Attached files
| file | filename |
|---|---|
| 8-K - FORM 8-K - SANFILIPPO JOHN B & SON INC | d365734d8k.htm |
 Investor
Meetings
6/2012
Exhibit 99.1 |
 ®
2
Forward Looking Statements
Forward Looking Statements
Some of the statements in this presentation constitute “forward-looking
statements”
about John B. Sanfilippo & Son, Inc. Such statements include, in
particular, statements about our plans, strategies, business prospects, changes
and trends in our business and the markets in which we operate. In some
cases, you can identify forward-looking statements by the use of words
such as “may,”
“will,”
“could,”
“would,”
“should,”
“expect,”
“plan,”
“anticipate,”
“intend,”
“believe,”
“estimate,”
“forecast,”
“predict,”
“propose,”
“potential”
or “continue”
or
the negative of those terms or other comparable terminology. These statements
represent our present expectations or beliefs concerning future events and
are not guarantees. Such statements speak only as of the date they are made,
and we do not undertake any obligation to update any forward-looking
statement. We caution that forward-looking statements are qualified by
important factors, risks and uncertainties, that could cause actual results
to differ materially from those in the forward looking statements. Our
periodic reports filed with the Securities and Exchange Commission,
including our Forms 10-K and 10-Q and any amendments thereto,
describe some of these factors. |
 Introduction
to
JBSS |
 ®
4
Who We Are -
Who We Are -
JBSS
JBSS
•
One of the largest nut processors in the world with $700
million net sales for the last four fiscal quarters
•
State-of-the-art nut processing capabilities, including what we
believe is the single largest nut processing facility in the
world
•
A North American market leader in every major selling
channel
–
from
consumer/retail
and
commercial
ingredients
to contract manufacturing and export/international
•
Dual consumer strategy of branded nut and dried fruit
programs (Fisher, Orchard Valley Harvest) as well as private
brands
•
Procurement expertise with senior buyers averaging over 20+
years experience
•
Profitable business with strong growth prospects both
domestically and throughout the world |
 ®
5
To be the global source for nuts, committed to quality,
expertise and innovation that delivers an unmatched
experience to our customer and consumer
.
Integrity
People
Investment
Corporate Vision
Core Values
Safety
Resource Conservation
Customer Driven
Innovation
Execution
Quality
Continuous Improvement
Who We Are -
Who We Are -
JBSS
JBSS |
 ®
6
Who We Are –
Who We Are –
JBSS Business
JBSS Business
•
Consumer
Channel
–
sale
of
nuts
and
dried
fruits
to
major
food retailers
•
Branded Business:
•
Fisher
Baking
-
#2
national
market
share*
•
Fisher
Snack
–
Established
Midwest
brand
•
Orchard
Valley
Harvest
–
full
line
natural
nuts &
dried fruit products sold into Produce section of
food retailers
•
Private Brand Business:
•
Predominantly snack nuts sold under retailers’
own brands
* As measured by Nielsen Food, Drug and Mass merchandiser (Including Wal-Mart) 52 Weeks
Ending 5/12/12 |
 ®
7
Who We Are –
Who We Are –
JBSS Business
JBSS Business
•
Commercial
Ingredients
Channel
–
sale
of
nuts
as
ingredients
to foodservice suppliers, other food manufacturers, and
prepared food processors (consolidation of former Industrial
& Foodservice Channels)
•
Contract
Manufacturing
Channel
–
third
party
processing
for
branded food players
•
International
Channel
–
sale
of
Fisher
snack
nuts
and
private
brand nut products outside the United States
|
 ®
8
•
Diversified nut
business with high
emphasis on bulk &
ingredient sales to
industrial, foodservice
and international
customers
•
Packaged goods sold
to consumers
approximately half of
total sales
Where We’ve Been –
Where We’ve Been –
FY 2007
FY 2007
Total FY 2007 Sales: $541 Million
Total FY 2007 Sales: $541 Million |
 ®
9
•
Strategic use of
acquisitions to drive
future growth and
profitability –
Orchard
Valley Harvest
•
Shifting company profile
away from riskier
commodity business to
more value-added
consumer business
•
Focus on building our
branded (Fisher and
Orchard Valley Harvest)
business both
domestically and
internationally
Where We Are Today –
Where We Are Today –
FY 2011
FY 2011
Total FY 2011 Sales: $674 million
Total FY 2011 Sales: $674 million
*
* Combination of former foodservice and industrial channels |
 ®
10
We Are Experts In Every Nut Type
We Are Experts In Every Nut Type
•
Complete product portfolio of
nuts.
•
Comprehensive variety of
value-added products
•
Wide assortment of other
snack products
•
Highly versatile product
styles, sizes and packaging,
customized to customer
specifications
•
Benefits
•
Appeals to major
customers
•
Reduces product
concentration risks
FY 2011 Gross Sales by Nut Type |
 Almonds
Walnuts
Pecans
Peanuts
We Are Experts in Procurement
We Are Experts in Procurement
®
11 |
 ®
12
Pecans, Pine Nuts
Mexico
Cashews
Vietnam
Pine Nuts
China
We Are Experts in Procurement
We Are Experts in Procurement
South Africa
Macadamias
Guatemala
Macadamias
Australia
Macadamias
India
Cashews
Turkey
Hazelnuts
Brazil
Cashews
Hawaii
Macadamias |
 ®
13
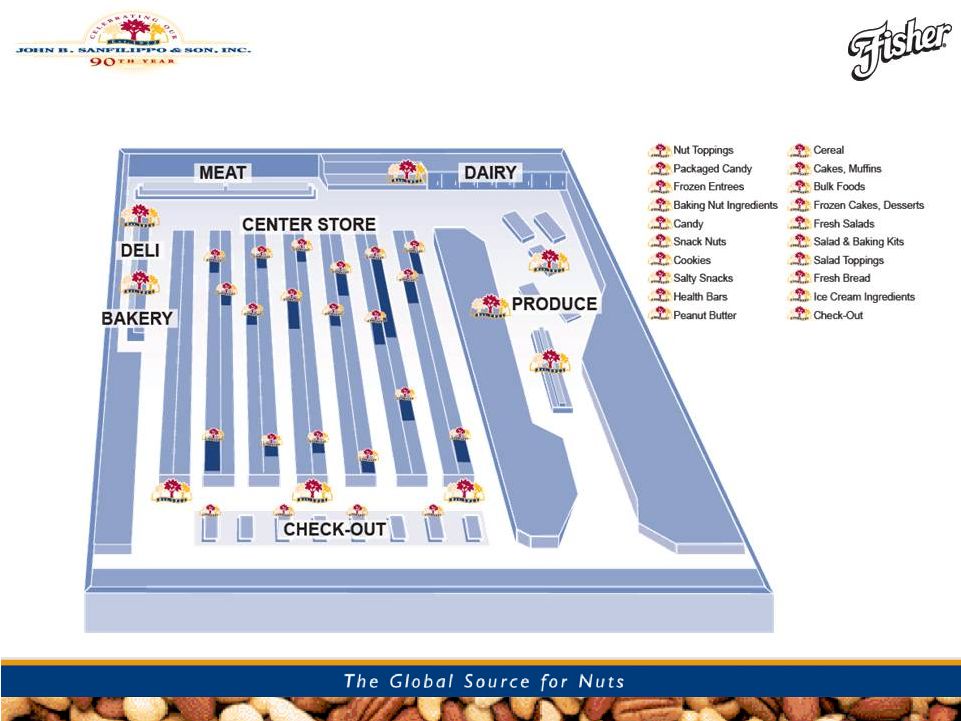
We Reach Consumers in 20+ In-Store Points
We Reach Consumers in 20+ In-Store Points |
 14
Orchards
Cold Storage
Shelling, Sizing,
Blanching,
Slicing/Dicing
Roasting/Panning/
Enrobing
Packaging
Cleaning & Inspection
Shipping
JBSS
is
the
only
US
vertically
integrated
major
nut
processor
and
sheller
of
3
major
nut
types
-
peanuts,
pecans
and
walnuts
We Have Total Supply Chain Knowledge
We Have Total Supply Chain Knowledge
14
Starts at
the Grower
Consumer
Commercial
Ingredients
Contract Mfg
International
Ends Delivered to You
® |
 15
®
Elgin, IL
San Antonio
Houston
Our Facilities Are Strategically Located
Our Facilities Are Strategically Located
•
Across the country production/distribution locations give JBSS
logistical advantages in serving its Customers as reflected in quick
reaction times and efficient shipping costs
15 |
 16
®
•
1 Million Square Feet
•
350,000 sq. ft. warehouse and distribution
•
160,000 sq ft. segregated cooler storage
•
480,000 sq ft. manufacturing
•
100,000 sq ft. office
•
Comprehensive Allergen Prevention
Programs
•
State-of-the-art warehouse management
system
•
Individual cooler storage: one for peanuts,
one for tree nuts
•
Separated processing and production
rooms
•
Dedicated manufacturing equipment for
peanut-shared and tree nut processing
•
Robust
Quality
Systems
–
SQF
Level
2
•
Infinity / QRS Systems
•
Quasi positive release on all raw material,
work-in-process and finished goods
•
Organic Certification
Shared
Shared
Coolers
Coolers
Tree Nut
Tree Nut
Coolers
Coolers
Peanut
Peanut
Coolers
Coolers
Elgin, IL
Elgin, IL
State-of-the Art World Class Facility
State-of-the Art World Class Facility
16 |
 17
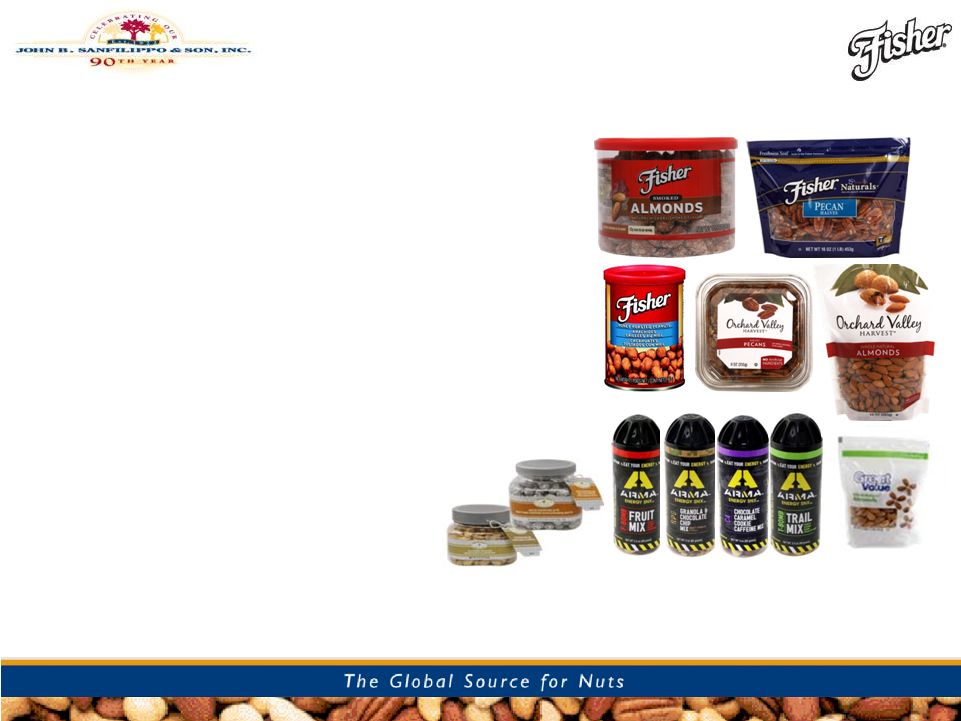
We Launched Over 200 New Products in FY 2011
We Launched Over 200 New Products in FY 2011
Across Diversified Channels
Across Diversified Channels
182 new items in Consumer Channel
13 new items in Commercial Ingredients Channel
8 new items in Export Channel
16 new items for Contract Manufacturing Channel
17
•
•
•
•
® |
 ®
18
We Are The Preferred Private Brand Supplier
We Are The Preferred Private Brand Supplier
9-Time Category Colonel Award Winner 9-Time Category Colonel Award Winner
NUTS/ SEEDS/ TRAIL MIX -
NUTS/ SEEDS/ TRAIL MIX -
PL Buyer Magazine
PL Buyer Magazine |
 19
®
JBSS 2012 Strategy
JBSS 2012 Strategy
19 |
 Growing
with Fisher
and OVH
® |
 ®
21
We are Reinventing Fisher Baking
We are Reinventing Fisher Baking
*
* Quantitative paired comparison test – online study by Bluechip Marketing Worldwide
March 2011 |
 ®
22
We are Reinventing Fisher Baking
We are Reinventing Fisher Baking
Share
20.1
20.1
vs. YAG
+0.7
+0.7
Share
32.8
32.8
vs. YAG
(7.8)
(7.8)
Share
1.5
1.5
vs. YAG
(0.6)
(0.6)
Source: Nielsen – Food, Drug and Mass merchandiser data 12 Weeks Ended 5/12/12, includes
Wal-Mart Homescan data |
 ®
23
We are Reinventing Fisher Snack
We are Reinventing Fisher Snack |
 ®
24
Orchard Valley Harvest Acquisition May 2010
Orchard Valley Harvest Acquisition May 2010
•
Who: Leading diversified supplier of branded
and private label nut and dried fruit products
in the produce category
•
Rationale: (i) expand JBSS portfolio and
market presence into the store perimeter (ii)
acquire platform to build a truly national
produce nut program, (iii) broaden JBSS’
product breadth and production capabilities
•
Final purchase price:
$40.5 million
•
OVH
2009
Net
Sales:
$59.3
million
•
Purchase price to net sales: 0.7X |
 ®
25
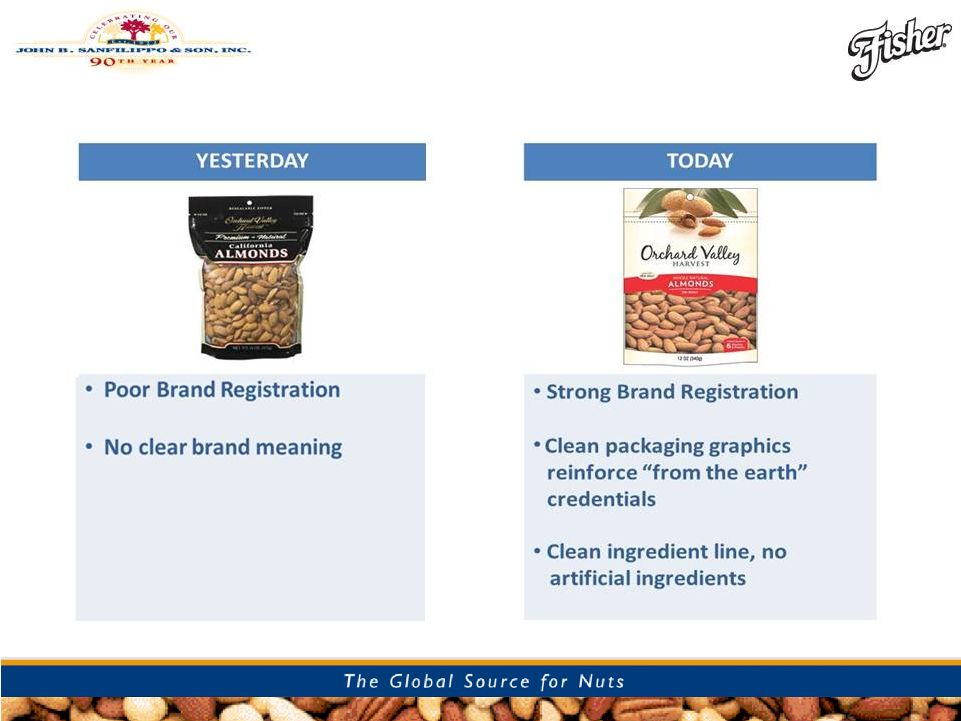
We Are Reinventing Orchard Valley Harvest
We Are Reinventing Orchard Valley Harvest |
 ®
26
We Are Reinventing Orchard Valley Harvest
We Are Reinventing Orchard Valley Harvest |
 ®
27
We Are Investing in Social Media
We Are Investing in Social Media
Investing in Facebook, Twitter etc.
Investing in Facebook, Twitter etc.
Facebook Fisher Nuts Fans |
 ®
28
We Are Growing Fisher Snack Internationally
We Are Growing Fisher Snack Internationally
Selling in China since 12/10; SIAL Food Show
Selling in China since 12/10; SIAL Food Show |
 ®
29
We Are Expanding Fisher Snack Internationally
We Are Expanding Fisher Snack Internationally |
 ®
30
We Are Opening an Office In Shanghai
We Are Opening an Office In Shanghai
Anticipated Opening:
Early FY 2013 |
 JBSS
Financials |
 ®
32
Nut Industry Has Experienced Record High Prices
Nut Industry Has Experienced Record High Prices |
 ®
33
Yet JBSS Has Become More Efficient
Yet JBSS Has Become More Efficient
Sales Per Employee*
* Fiscal net sales / average number of employees as reported on
Form 10-K. Temporary employees not included. |
 ®
34
JBSS
JBSS
Net
Net
Sales
Sales
FYs
FYs
1991-
1991-
2011
2011
&
&
L4Q
L4Q
Ended
Ended
Q3
Q3
2012
2012
($ Millions)
Note: FY 1997 reflects stub year
Item Rationalization,
De-emphasized
Commodity Sales,
Lower Prices
Low Carb Diet Run Up
Higher Prices,
OVH
acquisition |
 ®
35
JBSS Stockholders Equity FYE 1991-
JBSS Stockholders Equity FYE 1991-
2011 & Q3 2012
2011 & Q3 2012
($ Millions) |
 ®
36
JBSS Total Outstanding Debt As % of Net Sales
JBSS Total Outstanding Debt As % of Net Sales
FY’s 1991 –
FY’s 1991 –
L4Q Q3 2012
L4Q Q3 2012
Note: FY 1997 reflects stub year |
 ®
37
EBITDA consists of earnings before interest, taxes, depreciation,
amortization and noncontrolling interest. EBITDA is not a measurement
of financial performance under accounting principles generally accepted
in
the
United
States
of
America
("GAAP"),
and
does
not
represent
cash
flow from operations. EBITDA is presented solely as a supplemental
disclosure because management believes that it is important in
evaluating JBSS's financial performance and market valuation. In
conformity
with
Regulation
G,
a
reconciliation
of
EBITDA
to the most
directly comparable financial measures calculated and presented in
accordance
with
GAAP
is
presented
in
the
following
slide.
EBITDA |
 ®
38
Reconciliation of Net Income (Loss) to EBITDA*
Reconciliation of Net Income (Loss) to EBITDA*
*
EBITDA
is
a
non-GAAP
measure.
See
slide
entitled
“
EBITDA”
for
management’s
purpose
for
including
this
measure
in
this
presentation.
(In $,000's)
FY2002
FY2003
FY2004
FY2005
FY2006
FY2007
FY2008
FY2009
FY2010
FY2011
L4Q Q312
NET INCOME (LOSS)
7,691
15,027
22,630
14,499
(16,721)
(13,577)
(5,957)
6,917
14,425
2,835
15,445
INTEREST EXPENSE
5,757
4,681
3,434
3,998
6,516
9,347
10,502
7,646
5,653
6,444
5,707
INCOME TAX EXPENSE
(BENEFIT)
5,044
9,607
14,468
9,269
(8,689)
(7,520)
(897)
(259)
8,447
(49)
7,382
OVH GOODWILL
IMPAIRMENT
5,662
5,662
DEPRECIATION &
AMORTIZATION
10,428
11,248
11,190
10,501
10,000
13,584
15,742
15,922
15,825
16,968
17,151
EBITDA
28,920
40,563
51,722
38,267
(8,894)
1,834
19,390
30,226
44,350
31,860
51,347
NET SALES
352,799
419,677
520,811
581,729
579,564
540,858
541,771
553,846
561,633
674,212
700,251
EBITDA MARGIN (%
OF NET SALES)
8.2%
9.7%
9.9%
6.6%
(1.5%)
0.3%
3.6%
5.5%
7.9%
3.9%
7.3%
POUNDS SOLD
211,960
250,629
284,576
278,741
248,137
246,142
221,958
217,465
224,302
232,746
219,224
EBITDA PER LBS
SOLD
0.136
0.162
0.182
0.137
(0.036)
0.007
0.087
0.139
0.198
0.113
0.234 |
 ®
39
EBITDA*
EBITDA*
* EBITDA
is
a
non-GAAP
measure.
See
slide
entitled
“Reconciliation
of
Net
Income
(Loss)
to
EBITDA”
for
reconciliation
to
GAAP
measure
($ Thousands) |
 ®
40
EBITDA* Margin (% of Net Sales)
EBITDA* Margin (% of Net Sales)
* EBITDA
is
a
non-GAAP
measure.
See
slide
entitled
“Reconciliation
of
Net
Income
(Loss)
to
EBITDA”
for
reconciliation
to
GAAP
measure |
 ®
41
EBITDA* Per Pound Sold
EBITDA* Per Pound Sold
* EBITDA
is
a
non-GAAP
measure.
See
slide
entitled
“Reconciliation
of
Net
Income
(Loss)
to
EBITDA”
for
reconciliation
to
GAAP
measure |
 ®
42
JBSS Common Stock
JBSS Common Stock
Outperforms S&P 500
Outperforms S&P 500
and Russell 2000 since Market Bottom
and Russell 2000 since Market Bottom |
 ®
43
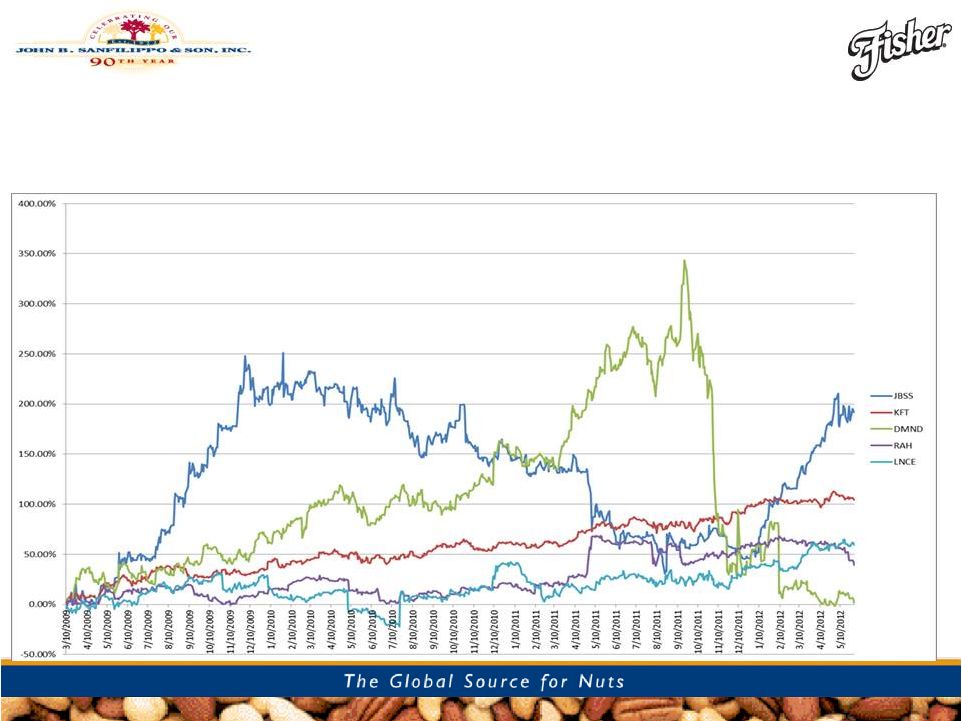
JBSS Common Stock Outperforms Diamond,
JBSS Common Stock Outperforms Diamond,
Ralcorp, Kraft and Snyder’s-Lance Since
Ralcorp, Kraft and Snyder’s-Lance Since
Market Bottom
Market Bottom |
 Thank
You |
