Attached files
| file | filename |
|---|---|
| 8-K - FORM 8-K - E TRADE FINANCIAL CORP | d363786d8k.htm |
 E*TRADE
Financial Corporation Sandler O’Neill Global Exchange & Brokerage
Conference Steven Freiberg, CEO
June 7, 2012
©
2012 E*TRADE Financial Corporation. All rights reserved.
This presentation contains confidential information and may not be disclosed
without E*TRADE Financial Corporation’s written permission.
Exhibit 99.1 |
 ©
2012 E*TRADE FINANCIAL Corp. All rights reserved.
This presentation contains confidential information and may not be disclosed
without E*TRADE FINANCIAL Corporation’s written permission.
2
Notice to investors
Safe Harbor Statement
This presentation contains certain projections or other forward-looking statements
regarding future events or the future performance of the Company. Various factors,
including risks and uncertainties referred to in the 10Ks, 10Qs and other reports
E*TRADE Financial Corporation periodically files with the SEC, could cause our actual
results to differ materially from those indicated by our projections or other
forward- looking statements. This presentation also contains disclosure of
non-GAAP financial measures. A reconciliation of these financial measures to the
most directly comparable GAAP financial measures can be found on the investor relations
site at https://investor.etrade.com. Forward-Looking
Statements The statements contained in this presentation that are forward looking are
based on current expectations that are subject to a number of uncertainties and risks,
and actual results may differ materially. Further information about these risks and
uncertainties can be found in the Company’s annual, quarterly and current reports
on Form 10-K, Form 10- Q and Form 8-K previously filed by E*TRADE Financial
Corporation with the SEC (including information under the caption “Risk
Factors”). Any forward-looking statement included in this release speaks only
as of the date of this communication; the Company disclaims any obligation to update
any information. |
 ©
2012 E*TRADE FINANCIAL Corp. All rights reserved.
This presentation contains confidential information and may not be disclosed
without E*TRADE FINANCIAL Corporation’s written permission.
Improve market position in retail brokerage
•
Accelerate growth of the customer franchise
•
Continue to enhance the customer experience, improve satisfaction and retention
Capitalize on value of complementary brokerage businesses
•
Corporate services group
•
Market making operations
Enhance position in retirement & investing
•
Expand brand position for awareness and preference
•
Grow customer share of wallet
Continue to evolve bank franchise
•
Mitigate
credit
losses
on
legacy
loan
portfolio
and
enhance
risk
profile
•
Optimize value of customer deposits
Strengthen overall financial and franchise position
•
Strengthen balance sheet and income statement
•
Improve capital ratios through de-risking and de-leveraging
•
Focus on increasing shareholder value through a more efficient capital structure
•
Increase focus on expense reduction in light of challenging operating environment
Business Strategy
3 |
 ©
2012 E*TRADE FINANCIAL Corp. All rights reserved.
This presentation contains confidential information and may not be disclosed
without E*TRADE FINANCIAL Corporation’s written permission.
4
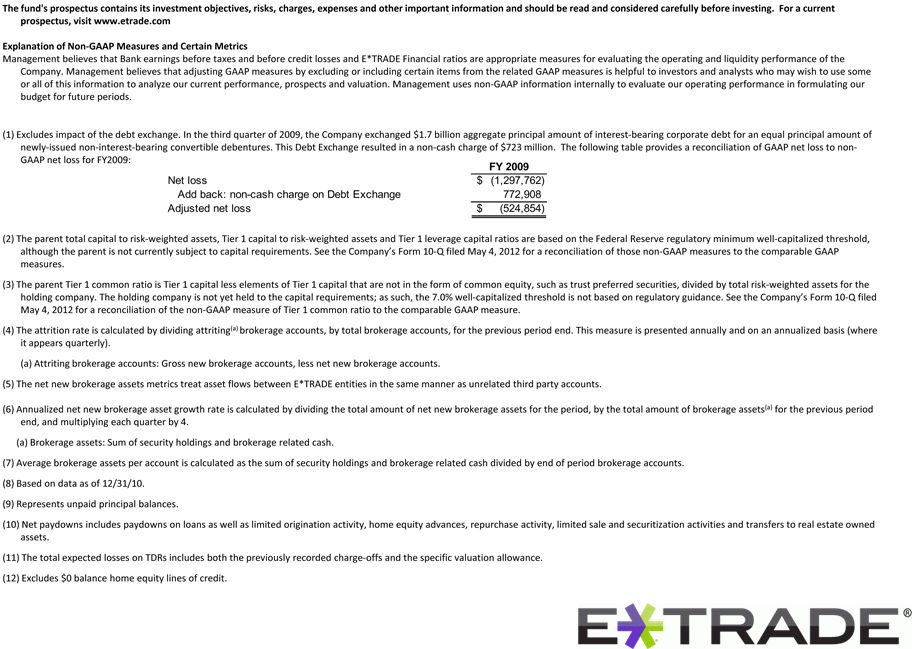
(1)
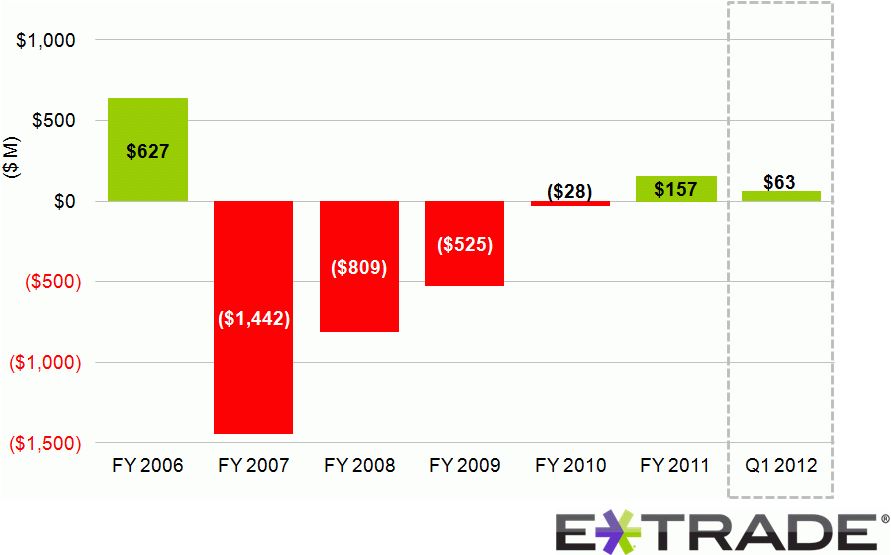
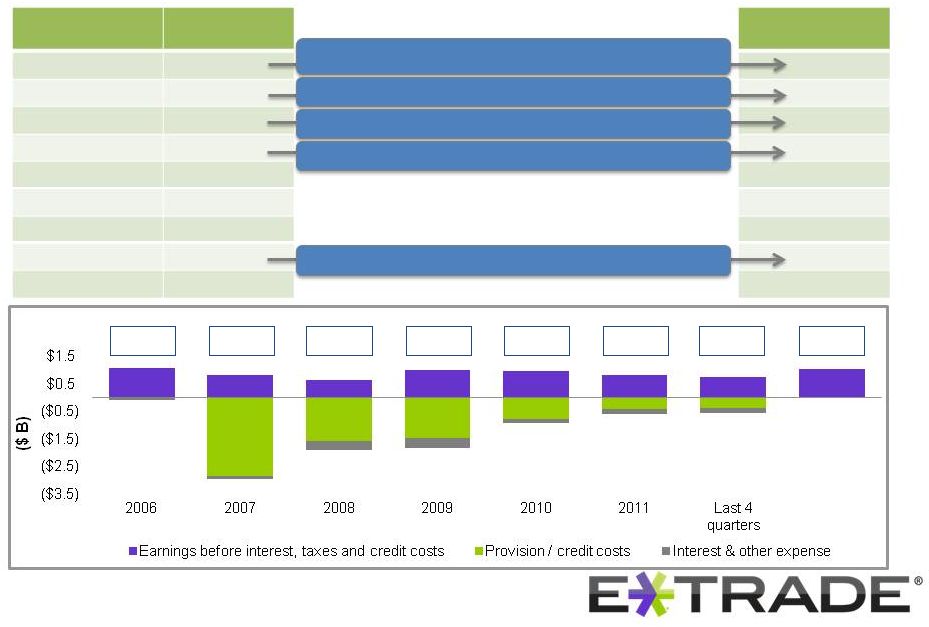
Strengthen overall financial position
Ongoing improvement in net income |
 Strengthen overall
financial position $0.9B
$(2.2)B
$(1.3)B
$(0.9)B
$0.0B
$0.2B
Pre-tax income:
Defined path to improved earnings through current strategy
Should reduce to $0 as capital is efficiently deployed
$1.0B
Long-term
impact to
current
strategy
(1)
$0.2B
Net Interest Spread should improve to 300bps
with normalized rate environment
Should reduce to $0 as legacy portfolio runs off
Should reduce to $0 as legacy portfolio runs off
Should reduce by half as risk profile improves
($ M)
Last 4 quarters
Driver
Long-term impact
to current strategy
Revenue
$1,989
$2,123
Provision
($397)
$0
Servicing
($70)
$0
FDIC expenses
($113)
($57)
Other
($1,060)
($1,060)
Expenses, total
($1,243)
($1,117)
Operating income
$349
$1,006
Interest & other
($177)
$0
Pre-tax income
$172
$1,006
©
2012 E*TRADE FINANCIAL Corp. All rights reserved.
This presentation contains confidential information and may not be disclosed
without E*TRADE FINANCIAL Corporation’s written permission.
5 |
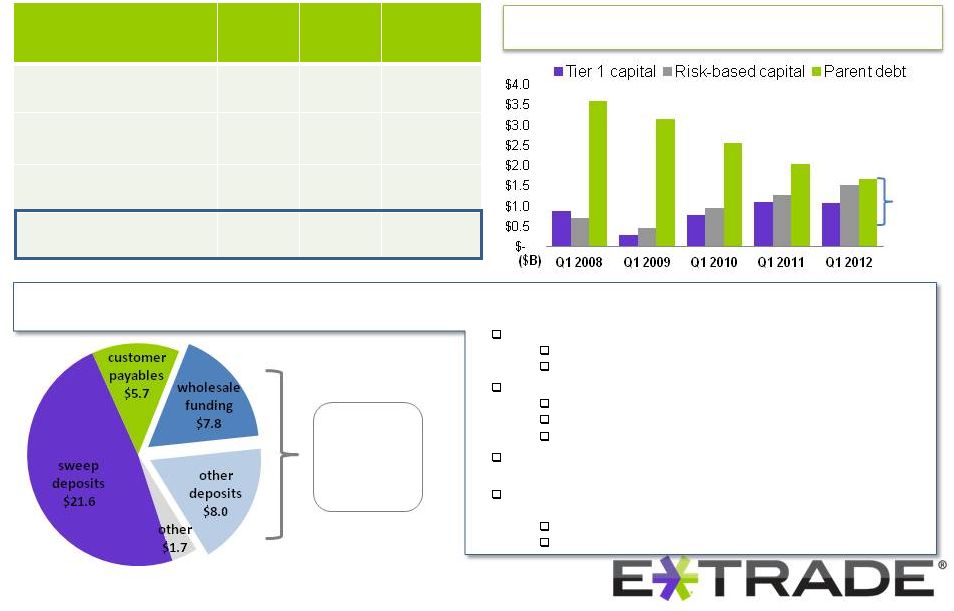 Strengthen overall
financial position Improve capital structure
Capital ratios as of 3/31/12
Bank
Parent
Well-
capitalized
threshold
Total capital to
risk-weighted assets
(2)
17.0%
12.6%
10.0%
Tier 1 capital to
risk-weighted assets
(2)
15.7%
11.4%
6.0%
Tier 1 common
(3)
15.7%
9.4%
7.0%
Tier 1 leverage
(2)
7.3%
5.5%
5.0%
Bank excess capital / Parent debt
Focused on de-leveraging to improving most constraining ratio: Tier 1 leverage
$930M
of 12.5%
notes
Non-core
liabilities
= 35% of
total
On average, each $1B reduction in balance sheet size equates to:
13-15 bps of improvement to consolidated Tier 1 leverage ratio
16-18 bps of improvement to Bank Tier 1 leverage ratio
De-leveraging options include:
Move non-core deposits off balance sheet
Move portion of sweep deposits off balance sheet
Eliminate wholesale funding (~$700M pre-tax charge)
Improving leverage ratio is an integral component of being able to
refinance high-cost debt at the parent
Refinancing the full $930M of 12.5% notes at first call date (12/1/12)
would result in a pre-tax loss of approximately $266 million:
~ $116 million for call premium
~ $150 million for original issue discount
©
2012 E*TRADE FINANCIAL Corp. All rights reserved.
This presentation contains confidential information and may not be disclosed
without E*TRADE FINANCIAL Corporation’s written permission.
6 |
 ©
2012 E*TRADE FINANCIAL Corp. All rights reserved.
This presentation contains confidential information and may not be disclosed
without E*TRADE FINANCIAL Corporation’s written permission.
7
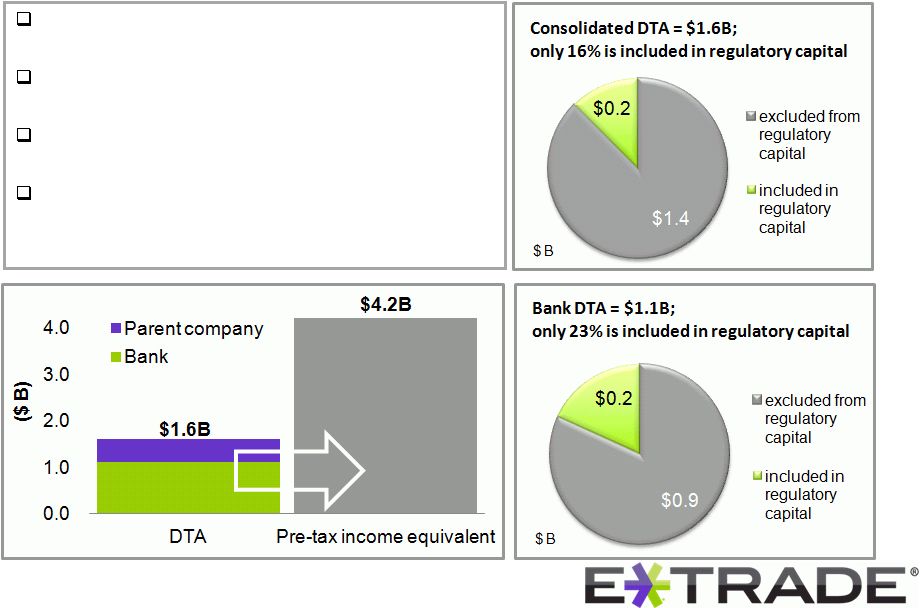
Strengthen overall financial position
Deferred tax asset
Consolidated DTA of $1.6B
($0.5B at parent; $1.1B at Bank)
Ability to include more in regulatory capital with ongoing
profitability
Potential source of corporate cash in future periods as
subsidiaries reimburse the parent for use of its DTA
Approximately 16 years to use; expect to utilize the full
amount |
 ©
2012 E*TRADE FINANCIAL Corp. All rights reserved.
This presentation contains confidential information and may not be disclosed
without E*TRADE FINANCIAL Corporation’s written permission.
8
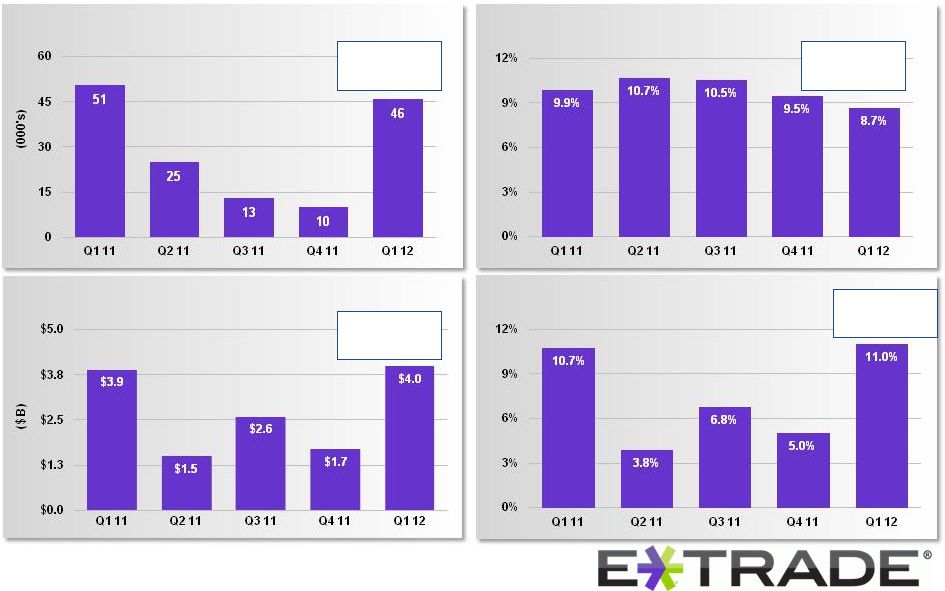
Improve market position in retail brokerage
Net new brokerage accounts
Net new brokerage assets
(5)
Accelerate growth of the customer franchise
Annualized brokerage
account attrition
(4)
2010: 12.2%
2011: 10.3%
2010: 6.8%
2011: 6.7 %
2010: 54k
2011: 99k
2010: $8.1B
2011: $9.7B
Annualized net new
brokerage asset growth
(6) |
 ©
2012 E*TRADE FINANCIAL Corp. All rights reserved.
This presentation contains confidential information and may not be disclosed
without E*TRADE FINANCIAL Corporation’s written permission.
9
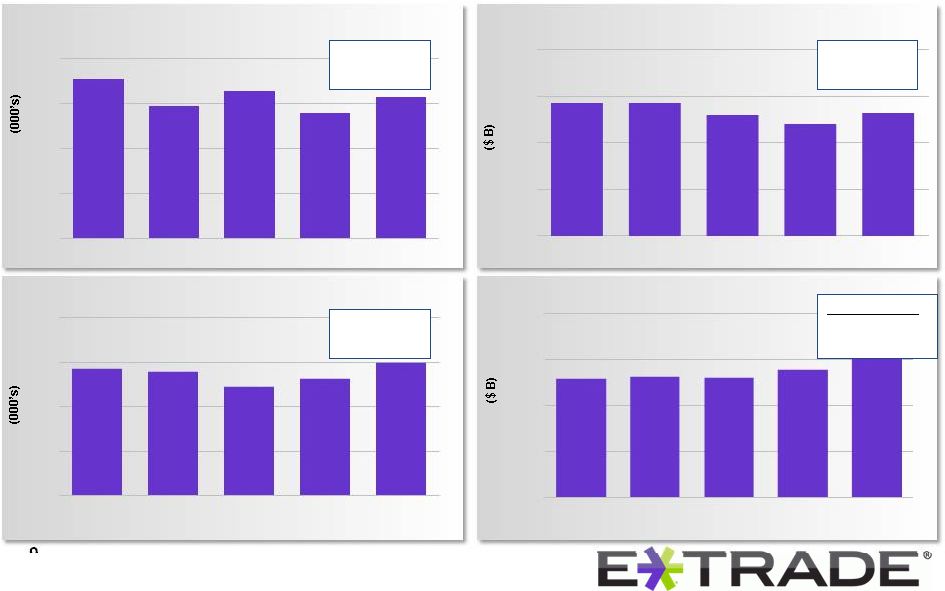
DARTs
Improve market position in retail brokerage
Accelerate growth of the customer franchise
Avg brokerage assets per account
(7)
2010: $4.5B
2011: $5.4B
Average yield:
2010: 12bps
2011: 11bps
2010: 151k
2011: 157k
2010: $49k
2011: $54k
$57
$56
$49
$52
$60
$
$20
$40
$60
$80
Q1 11
Q2 11
Q3 11
Q4 11
Q1 12
177
148
165
140
157
0
50
100
150
200
Q1 11
Q2 11
Q3 11
Q4 11
Q1 12
$5.7
$5.7
$5.2
$4.8
$5.3
$0
$2
$4
$6
$8
Q1 11
Q2 11
Q3 11
Q4 11
Q1 12
Customer margin receivables
$26
$26
$26
$28
$31
$0
$10
$20
$30
$40
Q1 11
Q2 11
Q3 11
Q4 11
Q1 12
Brokerage-related cash |
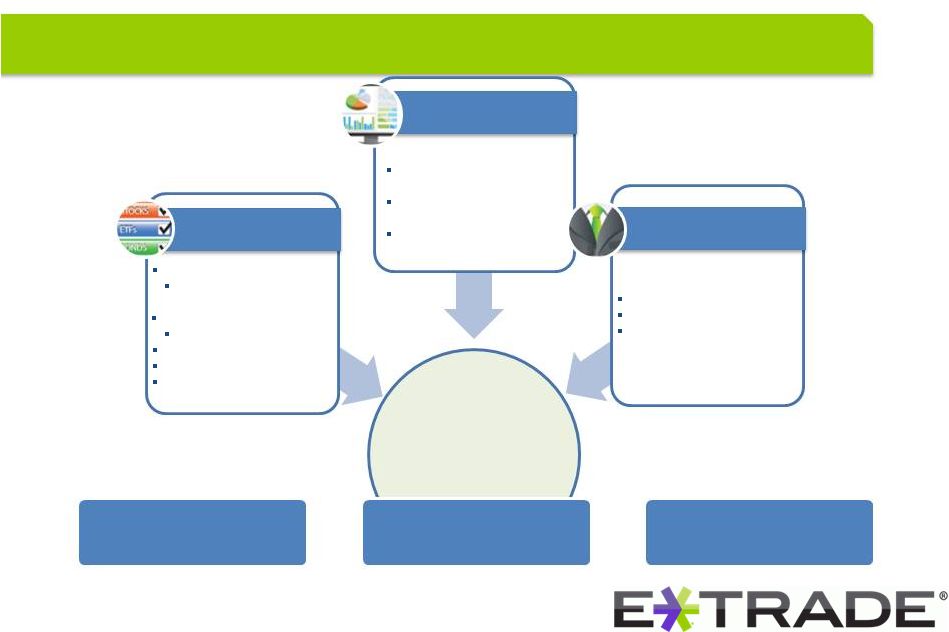
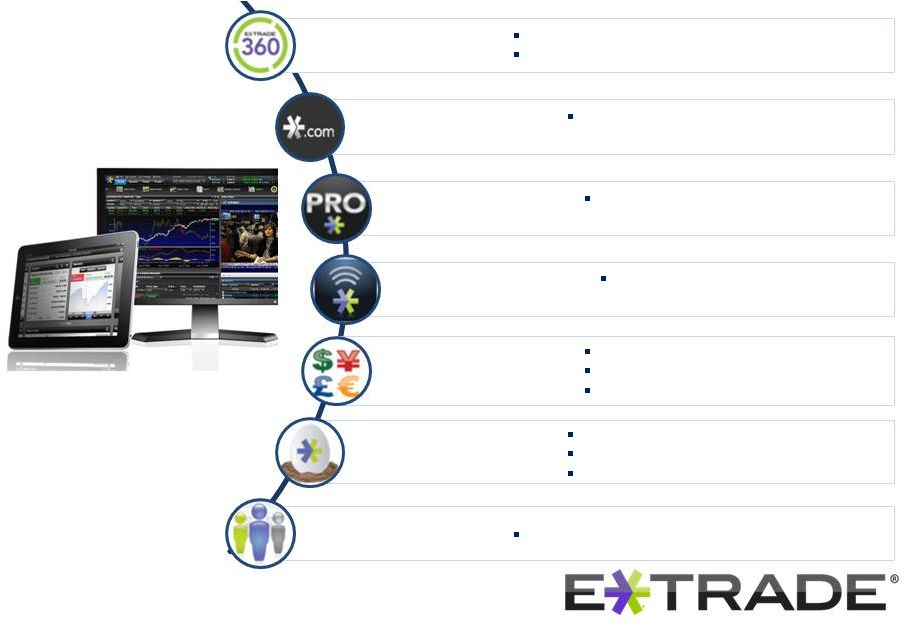 Unique,
customizable website experience One-page investing dashboard
Dynamic content, streamlined experience,
better segmentation
Premiere, fully customizable active trader
platform
Powerful platform for account and
market access anytime, anywhere
Sophisticated options tools and analytics
E*TRADE FX platform
Integrated futures (Q3 12)
Upgraded Bond Resource Center
New educational resources –
video, live, web
Expanded Retirement Planning Center
Evolving products & platform
Connecting customers for education, investing ideas
Improve market position in retail brokerage
New Customer Site
New Public Site
E*TRADE Pro
E*TRADE Mobile
Options,
Futures & FX
Investing & planning
resources
E*TRADE
Community
©
2012 E*TRADE FINANCIAL Corp. All rights reserved.
This presentation contains confidential information and may not be disclosed
without E*TRADE FINANCIAL Corporation’s written permission.
10 |
 ©
2012 E*TRADE FINANCIAL Corp. All rights reserved.
This presentation contains confidential information and may not be disclosed
without E*TRADE FINANCIAL Corporation’s written permission.
11
Market making business
Leveraging world class technologies and superior execution
capabilities
Leading market share in ADRs; growing market share in
National Market Securities
Growing
base
of
external
customers,
comprising
40+
external
clients
(33%
y/y
growth),
and
accounting
for
~
50%
of
market
making revenue
Corporate services group
Build on market leadership with 1,400+ corporate clients,
representing +20% of S&P 500
Foster strategically important channel for new brokerage
accounts, accounting for 25-30% of gross new accounts
1.1 million accounts; $25B in vested and $48B in unvested
options
Proceeds retention of 35%+ 3 months post exercise, and 15%+
12 months post exercise
Capitalize on value of complementary brokerage businesses
E*TRADE
#2 Player
#3 Player
6+ other providers
10%
$0
$5
$10
$15
$20
$25
$30
$30
$24
$27
$25
$24
Principal transactions revenue ($M)
48%
20%
22%
Stock plan administration for
public companies |
 ©
2012 E*TRADE FINANCIAL Corp. All rights reserved.
This presentation contains confidential information and may not be disclosed
without E*TRADE FINANCIAL Corporation’s written permission.
12
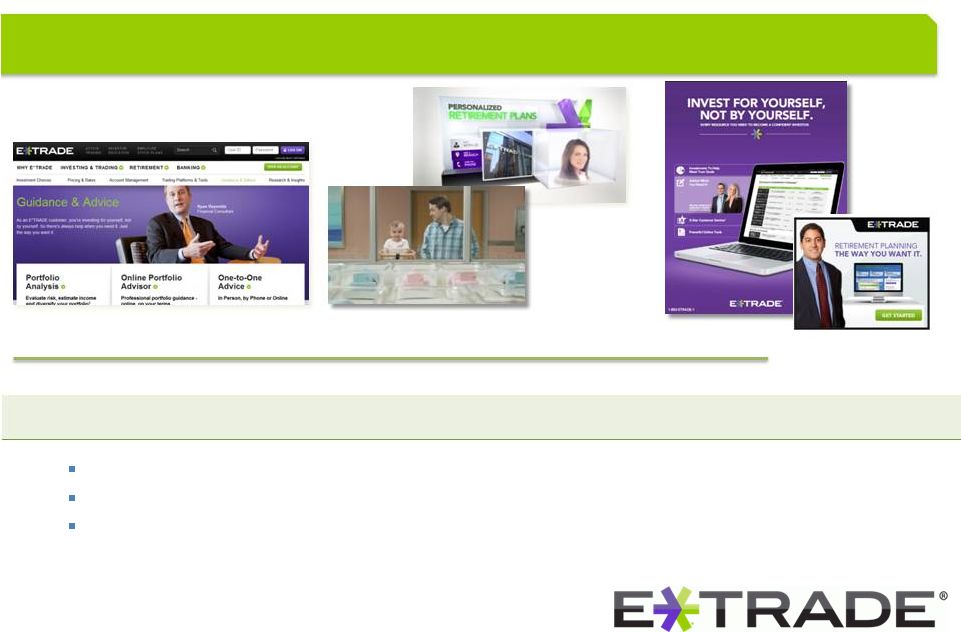
Enhance position in retirement & investing
NEW
Public Site
NEW
TV Commercials
NEW
Print & Online
Financial consultant network highlights
Retooled marketing focused on retirement & investing to evolve the brand
Grew
Financial
Consultant
headcount
by
42%
since
year-end
2010
We
estimate
we
have
a
12%
share
of
our
customers’
wallet
(36%
for
active
traders;
10%
for
investors)
(8)
Have
identified
segments
best
served
by
proactive
engagement
with
FCs
—
One
year
post
assignment
seeing
significant
improvement
in
engagement
and
retention |
 ©
2012 E*TRADE FINANCIAL Corp. All rights reserved.
This presentation contains confidential information and may not be disclosed
without E*TRADE FINANCIAL Corporation’s written permission.
13
Integrated retirement & investing offering to drive accounts & assets
Chartered Retirement
Planning Counselors
SM
Kiplinger’s 2011 “Best Of”
Retirement Calculator
Retirement education
8,100+ mutual funds
4,600 no-load/6,900 no
transaction fee
80+ commission -free
70,000+ bonds
Unified Managed Accounts
Managed Investment
Portfolios
Integrated into advertising
Grew headcount by 42%
Increased asset penetration
1year post assignment
Enhance position in retirement & investing
†
Unified Managed Accounts and Managed Investment Portfolios are offered by E*TRADE Capital
Management Financial Consultants
Financial Consultants
Services
Services
Products
†
Products
†
$33.1 billion in retirement
assets
16% of $202 billion of customer assets
783k retirement accounts
28% of brokerage accounts
$0.8 billion in managed
investment accounts
(2 years post inception)
Accounts
&
assets
Every ETF sold |
 ©
2012 E*TRADE FINANCIAL Corp. All rights reserved.
This presentation contains confidential information and may not be disclosed
without E*TRADE FINANCIAL Corporation’s written permission.
14
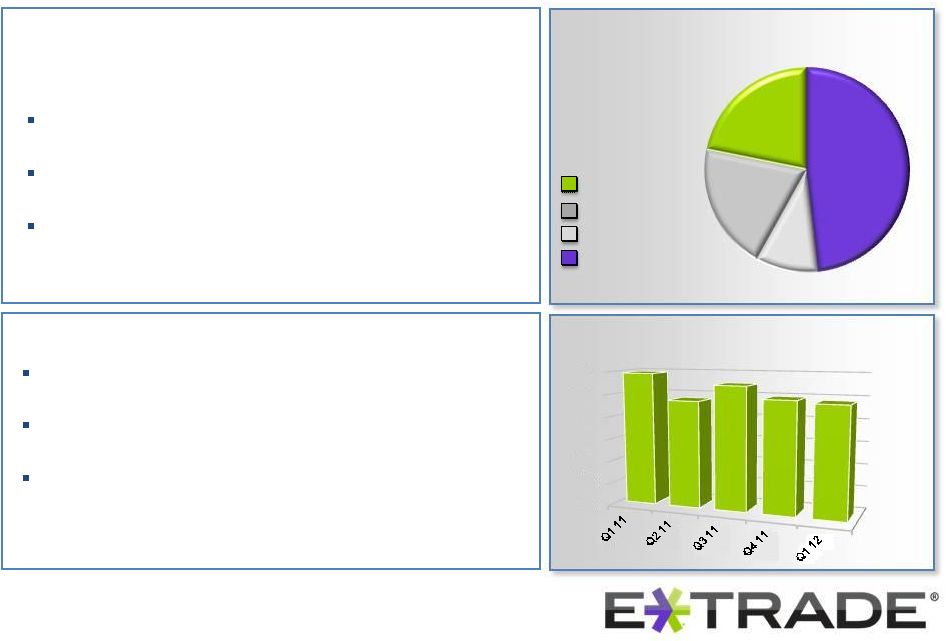
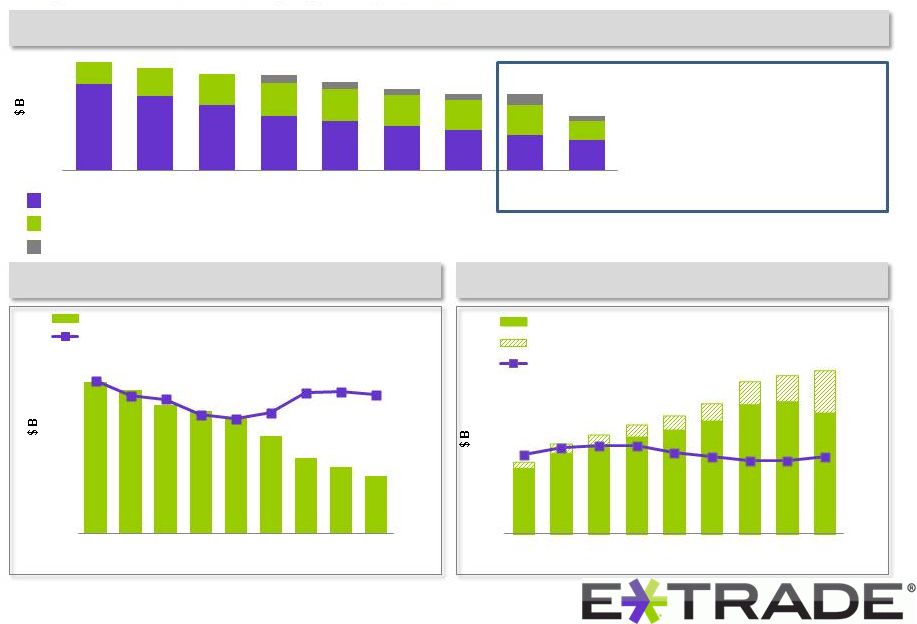
Favorable mix shift in assets (lower risk) and liabilities (lower-cost)
Continue to evolve bank franchise
Improvement in asset composition…
…Funding mix also continues to improve
•
Legacy loan portfolio now accounts for less than one-third
of total interest earning assets, down from over 60% at the
peak in 1Q 2008
•
Loan portfolio balances are down 60% from peak in 3Q
2007
•
Risk weighted assets are down 38% from peak in 3Q 2007,
while absolute assets are down 24%
•
More expensive wholesale funding channel now accounts
for only 18% of interest-bearing liabilities, down from 38%
at its peak in 3Q 2007
•
Absolute size of wholesale funding is down 64% from its
peak in 3Q 2007
•
Balance sheet strategy going forward is liability-driven, by
brokerage cash |
 ©
2012 E*TRADE FINANCIAL Corp. All rights reserved.
This presentation contains confidential information and may not be disclosed
without E*TRADE FINANCIAL Corporation’s written permission.
15
Continue to evolve bank franchise
Mitigate credit losses on legacy loan portfolio
($ B)
Loan balance
9/30/07
(9)
Paydowns
(10)
Charge-offs
Loan balance
3/31/12
(9)
Average age
1-4 Family loans
$17
($10)
($1)
$6
6.0 yrs
Home equity
$12
($4)
($3)
$5
6.2 yrs
Consumer
$3
($2)
($0)
$1
8.4 yrs
TOTAL
$32
($16)
($4)
$12
$0
$100
$200
$300
$400
$500
$600
$0
$200
$400
$600
$800
$1,000
$1,200
Down 64%
from peak in
Q4 08
Down 86%
from peak in
3Q 08
Delinquencies
Loans 30-89 days past due
Provision for loan losses
Provision
Qualitative reserve
62% decline |
 Continue to
evolve bank franchise Mitigate credit losses on legacy loan portfolio
Coverage of non-modified loans
General reserve
= Expected losses over next 12 months for
non-modified loans Coverage of
modified loans Components of allowance for loan losses
•
Increased the qualitative reserve in Q4 in
anticipation of losses related to a review of
modification policies and practices
pursuant to regulatory transition
•
Review was completed in Q1: Certain
modified loans were charged-off against
previously established SVA and the
qualitative reserve.
Specific
Valuation Allowance
= Expected losses over remaining life of modified loans
0.0
0.3
0.6
0.9
1.2
1Q 10
2Q 10
3Q 10
4Q 10
1Q 11
2Q 11
3Q 11
4Q 11
1Q 12
0%
20%
40%
60%
80%
0.0
0.4
0.8
1.2
1.6
1Q
2010
2Q
2010
3Q
2010
4Q
2010
1Q
2011
2Q
2011
3Q
2011
4Q
2011
1Q
2012
0%
20%
40%
60%
80%
0.0
0.4
0.8
1.2
1.6
1Q
2010
2Q
2010
3Q
2010
4Q
2010
1Q
2011
2Q
2011
3Q
2011
4Q
2011
1Q
2012
Modified loans
Prior charge-offs
Total expected losses on modified loans
(11)
90+ days past due non-modified loans
General reserve as a % of 90+ days past due non-modified loans
©
2012 E*TRADE FINANCIAL Corp. All rights reserved.
This presentation contains confidential information and may not be disclosed
without E*TRADE FINANCIAL Corporation’s written permission.
16
Qualitative
reserve
=
Accounts
for
factors
not
directly
considered
in
our
quantitative
model |
 ©
2012 E*TRADE FINANCIAL Corp. All rights reserved.
This presentation contains confidential information and may not be disclosed
without E*TRADE FINANCIAL Corporation’s written permission.
17
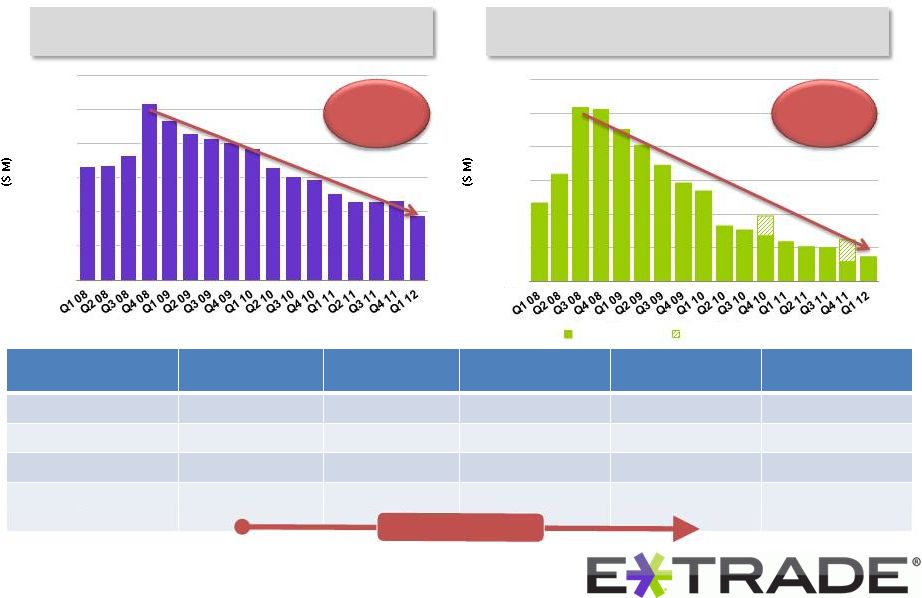
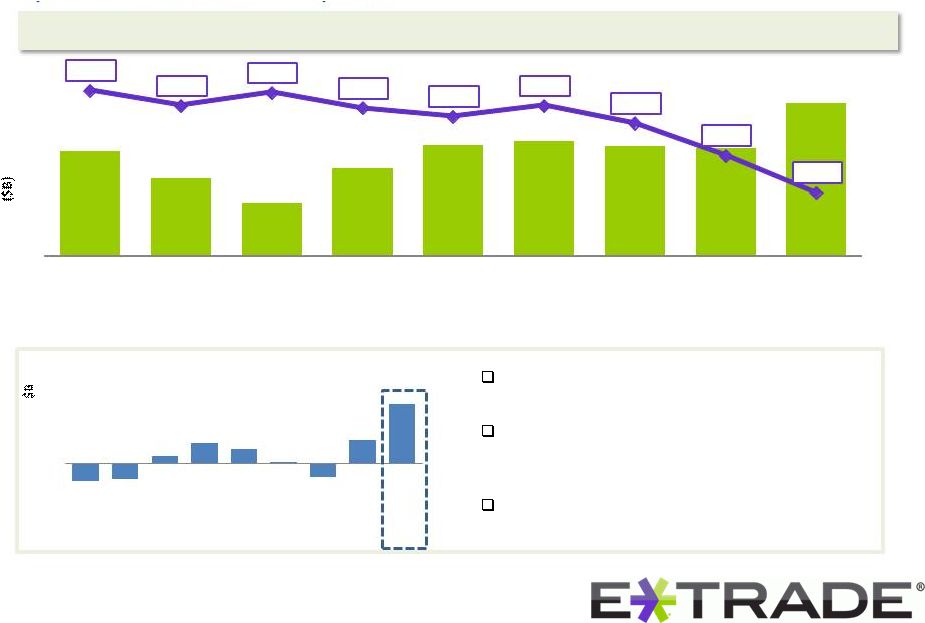
Continue to evolve bank franchise
Optimize value of customer deposits
Growth in balance sheet during Q1 2012 was the largest
since 3Q 2007
Marginal spread on a balance sheet that is increasing in
size is lower given the Company’s philosophy to
maintain a moderate level of interest rate risk
Expectation for net interest spread to average
approximately 240bps in 2012
$42.4
$41.0
$39.7
$41.5
$42.7
$42.9
$42.7
$42.6
$44.9
2.96%
2.89%
2.95%
2.88%
2.84%
2.89%
2.81%
2.66%
1Q 10
2Q 10
3Q 10
4Q 10
1Q 11
2Q 11
3Q 11
4Q 11
1Q 12
($2)
$0
$2
$4
1Q
2010
2Q
2010
3Q
2010
4Q
2010
1Q
2011
2Q
2011
3Q
2011
4Q
2011
1Q
2012
Growth in deposits
Customer deposits driving balance sheet size
2.49%
Average interest earning assets & net interest spread
3.00%
2.90%
2.80%
2.70%
2.60%
2.50%
2.40%
2.30%
2.20%
46
45
44
43
42
41
40
39
38
37 |
 ©
2012 E*TRADE FINANCIAL Corp. All rights reserved.
This presentation contains confidential information and may not be disclosed
without E*TRADE FINANCIAL Corporation’s written permission.
18
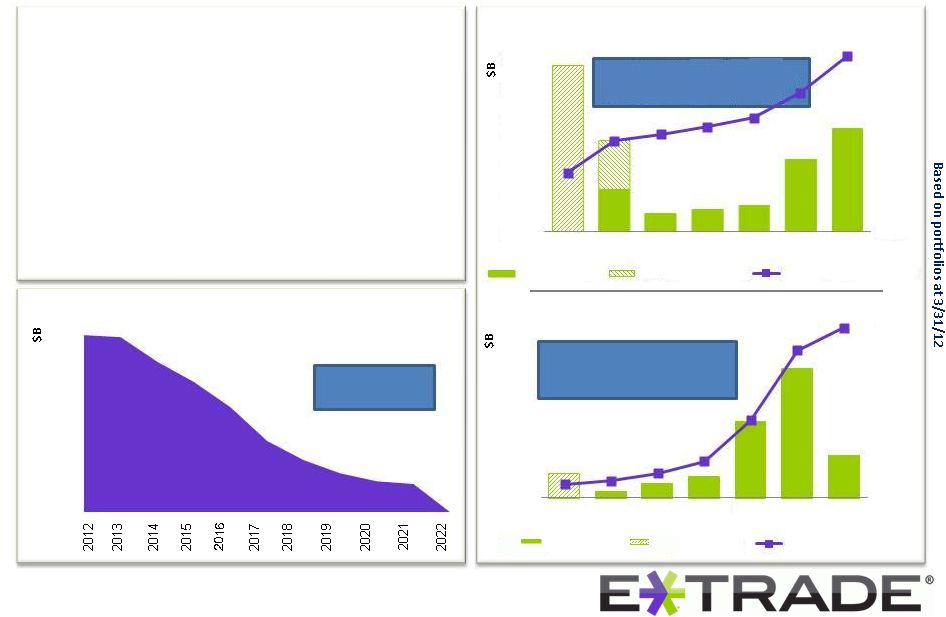
Continue to evolve bank franchise
Visibility into future drivers of net interest spread
Average cost 3-4%
1-4 family mortgages
•83%
of non-TDR portfolio is
adjustable for rate or amortization
•Over
$2.5B has previously reset and prior
Home equity lines of credit
•Avg
loan size: $75K (12)
•Avg
est increase at conversion: $150-200/mo. payment
and prior
•
Loan portfolio continues to run off at approximately
20% per year
•
Nearly 80% of 1-4 family loans resetting in the
remainder of 2012 are expected to reset to a lower
payment
•
Majority of home equity lines do not begin to amortize
until after 2014, and balances continue to decline
•
Hedges on wholesale funding channels require us to
continue issuing short-term debt for next several years
$0.5
$0.2
$0.2
$0.3
$0.8
$1.2
0%
20%
40%
60%
80%
100%
$0.0
$0.4
$0.8
$1.2
$1.6
$2.0
2011
2012
2013
2014
2015
2016
2017
payment resets by year
First-time resets
Prior first-time resets
% of total first-time resets
$0.3
$0.1
$0.2
$0.3
$0.9
$1.5
$0.5
0%
20%
40%
60%
80%
100%
$0.0
$0.4
$0.8
$1.2
$1.6
$2.0
I/O to amortizing conversions
% of total conversions
0.0
1.0
2.0
3.0
4.0
5.0
6.0
7.0
Wholesale funding obligations will expire over
the next ten years
2011
2012
2013
2014
2015
2016
2017
$1.9
$0.6
Prior conversions
Conversions |
 ©
2012 E*TRADE FINANCIAL Corp. All rights reserved.
This presentation contains confidential information and may not be disclosed
without E*TRADE FINANCIAL Corporation’s written permission.
19
Challenges
Prolonged low interest rate
environment
Further deterioration in home prices
Consumer confidence
Regulatory transition
Sustain accelerated growth in
brokerage
Success in retirement & investing
Reduce size of the balance sheet
Efficient use of capital
Business model
Environment |
 |
 21
Appendix
©
2012 E*TRADE FINANCIAL Corp. All rights reserved.
This presentation contains confidential information and may not be disclosed
without E*TRADE FINANCIAL Corporation’s written permission.
|