Attached files
| file | filename |
|---|---|
| 8-K - FORM 8-K - STRATEGIC HOTELS & RESORTS, INC | d361665d8k.htm |
 Investor
Presentation June 2012
Exhibit 99.1 |
 I.
BEE’s Unique Value Proposition
II.
Company Overview
III.
Industry Update
IV.
Operating Trends
V.
Financial Overview
BEE’s Unique Value Proposition
1 |
 o
The only pure play high-end lodging REIT
o
High-end outperforms the industry in a recovery
o
Industry leading asset management expertise
o
Assets are in pristine condition
o
Embedded organic growth through revenue growth and ROI opportunities
o
Historically low supply growth environment, particularly in BEE markets
o
Replacement cost, excluding land, approximately $700,000 per key
o
Balance sheet positioned for growth
The best investment proposition in the lodging space
2
BEE’s Unique Value Proposition |
 BEE’s
Unique Value Proposition Proven
Investment
Track Record
Industry Leading
Asset
Management
High-end, Unique
& Irreplaceable
Hotel & Resort
Portfolio
3 |
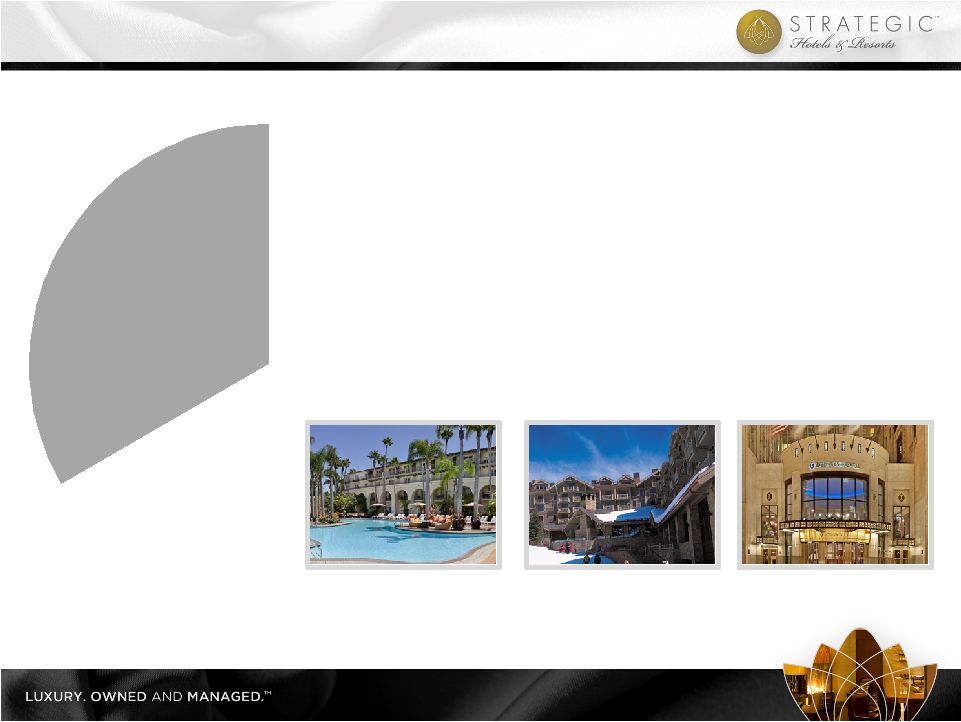 Highlights
o
Best portfolio in public markets
o
Locations in high-barrier-to-entry markets
o
City-center and resort destinations
o
World-class amenities
o
No new supply in BEE’s markets
Four Seasons Jackson Hole
Ritz-Carlton Laguna Niguel
InterContinental Chicago
BEE’s Unique Value Proposition
Industry
As
High-end, Unique
& Irreplaceable
Hotel & Resort
Portfolio
4 |
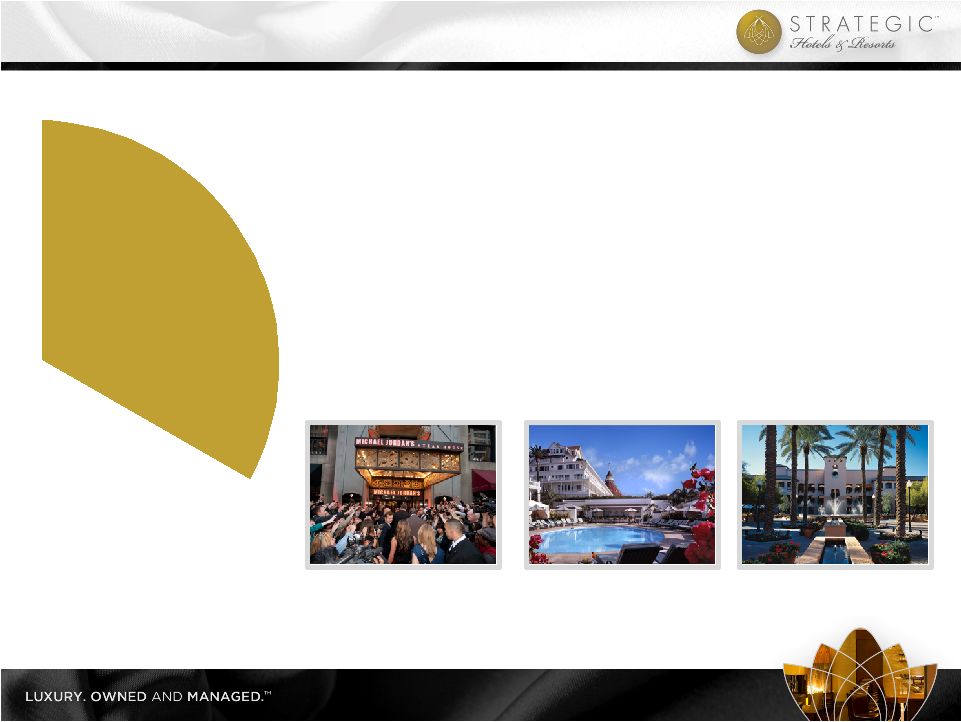 Highlights
o
Execution of complex and accretive restructurings
o
Assessment and development of ROI projects
o
Recent success in acquiring hotels through
off-market transactions
o
Maximized proceeds through well-timed
asset sales
Hotel del Coronado
Michael Jordan’s Steak House
Fairmont Scottsdale Princess
BEE’s Unique Value Proposition
Proven
Investment
Track Record
5 |
 Industry
Leading Asset
Management
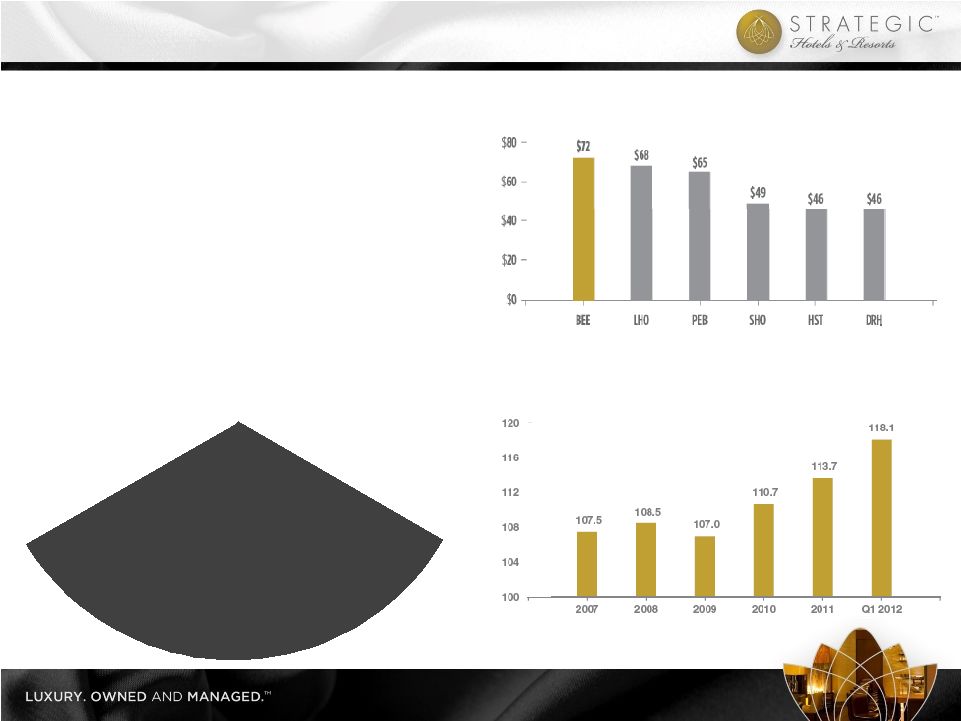
Highlights
o
Highest
EBITDA
per
room
in
competitive
set
o
Sustained market share penetration
and revenue growth
o
Implemented cost cutting initiatives
in advance of recession
o
Maintaining fixed cost reductions
in recovery
o
Strong relationships with and rigorous
oversight of brand managers
EBITDA Per Available Room
Annual RevPAR Index
BEE’s Unique Value Proposition
Note:
All
metrics
represent
full-year
2011
results.
BEE
portfolio
reflects
Total
United
States
portfolio
as
of
12/31/2011.
Source:
Public
filings
Source: Smith Travel Research
6 |
 I.
BEE’s Unique Value Proposition
II.
Company Overview
III.
Industry Update
IV.
Operating Trends
V.
Financial Overview
Company Overview
7 |
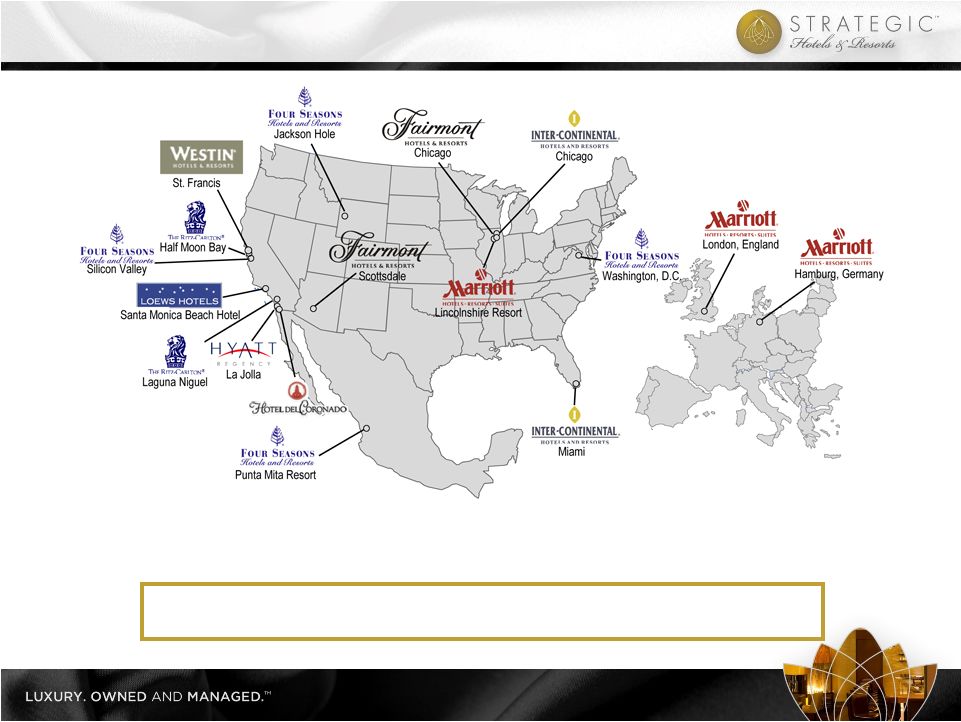 Top-Tier
Market Exposure 17
hotels
located
in
primary
gateway
cities
and
high
barrier
to
entry
markets;
including
7,762
rooms
and
840,000
square
feet
of
meeting
space
8 |
 o
InterContinental
Miami
–
Guestroom
renovation
o
InterContinental
Chicago
–
Michael
Jordan’s
Steak
House
o
Four
Seasons
Washington,
D.C.
–
Retail
outlet
renovation
o
Marriott
Lincolnshire
Resort
–
Lobby
renovation
o
Westin
St.
Francis
–
Michael
Mina
Steakhouse
conversion
o
Four
Seasons
Washington,
D.C.
–
Lobby
renovation,
11-room
expansion,
new
restaurant,
63-room
and
suite
renovation
o
Westin
St.
Francis
–
Clock
Bar
o
Fairmont
Chicago
–
ENO
wine
tasting
room,
lobby
renovation,
guestroom
renovation,
new
spa
and
fitness
center
o
Four
Seasons
Punta
Mita
Resort
–
New
lobby
bar
o
Ritz-Carlton
Half
Moon
Bay
–
ENO
wine
tasting
room,
restaurant
and
lounge
renovation,
suite
renovation
Notable 2008
capital projects
Notable 2009
capital projects
Notable 2010
capital projects
Notable 2011
capital projects
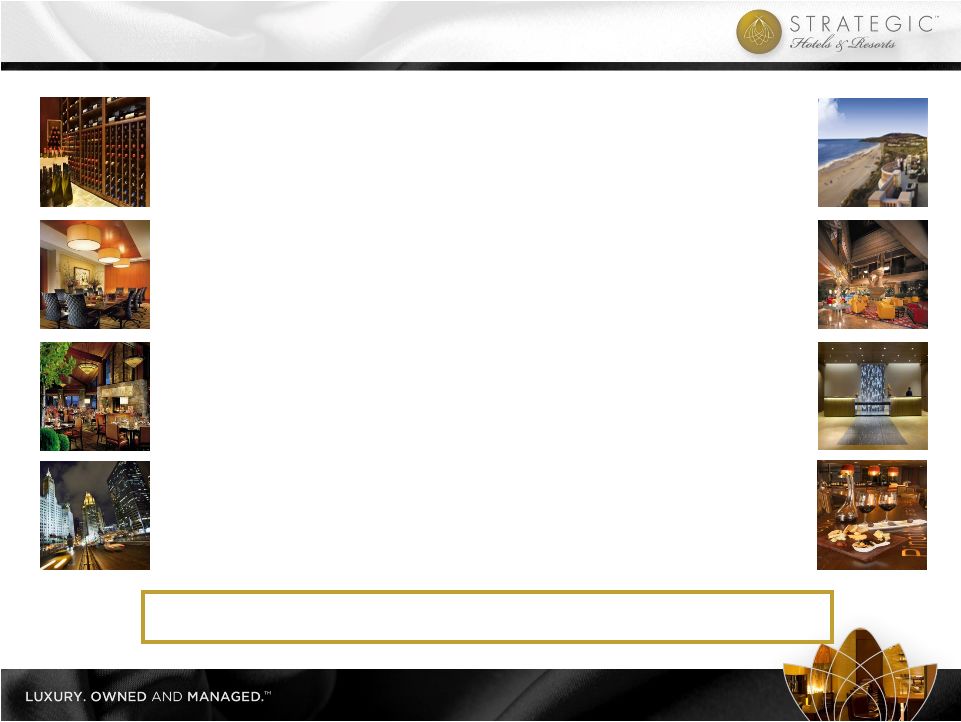
Fairmont Chicago Lobby
Four Seasons Washington, D.C. Lobby
Westin St. Francis Michael Mina
Bourbon Steak
InterContinental Miami Guestroom
Portfolio Well-Positioned to Enhance Cash Flow Growth
9 |
 Four Seasons
Washington, D.C. o
ENO
Wine
Room
o
Retail
space
optimization
Four
Seasons
Silicon
Valley
o
Qauttro
patio
renovation
o
Meeting
room
renovation
Four Seasons Jackson Hole
o
Restaurant
re-concept
InterContinental Chicago
o
North
tower
guestroom
renovation
o
Meeting
space
expansion
o
Michigan
Ave.
façade
optimization
Ritz-Carlton Laguna Niguel
o
35-room
fire
pit
addition
o
Pool
deck
upgrades
InterContinental Miami
o
Public
space
revitalization
o
Meeting
space
expansion
o
Pool
deck
refurbishment
Fairmont Chicago
o
Meeting
space
renovation
o
Restaurant
re-concept
Westin St. Francis
o
ENO
Wine
Room
Loews Santa Monica Beach Hotel
o
Exterior
/
interior
upgrade
Significant
ROI
capital
investment
opportunities
within
existing
portfolio;
rigorous
analysis
and
approval
process
for
each
project
Potential Capital Projects in the Pipeline
10 |
 I.
BEE’s Unique Value Proposition
II.
Company Overview
III.
Industry Update
IV.
Operating Trends
V.
Financial Overview
Industry Update
11 |
 o
Lodging demand historically correlates with GDP (~80%) but potential exists for
near-term disconnect, particularly at the high-end
o
Customer demographics for luxury / high-end very strong –
corporate America and college educated
consumers
o
Supply growth remains historically low and development pipeline indicates muted supply for
the next several years
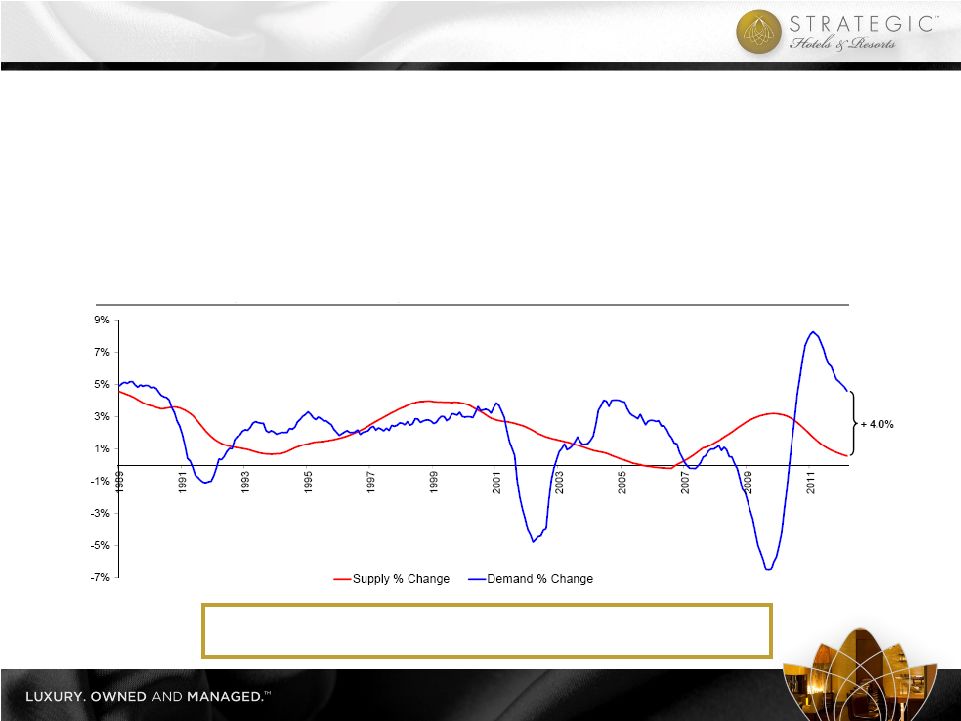
Total U.S. Supply & Demand Change (TTM)
Source: Smith Travel Research
Demand growth exceeds supply growth by 400 bps which should
result in significant ADR growth as recovery continues
Lodging Outlook
12 |
 Source: Smith Travel Research
Note: Data represents trends within the United States
o
Luxury supply growth was historically lower leading into the recent recession
o
Projects in planning or under construction have decreased significantly
o
No new competitive luxury or upper-upscale supply projected in BEE markets
o
1-2 years estimated time to permit; 3 years estimated time to build a luxury hotel
o
Economic proposition of hotel construction challenging with replacement cost estimated
at over $700,000 per key
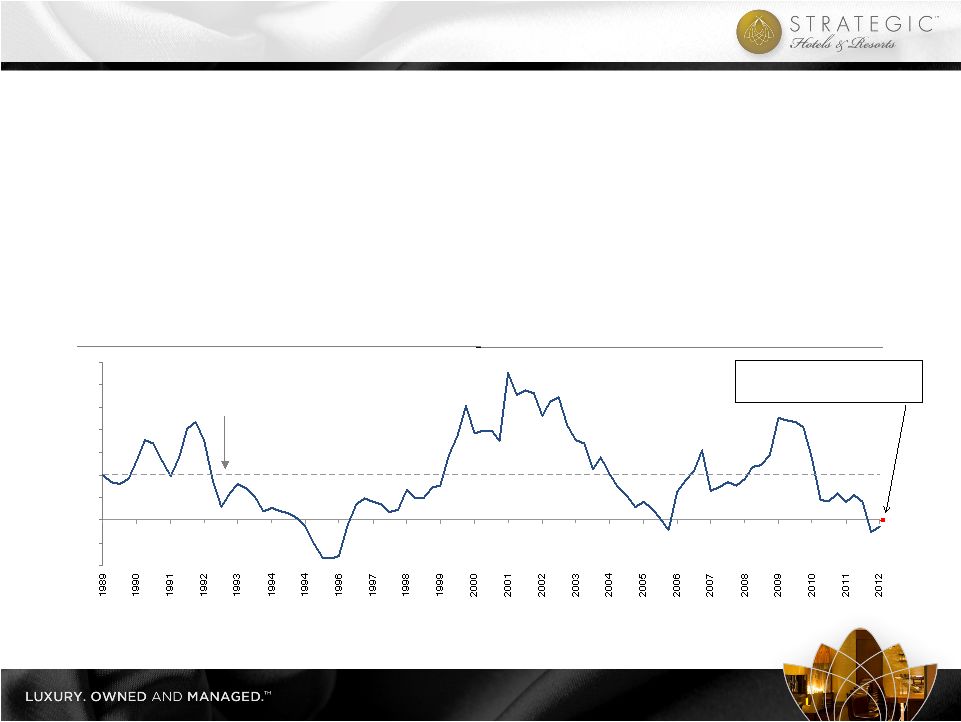
Favorable Supply Outlook
Year-Over-Year % Supply Growth
1988 –
Q1 2012
Average: 4.0%
Supply Growth in
BEE Markets = 0.0%
(4%)
(2%)
0%
2%
4%
6%
8%
10%
12%
14%
13 |
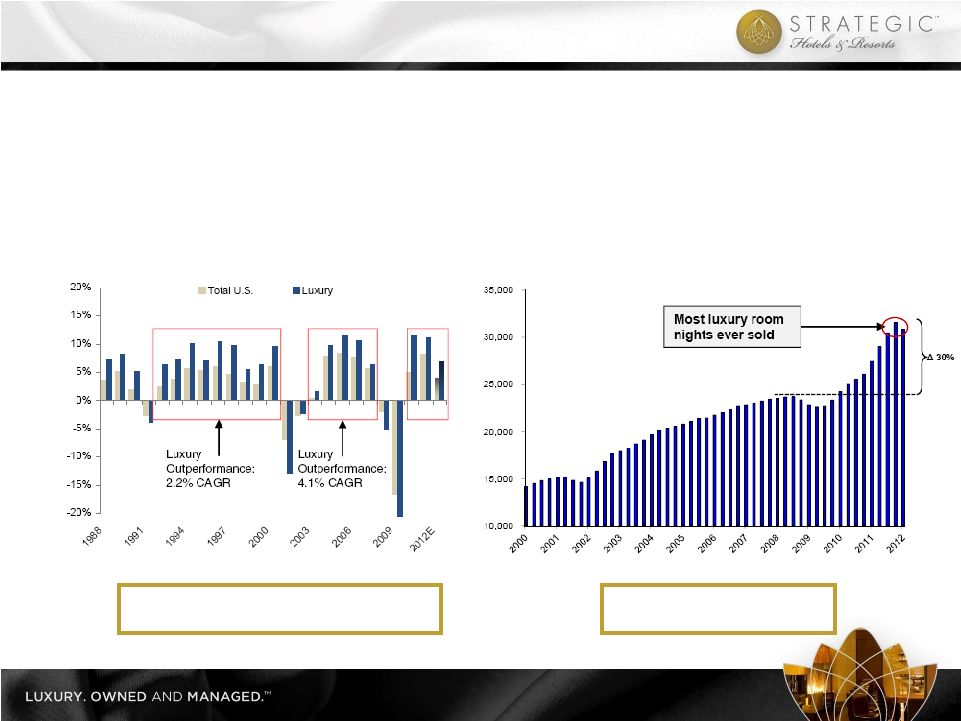 14
Source: Smith Travel Research and PWC
Source: Smith Travel Research
Annual % Change in RevPAR
Quarterly Luxury Room Night Demand (000s)
o
Luxury
hotels
have
experienced
prolonged
RevPAR
growth
following
past
industry
downturns
o
1992
–
2000:
9
consecutive
years
of
annual
luxury
RevPAR
growth
totaling
109%
or
8.5%
annually
o
2002
–
2007:
5
consecutive
years
of
annual
luxury
RevPAR
growth
totaling
48%
or
8.2%
annually
o
Overall
luxury
room
nights
sold
is
at
an
all-time
high;
30%
higher
than
2007
Luxury outperformed Total U.S. hotels
2.0% -
4.0% in previous two downturns
Luxury room night demand
currently at all-time highs
Luxury Hotels Outperform in a Recovery
14 |
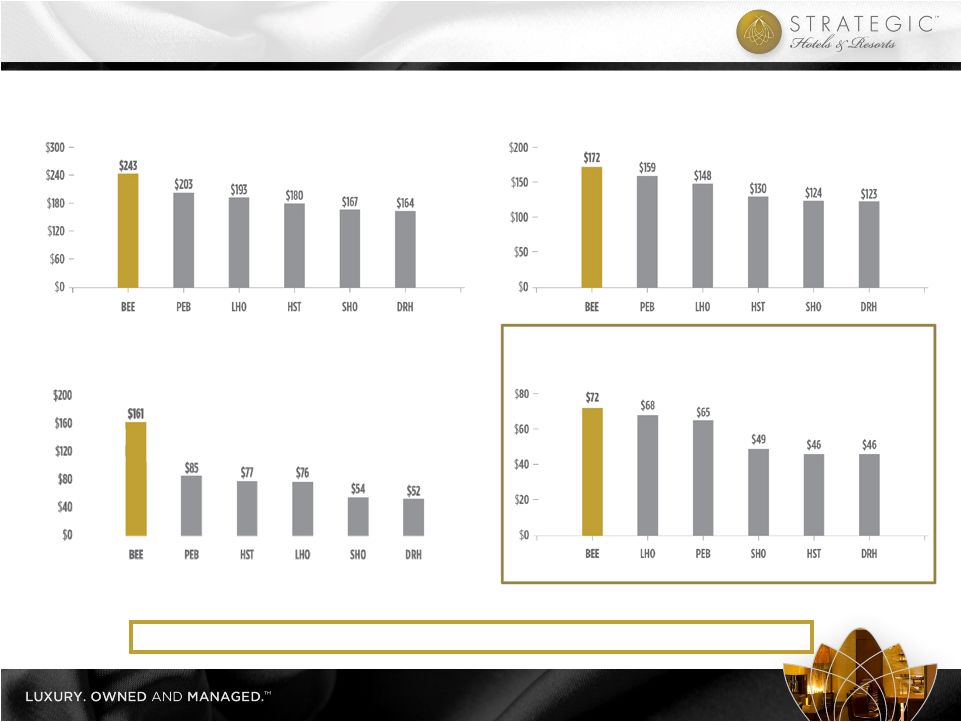 ADR
RevPAR
EBITDA Per Available Room
Non –
Rooms Revenue Per Available Room
Note: All metrics represent full-year 2011 results
BEE
portfolio
reflects
Total
United
States
portfolio
as
of
12/31/2011
Source: Public filings
BEE delivers industry leading results
BEE Outperforms Competitors
15 |
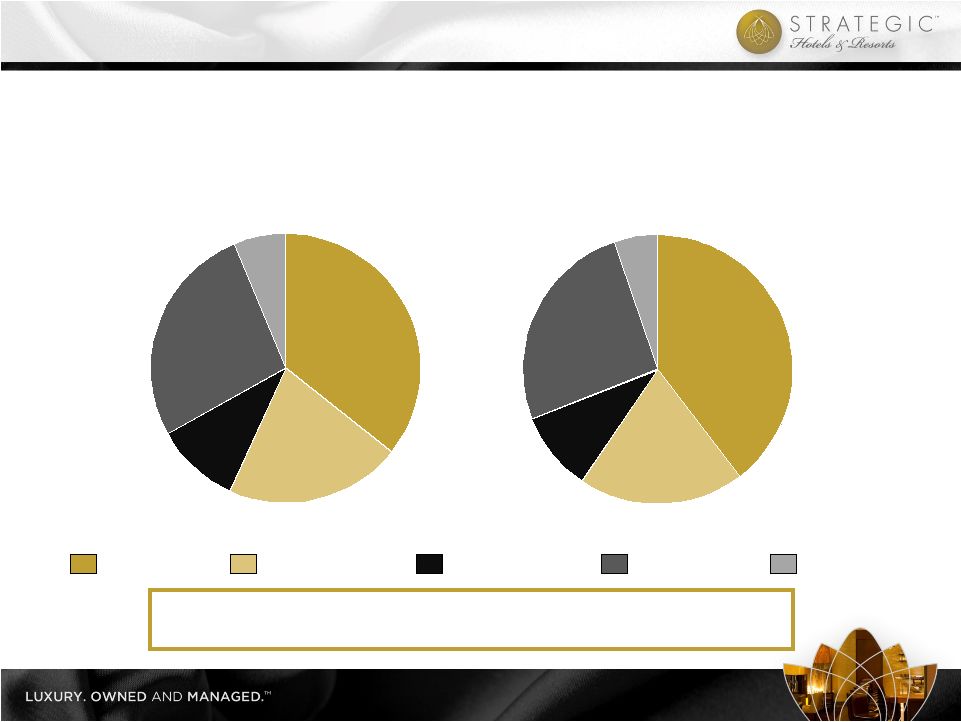
  o
Total RevPAR is key top-line performance metric
o
Focus on maximizing RevPAR, non-rooms revenue, and yield per square foot
BEE Total Revenue Mix
Peers Total Revenue Mix
Note: All metrics represent the full-year 2011. BEE portfolio reflects the
North America Same Store portfolio Peers include: DRH, HST, LHO, PEB,
SHO Source: Public filings
BEE
revenue
driven
more
heavily
by
non-rooms
revenue
relative
to
peers,
maximizing
yield
per
square
foot
from
our
hotels
BEE Revenue Mix Compared to Peers
54%
36%
10%
Rooms
Other
Food &
Beverage
65%
29%
6%
Rooms
Other
Food &
Beverage
16 |
 36%
21%
10%
27%
6%
40%
20%
9%
26%
5%
17
Note: Statistics represent the full year 2011. Portfolio reflects the North America
Same Store portfolio BEE Occupied Room Nights Mix
BEE Room Revenue Mix
o
Targeted mix of business ~50% / 50% group / transient
o
Group business typically yields higher non-rooms revenue than transient business
43% Group
40% Group
57% Transient
60% Transient
BEE
total
revenue
driven
heavily
by
group
business
and
ancillary
group
spend;
still
significant
capacity
to
grow
group
business
BEE Revenue Mix
Transient - Other
Transient - Negotiated
Group - Association
Group - Corporate
Group - Other
17 |
     BEE
(1)
Peers
Peer margins
@ BEE
Revenue Mix
Revenue
Rooms
54%
65%
54%
Food & Beverage
36%
29%
36%
Other
10%
6%
10%
Total
100%
100%
100%
Departmental Profit Margin
Rooms
71%
73%
73%
Food & Beverage
26%
27%
27%
EBITDA
21%
24%
18%
3% better than peers
(1) Portfolio includes all North American hotels owned for the full year 2011
Peers include: DRH, HST, LHO, PEB, & SHO
Source: Public filings
BEE’s
margins
significantly
outperform
when
adjusted
for
same
revenue
mix
Industry Leading Operating Margins
18 |
 I.
BEE’s Unique Value Proposition
II.
Company Overview
III.
Industry Update
IV.
Operating Trends
V.
Financial Overview
Operating Trends
19 |
 o
Group pace remains the most reliable forward looking indicator
o
Booking window has shortened forcing more reliance on room nights booked ITYFTY
(“in-the-year-for-the-year”)
Year-Over-Year Group Pace
Assuming similar production as 2011,
group room nights 14% below peak
*2012 production in the year assumes the same production as in 2011
Group room nights on the books for 2012 are approximately flat compared
to same time last year; ADR up approximately 4% compared to 2011
rate
Group room nights on the books for 2013 are up approximately 7%
compared to 2012; ADR approximately flat compared to 2012 rate
Group Booking Outlook
0
200,000
400,000
600,000
800,000
1,000,000
2007
2008
2009
2010
2011
2012*
Definite through April
Production in the year
20 |
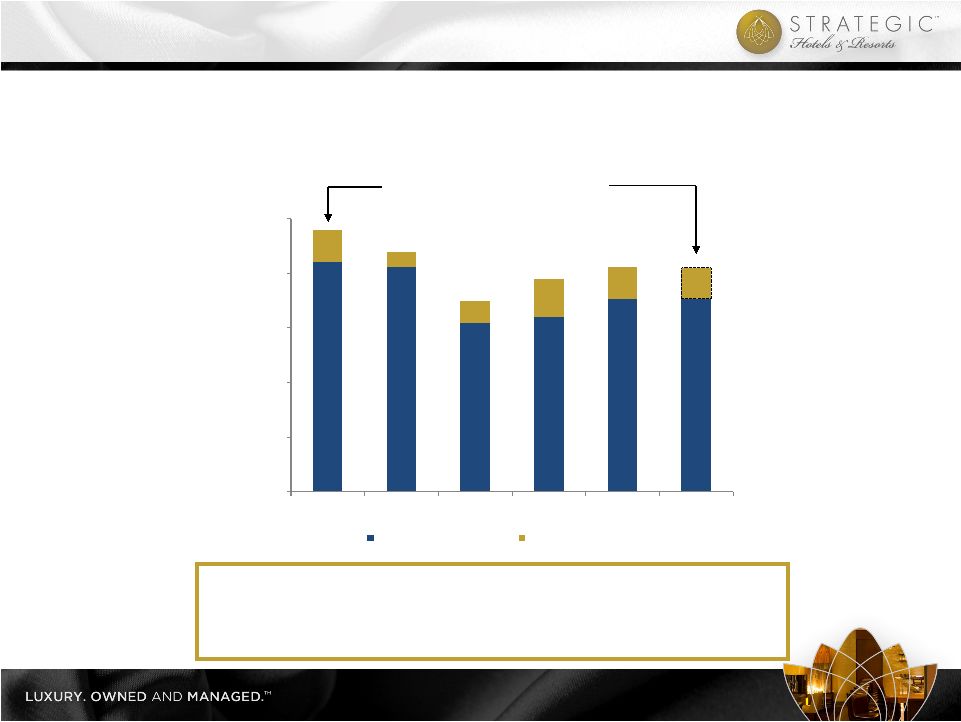
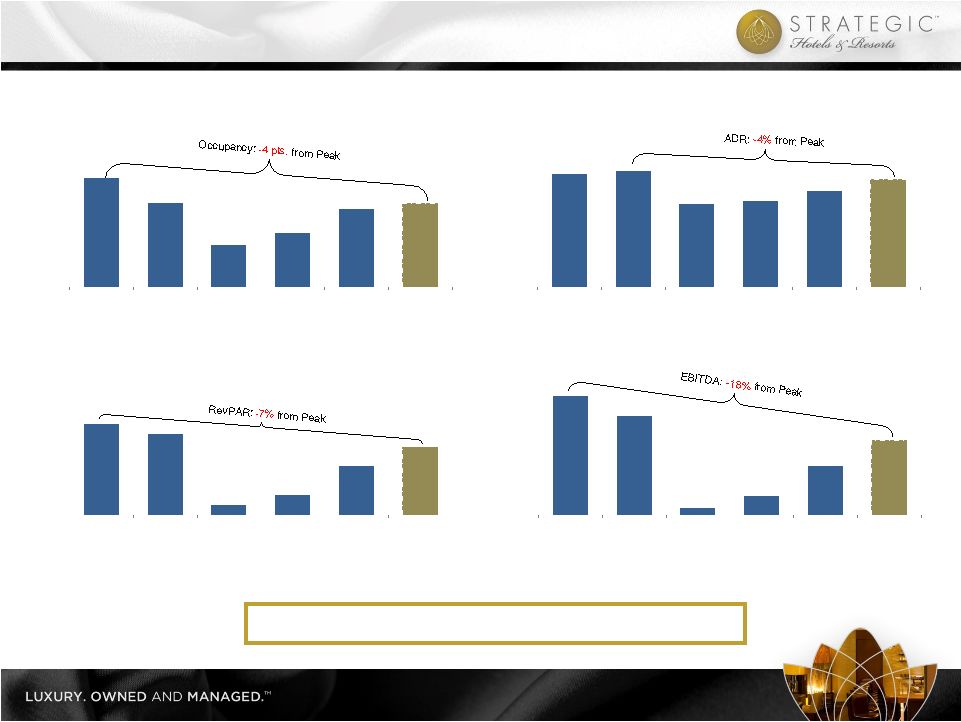 $100
$120
$140
$160
$180
$200
2007
2008
2009
2010
2011
2012F
$140
$160
$180
$200
$220
2007
2008
2009
2010
2011
2012F
$120
$160
$200
$240
$280
2007
2008
2009
2010
2011
2012F
60%
64%
68%
72%
76%
80%
2007
2008
2009
2010
2011
2012F
Occupancy
ADR
RevPAR
Property EBITDA (in millions)
Note:
Same
store
North
America
portfolio,
excludes:
Hotel
del
Coronado,
Fairmont
Scottsdale
Princess,
Four
Seasons
Jackson
Hole,
Four
Seasons
Silicon
Valley
2012 forecast assumes midpoint of guidance range
Operating
performance
improving;
still
below
peak
Embedded Portfolio Growth
21 |
 I.
BEE’s Unique Value Proposition
II.
Company Overview
III.
Industry Update
IV.
Operating Trends
V.
Financial Overview
Financial Overview
22 |
 Raised $665
million in equity: o
$335 mm secondary offering (May 2010)
o
$145 mm Woodbridge transaction acquiring two Four Seasons hotels
plus PIPE (February 2011)
o
$70 mm equity placement to GIC for share in InterContinental Chicago (June 2011)
o
$115 mm overnight equity offering (April 2012)
Asset sales:
o
Sold
InterContinental
Prague
for
€110.6mm
(December
2010)
o
Sold leasehold position at Marriott Paris Champs-Elysees for approximately $60 million
(April 2011) o
Sold stake in BuyEfficient for $9mm (January 2011)
Debt Repayments:
o
Tendered
and
fully
retired
$180mm
unsecured
convertible
recourse
notes
(May
2010)
Hotel del Coronado complex restructuring (February 2011):
o
Negotiated new joint-venture with Blackstone and KSL
o
Closed new CMBS mortgage financing totaling $425mm
Fairmont Scottsdale Princess complex restructuring (June 2011):
o
Negotiated new joint venture structure with Walton Street Capital
o
Negotiated amendment and extension to CMBS debt for four years at below market terms
New Line of Credit (June 2011):
o
Reduced lenders in bank syndicate from 21 banks to 10 banks
o
Achieved three year term with one year extension
Debt refinancings:
o
Six property loans refinanced totaling nearly $800 million
Preferred Equity Tender (December 2011):
o
Successfully tendered for approximately 22% of outstanding preferred equity at a 15%
discount to par plus accrued preferred dividends; 14 quarters accrued dividends
payable June 29, 2012 Accomplishments
Since
January
1
st
,
2010
23 |
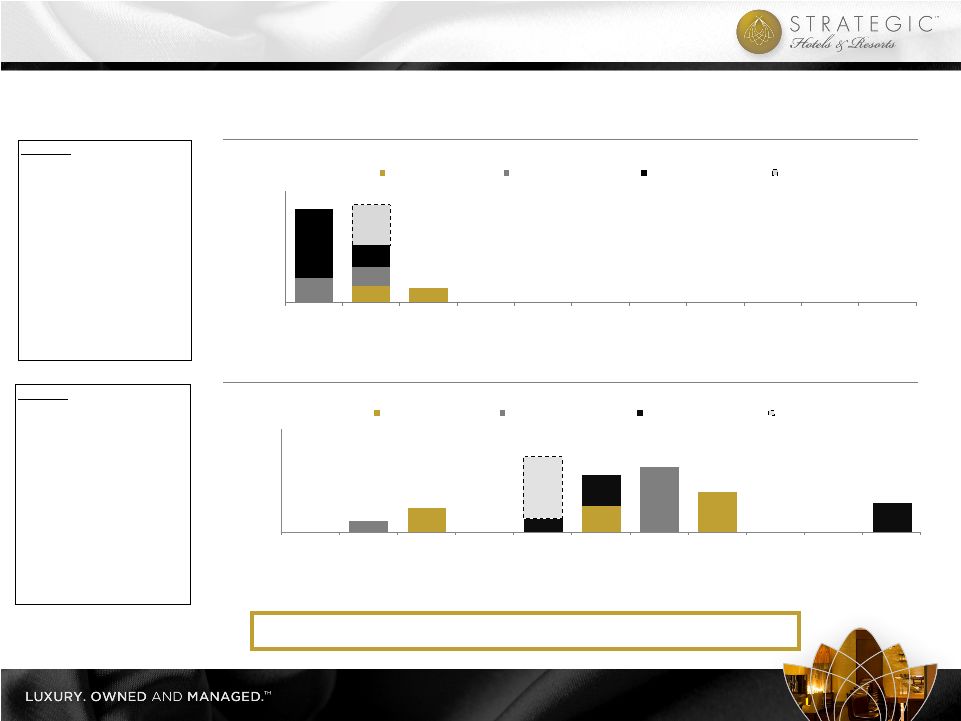 $115.5
$130.0
$195.0
$52.2
$315.7
$66.5
$145.8
$145.0
$0.0
$100.0
$200.0
$300.0
$400.0
$500.0
2011
2012
2013
2014
2015
2016
2017
2018
2019
2020
2021
Bank
Life Co.
CMBS
Corporate
$300.0
Capacity
$275.8
$148.9
$124.9
$220.0
$173.5
$614.5
$194.8
$358.0
$0.0
$200.0
$400.0
$600.0
$800.0
$1,000.0
2011
2012
2013
2014
2015
2016
2017
2018
2019
2020
2021
Bank
Life Co.
CMBS
Corporate
$834.5
$875.2
January 1, 2010
March 31, 2012
BEE’s balance sheet is structured for growth
Strong Recapitalized Balance Sheet ($ in millions)
Note: Assumes full extension periods for all loans.
(a)
Pro-forma for April 2012 equity offering.
(b)
EBITDA reflects mid-point of 2012 guidance range.
Key Stats
(a)(b)
Net Debt/EBITDA
6.1x
Net Debt+Pref /EBITDA
7.8x
Net Debt/TEV
40.7%
Avg. Maturity (yrs)
5.1
Unencumbered assets
2
Corporate liquidity (MM)
$345.0
Mix of Debt
Bank Debt
37.8%
Life Insurance Co.
31.6%
CMBS
30.7%
Key Stats
Net Debt/EBITDA
14.3x
Net Debt+Pref /EBITDA
17.4x
Net Debt/TEV
76.9%
Avg. Maturity (yrs)
3.4
Unencumbered assets
0
Corporate liquidity (MM)
$105.0
Mix of Debt
Bank Debt
18.5%
Life Insurance Co.
26.6%
CMBS
54.8%
24 |
       (a) Excludes Fairmont Scottsdale Princess, Four Seasons Jackson
Hole, Four Seasons Silicon Valley, and Hotel del Coronado
1st
Quarter 2012 Results (EBITDA in millions)
2011 Actual
2012 Actual
Operations
(Same Store N.A. Portfolio)
(a)
ADR
$226
5.1%
$238
RevPAR
$146
9.4%
$160
Total RevPAR
$279
7.7%
$301
EBITDA Margins
15.5%
170 bps
17.2%
Corporate Results
Comparable EBITDA
$28.7
15.9%
$33.3
Comparable FFO / share
($0.02)
N/A
$0.02
25 |
      (a)
Portfolio excludes Fairmont Scottsdale Princess, Four Seasons Jackson Hole, Four
Seasons Silicon Valley, and Hotel del Coronado (b)
2011 Comparable FFO / share excludes one-time gain associated with preferred
equity tender 2012 Guidance (EBITDA in millions)
2011 Actual
2012 Guidance
Operations
(Same Store N.A. Portfolio)
(a)
RevPAR
$170
6%-8%
$180-$183
Total RevPAR
$314
5%-7%
$330-$336
EBITDA Margins
21.1%
100 - 175bps
22.1%-22.9%
Corporate Results
Comparable EBITDA
$155
7%-16%
$165-$180
Comparable FFO / share
$0.14
50%-107%
$0.21-$0.29
(b)
26 |
 o
The only pure play high-end lodging REIT
o
High-end outperforms the industry in a recovery
o
Industry leading asset management expertise
o
Assets are in pristine condition
o
Embedded organic growth through revenue growth and ROI opportunities
o
Historically low supply growth environment, particularly in BEE markets
o
Replacement cost, excluding land, approximately $700,000 per key
o
Balance sheet positioned for growth
The best investment proposition in the lodging space
BEE’s Unique Value Proposition
27 |
 Disclaimer
28
Except for historical information, the matters discussed in this presentation are forward-looking
statements subject to certain risks and uncertainties. Forward-looking statements relate to
expectations, beliefs, projections, future plans and strategies, anticipated events or trends, and
similar expressions concerning matters that are not historical facts. These forward-looking
statements are identified by their use of such terms and phrases such as “anticipate,”
“believe,” “could,” “estimate,” “expect,” “intend,” “may,” “plan,” “predict,” “project,” “should,” “will,”
“continue” and other similar terms and phrases, including references to assumptions and
forecasts of future results. Forward-looking statements are not guarantees of future performance.
Actual results could differ materially from the Company’s projections.
Factors that may contribute to these differences include, but are not limited to the following:
the effects of the recent global economic recession upon business and leisure travel and the
hotel markets in which the Company invests; the Company’s liquidity and refinancing demands; the
Company’s ability to obtain or refinance maturing debt; the Company’s ability to
maintain compliance with covenants contained in the Company’s debt facilities; the Company’s
ability to meet the requirements of the Maryland General Corporation Law with respect to the
payment of preferred dividends on the June 29, 2012 payment date; stagnation or further deterioration in economic and market conditions, particularly impacting business and leisure
travel spending in the markets where the Company’s hotels operate and in which the Company
invests, including luxury and upper upscale product; general volatility of the capital markets
and the market price of the Company’s shares of common stock; availability of capital; the
Company’s ability to dispose of properties in a manner consistent with the Company’s
investment strategy and liquidity needs; hostilities and security concerns, including future terrorist
attacks, or the apprehension of hostilities, in each case that affect travel within or to the
United States, Mexico, Germany, England or other countries where the Company invests; difficulties in
identifying properties to acquire and completing acquisitions; the Company’s failure to
maintain effective internal control over financial reporting and disclosure controls and procedures; risks related to natural disasters; increases in interest rates and operating costs,
including insurance premiums and real property taxes; contagious disease outbreaks, such as the H1N1
virus outbreak; delays and cost-overruns in construction and development; marketing
challenges associated with entering new lines of business or pursuing new business strategies; the Company’s failure to maintain the Company’s status as a REIT; changes in
the competitive environment in the Company’s industry and the markets where the Company invests;
changes in real estate and zoning laws or regulations; legislative or regulatory changes,
including changes to laws governing the taxation of REITS; changes in generally accepted accounting principles, policies and guidelines; and litigation, judgments or settlements.
Additional risks are discussed in the Company’s filings with the Securities and Exchange
Commission, including those appearing under the heading “Item 1A. Risk Factors” in the
Company’s most recent Form 10-K and subsequent Form 10-Qs. Although the Company believes
the expectations reflected in such forward-looking statements are based on reasonable
assumptions, it can give no assurance that its expectations will be attained. The forward-looking
statements are made as of the date of this press release, and the Company undertakes no
obligation to publicly update or revise any forward-looking statement, whether as a result of new
information, future events or otherwise, except as required by law. |
 Non-GAAP
to GAAP Reconciliations Reconciliation of Net Debt / EBITDA
($ in 000s)
YE 2009
(a)
1Q 2012
(b)(c)
Consolidated debt
$1,658,745
$1,000,128
Pro rata share of unconsolidated debt
282,825
212,275
Pro rata share of consolidated debt
(107,065)
(45,548)
Cash and cash equivalents
(116,310)
(113,605)
Net Debt
$1,718,195
$1,053,250
Comparable EBITDA
$119,953
$172,500
Net Debt / EBITDA
14.3x
6.1x
(a) All figures taken from year-end 2009 financial statements.
(b) Comparable EBITDA reflects mid-point of guidance range.
(c) All figures taken from 1st quarter 2012 financial statements and adjusted
for April 2012 equity offering.
Reconciliation of Net Debt / TEV
($ in 000s)
YE 2009
(a)
1Q 2012
(b)
Consolidated Debt
$1,658,745
$1,000,128
Pro rata share of unconsolidated debt
282,825
212,275
Pro rata share of consolidated debt
(107,065)
(45,548)
Cash and cash equivalents
(116,310)
(113,605)
Net Debt
$1,718,195
$1,053,250
Market Capitalization
$144,966
$1,243,298
Total Debt
1,834,505
1,166,855
Preferred Equity
370,236
289,102
Cash and cash equivalents
(116,310)
(113,605)
Total Enterprise Value
$2,233,397
$2,585,650
Net Debt / Enterprise Value
76.9%
40.7%
(a) All figures taken from year-end 2009 financial statements.
(b) All figures taken from 1st quarter 2012 financial statements and adjusted
for April 2012 equity offering.
Reconciliation of Net Debt + Preferred Equity / EBITDA
($ in 000s)
YE 2009
(a)
1Q 2012
(b)(c)
Preferred equity capitalization
$370,236
$289,102
Consolidated debt
1,658,745
1,000,128
Pro rata share of unconsolidated debt
282,825
212,275
Pro rata share of consolidated debt
(107,065)
(45,548)
Cash and cash equivalents
(116,310)
(113,605)
Net Debt + Preferreds
$2,088,431
$1,342,352
Comparable EBITDA
$119,953
$172,500
Net Debt + Preferreds / EBITDA
17.4x
7.8x
(a) All figures taken from year-end 2009 financial statements.
(b) Comparable EBITDA reflects mid-point of guidance range.
(c) All figures taken from 1st quarter 2012 financial statements and adjusted
for April 2012 equity offering.
29 |
 Non-GAAP
to GAAP Reconciliations 2012
2011
Net loss attributable to SHR common shareholders
(31,516)
$
(35,407)
$
Depreciation and amortization
25,490
30,605
Interest expense
19,605
19,548
Income taxes - continuing operations
465
(1,648)
Income taxes - discontinued operations
-
359
Noncontrolling interests
(117)
(138)
Adjustments from consolidated
affiliates (1,257)
(1,329)
Adjustments from unconsolidated affiliates
6,682
3,890
Preferred shareholder dividends
6,041
7,721
EBITDA
25,393
23,601
Realized portion of deferred gain on sale-leaseback -
continuing operations (51)
(53)
Realized portion of
deferred gain on sale-leaseback - discontinued operations
-
(1,152)
Gain on sale of assets - continuing operations
-
(2,640)
Gain on sale of assets - discontinued
operations -
(14)
Foreign currency exchange
loss (gain) - continuing operations (a) 5
(139)
Foreign currency exchange gain -
discontinued operations (a) -
(58)
Adjustment for Value
Creation Plan 7,939
9,181
Comparable EBITDA
33,286
$
28,726
$
(a)
Foreign currency exchange gains or losses applicable to
third-party and inter-company debt and certain balance sheet items held by
foreign subsidiaries.
March 31,
Reconciliation of Net Loss Attributable to SHR Common Shareholders to
EBITDA and Comparable EBITDA (in thousands)
Three Months Ended
30 |
 Non-GAAP
to GAAP Reconciliations 2012
2011
Net loss attributable to SHR common shareholders
(31,516)
$
(35,407)
$
Depreciation and amortization
25,490
30,605
Corporate depreciation
(265)
(299)
Gain on sale of assets
- continuing operations -
(2,640)
Gain on sale of assets - discontinued
operations -
(14)
Realized
portion of deferred gain on sale-leaseback - continuing operations
(51)
(53)
Realized
portion of deferred gain on sale-leaseback - discontinued operations
-
(1,152)
Deferred tax expense on realized portion of
deferred gain on sale-leasebacks -
359
Noncontrolling
interests adjustments (133)
(157)
Adjustments from
consolidated affiliates (667)
(1,561)
Adjustments from unconsolidated
affiliates 3,764
1,839
FFO
(3,378)
(8,480)
Redeemable noncontrolling interests
16
19
FFO
- Fully Diluted (3,362)
(8,461)
Non-cash mark to market of interest rate
swaps (1,530)
(4,366)
Foreign currency exchange loss (gain) -
continuing operations (a) 5
(139)
Foreign currency exchange
gain - discontinued operations (a) -
(58)
Adjustment for
Value Creation Plan 7,939
9,181
Comparable FFO
3,052
$
(3,843)
$
Comparable FFO per diluted share
0.02
$
(0.02)
$
Weighted average diluted shares
188,787
157,333
(a)
Foreign currency exchange gains or losses applicable to
third-party and inter-company debt and certain balance sheet items held by foreign
subsidiaries.
March 31,
Three Months Ended
31 |
 Non-GAAP
to GAAP Reconciliations Operational Guidance
Low Range
High Range
North American same store Total RevPAR growth (a)
5.0%
7.0%
North American same store RevPAR growth (a)
6.0%
8.0%
(a) Includes North American hotels which are consolidated in our
financial results, but excludes the Four Seasons Jackson Hole and Four
Seasons Silicon Valley hotels, which were acquired in 2011.
Comparable EBITDA Guidance
Low Range
High Range
Net loss attributable to common shareholders
(79.3)
$
(64.3)
$
Depreciation and amortization
105.0
105.0
Interest expense
83.1
83.1
Income taxes
1.1
1.1
Noncontrolling
interests (0.3)
(0.3)
Adjustments from consolidated
affiliates (5.7)
(5.7)
Adjustments from unconsolidated
affiliates 28.3
28.3
Preferred shareholder dividends
24.2
24.2
Realized portion of deferred gain on
sale-leasebacks (0.2)
(0.2)
Adjustment for Value Creation Plan
8.8
8.8
Comparable
EBITDA 165.0
$
180.0
$
Comparable FFO Guidance
Low Range
High Range
Net loss attributable to common shareholders
(79.3)
$
(64.3)
$
Depreciation and amortization
103.8
103.8
Realized portion of deferred gain on
sale-leasebacks (0.2)
(0.2)
Noncontrolling interests
(0.2)
(0.2)
Adjustments from consolidated
affiliates (2.9)
(2.9)
Adjustments from unconsolidated
affiliates 15.5
15.5
Adjustment for Value Creation Plan
8.8
8.8
Other adjustments
(1.5)
(1.5)
Comparable FFO
44.0
$
59.0
$
Comparable FFO per diluted share
(b) 0.21
$
0.29
$
(b) Comparable FFO per diluted share has been
adjusted to reflect the 18.4 million shares issued in the Company's common equity offering which
closed on April 23, 2012.
2012 Guidance
(in millions, except per share data)
Year Ended
December 31, 2012
December 31, 2012
Year Ended
December 31, 2012
Year Ended
32 |
 33
Thank You |