Attached files
| file | filename |
|---|---|
| 8-K - FORM 8K INVESTOR DAY - WEST PHARMACEUTICAL SERVICES INC | form8k.htm |

Welcome and Introductions
Presentation Background and Agenda
Presentation Background and Agenda
Donald E. Morel Jr., Ph.D.
Chairman and Chief Executive Officer
© 2012 by West Pharmaceutical Services, Inc., Lionville, PA.
All rights reserved. This material is protected by copyright. No part of it may be reproduced, stored in a retrieval system, or transmitted in any
form or by any means, electronic, mechanical, photocopying or otherwise, without written permission of West Pharmaceutical Services, Inc.
All trademarks and registered trademarks are property of West Pharmaceutical Services, Inc., unless noted otherwise.
form or by any means, electronic, mechanical, photocopying or otherwise, without written permission of West Pharmaceutical Services, Inc.
All trademarks and registered trademarks are property of West Pharmaceutical Services, Inc., unless noted otherwise.

Safe Harbor Statement
Cautionary Statement Under the Private Securities Litigation Reform Act of 1995
This presentation and any accompanying management commentary contain “forward-looking statements”
as that term is defined in the Private Securities Litigation Reform Act of 1995. Such statements include,
but are not limited to statements about expected financial results for 2012 and future years.
as that term is defined in the Private Securities Litigation Reform Act of 1995. Such statements include,
but are not limited to statements about expected financial results for 2012 and future years.
Each of these estimates is based on preliminary information, and actual results could differ from these
preliminary estimates. We caution investors that the risk factors listed under “Cautionary Statement” in
our press releases, as well as those set forth under the caption "Risk Factors" in our most recent Annual
Report on Form 10-K as filed with the Securities and Exchange Commission and as revised or
supplemented by our quarterly reports on Form 10-Q, could cause our actual results to differ materially
from those estimated or predicted in the forward-looking statements. You should evaluate any statement
in light of these important factors. Except as required by law or regulation, we undertake no obligation to
publicly update any forward-looking statements, whether as a result of new information, future events,
or otherwise.
Non-GAAP Financial Measures
Certain financial measures included in these presentation materials, and which may be referred to in
management’s discussion of the Company’s results and outlook, are Non-GAAP (Generally Accepted
Accounting Principles) financial measures. Please refer to the “Non-GAAP Financial Measures” and
“Notes to Non-GAAP Financial Measures” at the end of these materials for more information. Non-GAAP
financial measures should not be considered in isolation or as an alternative to such measures
determined in accordance with GAAP.
2

Agenda
Introductory Remarks Don Morel
Chairman and Chief Executive Officer
Chairman and Chief Executive Officer
Pharmaceutical Markets Update Mike Schaefers
Vice President, Marketing-Europe
Vice President, Marketing-Europe
Pharmaceutical Packaging Systems Jeff Hunt
President, Pharmaceutical Packaging Systems
President, Pharmaceutical Packaging Systems
Asian Growth and Expansion Warwick Bedwell
President, Asia-Pacific Region
President, Asia-Pacific Region
West NovaPure® Components Fran DeGrazio
Vice President, Marketing and Strategic
Business Development-Americas
Vice President, Marketing and Strategic
Business Development-Americas
Pharmaceutical Delivery Systems John Paproski
President, Pharmaceutical Delivery Systems
President, Pharmaceutical Delivery Systems
Self-Injection Systems Bart Burgess
Manager, Business Development
Manager, Business Development
Daikyo Crystal Zenith® Scott Young
Director, Crystal Zenith Products
Director, Crystal Zenith Products
Closing Remarks Don Morel
3
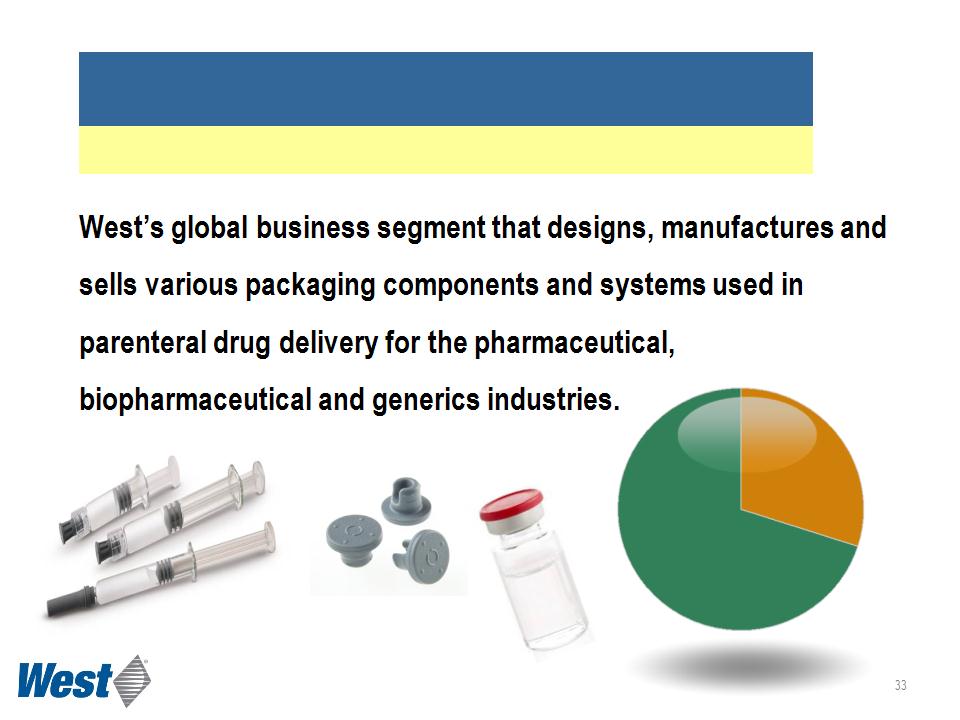
Pharmaceutical Packaging Systems
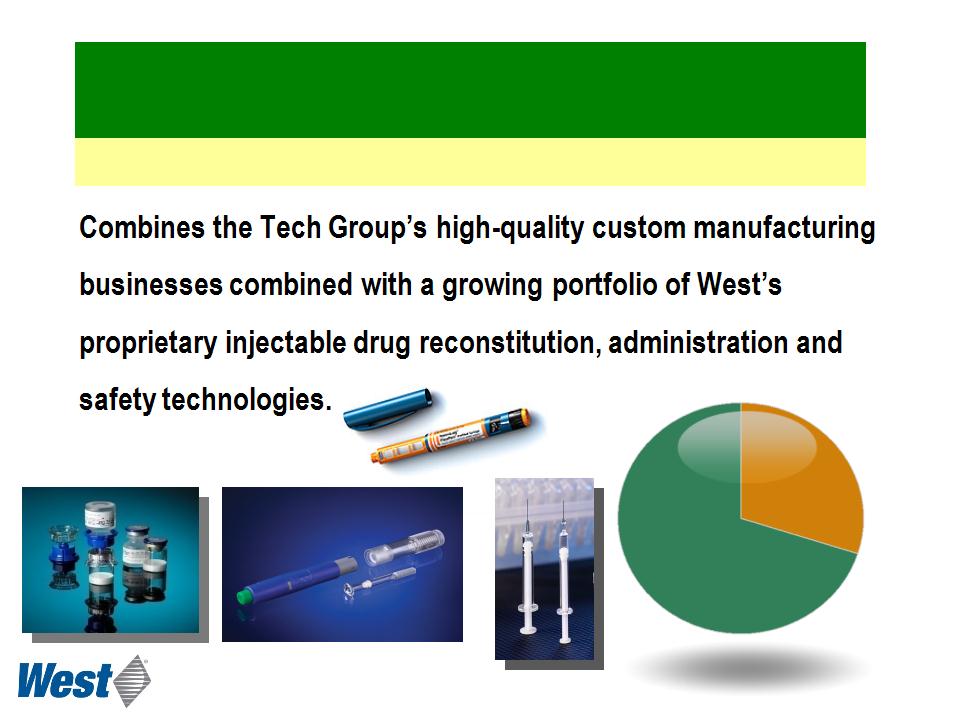
Pharmaceutical Delivery Systems
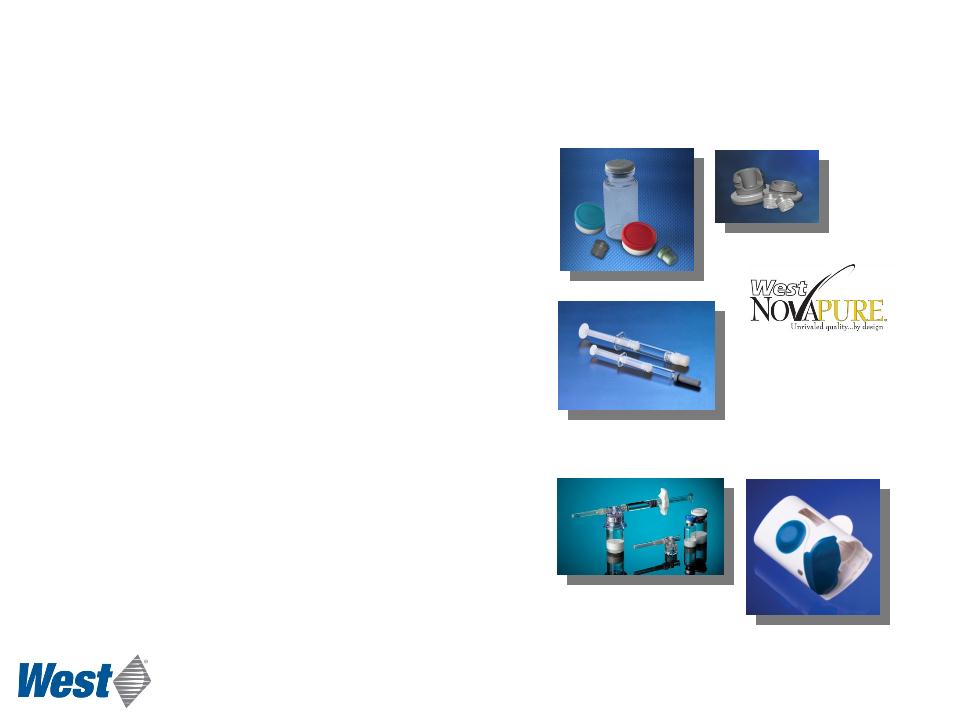
• A globally diverse manufacturer of products
used primarily in containing and administering
small-volume parenteral drugs
used primarily in containing and administering
small-volume parenteral drugs
• Strong competitive position
§ Diversified customer base
§ Proprietary technology
§ Global footprint
§ Significant barriers to entry
• Stability with growth potential
§ Proprietary Products
§ Geographic Expansion
• Financial strength to invest
§ Reliable operating cash flow
§ Well capitalized
4
Who We Are
The West Transition
• Founded in Philadelphia (1923) and listed on NYSE since 1980
• Initiated strategic transformation in 2001 to become a leading global supplier
of value-added pharmaceutical packaging systems and components
of value-added pharmaceutical packaging systems and components
5
‘03 ‘04 ‘05 ‘06 ‘07 ‘08 ‘09 ‘10 ‘11
2002
$420 M
$420 M
2011
$1.2 B
$1.2 B
Kinston
recovery
Sale of
CCI
CCI
Sale of
Drug
Drug
Delivery
Acquired
Tech Group,
Medimop
Tech Group,
Medimop
Began
Eur/Asia
expansion
expansion
Acquired
Pharma
Pen
Pharma
Pen
Acquired
Normandy
Normandy
Acquired
LaModel
LaModel
China
plastics
completed
plastics
completed
Global
Quality
Initiative
Quality
Initiative
China
rubber
begun
rubber
begun
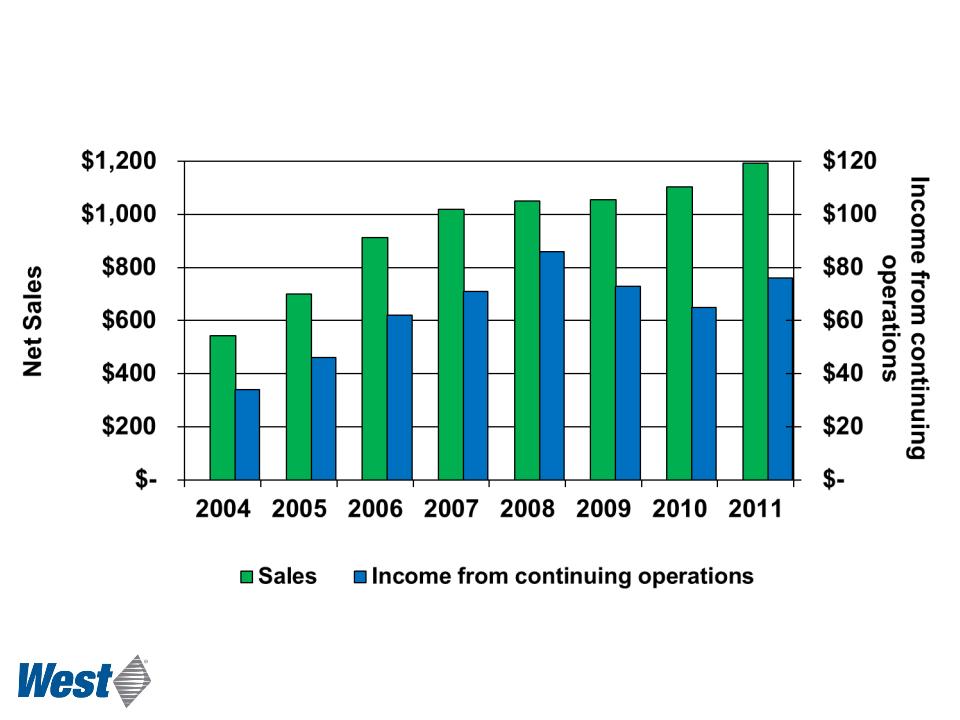
Sales and Income from Continuing Operations
$ millions
6

• Global economic conditions remain unsettled
• Global pharmaceutical revenue and unit growth will vary by region
• Further consolidation is expected
• Unknown: Status and impact of US healthcare legislation
• Tougher regulatory enforcement
• Our customers are under pressure to produce earnings growth from
merger “synergies” while key products are facing patent expiration and
new product pipelines remain thin
merger “synergies” while key products are facing patent expiration and
new product pipelines remain thin
• Our challenge: How do we grow revenues in this environment?
Business Environment
7

Summary Results
$ millions, except per-share data
$ millions, except per-share data
|
|
Three Months Ended
March 31,
|
|
|
2012
|
2011
|
|
|
|
|
|
|
Net Sales
|
$ 316.3
|
$ 295.4
|
|
Gross Profit
|
101.1
|
88.0
|
|
Reported Operating Profit
|
41.7
|
28.8
|
|
Adjusted Operating Profit (1)
|
42.3
|
30.7
|
|
Reported Diluted EPS
|
$ 0.81
|
$ 0.56
|
|
Adjusted Diluted EPS(1)
|
$ 0.83
|
$ 0.60
|
(1) These are Non-GAAP measurements. For an explanation and reconciliation of these items, see “Cautionary Statement”
(Slide 2) and “Non-GAAP Financial Measures” and “Notes to Non-GAAP Financial Measures” (see slides 93 - 95)
(Slide 2) and “Non-GAAP Financial Measures” and “Notes to Non-GAAP Financial Measures” (see slides 93 - 95)
8
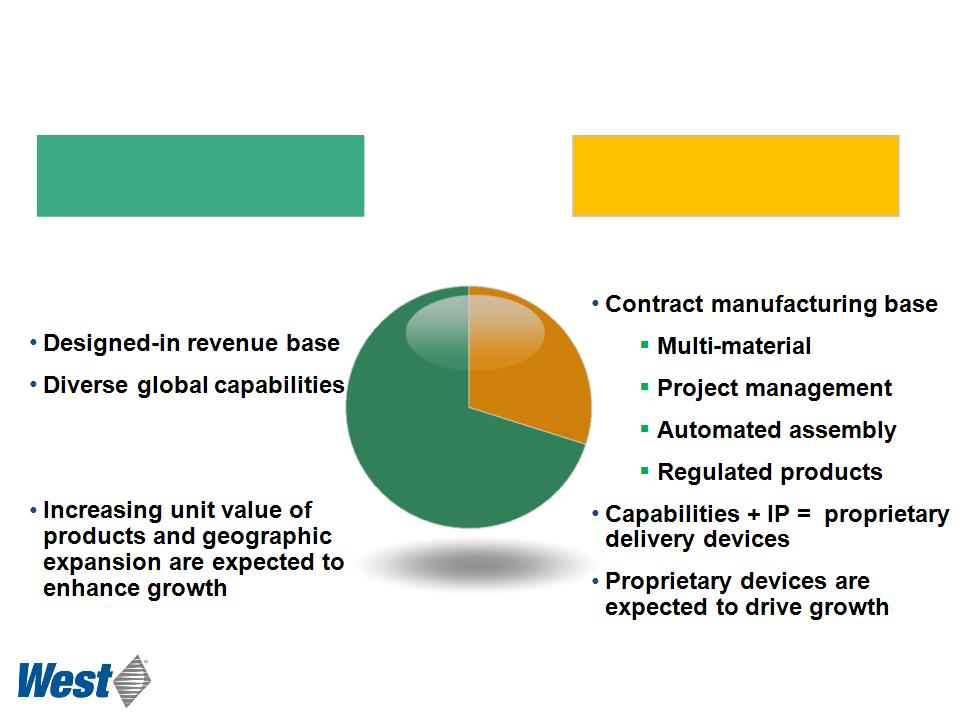
Business Segments
2011 Revenues
($ millions)
Delivery Systems
Packaging Systems
• Established leadership
• High market shares
• Steady growth in base
9
$ 857
$337

|
Pharmaceutical Packaging
Systems |
|
|
Business Unit Focus
• Small-volume parenteral packaging
• Large-volume parenteral packaging
• Prefillable syringe components
• Disposable medical device components
• Diagnostic, dental, veterinary packaging
Jeff Hunt
President
10

Our Growth Strategy
|
Pharmaceutical Packaging
Systems |
|
|
• Generate incremental value per unit
• Leverage changing regulatory environment
• Global quality initiative
• Optimize manufacturing productivity
• Strategic acquisitions
• Geographic expansion
11

|
Pharmaceutical Delivery
Systems (How drugs are administered)
|
|
|
Business Unit Focus
• Safety systems (B.Safe®, NovaGuard™,
Eris™)
Eris™)
• Reconstitution systems - Medimop
• Crystal Zenith® prefillable syringe systems
• Advanced injection systems (SmartDose®
and ConfiDose®)
and ConfiDose®)
• Tech Group contract manufacturing
The Eris safety syringe system is not currently available in the United States.
John Paproski
President
12

Our Growth Strategy
• Concentrate on systems for unmet market needs
• Build market share in multi-component systems
for drug administration utilizing Daikyo Crystal
Zenith as a platform technology
for drug administration utilizing Daikyo Crystal
Zenith as a platform technology
• Production supported by existing design, multi-
material molding, and assembly capabilities
material molding, and assembly capabilities
• Expand through innovation and strategic
technology acquisitions
technology acquisitions
|
Pharmaceutical Delivery
Systems |
|
|
13

• Our global position
• Strength of the franchise
• Key therapeutic catgeories and growth drivers
• New product pipeline and opportunities
• Risk factors
• Strong, experienced management team
• Substantial progress since 2010
Key Take-aways
14

Global Pharmaceutical Market Updates
Mike Schaefers, Ph.D.
Vice President, Marketing, Europe
15

• Global pharmaceutical revenue growth slowing down
§ CAGR ‘11 - ‘15 of 3% - 6%
§ Developed markets with moderate growth of 0 - 4%
§ “Pharmerging markets” ( BRIC, MENA) with increases of 12 - 17%
§ While unit growth remains moderate
• Dynamic growth in “Pharmerging markets” fueled by
§ Increase in skilled workforce and education level
§ Improvements in infrastructure and access to medicines
§ Lifestyle changes trigger chronic diseases
Global Pharmaceutical Market Trends
IMS, The Global Use of Medicines, May 2011, IMS Health Report 2011
16

• Globalization and consolidation of pharma industry
progressing
progressing
• Trend towards outsourcing of production to contract
manufacturer or partner in India and China
manufacturer or partner in India and China
• Growing regulatory pressure and closer scrutiny of new
products
products
• Recent drug recalls have led to shortages of injectable drugs
• Quality by Design (QbD), combination products and CFR 820
influencing industry’s mindset
influencing industry’s mindset
17
Global Pharmaceutical Market Trends

• Paradigm shift from batch production to small scale
manufacturing driven by diversity and clinical trial needs
manufacturing driven by diversity and clinical trial needs
• Price cuts and reimbursement restrictions in developed
markets
markets
• Patent cliff and lack of “blockbuster” drug innovations
• M&A shaping leading pharma companies and continuing
as the new R&D
as the new R&D
• Focus on “total cost of ownership”
18
Global Pharmaceutical Market Trends

• But growth opportunities remain, such as
• Pharmerging markets
• Generics
• BioTech, speciality drugs and biosimilars products
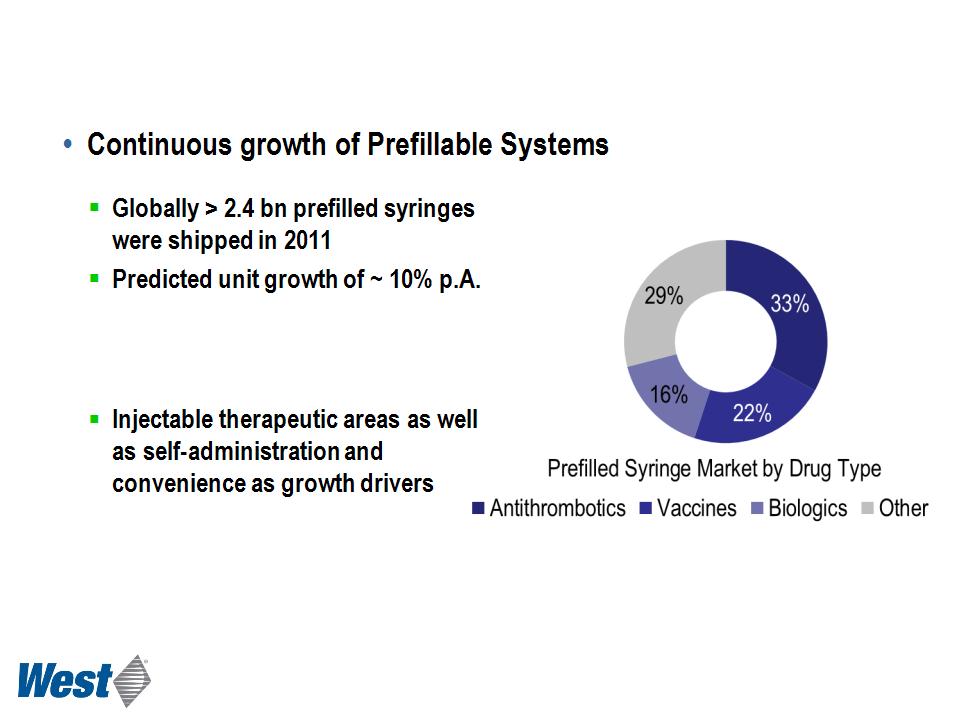
• Continuously expanding prefillable systems market
• Trend towards injection devices
§ Enabling new treatment and application options
§ Allowing home administration
§ Powerful lifecycle management tools
19
Global Pharmaceutical Market Trends

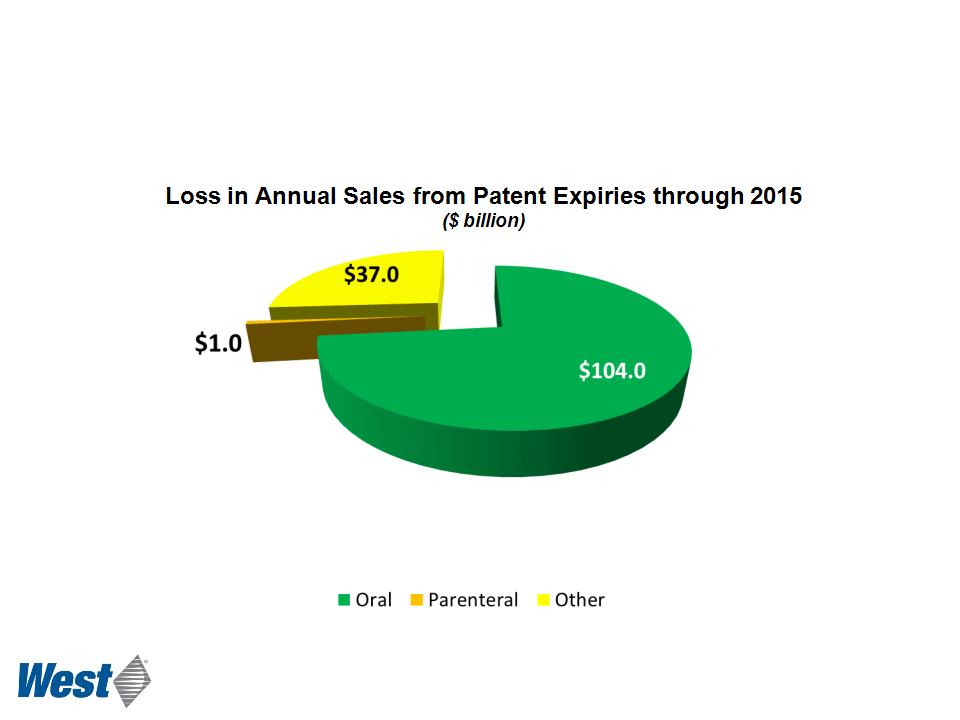
• Generics
• $142 billion in global branded drug products losing patent protection
in the near future
in the near future
• Significant policy changes encourage use of generics
§ Affordable Care Act in US
§ Drug price cuts in i.e. China, Japan, Spain, Italy
§ Cost benefit evaluations of new medicines
• Generics will exceed 20% of drug spending in most developed markets
IMS, The Global Use of Medicines, May 2011, IMS Health Report 2011
20
Global Pharmaceutical Market Trends

• Sales from commercialized biotech drugs are on the rise
• Revenue CAGR of 6% - 9% over the next several years
§ Strong pipelines for biologic products
§ Increase in long-acting or depot injections
• Technical constraints of new biologics drive need for innovative
injectable packaging and delivery solutions
injectable packaging and delivery solutions
21
Global Pharmaceutical Market Trends

• Biosimilar regulations and affordability
• More and more patents of biologic drugs expire
§ Major target for cost savings in health care
• Leading pharma companies such as Merck, Teva, Novartis
established biosimilar divisions
established biosimilar divisions
• Mature European markets for biosimilars
§ Clear approval path but low adoption rates
• Strong biosimilar business in emerging markets
§ Less stringent regulations
• Awaiting US legislation on biosimilars and new EU mAb legislation
• Delivery devices are key differentiator for biosimilars
22
Global Pharmaceutical Market Trends

• Parenterals continue to be important for administering
biopharmaceuticals
biopharmaceuticals
• Oral delivery
§ Poor bioavailability due to challenges posed by the
gastrointestinal tract
gastrointestinal tract
• Nasal delivery
§ Potential safety issues for large molecules due to need for
permeation enhancers to deliver sufficient dose
permeation enhancers to deliver sufficient dose
• Pulmonary delivery
§ Potential safety issues with delivering through lung
§ Low bioavailability
• Transdermal delivery
§ Limitations in delivering the therapeutic dose through skin
23
Global Pharmaceutical Market Trends
• Extra Protection for Parenterals against Generic Threat
Scrip 100, 2011 Special Report
24
Global Pharmaceutical Market Trends

• Therapeutic areas Oncology, Diabetes, Autoimmune ( RA, MS,
etc.) and Vaccines driving parenteral growth
etc.) and Vaccines driving parenteral growth
• High unmet medical need
• High cost burden of diseases
• New drugs enabled through biotechnology
• Innovative container and delivery systems allowing new
treatment options
treatment options
• Patient access expanded
• Funding redirected from other areas where low-cost generics
will be available
will be available
25
Global Pharmaceutical Market Trends
|
Category
|
Key Customers
|
Projected
Growth |
|
Diabetes
|
|
4 - 7 %
|
|
Oncology
|
|
5 - 8 %
|
|
Vaccines
|
|
> 10 %
|
|
Autoimmune
|
|
6 - 9 %
|
• Therapeutic Category Growth Drivers
IMS, The Global Use of Medicines, May 2011, market & research.com
26
Global Pharmaceutical Market Trends

Requirements
West Solutions
• Therapeutic Targets and West Solution Portfolio - A Perfect Match
Therapeutic Targets
• Stability of demanding pharmaceuticals/
biopharmaceuticals
biopharmaceuticals
• Manage silicone sensitivity of proteins
• Solutions to avoid glass delamination
and breakage
and breakage
• Need for lifecycle management, product
and brand differentiation
and brand differentiation
• Health care worker/ patient safety
• Human factors
• Trend towards self-administration
• Efficient and cost effective therapies
• High value pharma packaging
• In-depth understanding of container
closure and device interaction
closure and device interaction
• Proprietary, innovative delivery
systems
systems
• Concept to commercialization solutions
• Risk assessment and risk mitigation
strategies
strategies
27
Greystone 2012 PFS Report; Market Intelligence
§ Cartridge based devices gain
importance for biologic drug
delivery
importance for biologic drug
delivery
28
Global Pharmaceutical Market Trends
Providing Solutions to a Changing Market
29

• Significant growth potential for generics and biosimilars
in developed countries and emerging markets
in developed countries and emerging markets
• Proactive support of lifecycle management activities at
pharma/ biotech
pharma/ biotech
§ Product and brand differentiation through West solutions
• Support generic and biosimilars customers globally with
differentiated product and solution offering
differentiated product and solution offering
§ Enable “Speed to Market” and compliance to stringent regulatory
requirements for developed markets
requirements for developed markets
§ Dedicated offerings for mid-tier and domestic emerging markets
§ Biosimilars retain originator packaging
§ Delivery devices are key differentiator for biosimilars
The Potential of Generics and Biosimilars
30

• West is well positioned for future growth
• Focus on strongly growing therapeutic categories diabetes/insulin,
vaccines, oncology and AIID
vaccines, oncology and AIID
• Importance of parenterals and biological drugs in these categories
• Growing need for high value pharma and world class packaging
• Growth opportunities through proprietary delivery devices
• Perfect match between requirements of targeted therapeutic categories
and West´s solution portfolio
and West´s solution portfolio
• Leveraging the potential of generic and biosimilars market
Summary
31

Pharmaceutical Packaging Systems Overview
Jeff Hunt
President
Pharmaceutical Packaging Systems
32
|
Pharmaceutical Packaging Systems
|
|
|
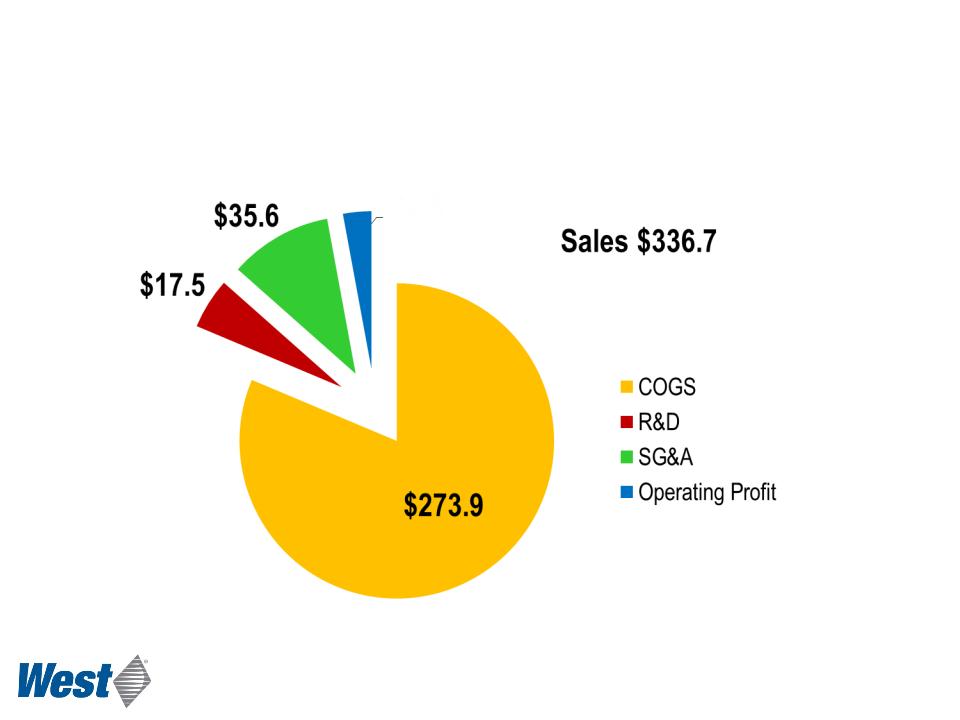
2011
Revenues
Revenues
$857 million
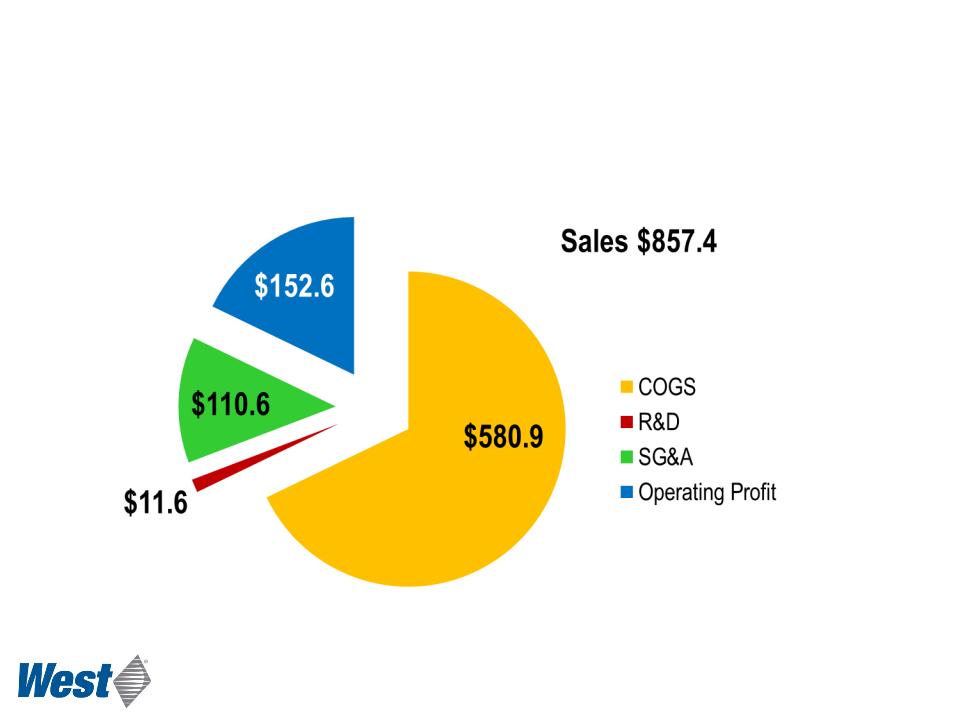
Pharmaceutical Packaging Systems
2011 Operating Results
2011 Operating Results
34

• Create profitable and sustainable growth platforms
• Strengthen market leadership position via innovation
• Accelerate growth through:
• Value-added products
• Geographic expansion
• Optimize global profitability
Strategic Objectives
35

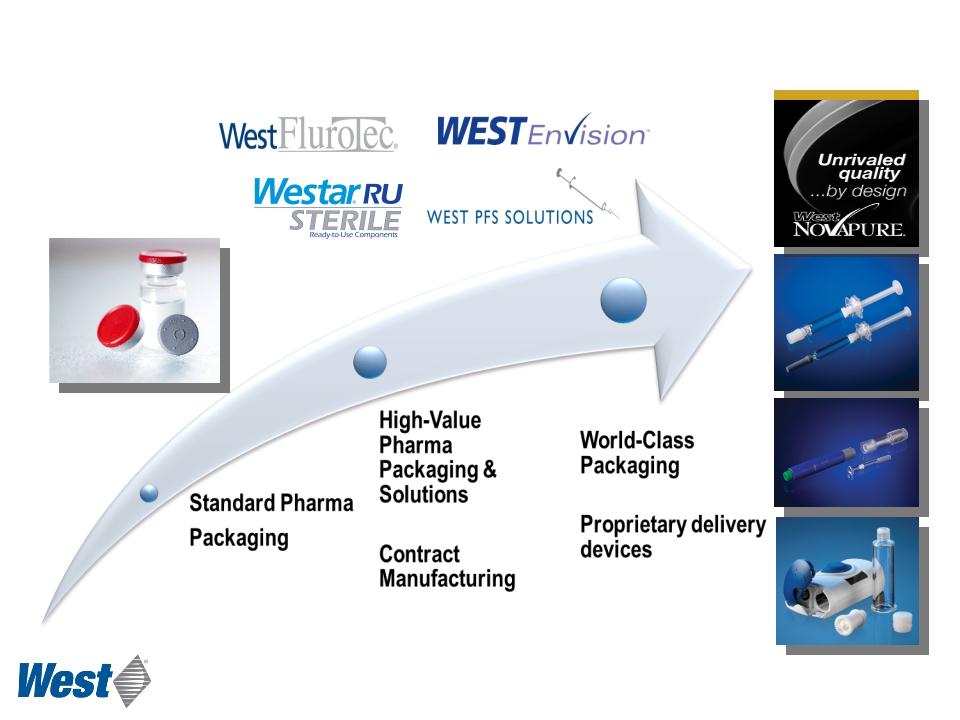
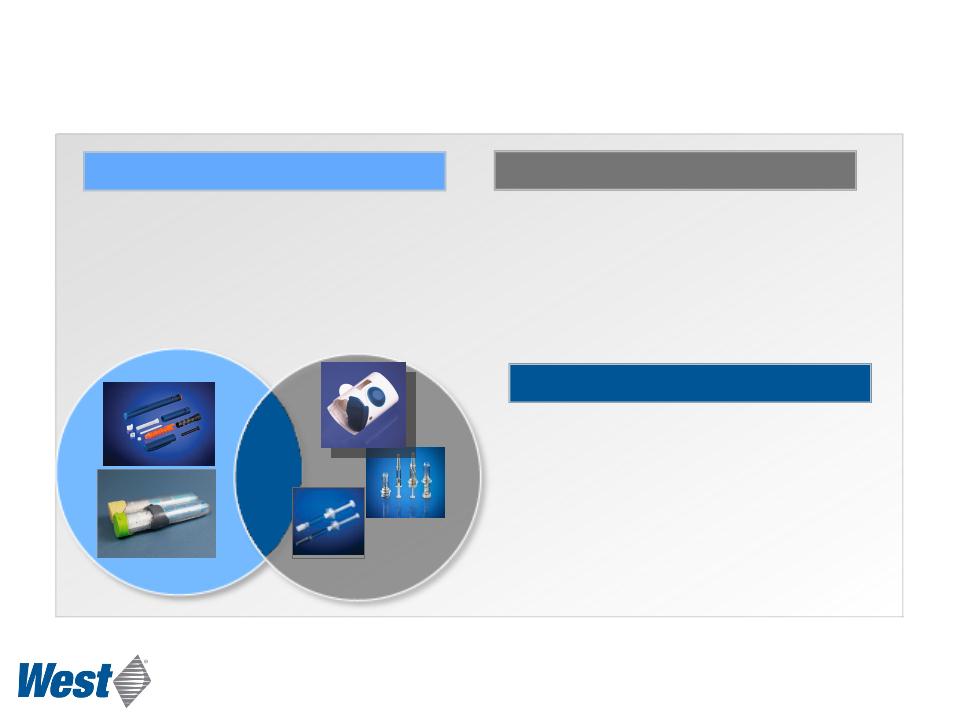
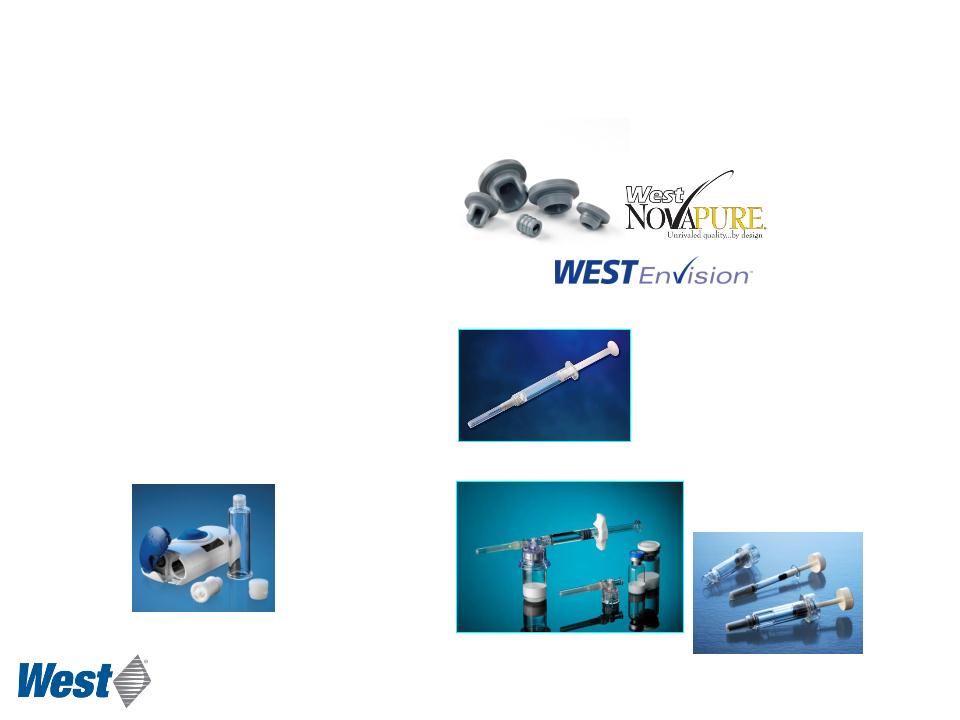
Market & Growth Drivers
Pharmaceutical Systems Products
Pharmaceutical Systems Products
Safety
NovaGuard™
Medimop
Market Needs
Silicone-free
Daikyo CZ
PFS
Systems Solution
NovaPure®
Westar® RU
Lined seals
Ready Pack™
Regulatory
VeriSure™
CCS™
TrimTec®
Material Science
Quality
Vision inspection
cGMP
Demographics/Convenience
Auto-injectors
Electronic Patch Pump
Reconstitution
Growth Platforms
Safety & Admin Systems
Prefillable Syringe Systems
Advanced Injection Systems
Injectable Container Solutions
36

Long-Term Outlook
• Long-range plan delivers $300 million of incremental sales
and $100 million operating profit
and $100 million operating profit
• High-value products and prefilled syringe components
• Optimize supply chain and manufacturing operations
• Global expansion in China and India
37

Asia Pacific Region
Warwick Bedwell
President, Asia Pacific
38

Markets in Asia Pacific
• 50+% of the World’s population
• Fastest growing in the World, GDP 6.7% growth in 20111
• Rising healthcare spend and urbanization
• Focus of global healthcare/pharmaceutical industry
§ Large & growing population with increasing level of disposable income
§ Improving access to medicines
§ Aging populations e.g. China driving demand for greater healthcare investment
§ Increased prevalence of chronic lifestyle diseases
§ Lower cost region for manufacturing and outsourcing2,3
1 EIU Dec 2010 2 PWC 2010 3EIU Aug 2011
39

AP Pharma Markets by 2015
• Region (incl. Japan) will represent close to 1/3 global sales1
• China alone expected to bring over 1/4 global growth1
• Within APAC China, India, Indonesia and Vietnam will outpace all other
countries in growth1
countries in growth1
• Markets look attractive for biosimilar penetration2
§ Strong local industry and relatively lax regulatory systems
• Local players are strong within self pay markets while MNCs are strong
in reimbursed markets2
in reimbursed markets2
• Original/Branded generic products continue to comprise the majority
within most APJ markets2
within most APJ markets2
1 IMS Health Market Prognosis Oct 2011 2 IMS Health, MIDAS MAT June 2011
40

• Annual consumption growing >15%
with India and China as market drivers
with India and China as market drivers
• 6.5 billion IV infusions p.a.
• Emerging PFS and cartridge markets
• Est. in 2010 that globally 285 million diabetics,
over 50% in AP
over 50% in AP
§ 92 million in China
§ 51 million in India
• Highly fragmented
§ 60+ competing manufacturers
of stoppers
of stoppers
§ 100+ competing manufacturers
of seals
of seals
• Quality and technology improving
§ Increasing regulatory requirements
§ Quality segment to grow faster
Ref: IMS Report 2011, Frost & Sullivan Report 2010,
LEK 2009, Local intelligence
LEK 2009, Local intelligence
41
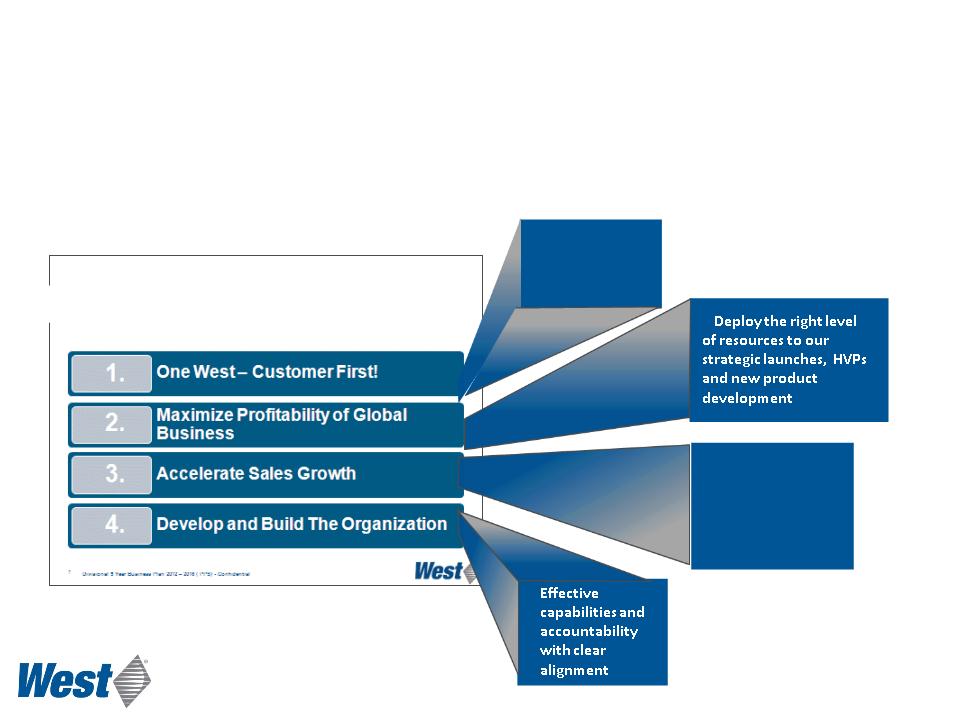
West in Asia Pacific
• Region Business Objectives - “Double+ in 5”
• Region Operations Objectives - Selectively invest for growth
Do best what
matters most
to customers
matters most
to customers
Market assessment
and prioritization,
WCSO/SFE and
GKAM
and prioritization,
WCSO/SFE and
GKAM
Core Business Strategies
42

China Strategic Rationale
• Largest global pharma market in volume and 3rd in value
§ 60% of total APAC injectables
§ More Drugs to be reimbursed
§ Foreign players are challenging domestic stronghold in generics
§ Increase in alliances of domestic companies with MNCs
• Business strategy
§ Defend and build share of MNCs/branded generics
§ Capture market share from local players
§ Best performance to price ratio
§ Reduce COGs and introduce “total cost of ownership” concept
§ Provide “best-in-class” service and quality
43

India Strategic Rationale
• Key location to drive growth
§ Large market at USD 25b (>50% export) and 15.7% CAGR to 2015
§ Generic production - Western markets
§ Asia Pacific and MENA markets
• Business strategy
§ Defend and build share of MNCs/branded generics
§ Support generic producers with short lead times/flexible
trading terms
trading terms
§ Build regional capacity and enable growth in Singapore for HVPs
§ Augment Singapore capacity
44
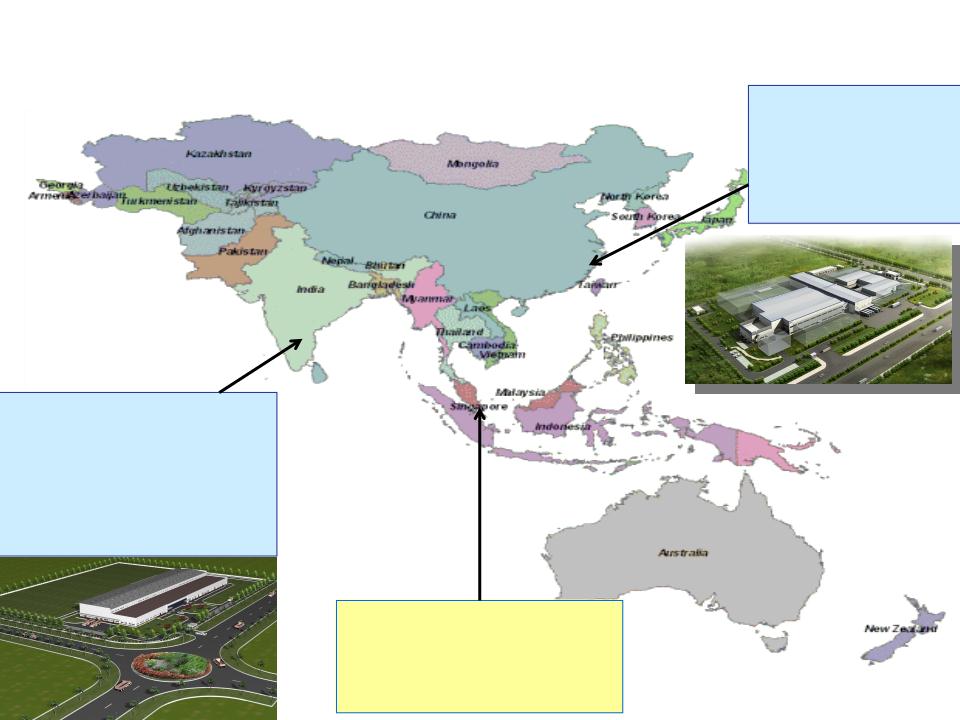
Region Operations Strategy
Singapore
1.HVP Focus
2.AP market & special items
3.R&D hub & technical center
China IV Plastic
1.Global supply
China Elastomer
2.China Market,
Efficiency focus
Efficiency focus
India Elastomer
1.Domestic standard
products & MNC support
2.ROW standard product
India Metal
1.AP market support
•
45

Summary
West in Asia Pacific
West in Asia Pacific
• Forecast mid-term market outperformance in sales and solid
operating profit
operating profit
• Making the strategic investments to meet regional growth
and competition
and competition
• China and India are key to future regional and global growth
46

NovaPure® Components
Fran DeGrazio
Vice President, Marketing &
Strategic Business Development
47

Industry Challenges in Respect
to Packaging Component Issues
to Packaging Component Issues
• Total cost of ownership is too high
• Packaging component quality is too variable
• Pharma industry understanding and perspective is needed
• Transparency of information should be improved
• Requirements by regulatory agencies are more stringent
• Biotech products have increased environmental sensitivity
• Risk must be minimized across the board
48

Revenue Opportunity ($ per unit)
Plungers and
Sleeve Stoppers
Sleeve Stoppers
Stoppers
Seals
RU Seals
Westar® RU
Standard Products
High-Value Products
49

Industry Desires These Features
|
|
|
Competitive
Offerings |
|
Process designed using QbD principles
|
þ
|
ý
|
|
Knowledge management
|
þ
|
ý
|
|
Shortened lead times
|
þ
|
ý
|
|
Global sourcing
|
þ
|
ý
|
|
Paradigm shift in quality specification
|
þ
|
ý
|
|
24/7 access to technical information
|
þ
|
ý
|
|
Minimized drug compatibility issues
|
þ
|
ý
|
50
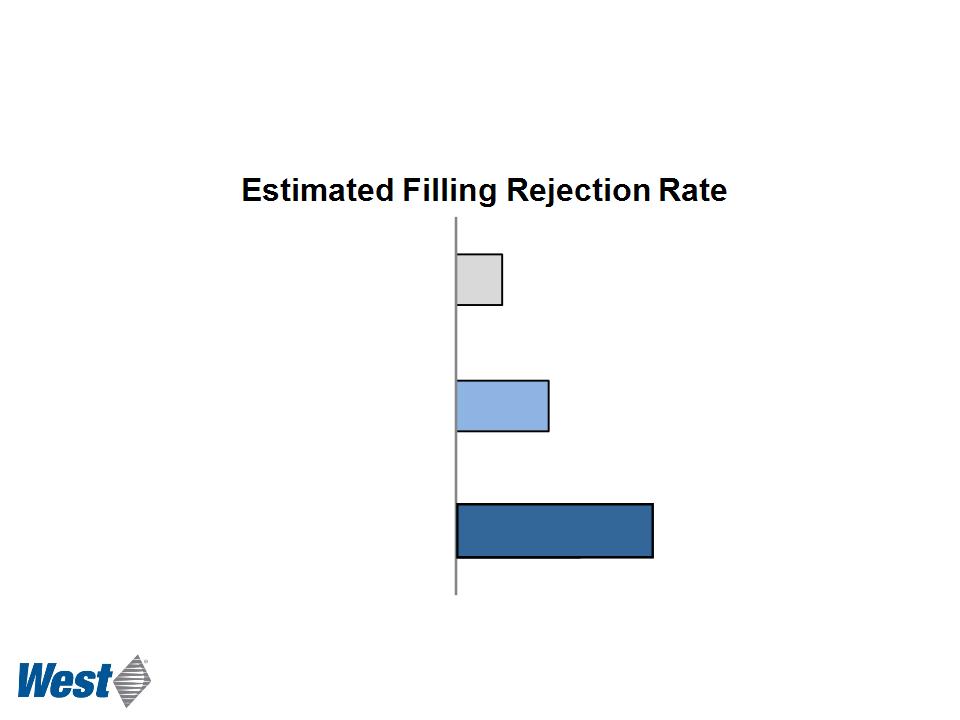
Lower Filling Line Rejection Rate for
NovaPure Components
NovaPure Components
51
3.0%
0.5% - 1.0%
Typical rejection rate
at pharma company
at pharma company
1.5%
Westar RS +
Envision
Envision
NovaPure
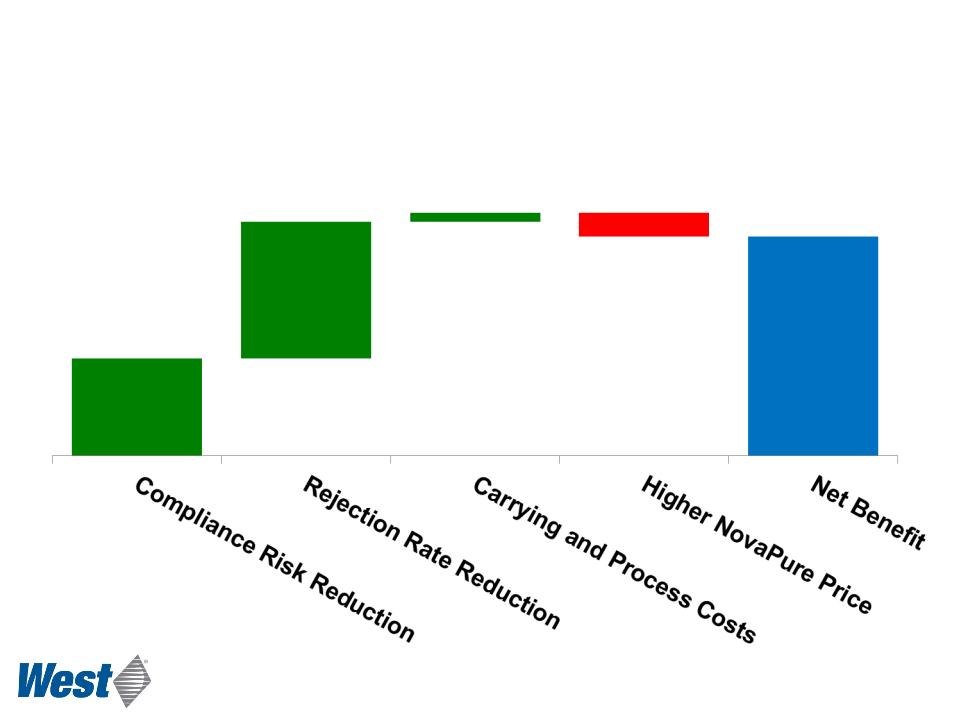
Cost of Ownership Case Study
Benefit /Cost Relationship
Benefit /Cost Relationship
52
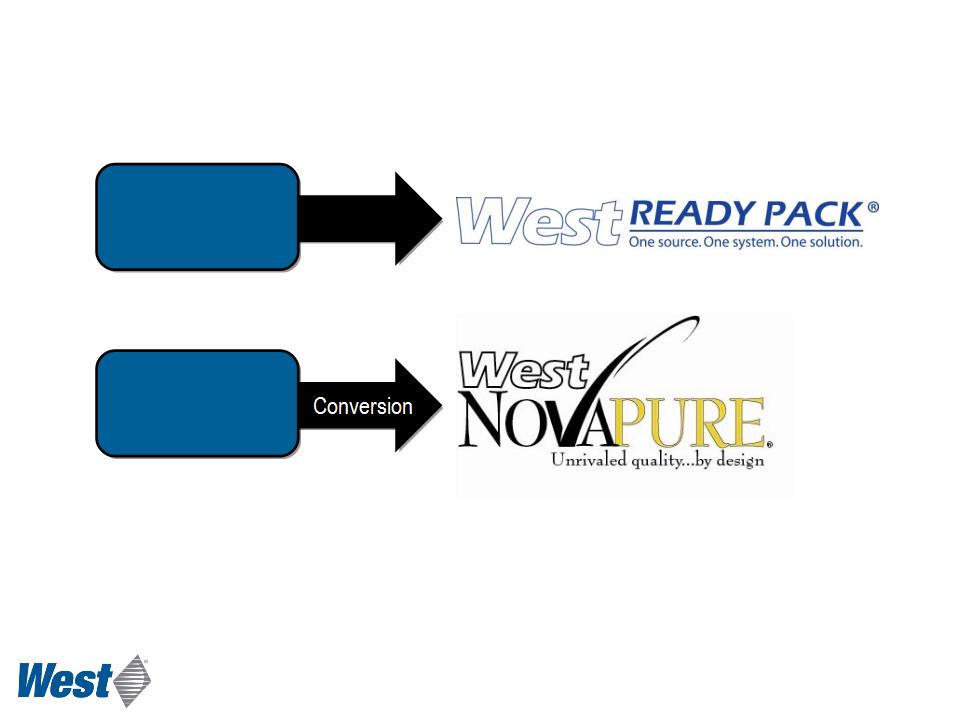
Accelerating Adoption of West NovaPure Components
Drugs already on
the market
the market
Seeding for drugs
in development
in development
53
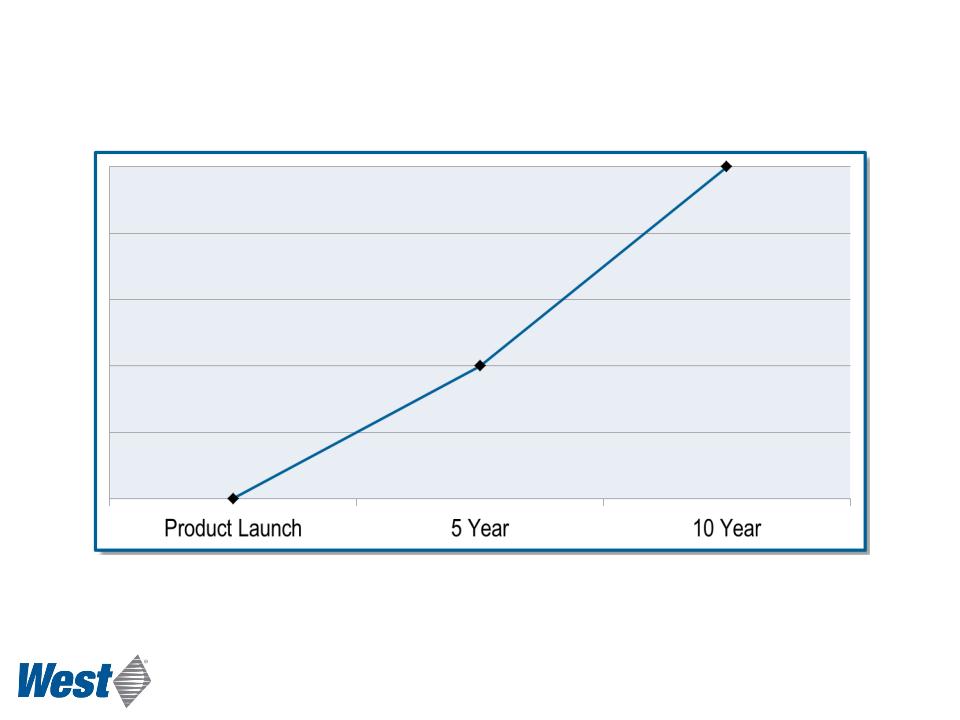
Expected NovaPure Growth
54
Like FluroTec, Westar and other fundamental improvements in
pharma packaging, NovaPure growth is expected to be long-
lasting and persistent
pharma packaging, NovaPure growth is expected to be long-
lasting and persistent
Why NovaPure Components?
Lower Total
Cost of
Ownership
Cost of
Ownership
Improved
Transparency
Transparency
Hidden Costs
55

Pharmaceutical Delivery Systems
John Paproski
President
Pharmaceutical Delivery systems
56
|
Pharmaceutical Delivery Systems
|
|
|
2011
Revenues:
$337 million
57
Pharmaceutical Delivery Systems
2011 Operating Results
2011 Operating Results
58
Contract Manufacturing
• 2011 sales: $264 million
• 20 million injection devices pa
• >1.3 billion plastic components for
Insulin Pens
Insulin Pens
Proprietary Products
• 2011 sales: $73 million
• Reconstitution, CZ systems,
syringe safety, self-injection
syringe safety, self-injection
• >50 million reconstitution systems
• >100 million needle safety systems
Synergies
• Marketing
• Engineering
• Project management
• Manufacturing
• Capacity
A Proven Track Record for Device Manufacture
59
Acquisition of
Medimop:
Administration
Systems
Medimop:
Administration
Systems
2005
Licensing of
NovaGuard™:
Safety
System
NovaGuard™:
Safety
System
2006
Acquisition of
PharmaPen:
Auto-injector
PharmaPen:
Auto-injector
2007
Daikyo CZ
Insert
Needle
License:
Prefillable
Syringe
Systems
Insert
Needle
License:
Prefillable
Syringe
Systems
2008
Acquisition
of Plastef:
Prefillable
Syringe
Safety
of Plastef:
Prefillable
Syringe
Safety
2009
Acquisition
of LaModel:
Electronic
Patch
Injector
of LaModel:
Electronic
Patch
Injector
2010
Marketing
agreement
agreement
Product
Development
Development
Formation of
PDS division
PDS division
Portfolio Expansion to Meet Market Needs
Acquisition
of B.safe:
Prefilled
syringe
safety
of B.safe:
Prefilled
syringe
safety
2011
60

Positioned to Respond to Market Trends
• Continuing growth in Injectable therapies
§ Remains preferred route for biologics
§ Prefilled systems (2.4 billion in 2011 growth of 10% p.a.)
• Growth of combination products
§ Drugs with Injection device quadrupled in last decade (from 15 to 60 )
§ Driven by self injection, lifecycle management, competition
• Growth in biosimilars
§ Innovators: differentiation and lifecycle extension through devices
§ Generic companies need a functional copy with minimal investment
*Ref: Greystone report, April 2012: Prefilled syringes to 2016
61
Biotherapeutic Drug Delivery Remains our Focus
• Proteins
• High concentrations
• Large molecules are more sensitive
• Stability tested on drug and device
• Cold chain to maintain potency
• Combination Products
• In 2010, 33% of pharmaceutical
development pipeline were biologics
development pipeline were biologics
• Portion of top 100 products**:
|
2000
|
2008
|
2012
|
|
11%
|
28%
|
50%
|
* Tufts study, 2010
** Evaluate Pharma, April 2010
62
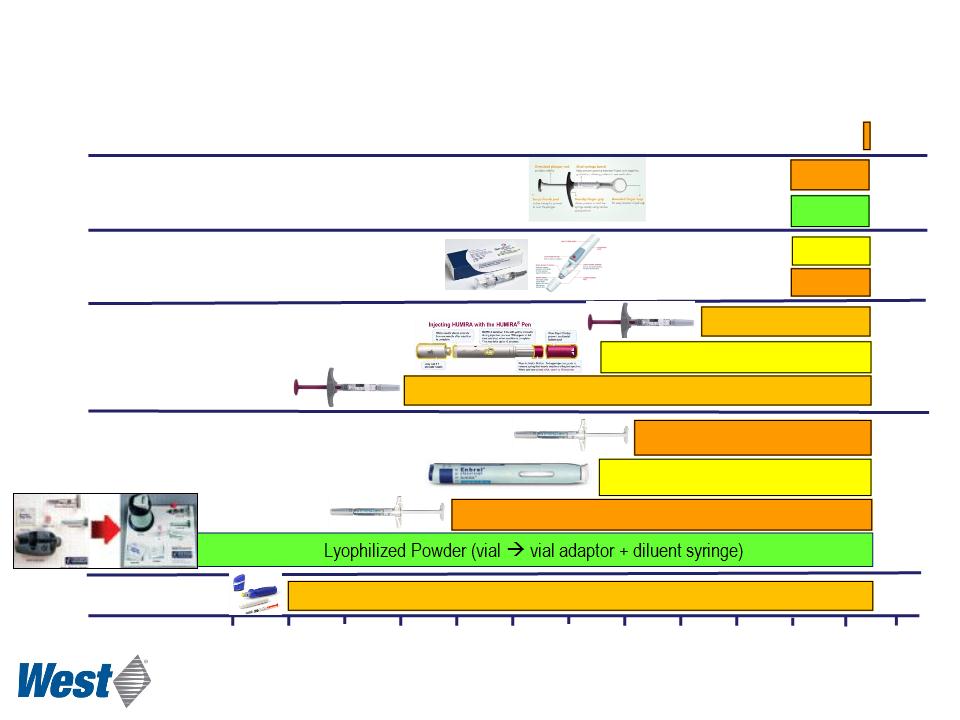
Subcutaneous RA drugs: A Competitive Market
2000
2008
2002
2004
2006
2010
Enbrel®
Humira®
Simponi®
Cimzia®
Smartject®
Vial “pack”
Kineret®
PFS (extended flange) (40mg/0.8ml)
Humira® Pen
PFS 50mg (extended flange)
PFS 25 mg
SureClick™
PFS ( with optional Simpleject reusable auto-injector)
PFS (20mg/0.4ml)
Orencia®
2012
PFS - Subcutaneous
PFS / Needle Safety
Ergonomic PFS
Source: Donna French, PhD, Genentech
63

Challenges Faced by Biotech Companies
• Glass issues
§ Functional, quality, breakage
§ Trend towards plastics
• Increased sensitivity to various materials
§ Silicone oil, tungsten, extractables
• Increased demand for high-dose biologics
§ Driving drug product viscosities and dose volumes higher
§ Competition within therapeutic classes making IV delivery unattractive
• Increased FDA scrutiny on combination products
§ Devices considered earlier in process
**Ref: HRA survey for West at PDA, April 2012
64
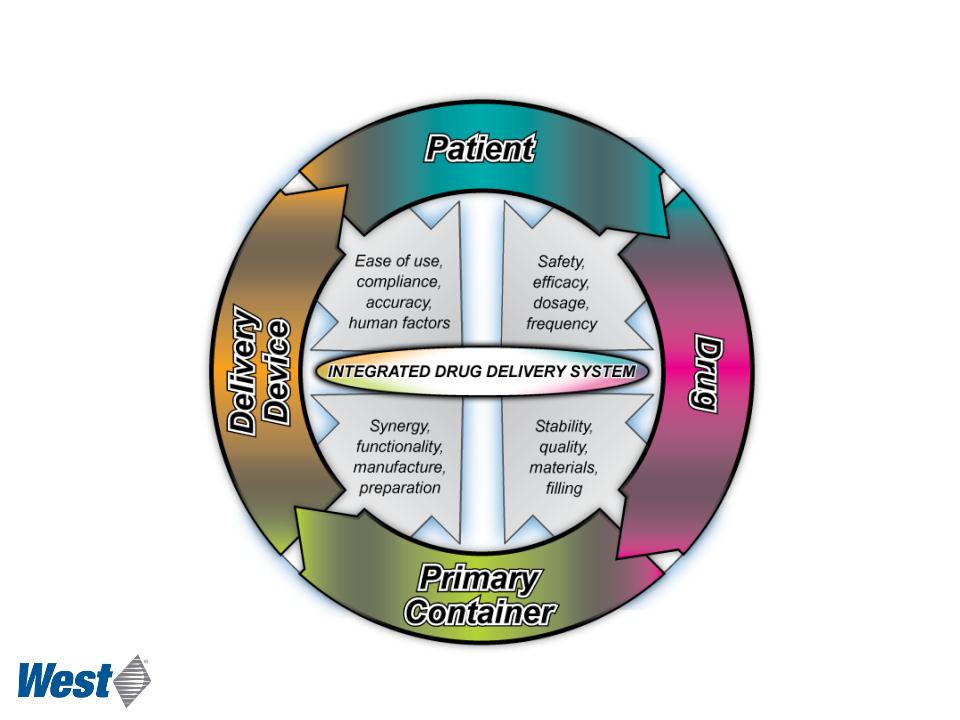
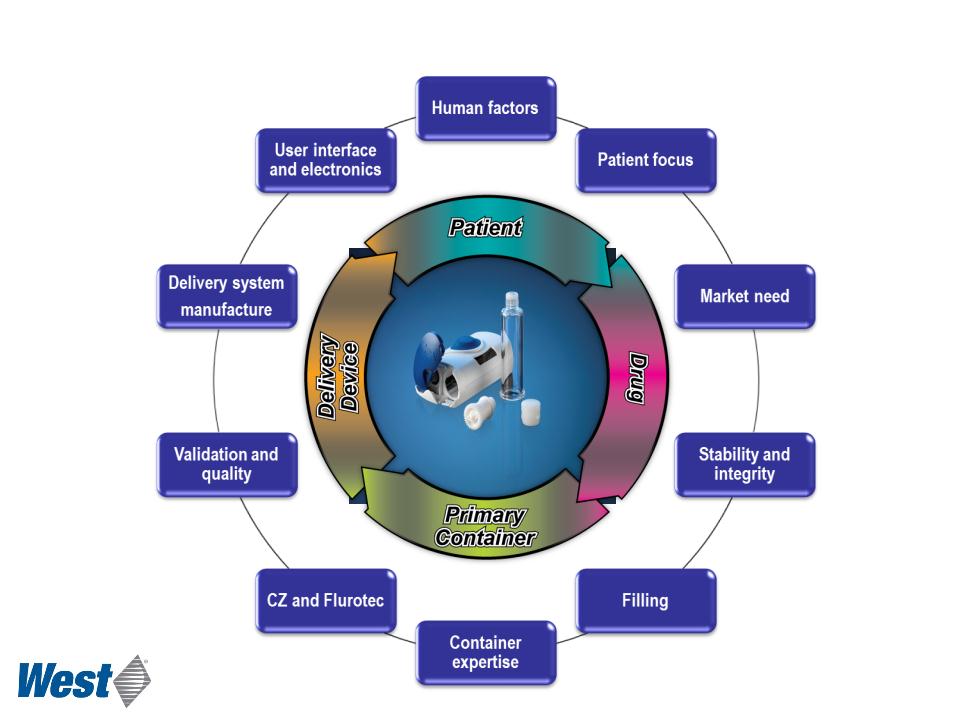
Need for an Integrated Drug Delivery System
65
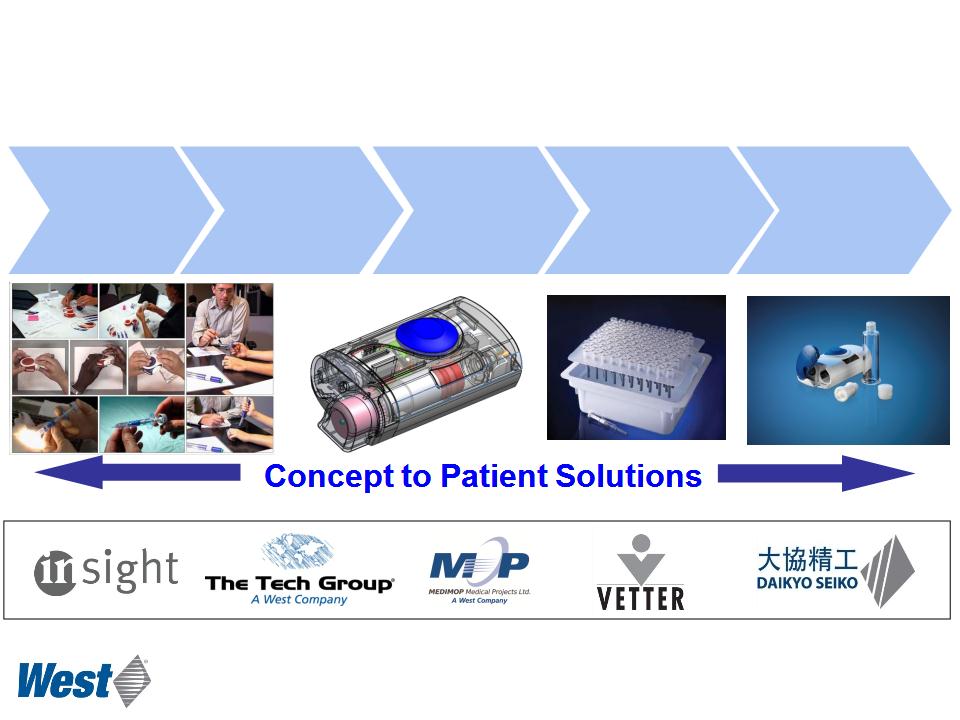
West Provides Integrated Solutions from Concept to Patient
Discovery
(ideation)
Concept
Development
Product &
Process
Development
Process
Development
Industrialization
Life cycle
management
management
66

Well Positioned to Partner with our Customers
• Extensive product portfolio
• Internal capabilities combined with Industry collaboration
• Building on established market position and experience
• Focus on the patient and the needs for an integrated system
approach
approach
• Proactive support for customers’ need for combination products
CZ and SmartDose are examples to showcase these capabilities….
67

Self-Injection Systems
Bart Burgess
Principle, Business Development
68
A Platform Partner for Self-Injection Systems
• West ConfiDose®
§ Auto-injector platform for delivery from 1mL long glass or CZ PFS
§ Expanding system offerings to meet new identified market needs
• West SmartDose®
§ Electronic patch injector system incorporating a proprietary CZ container
§ Addressing the needs of high-dose biologics and high-value products
• Dose Family
§ Combining device innovations and primary container expertise
§ Expanding range of systems through acquisition and innovation
SmartDose® is a registered trademark of Medimop Medical Projects Ltd.
69
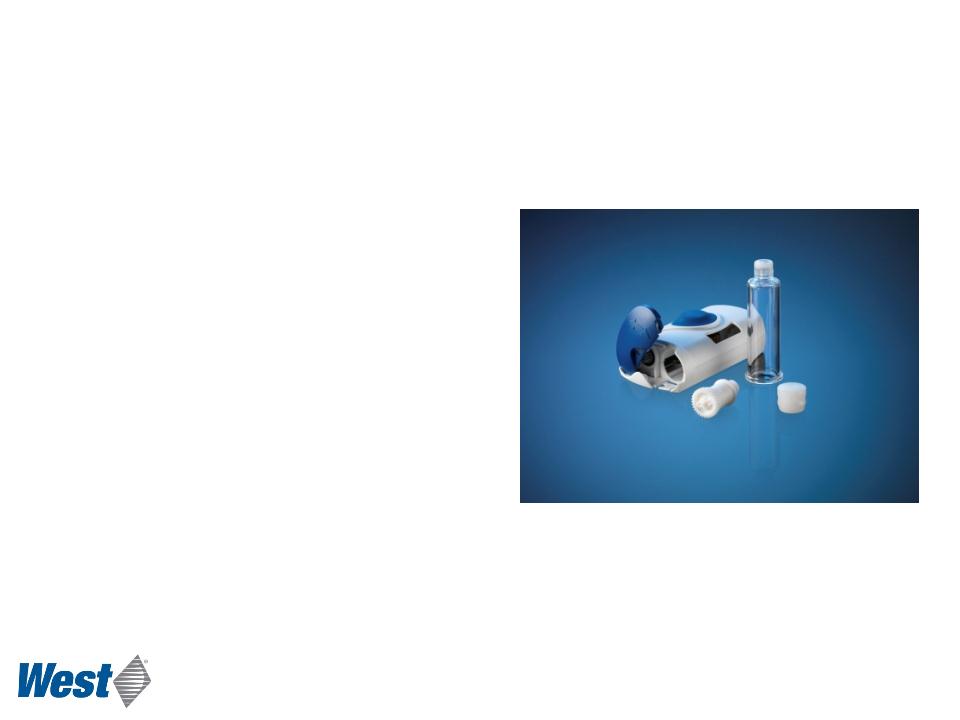
SmartDose® Electronic Patch Injector
Platform Technology*
Platform Technology*
§ Designed for subcutaneous delivery - 2.5 mL and 3.5 mL versions in development
§ Uses Daikyo CZ prefilled cartridge
§ Focuses on the user experience
§ Integrated needle safety
§ Simple push-button operation
§ Electronically controlled delivery profile
§ Freedom-to-operate clearance
§ Capitalizes on several emerging needs:
§ Higher doses may be needed for efficacy
§ New entrants to competitive therapeutic areas need self-injection convenience
*For investigational use only by our pharmaceutical and biotechnology development partners.
West markets SmartDose technology as an integrated system with drug filling and final
assembly performed by the pharmaceutical customer.
West markets SmartDose technology as an integrated system with drug filling and final
assembly performed by the pharmaceutical customer.
70
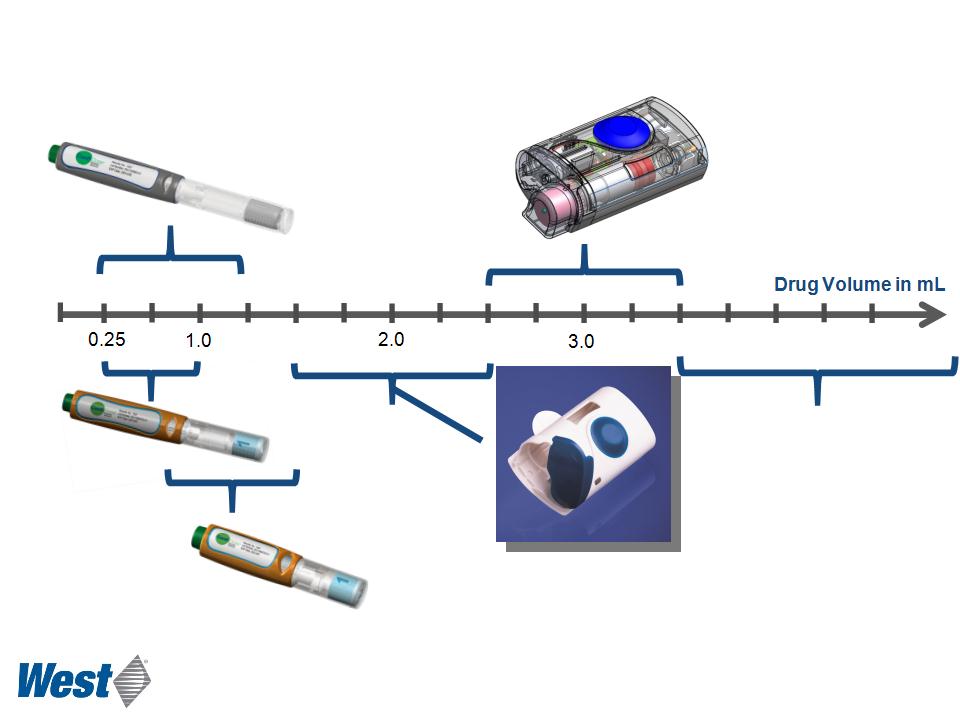
Self Injection Systems Portfolio
4.0
Future SmartDose
Iterations
Iterations
SmartDose 3.5
SmartDose 2.5
ConfiDose 1.2mL
ConfiDose 1mL
ConfiDose 1.5mL
Additional Platform
Expansions Coming Soon…
Expansions Coming Soon…
71
An Example of a Fully Integrated System
72

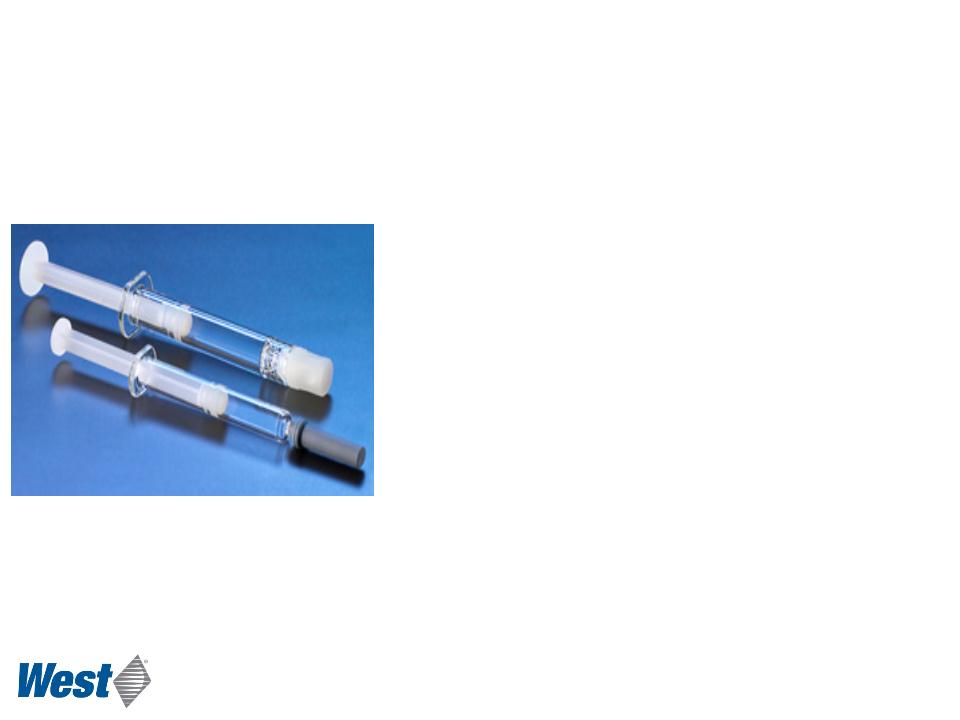
Daikyo Crystal Zenith®
Scott Young, Ph.D.
Director, Crystal Zenith Products
73
Daikyo Crystal Zenith® is a registered trademark of Daikyo Seiko, Ltd.
Daikyo Crystal Zenith technology is licensed from Daikyo Seiko, Ltd.
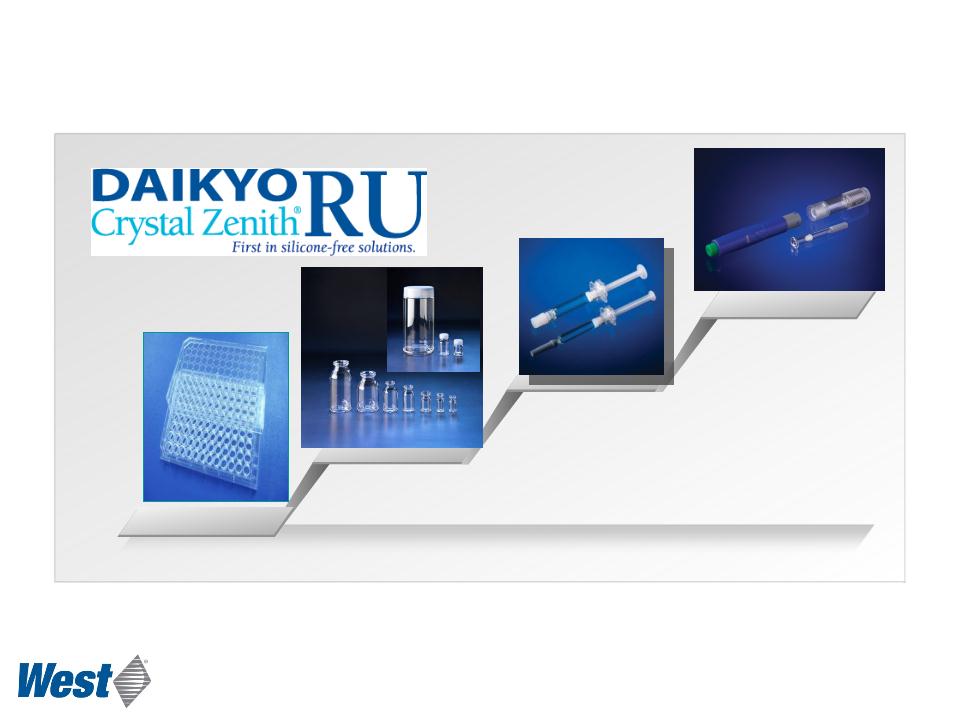
Vials and
bulk containers
Prefillable Syringe
From drug discovery to self-injection system
Self-injection System*
Discovery
CZ Solutions Across the Product Lifecycle
*For investigational use only by our pharmaceutical or biotechnology
development partners.
development partners.
74
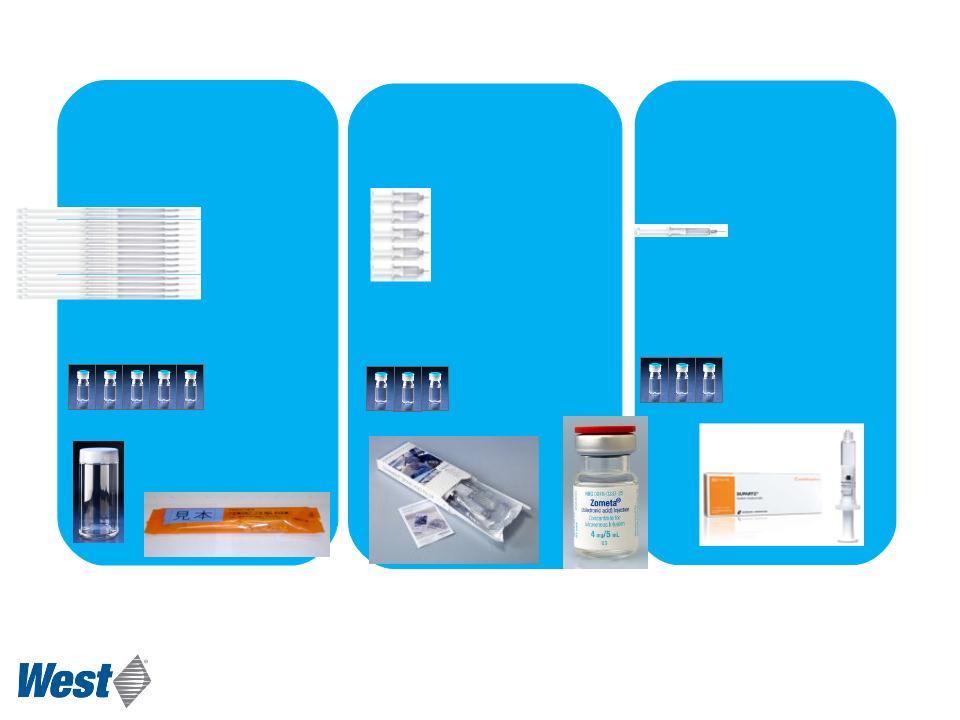
Daikyo Crystal Zenith Product Approvals
hyaluronic acid
MRI contrast
media
media
bone cement
6 Contrast Media
5 MRI
2 Hyaluronic Acid
1 Calcitonin
1 Proton Pump
Inhibitor
Inhibitor
fluconazole
oncology
anticoagulant
2 oncology
1 acyclovir
hyaluronic acid
3 oncology
API Container
Japan
MHLW
Europe
EMEA
US
FDA
Calcitonin
Bone
cement
Zometa
Hyaluronic
acid
75
• Highly break resistant
• Superior quality
§ Reduced Particles vs glass
§ Reduced cosmetic defects
§ 100% vision inspection, including needle
• No Silicone oil for system lubricity
• Tungsten and glue free
• Compatible with filling lines
• Consistent functionality
• Tight dimensional tolerances
• Maintains integrity with fill volumes >1mL
• Recent completion of extra capacity in Scottsdale AZ
76
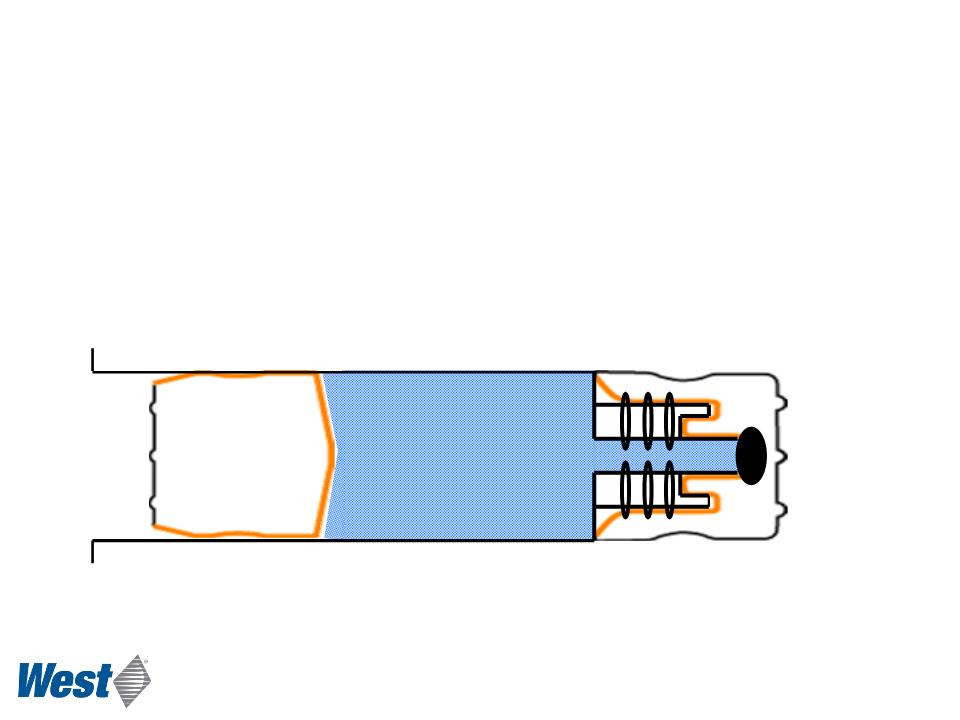
Orange color indicates Flurotec® film coverage
Complete coverage with
inert film on drug
contact surfaces
inert film on drug
contact surfaces
Flurotec Film
• Patent Protection from Daikyo Seiko
• Trade Secret Molding / Processing
• Silicone-Free System
Daikyo Crystal Zenith Syringe Barrel
• Custom Formulated Resin exclusive to
Daikyo Seiko
Daikyo Seiko
• IP Filed on CZ 1ml-IN Process
• Other IP on packaging / designs
Daikyo Crystal Zenith Competitive Advantage
Fully laminated
piston
piston
Inside-laminated
tip cap
tip cap

Tungsten residue
Breakage
Silicone oil
variability
variability
Auto-injector
failure
failure
Cosmetic defects
Particles
Potential Glass Syringe Risk Areas
78

Pharmaceutical Market View of Risk Mitigation
• FDA cautionary statement; potential results of glass particles*:
§ Vascular events
§ Foreign body granuloma
§ Local injection site reactions
§ Increased immunogenicity
• Multiple companies evaluating CZ at various phases
§ In 2011 Rx360 surveyed companies and found
§ 28% had recalls
§ They estimated industry cost of recalls at $100MM
§ In a recent study, 48% of survey respondents indicated that their
company was evaluating plastic options
company was evaluating plastic options
Source: D. Jaworski, CDER, Presentation from PDA Glass Conference, May 2011
79

|
Action Associated with
Breakage Issue |
Associated Costs
|
Total Cost
|
|
Investigation and inspection
of issues, complaints and syringe products |
· Field complaints inquiry
· Investigation and resources
· Inspection
|
> $50 Million
|
|
Loss of market share
|
Loss of sales until re-launch, and loss of 5%
of share at market price post re-launch for year 1 |
> $50 Million
|
|
Replacement of drug
product, components and delivery system after re-launch |
2 million units at $100 each
|
> $200 Million
|
|
Pipeline Assessment: Drugs
in Phase II/III clinical trials |
200,000 units x approx. $100 each cost
(assuming 1/10 total production)
|
>$20 Million
|
|
Significant impacts on product supply, market confidence, brand value
|
Not estimable
|
|
Illustrative Estimates of Costs Associated with Drug Recalls
80
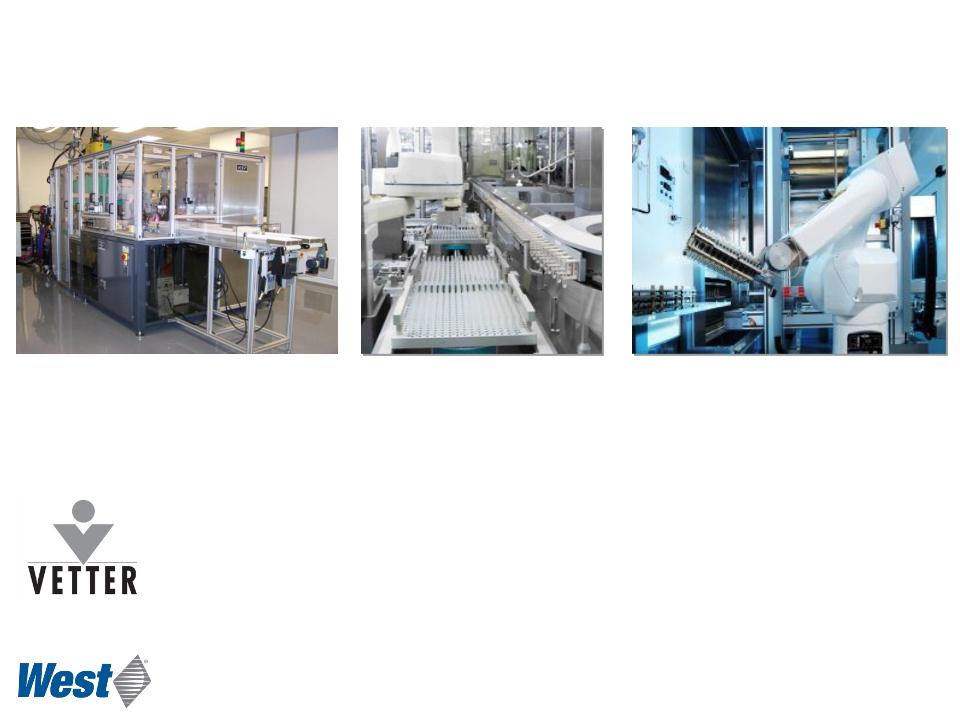
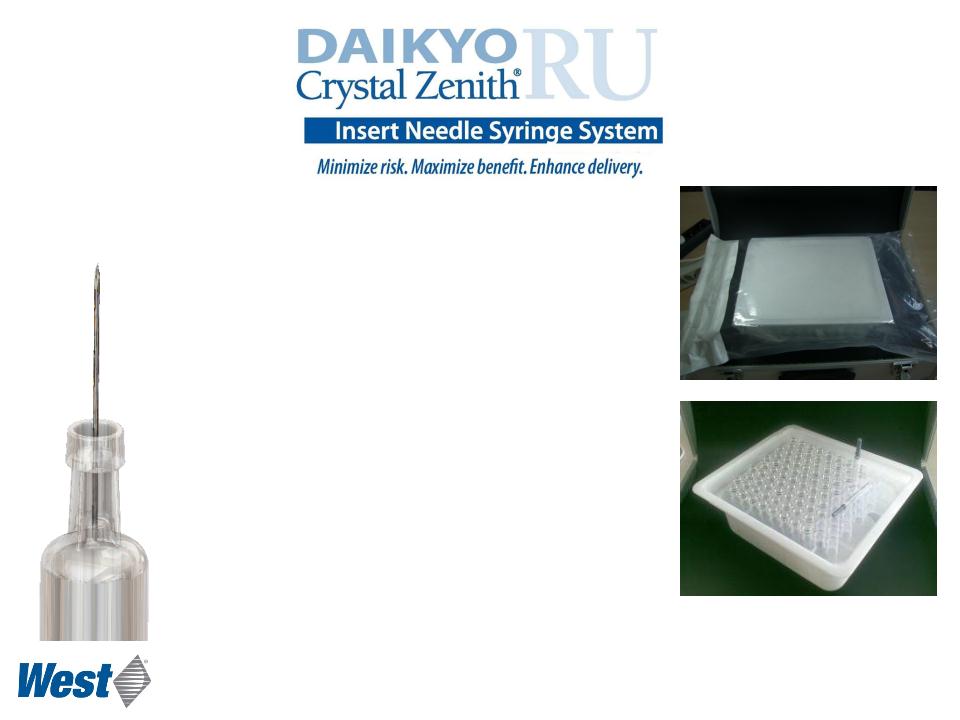
1mL Long Insert Needle Syringe
Ready for Commercial Supply
Ready for Commercial Supply
• Validated, sterile product
• Scottsdale capability at 6 million unit per annum
§ Expandable to 20+ million units in existing space
§ Plans to add capacity in US and IRE as needed in future
• Vetter collaboration
§ Combining expertise to establish a full service provider for
high-value biopharmaceutical drug product processing
high-value biopharmaceutical drug product processing
§ Installation of dedicated Crystal Zenith syringe fill and finish equipment
81
Summary
• Pharma customers and regulatory
personnel are demanding Daikyo
Crystal Zenith to reduce recalls due to
glass defects.
personnel are demanding Daikyo
Crystal Zenith to reduce recalls due to
glass defects.
• Daikyo Crystal Zenith vial and syringe
systems are a global market-proven
option.
systems are a global market-proven
option.
We believe that all of our major
biologic customers are evaluating
Daikyo Crystal Zenith.
biologic customers are evaluating
Daikyo Crystal Zenith.

Wrap-up
Don Morel
Chairman and CEO
83

2010 - Present
Strategic Execution
Strategic Execution
• Revenue and earnings growth
• Capacity investments for new markets and
products
products
§ Envision and NovaPure components
§ Daikyo Crystal Zenith and SmartDose
• Improved management bench strength
• Maintained strong balance sheet
84

Our Long-Term Focus
• Expand and strengthen packaging franchise
§ The Global Quality Initiative
§ Capacity expansion in key markets
§ Technology and product acquisitions
• Invest to ensure proprietary product success
• Conservative Financial Management
§ Operating cash flow
§ Prudent spending: discretionary SG&A and Capex
§ A strong balance sheet
85

Five-Year Growth Opportunity
2016 Strategic Planning Goals:
• Sales: $0.7 billion to $0.8 billion
• Operating margin: 20%
2016 Strategic Planning Goals:
• Sales of $1.0 billion to $1.1 billion
• Operating margin: 20%
|
Pharmaceutical
Packaging Systems
|
|
|
|
Pharmaceutical
Delivery Systems
|
|
|
Consolidated 2016 Strategic Planning Goals
2016 Sales: $1.7 to $1.9 billion
2016 Operating Margin: 19%
86

Selected Risk Factors
• Eurozone economic uncertainty
• Healthcare reform (U.S.)
• Supply chain stability
• Timing of new product commercialization
• Currency risk
• Regulatory risk
87
Summary
• A terrific franchise
• Significant growth potential
• The financial strength to invest
• An experienced team
Injectable Container Solutions
Advanced
Injection
Systems
Injection
Systems
Prefillable Syringe Systems
Safety and Administration
Systems
Systems
88

Each and every day
over 100 million
West products are used
to enhance the quality of
healthcare around the world
89

Q & A
90

Non-GAAP Financial Measures(1)
Three Months Ended March 31, 2012 and 2011
Three Months Ended March 31, 2012 and 2011
(in millions, except per share data)
(1) See “Notes to Non-GAAP Financial Measures” (Slides 14-15), “Cautionary Statement” (Slide 2) and see the “Restructuring and Other Items” section and “Supplemental Information and
Notes to Non-GAAP Financial Measures” in today’s press release for an explanation and reconciliation of these items.
Notes to Non-GAAP Financial Measures” in today’s press release for an explanation and reconciliation of these items.
|
|
As Reported
March 31,
2012
|
Restructuring
and related charges |
Acquisition-
related contingencies |
Discrete
tax items |
Non-GAAP
March 31,
2012
|
|
Operating profit
|
$41.7
|
$0.4
|
$0.2
|
$-
|
$42.3
|
|
Interest expense, net
|
3.9
|
-
|
-
|
-
|
3.9
|
|
Income before income taxes
|
37.8
|
0.4
|
0.2
|
-
|
38.4
|
|
Income tax expense
|
9.8
|
0.1
|
0.1
|
(0.3)
|
9.7
|
|
Equity in net income of affiliated companies
|
1.2
|
-
|
-
|
-
|
1.2
|
|
Net income
|
$29.2
|
$0.3
|
$0.1
|
$0.3
|
$29.9
|
|
|
|
|
|
|
|
|
Net income per diluted share
|
$0.81
|
$0.01
|
$-
|
$0.01
|
$0.83
|
|
|
As Reported
March 31,
2011
|
Restructuring
and related charges |
Discrete
tax items |
Non-GAAP
March 31,
2011
|
|
Operating profit
|
$28.8
|
$1.9
|
$-
|
$30.7
|
|
Interest expense, net
|
4.5
|
-
|
-
|
4.5
|
|
Income before income taxes
|
24.3
|
1.9
|
-
|
26.2
|
|
Income tax expense
|
6.1
|
0.6
|
(0.2)
|
6.5
|
|
Equity in net income of affiliated companies
|
1.4
|
-
|
-
|
1.4
|
|
Net income
|
$19.6
|
$1.3
|
$0.2
|
$21.1
|
|
|
|
|
|
|
|
Net income per diluted share
|
$0.56
|
$0.04
|
$-
|
$0.60
|

NOTES TO NON-GAAP FINANCIAL MEASURES
For additional details, please see today’s press release and Safe Harbor Statement.
For additional details, please see today’s press release and Safe Harbor Statement.
These slides use non-GAAP financial measures. West believes that these non-GAAP measures of financial results provide useful information to
management and investors regarding certain business trends relating to West’s financial condition, results of operations and the Company’s
overall performance. Our executive management team uses adjusted operating profit and adjusted diluted EPS to evaluate the performance of
the Company in terms of profitability and to compare operating results to prior periods. Adjusted operating profit is also used to evaluate
changes in the operating results of each segment and to allocate resources to our segments. The Company believes that the use of these non-
GAAP financial measures provides an additional tool for investors to use in evaluating ongoing operating results and trends in comparing its
financial measures with other companies.
Our executive management does not consider such non-GAAP measures in isolation or as an alternative to such measures determined in
accordance with GAAP. The principal limitation of such non-GAAP financial measures is that they exclude significant expenses and income that
are required by GAAP to be recorded. In addition, they are subject to inherent limitations as they reflect the exercise of judgment by
management about which items are excluded from the non-GAAP financial measures. In order to compensate for these limitations, our executive
management presents its non-GAAP financial measures in connection with its GAAP results. We urge investors and potential investors to review
the reconciliation of our non-GAAP financial measures to the comparable GAAP financial measures, and not rely on any single financial measure
to evaluate the Company’s business.
In calculating adjusted operating profit and adjusted diluted EPS, we exclude the impact of items that are not considered representative of
ongoing operations. Such items include restructuring and related costs, certain asset impairments, other specifically identified gains or losses,
and discrete income tax items. Reconciliations of these adjusted non-GAAP measures to the comparable GAAP financial measures are included
in the preceding (current and prior-year periods) and succeeding (2012 Guidance) slides.
The following is a description of the items excluded from adjusted operating profit and adjusted diluted EPS:
(continued on following slide)
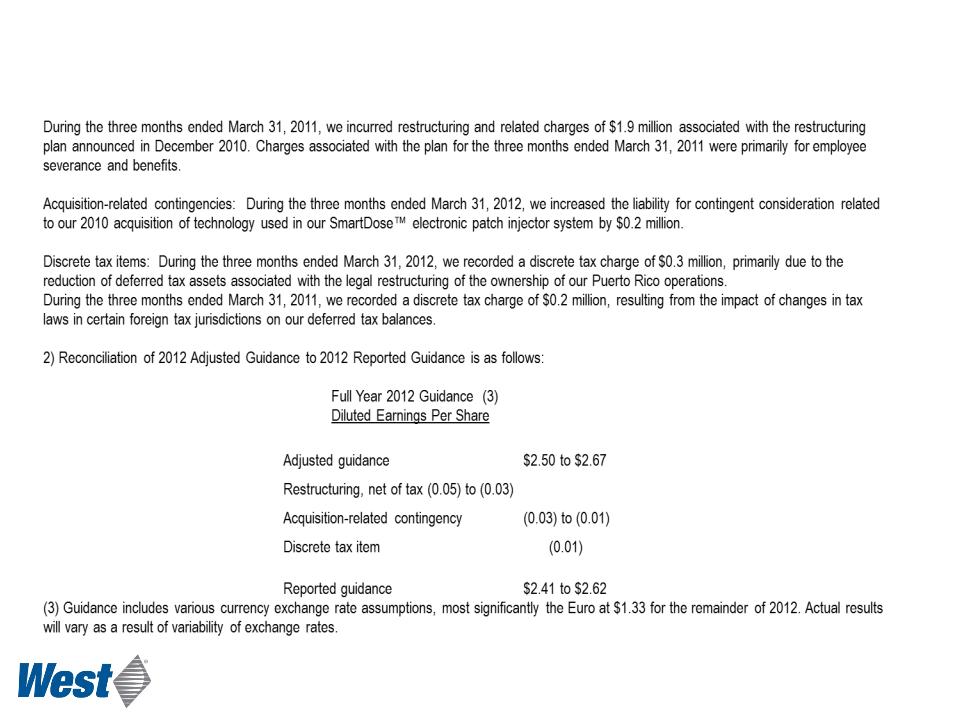
Restructuring and related charges: During the three months ended March 31, 2012, we incurred restructuring and related charges of $0.4 million
associated with the restructuring plan announced in December 2010. Charges associated with the plan for the three months ended March 31, 2012 were
primarily facility closure costs associated with the 2011 closure of a plant in the United States and a reduction of operations at a manufacturing facility in
England
NOTES TO NON-GAAP FINANCIAL MEASURES
For additional details, please see today’s press release and Safe Harbor Statement.
For additional details, please see today’s press release and Safe Harbor Statement.