Attached files
| file | filename |
|---|---|
| 8-K - FORM 8-K - ELAH Holdings, Inc. | d357399d8k.htm |
 B. Riley
Investor Conference May 2012
Exhibit 99.1 |
 CAUTIONARY
STATEMENT This
presentation
may
contain
certain
“forward-looking
statements”
within
the
meaning
of
the
Private
Securities
Litigation
Reform
Act
of
1995,
including
statements
with
regard
to
the
future
performance
of
Signature
Group
Holdings,
Inc.
(“Signature”
or
the
“Company”).
Words
such
as
“believes,”
“expects,”
“projects,”
“anticipates,”
and
“future”
or
similar
expressions
are
intended
to
identify
forward-looking
statements.
These
forward-looking
statements
are
subject
to
the
inherent
uncertainties
in
predicting
future
results
and
conditions.
Certain
factors
could
cause
actual
results
to
differ
materially
from
those
projected
in
these
forward-looking
statements,
and
such
factors
are
identified
from
time
to
time
in
our
filings
with
the
Securities
and
Exchange
Commission.
Pursuant
to
the
Private
Securities
Litigation
Reform
Act
of
1995,
Signature
undertakes
no
obligation
to
publicly
update
or
revise
any
forward-looking
statements, whether as a result of new information, future events or otherwise.
No
representation
or
warranty,
express
or
implied,
is
made
as
to
the
accuracy
or
completeness
of
the
information
contained
herein,
and
nothing
shall
be
relied
upon
as
a
promise
or
representation
as
to
the
future of the Company.
For
more
specific
financial
information
please
refer
to
the
Company’s
Annual
Report
on
form
10-K
for
the
year
ended
December
31,
2011,
the
Quarterly
Report
on
form
10-Q
for
the
quarter
ended
March,
31, 2012 and other SEC filings.
2 |
 OVERVIEW
3
Signature Group Holdings, Inc.
Reorganization
On June 11, 2010, Fremont General Corporation (“Fremont”)
emerged from bankruptcy and was renamed Signature Group
Holdings, Inc.
Facilities
Headquartered in Sherman Oaks, CA
Corporate development office in New York, NY
Ticker
SGGH, traded on OTCQX
Cash
$52.8 million (1)
Assets
$139.2 million (1)
NOLs
$889.9 million as of 12/31/2011 –
Expire beginning in 2027 (Federal)
Shareholder Equity
$63.3 million (1)
Shares Outstanding
119,931,857 as of May 11, 2012
(1) Information provided as of March 31, 2012 |
 HISTORY
Over the past two years we have addressed numerous legacy challenges which
include:
–
Become current with our periodic reporting requirements under the Securities
Exchange Act of 1934 as amended, which included filing three Annual Reports on Form
10-K and seven Quarterly Reports on Form 10-Q within an 18 month period
–
Resolved in excess of 200 legal proceedings associated with Fremont and its
subsidiaries –
Implemented value maximizing strategies for the residential loan
portfolio and other
assets, including significant divestitures
–
Monitored and managed the repurchase demands relating to Fremont’s legacy
residential loan sales
–
Reduced staffing and expenses associated with the Fremont legacy
operations
–
Rebuilt an experienced accounting and finance team
4 |
 OPERATIONS
Actively seek acquisition opportunities
–
North American Breaker Company acquired July 2011
–
Cosmed Inc. formed in February 2011 to acquire the assets of Costru, LLC
Acquire and originate debt opportunities through Signature Special Situations
Position the Company to take advantage of its net operating loss
carryforwards
Legacy clean-up and wind-down of the discontinued operations
5 |
 ACQUISITIONS
Target Transactions
EBITDA of $7 million to $25 million
Enterprise values up to $300
million
Equity investments up to $100
million
Larger investments are achievable
Industry agnostic
Key Acquisition Criteria
Proven and committed management
team with the ability to operate
autonomously
Market leading or niche oriented
Sustainable business that can be held
long term
Low capital expenditures
6
Ideal Situations
Companies that do not have a natural strategic buyer or stand alone IPO potential
Private equity or hedge fund holdings which need an exit per LP requirements
Companies with limited or declining tax deductions
Non-core divisions of larger enterprises
Family businesses seeking to diversify holdings |
 NORTH
AMERICAN BREAKER COMPANY Wholly owned subsidiary acquired July 29, 2011
Aggregate purchase price consideration of approximately $36.9
million with a net cash outlay of $10.9 million after giving effect
to a debt financing facility closed in September 2011
Highly profitable distributor of specialty electrical components,
primarily circuit breakers, to electrical wholesalers throughout
the country
–
Gross Margins approaching 40%
–
Q1 2012 over Q1 2011 sales growth of 14.9%
–
Minimal capital expenditures
7
Low risk business model
–
“Need it now”
product
–
Operates in steady replacement market
–
Strong national market presence
Headquarters and warehouse in Burbank CA
Four regional centers -
Dallas, TX, Chicago, IL, Orland, FL, Cranbury, NJ
1 day
2 days
3 days
Ground Transit Time: |
 SIGNATURE
SPECIAL SITUATIONS Seek debt opportunities with significant upside potential that
generate high risk adjusted returns in the form of:
–
Interest Income
–
Fees
–
Recovery of discounted principal balances
–
Market value appreciation
Asset types considered include:
–
Distressed and sub-performing debt
–
Secured loans
–
Real estate mortgages
–
Corporate bonds
–
Tranche B loans
–
Public and private debt
–
Annuity streams
Positions are frequently purchased at a discount
Maintain focus on managing downside risk and exposure
8 |
 DISCONTINUED
OPERATIONS – LEGACY MATTERS
Monetize assets through an actively
managed approach
–
$58.0 million UPB subprime residential loan
portfolio (1)
–
$2.7 million REO prior to allowance (1)
–
$2.0 million FHLB Stock (1)
–
CRA Assets
Monitor repurchase demands for
Fremont’s subprime loan originations
–
Total outstanding repurchase claims of
approximately
$101.7
million
(1)
–
Repurchase reserve of $8.3 million (1)
–
No new demands or activity since June 2011
Manage and resolve ongoing and new
legacy related litigation
(1) As of March31, 2012
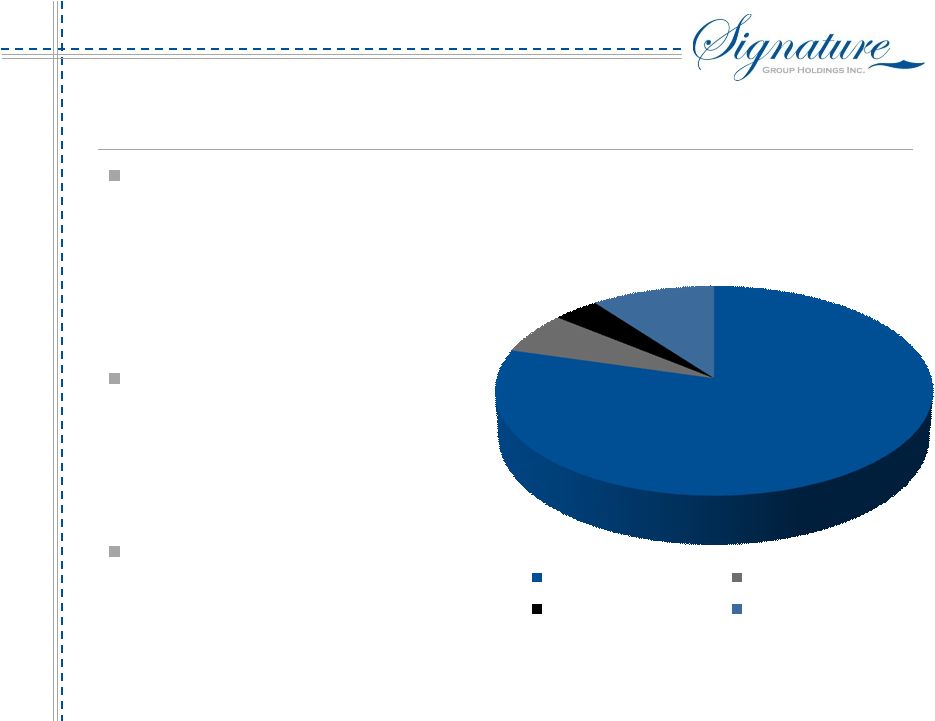
9
62
5
3
8
Outstanding Litigation
(Number of Cases as of 3/31/2012)
Home Borrower
FIL Securitization
Fremont Employment
Plaintiff -
Mortgage Fraud |
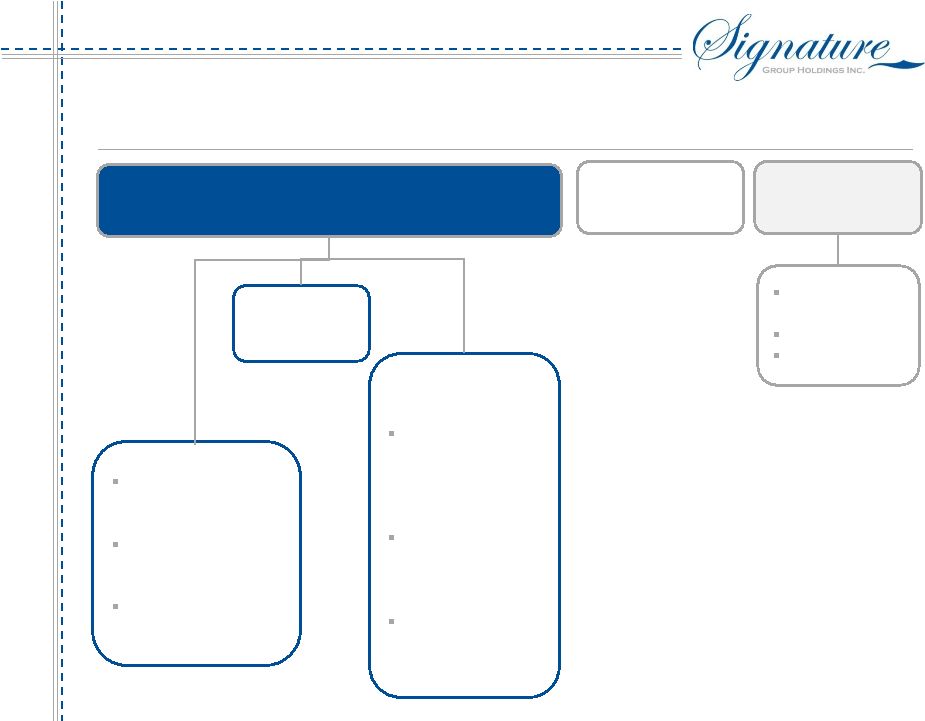 SIGNATURE’S MATERIAL COMPONENTS
10
Continuing Operations
Discontinued
Operations
Signature Special
Situations
Effective 4/1/2012
performing
residential loans
reclassified from
Disc Ops
Commercial loans
of $4.2mm and
preferred equity of
$2mm
Public bond
investment current
carrying value of
$8.1mm
NABCO
3 months ending
3/31/2012 revenue:
$7.8mm
3 months ending
3/31/2012 EBITDA:
$2.0mm
Total assets at
3/31/2012: $38.0mm
Cash
$52.8mm as of
3/31/12
NOLs
$889mm as of
12/31/11
Non-performing
LHFS
FHLB Stock
REO |
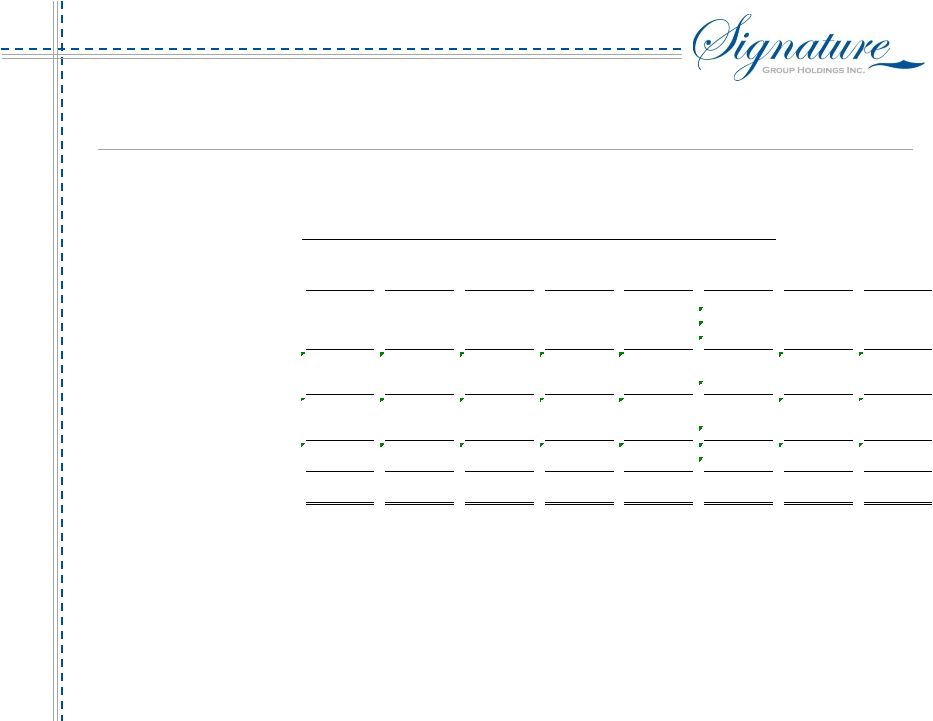
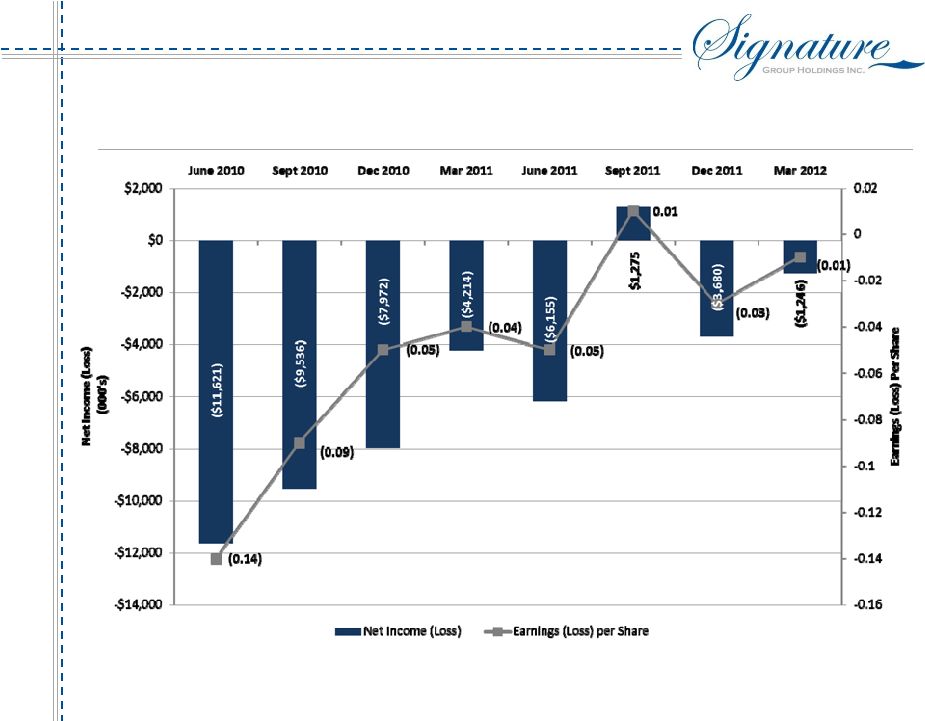 QUARTERLY
NET INCOME (LOSS) AND EPS 11 |
 NON-GAAP
FINANCIAL MEASURES* 12
(Dollars in thousands)
Three months ended March 31, 2012:
NABCO
Cosmed
Net earnings (loss)
$
657 $
(95) Plus:
Interest
317
75
Income tax expense
438
3
Depreciation
15
3
Amortization of intangibles and other purchase accounting adjustments
587
18
EBITDA
2,014
4
Adjustments:
Change in fair value of contingent consideration
74
0
Reversal of accrued compensation
0
(95)
Adjusted EBITDA
$ 2,014
$ (91)
*See Signature’s 1
st
Quarter 10-Q for full disclosure
Evaluate operating subsidiaries based on EBITDA and Adjusted EBITDA, Non-GAAP
measures
EBITDA calculated as earnings before interest, taxes, depreciation and amortization
Adjusted EBITDA then removes or adds back certain items as identified below
|
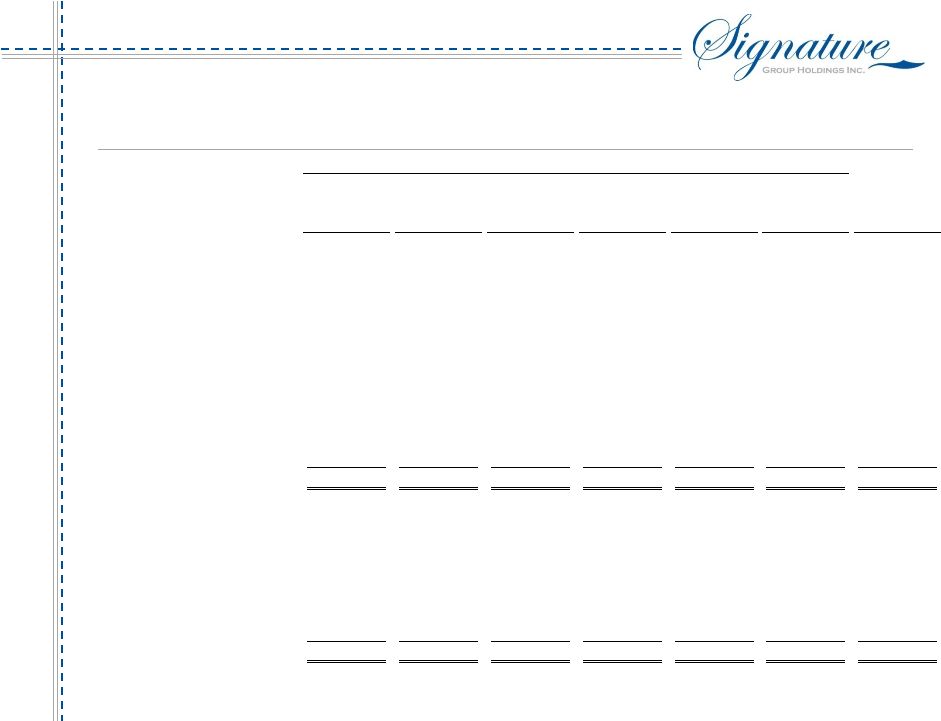
 CONSOLIDATED
STATEMENT OF OPERATIONS (UNAUDITED) 13
(Dollars in thousands, except per share amounts)
2012
2011
Revenues:
Net sales
8,041
$
546
$
Interest
731
156
Total revenues
8,772
702
Expenses:
Cost of goods sold
4,947
273
Selling, general and administrative
819
610
Compensation
2,224
279
Professional fees
1,747
1,076
Amortization of intangibles
605
26
Interest
1,113
888
Total expenses
11,455
3,152
Other income (expense):
Change in fair value of common stock warrant liability
3
801
Other (expense) income
(74)
281
Total other income (expense)
(71)
1,082
Loss from continuing operations before reorganization items, netand income taxes
(2,754)
(1,368)
Reorganization items, net
95
499
Loss from continuing operations before income taxes
(2,849)
(1,867)
Income tax expense (benefit)
49
(99)
Loss from continuing operations
(2,898)
(1,768)
Earnings (loss) from discontinued operations, net of income taxes
1,652
(2,406)
Net loss
(1,246)
(4,174)
Loss attributable to noncontrolling interest
-
40
Net loss attributable to Signature Group Holdings, Inc.
(1,246)
$
(4,214)
$
EARNINGS (LOSS) PER SHARE:
Basic and diluted:
Loss from continuing operations
(0.03)
$
(0.02)
$
Earnings (loss) from discontinued operations, net of income
taxes 0.02
(0.02)
Net loss attributable to Signature Group Holdings, Inc.
(0.01)
$
(0.04)
$
Three Months Ended
March 31, |
 CONSOLIDATED
BALANCE SHEETS 14
March 31,
December 31,
52,439
4,991
3,750
4,112
8,681
6,978
18,180
2,487
41,400
143,018
5,116
5,916
3,597
51,613
1,403
11,536
79,181
1,151
446,805
(384,315)
196
143,018
63,837
63,837
(Dollars in thousands, except per share amounts)
2012
2011
(Unaudited)
ASSETS
Cash and cash equivalents
52,688
$
$
Investment securities, available for sale
8,116
Loans receivable, net
5,478
Trade and other receivables, net
3,925
Inventories
9,579
Intangible assets, net
6,365
Goodwill
18,180
Other assets
2,585
Assets of discontinued operations
32,249
TOTAL ASSETS
139,165
$
$
LIABILITIES AND SHAREHOLDERS' EQUITY
Liabilities:
Lines of credit
3,066
$
$
Accrued expenses and other liabilities
5,553
Contingent consideration
3,671
Long-term debt
51,413
Common stock warrant liability
1,400
Liabilities of discontinued operations
10,759
TOTAL LIABILITIES
75,862
Commitments and contingencies
Shareholders' equity:
Preferred stock, $0.01 par value; 10,000,000 shares authorized; none issued or
outstanding -
-
Common stock, $0.01 par value; 190,000,000 shares authorized; 119,098,524 and
117,431,856
shares issued and outstanding at March 31, 2012 and December 31,2011, respectively
1,156
Additional paid-in capital
447,151
Accumulated deficit
(385,561)
Accumulated other comprehensive income
557
Total
shareholders‘
equity -
Signature Group Holdings, Inc.
63,303
Noncontrolling interest
-
-
TOTAL SHAREHOLDERS' EQUITY
63,303
TOTAL LIABILITIES AND SHAREHOLDERS' EQUITY
139,165
$
$
|
 SEGMENT
INCOME STATEMENTS 15
12,304
13,322
(71)
(1,089)
(1,197)
(1,246)
(1,246)
Continuing Operations
(Dollars in thousands)
Signature
Special
Situtations
NABCO
Cosmed
Corporate
and Other
Eliminations
Total
Discontinued
Operations
Total
Three months ended March 31, 2012:
Revenues
870
$
7,843
$
198
$
163
$
(302)
$
8,772
$
3,532
$
$
Expenses
157
6,675
289
4,636
(302)
11,455
1,867
Other income (expense)
-
(73)
(1)
3
-
(71)
-
Earnings (loss) before reorganization items, net
and income taxes
713
1,095
(92)
(4,470)
-
(2,754)
1,665
Reorganization items, net
-
-
-
95
-
95
13
108
Earnings (loss) before income taxes and loss
attributable to noncontrolling interest
713
1,095
(92)
(4,565)
-
(2,849)
1,652
Income tax expense (benefit)
19
438
3
(411)
-
49
-
49
Net earnings (loss)
694
657
(95)
(4,154)
-
(2,898)
1,652
Loss attributable to noncontrolling interest
-
-
-
-
-
-
-
-
Net earnings (loss) attributable to Signature
Group Holdings, Inc.
694
$
657
$
(95)
$
(4,154)
$
-
$
(2,898)
$
1,652
$
$
|
 SEGMENT
BALANCE SHEETS 16
Continuing Operations
(Dollars in thousands)
Signature
Special
Situtations
NABCO
Cosmed
Corporate
and Other
Eliminations
Total
Discontinued
Operations
March 31, 2012
Cash and cash equivalents
239
$
595
$
73
$
51,781
$
-
$
52,688
$
117
$
Investment securities, available for sale
8,116
-
-
-
-
8,116
-
Loans receivable, net
5,478
-
-
-
-
5,478
-
Trade and other receivables, net
-
3,805
120
-
-
3,925
-
Inventories
-
8,757
822
-
-
9,579
-
Intangible assets, net
-
6,113
252
-
-
6,365
-
Goodwill
-
17,780
400
-
-
18,180
-
Deferred tax assets
-
-
-
1,791
(1,791)
-
-
Loans held for sale, net
-
-
-
-
-
-
26,000
Commercial real estate investments
-
-
-
-
-
-
110
Real estate owned, net
-
-
-
-
-
-
2,000
Intercompany receivable
6,553
14
-
10,668
(17,235)
-
-
Other assets
1,239
914
11
1,883
(1,462)
2,585
4,022
Total assets
21,625
$
37,978
$
1,678
$
66,123
$
(20,488)
$
106,916
$
32,249
$
Lines of credit
-
$
3,066
$
-
$
-
$
-
$
3,066
$
-
$
Accrued expenses and other liabilities
309
3,261
55
3,318
(1,462)
5,481
2,509
Contingent consideration
-
3,671
-
-
-
3,671
-
Long-term debt
-
12,413
-
39,000
-
51,413
-
Common stock warrant liability
-
-
-
1,400
-
1,400
-
Repurchase reserve
-
-
-
-
-
-
8,250
Deferred tax liabilities
-
1,863
-
-
(1,791)
72
-
Intercompany payable
10,668
4,203
2,350
14
(17,235)
-
-
Total liabilities
10,977
$
28,477
$
2,405
$
43,732
$
(20,488)
$
65,103
$
10,759
$
|