Attached files
| file | filename |
|---|---|
| EX-32.1 - EX-32.1 - ELAH Holdings, Inc. | rely-ex321_7.htm |
| EX-32.2 - EX-32.2 - ELAH Holdings, Inc. | rely-ex322_6.htm |
| EX-31.2 - EX-31.2 - ELAH Holdings, Inc. | rely-ex312_9.htm |
| EX-31.1 - EX-31.1 - ELAH Holdings, Inc. | rely-ex311_10.htm |
| EX-21 - EX-21 SUBSIDIARIES - ELAH Holdings, Inc. | rely-ex21_393.htm |
| EX-16.1 - EX-16.1 - ELAH Holdings, Inc. | rely-ex161_399.htm |
| EX-23.2 - EX-23.2 CONSENT OF SQUAR MILNER - ELAH Holdings, Inc. | rely-ex232_397.htm |
| EX-23.1 - EX-23.1 CONSENT OF EY - ELAH Holdings, Inc. | rely-ex231_398.htm |
UNITED STATES
SECURITIES AND EXCHANGE COMMISSION
Washington, D.C. 20549
FORM 10-K
|
þ |
Annual Report Pursuant to Section 13 or 15(d) of the Securities Exchange Act of 1934 |
For the Fiscal Year Ended December 31, 2015
or
|
¨ |
Transition Report Pursuant to Section 13 or 15(d) of the Securities Exchange Act of 1934 |
For the transition period from to
Commission File Number 001-08007

REAL INDUSTRY, INC.
(Exact Name of Registrant as Specified in its Charter)
|
Delaware |
|
46-3783818 |
|
(State or Other Jurisdiction of |
|
(I.R.S. Employer |
|
15301 Ventura Boulevard, Suite 400 |
|
(805) 435-1255 |
|
(Address of Principal Executive Offices) (Zip Code) |
|
(Registrant’s Telephone Number, including Area Code) |
Securities Registered Pursuant to Section 12(b) of the Act:
None
Securities Registered Pursuant to Section 12(g) of the Act:
(Title of Each Class)
Common Stock, $0.001 par value
Indicate by check mark if the Registrant is a well-known seasoned issuer, as defined in Rule 405 of the Securities Act of 1933. ¨ Yes þ No
Indicate by check mark if the Registrant is not required to file reports pursuant to Section 13 or 15(d) of the Securities Exchange Act of 1934. ¨ Yes þ No
Indicate by check mark whether the Registrant (1) has filed all reports required to be filed by Section 13 or 15(d) of the Securities Exchange Act of 1934 during the preceding 12 months (or for such shorter period that the Registrant was required to file such reports), and (2) has been subject to such filing requirements for the past 90 days. þ Yes ¨ No
Indicate by checkmark whether the Registrant has submitted electronically and posted on its corporate website, if any, every Interactive Data File required to be submitted and posted pursuant to Rule 405 of Regulation S-T (§ 232.405 of this chapter) during the preceding 12 months (or for such shorter period that the Registrant was required to submit and post such files). þ Yes ¨ No
Indicate by check mark if disclosure of delinquent filers pursuant to Item 405 of Regulation S-K (§ 229.405 of this chapter) is not contained herein, and will not be contained, to the best of Registrant’s knowledge, in definitive proxy or information statements incorporated by reference in Part III of this Form 10-K or any amendment to this Form 10-K. þ
Indicate by check mark whether the Registrant is a large accelerated filer, an accelerated filer, a non-accelerated filer, or a smaller reporting company. See the definitions of “large accelerated filer,” “accelerated filer” and “smaller reporting company” in Rule 12b-2 of the Securities Exchange Act of 1934.
|
¨ Large Accelerated Filer |
|
þ Accelerated Filer |
|
|
|
|
|
¨ Non-Accelerated Filer (Do not check if a smaller reporting company) |
|
¨ Smaller Reporting Company |
Indicate by check mark whether the Registrant is a shell company (as defined in Rule 12b-2 of the Securities Exchange Act of 1934). ¨ Yes þ No
The aggregate market value of the Registrant’s common stock held by non-affiliates of the Registrant was $275,093,684 on June 30, 2015, the last business day of the Registrant’s most recently completed second fiscal quarter, based on the closing sales price of the Registrant’s common stock on the Nasdaq Stock Exchange, on that date. Shares of the Registrant’s common stock held by each officer, director and each person known to the Registrant to own 10% or more of the outstanding voting power of the Registrant, as of that date, have been excluded since such persons may be deemed to be affiliates. This determination of affiliate status is not a determination for any other purpose.
On February 29, 2016, 29,232,368 shares of the Registrant’s common stock were outstanding.
DOCUMENTS INCORPORATED BY REFERENCE
Part III incorporates by reference certain information from the Registrant’s definitive proxy statement for the 2016 Annual Meeting of Stockholders to be filed with the Securities and Exchange Commission on or before April 30, 2016.
ANNUAL REPORT ON FORM 10-K
For the Fiscal Year Ended December 31, 2015
TABLE OF CONTENTS
|
|
|
|
Page |
||
|
|
|
|
|
||
|
|
|
|
|
|
|
|
Item 1. |
|
1 |
|
||
|
Item 1A. |
|
8 |
|
||
|
Item 1B. |
|
23 |
|
||
|
Item 2. |
|
24 |
|
||
|
Item 3. |
|
24 |
|
||
|
Item 4. |
|
25 |
|
||
|
|
|
|
|
||
|
|
|
|
|
|
|
|
Item 5. |
|
26 |
|
||
|
Item 6. |
|
29 |
|
||
|
Item 7. |
Management’s Discussion and Analysis of Financial Condition and Results of Operations |
|
30 |
|
|
|
Item 7A. |
|
51 |
|
||
|
Item 8. |
|
53 |
|
||
|
Item 9. |
Changes in and Disagreements with Accountants on Accounting and Financial Disclosure |
|
53 |
|
|
|
Item 9A. |
|
53 |
|
||
|
Item 9B. |
|
56 |
|
||
|
|
|
|
|
||
|
|
|
|
|
|
|
|
Item 10. |
|
57 |
|
||
|
Item 11. |
|
57 |
|
||
|
Item 12. |
Security Ownership of Certain Beneficial Owners and Management and Related Stockholder Matters |
|
57 |
|
|
|
Item 13. |
Certain Relationships and Related Transactions, and Director Independence |
|
57 |
|
|
|
Item 14. |
|
57 |
|
||
|
|
|
|
|
||
|
|
|
|
|
|
|
|
Item 15. |
|
58 |
|
||
SAFE HARBOR STATEMENT UNDER THE PRIVATE SECURITIES LITIGATION REFORM ACT OF 1995
Certain statements in this Annual Report on Form 10-K for the fiscal year ended December 31, 2015 (the “Annual Report”), including, without limitation, matters discussed under Part II, Item 7, “Management’s Discussion and Analysis of Financial Condition and Results of Operations” (“MD&A”) should be read in conjunction with the consolidated financial statements, related notes, and other detailed information included elsewhere in this Annual Report. We are including this cautionary statement to make applicable and take advantage of the safe harbor provisions of the Private Securities Litigation Reform Act of 1995. Certain statements that are not historical fact are forward-looking statements. These forward-looking statements can be identified by the use of words such as “believes,” “anticipates,” “expects,” “intends,” “plans,” “projects,” “strategy,” “estimates,” “assumes,” “may,” “should,” “will,” “likely,” “could” or other similar expressions. Such forward-looking statements involve known and unknown risks, uncertainties and other important factors that could cause actual results, performance or achievements to differ materially from the forward-looking statements. These forward-looking statements are based on our current beliefs, intentions and expectations. These statements are neither guarantees nor indicative of future performance. Important assumptions and other important factors that could cause changes in our financial condition or results of operations or could cause actual results to differ materially from those forward-looking statements include, but are not limited to:
|
|
· |
changes in domestic and international demand for recycled aluminum, including in the automotive, consumer packaging, aerospace, building and construction, steel, and durable goods manufacturing industries; |
|
|
· |
the cyclical nature of the aluminum industry, material adverse changes in the aluminum industry or end-use segments, such as global and regional supply and demand conditions for aluminum and aluminum products, and changes in our customers’ industries; |
|
|
· |
commodity price fluctuations in the aluminum market and our ability to enter into effective commodity derivatives or arrangements to effectively manage our exposure to such commodity price fluctuations; |
|
|
· |
our ability to use United States (“U.S.”) federal and state net operating loss tax carryforwards (“U.S. NOLs”) and recognize future tax benefits, including in connection with the sale of NABCO, the Real Alloy Acquisition, and the Financings (each as defined below); |
|
|
· |
the servicing of, and the high leverage associated with, the indebtedness from the Financings, security interests in the assets associated with such indebtedness, and compliance with the terms of the indebtedness, including the restrictive covenants that constrain the operation of our business and the businesses of our subsidiaries; |
|
|
· |
disruption in relationships with customers, employees and suppliers relating to the Real Alloy Business (as defined below) and our other businesses as a result of the Real Alloy Acquisition; |
|
|
· |
our ability to successfully identify, acquire and integrate additional companies and businesses that perform and meet expectations after completion of such acquisitions; |
|
|
· |
our ability to achieve future profitability; |
|
|
· |
our ability to control operating costs and other expenses; |
|
|
· |
our ability to secure additional financing; |
|
|
· |
our dependence, as a holding company, on funding from our operating subsidiaries; |
|
|
· |
general economic conditions may be worse than expected; |
|
|
· |
competition among other companies with whom we compete may increase significantly; |
|
|
· |
the loss of key personnel or the ability to cost-effectively attract, retain and motivate key personnel; |
|
|
· |
our ability to maintain effective disclosure controls and procedures and internal control over financial reporting to ensure timely, effective and accurate financial reporting; |
|
|
· |
changes in accounting policies and practices, as may be adopted by regulatory agencies and other organizations, including without limitation the Securities and Exchange Commission (“SEC or “Commission”) and the Financial Accounting Standards Board (“FASB”); |
|
|
· |
changes in laws or government regulations or policies affecting our current business operations and/or the legacy businesses related to residential mortgage lending and servicing, which are now a part of discontinued operations; |
|
|
· |
the impact of current or new litigation matters, or changes in litigation strategies brought against us in our current businesses, or the former businesses of our subsidiary SGGH, LLC (“SGGH”); |
1
|
|
· |
other factors, risks and uncertainties described in this Annual Report under Part I, Item 1A “Risk Factors,” as may be supplemented in our other filings with the Commission from time to time. |
All forward-looking statements set forth herein are qualified by these cautionary statements and are made only as of the date hereof. We undertake no obligation to update or revise the information contained herein including, without limitation, any forward-looking statements whether as a result of new information, subsequent events or circumstances, or otherwise, unless otherwise required by law.
2
Overview
Real Industry, Inc. (“Real Industry,” the “Company,” “we,” “us” or “our”) is a Delaware holding company that operates through subsidiaries. Our business focus is supporting the performance of Real Alloy, a global leader in aluminum recycling and our single largest operating business today, and to make acquisitions of additional operating companies. We seek to acquire meaningful ownership stakes in businesses with talented and experienced management teams, strong customer relationships, and sustainable competitive advantages. We regularly consider acquisitions of businesses that operate in undervalued industries, as well as businesses that we believe are in transition or are otherwise misunderstood by the marketplace. Post-acquisition, we expect to operate our businesses as autonomous subsidiaries, as we do with Real Alloy. We anticipate that we will continue to use our securities to pursue value-enhancing acquisitions and leverage our considerable tax assets, as well as support the needs of our existing operating segments, as necessary.
A key element to our business strategy is utilizing our considerable U.S. NOLs by becoming a significantly profitable enterprise. Our NOLs were predominantly generated by the legacy businesses of Fremont General Corporation (“Fremont”), and as of December 31, 2015, we have U.S. NOLs of approximately $871.8 million, which begin to expire if not used before our 2027 tax year. The ultimate realization of our deferred tax assets, including our U.S. NOLs, depends on our ability to generate future U.S. taxable income through the implementation of our business plan.
Transformation of Real Industry
During the first quarter of 2015, the Company underwent a considerable transformation. On January 9, 2015, we completed the sale of North American Breaker Co., LLC (“NABCO”), previously the primary business within our subsidiary SGGH. On February 27, 2015, we acquired and began operating the global recycling and specification alloys business (the “Real Alloy Business” operated as Real Alloy Holding, Inc. or “Real Alloy”) of Aleris Corporation (“Aleris”) for total consideration of $554.5 million (the “Real Alloy Acquisition”). A portion of the proceeds of the sale of NABCO were used to fund the Real Alloy Acquisition.
The closing of the Real Alloy Acquisition was the culmination of a series of equity and debt financing transactions that began in the fourth quarter of 2014, raising the capital required to fund the Real Alloy Acquisition and pay transaction costs as summarized below (collectively, the “Financings”):
|
|
· |
In October 2014, Real Industry issued 0.3 million shares of common stock at $10.00 per share in a private placement providing gross proceeds of $3.0 million; |
|
|
· |
In December 2014, Real Industry issued approximately 4.4 million shares of common stock at $6.50 per share in an underwritten public offering providing gross proceeds of $28.5 million; |
|
|
· |
In January 2015, Real Alloy issued $305.0 million in senior secured notes due January 2019 (the “Senior Secured Notes”) at a price of 97.206% of the principal amount, providing gross proceeds of $296.5 million; |
|
|
· |
In February 2015, Real Industry issued approximately 9.8 million shares of common stock to existing stockholders in a stapled rights offering (the “Rights Offering”), providing gross proceeds of $55.0 million; |
|
|
· |
In February 2015, certain operating subsidiaries of Real Alloy entered into new credit facilities, including a $110.0 million asset-based lending facility (the “Asset-Based Facility”) and a €50.0 million factoring facility (the “Factoring Facility”); and |
|
|
· |
In February 2015, Real Industry issued 25,000 shares of non-participating preferred stock (the “Redeemable Preferred Stock”) to Aleris, with a liquidation value of $25.0 million. |
The Real Alloy Acquisition was a transformative event for the Company, both in terms of size and substance. We have devoted significant time and attention to integrating and incorporating the Real Alloy Business into the Company, even as a largely stand-alone operating entity. For more information on the details of the Real Alloy Acquisition and the Financings for such transaction, please see Note 1—Business and Operations and Note 3—Business Combinations in the notes to the consolidated financial statements in Part IV, Item 15 of this Annual Report.
2015 – Other Corporate Milestones
On April 21, 2015, our common stock began trading on the Nasdaq Stock Market (“NASDAQ”) under the symbol “RELY.”
1
At our 2015 Annual Meeting of Stockholders on May 28, 2015, our stockholders approved an amendment to our charter to change our name to Real Industry, Inc., we expanded the size of our board of directors (“Board”) to seven members, and a new independent registered public accounting firm was approved.
In June 2015, Real Industry became a member of the Russell Global®, Russell 2000® and Russell Microcap® indexes.
In October 2015, we filed a $700.0 million shelf registration statement on Form S-3 (the “Shelf Registration Statement”) replacing the September 2013 registration statement on Form S-3 that had availability of approximately $200.0 million of registered securities.
Corporate History and Structure
Real Industry, Inc. is the successor to Signature Group Holdings, Inc., a Delaware corporation (“Signature Delaware”), which on January 2, 2014, completed a holding company reorganization and reincorporation from Nevada to Delaware (the “Reincorporation”). The Reincorporation was completed to take advantage of the benefits of Delaware corporate law and to provide a better organizational structure for our future acquisitions and the management of existing operations. To accomplish this, in late 2013, Signature Group Holdings, Inc. a Nevada corporation (“Signature Nevada”) formed SGH Holdco, Inc., a Delaware corporation, and its subsidiary, SGGH. In the Reincorporation, following the approval of Signature Nevada’s stockholders, Signature Nevada merged with and into SGGH, with Signature Nevada ceasing to exist and SGGH continuing as the surviving entity and as a wholly owned subsidiary of SGH Holdco, Inc., which concurrent with the merger, was renamed Signature Group Holdings, Inc. In the Reincorporation, each outstanding share of common stock of Signature Nevada was automatically converted into one share of common stock of Signature Delaware. In May 2015, Signature Delaware was renamed Real Industry, Inc.
Signature Nevada was originally incorporated as Fremont in 1972. Prior to its bankruptcy filing in June 2008, Fremont operated as a financial services holding company. On June 11, 2010 (the “Reorganization Date”), Fremont completed a plan of reorganization and emerged from a nearly two-year reorganization under Chapter 11 bankruptcy proceedings (the “Bankruptcy Proceedings”) as a renamed public company, with significant cash resources and a substantial amount of U.S. NOLs.
After the Reorganization Date, Signature Nevada was repositioned through the divestiture of non-core legacy assets, the settlement and resolution of a significant number of legacy legal actions, and it made select investments through a former specialty lending business segment and acquired NABCO.
In order to preserve the availability of our U.S. NOLs, our Amended and Restated Bylaws include trading restrictions (the “Tax Benefit Preservation Provision”) that imposes on any persons who own, or as a result of a transaction would own, 4.9-percent or more of our common stock in order to reduce the risk that any change in ownership might limit our ability to utilize the U.S. NOLs under Section 382 of the Internal Revenue Code of 1986, as amended (the “Tax Code”), and thereby suffer limitations on our ability to utilize our U.S. NOLs in the future. For more information on the Tax Benefit Preservation Provision, see “Risk Factors—Risks Related to Our Business—Our ability to use our U.S. NOLs to offset future U.S. taxable income may be limited as a result of past events, the Financings, the Real Alloy Acquisition or the other financings, or as the result of future acquisitions or other issuances or transfers of our common stock.” Additionally, we have a Rights Agreement, dated October 23, 2007, as amended, between Fremont and Computershare NA, as successor to Mellon Investor Services LLC, as Rights Agent (the “Rights Agreement”), which was adopted to protect the value of our U.S. NOLs and continues to remain in effect. The Rights Agreement was approved by the Company’s shareholders through the Reincorporation.
Business and Management Strategy
Our business strategy is to take meaningful ownership positions in operating companies that leverage the strengths of our platform, including our status as a public company, our sizable tax assets, and the experience of our executive management team. We seek to acquire companies with sustainable competitive advantages. In considering acquisition opportunities, we seek businesses with management teams that have shown success through business cycles, and have defensible market positions. We regularly consider acquisitions in what we view as undervalued industries, as well as businesses with values we believe to be misunderstood by the marketplace. In all cases we seek opportunities that will be accretive to our earnings.
We believe the Real Alloy Acquisition is consistent with this strategy. For more information on the business operations of Real Alloy, please refer to “Our Segments—RANA and RAEU” in this Item 1. Given our present size and operations, the Real Alloy Acquisition represents a transformative transaction for the Company. During 2015, our management team worked closely with the Real Alloy management team to integrate and incorporate the Real Alloy Business into the Company, even as a largely stand-alone business unit, and certain members of our management will continue to focus on this transition until it is complete. Further, we are working closely with Real Alloy management to accomplish the business objectives and operating strategies of Real Alloy.
2
Beyond the Real Alloy Acquisition, we expect to continue to evaluate acquisition opportunities as permitted by the terms of the Financings, and these may or may not have a strategic relationship with Real Alloy. Potential transactions are typically identified by our chief executive officer (“CEO”), but may be sourced by members of the management team, Board, and others connected with the Company. The bulge bracket investment banks on Wall Street, as well as regional firms, and other organizations around the country, routinely approach Real Industry with acquisition opportunities. Our CEO and management screen such ideas and determine whether to engage in a process. During the second half of 2015, after the Real Alloy Acquisition was closed and the integration efforts were well underway, we recommenced our acquisition efforts, reviewed more than a dozen potential acquisitions, and devoted significant management resources to four such opportunities. We incurred approximately $0.6 million of diligence and advisory costs and expenses, unrelated to Real Alloy, during the year ended December 31, 2015.
Similar to the Real Alloy Acquisition, we expect that most, if not all of our future acquisitions would be separately financed in the credit markets and we anticipate structuring any such financings to minimize the impact on our other businesses. We structured the Financings for the Real Alloy Acquisition, including our stapled Rights Offering, with a view to minimizing ownership shift in our common stock and allowing our existing stockholders the ability to avoid dilution as we grow. At the holding company level, we may enter into financing arrangements, issue securities in secondary offerings, rights offerings or private placements, or provide other financial support under terms that would limit us from additional acquisitions until such financing arrangements are repaid.
In conjunction with our business strategy of making acquisitions, as described above, our management strategy involves proactive strategic, financial and operational support for the management and operations of our business units. Particular areas in which we may provide assistance to our business units include:
|
|
· |
recruiting and retaining talented managers to lead our businesses; |
|
|
· |
monitoring financial and operational performance, instilling consistent financial discipline, and supporting management in the development and implementation of information systems to effectively achieve these goals; |
|
|
· |
assisting management in the development of their analyses and pursuit of prudent organic growth strategies; |
|
|
· |
evaluating capital investments to expand geographic reach, increase capacity, or otherwise grow service or product offerings; |
|
|
· |
identifying and working with management to execute attractive acquisition opportunities in their respective sector or industry; and |
|
|
· |
implementing our Six Sigma, lean operations framework across all subsidiaries. |
As part of our business and operating strategy, we may dispose of businesses or assets we own from time to time via sale, liquidation or other means when attractive opportunities arise that outweigh the potential future value we believe such businesses or assets can bring to us. As such, our decision to dispose of businesses or assets is based on our belief that doing so will increase stockholder value.
As an entity seeking to acquire well-performing companies, we compete in a diverse market with a wide spectrum of capital providers, including private equity funds, investment banks, public and private funds, hedge funds, and high net worth individuals and their family offices. Additionally, we compete with operating companies who seek to make acquisitions for strategic purposes. Real Industry’s existing and potential competitors for acquisitions may be larger, may have easier access to financing sources and a greater ability to issue equity capital in the market generally, may have greater technical and marketing resources, may possess industry-specific overlaps with potential targets, and may have longer standing reputations in the marketplace for acquisitions.
Our Segments – RANA and RAEU
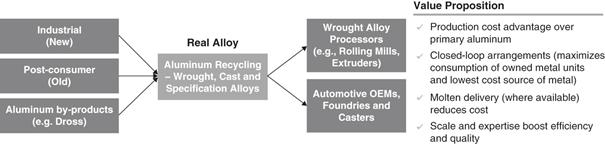
Real Alloy is a global leader in third-party aluminum recycling, which includes the processing of scrap aluminum and by-products and the manufacturing of wrought, cast, and specification or foundry alloys. Real Alloy offers a broad range of products and services to wrought alloy processors, automotive original equipment manufacturers, foundries, and casters. Industries served include automotive, consumer packaging, aerospace, building and construction, steel, and durable goods. Real Alloy delivers recycled metal in liquid or solid form according to customer specifications. Real Alloy’s facilities are capable of processing industrial (new) scrap, post-consumer (old/obsolete) scrap, and various aluminum by-products, giving it a great degree of flexibility in reclaiming high-quality recycled aluminum. Real Alloy currently operates eighteen facilities strategically located throughout North America and six facilities in Germany, Norway, and Wales.
3
Real AlloyWe have two reportable segments, both related to the Real Alloy Business: Real Alloy North America (“RANA”) and Real Alloy Europe (“RAEU”). We are only including the results of operations for these two reportable segments for the period from the acquisition date, February 27, 2015, to December 31, 2015, or approximately ten months, in any performance metric noted as “for the year ended December 31, 2015.”
RANA includes aluminum melting, processing, recycling, and alloying activities conducted in eighteen facilities located in the United States, Canada and Mexico. RANA services customers serving end-uses related to automotive, consumer packaging, construction, transportation, and steel. Approximately 53.8% of RANA’s invoiced sales volume was used in automotive applications in the year ended December 31, 2015. For the year ended December 31, 2015, RANA reported $711.4 million of revenues, representing 62.1% of the Company’s consolidated revenues.
Similar to RANA, RAEU’s operations primarily convert aluminum scrap, dross and other alloying agents, as needed, and deliver the recycled metal in ingot or molten form to customers from six facilities located in Germany, Norway and Wales. RAEU supplies the European automobile industry, which represented approximately 72.0% of this segment’s invoiced sales volume in the year ended December 31, 2015, and other aluminum producers and manufacturers serving other European aluminum industries. For the year ended December 31, 2015, RAEU reported $434.2 million of revenues, representing 37.9% of the Company’s consolidated revenues.
In both RANA and RAEU, Real Alloy conducts business with its customers primarily through tolling arrangements and buy/sell arrangements. Under tolling arrangements, customers pay a fee to convert their own aluminum scrap or by-products into usable recycled metal. Tolling arrangements provide Real Alloy benefits through commodity price risk reduction, earnings stability, and consistent returns on invested capital given the reduced working capital needs associated with tolling. Under buy/sell arrangements, scrap units are purchased in the open market, including from scrap dealers, customers and other producers, and the scrap is processed and sold as wrought or cast alloys to customer specifications. Real Alloy invoiced approximately 375.4 thousand metric tonnes (“kt”) in North America and 176.1 kt in Europe through tolling arrangements, which represented 54.8% of its overall volume for the year ended December 31, 2015, and invoiced approximately 299.9 kt in North America and 155.6 kt in Europe through buy/sell arrangements, which represented 45.2% of its overall volume during the same period. The buy/sell portion of Real Alloy’s business has a much more significant impact on reported revenues and cost of sales compared to tolling arrangements, as the cost of metal is included in both figures.
Real Alloy is a trusted partner in the aluminum recycling industry and has long-standing relationships with a diverse customer base, including many blue-chip multinational companies. Many of Real Alloy’s customers, and all of its top ten customers, have closed-loop arrangements under which customers provide aluminum scrap and by-products generated by their operations, and their scrap and by-products are converted into usable recycled aluminum metal that is returned. Typically, closed-loop arrangements utilize tolling arrangements, though they can also be facilitated through buy/sell arrangements. Closed-loop arrangements benefit customers by enabling them to maximize utilization of their own metal (which is usually their lowest cost alternative), optimize operational efficiencies, and minimize by-product waste. The closed-loop business model also allows Real Alloy to be highly integrated into its customers’ supply chains, further strengthening customer relationships.
Real Alloy’s well-maintained facilities have been equipped with a broad range of pre-processing equipment, such as shredders, dryers and mills, thereby increasing flexibility and enabling it to process multiple grades of scrap and by-products to optimize metal purchases and minimize input costs. Its ability to effectively source and use diverse types of scrap allows Real Alloy to improve business performance. Increased flexibility in raw material input mix improves margins and is expected to help to insulate Real Alloy in periods of unfavorable market conditions while creating significant benefits during upcycles. Additionally, Real Alloy’s centralized purchasing function within each of its operating regions, combined with its broad geographic footprint, allows it to leverage its scale and purchasing expertise to secure the lowest cost aluminum scrap available.
4
With its extensive footprint and strategically located facilities in North America and Europe, Real Alloy effectively and efficiently serves both its global blue-chip customers and its regional and local customers. Most of its operations are located near customers’ facilities, allowing for closed-loop arrangements, as discussed above, and making Real Alloy an integral part of its customers’ supply chain. At twelve facilities, this close proximity allows Real Alloy to deliver “just-in-time” molten metal for direct use in customers’ operations, which differentiates Real Alloy from many of its competitors. In 2015, 41% of Real Alloy’s volume was delivered in molten metal form. This capability is a significant competitive advantage as it enables maximum production efficiency, reduces costs, and reinforces the integrated nature of its customer relationships. With its multi-location operation, aluminum scrap or by-products can be taken from a customer in one location, with recycled metal delivered back to that same customer in a different location and/or as a different alloy.
Real Alloy’s scale, broad geographic footprint across two continents and comprehensive product and service offerings positions it to capitalize on favorable industry trends. Unlike other metals, aluminum is infinitely recyclable without any loss of quality, thus making recycled, or secondary aluminum, just as desirable and usable as primary aluminum. This characteristic, coupled with increasing global demand for aluminum and long-term secular growth in key end-markets, provides a positive macro environment for Real Alloy’s growth plans. According to the Freedonia Group, global aluminum demand is projected to grow 5.4% annually from 2012 to 2022. More specifically, in the automotive sector, which represented approximately 59.8% of Real Alloy’s volumes for the year ended December 31, 2015, aluminum consumption is expected to grow by over 17% annually from 2012 to 2017, largely driven by the “lightweighting” of vehicles to meet new regulatory standards. In addition to growing demand in Real Alloy’s key end-markets, demand for recycled aluminum is expected to grow at a faster rate than primary aluminum production in North America and Europe, which is largely driven by the cost and energy efficiency of recycling aluminum. By 2022, secondary aluminum production is expected to comprise nearly 50% of all aluminum production in North America and Europe.
Real Alloy’s operations were shaped through a series of acquisitions, organic growth, and divestitures over the past 30+ years. Prior to ownership by Real Industry and Aleris, much of the recycling and specification alloys business was part of IMCO Recycling Inc. From 2005 through 2007, Aleris completed purchases of several companies, including Alumitech, Inc. and Wabash Alloys, LLC, to enhance its recycling and specification alloys portfolio.
The financial performance of Real Alloy is determined, in part, by the volume of metal processed and invoiced. Increased production volume will normally result in lower per unit costs, while higher invoiced volumes will normally result in additional revenue and associated margins. A significant component of revenue is derived from the price of aluminum scrap, which is a commodity that changes based on both macro and micro economic supply and demand conditions, and which is generally passed through to customers. Revenues and margin percentages are also subject to fluctuation based on the percentage of customer-owned metal tolled or processed. Increased processing under such tolling agreements results in lower revenues and generally also results in higher gross profit margin and net earnings margin compared to buy/sell arrangements. Tolling agreements reduce exposure to the risk of changing metal prices and working capital requirements. Although tolling agreements are beneficial in these ways, the percentage of Real Alloy’s capacity under these agreements is limited by the amount of metal their customers own and the extent they are willing to enter into such arrangements.
In addition to focusing on tolling relationships and carefully managing the size of its commercial inventory position related to its buy/sell business, Real Alloy also utilizes various derivative financial instruments designed to reduce the impact of changing aluminum prices on these net physical purchases and sales, particularly in its European operations. A portion of its buy/sell business is executed based on published indices, which often do not correlate with an index and, therefore, are not hedged. Real Alloy’s risk management practices reduce, but do not eliminate exposure to changing aluminum prices. While these practices limit exposure to unfavorable aluminum price changes, they also limit Real Alloy’s ability to benefit from favorable price changes.
Margins are impacted by the fees charged to customers to process their metal, by “scrap spreads,” which represents the difference between the purchase price of the aluminum scrap Real Alloy buys and its selling prices, and by conversion costs. Aluminum scrap prices tend to be determined regionally and are typically impacted by supply and demand dynamics. While aluminum scrap prices may trend in a similar direction as primary aluminum prices, the extent of price movements is not highly correlated and can cause unpredictable movements in metal spreads of aluminum scrap versus primary aluminum. Real Alloy’s operations are more significantly impacted by scrap spreads, which they strive to maximize by utilizing all grades of aluminum scrap and optimizing metal blends and plant loadings. Additionally, recycling operations are labor intensive and require a significant amount of energy (primarily natural gas and electricity) to melt aluminum scrap or primary aluminum, which is referred to as “conversion costs.”
5
The third-party aluminum recycling industry is highly fragmented, with a few participants in North America and in Europe operating multiple facilities, and many smaller aluminum recyclers that are single plant, family-owned businesses. We believe Real Alloy is the largest third-party aluminum recycler in both North America and Europe. Historically, Real Alloy has competed effectively because of its extensive global footprint, significant production flexibility, superior range of products and services, operational efficiency and flexibility, knowledgeable and experienced management team, well-invested and strategically located facilities, and operational economies of scale. Real Alloy’s main competitors in North America are Scepter Inc., Smelter Service Corporation, Tennessee Aluminum Processors, Inc., Owl’s Head Alloys Inc., Imperial Aluminum, Superior Aluminum Alloys, LLC, Allied Metal Company, Audubon Metals LLC, Spectro Alloys Corporation, Beck Aluminum Corporation, and Timco, a division of TST Inc. Main competitors in Europe are Oetinger Aluminum, AMAG Austria Metall AG, Raffmetal SpA, Trimet Aluminum, and Befesa. Many of Real Alloy’s customers also recycle their own scrap. In the future, such customers may increase the amount of scrap they recycle, and other customers may recycle their own scrap, in lieu of using third-party recycling services.
Raw Materials and Supplies
The buy/sell portion of Real Alloy’s business requires the purchase of aluminum scrap, primary aluminum, and hardeners. Metallics (primary aluminum metal, aluminum scrap, and aluminum dross) represent the largest component of Real Alloy’s cost of sales. The availability and price of these raw materials depends on a number of factors outside of the control of Real Alloy, including general economic conditions, international demand for metallics and internal recycling activities by primary aluminum producers and other consumers of aluminum. Real Alloy purchases its raw materials from a wide spectrum of aluminum scrap dealers, primary aluminum producers, and other intermediaries. During the year ended December 31, 2015, no supplier provided more than 10% of Real Alloy’s metal purchases. The top ten suppliers represented approximately 22% of total metal purchases in 2015.
Energy Supplies
Real Alloy’s operations are dependent on natural gas and electricity, which represent the third largest component of cost of sales after metal and labor costs. Real Alloy purchases the majority of its natural gas and electricity on a spot-market basis. In an effort to acquire the most favorable energy costs, Real Alloy secures a portion of its natural gas and electricity at fixed price commitments. Real Alloy uses forward contracts, as well as contractual price escalators, and pass through mechanics in customer contracts, to reduce the risks associated with natural gas requirements.
Patents and Other Intellectual Property
Real Alloy holds patents registered in the U.S. and other countries relating to its business. In addition to patents, it also possesses other intellectual property, including trademarks, trade names, know-how, developed technology and trade secrets. Although we believe these intellectual property rights are important to the operations of Real Alloy, we do not consider any single patent, trademark, trade name, know-how, developed technology, trade secret or any group of patents, trademarks, trade names, know-how, developed technology or trade secrets to be material to Real Alloy as a whole.
Seasonality
Demand for certain of Real Alloy’s products can be seasonal, depending on market demand related to its automotive customers and rolling mill customers that serve automotive manufacturers. Additionally, Real Alloy’s margins can be influenced by weather due to its impact on scrap availability. Specifically, in regions subject to freezing temperatures and snowfall, the aluminum scrap supply can become temporarily limited during the winter months, putting pressure on margins.
Employees
As of December 31, 2015, Real Alloy had a total of approximately 1,700 employees, including approximately 1,100 in North America and 600 in Europe. Approximately 21% of our U.S. employees and substantially all of our non-U.S. employees are covered by collective bargaining agreements. We believe employee relations are satisfactory.
6
Real Alloy’s operations are subject to U.S. federal, state, and local, and foreign environmental laws and regulations, which govern, among other things, air emissions, wastewater discharges, the handling, storage, and disposal of hazardous substances and wastes, the investigation or remediation of contaminated sites, and employee health and safety. These laws can impose joint and several liability for releases, or threatened releases, of hazardous substances upon statutorily defined parties, including Real Alloy, regardless of fault or the lawfulness of the original activity or disposal. Given the changing nature of environmental legal requirements, Real Alloy may be required, from time to time, to install additional pollution control equipment, make process changes, or take other environmental control measures at some of its facilities to meet future requirements. Currently, and from time to time, Real Alloy is a party to notices of violation brought by environmental agencies concerning laws governing air emissions.
Our aggregate accrual for environmental matters was $16.0 million as of December 31, 2015, including $4.3 million classified in accrued liabilities in the consolidated balance sheets. See Note 3—Business Combinations and Note 23—Commitments and Contingencies in the notes to consolidated financial statements included in Part IV, Item 15 for additional information about environmental obligations assumed in the Real Alloy Acquisition and environmental matters as of December 31, 2015, respectively.
In addition, we have asset retirement obligations of $5.0 million as of December 31, 2015, for costs related to the future removal of asbestos, ongoing monitoring of landfill closure, and underground storage tanks at various facilities, all of which were assumed in the Real Alloy Acquisition. Asset retirement costs identified after the acquisition date are capitalized as long-lived assets (asset retirement cost), and are amortized over the remaining useful life of the related asset. See Note 2—Financial Statement Presentation and Significant Accounting Policies, Note 3—Business Combinations, and Note 11—Asset Retirement Obligations in the notes to consolidated financial statements included in Part IV, Item15 of this Annual Report for additional information about asset retirement obligations.
The processing of scrap generates solid waste in the form of salt cake and baghouse dust. For RANA, salt cake is further processed for recycling at milling operations or disposed of in landfills. For RAEU, salt cake is processed for recycling, but is not disposed of in landfills. Baghouse dust is disposed of in landfills in North America and in underground deposits in Europe. If salt cake was ever classified as a hazardous waste in the U.S., the costs to manage and dispose of salt cake would increase, which could result in significant increased expenditures.
Financial Information about Geographic Areas
The chief operating decision-maker (“CODM”), our CEO, evaluates Real Alloy largely by geographic area. Our reporting segments of RANA and RAEU have been accordingly created representing the Real Alloy businesses in North America and Europe. See Note 19—Segment and Geographic Information in the notes to consolidated financial statements included in Part IV, Item 15 of this Annual Report for additional information about our segments.
Other Business Units of Corporate and Other
As a holding company, we report the administrative, financial and human resource activities related to the oversight of our business segment and units, implementation of our acquisition strategies, maintenance of our public company status and management of our discontinued operations as “Corporate and Other.” As of December 31, 2015, our corporate staff was comprised of eleven individuals none of which are under a collective bargaining agreement and management believes its relationships are good. The holding company plans to charge its business segments management fees for providing oversight and for certain direct and indirect expenses incurred on their behalf. In the case of Real Alloy, for the ten month period ended December 31, 2015, $2.5 million of management fees were charged. Such charges are excluded from Real Alloy’s Adjusted EBITDA, as management excludes such costs when assessing segment performance.
Corporate and Other also includes the assets, liabilities, and results of operations of operating segments that do not meet the criteria of a reportable segment, generally as a result of the size of the segment, including Cosmedicine, LLC (“Cosmedicine”) and Signature Credit Partners, Inc. (“SCP”). Cosmedicine is a 90.0% owned specialty cosmetics company that re-launched a line of prestige skin care products and regimens, including lotions, crèmes and sunscreen in the second half of 2015. Cosmedicine owns the intellectual property and proprietary product formulations of a line of anti-aging skin care and skin protection products. Cosmedicine reported sales of less than $0.1 million in 2015, which were exclusively through its e-commerce channel. SCP was the primary component of a former reportable segment, Special Situations. As of December 31, 2015, SCP has assets of approximately $1.6 million. Management does not expect to deploy additional capital in SCP and expects to generate less than $0.1 million of revenues annually until the remaining mortgage loans receivable portfolio runs off.
7
Discontinued operations presents the financial condition and results of operations of the businesses and operations of our subsidiary SGGH that have been sold, or have been discontinued, including NABCO and certain of Fremont’s former operations where SGGH is still engaged in various legal proceedings. See “Legal Proceedings” in Note 23—Commitments and Contingencies in the notes to consolidated financial statements in Part IV, Item 15 of this Annual Report for more information about the material legal proceedings in which SGGH is involved, all of which are related to Fremont’s former operations. During the first quarter of 2015, NABCO was sold for a pretax gain of $39.7 million and, as a result of a strategic shift in operations, its results of operations have been reclassified to discontinued operations for all periods presented.
As of December 31, 2015, discontinued operations has $0.3 million of assets and $0.8 million of liabilities. See Note 20—Discontinued Operations for additional information about our discontinued operations.
Available Information: Website Access to Periodic Reports
The following information can be found on Real Industry’s website at www.realindustryinc.com:
|
|
· |
the most recent Annual Report on Form 10-K, Quarterly Reports on Form 10-Q, Current Reports on Form 8-K and amendments to those reports filed or furnished pursuant to Section 13 or 15(d) of the Securities Exchange Act of 1934, as amended (the “Exchange Act”), as soon as reasonably practicable after the reports have been filed with the Commission. Copies of all of Real Industry’s Form 10-Ks, Form 10-Qs and other reports filed with the Commission can also be obtained from the Commission’s website at https://www.sec.gov; |
|
|
· |
information relating to corporate governance at Real Industry, including our Code of Conduct (for directors and all employees, including executive officers), which also complies with the definition of a “code of ethics” set forth in Section 406(c) of the Sarbanes-Oxley Act of 2002, as required by NASDAQ’s corporate governance requirements. We intend to disclose any amendments to or waivers from these governance documents on our Internet website, in lieu of disclosure on Form 8-K in accordance with Item 5.05(c) of Form 8-K; |
|
|
· |
information about membership on Board committees, as well as the charters of standing committees of the Board; and |
|
|
· |
information relating to transactions in Real Industry’s securities by its directors, executive officers and significant stockholders reportable on Forms 3, 4 and 5, and Schedules 13D and 13G. |
The information contained on our Internet website is not incorporated herein.
Additionally, copies of any of this information will be provided, free of charge, upon written request to the Company’s principal executive offices, Real Industry, Inc., Investor Relations, 15301 Ventura Boulevard, Suite 400, Sherman Oaks, California 91403, or by email request to investor.relations@realindustryinc.com. Our telephone number is (805) 435-1255.
Before deciding to purchase, hold or sell our common stock, you should carefully consider the risks described below in addition to other information contained in this Annual Report and in our other filings with the SEC, including our subsequent reports on Forms 10-Q and 8-K. The risks and uncertainties described below are in addition to risks that apply to most businesses and are not the only ones we face. The order in which the risks appear is not intended as an indication of their relative weight, likelihood or importance. Additional risks and uncertainties that are not presently known to us or that we currently deem immaterial may also affect our business. If any of these known or unknown risks or uncertainties actually occurs, our business, financial condition, results of operations and/or liquidity could be materially and adversely affected. In that event, the market price for our common stock will likely decline and you may lose all or part of your investment.
Risks Related to the Real Alloy Acquisition and the Financings
Following the consummation of the Real Alloy Acquisition, we and Real Alloy have and continue to incur significant cost, time, effort, and attention on integration and the development of necessary support related to its carve-out from Aleris. These may hinder our ability to realize the expected benefits of the Real Alloy Acquisition. We are a holding company and Real Alloy represents a significantly larger operating business than any other business owned by Real Industry. Real Alloy operated substantially on a stand-alone basis from Aleris and maintained its own sales, marketing, product development, manufacturing, and other administrative teams; however, it did receive support from Aleris with respect to legal, purchasing, information technology (“IT”), tax, and certain other financial and operating services such as human resources (“HR”), insurance, and treasury services.
8
While we are operating Real Alloy predominantly as a stand-alone business with substantially the same organizational structure, operations, management team, employees, and locations as were present prior to the Real Alloy Acquisition, the success of the Real Alloy Acquisition will substantially depend on our ability to integrate Real Alloy into Real Industry and support its business needs, as well as effectively manage this significantly larger business. Challenges may include: i) integrating Real Alloy into our accounting and financial reporting system and functions; ii) developing, adapting and maintaining operating and administrative support systems historically provided by Aleris on which Real Alloy has relied, including legal, purchasing, IT, tax, HR, insurance, and treasury services; and iii) Real Alloy’s ability to adapt to our policies, procedures and support systems, including internal controls.
The incorporation of, and development of the necessary support for, Real Alloy could be a lengthy process, requiring substantial expenditures by Real Industry, as well as significant time, effort and attention from the management teams and key employees of both Real Industry and Real Alloy. Such demands could divert needed resources from both businesses. Further, these challenges could result in the loss of key employees, disruption of the ongoing businesses and relationships with customers, suppliers and other third-parties, diversion of management and corporate attention to integration issues, tax costs and inefficiencies, and inconsistencies in standards, controls, IT systems, accounting systems, procedures, policies, Sarbanes-Oxley controls, and other administrative systems. If any of these factors limit our ability to integrate Real Alloy successfully or on a timely basis, we may not achieve the strategic, operational, financial, and other benefits anticipated to result from the Real Alloy Acquisition to the fullest extent, on a timely basis or at all.
For a period following the closing of the Real Alloy Acquisition, we and Real Alloy will be subject to business uncertainties that could adversely affect our and their businesses. Delays in integrating the business could exacerbate these uncertainties and have adverse effects. Uncertainties about the effect of the Real Alloy Acquisition on the employees and customers of both Real Industry and Real Alloy may have an adverse effect on Real Alloy and, consequently, us. Although we and Real Alloy have taken, and continue to take, steps to reduce the potential adverse effects during the integration period, these uncertainties may impair our and Real Alloy’s ability to attract, retain and motivate key personnel. These uncertainties could cause customers, suppliers and others that deal with Real Alloy, and to a lesser degree, our business, to seek to change their existing business relationships. Alternatively, it could cause third-parties who are considering doing business with us or Real Alloy to delay taking action until the Real Alloy Acquisition is fully integrated. Employee retention could be reduced during the integration of the Real Alloy Acquisition, as employees of Real Industry or Real Alloy may experience uncertainty about their future duties or roles. If, despite retention and business partner management efforts, we or Real Alloy lose key employees or customer/supplier relationships because of concerns relating to the uncertainty and difficulty of the integration process or a desire not to remain with Real Industry or Real Alloy, the business, operations, prospects and financial results of the Company could be harmed.
With the completion of the Real Alloy Acquisition, we operate a substantially larger entity in an industry and at locations in which we have not operated, and we are subject to additional regulations, risks and uncertainties that we have not previously faced. These could exceed our expectations and have a negative impact on our financial condition and results of operations. Following the consummation of the Real Alloy Acquisition, the size of the Company and our primary operating segments have changed substantially compared with our previous operations. As a result, any risk or uncertainty that is significant to Real Alloy, including those discussed below under “Risks Related to Real Alloy,” will also be significant to us and could have a negative effect on our financial condition and results of operations.
If Real Alloy is unable to maintain compliance with U.S. federal, state, and local, and foreign regulatory requirements, we could incur substantial costs, including fines, civil penalties, and criminal sanctions or costs associated with upgrades to improve facilities or changes in manufacturing processes in order to achieve and maintain regulatory compliance. While we intend to operate Real Alloy largely as a stand-alone business, our results of operations, financial condition and stock price will largely depend on Real Alloy’s ability to handle its business risks and uncertainties. These risks and uncertainties may exceed our expectations, and it may take time for us to mitigate them.
The market price of our common stock has been volatile, may continue to be volatile, and may be affected by factors different from those affecting our shares prior to the Real Alloy Acquisition. The market price of our common stock has experienced, and may continue to experience, significant volatility. During 2015, our stock price ranged from $5.90 to $13.50. Our previous businesses differ significantly from Real Alloy in several ways, including size, industry, geographic area, and applicable regulations. As a result, the results of operations following the Real Alloy Acquisition and the market price of our shares of common stock may be affected by factors different from those previously affecting our results of operations prior to the Real Alloy Acquisition. In addition, the Company conducted multiple offerings of common stock as part of the Financings, for the Real Alloy Acquisition and general corporate purposes, which may have depressed the market price of our common stock as a result of dilution. The Company may conduct further offerings in the future, and any additional equity offering could dilute our stockholders’ ownership in the Company.
9
The Real Alloy Acquisition may not be accretive to earnings and if not accretive, may cause dilution to our earnings per share. We currently anticipate that the Real Alloy Acquisition will be accretive to our earnings in 2016. This expectation is based on our preliminary estimates, which may change materially. We may encounter additional or unforeseen transaction and integration-related costs, or we may fail to realize all of the anticipated benefits of the Real Alloy Acquisition. Any of these factors could cause a decrease in our earnings per share or decrease or delay the expected accretive effect of the Real Alloy Acquisition and contribute to a decrease in the price of our common stock.
The Real Alloy Acquisition may expose us to unknown or contingent liabilities for which we will not be adequately indemnified. The entities acquired in the Real Alloy Acquisition may have unknown or contingent liabilities, including liabilities for failure to comply with environmental and other laws and regulations, and for litigation or other claims. While the Real Alloy purchase agreement includes indemnification provisions, the total amount of indemnification related to breaches of representations, warranties and covenants is generally capped at $67.0 million, excluding breaches of certain fundamental representations, and representations relating to taxes and Title IV of ERISA, and, generally, Aleris is not obligated to indemnify us until the aggregate amount of all losses exceeds $3 million. However, certain scheduled environmental matters are subject to a deductible of approximately $23.9 million. Based on these provisions we may incur material liabilities for the past activities of Real Alloy. Such liabilities and related legal or other costs and/or resulting reputational damage could negatively impact our business, financial condition and results of operations.
We have issued $25.0 million in Redeemable Preferred Stock to Aleris as partial consideration in the Real Alloy Acquisition, which shares have superior rights to our common stock. In connection with the Real Alloy Acquisition, we issued $25.0 million of newly created Redeemable Preferred Stock to Aleris to be held in an escrow to secure Aleris’ indemnification obligations under the Real Alloy purchase agreement. The Redeemable Preferred Stock could have a material impact on the rights of our common stockholders in terms of dividends, repurchases and redemptions by, or in the event of a liquidation of, the Company.
We will pay quarterly dividends on the Redeemable Preferred Stock, increasing from 7% for the first eighteen months after the issue date, to 8% for the next twelve months, to 9% thereafter, with dividends payable in kind for the first two years, and thereafter in cash. Other than dividends or distributions payable on our common stock in shares of common stock, the Redeemable Preferred Stock ranks superior to our common stock in the payment of accrued and accumulated dividends, declaration and payment of new dividends and distributions, and making of redemptions. In addition, without the consent of the holders of a majority of the Redeemable Preferred Stock, we are prohibited from paying dividends on our common stock until February 27, 2017.
The Redeemable Preferred Stock generally has no voting rights, except, among other customary matters, for any merger (unless the Redeemable Preferred Stock remains outstanding or is purchased at the liquidation preference), for any acquisition valued at more than 5% of the consolidated assets of the Company (so long as at least $10.0 million in aggregate principal amount of Redeemable Preferred Stock remain outstanding), or (until February 27, 2017) for the declaration or payment of cash dividends on common stock or generally the purchase, redemption or acquisition of common stock.
Our debt agreements as of December 31, 2015 and future debt financing arrangements into which we or our subsidiaries may otherwise enter, may contain various covenants that limit our ability to take certain actions and also require us to meet financial maintenance tests. Failure of these tests or to comply with these limits could have a material adverse effect on our operations, business and financial results. As of December 31, 2015, we had approximately $331.1 million of indebtedness outstanding, which was entirely related to Real Alloy. Further, Real Alloy has additional borrowing capacity under the Asset-Based Facility and Factoring Facility. Interest costs related to this indebtedness, together with the dividends on the Redeemable Preferred Stock, will be substantial. The Senior Secured Notes, the Asset-Based Facility, the Factoring Facility and the Redeemable Preferred Stock, and the instruments governing our other future indebtedness contain, or may contain, certain customary restrictions, covenants, provisions for mandatory repayment upon the occurrence of certain events, and provisions for events of default that will require us or Real Alloy to satisfy certain financial tests and maintain certain financial ratios, restrict our or Real Alloy’s ability to engage in specified types of transactions, and otherwise limit the distributions of funds from Real Alloy to us. This overall leverage and the terms of our financing arrangements could:
|
|
· |
limit the ability to pay dividends, especially from Real Alloy, and future subsidiaries, to us; |
|
|
· |
make it more difficult to satisfy obligations under the terms of this indebtedness; |
|
|
· |
limit the ability to refinance this indebtedness on terms acceptable to Real Alloy, us, or at all; |
|
|
· |
limit the flexibility to plan for and adjust to changing business and market conditions in the industries in which we or Real Alloy operate and increase the vulnerability to general adverse economic and industry conditions; |
10
|
|
· |
restrict sales of key assets; |
|
|
· |
limit the ability to substantially change our business or enter into new lines of business; |
|
|
· |
limit the ability to obtain additional financing for working capital, to fund growth or acquisitions or for general corporate purposes, even when necessary to maintain adequate liquidity, particularly if any ratings assigned to our debt securities by rating organizations were revised downward; or |
|
|
· |
cause a competitive disadvantage and may reduce our flexibility in responding to increased competition. |
In addition, the restrictive covenants in the Senior Secured Notes and Asset-Based Facility and certain other indebtedness require us or could require us to maintain specified financial ratios and satisfy other financial conditions and tests. Our ability to meet those financial ratios, conditions and tests will depend on our ongoing financial and operating performance, which, in turn, will be subject to economic conditions and to financial, market, and competitive factors, many of which are beyond our control. A breach of any of these covenants could result in a default under the instruments governing our indebtedness.
With respect to the Real Alloy Acquisition, challenges with integration, the industry, operations and other business, market and acquisition-related risks, as well as various uncertainties and events beyond our control, could affect our ability to comply with such restrictions and covenants. Failure to comply with any of the restrictions and covenants in our existing or future financing arrangements could result in a default under those arrangements and under other arrangements containing cross-default provisions.
Upon the occurrence of an event of default under any such financing arrangement, the relevant lenders could assess increased interest rates, accelerate the maturity of the debt or foreclose upon any collateral securing the debt. In this event, we may lack sufficient funds or other resources to satisfy all of our obligations. In addition, any limitations imposed by financing agreements on our ability to incur additional debt or to take other actions could significantly impair our ability to obtain other financing.
Risks Related to Real Industry as a Holding Company
Our financial condition and results of operations will depend on our ability to acquire and integrate businesses that perform and meet expectations after closing. A key element of our business strategy involves the acquisition and integration of profitable operating businesses. We may experience challenges identifying, financing, consummating and integrating such acquisitions. Competition exists in the market for the acquisition of profitable operating companies. We may not be able to find suitable acquisition opportunities that are available at attractive valuations, if at all. Even if we do find suitable acquisition opportunities, we may not be able to consummate the acquisitions on commercially acceptable terms, as suitable financing arrangements may not be available on acceptable terms, on a timely basis, or at all.
Even if we are successful in completing additional acquisitions, these could require significant investments of capital, management attention, and integration effort. We may also encounter difficulties in assimilating and integrating the operations, personnel, technologies, products, and information systems of acquired companies, and retaining key personnel. We may also incur significant goodwill impairment charges in the future. Acquisitions could disrupt relationships with existing customers, suppliers, and strategic partners of the newly acquired entities and may create other contractual, intellectual property, or employment issues. The acquisition of another company or business may also require us to enter into a business or geographic market in which we have little or no prior experience. These challenges could disrupt our ongoing business, distract our management and employees, harm our reputation and increase our operating costs, and these challenges could be magnified as the size of the acquisition increases.
There can be no assurance that we will be able to consummate any future acquisitions or that, if consummated, we will realize the benefits anticipated from these acquisitions. Even if we are able to grow and build our operations, any failure to manage our growth effectively could have a material adverse effect on our business, financial condition, results of operations and prospects.
11
We have experienced substantial losses from continuing operations in recent years and may experience losses in the future. Although we reported net earnings for the year ended December 31, 2014, primarily as a result of NABCO’s operations, for the years ended December 31, 2015, 2014, 2013, 2012 and 2011, we reported losses from continuing operations of $31.7 million, $0.1 million, $14.2 million, $7.4 million and $9.9 million, respectively. Since emerging from Bankruptcy Proceedings in 2010, we have continued to have significant operating costs at corporate, including compensation, legal, professional and other outside services expenses, occupancy, and other general and administrative expenses. While we believe we made significant progress in reducing our operating costs at corporate since summer 2013, following the sale of NABCO and the consummation of the Real Alloy Acquisition, the nature of our operations and our operating costs have changed significantly. Therefore, we may experience operating losses and net losses in the future, which could make it difficult to fund our operations, finance acquisitions and achieve our business plan, any of which could cause the market price of our common stock to decline.
Our ability to use our U.S. NOLs to offset future U.S. taxable income may be limited as a result of past events, the Financings, the Real Alloy Acquisition or other financings, or as the result of future acquisitions or other issuances or transfers of our common stock. As of December 31, 2015, we reported U.S. NOLs of approximately $871.8 million, which will begin to expire if not used before the tax year ending December 31, 2027. For accounting purposes, a valuation allowance is required to reduce our potential deferred tax assets if it is determined that it is more likely than not that all or some portion of such assets will not be realized due to the lack of sufficient taxable income. As a result of uncertainties about the timing and amount of future U.S. taxable income, we have a full valuation allowance of $382.4 million recorded against our deferred tax assets as of December 31, 2015, and expect to continually review and evaluate the valuation allowance in future periods.
Our ability to fully utilize our existing U.S. NOLs could be limited or eliminated as a result of changes in U.S. federal tax laws and regulations or should we: i) be found by the Internal Revenue Service (“IRS”) to not be able to avail ourselves of Section 382(l)(5) of the Tax Code in connection with the Plan of Reorganization; ii) undergo an “ownership change” as described under Section 382 of the Tax Code; iii) be deemed to have abandoned an active business; or iv) not return to profitability or be only marginally profitable in the future.
Although we cannot assure you that the IRS will agree with our position, we believe that, as of Fremont’s emergence from Bankruptcy Proceedings, Signature Nevada, its successor, and after the Reincorporation in 2014, Real Industry as successor in interest to Signature Delaware has met the criteria under Section 382(l)(5) of the Tax Code to be able to utilize its U.S. NOLs to offset future taxable income, if any.
Our ability to utilize our U.S. NOLs, however, will be subject to significant limitation for U.S. federal income tax purposes if the Company undergoes an “ownership change” as defined in Section 382 of the Tax Code. For this purpose, an “ownership change” is generally defined as greater than a 50% change in equity ownership by value, over a rolling three-year period. We may experience an ownership change in the future as a result of changes in our common stock ownership, which would result in a limitation on our ability to utilize our U.S. NOLs. Separately, any changes to tax rules or the interpretation of tax rules could negatively impact our ability to recognize benefits from our U.S. NOLs.
While there is no guarantee that the IRS will agree with our position, we believe that the Financings and the Real Alloy Acquisition did not result in an ownership change for purposes of Section 382 of the Tax Code. The Company received an opinion letter (the “Section 382 Opinion Letter”) from its U.S. tax counsel, Blank Rome LLP, substantially to the effect that the Financings and Real Alloy Acquisition should not result in an “ownership change” for U.S. federal income tax purposes and that the Company may use its U.S. NOLs to offset future U.S. taxable income generated by Real Alloy. The Section 382 Opinion Letter is restricted to the precise terms described therein and the Company or its stockholders may engage in subsequent transactions that would result in an “ownership change.” Additionally, the Company adopted the Tax Benefit Preservation Provision in order to protect stockholder value by preserving our U.S. NOLs. There is no guarantee, however, that the Tax Benefit Preservation Provision will be effective in protecting our U.S. NOLs and other tax assets.
The amount of our U.S. NOLs has not been audited or otherwise validated by the IRS. The IRS could challenge the amount of our U.S. NOLs and other tax assets, which could result in an increase in our liability for income taxes in the future. Further, our U.S. NOLs only have value to the extent we generate U.S. taxable income. If we are unable to generate U.S. taxable income prior to the expiration of the U.S. NOLs, or if we are only marginally profitable during such period, we will be limited in our ability to utilize the tax benefits related to our U.S. NOLs. There can be no assurance that we will have sufficient U.S. taxable income to be able to utilize our U.S. NOLs prior to their expiration. Finally, the use of U.S. NOLs is subject to various tax laws and regulations and the changes in such or the interpretations thereof.
12
Funding for our future acquisitions and operations could increase our liabilities, trigger negative tax consequences or dilute, or rank preferentially to, our stockholders. We intend to fund any future acquisition through a mix of our available cash, the sale of equity securities in private placements or in registered offerings under our Shelf Registration Statement declared effective on October 21, 2015, rights offerings to existing stockholders, and debt financings. Utilizing these funding sources can result in increased debt or contingent liabilities, adverse tax consequences or substantial capital commitments. Any of these events could negatively impact our financial condition and results of operations and could cause the price of our common stock to decline.
We currently have 9,235,000 shares of blank check preferred stock available for issuance and $700.0 million of securities available for issuance under the Shelf Registration Statement. In order to fund our future operations or acquisitions, we may sell equity securities or convertible debt securities, which securities could have rights, preferences and privileges senior to our existing stockholders. In such event, future security holders could be entitled to dividends, liquidation or other transaction preferences, or voting rights that are not provided to our existing common stockholders. Further, with or without preferential terms, future issuances of securities could result in dilution to our stockholders.
Pending legal proceedings and other contingent liabilities may impact our financial condition and results of operations, lowering our stock price, and limiting our ability to use our common stock as consideration in future transactions. Our subsidiary, SGGH, is subject to a number of lawsuits seeking monetary damages or injunctive relief and it has potential other contingent liabilities, including repurchase claims, which relate to Fremont’s prior businesses and are presented in discontinued operations. For a summary of our material legal proceedings, see “Legal Proceedings” in Note 23—Commitments and Contingencies in the notes to consolidated financial statements, included in Part IV, Item 15 of this Annual Report. Additional litigation may be filed against us, or our subsidiaries, or disputes may arise in the future concerning matters involving the discontinued operations. We and SGGH have been and intend to continue to vigorously defend ourselves in all legal proceedings in which we are involved, however, the outcome of litigation and other legal matters is always uncertain and could materially adversely affect our liquidity, financial condition and results of operations. Furthermore, the costs to defend SGGH or the Company in these matters may be significant. In turn, these could have a material impact on the price of our common stock, which may limit our ability to utilize our common stock as consideration for potential future acquisitions and other transactions in which we may engage.
SGGH has received repurchase claims relating to certain residential mortgage loans sold by our discontinued operations, and may receive additional claims in the future that, unless withdrawn or settled within the limits of the established repurchase reserve, could adversely affect our financial condition and results of operations. As of December 31, 2015, SGGH had $101.7 million of outstanding repurchase claims associated with claims of breaches of certain representations and warranties related to the residential real estate loans sold by Fremont Investment & Loan (“FIL”). SGGH maintains a repurchase reserve for the estimated losses it may experience from repurchase claims, based on the representations and warranties FIL provided to counterparties that purchased the residential real estate loans, largely from 2002 through 2007. While management believes the $0.7 million repurchase reserve liability is sufficient as of December 31, 2015, the reserve is subjective and is based on management’s current expectations based on facts currently known. For example, based on the ACE Securities Case (as defined herein), management reduced the repurchase reserve by $4.8 million in 2015. See Note 20—Discontinued Operations in the notes to consolidated financial statements included in Part IV, Item 15 of this Annual Report for additional information about the repurchase reserve.
Although the last mortgage loan purchase agreement was executed in mid-2007, there is no certainty that other claims will not also be asserted against SGGH or us. Changing or new facts and circumstances could cause us to increase the repurchase reserve in future periods or may cause us to experience losses in excess of the repurchase reserve liability. Any material increase in, or change in the nature of, repurchase claim activity and payout amounts, the repurchase reserve, or changes in our ability to object to, defend or settle such claims, could have a material adverse effect on our financial condition and results of operations. See “Critical Accounting Policies” in Part II, Item 7 of this Annual Report for additional information related to our repurchase reserve.
13
SGGH is subject to residential mortgage-backed securities defense, indemnity and contribution claims. In connection with residential mortgage-backed securities offerings (“RMBS Offerings”) involving loans originated by FIL, either or both of FIL and its subsidiary entered into mortgage loan purchase agreements, underwriting agreements, and indemnification and contribution agreements, which contained various representations and warranties relating to the loans. Investment banks involved in these RMBS Offerings have been sued in a number of actions concerning their activities related to subprime mortgages (“RMBS Actions”), where neither FIL, nor its subsidiary, are a named defendant. FIL and its subsidiary have received demands for defense, indemnity and contribution from defendants in various RMBS Actions. Each of these demands has been rejected as we believe the demanding parties are being sued for conduct not chargeable to FIL or its subsidiary. There is no assurance that FIL or its subsidiary will not be named as a defendant in additional RMBS Actions or receive additional demands for defense, indemnity and contribution. We intend to vigorously defend any claims seeking defense, indemnity or contribution, but we cannot presently predict whether such claims will be pursued or what the outcome would be. However, if the investment banks suffer losses in connection with RMBS Actions and successfully pursue claims against FIL, its subsidiary or SGGH, this could have a material adverse effect on our consolidated financial position, results of operations and cash flows.
We depend on key personnel to achieve our business and strategic objectives. We depend on the members of our senior management team, particularly Craig Bouchard, Kyle Ross and John Miller, to execute our business plan and strategy and to manage our business and day-to-day operations, including identifying, structuring, closing and monitoring business acquisitions. These members of our senior management team have critical industry experience and relationships that we rely upon to implement our business plan. If we lose the services of one or more of these individuals, it may take us significant time, effort and cost to identify and hire suitable executives with the appropriate experience and expertise to join the Company, and in the meantime, we may not be able to operate our business or identify and manage our business as we planned. As a result, our ability to compete could be harmed. All of these consequences could have a material adverse effect on our business, financial condition and results of operations.
We have continuing indemnity obligations in connection with the NABCO Sale. In connection with the sale of NABCO, we and SGGH each have customary indemnification obligations related to our representations, warranties, covenants and other obligations. While the indemnification is capped at an aggregate of $7.8 million for breaches of most representations and warranties, other indemnification obligations are not limited. Should a significant claim arise, we could be required to pay a material amount of our available cash to fund or address any such indemnified liability, including the costs of negotiating or defending claims from the purchasers of NABCO or third-parties and the final costs of the underlying liability.
Our operations may not perform as expected and we may not realize full value for assets we sell. Based on any number of factors, our operations may not perform as expected. As a result, we may from time to time decide to sell operating subsidiaries or assets. As discussed above, we sold NABCO on January 9, 2015, but there can be no assurance that we will be successful in completing any such future transactions. If such a transaction is completed, it may reduce the size of our business. There is also no assurance that we will receive adequate consideration in the disposition of any operating subsidiary or asset. As a result, our future disposition of operating subsidiaries or assets could have a material adverse effect on our business, financial condition, and results of operations.
As of December 31, 2015, we reported a material weakness in our internal control over financial reporting. If we fail to remediate this material weakness or experience other material weaknesses in our system of internal control, we may not be able to report our financial results accurately or on a timely basis and may not be able to detect fraud, any of which could materially and adversely affect our business and our common stock price. As disclosed in our quarterly report on Form 10-Q for the period ended June 30, 2015, our CEO and chief financial officer (“CFO”) identified a material weakness in our internal control over financial reporting. The identified material weakness pertains to control deficiencies in our financial close process, specifically accounting for the Real Alloy Acquisition, including the lack of effective oversight and review of various analyses and reconciliations, and the inability to meet external financial reporting deadlines. The material weakness was caused by the significant level of activity related to accounting for the Real Alloy Acquisition, the integration of the Real Alloy Business, a manual consolidation process, and the complexity of the Real Alloy Acquisition and the associated purchase accounting.
Also as described in our quarterly reports on Form 10-Q for the periods ended June 30, 2015 and September 30, 2015, and as discussed in Item 9A “Controls and Procedures,” we have taken steps to remediate a number of the aspects of this material weakness; however, our CEO and CFO have concluded that our disclosure controls and procedures were not effective as of December 31, 2015, as our process to account for the Real Alloy Acquisition, a 2015 event, was not remediated by year-end.
Notwithstanding the material weakness, our CEO and CFO have concluded that the unaudited condensed consolidated financial statements included in this Annual Report present fairly, in all material respects, our financial position, results of operations and cash flows for the periods presented in conformity with GAAP.
14
If we fail to maintain or enhance our internal control over financial reporting or fail to properly maintain an effective system of internal control over financial reporting, we may be unable to detect fraud or to report our financial results accurately and on a timely basis. The existence of any such deficiencies and/or weaknesses, even if cured, could also lead to the loss of investor confidence in the reliability of our financial statements, which could negatively impact the price of our common stock. Such deficiencies or material weaknesses may also subject us to lawsuits, investigations and other penalties.
In addition, our business strategy contemplates the acquisition of businesses and the operation of subsidiaries whose financial results will be consolidated into our financial statements and reporting. We have a lean operations staff that we believe is appropriate for our current business, but this environment could result in future challenges with our business combination process like we have experienced with the Real Alloy Acquisition. Additionally, as a result of these business activities and our future growth, the scope of our internal control over financial reporting will have to expand, which may subject us to increased internal control risks, especially as new businesses are integrated into our processes. Effective internal control over financial reporting must be established and maintained in connection with these acquisitions, if any, in order for us to produce accurate and timely financial reports. Failure to do so would result in our inability to report our financial results accurately and on a timely basis, and possibly lead to other deficiencies, which would likely have a negative impact on the market value of our common stock.
Furthermore, Section 404 of the Sarbanes-Oxley Act currently requires us to evaluate the effectiveness of our internal control over financial reporting at the end of each fiscal year and to include a management report assessing the effectiveness of our internal control over financial reporting in our Annual Report. We are also subject to the auditor attestation requirement under Section 404(b) of the Sarbanes-Oxley Act. We may not be able to complete the work required for such attestations on a timely basis and, even if we timely complete such requirements, we cannot assure you that our independent registered public accounting firm will conclude that our internal control over financial reporting is effective. The inability to obtain such attestation could lead to the loss of investor confidence in the reliability of our financial statements, which could negatively impact the price of our common stock and may impair our ability to raise capital under our Shelf Registration Statement.
We may not obtain the expected benefits of the Reincorporation, from a Nevada corporation to a Delaware corporation. We completed the Reincorporation to take advantage of the benefits of Delaware law and provide us with additional flexibility as we pursue our goal of growth through acquisitions. These expected benefits may not be obtained if we fail to complete acquisitions or if market conditions or other circumstances prevent us from taking advantage of the strategic, business and financing flexibility that it affords us. In addition, our holding company structure may not keep the assets and liabilities of the Company and any new businesses we acquire legally separate. As a result, we may have incurred the costs of implementing the Reincorporation without realizing the possible benefits. These costs include the increased administrative costs and expenses associated with keeping separate records, and in some cases making separate regulatory filings for the Company and SGGH.
As a holding company, Real Industry depends in large part on funding from its operating subsidiaries. Real Industry is a holding company with no current business operations of its own. Until it has either formed or acquired other companies, its only significant assets are its cash and interests in its subsidiaries. As a result, we may rely on funding from our operating subsidiaries to meet our obligations. If our subsidiaries need to retain their funds to meet their financial obligations or experience other restrictions on their ability to fund Real Industry, that may limit Real Industry’s access to funds and ability to pursue its acquisition strategy or other strategic objectives.
15
Our data and information systems and network infrastructure may be subject to hacking or other cyber-security threats, giving unauthorized persons access to, and the ability to misappropriate, our customer data, and proprietary business information. In our operations, we store and transmit our proprietary information and that of our customers. We have offices, operations and employees in various locations throughout the United States, and following the Real Alloy Acquisition, considerably more locations in the United States, Europe, Canada and Mexico. Our operations are dependent upon the connectivity and continuity of our facilities and operations. Despite our security measures, our information systems and network infrastructure may be vulnerable to cyber-attacks or could be breached due to an employee error or other disruption that could result in unauthorized disclosure of sensitive information that has the potential to significantly interfere with our business operations. Breaches of our security measures could expose us to a risk of loss or misuse of this information, litigation, and potential liability. Since techniques used to obtain unauthorized access or to sabotage information systems change frequently and generally are not recognized until launched against a target, we may be unable to anticipate these techniques or to implement adequate preventive measures in advance of such an attack on our systems. In addition, vendors that use cyber or “cloud” storage of information as part of their service or product offerings, despite our attempts to validate the security of such services, our proprietary information may be misappropriated by third-parties. In the event of an actual or perceived breach of our security, or the security of one of our vendors, the market perception of the effectiveness of our security measures and our attractiveness as a business partner could be harmed and we could suffer damage to our reputation or our business, or lose existing customers and lose our ability to obtain new customers. Additionally, misappropriation of our proprietary business information could prove competitively harmful to our business.
Changes in, and compliance with, laws or regulations governing our operations may adversely affect our business or cause us to alter our business strategy. We are subject to regulation at the U.S. federal, state and local, and foreign level, as may be any entity we acquire. Further, new legislation may be enacted or new interpretations, rulings or regulations could be adopted, potentially with retroactive effect, any of which could harm us, our operations, our plans and our stockholders. Changes to laws and regulations may cause us to alter our business strategy in order to avail ourselves of new or different opportunities. Such changes could result in material differences in the strategies and plans set forth in this Annual Report. Thus, any such changes, if they occur, could have a material adverse effect on our financial condition and results of operations. In addition, our inability to comply with the U.S. federal, state and local, and foreign statutes and regulations in the business segments, geographic regions and jurisdictions in which we operate could have a material adverse impact on our financial condition, results of operations and our stock price.
Risks Related to Real Alloy
The cyclical nature of the metals industry, Real Alloy’s end-use segments, and the industries of Real Alloy’s customers could limit operating flexibility and could negatively affect Real Alloy’s financial condition and results of operations. The metals industry is generally cyclical in nature. It tends to reflect and be amplified by changes in general macro and local economic conditions. These conditions include, but are not limited to, the level of economic growth, financing availability, the availability of affordable energy sources, employment levels, interest rates, consumer confidence, and demand for automobiles and housing. Historically, in periods of recession or periods of minimal economic growth, metals companies have tended to underperform other sectors. Real Alloy is particularly sensitive to trends in the automobile industry, which can be seasonal, highly cyclical, and dependent upon general economic conditions. For example, during recessions or periods of low growth, the automobile industry typically experiences major cutbacks in production, resulting in decreased demand for inputs such as aluminum. This may lead to significant fluctuations in demand and pricing for Real Alloy’s products and services. Because Real Alloy generally has certain fixed costs, its near-term profitability can be significantly affected by decreased processing volume. Accordingly, reduced demand and pricing pressures may significantly reduce its profitability and adversely affect its financial condition. Economic downturns in regional and global economies or a prolonged recession in its principal industry segments have had a negative impact on the operations of Real Alloy and could have a negative impact on Real Alloy’s future financial condition or results of operations. In addition, global economic and commodity trends have been increasingly correlated in recent years. Although Real Alloy will continue to seek to diversify its business on a geographic and industry end-use basis, there can be no assurance that diversification will significantly mitigate the effect of cyclical downturns.
Changes in the market price of aluminum scrap impact the selling prices of Real Alloy’s products and the margins it earns from selling its products and services. Market prices are dependent upon supply and demand and a variety of factors over which Real Alloy has minimal or no control, including:
|
|
· |
regional and global economic conditions; |
|
|
· |
availability and relative pricing of metal substitutes; |
|
|
· |
labor costs; |
|
|
· |
energy prices; |
|
|
· |
environmental and conservation regulations; |
16
|
|
· |
import and export levels and/or restrictions. |
Real Alloy requires substantial amounts of capital to operate; failure to maintain sufficient liquidity will have a material adverse effect on its financial condition and results of operations. Real Alloy requires substantial amounts of capital to operate and its liquidity can be adversely affected by a number of factors outside its control. Fluctuations in aluminum prices may result in increased cash costs for aluminum scrap and increase working capital needs. In addition, if aluminum price movements result in a negative valuation of current financial derivative positions, counterparties may require the posting of cash collateral. Furthermore, in an environment of falling aluminum prices, the borrowing base and availability under Real Alloy’s then-current borrowing facilities may shrink and constrain Real Alloy’s liquidity.
Real Alloy requires substantial capital investments that it may be unable to fulfill. The operations of Real Alloy are capital intensive. Under Aleris, total capital expenditures were $60.5 million, $55.7 million, $37.4 million and $31.9 million for the years ended December 31, 2011, 2012, 2013 and 2014, respectively. In 2015, the amount was approximately $34.2 million, of which $26.0 million was spent under Real Industry’s ownership. Real Alloy may not generate sufficient operating cash flows and its external financing sources may not be available in amounts sufficient to enable it to make anticipated capital expenditures, service or refinance indebtedness or fund other liquidity needs. If Real Alloy is unable to make upgrades or purchase new equipment, its financial condition and results of operations could be affected by higher maintenance costs, lower sales volumes due to the impact of reduced product quality, and other competitive influences.
The loss of certain members of the management team of Real Alloy may have an adverse effect on its operating results. The success of Real Alloy will depend, in part, on the efforts of senior management and other key employees. These individuals possess sales, marketing, engineering, manufacturing, financial, and administrative skills that are critical to the operation of its business. If Real Alloy loses or suffers an extended interruption in the services of one or more of its senior officers, its financial condition and results of operations may be negatively affected. Moreover, the pool of qualified individuals may be highly competitive and Real Alloy may not be able to attract and retain qualified personnel to replace or succeed members of senior management or other key employees, should the need arise.
Real Alloy may be unable to effectively manage its exposure to commodity price fluctuations, and its hedging activities may affect profitability in a changing metals price environment and subject its earnings to greater volatility from period-to-period. Significant increases in the price of primary aluminum, aluminum scrap, alloys, hardeners, commodity inputs, or energy would cause the cost of sales for Real Alloy to increase significantly and, if not offset by product price increases, would negatively affect its financial condition and results of operations. Real Alloy is a substantial consumer of raw materials, and by far the largest input cost in producing its goods is the cost of aluminum and aluminum scrap. In the case of buy/sell arrangements, customers pay for products based on the indexed prices or based on a fixed price. Under tolling arrangements, customers pay Real Alloy a processing fee. In general, Real Alloy uses these pricing mechanisms to pass changes in the price of aluminum and aluminum scrap, and, sometimes, energy, through to its customers. Buy/sell arrangements may require Real Alloy to purchase raw materials in future periods, exposing it to the risk that increased aluminum or energy prices will increase the cost of its products, thereby reducing or eliminating the margin Real Alloy receives when it delivers the product. These risks may be exacerbated by the failure of customers to pay for products on a timely basis, or at all.
Similarly, as Real Alloy maintains substantial quantities of raw material and finished goods inventories, significant decreases in the price of aluminum and aluminum scrap would reduce the realizable value of its inventory, negatively affecting its financial condition and results of operations. In addition, a drop in aluminum prices between the date of purchase and the final settlement date on derivative contracts used to mitigate the risk of price fluctuations may require Real Alloy to post additional margin, which, in turn, can be a significant demand on liquidity.
17
Real Alloy purchases and sells LME forwards, futures and options contracts to reduce its exposure to changes in aluminum prices in its European operations. The ability to realize the benefit of a hedging program is dependent upon factors beyond its control, such as counterparty risk, as well as its receiving timely payments from customers. The cost of energy used, however, is also substantial. In addition, at certain times, hedging options may be unavailable or not available on terms acceptable to Real Alloy. In certain scenarios when market price movements result in a decline in value of its current derivatives position, its mark-to-market expense may exceed its credit line and counterparties may request the posting of cash collateral. Despite the use of LME forwards, futures and options contracts, Real Alloy remains exposed to the variability in prices of aluminum scrap. While aluminum scrap is typically priced in relation to prevailing aluminum index prices (LME, Platts, Metal Bulletin, etc.), certain scrap types used in Real Alloy’s operations are not highly correlated to an underlying index and, therefore, are not hedged. Aluminum scrap is also priced at a discount to selling prices. This discount is referred to in the industry as the “scrap spread” and fluctuates depending upon industry conditions. In addition, Real Alloy purchases forwards, futures or options contracts to reduce exposure to changes in natural gas prices. It does not account for forwards, futures, or options contracts as hedges of the underlying risks. As a result, unrealized gains and losses on these derivative financial instruments are reported in the consolidated statements of operations as current period earnings or loss. The inclusion of such unrealized gains and losses in earnings may produce significant period-to-period earnings volatility that is not necessarily reflective of underlying operating performance.
Real Alloy may encounter increases in the cost, or limited availability, of raw materials and energy, which could cause the cost of sales to increase thereby reducing operating results and limiting operating flexibility. Real Alloy requires substantial amounts of raw materials and energy in its business, consisting principally of aluminum scrap, primary aluminum, alloys, and other materials, and natural gas and electricity. Any substantial increases in the cost of raw materials or energy could cause operating costs to increase and negatively affect Real Alloy’s financial condition and results of operations.
Aluminum scrap, primary aluminum, and hardener prices are subject to significant cyclical price fluctuations. Metallics (primary aluminum metal, aluminum scrap, and aluminum dross) represent the largest component of cost of sales. Real Alloy purchases aluminum primarily from aluminum scrap dealers, primary aluminum producers and other intermediaries. Real Alloy has limited control over the price or availability of these supplies.
The availability and price of aluminum scrap depends on a number of factors outside of the control of Real Alloy, including general economic conditions, international demand for metallics and internal recycling activities by primary aluminum producers and other consumers of aluminum. Increased regional and global demand for aluminum scrap can have the effect of increasing the prices that Real Alloy pays for these raw materials thereby increasing the cost of sales. Real Alloy may not be able to adjust its selling prices to recover the increases in aluminum scrap prices. If aluminum scrap and dross prices were to increase significantly without a commensurate increase in the traded value of the primary metals or of the indices on which sales are made, the future financial condition and results of operations of Real Alloy could be affected by higher costs and lower profitability. In addition, a significant decrease in the pricing spread between aluminum scrap and primary aluminum could make recycling less attractive compared to primary production, and thereby reduce customer demand for Real Alloy’s recycling services.
After raw material and labor costs, energy represents the third largest component of the cost of sales. The price of natural gas, and therefore the costs, can be particularly volatile. Price and volatility can differ by global region based on supply and demand, political issues, and government regulation, among other things. As a result, Real Alloy’s natural gas costs may fluctuate dramatically, and it may not be able to reduce the effect of higher natural gas costs on its cost of sales. If natural gas costs increase, its financial condition and results of operations may be adversely affected. Although Real Alloy attempts to mitigate volatility in natural gas costs through the use of hedging and the inclusion of price escalators and pass-through mechanisms, it may not be able to eliminate the effects of such cost volatility. Furthermore, in an effort to offset the effect of increasing costs, it may have also limited its potential benefit from declining costs.
If Real Alloy were to lose order volumes from any of its largest customers, its sales volumes, revenues and cash flows could be reduced. Real Alloy is exposed to risks related to customer concentration. Its ten largest customers were responsible for approximately 58% of its volume invoiced for the year ended December 31, 2015. One customer accounted for approximately 13% of those volumes. A loss of order volumes from, or a loss of industry share by, any major customer could negatively affect the financial condition and results of operations of Real Alloy by lowering sales volumes and lowering profitability. In addition, Real Alloy’s strategy of having dedicated facilities and arrangements with customers subject it to the inherent risk of increased dependence on a single or a few customers with respect to these facilities. In such cases, the loss of such a customer, or the reduction of that customer’s business at one or more of its facilities, could negatively affect its financial condition and results of operations, and Real Alloy may be unable to timely replace, or replace at all, lost order volumes. In addition, several of Real Alloy’s customers have become involved in bankruptcy or insolvency proceedings and have defaulted on their obligations to Real Alloy in recent years. Similar incidents in the future would adversely impact the financial condition and results of operations of Real Alloy.
18
Real Alloy does not have long-term contractual arrangements with a substantial number of its customers, and sales volumes and revenues could be reduced if those customers switch their suppliers. A substantial amount of Real Alloy’s volume is sold to customers under contractual arrangements of one year or less or on a purchase order basis. Customers may choose not to continue to purchase products and services from Real Alloy. Any significant loss of these customers or a significant reduction in their purchase orders could have a material negative impact on the sales volume and business of Real Alloy.
Real Alloy may not be able to compete successfully in the industry segments it serves and aluminum may become less competitive with alternative materials, which could reduce Real Alloy’s share of industry sales, sales volumes, and selling prices. Aluminum competes with other materials such as steel, plastic, composite materials, and glass for various applications. Higher aluminum prices tend to make aluminum products less competitive with these alternative materials.
Real Alloy competes with other aluminum recyclers in segments that are highly fragmented and characterized by smaller, regional operators. The principal factors of competition in the aluminum recycling business include price, metal recovery rates, proximity to customers, customer service, molten metal delivery capability, environmental and safety regulatory compliance, and types of services offered. Many of Real Alloy’s customers also have the capability to recycle scrap and may choose to bring more of their recycling volumes within their own operations.
With its international business, Real Alloy encounters the risk that non-U.S. governments could take actions to enhance local production or local ownership at its expense.
Additional competition could result in a reduced share of industry sales or reduced prices for Real Alloy’s products and services, which could decrease revenues or reduce volumes, either of which could have a negative effect on our financial condition and results of operations.
Real Alloy has been shaped by historical acquisitions and divestitures under former owners, and we will continue to evaluate future acquisitions and divestitures. Future acquisitions or divestitures may not be successful, which could adversely affect Real Alloy’s financial condition. The future financial performance and success of Real Alloy will depend in part on its ability to successfully implement its business strategy on a stand-alone basis. Part of the business strategy for Real Alloy has been, and will continue to be, the opportunistic pursuit of strategic acquisitions and dispositions. However, there can be no assurance that any such growth efforts will be successful, or that if successful, Real Alloy will be able to effectively manage expanded or acquired operations. The ability of Real Alloy to achieve its expansion and acquisition needs and objectives and to effectively manage its growth depends on numerous risks commonly encountered in business combinations, including the following:
|
|
· |
its ability to identify appropriate acquisition targets and to negotiate acceptable terms for their acquisition; |
|
|
· |
the ability to integrate new businesses into Real Alloy’s operations; |
|
|
· |
the availability of capital on acceptable terms to finance acquisitions (including in light of the terms of the indebtedness under the Financings); |
|
|
· |
the ability to generate the cost savings or synergies anticipated; |
|
|
· |
the inaccurate assessment of undisclosed liabilities; |
|
|
· |
increasing demands on Real Alloy’s operational systems; and |
|
|
· |
the amortization of acquired intangible assets. |
In addition, the process of integrating new businesses could cause the interruption of, or loss of momentum in, the activities of the existing Real Alloy business and the diversion of management’s attention. Any delays or difficulties encountered in connection with the integration of new businesses or divestiture of existing businesses could negatively impact Real Alloy and its results of operations. Furthermore, any acquisition could result in significant increases in outstanding indebtedness and debt service requirements. The terms of this indebtedness may further limit Real Alloy’s ability to pursue acquisitions.
Further aluminum industry consolidation could impact Real Alloy. The aluminum industry has experienced consolidation over the past several years, and there may be further industry consolidation in the future. Although recent industry consolidation has not negatively impacted Real Alloy, further consolidation in the aluminum industry could possibly have negative impacts that we cannot reliably predict.
19
A portion of Real Alloy’s sales is derived from international operations, which exposes Real Alloy to certain risks inherent in doing business abroad. Real Alloy has aluminum recycling operations in Germany, the United Kingdom, Mexico, Norway and Canada and magnesium recycling operations in Germany. Real Alloy continues to explore opportunities to expand its international operations. Real Alloy’s international operations generally are subject to risks, including:
|
|
· |
changes in U.S. and foreign governmental regulations, trade restrictions and laws, including tax laws and regulations; |
|
|
· |
compliance with U.S. and foreign anti-corruption and trade control laws, such as the Foreign Corrupt Practices Act and similar anti-corruption laws in the United Kingdom and Germany, and export controls and economic sanction programs, including those administered by the U.S. Treasury Department’s Office of Foreign Assets Control; |
|
|
· |
currency exchange rate fluctuations; |
|
|
· |
tariffs and other trade barriers; |
|
|
· |
the potential for nationalization of enterprises or government policies favoring local production; |
|
|
· |
interest rate fluctuations; |
|
|
· |
high rates of inflation; |
|
|
· |
currency restrictions and limitations on repatriation of profits; |
|
|
· |
differing protections for intellectual property and enforcement thereof; |
|
|
· |
divergent environmental laws and regulations; and |
|
|
· |
political, economic and social instability. |
The occurrence of any of these events could cause costs to rise, limit growth opportunities or have a negative effect on Real Alloy’s operations and ability to plan for future periods, and subject it to risks not generally prevalent in the U.S.
The financial condition and results of operations of some of the operating entities of Real Alloy are reported in various currencies and then translated into U.S. dollars (“USD”) at the applicable exchange rate for inclusion in its and Real Industry’s consolidated financial statements. As a result, appreciation of USD against these currencies, generally, may have a negative impact on reported revenues and operating profit, and the resulting accounts receivable, while depreciation of USD against these currencies, generally, may have a positive effect on reported revenues and operating profit. In addition, a portion of the revenues generated by its international operations are denominated in USD, while the majority of costs incurred are denominated in local currencies. As a result, appreciation in USD may have a positive impact on earnings while depreciation of USD may have a negative impact on earnings.
Impairment of Real Alloy’s intangible assets could result in significant charges that could adversely impact future operating results. Real Alloy has significant intangible assets, including goodwill, which are susceptible to impairment charges as a result of changes in various factors or conditions. The most significant intangible assets are goodwill and customer relationships, all of which are related to business combinations. We assess the potential impairment of goodwill and indefinite-lived intangible assets on an annual basis, as well as whenever events or changes in circumstances indicate that the carrying value may exceed fair value. We assess finite-lived intangible assets whenever events or changes in circumstances indicate that the carrying value may exceed fair value.
As of December 31, 2015, our consolidated balance sheets included $15.1 million of identifiable intangible assets, net and $104.3 million of goodwill. As a result of the Real Alloy Acquisition, both intangible assets and goodwill have increased substantially. Adverse changes in the operations of the Real Alloy business or other unforeseeable factors could result in an impairment charge in future periods that could adversely impact our results of operations and financial position in that period.
Current environmental liabilities as well as the cost of compliance with, and liabilities under, health and safety laws could increase the operating costs of Real Alloy and negatively affect its financial condition and results of operations. Real Alloy’s operations are subject to U.S. federal, state and local, and foreign environmental laws and regulations, which govern, among other things, air emissions, wastewater discharges, the handling, storage, and disposal of hazardous substances and wastes, the remediation of contaminated sites, and employee health and safety. Future environmental regulations could impose stricter compliance requirements on the industries in which Real Alloy operates. Additional pollution control equipment, process changes, or other environmental control measures may be needed at some of its facilities to meet future requirements.
20
Financial responsibility for contaminated property can be imposed on Real Alloy where current operations have had an environmental impact. Such liability can include the cost of investigating and remediating contaminated soil or ground water, fines and penalties sought by environmental authorities, and damages arising out of personal injury, contaminated property and other toxic tort claims, as well as lost or impaired natural resources. Certain environmental laws impose strict, and in certain circumstances joint and several, liability for certain kinds of matters, such that a person can be held liable without regard to fault for all of the costs of a matter even though others were also involved or responsible. Future remedial requirements at currently owned or operated properties or adjacent areas could result in significant liabilities.
Changes in environmental requirements or changes in their enforcement could materially increase costs. For example, if salt cake, a by-product of aluminum recycling operations, were to become classified as a hazardous waste in the U.S., the costs to manage and dispose of it would increase and could result in significant increased expenditures.
Real Alloy could experience labor disputes that could disrupt its business. Approximately 21% of Real Alloy employees in North America and substantially all of the employees located in Europe, where union membership is common, are represented by unions or equivalent bodies and are covered by collective bargaining or similar agreements that are subject to periodic renegotiation. Although Real Alloy believes they will successfully negotiate new collective bargaining agreements when the current agreements expire, these negotiations may not prove successful, may result in a significant increase in the cost of labor, or may break down and result in the disruption or cessation of its operations.
New government regulation of greenhouse gas emissions may subject Real Alloy to significant new costs and restrictions on its operations. Climate change is receiving increasing attention worldwide, including recently announced, long-term greenhouse gas emission reduction commitments by the U.S. and China. Many scientists, legislators, and others attribute climate change to increased levels of greenhouse gases, including carbon dioxide, which has led to significant legislative and regulatory efforts to limit greenhouse gas emissions. There are legislative and regulatory initiatives in various jurisdictions that would institute a cap-and-trade system, covering various sectors of the economy, under which emitters would be required to buy allowances to offset emissions of greenhouse gas. In addition, several states, including states where Real Alloy has manufacturing plants, are considering greenhouse gas registration and reduction programs. Certain of these plants use significant amounts of energy, including electricity derived from various sources, and natural gas. Greenhouse gas regulation could increase the price of the electricity that Real Alloy purchases, increase the cost of its use of natural gas, restrict access to, or the use of, natural gas, require Real Alloy to purchase allowances to offset its emissions or result in an overall increase in the cost of raw materials. Any one of these developments could significantly increase Real Alloy’s costs, reduce its competitiveness in a global economy or otherwise negatively affect its business, operations or financial results. While future emissions regulation appears likely, it is too early to predict specifically how such regulation might affect Real Alloy’s business, operations, or financial results.
The profitability of Real Alloy depends, in part, on the availability of an adequate source of raw materials. Real Alloy depends on aluminum scrap for its operations and acquires its aluminum scrap from numerous sources. These suppliers generally are not bound by long-term contracts and have no obligation to sell aluminum scrap to us. In periods of low industry prices, suppliers may elect to hold aluminum scrap waiting for higher prices. In addition, the slowdown in industrial production and consumer consumption in the U.S. and Europe during past economic crises may have reduced the supply of aluminum scrap available to Real Alloy. Further, exports of aluminum scrap out of North America and Europe can negatively impact availability and scrap spreads. If an adequate supply of aluminum scrap is not available, Real Alloy would be unable to recycle metals at desired volumes and its results of operations and financial condition would be materially and adversely affected.
The operations of Real Alloy present significant risk of injury or death. It may be subject to claims that are not covered by or exceed its insurance. Because of the heavy industrial activities conducted at its facilities, there exists a risk of injury or death to employees and visitors of Real Alloy, notwithstanding the safety precautions taken. These operations are subject to regulation by various U.S. federal, state and local, and foreign agencies responsible for employee health and safety, including the Occupational Safety and Health Administration. While Real Alloy has policies in place to minimize such risks, it may nevertheless be unable to avoid material liabilities for any employee death or injury that may occur in the future. These types of incidents may not be covered by or may exceed insurance coverage and may have a material adverse effect on Real Alloy’s results of operations and financial condition.
21
Recent derivatives legislation could have an adverse impact on the ability to hedge risks associated with Real Alloy’s operations and on the cost of its hedging activities. Real Alloy uses over-the-counter (“OTC”) derivatives products to hedge its metal commodity and natural gas risks and, historically, currency risks. Legislation in Europe and the U.S. has been adopted to increase the regulatory oversight of the OTC derivatives markets and impose restrictions on certain derivative transactions, which could affect the use of derivatives in hedging transactions. A significant number of the final rules and regulations pursuant to this legislation have not been adopted and not all compliance dates have been reached. If future rules and regulations subject Real Alloy to additional capital or margin requirements, reduce the number of eligible derivatives counterparties, or impose other restrictions on its trading and commodity positions, they could have an adverse effect on the ability to hedge risks associated with Real Alloy and on the costs of its hedging activities.
Certain German pension and benefit obligations of Real Alloy are currently underfunded. Real Alloy may have to make significant cash payments to certain German pension plans, which would reduce the cash available for its business and have an adverse effect on its business financial condition, results of operations, prospects and ability to satisfy its obligations under its indebtedness.
Risks Related to Our Common Stock
The market price of our common stock may fluctuate significantly. Since Fremont emerged from Bankruptcy Proceeding in June 2010, the market price and liquidity of the market for shares of our common stock has varied significantly, from a low closing sales price per share of $2.31 per share in the second quarter of 2012, to a high closing price per share of $14.10 in the third quarter of 2013. The market price of our common stock may be significantly affected by numerous factors, some of which are beyond our control and may not be directly related to our operating performance. These factors include, but are not limited to:
|
|
· |
changes or variations in earnings and/or operating results; |
|
|
· |
our ability to complete acquisitions on a timely and cost-effective basis, and generate the expected benefits from such acquisitions; |
|
|
· |
challenges to our U.S. NOLs or any inability to fully utilize our U.S. NOLs prior to their expiration; |
|
|
· |
shortfalls in operating revenues or net income or any increase in losses from levels expected by investors or securities analysts; |
|
|
· |
changes in the value of our assets; |
|
|
· |
changes in accounting principles or changes in interpretations of existing accounting principles, which could affect our financial results; |
|
|
· |
changes in legislation or regulatory policies, practices, or actions; |
|
|
· |
the commencement or outcome of material litigation involving the Company, our subsidiaries, or the industries in which we have exposure, or both; |
|
|
· |
changes in our capital structure, such as future issuances of securities or the incurrence of additional debt; |
|
|
· |
actual or expected sales of our common stock by our stockholders; |
|
|
· |
departure of key personnel; and |
|
|
· |
general market volatility, economic trends and other external factors. |
We and our predecessors have not paid cash dividends since 2006 and do not intend to pay cash dividends on our common stock in the foreseeable future. We are a holding company that does not operate any business that is separate from those of its subsidiaries. We are therefore dependent on our subsidiaries for any funds from which to pay dividends. We and our predecessors have not paid a dividend since the fourth quarter of 2006, and we do not expect to pay any cash dividends on our common stock in the foreseeable future, but rather expect to retain earnings to finance the growth of our business.
In addition, our future cash dividends would be limited by the terms of certain of the Financings and the Redeemable Preferred Stock. Because we do not anticipate paying cash dividends for the foreseeable future, holders of our common stock will not realize a return on their investment unless the trading price of our common stock appreciates, which we cannot assure.
22
Certain provisions of our Amended and Restated Bylaws could deter takeover attempts and have an adverse impact on the price of our common stock. Our Amended and Restated Bylaws contain provisions, the Tax Benefit Preservation Provisions, to protect the value of our U.S. NOLs. Such provisions may have the effect of discouraging a third-party from making an acquisition proposal for us, which may inhibit a change in control in circumstances that could give the holders of our common stock the opportunity to realize a premium over the market price for our common stock.
Our Rights Agreement could discourage, delay or prevent takeover attempts. Attempts to acquire control of the Company may be discouraged, delayed or prevented by the Rights Agreement, which was adopted to protect the value of our U.S. NOLs and continues to remain in effect as its assumption was approved by our stockholders as part of the Reincorporation. The Rights Agreement is designed to prevent an “ownership change” within the meaning of IRC Section 382 and thereby preserve our ability to utilize our U.S. NOLs, however the existence of the Rights Agreement may discourage, delay or prevent a third-party from effecting a change of control or takeover of the Company in circumstances that could give the holders of our common stock the opportunity to realize a premium over the market price of our common stock.
None.
23
We lease approximately 3,300 square feet in Sherman Oaks, California for our principal executive and administrative offices, which lease expires in 2017, and sub-lease approximately 800 square feet in New York City for our satellite executive and administrative offices, and Cosmedicine’s administrative offices, which lease is on a month-to-month basis.
Through April 2016, Real Alloy sub-leases approximately 13,000 square feet in Beachwood, Ohio from Aleris on a month-to-month basis for its principal executive offices and executive offices for RANA. In April 2016, Real Alloy will relocate its executive offices to a 20,000 square feet office space in Beachwood, Ohio, which lease expires in 2023. Real Alloy’s principal European corporate office is located at its manufacturing facility in Grevenbroich, Germany. Real Alloy operates twenty-four facilities, most of the facilities run twenty-four hours a day, seven days a week. We believe Real Alloy’s existing properties are adequate for its operations for at least the next twelve months. Real Alloy’s production and manufacturing facilities are listed below by reportable segment:
|
Reportable Segment |
|
Location |
|
Title |
|
Lease Expiration |
|
Real Alloy North America |
|
|
|
|
|
|
|
|
|
Steele, Alabama |
|
Owned |
|
|
|
|
|
Goodyear, Arizona |
|
Leased |
|
2016(2) |
|
|
|
Post Falls, Idaho |
|
Owned |
|
|
|
|
|
Chicago Heights, Illinois |
|
Owned |
|
|
|
|
|
Wabash, Indiana (1) |
|
Owned |
|
|
|
|
|
Morgantown, Kentucky |
|
Owned |
|
|
|
|
|
Coldwater, Michigan (1) |
|
Owned |
|
|
|
|
|
Saginaw, Michigan |
|
Owned |
|
|
|
|
|
Elyria, Ohio |
|
Owned |
|
|
|
|
|
Macedonia, Ohio |
|
Owned |
|
|
|
|
|
Rock Creek, Ohio |
|
Owned |
|
|
|
|
|
Sapulpa, Oklahoma |
|
Owned |
|
|
|
|
|
Loudon, Tennessee |
|
Owned |
|
|
|
|
|
Friendly, West Virginia |
|
Owned |
|
|
|
|
|
Mississauga, Canada |
|
Owned |
|
|
|
|
|
Monclova, Mexico |
|
Owned |
|
|
|
Real Alloy Europe |
|
|
|
|
|
|
|
|
|
Deizisau, Germany |
|
Owned |
|
|
|
|
|
Grevenbroich, Germany |
|
Owned |
|
|
|
|
|
Töging, Germany |
|
Owned |
|
|
|
|
|
Raudsand, Norway |
|
Owned |
|
|
|
|
|
Romsdal, Norway |
|
Owned |
|
|
|
|
|
Swansea, Wales |
|
Leased |
|
2030 |
|
|
(1) |
Two facilities at this location. |
|
|
(2) |
Automatic five-year extension option. |
Bankruptcy Proceedings
Management has and continues to reposition the Company after Fremont emerged from Bankruptcy Proceedings in June 2010. Prior to June 2008, Fremont, a financial services holding company, with most operations conducted through FIL, which offered certificates of deposit, savings and money market deposit accounts through retail banking branches in California, was a significant participant in the residential and commercial mortgage lending industry. In June 2008, Fremont filed a voluntary petition for relief under Chapter 11 of Title 11 of the U.S. Code in the United States Bankruptcy Court for the Central District of California, Santa Ana Division (the “California Federal Bankruptcy Court”). In May 2010, the California Federal Bankruptcy Court entered an order, as amended, confirming the Plan of Reorganization. On the Reorganization Effective Date, Fremont emerged from Bankruptcy Proceedings as Signature Group Holdings, Inc.
24
During the Bankruptcy Proceedings, Fremont executed a number of settlement agreements related to litigation matters and loan repurchase claims. In the years ended December 31, 2015, 2014 and 2013, no additional settlements were executed or paid. The last unpaid claims consisted of the disputed Colburn and Walker matters, which were finalized in 2015 with Real Industry and the counterparties entering into settlement agreement and release agreements whereby Real Industry prevailed in full in both matters, as described in “Legal Proceedings” in Note 23—Commitments and Contingencies in the notes to consolidated financial statements, included in Part IV, Item 15 of this Annual Report.
On April 15, 2013, the California Federal Bankruptcy Court granted the Company’s motion for a final decree, and issued a final decree in the Bankruptcy Proceedings. The California Federal Bankruptcy Court retained jurisdiction to preside over disputed claims described in “Legal Proceedings” in Note 23—Commitments and Contingencies in the notes to consolidated financial statements, included in Part IV, Item 15 of this Annual Report.
Legal Proceedings
The information set forth under “Legal Proceedings” in Note 23—Commitments and Contingencies in the notes to consolidated financial statements, included in Part IV, Item 15 of this Annual Report, is incorporated herein by reference.
Not Applicable.
25
|
Item 5. |
Market for Registrant’s Common Equity, Related Stockholder Matters and Issuer Purchases of Equity Securities |
Market Information
Our common stock is traded on the NASDAQ Stock Market under the symbol “RELY” as part of the NASDAQ Global Select Market. Real Industry is also a member of the Russell Global®, Russell 2000® and Russell Microcap® indices. The following table sets forth prices of the high and low completed trades of the Company’s common stock as reported as on the NASDAQ:
|
|
2015 |
|
|
2014 |
|
||||||||||
|
|
High |
|
|
Low |
|
|
High |
|
|
Low |
|
||||
|
First Quarter |
$ |
8.82 |
|
|
$ |
6.06 |
|
|
$ |
12.00 |
|
|
$ |
9.50 |
|
|
Second Quarter |
|
13.50 |
|
|
|
5.90 |
|
|
|
11.75 |
|
|
|
9.85 |
|
|
Third Quarter |
|
13.00 |
|
|
|
8.33 |
|
|
|
10.25 |
|
|
|
8.00 |
|
|
Fourth Quarter |
|
10.80 |
|
|
|
8.00 |
|
|
|
10.65 |
|
|
|
6.35 |
|
On February 29, 2016, there were 1,105 registered stockholders and the last reported trade of our common stock on the NASDAQ was $7.03 per share.
Dividends
There were no cash dividends declared on Real Industry’s common stock during the years ended December 31, 2015, 2014 and 2013. The decision to pay dividends is made by the Board and is dependent on the earnings of Real Industry, management’s assessment of future capital needs, and other factors. Neither the Company, nor its predecessor, has paid a dividend since the fourth quarter of 2006. Real Industry does not expect to pay any cash dividends on its common stock in the foreseeable future and anticipates that any earnings generated from future operations will be used to finance its operations and growth.
The terms of the Redeemable Preferred Stock issued in connection with the Real Alloy Acquisition provide for the payment of quarterly dividends, increasing from 7% for the first eighteen months after the issue date, to 8% for the next twelve months, to 9% thereafter, with dividends payable in kind for the first two years, and thereafter in cash. Other than dividends or distributions payable on our common stock in shares of common stock, the Redeemable Preferred Stock will rank superior to our common stock in the payment of accrued and accumulated dividends, declaration and payment of new dividends and distributions, and making of redemptions. In addition, without the consent of the holders of a majority of the Redeemable Preferred Stock, we are prohibited from paying dividends on our common stock until February 27, 2017.
In addition, we are a holding company that does not operate any business that is separate from its subsidiaries, primarily Real Alloy Parent and SGGH, and their respective subsidiaries. We are therefore dependent on Real Alloy Parent, SGGH, or other subsidiaries we may form or acquire in the future, for any funds from which to pay dividends. These payments may be limited by the terms of the Financings, and by financings we may enter into in the future. Among these limitations within the Senior Secured Notes and the Asset-Based Facility are limitations on the amount of dividends Real Alloy and its subsidiaries may pay us.
Performance Graph
The information required by this item is set forth under the caption “Performance Graph” in the Company’s Definitive Proxy Statement to be filed with the SEC for our 2016 Annual Meeting of Stockholders (the “2016 Proxy Statement”), and is incorporated herein by reference.
26
Equity Compensation Plan Information
The following table sets forth the number of shares of our common stock subject to outstanding common stock options, warrants and stock rights, the weighted average exercise price of outstanding common stock options, warrants and stock rights, and the number of shares remaining available for future award grants under our equity compensation plans (“Equity Plans”) as of December 31, 2015:
|
|
Number of Securities to be Issued Upon Exercise of Outstanding Common Stock Options, Warrants and Stock Rights (a) |
|
|
Weighted Average Exercise Price of Outstanding Common Stock Options, Warrants and Stock Rights |
|
|
Number of Securities Remaining Available for Future Issuance Under Equity Compensation Plans, Excluding Securities Reflected in Column (a) |
|
|||
|
Equity Plans approved by security holders |
|
1,035,650 |
|
|
$ |
6.28 |
|
|
|
1,677,640 |
|
|
Equity Plans not approved by security holders |
|
— |
|
|
|
— |
|
|
|
— |
|
|
|
|
1,035,650 |
|
|
$ |
6.28 |
|
|
|
1,677,640 |
|
Issuer Purchases of Equity Securities
The following table summarizes repurchases of the Company’s equity securities made during the year ended December 31, 2015, which includes options exercised by an employee by delivering shares held by such employee for more than six months and 24,167 Warrants exercised on a cashless basis during the year ended December 31, 2015:
|
Period |
|
Number of Shares Purchased |
|
|
Average Price Paid per Share |
|
|
Number of Shares Purchased as Part of Publicly Announced Plans or Programs |
|
|
Maximum Number of Shares that May Yet Be Purchased Under the Plans or Programs |
|
||||
|
January 1—January 31 |
|
|
— |
|
|
$ |
— |
|
|
|
— |
|
|
|
— |
|
|
February 1—February 28 |
|
|
— |
|
|
|
— |
|
|
|
— |
|
|
|
— |
|
|
March 1—March 31 |
|
|
— |
|
|
|
— |
|
|
|
— |
|
|
|
— |
|
|
April 1—April 30 |
|
|
— |
|
|
|
— |
|
|
|
— |
|
|
|
— |
|
|
May 1—May 31 |
|
|
5,640 |
|
|
|
7.50 |
|
|
|
— |
|
|
|
— |
|
|
June 1—June 30 |
|
|
— |
|
|
|
— |
|
|
|
— |
|
|
|
— |
|
|
July 1—July 31 |
|
|
— |
|
|
|
— |
|
|
|
— |
|
|
|
— |
|
|
August 1—August 31 |
|
|
— |
|
|
|
— |
|
|
|
— |
|
|
|
— |
|
|
September 1—September 30 |
|
|
21,856 |
|
|
|
9.79 |
|
|
|
— |
|
|
|
— |
|
|
October 1—October 31 |
|
|
— |
|
|
|
— |
|
|
|
— |
|
|
|
— |
|
|
November 1—November 30 |
|
|
— |
|
|
|
— |
|
|
|
— |
|
|
|
— |
|
|
December 1—December 31 |
|
|
— |
|
|
|
— |
|
|
|
— |
|
|
|
— |
|
Tax Benefit Preservation Provision and Rights Agreement
In order to preserve valuable tax attributes following emergence from Bankruptcy Proceedings, restrictions were included in our Amended and Restated Bylaws on transfers of Real Industry common stock. Unless approved by the Board, any attempted transfer of Real Industry common stock is prohibited and void to the extent that, as a result of such transfer (or any series of transfers) i) any person or group of persons shall become a 4.9-percent holder of Real Industry common stock or ii) the ownership interests of any “five percent holder” (as defined in Section 1.382-2T(g) of the Tax Code) shall be increased or decreased. Persons wishing to become a 4.9-percent holder (or existing five percent holders wishing to increase or decrease their percentage ownership) must request a waiver of the restriction from Real Industry, and the Board may grant a waiver in its sole discretion. The Tax Benefit Preservation Provision is meant to reduce the potential for a “change of control” event, which, if it were to occur, would have the effect of limiting the amount of U.S. NOLs available for use in a particular year.
27
Attempts to acquire control of the Company may be discouraged, delayed or prevented by the Rights Agreement, which was adopted to protect the value of our U.S. NOLs and continues to remain in effect as its assumption was approved by our stockholders as part of the Reincorporation. Pursuant to the Rights Agreement, ten whole rights will attach to each share of common stock outstanding. Each right entitles the registered holder to purchase from Real Industry a unit consisting of one one-thousandth (1/1000) of a share of Series A Junior Participating Preferred Stock, par value $0.001 per share, of Real Industry at a purchase price of $12.00 per unit, subject to adjustment. The rights do not become exercisable until the earlier to occur of: (i) 10 business days following a public announcement that a person or group has acquired beneficial ownership of 5% or more of outstanding Real Industry common stock (any such person or group is referred to as an acquiring person), or (ii) 10 business days (or a later date as determined by the Board) following the commencement of a tender offer or exchange offer that would result in a person or entity becoming an acquiring person. The Rights Agreement is designed to prevent an “ownership change” within the meaning of IRC Section 382 and thereby preserve our ability to utilize our U.S. NOLs.
28
|
(In millions, except share and |
As of or for the Year Ended December 31, |
|
|||||||||||||||||
|
per share amounts, tonnes in thousands) |
2015 |
|
|
2014 |
|
|
2013 |
|
|
2012 |
|
|
2011 |
|
|||||
|
Statement of Operations Data: |
|
|
|
|
|
|
|
|
|
|
|
|
|
|
|
|
|
|
|
|
Operating revenues |
$ |
1,145.6 |
|
|
$ |
2.1 |
|
|
$ |
5.3 |
|
|
$ |
4.6 |
|
|
$ |
1.1 |
|
|
Operating profit (loss) |
$ |
10.2 |
|
|
$ |
(8.4 |
) |
|
$ |
(7.7 |
) |
|
$ |
(12.0 |
) |
|
$ |
(18.4 |
) |
|
Loss from continuing operations |
$ |
(31.7 |
) |
|
$ |
(0.1 |
) |
|
$ |
(14.2 |
) |
|
$ |
(7.4 |
) |
|
$ |
(9.9 |
) |
|
Earnings (loss) from discontinued operations, net of income taxes |
$ |
24.9 |
|
|
$ |
5.5 |
|
|
$ |
4.2 |
|
|
$ |
(0.1 |
) |
|
$ |
6.4 |
|
|
Earnings (loss) attributable to Real Industry, Inc. |
$ |
(6.9 |
) |
|
$ |
5.5 |
|
|
$ |
(10.0 |
) |
|
$ |
(7.5 |
) |
|
$ |
(3.5 |
) |
|
Dividends and accretion on Redeemable Preferred Stock |
|
(2.3 |
) |
|
|
— |
|
|
|
— |
|
|
|
— |
|
|
|
— |
|
|
Net earnings (loss) available to common stockholders |
$ |
(9.2 |
) |
|
$ |
5.5 |
|
|
$ |
(10.0 |
) |
|
$ |
(7.5 |
) |
|
$ |
(3.5 |
) |
|
Basic and diluted earnings (loss) per share: |
|
|
|
|
|
|
|
|
|
|
|
|
|
|
|
|
|
|
|
|
Loss from continuing operations |
$ |
(1.28 |
) |
|
$ |
— |
|
|
$ |
(1.11 |
) |
|
$ |
(0.59 |
) |
|
$ |
(0.81 |
) |
|
Earnings (loss) from discontinued operations |
|
0.93 |
|
|
|
0.41 |
|
|
|
0.32 |
|
|
|
— |
|
|
|
0.52 |
|
|
Basic and diluted earnings (loss) per share attributable to Real Industry, Inc. |
$ |
(0.35 |
) |
|
$ |
0.41 |
|
|
$ |
(0.79 |
) |
|
$ |
(0.59 |
) |
|
$ |
(0.29 |
) |
|
Weighted average shares outstanding |
|
26,657,832 |
|
|
|
13,403,083 |
|
|
|
12,836,071 |
|
|
|
12,572,843 |
|
|
|
12,277,237 |
|
|
Cash dividends per common share |
$ |
— |
|
|
$ |
— |
|
|
$ |
— |
|
|
$ |
— |
|
|
$ |
— |
|
|
Balance Sheet Data: |
|
|
|
|
|
|
|
|
|
|
|
|
|
|
|
|
|
|
|
|
Cash and cash equivalents |
$ |
35.7 |
|
|
$ |
61.9 |
|
|
$ |
47.8 |
|
|
$ |
49.8 |
|
|
$ |
45.8 |
|
|
Total assets |
$ |
700.9 |
|
|
$ |
121.7 |
|
|
$ |
90.1 |
|
|
$ |
125.7 |
|
|
$ |
103.6 |
|
|
Total stockholders' equity |
$ |
142.4 |
|
|
$ |
85.6 |
|
|
$ |
49.9 |
|
|
$ |
58.2 |
|
|
$ |
63.8 |
|
|
Long-term obligations (including current portion): |
|
|
|
|
|
|
|
|
|
|
|
|
|
|
|
|
|
|
|
|
Long-term debt |
$ |
314.4 |
|
|
$ |
— |
|
|
$ |
— |
|
|
$ |
37.8 |
|
|
$ |
47.0 |
|
|
Redeemable Preferred Stock |
|
21.9 |
|
|
|
— |
|
|
|
— |
|
|
|
— |
|
|
|
— |
|
|
Total long-term obligations |
$ |
336.3 |
|
|
$ |
— |
|
|
$ |
— |
|
|
$ |
37.8 |
|
|
$ |
47.0 |
|
|
Other Financial Data: |
|
|
|
|
|
|
|
|
|
|
|
|
|
|
|
|
|
|
|
|
Net cash provided by (used in): |
|
|
|
|
|
|
|
|
|
|
|
|
|
|
|
|
|
|
|
|
Operating activities |
$ |
92.5 |
|
|
$ |
(14.0 |
) |
|
$ |
22.8 |
|
|
$ |
3.5 |
|
|
$ |
(15.6 |
) |
|
Investing activities |
|
(477.3 |
) |
|
|
2.9 |
|
|
|
8.7 |
|
|
|
7.6 |
|
|
|
(13.6 |
) |
|
Financing activities |
|
358.0 |
|
|
|
26.0 |
|
|
|
(34.5 |
) |
|
|
(8.2 |
) |
|
|
10.8 |
|
|
Expense (income) from change in fair value of common stock warrant liability |
|
1.5 |
|
|
|
(3.7 |
) |
|
|
6.9 |
|
|
|
0.9 |
|
|
|
(4.3 |
) |
|
Depreciation and amortization |
|
32.5 |
|
|
|
— |
|
|
|
— |
|
|
|
— |
|
|
|
— |
|
|
Other noncash operating cash flows |
|
15.6 |
|
|
|
1.0 |
|
|
|
2.0 |
|
|
|
1.8 |
|
|
|
1.1 |
|
|
Capital expenditures |
|
26.0 |
|
|
|
0.1 |
|
|
|
— |
|
|
|
— |
|
|
|
— |
|
|
U.S. net operating loss tax carryforwards |
|
871.8 |
|
|
|
895.0 |
|
|
|
890.5 |
|
|
|
886.9 |
|
|
|
890.0 |
|
|
Operating Information: |
|
|
|
|
|
|
|
|
|
|
|
|
|
|
|
|
|
|
|
|
Volume invoiced (metric tonnes): |
|
|
|
|
|
|
|
|
|
|
|
|
|
|
|
|
|
|
|
|
Tolling |
|
551.5 |
|
|
N/A |
|
|
N/A |
|
|
N/A |
|
|
N/A |
|
||||
|
Buy/sell |
|
455.5 |
|
|
N/A |
|
|
N/A |
|
|
N/A |
|
|
N/A |
|
||||
|
Total volume invoiced |
|
1,007.0 |
|
|
N/A |
|
|
N/A |
|
|
N/A |
|
|
N/A |
|
||||
As a result of the Company’s transformation in the first quarter of 2015, the selected financial data included in this Item 6 represents a change from the selected financial data included in the 2014 Form 10-K, including relevant information concerning the current operations of Real Alloy and presentation of NABCO’s assets, liabilities, and results of operations in discontinued operations. For additional information about the transformative events that occurred in the first quarter of 2015, see “Overview” in Part I, Item 1 of this Annual Report.
29
This Item 7 contains certain non-GAAP financial information. See “Non-GAAP Financial Measures” below for important information regarding the non-GAAP financial information included in this Item 7, together with a reconciliation of such non-GAAP financial information presented to the most comparable GAAP information.
This MD&A is intended to provide readers of our consolidated financial statements with the perspectives of management. MD&A presents, in narrative form, information regarding our financial condition, results of operations, liquidity, and certain other factors that may affect our future results. This should allow readers of this Annual Report to obtain a comprehensive understanding of our business, strategy, current trends, and future prospects. MD&A should be read in conjunction with the consolidated financial statements and related notes included in Part IV, Item 15 of this Annual Report.
Overview
Real Industry is a Delaware holding company that operates through its subsidiaries. Following the sale of NABCO and the Real Alloy Acquisition, both of which occurred in the first quarter of 2015, our principal activities are now related to our aluminum recycling and specification alloys business. The Real Alloy Acquisition was a transformative event for the Company, both in terms of size and substance. We have and continue to devote significant time and attention to integrating and incorporating the Real Alloy Business into the Company, even as a largely stand-alone business unit. For more information on the details of the Real Alloy Acquisition and the Financings related to such transaction, please see Item 1 “Business” or Note 3—Business Combinations in the notes to consolidated financial statements in Part IV, Item 15 of this Annual Report.
Real Alloy is a global leader in third-party aluminum recycling, which includes the processing of scrap aluminum and by-products and the manufacturing of wrought, casts and specification or foundry alloys. Real Alloy offers a broad range of products and services to wrought alloy processors, automotive original equipment manufacturers, and foundries and casters. Real Alloy’s customers include companies that participate in or sell to the automotive, consumer packaging, aerospace, building and construction, steel, and durable goods industries. Real Alloy delivers recycled metal in liquid or solid form according to customer specifications. Real Alloy’s facilities are capable of processing industrial (new) scrap, post-consumer (old/obsolete) scrap, and various aluminum by-products, providing a great degree of flexibility in reclaiming high-quality recycled aluminum. Real Alloy currently operates twenty-four facilities strategically located throughout North America and Europe.
In addition to integrating Real Alloy into the Company, our focus is on the supporting the performance of Real Alloy, as well as evaluating potential acquisition targets. We seek to acquire significant ownership interests in businesses with talented and experienced management teams, strong margins, and sustainable competitive advantages. We regularly consider acquisitions of businesses that operate in undervalued industries, as well as businesses that we believe are in transition or are otherwise misunderstood by the marketplace. Post-acquisition, we plan to operate our businesses as autonomous subsidiaries. We anticipate that we will continue to use our securities to pursue value-enhancing acquisitions and leverage our considerable tax assets, as well as support the growth needs of our existing operating segments, as necessary.
A key element to our business strategy is utilizing our U.S. NOLs, primarily generated by Fremont’s legacy businesses. As of December 31, 2015, our U.S. NOLs total approximately $871.8 million. The U.S. NOLs are further discussed in Note 14—Income Taxes in the notes to consolidated financial statements included in Part IV, Item 15 of this Annual Report.
The Company’s consolidated financial statements included in this Annual Report and MD&A present the Company’s financial condition and results of operations by reportable segment, Corporate and Other, and discontinued operations. As a result of the Real Alloy Acquisition and sale of NABCO in 2015, we have new reportable segments. We are only reporting the results of these reportable segments for the period from February 27, 2015 to December 31, 2015, or approximately ten months, under the reference points described as “for the year ended December 31, 2015.”
30
Real Alloy North America (RANA)
Our RANA segment includes aluminum melting, processing, recycling, and alloying activities conducted in eighteen facilities located in the United States, Canada and Mexico. This segment’s operations convert aluminum scrap and dross (a by-product of melting aluminum) in combination with other alloying agents, hardeners, or other additives, as needed, to produce recycled aluminum alloys with chemical compositions and specific properties, including increased strength, formability and wear resistance, as specified by customers for their particular applications. RANA services customers serving end-uses related to automotive, consumer packaging, construction, transportation and steel. We estimate that approximately 53.8% of RANA’s invoiced sales volume was used in automotive applications in the year ended December 31, 2015. A significant percentage of this segment’s volume is sold through tolling arrangements, in which RANA converts customer-owned aluminum scrap and dross and returns the recycled metal in ingot or molten form to these same customers for a fee. The remainder of RANA’s volume is supplied under buy/sell arrangements with our customers whereby aluminum scrap is purchased from third-parties and we convert that material to our customers’ specifications and deliver it in ingot or molten form. The buy/sell portion of RANA’s business has a much more significant impact on reported revenues and cost of sales compared to tolling arrangements, as the cost of the third-party aluminum scrap purchases is included in both revenues and cost of sales.
Real Alloy Europe (RAEU)
We are a leading European recycler of aluminum scrap and magnesium through our RAEU segment. Similar to RANA, this segment’s operations primarily convert aluminum scrap, dross and other alloying agents as needed and deliver the recycled metal in ingot or molten form to customers from six facilities located in Germany, Norway and Wales. Our RAEU segment supplies the European automobile industry, which we estimate represented approximately 72.0% of this segment’s invoiced sales volume in the year ended December 31, 2015, and other aluminum producers and manufacturers serving other European aluminum industries. Also similar to RANA, RAEU services its customer via tolling and buy/sell arrangements.
Operating costs in Corporate and Other relate to administrative, financial and human resource activities related to the oversight of our operating segments, implementation of our acquisition and growth strategies, management of our discontinued operations, and maintaining our public company status. We do not include such costs within our measure of segment earnings and they are, therefore, excluded from segment results of operations. Corporate and Other also includes the results of operating entities that do not meet the threshold of a reportable segment.
Discontinued operations presents the financial condition and results of operations of the businesses and operations of our subsidiary SGGH that have been sold, or have been discontinued, including NABCO and certain of Fremont’s former operations where SGGH is still engaged in various legal proceedings. During the first quarter of 2015, NABCO was sold for a pretax gain of $39.7 million and its results of operations have been reclassified to discontinued operations for all periods presented as a result of the strategic shift in our reported operations. See “Legal Proceedings” in Note 23—Commitments and Contingencies in the notes to consolidated financial statements included in Part IV, Item 15 of this Annual Report for more information about the material legal proceedings in which SGGH is involved, which are all related to Fremont’s former operations.
Critical Measures of Our Financial Performance
The financial performance of our operating segments is the result of several factors, the most critical of which includes:
|
|
· |
Volumes invoiced; |
|
|
· |
Tolling and buy/sell percentages; |
|
|
· |
Revenues; and |
|
|
· |
Adjusted EBITDA. |
31
The financial performance of Real Alloy is determined, in part, by the volume of metal processed and invoiced. Increased production volume will normally result in lower per unit costs, while higher invoiced volumes will normally result in additional revenue and associated margins. A significant component of our revenue is derived from the price of aluminum, which is a commodity that changes based on both macro and micro economic supply and demand conditions, and we generally pass through this price volatility to our customers. Revenues and margin percentages are also subject to fluctuations based upon the percentage of customer-owned metal tolled, or processed. Increased processing under such tolling agreements results in lower revenues and generally also results in higher gross profit margins and net earnings margins compared to our buy/sell arrangements. Tolling agreements reduce our exposure to the risk of changing metal prices and reduce our working capital requirements. Although tolling agreements are beneficial to us in these ways, the percentage of our capacity we process under these agreements is limited by the amount of metal our customers own and their willingness to enter into such arrangements.
In addition to focusing on tolling relationships and carefully managing the size of our commercial inventory position related to our buy/sell business, Real Alloy utilizes various derivative financial instruments designed to reduce the impact of changing aluminum prices on these net physical purchases and sales, particularly in our European operations. A portion of our buy/sell business is executed based on published indices, which often do not correlate with a particular metal or aluminum index and, therefore, are not hedged. Real Alloy’s risk management practices reduce but do not eliminate exposure to changing aluminum prices. While these practices limit exposure to unfavorable aluminum price changes, they also limit Real Alloy’s ability to benefit from favorable price changes. Further, counterparties may require the posting of cash collateral by Real Alloy if the fair value of derivative liabilities exceeds the amount of credit granted by each counterparty, thereby reducing liquidity. As of December 31, 2015, no cash collateral was posted with counterparties.
Margins are impacted by the fees we charge our customers to process their metal, by “scrap spreads,” which represent the difference between the purchase price of the aluminum scrap we buy and our selling prices, and by conversion costs. Scrap prices tend to be determined regionally and are typically impacted by supply and demand dynamics. While aluminum scrap prices may trend in a similar direction as primary aluminum prices, the extent of price movements is not highly correlated and can cause unpredictable movements in scrap spreads compared to primary aluminum. Our operations are more significantly impacted by “scrap spreads,” which we strive to maximize by utilizing all grades of scrap and optimizing our metal blends and plant loadings. Additionally, our operations are labor intensive and require a significant amount of energy (primarily natural gas and electricity) to melt scrap or primary aluminum, which we refer to as conversion costs.
The measure of profitability for our operating segments is Adjusted EBITDA, or earnings before interest, taxes, depreciation and amortization, and excludes items of a nonoperational nature that may include unrealized and certain realized gains and losses on derivative financial instruments, charges and expenses related to acquisitions, management fees, and certain other gains and losses. See “Non-GAAP Financial Measures” below for a further discussion of our use of non-GAAP financial measures.
Critical Accounting Policies and Estimates
The accounting and reporting policies of the Company conform with GAAP and are fundamental to understanding our consolidated financial statements and this MD&A. Several of our policies are critical as they require management to make difficult, subjective and complex judgments about matters that are inherently uncertain and affect the reported amount of assets, liabilities, revenues and costs included in the consolidated financial statements. Circumstances and events that differ significantly from those underlying our estimates, assumptions, and judgments could cause the actual amounts reported to differ significantly from these estimates. These policies govern the following areas and are described below:
|
|
i. |
Business combinations; |
|
|
ii. |
Revenue recognition, shipping and handling costs, and advertising costs; |
|
|
iii. |
Inventories; |
|
|
iv. |
Market risk management using derivative financial instruments; |
|
|
v. |
Currency translation; |
|
|
vi. |
Impairment of long-lived assets and amortizable intangible assets; |
|
|
vii. |
Environmental and asset retirement obligations; |
|
|
viii. |
Pension benefits; |
|
|
ix. |
Repurchase reserve; |
32
|
|
xi. |
Goodwill and intangible assets. |
On an ongoing basis, we evaluate our estimates and assumptions based on historical experience and various other factors and circumstances. We believe our estimates and assumptions are reasonable under the circumstances; however, actual results may differ significantly from these estimates and assumptions, which could have a material impact on the carrying value of assets and liabilities as of the balance sheet dates, and our results of operations for the reporting periods in the future.
Business combinations
The acquisitions of our businesses are accounted for under the acquisition method of accounting. The amounts assigned to the identifiable assets acquired and liabilities assumed in connection with acquisitions are based on estimated fair values as of the date of the acquisition, with the remainder, if any, recorded as goodwill. The fair values are determined by management, taking into consideration information supplied by the management of the acquired entities, and other relevant information. Such information typically includes valuations obtained from independent appraisal experts, which management reviews and considers in its estimates of fair values. The valuations are generally based upon future cash flow projections for the acquired assets, discounted to present value. The determination of fair values requires significant judgment by management, particularly with respect to the value of identifiable intangible assets. This judgment could result in either a higher or lower value assigned to amortizable or depreciable assets. The impact could result in either higher or lower amortization and/or depreciation expense. Similarly, certain assumed liabilities, such as environmental and asset retirement obligations as well as pension obligations, involve significant management judgment that if incorrectly estimated, may result in future impairment charges.
Revenue recognition, shipping and handling costs, and advertising costs
Revenues are recognized when title transfers and risk of loss passes to the customer, in accordance with SAB 104. This typically occurs when the goods reach their destination. For customer-owned toll material, revenue is recognized upon the performance of the tolling service for the customers. For material that is consigned, revenue is not recognized until the product is used by the customer. Shipping and handling costs and advertising costs, which are expensed as incurred, are included within cost of sales and selling general and administrative (“SG&A”) expenses, respectively, in the consolidated statements of operations.
Inventories
Inventories are stated at the lower of cost or net realizable value. Cost is determined primarily on the average cost identification method and includes material, labor and overhead related to the manufacturing process. We review our inventory values on a regular basis to ensure that their carrying values can be realized. In assessing the ultimate realization of inventories, we are required to make judgments as to future demand requirements and compare that with the current or committed inventory levels. As the ultimate realizable value of most inventory is based upon the price of aluminum, future changes in those prices may lead to the determination that the cost of some, or all, of our inventory will not be realized, which would lead to recording the appropriate adjustment to inventory values.
Market risk management using derivative financial instruments
Real Alloy is engaged in activities that expose it to various market risks, including changes in the prices of aluminum alloys, aluminum scrap, copper, silicon, and natural gas, as well as changes in currency exchange rates. Certain of these financial exposures are managed as an integral part of Real Alloy’s risk management program, which seeks to reduce the potentially adverse effects that market volatility may have on operating results. We attempt to manage these risks with the use of derivative financial instruments and pass through pricing in our customer contracts. While derivative financial instruments reduce those risks, they do not eliminate them. The counterparties to the derivative financial instruments and futures contracts expose us to losses in the event of nonperformance. All credit parties are evaluated for creditworthiness and risk assessment prior to initiating trading activities and the fair values of our derivative financial instruments include an estimate of the risk associated with nonperformance by either ourselves or our counterparties.
33
Real Alloy may enter into forward contracts or swaps to manage its exposure to market risk. The fair value of these instruments is reflected in the consolidated balance sheets and the impact of these instruments is reflected in the consolidated statements of operations. Real Alloy does not hold or issue derivative financial instruments for trading purposes and we do not account for derivative financial instruments as hedges. Fair values for its metal and natural gas derivative instruments, if any, are determined based on the differences between contractual and forward rates of identical hedge positions as of the balance sheet date. See Note 18—Derivatives and Other Financial Instruments and Fair Value Measurements in the notes to consolidated financial statements included Part IV, Item 15 of this Annual Report for additional information about our derivative instruments.
Currency translation
Certain of Real Alloy’s international subsidiaries use the local currency as their functional currency. Real Alloy translates all of the amounts included in the consolidated statements of operations from its international subsidiaries into U.S. dollars at average monthly exchange rates, which management believes is representative of the actual exchange rates on the dates of the transactions. Adjustments resulting from the translation of the assets and liabilities into U.S. dollars at the balance sheet date exchange rates are reflected as a separate component of the Company’s stockholders’ equity. Currency translation adjustments accumulate in the Company’s stockholders’ equity until the disposition or liquidation of the international entities. Currency transactional gains and losses associated with receivables and payables denominated in currencies other than the functional currency are included within other, net in the consolidated statements of operations. The translation of accounts receivables and payables denominated in currencies other than the functional currencies resulted in transactional gains of $0.3 million for the year ended December 31, 2015.
Additionally, Real Alloy maintains intercompany long-term loans between its U.S. and foreign jurisdiction entities, which were established in the subsidiaries’ functional currency and due to their long-term nature, any currency related effects are recorded as a component of accumulated other comprehensive loss. The effects of exchange rates on intercompany loans held by Real Alloy’s international subsidiaries that are not long-term in nature are recognized in current period earnings. Managing liquidity requires the consideration of many alternatives, including the characterization of the nature of intercompany loans as long-term in nature or otherwise. In 2015, management reassessed the character of certain intercompany loans and as a result of the loans no longer being long-term in nature, the Company recorded $1.3 million of foreign exchange losses on intercompany loans during the year ended December 31, 2015.
Impairment of Long-Lived Assets and Amortizable Intangible Assets
We review the carrying value of property, plant and equipment that is held and used, as well as amortizable intangible assets when events or circumstances indicate that their carrying value may not be recoverable. Factors we consider that could trigger testing an asset, or asset group, for impairment include current period operating or cash flow losses, combined with a history of operating or cash flow losses, a projection or forecast that demonstrates continuing losses, significant adverse changes in the business climate within a particular business, or current expectations that a long-lived asset will be sold or otherwise disposed of significantly before the end of its estimated useful life.
We consider these factors quarterly and may test more frequently if changes in circumstances or the occurrence of events indicates that a potential impairment exists. To test for impairment, we compare the estimated undiscounted cash flows expected to be generated from the use and disposal of the asset, or asset group, to its carrying value. An asset group is established by identifying the lowest level of cash flows generated by the group of assets that are largely independent on cash flows of other assets. If cash flows cannot be separately and independently identified for a single asset, management will determine, for the asset group for which cash flows can be identified and projected, if an impairment has occurred. If these undiscounted cash flows are less than their respective carrying values, an impairment charge would be recognized to the extent that the carrying values exceed estimated fair values. Although third-party estimates of fair value are utilized when available, the estimation of undiscounted cash flows and fair value requires management to make assumptions regarding future operating results, as well as appropriate discount rates, where necessary. The results of our impairment testing are dependent on these estimates, which require significant judgment. The occurrence of certain events, including changes in economic and competitive conditions, could impact cash flows eventually realized and our ability to accurately assess whether an asset is impaired.
34
Environmental and asset retirement obligations
Environmental obligations that are not legal or contractual asset retirement obligations and that relate to existing conditions caused by past operations with no benefit to future operations are expensed, while expenditures that extend the life, increase the capacity, or improve the safety of an asset or that mitigate or prevent future environmental contamination are capitalized in property, plant and equipment. Our environmental engineers and consultants review and monitor environmental issues at our existing operating sites. This process includes investigation and remedial action selection and implementation, as well as negotiations with other potentially responsible parties and governmental agencies. Based on the results of this process, we provide reserves for environmental liabilities when and if environmental assessment and/or remediation cost are probable and can be reasonably estimated in accordance with ASC 410. While our accruals are based on management’s current best estimate of the future costs of remedial action, these liabilities can change substantially due to factors such as the nature and extent of contamination, changes in the required remedial actions and technological advancements. Our existing environmental liabilities are not discounted to their present values as the amount and timing of the expenditures are not fixed or reliably determinable.
Asset retirement obligations represent obligations associated with the retirement of tangible long-lived assets. Our asset retirement obligations relate primarily to the requirement to cap our three landfills, as well as costs related to the future removal of asbestos and costs to remove underground storage tanks. The fair value of a liability for an asset retirement obligation is recognized in the period in which it is incurred and capitalized as part of the carrying amount of the associated long-lived asset. These fair values are based upon the present value of the future cash flows expected to be incurred to satisfy the obligation. Determining the fair value of asset retirement obligations requires judgment, including estimates of the discount rate and estimates of future cash expenditures. Estimates of future cash expenditures are obtained primarily from independent engineering consulting firms. The present value of the obligations is accreted over time, while the capitalized cost is depreciated over the remaining useful life of the related asset. Changes in the timing or amount of future cash expenditures or the discount rate would impact the estimated fair value of the obligations.
Pension benefits
Pension benefit costs are accrued based on annual analyses performed by actuaries. These analyses are based on assumptions that include an assumed discount rate and an expected rate of return on plan assets. Both the discount rate and expected rate of return on plan assets require estimates and projections by management and can fluctuate from period to period. Real Alloy’s objective in selecting a discount rate is to select the best estimate of the rate at which the benefit obligations could be effectively settled. In making this estimate, projected cash flows are developed and matched with a yield curve based on an appropriate universe of high-quality corporate bonds. Assumptions for long-term rates of return on plan assets are based upon historical returns and future expectations for returns. See Note 3—Business Combinations and Note 15—Pension Benefit Plans in the notes to consolidated financial statements included in Part IV, Item 15 of this Annual Report for more information about the assumptions used to determine the pension benefit obligation as of the date of the Real Alloy Acquisition and as of December 31, 2015, respectively.
As of December 31, 2015, an increase in the discount rate of 0.5%, assuming inflation remains unchanged, would result in a decrease of $3.8 million in accrued pension benefits, and a $3.7 million decrease in the actuarial gain for the period. A decrease in the discount rate of 0.5% as of December 31, 2015, assuming inflation remains unchanged, would result in an increase of $4.3 million in accrued pension benefits, and a $4.3 million increase in the actuarial gain for the period.
The actuarial assumptions used to determine pension benefits may differ from actual results due to changing market and economic conditions, higher or lower withdrawal rates or longer or shorter life spans of participants. We do not believe differences in actual experience or changes in assumptions will materially affect our financial position or results of operations.
Repurchase reserve
Fremont’s subprime residential mortgage business originated residential real estate loans, and made customary standard industry representations and warranties in sales of those residential real estate loans. Should a court find that Fremont breached these representations and warranties, SGGH may be required to repurchase certain loans due to material defects that occurred in the origination of the loans. SGGH maintains a repurchase reserve for the estimated losses that may to be incurred due to outstanding loan repurchase claims, as well as potential future loan repurchase claims. The reserve is based on historical repurchase settlements, expected future repurchase trends, the expected valuation of such loans when repurchased, and similar legal cases related to the statute of limitations on the representations and warranties provided in mortgage loan purchase agreements. Because the estimated reserve is based upon currently available information, is subject to known and unknown uncertainties using multiple assumptions requiring significant judgment, we have identified the estimate of the repurchase reserve as a critical accounting estimate, and actual results may vary significantly from the current estimate. When loans are repurchased or a claim is settled, charge-offs are made to the repurchase reserve.
35
In June 2015, the New York State Court of Appeals affirmed the decision of the New York State Supreme Court, Appellate Division in ACE Securities Corp v. DB Structured Products, Inc. (the “ACE Securities Case”), whereby the New York state six-year statute of limitations on loan repurchase demands begins to run as of the closing date on which the representations were made, which, in the ACE Securities Case, was the date of the mortgage loan purchase agreements. Based on the final decision in the ACE Securities Case, management has reassessed its exposure to losses from repurchase demands and believes SGGH’s repurchase reserve of $0.7 million is adequate as of December 31, 2015.
The estimated range of possible losses related to known repurchase claims as of December 31, 2015 was $0.4 million to $0.9 million. As a result of the ACE Securities Case, management believes there is no exposure to unknown claims, or claims that have not yet been received, as Fremont’s last loan sale containing these representations and warranties occurred in 2007, more than the six years, or the statute of limitations determined in the ACE Securities Case, from the balance sheet date. The estimated range of possible losses related to repurchase claims as of December 31, 2014, both known and unknown, was $3.4 million to $6.9 million, for which SGGH maintained a repurchase reserve of $5.5 million. The repurchase reserve is included in noncurrent liabilities of discontinued operations in the consolidated balance sheets, and the provision for, or recovery of, the allowance for repurchase reserve is included in other nonoperating income (expense) in the statements of operations of discontinued operations.
The repurchase reserve represents our best estimate of the probable loss that SGGH may incur if it is determined that there were material breaches of certain representations and warranties in the contractual provisions of its predecessor’s sales of residential real estate loans. Because the level of repurchase losses is dependent on economic factors, investor demand strategies and other external conditions that may change over the life of the underlying loans, the liability for loan repurchase losses is difficult to estimate and requires considerable management judgment.
Deferred tax asset valuation
Deferred tax assets and liabilities are recognized for the future tax consequences related to differences between the financial statement carrying amounts of existing assets and liabilities and their respective tax bases, and for tax credits and NOLs. As of December 31, 2015 and 2014, we had deferred tax assets of $388.2 million and $390.7 million, respectively. We evaluate our deferred tax assets for recoverability considering negative and positive evidence, including our historical financial performance, projections of future taxable income, and future reversals of existing taxable temporary differences. We are required to establish a valuation allowance for deferred tax assets if we determine, based on available evidence at the time the determination is made, that it is more likely than not that some portion or all of the deferred tax assets will not be realized. In evaluating the need for a valuation allowance, we estimate future taxable income based on management approved business plans, future capital requirements, and ongoing tax planning strategies. This process involves significant management judgment about assumptions that are subject to change from period to period. Because the recognition of deferred tax assets requires management to make significant judgments about future earnings, the periods in which items will impact taxable income, and the application of inherently complex tax laws, we have identified the assessment of deferred tax assets and the need for any related valuation allowance as a critical accounting estimate.
Our analysis of the realizability of deferred tax assets considers future taxable income expected from continuing operations. The use of different assumptions of future earnings, the periods in which items will affect taxable income and the application of inherently complex tax laws can result in changes in the amounts of deferred tax items recognized, which can result in equity and earnings volatility because such changes are reported in current period earnings. We will continue to update our assumptions and forecasts of future taxable income and assess the need for any adjustment to the valuation allowance.
Our interpretations of tax laws are subject to examination by the IRS, state and foreign taxing authorities. Resolution of disputes over interpretations of tax laws may result in us being assessed additional income taxes. We regularly review whether we may be assessed such additional income taxes and recognize liabilities for such potential future tax obligations as appropriate.
Goodwill and intangible assets
As a result of our acquisitions, we have goodwill and other intangible assets. Goodwill resulting from business combinations is generally determined as the excess of the fair value of the consideration transferred, plus the fair value of any noncontrolling interests in the acquiree, over the fair value of the net assets acquired and liabilities assumed as of the acquisition date. Goodwill in continuing operations was $104.3 million and zero as of December 31, 2015 and 2014, respectively. Intangible assets in continuing operations consist primarily of customer relationships and totaled $15.1 million and $0.1 million as of December 31, 2015 and 2014, respectively, net of accumulated amortization. Goodwill and intangible assets in continuing operations, together, represented 17.0% and 0.1% of our total assets as of December 31, 2015 and 2014, respectively.
36
Goodwill is not amortized but must be allocated to reporting units and tested for impairment on an annual basis or in interim periods if events or circumstances indicate potential impairment. Subsequent to the acquisition of Real Alloy, our reporting units for purposes of goodwill impairment testing include RANA and RAEU. We perform our annual goodwill impairment test for all reporting units as of October 1 each year using a two-step process. First, we compare the fair value of each reporting unit to its current carrying amount, including goodwill. If the fair value of the reporting unit is in excess of the carrying value, the related goodwill is considered not to be impaired and no further analysis is necessary. If, however, the carrying value of the reporting unit exceeds the fair value, there is an indication of potential impairment and a second step of testing is performed to measure the amount of impairment, if any, for that reporting unit.
Estimating the fair value of reporting units and the assets, liabilities and intangible assets of a reporting unit is a subjective process that involves the use of estimates and judgments, particularly related to cash flows, discount rates and a terminal multiple. Management judgment is required to assess whether the carrying value of the reporting unit can be supported by the fair value of the individual reporting unit. There are widely accepted valuation methodologies, such as the market approach (earnings multiples and/or transaction multiples) and/or income approach (discounted cash flow methods), that are used to estimate the fair value of reporting units. We utilize both methodologies and consider a number of factors, including actual operating results, future business plans, economic projections, and market data. Because of the significant judgment used in determining the estimated fair value of our reporting units and the material balances of our goodwill and intangible assets, we have identified estimating the fair value of our reporting units as a critical accounting estimate.
In estimating the fair value of the reporting units in step one of the goodwill impairment analyses, fair values can be sensitive to changes in the projected cash flows and assumptions. In some instances, minor changes in the assumptions could impact whether the fair value of a reporting unit is greater than its carrying amount. Furthermore, a prolonged decrease or increase in a particular assumption could eventually lead to the fair value of a reporting unit being less than its carrying amount. Also, to the extent step two of the goodwill analyses is required, changes in the estimated fair values of individual assets and liabilities may impact other estimates of fair value for assets or liabilities and result in a different amount of implied goodwill, and ultimately the amount of goodwill impairment, if any. In conducting our goodwill impairment test for 2015, we determined the fair value of our reporting units using both a market approach and an income approach. Our analyses required management to make judgments about earnings multiples, future revenue growth and operating costs, expected cash flows, and discount rates. An average of the two methodologies was utilized to determine the indicated fair value of each reporting unit. See Note 8—Goodwill and Intangible Assets, Net for additional information about the assumptions used in step one of the goodwill impairment analysis.
Based on the results of step one of the 2015 goodwill impairment test, we determined that the estimated fair values of RANA and RAEU, including goodwill, exceeded their carrying values. Accordingly, goodwill was not considered impaired and the second step of impairment testing was not required. As a result of the close proximity between the Real Alloy acquisition date and the October 1 goodwill impairment testing date, the excess of fair value of our reporting units compared to their carrying values was less than 10%. If our reporting units do not continue to perform as expected from a free cash flow perspective, or if the cost of capital were to increase or valuation multiples were to decrease, we may be required to record goodwill impairment charges in the future.
Intangible assets with definite useful lives are amortized over their estimated lives and evaluated for potential impairment whenever events or changes in circumstances suggest that the carrying value of an intangible asset may not be fully recoverable. Experts are utilized to assist management in estimating the fair value of identifiable intangible assets as of the acquisition date. An impairment loss, generally calculated as the difference between the estimated fair value and the carrying value of the intangible asset, is recognized if the sum of the estimated undiscounted cash flows relating to the intangible asset is less than the corresponding carrying value. We did not recognize impairment on intangible assets in the years ended December 31, 2015, 2014 and 2013.
37
The following table presents selected components of our consolidated statements of operations for the years ended December 31, 2015, 2014 and 2013:
|
|
Year Ended December 31, |
|
|||||||||
|
(In millions, except per share amounts) |
|
2015 |
|
|
|
2014 |
|
|
|
2013 |
|
|
Revenues |
$ |
1,145.6 |
|
|
$ |
2.1 |
|
|
$ |
5.3 |
|
|
Cost of sales |
|
1,070.7 |
|
|
|
— |
|
|
|
— |
|
|
Gross profit |
|
74.9 |
|
|
|
2.1 |
|
|
|
5.3 |
|
|
Operating costs |
|
64.7 |
|
|
|
10.5 |
|
|
|
13.0 |
|
|
Operating profit (loss) |
|
10.2 |
|
|
|
(8.4 |
) |
|
|
(7.7 |
) |
|
Nonoperating expense, net |
|
51.0 |
|
|
|
0.1 |
|
|
|
8.8 |
|
|
Loss from continuing operations before income taxes |
|
(40.8 |
) |
|
|
(8.5 |
) |
|
|
(16.5 |
) |
|
Income tax benefit |
|
(9.1 |
) |
|
|
(8.4 |
) |
|
|
(2.3 |
) |
|
Loss from continuing operations |
|
(31.7 |
) |
|
|
(0.1 |
) |
|
|
(14.2 |
) |
|
Earnings from discontinued operations, net of income taxes |
|
24.9 |
|
|
|
5.5 |
|
|
|
4.2 |
|
|
Net earnings (loss) |
|
(6.8 |
) |
|
|
5.4 |
|
|
|
(10.0 |
) |
|
Earnings (loss) from continuing operations attributable to noncontrolling interest |
|
0.1 |
|
|
|
(0.1 |
) |
|
|
— |
|
|
Net earnings (loss) attributable to Real Industry, Inc. |
$ |
(6.9 |
) |
|
$ |
5.5 |
|
|
$ |
(10.0 |
) |
|
EARNINGS (LOSS) PER SHARE |
|
|
|
|
|
|
|
|
|
|
|
|
Net earnings (loss) attributable to Real Industry, Inc. |
$ |
(6.9 |
) |
|
$ |
5.5 |
|
|
$ |
(10.0 |
) |
|
Dividends and accretion on Redeemable Preferred Stock |
|
(2.3 |
) |
|
|
— |
|
|
|
— |
|
|
Net earnings (loss) available to common stockholders |
$ |
(9.2 |
) |
|
$ |
5.5 |
|
|
$ |
(10.0 |
) |
|
Basic and diluted earnings (loss) per share: |
|
|
|
|
|
|
|
|
|
|
|
|
Continuing operations |
$ |
(1.28 |
) |
|
$ |
— |
|
|
$ |
(1.11 |
) |
|
Discontinued operations |
|
0.93 |
|
|
|
0.41 |
|
|
|
0.32 |
|
|
Basic and diluted earnings (loss) per share |
$ |
(0.35 |
) |
|
$ |
0.41 |
|
|
$ |
(0.79 |
) |
Consolidated Results of Operations
We reported a net loss attributable to Real Industry of $6.9 million for the year ended December 31, 2015, net earnings of $5.5 million for the year ended December 31, 2014, and a net loss of $10.0 million for the year ended December 31, 2013. Basic and diluted loss per share for the year ended December 31, 2015 was $0.35, basic and diluted earnings per share for the year ended December 31, 2014 was $0.41 per share, and basic and diluted loss per share for the year ended December 31, 2013 was $0.79 per share. In the year ended December 31, 2015, our consolidated results of operations include a number of one-time expenses or events that may be considered obscuring underlying operating results. The following events are particularly noteworthy:
|
|
· |
We incurred $14.8 million of transaction and financing-related costs and expenses associated with the Real Alloy Acquisition; |
|
|
· |
We reported $9.2 million in noncash costs related to the amortization of the fair value adjustment of inventories and prepaid supplies under purchase accounting; |
|
|
· |
There was approximately $4.7 million of interest expense (including amortization of the original issue discount and debt issuance costs) associated with the Senior Secured Notes for the fifty days from funding on January 8, 2015 to the closing date of the Real Alloy Acquisition on February 27, 2015 where we had no offsetting operations from Real Alloy; |
|
|
· |
We reported $1.5 million of other noncash nonoperating expense from the change in fair value of common stock warrant liability, driven primarily by the increase in the price of our common stock from December 31, 2014; and |
|
|
· |
We recorded a $39.7 million pretax gain on sale of NABCO, as well as $4.8 million of recovery on allowance for repurchase reserve, each reported in discontinued operations. |
In addition, our reported earnings only reflect approximately ten months of operating results for Real Alloy, from the acquisition date February 27, 2015 to year-end. As a result of the transformation of our business in the first quarter of 2015 from the Real Alloy Acquisition and the sale of NABCO, historical comparisons of our operating results are limited in value and we have elected not to make any comparisons that management deems could be misleading.
38
Segments’ Results of Operations
The following tables present the results of operations of our reportable segments for the year ended December 31, 2015, and a reconciliation of Adjusted EBITDA to operating profit. As a result of the transformative transactions completed in the first quarter of 2015 our segments did not exist in the prior year, so we are not reporting comparable results of operations. The results of operations of Real Alloy are included from the acquisition date, February 27, 2015, through December 31, 2015, as a result, references to Real Alloy performance for the year ended December 31, 2015 should be considered ten months rather than twelve months. See “Non-GAAP Financial Measures” below for more information about Adjusted EBITDA.
|
|
Year Ended December 31, 2015 |
|
|||||||||
|
(Dollars in millions, tonnes in thousands) |
RANA |
|
|
RAEU |
|
|
Total |
|
|||
|
Buy/sell metric tonnes invoiced |
|
299.9 |
|
|
|
155.6 |
|
|
|
455.5 |
|
|
Tolling metric tonnes invoiced |
|
375.4 |
|
|
|
176.1 |
|
|
|
551.5 |
|
|
Total metric tonnes invoiced |
|
675.3 |
|
|
|
331.8 |
|
|
|
1,007.0 |
|
|
Revenues |
$ |
711.4 |
|
|
$ |
434.2 |
|
|
$ |
1,145.6 |
|
|
Cost of sales |
|
663.6 |
|
|
|
407.1 |
|
|
|
1,070.7 |
|
|
Gross profit |
$ |
47.8 |
|
|
$ |
27.1 |
|
|
$ |
74.9 |
|
|
Selling, general and administrative expenses |
$ |
27.3 |
|
|
$ |
14.8 |
|
|
$ |
42.1 |
|
|
Operating profit |
$ |
15.8 |
|
|
$ |
8.3 |
|
|
$ |
24.1 |
|
|
Adjusted EBITDA |
$ |
49.0 |
|
|
$ |
21.3 |
|
|
$ |
70.3 |
|
|
(In millions) |
Year Ended December 31, 2015 |
|
|
|
Adjusted EBITDA |
$ |
70.3 |
|
|
Unrealized losses on derivative financial instruments |
|
0.8 |
|
|
Depreciation and amortization |
|
32.5 |
|
|
Amortization of purchase accounting adjustments |
|
9.2 |
|
|
Corporate and Other: |
|
|
|
|
Operating loss—excludes share-based compensation expense |
|
12.6 |
|
|
Share-based compensation expense |
|
1.3 |
|
|
Other |
|
3.7 |
|
|
Operating profit |
$ |
10.2 |
|
Real Alloy North America (RANA)
For the year ended December 31, 2015, RANA generated $49.0 million of Adjusted EBITDA on $711.4 million of total revenues. During the period, buy/sell arrangements with its customers represented 44.4% of total invoiced volume, while tolling arrangements represented 55.6%. Adjusted EBITDA per metric tonne invoiced was $73 during the year ended December 31, 2015.
Gross profit for RANA was $47.8 million for the year ended December 31, 2015, representing a margin of 6.7% of total revenues. Cost of sales consists primarily of metal costs and conversion costs. During the period, RANA’s cost of sales includes $4.5 million of noncash expenses associated with the amortization of the fair value adjustment of acquired inventories and prepaid supplies in purchase accounting. Excluding this amount, gross profit would have been $52.3 million during the period, or a gross margin of 7.4%. Cost of sales per metric ton invoiced for the year ended December 31, 2015 was $983. During the year ended December 31, 2015, gross profit was positively impacted by lower maintenance costs as a result of purchase accounting adjustments to property, plant and equipment.
SG&A expenses, excluding depreciation and amortization, were $27.3 million for the year ended December 31, 2015. Approximately 20% of the SG&A expenses RANA incurred during the period relate to transition services expenses for support received from Aleris for information technology services, treasury services, accounts payable, cash management and payroll, credit/collection services, environmental services, and human resource services. As Real Alloy continues to implement its separation from Aleris, management anticipates that expenses related to the transition services agreement with Aleris will decrease, and such costs and expenses will be replaced directly at Real Alloy as it builds out its own stand-alone infrastructure. We expect the ongoing expenses as a stand-alone operation to be lower than the expenses associated with the transition services provided by Aleris.
39
RANA recognized $1.1 million of losses on derivative financial instruments in the year ended December 31, 2015, including $0.4 million of realized losses and $0.7 million of unrealized losses. Generally, realized gains or losses represent the cash paid or received upon settlement of our derivative financial instruments, which offsets the corresponding loss or gain realized on the physical material included in cost of sales and is included in Adjusted EBITDA. Unrealized gains or losses reflect the change in the fair value of derivative financial instruments from the later of the end of the prior period or our entering into the derivative instrument, as well as the reversal of previously recorded unrealized gains or losses for derivatives that settled during the period and is excluded form Adjusted EBITDA.
RANA had depreciation and amortization expense of $26.1 million and capital expenditures of $19.4 million during the year ended December 31, 2015.
Real Alloy Europe (RAEU)
For the year ended December 31, 2015, RAEU generated $21.3 million of Adjusted EBITDA on $434.2 million of total revenues. During the period, buy/sell arrangements with its customers represented 46.9% of total invoiced volume, while tolling arrangements represented 53.1%. Adjusted EBITDA per metric ton invoiced was $64 during the period.
Gross profit for RAEU was $27.1 million for the year ended December 31, 2015, representing a margin of 6.2% of total revenues. During the period, RAEU’s cost of sales includes noncash expenses associated with the amortization of the fair value adjustment of acquired inventories in purchase accounting, totaling $4.7 million. Excluding this amount, gross profit would have been $31.8 million during the period, or a gross margin of 7.3%. Cost of sales per metric ton invoiced for the year ended December 31, 2015 was $1,227. During the year ended December 31, 2015, gross profit was positively impacted by lower maintenance costs as a result of purchase accounting adjustments to property, plant and equipment.
SG&A expenses, excluding depreciation and amortization, were $14.8 million for the year ended December 31, 2015. Approximately 13% of the SG&A expenses RAEU incurred during the period relate to transition services expenses for support received from Aleris, primarily for information technology services. As Real Alloy implements its separation from Aleris, management expects expenses related to the transition services agreement with Aleris to decrease, but such costs and expenses will be replaced directly at Real Alloy as the business builds out its own stand-alone infrastructure. We expect the ongoing expenses as a stand-alone operation to be lower than the expenses associated with the Aleris transition services.
RAEU recognized $3.1 million of losses on derivative financial instruments in the year ended December 31, 2015, including $3.0 million of realized losses, and $0.1 million of unrealized losses. Generally, realized gains or losses represent the cash paid or received upon settlement of our derivative financial instruments, which offsets the corresponding loss or gain realized on the physical material included in cost of sales. Unrealized gains or losses reflect the change in the fair value of derivative financial instruments from the later of the end of the prior period or our entering into the derivative instrument, as well as the reversal of previously recorded unrealized gains or losses for derivatives that settled during the period.
RAEU had depreciation and amortization of $6.4 million and capital expenditures of $6.6 million during the year ended December 31, 2015.
Operating costs outside of segments
Operating costs outside of our reportable segments, included in Corporate and Other, relate to administrative, financial and human resource activities related to the oversight of our operating segments, implementation of our acquisition and growth strategies, management of our discontinued operations, and maintaining our public company status. For the year ended December 31, 2015, 2014 and 2013, operating costs in Corporate and Other were $13.9 million, $10.5 million and $13.0 million, respectively. Compensation is the largest operating cost included in Corporate and Other. Of the $5.4 million of compensation expense in the year ended December 31, 2015, $1.3 million was related to noncash equity award expense and $0.3 million related to severance. Real Industry charged $2.5 million of management fees to Real Alloy in 2015, but such management fees are excluded from segment results of operations, as management excludes such costs when assessing segment performance. Corporate and Other also includes the results of Cosmedicine, as it does not meet the threshold of a reportable segment. The operations of Cosmedicine, which re-launched its branded skin care product line during the latter half of 2015, generated a loss of $2.0 million for the year ended December 31, 2015.
40
Nonoperating expenses and income
Interest expense (income), net
Interest expense (income), net for the years ended December 31, 2015, 2014 and 2013 was $34.9 million, $(0.1) million and $2.0 million, respectively. Included in interest expense are the amortization of debt issuance costs, which represent original issue discounts, placement and advisory fees, legal, accounting and other costs associated with issuing such debt. The amortization of debt issuance costs included in interest expense for the years ended December 31, 2015 was $4.3 million. Interest expense and amortization of original issue discount and debt issuance costs associated with the Senior Secured Notes are for the period January 8, 2015 through December 31, 2015, while the interest expense and debt issuance costs associated with the Asset-Based Facility are for the period February 27, 2015 through December 31, 2015. There was approximately $4.7 million of interest expense (including amortization of issuance discount and debt issuance costs) associated with the Senior Secured Notes for the fifty days from funding on January 8, 2015 to the closing date of the Real Alloy Acquisition on February 27, 2015 where we had no offsetting operations from Real Alloy.
Acquisition and financing-related costs and expenses
Acquisition and financing-related costs and expenses for the years ended December 31, 2015, 2014 and 2013 were $14.8 million, $3.4 million and zero, respectively. All of the expense in 2015 and 2014 related to due diligence, professional fees and expired commitments associated with certain financial arrangements entered into for the Real Alloy Acquisition.
Other nonoperating expenses and income.
For the year ended December 31, 2015, we reported $1.5 million of other noncash nonoperating expense from the change in fair value of common stock warrant liability, driven primarily by the increase in the price of our common stock from December 31, 2014. We reported $1.3 million of noncash other nonoperating expense from the foreign exchange rate effect associated with Real Alloy’s intercompany loans that are not considered long-term in nature, and the Company recognized a $0.9 million gain on the sale of a trademark owned by Cosmedicine.
Income tax benefit
Income tax benefit was $9.1 million, $8.4 million and $2.3 million for the years ended December 31, 2015, 2014 and 2013, respectively. The income tax benefit for the year ended December 31, 2015 consisted of an income tax benefit of $12.3 million from domestic jurisdictions and a $3.2 million income tax expense from international jurisdictions. The domestic income tax benefit for the years ended December 2015, 2014 and 2013 is based primarily on allocations between loss from continuing operations before income taxes and earnings from discontinued operations before income taxes.
Real Industry has valuation allowances recorded to reduce certain deferred tax assets to amounts that are more likely than not to be realized. The valuation allowances relate to the potential inability to realize our deferred tax assets associated with U.S. NOLs and net tax operating losses in certain other foreign jurisdictions. Real Industry intends to maintain its valuation allowances until sufficient positive evidence exists to support their reversal. As of December 31, 2015 and 2014, we had valuation allowances of $382.4 million and $385.6 million, respectively, to reduce certain deferred tax assets to amounts that are more likely than not to be realized. Of the total as of December 31, 2015 and 2014, deferred tax valuation allowances of $377.0 million and $370.1 million, respectively, relate to net operating losses in U.S. tax jurisdictions. During the year ended December 31, 2014, $5.1 million of the valuation allowance was released based upon management’s estimate of 2015 taxable income, including the gain on sale of NABCO.
Discontinued Operations
Discontinued operations presents the financial condition and results of operations of SGGH’s former businesses, specifically, NABCO and certain of Fremont’s former operations.
Earnings from discontinued operations, net of income taxes increased $19.4 million to $24.9 million for the year ended December 31, 2015, as compared to $5.5 million for the year ended December 31, 2014. The earnings of discontinued operations, net of income taxes in 2015 primarily represents the $39.7 million pretax gain on sale of NABCO and the $4.8 million recovery of allowance for repurchase reserve and eight days of NABCO operating results, while the earnings in 2014 primarily represent NABCO’s operating results.
41
The following table presents selected components of the Company’s consolidated balance sheets as of December 31, 2015 and 2014:
|
|
December 31, |
|
|||||
|
(In millions) |
|
2015 |
|
|
|
2014 |
|
|
ASSETS |
|
|
|
|
|
|
|
|
Current assets: |
|
|
|
|
|
|
|
|
Cash and cash equivalents |
$ |
35.7 |
|
|
$ |
61.9 |
|
|
Trade accounts receivable, net |
|
77.2 |
|
|
|
— |
|
|
Financing receivable |
|
32.7 |
|
|
|
— |
|
|
Inventories |
|
101.2 |
|
|
|
— |
|
|
Prepaid expenses, supplies, and other current assets |
|
24.7 |
|
|
|
1.0 |
|
|
Current assets of discontinued operations |
|
0.3 |
|
|
|
18.1 |
|
|
Total current assets |
|
271.8 |
|
|
|
81.0 |
|
|
Debt and equity offering costs |
|
— |
|
|
|
14.5 |
|
|
Property, plant and equipment |
|
301.5 |
|
|
|
0.1 |
|
|
Intangible assets, net |
|
15.1 |
|
|
|
0.1 |
|
|
Goodwill |
|
104.3 |
|
|
|
— |
|
|
Deferred income taxes |
|
— |
|
|
|
4.9 |
|
|
Other noncurrent assets |
|
8.2 |
|
|
|
1.1 |
|
|
Noncurrent assets of discontinued operations |
|
— |
|
|
|
20.0 |
|
|
TOTAL ASSETS |
$ |
700.9 |
|
|
$ |
121.7 |
|
|
LIABILITIES, REDEEMABLE PREFERRED STOCK AND STOCKHOLDERS’ EQUITY |
|
|
|
|
|
||
|
Current liabilities: |
|
|
|
|
|
|
|
|
Trade payables |
$ |
100.9 |
|
|
$ |
— |
|
|
Accrued liabilities |
|
51.8 |
|
|
|
7.1 |
|
|
Long-term debt due within one year |
|
2.3 |
|
|
|
— |
|
|
Current liabilities of discontinued operations |
|
0.1 |
|
|
|
8.1 |
|
|
Total current liabilities |
|
155.1 |
|
|
|
15.2 |
|
|
Accrued pension benefits |
|
38.0 |
|
|
|
— |
|
|
Environmental liabilities |
|
11.7 |
|
|
|
— |
|
|
Long-term debt, net |
|
312.1 |
|
|
|
— |
|
|
Common stock warrant liability |
|
6.9 |
|
|
|
5.6 |
|
|
Deferred income taxes |
|
6.7 |
|
|
|
— |
|
|
Other noncurrent liabilities |
|
5.4 |
|
|
|
0.1 |
|
|
Noncurrent liabilities of discontinued operations |
|
0.7 |
|
|
|
15.2 |
|
|
TOTAL LIABILITIES |
|
536.6 |
|
|
|
36.1 |
|
|
Redeemable preferred stock |
|
21.9 |
|
|
|
— |
|
|
TOTAL STOCKHOLDERS’ EQUITY |
|
142.4 |
|
|
|
85.6 |
|
|
TOTAL LIABILITIES, REDEEMABLE PREFERRED STOCK AND STOCKHOLDERS’ EQUITY |
$ |
700.9 |
|
|
$ |
121.7 |
|
General
Largely as a result of the Real Alloy Acquisition and the Financings, total assets increased $579.2 million to $700.9 million as of December 31, 2015, from $121.7 million as of December 31, 2014; total liabilities increased $500.5 million to $536.6 million as of December 31, 2015, from $36.1 million as of December 31, 2014; and total stockholders’ equity increased to $142.4 million as of December 31, 2015, from $85.6 million as of December 31, 2014.
Changes in stockholders’ equity reflect a net loss during the period, increased by equity issuances and share-based compensation expense, and decreased by accumulated other comprehensive loss. See the Consolidated Statements of Changes in Stockholders’ Equity in the consolidated financial statements included in Part IV, Item 15 of this Annual Report for more details on changes in stockholders’ equity.
42
As a result of the transformation of our Company in the first quarter of 2015 from the Real Alloy Acquisition and the sale of NABCO, historical comparisons of our financial condition are limited in value and we have elected not to make any comparisons that management deems could be misleading.
The following tables present the assets and liabilities of our reportable segments as of December 31, 2015, and a reconciliation to our consolidated assets and liabilities. As a result of the transformation of the Company in the first quarter of 2015, we have no comparable reportable segments as of December 31, 2014.
|
(In millions) |
RANA |
|
|
RAEU |
|
||
|
Segment Assets |
|
|
|
|
|
|
|
|
Current assets: |
|
|
|
|
|
|
|
|
Cash and cash equivalents |
$ |
8.1 |
|
|
$ |
7.2 |
|
|
Trade accounts receivable, net |
|
63.7 |
|
|
|
13.5 |
|
|
Financing receivable |
|
— |
|
|
|
32.7 |
|
|
Inventories |
|
61.7 |
|
|
|
38.5 |
|
|
Prepaid expenses, supplies, and other current assets |
|
12.5 |
|
|
|
6.8 |
|
|
Total current assets |
|
146.0 |
|
|
|
98.7 |
|
|
Property, plant and equipment, net |
|
199.3 |
|
|
|
102.2 |
|
|
Intangible assets, net |
|
15.0 |
|
|
|
— |
|
|
Goodwill |
|
95.4 |
|
|
|
8.9 |
|
|
Other noncurrent assets |
|
4.9 |
|
|
|
1.9 |
|
|
Total segment assets |
$ |
460.6 |
|
|
$ |
211.7 |
|
|
Segment Liabilities |
|
|
|
|
|
|
|
|
Current liabilities: |
|
|
|
|
|
|
|
|
Trade payables |
$ |
58.1 |
|
|
$ |
42.3 |
|
|
Accrued liabilities |
|
34.3 |
|
|
|
14.6 |
|
|
Total current liabilities |
|
92.4 |
|
|
|
56.9 |
|
|
Accrued pension benefits |
|
— |
|
|
|
38.0 |
|
|
Environmental liabilities |
|
11.7 |
|
|
|
— |
|
|
Other noncurrent liabilities |
|
4.1 |
|
|
|
1.4 |
|
|
Total segment liabilities |
$ |
108.2 |
|
|
$ |
96.3 |
|
|
(In millions) |
|
|
|
|
Assets: |
|
|
|
|
Real Alloy North America |
$ |
460.6 |
|
|
Real Alloy Europe |
|
211.7 |
|
|
Unallocated |
|
28.6 |
|
|
Total consolidated assets |
$ |
700.9 |
|
|
Liabilities: |
|
|
|
|
Real Alloy North America |
$ |
108.2 |
|
|
Real Alloy Europe |
|
96.3 |
|
|
Unallocated |
|
332.1 |
|
|
Total consolidated liabilities |
$ |
536.6 |
|
Cash and cash equivalents
Cash and cash equivalents decreased $26.2 million to $35.7 million as of December 31, 2015, from $61.9 million as of December 31, 2014. Cash and cash equivalents maintained at Real Alloy totaled $15.3 million as of December 31, 2015, an increase of $5.1 million from the $10.2 acquired on February 27, 2015. This cash is generally for working capital needs and general corporate purposes, including debt service payments. Cash at Corporate and Other decreased $41.5 million from December 31, 2014, to $20.4 million as of December 31, 2015, primarily as a result of capital contributions to Real Alloy to fund a portion of the Real Alloy Acquisition and the payment of corporate expenses during the period, offset by gross proceeds raised in the Rights Offering and controlled equity offerings totaling $68.0 million.
43
Trade accounts receivable, net
Trade accounts receivable, net was $77.2 million as of December 31, 2015, compared to the $150.1 million of acquired receivables as of February 27, 2015. The significant decrease in trade accounts receivable from the acquisition date to December 31, 2015 is primarily a result of the sale of accounts receivables under the Factoring Facility, and a reduction in the price of metal, as of December 31, 2015, as compared to February 27, 2015, which lowers Real Alloy’s revenues, and general seasonality of the business. With the sale of NABCO and its reclassification to discontinued operation, there were no trade accounts receivable as of December 31, 2014.
Financing receivable
Financing receivable was $32.7 million as of December 31, 2015. The balance represents the amounts due RAEU from sales of accounts receivables under the Factoring Facility, less $2.8 million of outstanding advances against these amounts due.
Inventories
Inventories were $101.2 million as of December 31, 2015, compared to the $157.7 million acquired as of February 27, 2015. Inventory values have declined due to lower aluminum scrap on hand to support RANA and RAEU’s buy/sell business as management has focused its efforts on reducing working capital particularly in an environment of falling scrap aluminum metal prices, which further led to the overall reduction in inventory during the period, and general seasonality of the business. With the sale of NABCO and its reclassification to discontinued operation, we are reporting zero inventories as of December 31, 2014.
Prepaid expenses, supplies and other current assets
Prepaid expenses, supplies and other current assets were $24.7 million as of December 31, 2015, an increase of $23.7 million from the $1.0 million reported as of December 31, 2014. The significant increase is associated with the Real Alloy Acquisition.
Debt and equity offering costs
Debt and equity offering costs associated with capital raising efforts were $14.5 million as of December 31, 2014. Such costs are expensed or reclassified in the period the associated offerings are completed, or terminate in the case of commitments. Of the $14.5 million as of December 31, 2014, $0.3 million associated with the Rights Offering was reclassified as a reduction of additional paid-in capital; $3.7 million associated with the Senior Secured Notes and Asset-Backed Facility were reclassified as a reduction of the associated debt; and $10.5 million associated with the backstop and bridge financing agreements that were not utilized to fund the Real Alloy Acquisition were expensed during 2015.
Property, plant and equipment, net
Property, plant and equipment, net was $301.5 million as of December 31, 2015, and reflects the final purchase accounting adjustments to estimated fair value at the Real Alloy acquisition date, plus capital expenditures during the period, offset by scheduled depreciation and amortization during the year ended.
Goodwill and intangible assets, net
Intangible assets, net, comprised primarily of customer relationships, increased $15.0 million to $15.1 million as of December 31, 2015, from $0.1 million as of December 31, 2014, primarily as a result of the Real Alloy Acquisition. Goodwill is reported at $104.3 million based on the final estimated acquisition date fair values of assets acquired and liabilities assumed in the Real Alloy Acquisition, and currency translation adjustments. See Note 3—Business Combinations in the notes to consolidated financial statements included in Part IV, Item 15 of this Annual Report for additional information about goodwill and intangible assets.
Trade payables
Trade payables were $100.9 million as of December 31, 2015, compared to the $112.4 million assumed as of February 27, 2015, with the reduction largely due to lower aluminum scrap prices and the general seasonality of the business. With the sale of NABCO and its reclassification to discontinued operation, there were nominal trade payables as of December 31, 2014.
44
Accrued liabilities were $51.8 million as of December 31, 2015, compared to the $26.9 million assumed as of February 27, 2015, with the increase largely due to the accrual of interest on the Senior Secured Notes. Accrued liabilities were $7.1 million as of December 31, 2014.
Accrued pension benefits
Accrued pension benefits at RAEU were $38.0 million as of December 31, 2015 and were assumed as part of the Real Alloy Acquisition. See Note 15—Employee Benefit Plans in the notes to consolidated financial statements included in Part IV, Item 15 of this Annual Report for additional information about accrued pension benefits.
Environmental liabilities
Environmental liabilities were $16.0 million as of December 31, 2015, including $4.3 million classified in accrued liabilities and were assumed as part of the Real Alloy Acquisition. The change from the acquisition date fair values is primarily related to revised assumptions, including reductions to the estimated costs of remediation of environmental issues at Real Alloy’s landfills. See Note 3—Business Combinations and Note 23—Commitments and Contingencies in the notes to consolidated financial statements included in Part IV, Item 15 of this Annual Report for additional information about environmental liabilities.
Long-term debt and Redeemable Preferred Stock
Long-term debt increased to $314.4 million as of December 31, 2015, including $2.3 million due within one year, compared to zero as of December 31, 2014. Redeemable Preferred Stock, issued in the Real Alloy Acquisition, increased to $21.9 million as of December 31, 2015, compared to zero as of December 31, 2014. The increase in long-term debt is entirely related to the Real Alloy Acquisition and Real Alloy’s ongoing operations. See Note 9—Debt and Redeemable Preferred Stock in the notes to consolidated financial statements included in Part IV, Item 15 of this Annual Report.
Common stock warrant liability
Common stock warrant liability increased to $6.9 million as of December 31, 2015, compared to $5.6 million as of December 31, 2014. The $1.5 million change in fair value of common stock warrant liability during the year ended December 31, 2015 is primarily attributable to an increase in the underlying market price of our common stock from the beginning of the period. During the year, $0.2 million of the common stock warrant liability was reclassified to additional paid in capital following the exercise of 31,667 Warrants. See Note 10—Common Stock Warrant Liability in the notes to consolidated financial statements included in Part IV, Item 15 of this Annual Report for more information about the Warrants.
Discontinued Operations
Assets of discontinued operations decreased to $0.3 million as of December 31, 2015, from $38.1 million as of December 31, 2014. Liabilities of discontinued operations decreased to $0.8 million as of December 31, 2015, from $23.3 million as of December 31, 2014. The decrease in assets and liabilities of discontinued operations is primarily the result of the sale of NABCO in January 2015 and a reduction of the repurchase reserve.
The repurchase reserve decreased $4.8 million to $0.7 million as of December 31, 2015, from $5.5 million as of December 31, 2014. In June 2015, the New York State Court of Appeals affirmed the ACE Securities Case, whereby the six-year statute of limitations on loan repurchase demands begin to run as of the date the representations were made, which, in the ACE Securities Case, was the date of the mortgage loan purchase agreements. Management has reassessed its exposure to losses from repurchase demands and, based on the final decision in the ACE Securities Case, believes a repurchase reserve of $0.7 million is adequate as of December 31, 2015.
Liquidity and Capital Resources
Our primary capital needs are for working capital obligations, capital expenditures, other general corporate purposes, and to finance and fund acquisitions. We assess liquidity in terms of our ability to generate cash to fund our operating activities. Factors that could materially impact our liquidity include:
|
|
● |
cash flows generated from operating activities; |
|
|
● |
adequacy of available lines of credit; |
45
|
|
● |
our acquisition activity. |
Further acquisitions, divestitures, investments and changes in capital structure are possible.
As of December 31, 2015, our consolidated liquidity was $103.7 million.
Corporate Liquidity
Our holding company assets are principally comprised of stock or membership interests of our subsidiaries, cash and cash equivalents of $20.4 million, and receivables from our subsidiaries related to various intercompany arrangements, including management fees and tax sharing agreements. Our principal sources of liquidity include current cash and cash equivalents, public and private capital markets transactions, funds received from subsidiaries from management fees and tax sharing payments and repayments of advances, and borrowings and dividends from subsidiaries, as well as dispositions of existing businesses. As of December 31, 2015, our effective $700.0 million Shelf Registration Statement is available to use for existing business requirements and future acquisitions. During the year ended December 31, 2015, we raised $59.8 million of gross proceeds in our Rights Offering, including with respect to both common stockholders and Warrant holders; $1.2 million from the exercise of common stock options and Warrants; and $8.2 million from a controlled public equity offering. Our principal uses of liquidity, as of December 31, 2015, are the payment of operating costs of the holding company and to support our operating subsidiaries and our ongoing acquisition efforts. Any future acquisitions, joint ventures or other similar transactions will likely require additional capital and there can be no assurance that any such capital will be available to us on acceptable terms, if at all.
Assets of SGGH are principally comprised of stock or membership interests of its subsidiaries, cash and cash equivalents, and intercompany arrangements. Its current available liquidity is used to meet short-term cash requirements, which are principally the payment of professional fees associated with litigation in SGGH’s former businesses and operations, including discontinued operations. SGGH principal source of liquidity is its current cash and cash equivalents, funds received from subsidiaries from tax sharing payments and repayments of advances, and borrowings and dividends from affiliates.
Real Alloy Liquidity
As of December 31, 2015, Real Alloy had total liquidity of $83.1 million, including $15.3 million in cash, $42.1 million in availability under its revolving credit facility, and €23.6 million ($25.7 million) in availability under its Factoring Facility. Based on our current and anticipated levels of operations and the conditions in the markets and industry for Real Alloy, we believe that Real Alloy’s cash on hand, cash flows from operations, and availability under the Asset-Based and Factoring Facilities will enable it to meet its working capital, capital expenditures, debt service, and other funding requirements for the foreseeable future. However, its ability to fund our working capital needs, debt payments and other obligations, and to comply with the financial covenants under the Senior Secured Notes and Asset-Based Facility, including borrowing base limitations under the Asset-Based Facility, depends on its future operating performance and cash flows and many factors outside of our control, including the costs of raw materials, the state of the overall industry and financial and economic conditions and other factors, including those described under “Risk Factors” in Part 1, Item 1A of this Annual Report.
As of December 31, 2015, approximately $11.5 million of Real Alloy’s cash and cash equivalents were held by its non-U.S. subsidiaries. We currently have no plans to repatriate foreign earnings, which are expected to be permanently reinvested. If circumstances change and it becomes apparent that some or all of the permanently reinvested earnings will be remitted in the foreseeable future, an additional income tax charge may be necessary; however, we currently have the ability to remit all of the cash held by non-U.S. subsidiaries without incurring a U.S. tax liability.
46
The following table summarizes net cash provided (used) by operating, investing and financing activities for the years ended December 31, 2015, 2014 and 2013. The following presentation and discussion of cash flows reflects the combined cash flows from our continuing operations and discontinued operations.
|
|
Year Ended December 31, |
|
|||||||||
|
(In millions) |
2015 |
|
|
2014 |
|
|
2013 |
|
|||
|
Net cash provided by (used in) operating activities |
$ |
92.5 |
|
|
$ |
(14.0 |
) |
|
$ |
22.8 |
|
|
Net cash provided by (used in) investing activities |
|
(477.3 |
) |
|
|
2.9 |
|
|
|
8.7 |
|
|
Net cash provided by (used in) financing activities |
|
358.0 |
|
|
|
26.0 |
|
|
|
(34.5 |
) |
|
Effect of exchange rate differences on cash and cash equivalents |
|
(0.3 |
) |
|
|
— |
|
|
|
— |
|
|
Increase (decrease) in cash and cash equivalents |
$ |
(27.1 |
) |
|
$ |
14.9 |
|
|
$ |
(3.0 |
) |
Cash flows from operating activities
Cash flows provided by operating activities were $92.5 million for the year ended December 31, 2015, which was the result of net loss of $6.8 million for the period, adjusted for noncash expenses, including depreciation and amortization of $32.5 million; a $1.5 million noncash charge related to the change in fair value of the common stock warrant liability; the amortization of $9.2 million of the purchase accounting adjustment to inventories and prepaid supplies; the amortization of $4.3 million of debt issuance costs; $1.3 million of share-based compensation expense included in Corporate and Other, and $1.5 million in total; $89.2 million of cash provided by the changes in operating assets and liabilities; and reduced by $24.9 million of earnings from discontinued operations, net of income taxes and a $2.1 million deferred income tax benefit.
Cash flows used in and provided by operating activities in the years ended December 31, 2014 and 2013 were $14.0 million and $22.8 million, respectively, and were primarily related to the activities of NABCO and SCP.
Cash flows from investing activities
Cash flows used by investing activities were $477.3 million for the year ended December 31, 2015 and included $524.7 million to acquire Real Alloy and $26.0 million of capital expenditures, partially offset by $74.1 million of proceeds from the sale of NABCO.
Cash flows provided by investing activities in the years ended December 31, 2014 and 2013 were $2.9 million and $8.7 million, respectively, and relate primarily to the sale of investments by SCP.
Cash flows from financing activities
Cash flows provided by financing activities were $358.0 million for the year ended December 31, 2015, which included $290.2 million of net proceeds from the issuance of the Senior Secured Notes, net of original issue discount and debt issuance costs, proceeds from the Asset-Based Facility of $126.1 million and $63.3 million of net proceeds from the issuance of common stock. These fundings were offset by the repayment of NABCO debt totaling $14.3 million and $108.3 million of repayments on the Asset-Based Facility and capital leases.
Cash flows provided by financing activities for the year ended December 31, 2014 was $26.0 million, primarily proceeds from the issuance of common stock. Cash flows used in financing activities for the year ended December 31, 2013 was $34.5 million, primarily related to the retirement of $37.2 million of long-term debt.
47
Contractual obligations as of December 31, 2015 are summarized by contractual maturity in the following table:
|
(In millions) |
2016 |
|
|
2017 - 2018 |
|
|
2019 - 2020 |
|
|
After 2020 |
|
||||
|
Long-term debt and capital leases |
$ |
2.4 |
|
|
$ |
23.7 |
|
|
$ |
305.1 |
|
|
$ |
— |
|
|
Interest on long-term debt and capital leases |
|
31.9 |
|
|
|
63.3 |
|
|
|
15.3 |
|
|
|
— |
|
|
Redeemable Preferred Stock |
|
— |
|
|
|
4.3 |
|
|
|
33.6 |
|
|
|
— |
|
|
Estimated pension benefit payments |
|
0.9 |
|
|
|
2.1 |
|
|
|
2.5 |
|
|
|
7.5 |
|
|
Operating leases |
|
2.8 |
|
|
|
1.9 |
|
|
|
1.0 |
|
|
|
2.3 |
|
|
Estimated payments for asset retirement obligations |
|
0.9 |
|
|
|
— |
|
|
|
— |
|
|
|
— |
|
|
Purchase obligations |
|
1.9 |
|
|
|
2.1 |
|
|
|
0.5 |
|
|
|
— |
|
|
|
$ |
40.8 |
|
|
$ |
97.4 |
|
|
$ |
358.0 |
|
|
$ |
9.8 |
|
Interest on long-term debt and capital leases was estimated based on scheduled debt service payments on the Senior Secured Notes and capital leases, plus an estimate of interest payments that will be due on the Asset-Based Facility using the average outstanding borrowing in 2015 and the interest rate in effect as of December 31, 2015. Future interest payments will be different than the amount shown in the table if interest rates change or the average borrowings under the Asset-Based Facility change.
Indebtedness and Redeemable Preferred Stock
Senior Secured Notes
On January 8, 2015, Real Alloy completed a private placement of $305.0 million aggregate principal of Senior Secured Notes to qualified institutional purchasers in accordance with Rule 144A and Regulation S under the Securities Act at a price of 97.206% of the principal amount thereof. The Senior Secured Notes were issued pursuant to the Indenture between Real Alloy, an intermediate holding company, and Wilmington Trust, National Association, as trustee and notes collateral trustee. The Senior Secured Notes and related guarantees are secured by first priority security interests in the fixed assets of Real Alloy, an intermediate holding company and the Subsidiary Guarantors (as defined in the Pledge and Security Agreement) and by second priority security interests in certain other collateral of Real Alloy, an intermediate holding company and the Subsidiary Guarantors.
Asset-Based Facility
On February 27, 2015, a wholly owned subsidiary of Real Alloy and an affiliate of Real Alloy entered into the $110.0 million Asset-Based Facility. The Asset-Based Facility is secured by a first priority lien on Real Alloy’s wholly owned domestic subsidiary’s and, to the extent no adverse tax impact would be incurred, foreign subsidiaries: accounts receivable, inventory, instruments representing receivables, guarantees and other credit enhancements related to receivables, and bank accounts into which receivables are deposited, among other related assets. The Asset-Based Facility is also secured by a second priority lien on the assets that secure the Senior Secured Notes. The borrowing base under the Asset-Based Facility is determined based on eligible accounts receivable and eligible inventory. As of December 31, 2015, we estimate that the borrowing base would have supported borrowings of $67.7 million. After giving effect to outstanding borrowings and letters of credit, Real Alloy had $42.1 million available for borrowing under the Asset-Based Facility as of December 31, 2015.
Capital leases
As part of the Real Alloy Acquisition, existing capital leases of the Real Alloy business were assumed. In the normal course of operations, Real Alloy enters into capital leases primarily related to mobile and office equipment. As of December 31, 2015, $2.3 million is due within the next twelve months.
48
The Redeemable Preferred Stock was issued to Aleris on February 27, 2015 as a portion of the purchase price for the Real Alloy Acquisition and was recorded at estimated fair value of $19.6 million. The difference between the liquidation value and the estimated fair value as of the acquisition date is accreted to preferred dividends in the consolidated balance sheets. The Redeemable Preferred Stock pays quarterly dividends at a rate of 7% for the first eighteen months after the date of issuance, 8% for the next twelve months, and 9% thereafter. Dividends may be paid in kind for the first two years, and thereafter will be paid in cash. All accrued and accumulated dividends on the Redeemable Preferred Stock will be prior and in preference to any dividend on any of the Company’s common stock or other junior securities. As of December 31, 2015, the liquidation value of the Redeemable Preferred Stock was $21.9 million.
The descriptions above are only summaries, for more information see Note 9 – Debt and Redeemable Preferred Stock in the notes to consolidated financial statements included in Part IV, Item 15 of this Annual Report.
Non-GAAP Financial Measures
A non-GAAP financial measure is a numerical measure of historical or future financial performance, financial position or cash flows that excludes amounts, or is subject to adjustments that have the effect of excluding amounts, that are included in the most directly comparable measure calculated and presented in accordance with GAAP in the balance sheets, statements of operations, or statements of cash flows; or includes amounts, or is subject to adjustments that have the effect of including amounts, that are excluded from the most directly comparable measures so calculated and presented. We report our financial results in accordance with GAAP; however, our management believes that certain non-GAAP performance measures, which we use in managing our businesses, may provide investors with additional meaningful comparisons between current results and results in prior periods. Adjusted EBITDA is an example of a non-GAAP financial measure that we believe provides investors and other users of our financial information with useful information.
Management uses Adjusted EBITDA as a performance metric for the Company’s segments and believes this measure provides additional information commonly used by holders of our common stock, as well as the holders of the Senior Secured Notes and parties to the Asset-Based Facility with respect to the ongoing performance of our underlying business activities, as well as our ability to meet our future debt service, capital expenditures and working capital needs. In addition, Adjusted EBITDA is a component of certain covenants under the Indenture governing the Senior Secured Notes.
Our Adjusted EBITDA calculations represent net earnings before interest, taxes, depreciation and amortization, unrealized gains and losses on derivative financial instruments, share-based compensation expense, amortization of purchase accounting adjustments, charges and expenses related to acquisitions, and certain other gains and losses.
Adjusted EBITDA as we use it may not be comparable to similarly titled measures used by other companies, and in fact, is defined differently under the Senior Secured Notes and Asset-Based Facility agreements.. We compute Adjusted EBITDA by eliminating the impact of a number of items we do not consider indicative of our ongoing operating performance and certain other items. You are encouraged to evaluate each adjustment and the reasons we consider it appropriate for supplemental analysis. However, Adjusted EBITDA is not a financial measurement computed and presented in accordance with GAAP, and when analyzing our operating performance, investors should use Adjusted EBITDA in addition to, and not as an alternative for, net earnings, operating profit or any other performance measure derived in accordance with GAAP, or in addition to, and not as an alternative for, cash flows from operating activities as a measure of our liquidity. Adjusted EBITDA has limitations as an analytical tool, and it should not be considered in isolation, or as a substitute for, or superior to, our measures of financial performance prepared in accordance with GAAP. These limitations include, but are not limited to:
|
|
· |
not reflecting our cash expenditures or future requirements for capital expenditures (including replacing our depreciable assets) or contractual commitments; |
|
|
· |
not reflecting changes in, or cash requirements for, working capital needs; |
|
|
· |
not reflecting interest expense or cash requirements necessary to service interest and/or principal payments under the Senior Secured Notes or Asset-Based Facility; |
|
|
· |
not reflecting certain tax payments that may represent a reduction in cash available to us; and |
|
|
· |
comparability to other companies, including companies in our industry, that may calculate these measures differently and the degree of their usefulness as a comparative measure decreases as the number of differences in computations increases. |
49
In addition, in evaluating Adjusted EBITDA, it should be noted that in the future we may incur expenses similar to the adjustments in the reconciliation presented below. Our presentation of Adjusted EBITDA should not be construed as an inference that our future results will be unaffected by unusual or nonrecurring items.
As a result of the transformation of the Company in the first quarter of 2015, we have chosen not to provide any non-GAAP financial measures from prior periods to avoid being misleading.
The table below provides a reconciliation of Adjusted EBITDA to its most directly comparable financial measure presented in accordance with GAAP, net loss, and to net cash provided by operating activities for the year ended December 31, 2015:
|
|
Year Ended December 31, |
|
|
|
(In millions) |
2015 |
|
|
|
Adjusted EBITDA |
$ |
70.3 |
|
|
Unrealized losses on derivative financial instruments |
|
0.8 |
|
|
Depreciation and amortization |
|
32.5 |
|
|
Amortization of purchase accounting adjustments |
|
9.2 |
|
|
Corporate and Other: |
|
|
|
|
Operating loss—excludes share-based compensation expense |
|
12.6 |
|
|
Share-based compensation expense |
|
1.3 |
|
|
Other |
|
3.7 |
|
|
Operating profit |
|
10.2 |
|
|
Nonoperating expense, net |
|
(51.0 |
) |
|
Loss from continuing operations before income taxes |
|
(40.8 |
) |
|
Income tax benefit |
|
(9.1 |
) |
|
Loss from continuing operations |
|
(31.7 |
) |
|
Earnings from discontinued operations, net of income taxes |
|
24.9 |
|
|
Net loss |
|
(6.8 |
) |
|
Earnings from discontinued operations, net of income taxes |
|
(24.9 |
) |
|
Depreciation and amortization |
|
32.5 |
|
|
Deferred income taxes |
|
(2.1 |
) |
|
Change in fair value of common stock warrant liability |
|
1.5 |
|
|
Share-based compensation expense included in Corporate and Other |
|
1.3 |
|
|
Amortization of debt issuance costs |
|
4.3 |
|
|
Unrealized losses on derivative financial instruments |
|
0.8 |
|
|
Amortization of purchase accounting adjustments |
|
9.2 |
|
|
Other |
|
1.5 |
|
|
Changes in operating assets and liabilities, net of the effects of the Real Alloy Acquisition |
|
89.2 |
|
|
Net cash used in operating activities of discontinued operations |
|
(14.0 |
) |
|
Net cash provided by operating activities |
$ |
92.5 |
|
Off-Balance Sheet Transactions
Discontinued Operations
Prior to 2007, Fremont securitized a portion of its residential real estate loans. Securitization is a process of transforming loans into securities that are sold to investors. The loans were first sold to a special purpose corporation, which then transferred them to a qualified special purpose entity (“QSPE”), which was a separate legal entity from Fremont. The QSPE, in turn, issued interest-bearing securities, commonly known as asset-backed securities, secured by the future cash flows to be derived from the securitized loans. The QSPE used the proceeds from the issuance of the securities to pay the purchase price of the securitized loans.
Securitizations of mortgage loans were used to provide an additional source of liquidity and were structured as sales. The special purpose entities to which the mortgage loans were transferred were QSPEs and, therefore, under previous accounting rules through 2009, were not subject to consolidation. The accounting standards were amended effective January 1, 2010 to eliminate the concept of QSPEs. We reevaluated these QSPEs, as well as all other potentially significant interests in other unconsolidated entities, to determine if SGGH should include them in its consolidated financial statements. We determined that SGGH is not the primary beneficiary of these variable interest entities and, therefore, do not consolidate the loan securitization trusts.
50
The security investors and the QSPEs do not have any recourse against SGGH if the cash flows generated by the securitized loans are inadequate to service the securities issued by the QSPEs. At the close of each securitization, Fremont removed the carrying value of the loans securitized from its balance sheet and added the estimated fair value of the assets obtained in consideration for the loans, which generally included the cash received (net of transaction expenses), retained junior class securities (referred to as residual interests) and mortgage servicing rights, to its balance sheet. SGGH holds these residual interests, which are carried at zero in the consolidated balance sheets, as management does not anticipate receiving any significant distributions from these residual interests in the foreseeable future. During the years ended December 31, 2015, 2014 and 2013, SGGH received $0.2 million, $0.4 million and zero, respectively.
We also have repurchase reserve liabilities related to sales of residential real estate loans by Fremont’s former business that are subject to standard industry representations and warranties that may require SGGH to repurchase certain loans. Additional information concerning the repurchase reserve included in discontinued operations is included in Note 20—Discontinued Operations in the notes to consolidated financial statements included in Part IV, Item 15 of this Annual Report.
Recent Accounting Standards
The FASB issues and updates accounting standards on a regular basis. For a discussion of recently issued or updated accounting standards that are relevant to our operations, please refer to Note 2—Financial Statement Presentation and Significant Accounting Policies in the notes to consolidated financial statements included in Part IV, Item 15 of this Annual Report.
The following quantitative and qualitative disclosures about market risk include “forward-looking statements” that involve risk and uncertainties. Actual results could differ materially from those projected in the forward-looking statements.
The potential for changes in the value of financial instruments is referred to as market risk. Our consolidated balance sheets include assets and liabilities whose fair values are subject to market risks. As of December 31, 2015, our significant market risks are primarily associated with interest rates, credit, equity prices, specifically the fair value of our own common stock, commodities and foreign currencies. The following sections address the significant market risks associated with our business activities.
Interest Rate Risk
Real Alloy is subject to interest rate risk related to its variable rate debt. Based on the outstanding variable rate debt in the year ended December 31, 2015, a 1.0% increase in interest rates under its variable rate debt agreements would have resulted in increased interest expense of $0.2 million. This sensitivity analysis of the effect of a change in interest rates on long-term debt considers only variable rate debt outstanding in the year ended December 31, 2015 and does not consider future potential changes in long-term variable rate debt levels.
Credit Risk
We are primarily exposed to credit risk with our cash equivalents, trade accounts receivables and financing receivable. We do not believe that our cash equivalents present significant credit risk because the counterparties to the instruments consist of major financial institutions. Our cash and cash equivalents as of December 31, 2015 consists principally of cash balances in noninterest bearing checking accounts and money market funds. Substantially all trade accounts receivable balances are unsecured. There is not a significant concentration of credit risk with respect to trade receivables, although the top ten customers of Real Alloy represent approximately 59.7% of the total trade accounts receivable as of December 31, 2015. The financing receivable is due from one global financial institution for which we believe the risk of loss is minimal as of December 31, 2015.
51
The fair value of our common stock warrant liability is impacted to a minor extent by changes in interest rates, but the major fair value driver is the market value of our own common stock. The following table illustrates the impact of increases and decreases in the fair value of our common stock on the fair value of our common stock warrant liability. It is assumed that the increase or decrease in the fair value of our common stock occurs immediately and uniformly to each category of instrument containing interest rate risk, and that there are no significant changes to other factors used to determine the value of the instrument. The hypothetical changes in the fair value of our common stock do not reflect what could be deemed “best” or “worst” case scenarios. Variations in the fair value of our common stock could produce significant changes in other assumptions in the valuation of the common stock warrant liability, for example the actual exercise multiple may be significantly different than that assumed in our estimate of fair value. For these reasons, actual results may differ significantly from those reflected in the table.
|
|
|
|
|
|
Estimated Fair Value after Hypothetical Change in Fair Value of Real Industry Common Stock |
|
|||||||||||||
|
(In millions) |
Estimated Fair Value |
|
|
15% Decrease |
|
|
15% Increase |
|
|
30% Decrease |
|
|
30% Increase |
|
|||||
|
Common stock warrant liability: |
|
|
|
|
|
|
|
|
|
|
|
|
|
|
|
|
|
|
|
|
As of December 31, 2015 |
$ |
6.9 |
|
|
$ |
5.6 |
|
|
$ |
8.3 |
|
|
$ |
4.4 |
|
|
$ |
9.7 |
|
|
As of December 31, 2014 |
|
5.6 |
|
|
|
4.7 |
|
|
|
6.6 |
|
|
|
3.8 |
|
|
|
7.7 |
|
Commodity Price Risk
In the ordinary course of our business, we are exposed to earnings and cash flow volatility resulting from changes in the price of aluminum, and, to a lesser extent, hardeners such as silicon and copper, and energy. To mitigate the risks, Real Alloy engages in hedging strategies. For metal hedges, we use derivative instruments, such as forwards, futures, options, collars and swaps to manage the effect, both favorable and unfavorable, of such changes. For electricity and some natural gas price exposures, fixed price commitments are used.
Derivative contracts are used primarily to reduce uncertainty and volatility and cover underlying exposures and are held for purposes other than trading. Our commodity and derivative activities are subject to the management, direction and control of our Risk Management Committee, which is composed of our CEO, CFO, other officers and employees, as designated by the Audit Committee of the Board.
We are exposed to losses in the event of nonperformance by the counterparties to the derivative contracts discussed below. Although nonperformance by counterparties is possible, we do not currently anticipate any nonperformance by any of these parties. Counterparties are evaluated for creditworthiness and risk assessment prior to our initiating contract activities. The counterparties’ creditworthiness is monitored on an ongoing basis, and credit levels are reviewed to ensure that there is not an inappropriate concentration of credit outstanding to any particular counterparty.
Metal Hedging
Primarily in our RAEU segment, LME future swaps or forward contracts are sold as metal is purchased to fill fixed-price customer sales orders. As sales orders are priced, LME future or forward contracts are purchased, which generally settle within six months. Real Alloy may also buy put option contracts for managing metal price exposures. Option contracts require the payment of a premium, which is recorded as a realized loss upon settlement or expiration of the option contract. Upon settlement of put option contracts, Real Alloy receives cash and recognizes a related gain if the LME closing price is less than the strike price of the put option. If the put option strike price is less than the LME closing price, no amount is paid and the option expires. As of December 31, 2015, Real Alloy had 24.6 thousand metric tonnes of metal buy and sell derivative contracts.
Natural Gas Hedging
We monitor Real Alloy’s natural gas purchase requirements and, in order to manage price exposure, the future price of a portion of the natural gas requirements may be fixed by entering into financial hedge agreements. Under these swap agreements, payments are made or received based on the differential between the monthly closing price on the NYMEX and the contractual derivative price. Natural gas cost can also be managed through the use of cost escalators included in some long-term supply contracts with customers, which limits exposure to natural gas price risk. As of December 31, 2015, Real Alloy had 1.9 trillion of British thermal unit forward buy contracts.
52
Fair Values and Sensitivity Analysis
The following table shows the fair values of outstanding net liability derivative contracts as of December 31, 2015, and the effect on the fair value of a hypothetical adverse change in the market prices that existed as of December 31, 2015:
|
(In millions) |
Fair Value |
|
|
Impact of a Hypothetical 10% Adverse Price Change |
|
||
|
Metal derivatives |
$ |
(0.1 |
) |
|
$ |
(0.3 |
) |
|
Natural gas |
|
(0.6 |
) |
|
|
(0.5 |
) |
The disclosures above do not take into account the underlying commitments or anticipated transactions. If the underlying items were included in the analysis, the gains or losses on our derivative instruments would be offset by gains and losses realized on the purchase of the physical commodities. Actual results will be determined by a number of factors outside of our control and could vary significantly from the amounts disclosed. For additional information on derivative financial instruments, see Note 18—Derivatives and Other Financial Instruments and Fair Value Measurements included in the notes to consolidated financial statements included in Part IV, Item 15 of this Annual Report.
Currency Exchange Risk
The financial condition and results of operations of a majority of our international operating subsidiaries are reported in various currencies and then translated into USD at the applicable exchange rate for inclusion in our consolidated financial statements. As a result, appreciation of the U.S. dollar against these currencies will, generally, have a negative impact on reported revenues and operating profit, while depreciation of the U.S. dollar against these currencies will, generally, have a positive effect on reported revenues and operating profit. In addition, a portion of the revenues generated by our international operations are denominated in U.S. dollars, while the majority of costs incurred are denominated in local currencies. As a result, appreciation in the U.S. dollar will have a positive impact on earnings, while depreciation of the U.S. dollar will have a negative impact on earnings.
While it is difficult to quantify any particular impact of changes in exchange rates, a uniform 10% strengthening of the U.S. dollar (presuming all other variables are held constant) would have resulted in a decrease in net earnings of $0.1 million for the year ended December 31, 2015. Comparatively, a 10% weakening of the U.S. dollar would have resulted in an increase in net earnings of $0.1 million during the period. This sensitivity analysis of the effect of a change in foreign currency exchange rates does not factor in future changes in sales levels or local currency prices or costs.
The information required by this Item 8 is incorporated by reference to the Real Industry, Inc. consolidated financial statements and Reports of Independent Registered Public Accounting Firms in Part IV, Item 15 of this Annual Report.
None.
Evaluation of Disclosure Controls and Procedures
As of the end of the period covered by this Annual Report, management, with the participation of our CEO and CFO, performed an evaluation of the effectiveness of our disclosure controls and procedures as defined in Rules 13a-15(e) and 15d-15(e) of the Exchange Act. Our disclosure controls and procedures are designed to provide reasonable assurance that information required to be disclosed in the reports we file or submit under the Exchange Act is recorded, processed, summarized and reported within the time periods specified in the Commission’s rules and forms, and that such information is accumulated and communicated to our management, including our CEO and CFO, to allow timely decisions regarding required disclosures.
53
As disclosed in our quarterly reports on Form 10-Q for the periods ended June 30, 2015 and September 30, 2015, our CEO and CFO identified a material weakness in our internal control over financial reporting. The identified material weakness pertains to control deficiencies in our financial close process, specifically accounting for the Real Alloy Acquisition, including the lack of effective oversight and review of various analyses and reconciliations, and the inability to meet external financial reporting deadlines. The material weakness was caused by the significant level of activity related to accounting for the Real Alloy Acquisition, the integration of the Real Alloy Business, a manual consolidation process, and the complexity of the Real Alloy Acquisition and the associated purchase accounting.
Also as described in our quarterly reports on Form 10-Q for the periods ended June 30, 2015 and September 30, 2015, and as discussed below, we have taken steps to remediate a number of the aspects of this material weakness; however, our CEO and CFO have concluded that our disclosure controls and procedures were not effective as of December 31, 2015, as our process to account for the Real Alloy Acquisition, a 2015 event, was not remediated by year-end.
Notwithstanding this material weakness in accounting for the Real Alloy Acquisition, management concluded that the consolidated financial statements included in this Annual Report present fairly, in all material respects, the financial position of the Company at December 31, 2015 in conformity with GAAP and our external auditors have issued an unqualified opinion on our consolidated financial statements as of and for the year ended December 31, 2015. This material weakness has no impact on our consolidated financial statements in prior years.
Management's Report on Internal Control over Financial Reporting
Management is responsible for establishing and maintaining adequate internal control over financial reporting, as defined in the Exchange Act. Internal control over financial reporting is a process designed to provide reasonable assurance regarding the reliability of financial reporting and the preparation of financial statements in accordance with GAAP. The effectiveness of any system of internal control over financial reporting is subject to inherent limitations, including the exercise of judgment in designing, implementing, operating and evaluating internal control over financial reporting. Because of these inherent limitations, internal control over financial reporting cannot provide absolute assurance regarding the reliability of financial reporting and the preparation of financial statements in accordance with GAAP and may not prevent or detect misstatements. Also, projections of any evaluation of effectiveness to future periods are subject to the risk that our internal control over financial reporting may become inadequate because of changes in conditions or other factors, or that the degree of compliance with the policies or procedures may deteriorate. Therefore, even those systems determined to be effective can provide only reasonable assurance of achieving their control objectives.
Management assessed the effectiveness of our internal control over financial reporting as of December 31, 2015, as required under Section 404 of the Sarbanes-Oxley Act of 2002. In making this assessment, we used the criteria set forth by the Committee of Sponsoring Organizations of the Treadway Commission (COSO) in Internal Control—Integrated Framework (2013 Framework). Based on this assessment, management concluded that, as of December 31, 2015, the Company’s internal control over financial reporting was not effective, due to the material weakness described below.
A material weakness is a deficiency, or combination of deficiencies, in internal control over financial reporting such that there is a reasonable possibility that a material misstatement of our annual or interim consolidated financial statements will not be prevented or detected on a timely basis.
The material weakness in internal control over financial reporting resulted from the inadequate design and operation of internal controls related to the accounting for the Real Alloy Acquisition, specifically the review of the completeness and accuracy of key assumptions and financial data utilized in estimating the fair value of long-lived assets, the review of the accounting for intercompany loans arising from the Real Alloy Acquisition, as well the lack of documentation evidencing management’s review of the work of specialists. The control deficiencies surrounding the Real Alloy Acquisition created a reasonable possibility that a material misstatement to the consolidated financial statements may not be prevented or detected on a timely basis, and therefore we concluded that the deficiencies represent a material weakness.
Ernst & Young LLP, an independent registered public accounting firm, issued an attestation report on the effectiveness of the Company’s internal control over financial reporting as December 31, 2015, which is included below, under “Report of Independent Registered Public Accounting Firm.”
54
Remediation Efforts to Address Identified Material Weakness
Our management takes internal controls and the integrity of the Company’s consolidated financial statements seriously and believes that the remediation efforts described below are essential to maintaining strong and effective internal control over financial reporting, and a strong internal control environment. We are committed to ensuring that the Company’s controls are designed and operating effectively and have taken significant steps to remediate the material weakness reported in the periods ended June 30, 2015 and September 30, 2015, including:
|
|
· |
We developed an in-house internal audit function to assist management in designing more robust processes and controls within the Company, particularly related to complex accounting areas such as purchase accounting and transactions not in the ordinary course of operations; |
|
|
· |
We hired a new director of accounting and financial reporting at our Real Alloy operation, with significant technical accounting and SEC reporting experience; |
|
|
· |
We developed and implemented processes around the consolidation and financial reporting process, including supplementing controls over unusual transactions, review of account reconciliations and other oversight by financial leadership within the Company; |
|
|
· |
We have taken steps to automate our financial reporting and consolidation processes and added controls around the remaining manual consolidation activities; and |
|
|
· |
We invested significantly in support and training for our financial reporting group as a demonstration of management’s commitment to ensuring a strong internal control over financial reporting process for the Company with effective disclosure controls and procedures. |
We timely filed our quarterly report on Form 10-Q for the period ended September 30, 2015 and this Annual Report as a result of the remediation efforts through year-end and as part of our year-end close process.
Since December 31, 2015, we have continued to enhance the design and related documentation of management review controls over business combinations and purchase accounting based on the deficiencies identified in accounting for the Real Alloy Acquisition in 2015, which will be used and assessed in future acquisitions. Additionally, we have continued to invest in support and training for our entire finance and accounting department, including Real Alloy’s employees, as a demonstration of management’s commitment to ensuring a strong internal control environment.
We believe these measures have strengthened our internal controls over financial reporting and will prevent a reoccurrence of the material weakness described above. Our remediation efforts are subject to ongoing management review, as well as Audit Committee oversight. As we continue to evaluate and work to improve our internal control over financial reporting, management may take additional measures to modify and strengthen the remediation efforts.
Changes in Internal Control over Financial Reporting
The Real Alloy Acquisition represented a considerable transformation for us, with Real Alloy now serving as our primary business. The transition services agreement with Aleris, under which Aleris will continue providing specified services for up to twenty-four months following the acquisition, including treasury, accounts payable, cash management, payroll, credit and collection services, has had a material impact on the Company’s internal control over financial reporting. In conjunction with and following the Real Alloy acquisition, we implemented controls during the year to address risks inherent in the integration and reporting processes at Real Alloy, as well as the transition services being provided by Aleris.
In addition, the Company has taken actions to remediate the material weakness relating to internal control over financial reporting, as described above.
Except as otherwise described above, there was no change in our internal control over financial reporting that occurred during the period covered by this Report that has materially affected, or is reasonably likely to materially affect, our internal control over financial reporting.
55
REPORT OF INDEPENDENT REGISTERED PUBLIC ACCOUNTING FIRM
To the Board of Directors and Stockholders of
Real Industry, Inc.
We have audited Real Industry, Inc.’s internal control over financial reporting as of December 31, 2015, based on criteria established in Internal Control—Integrated Framework issued by the Committee of Sponsoring Organizations of the Treadway Commission (2013 framework) (the COSO criteria). Real Industry, Inc.’s management is responsible for maintaining effective internal control over financial reporting, and for its assessment of the effectiveness of internal control over financial reporting included in the accompanying Report of Management on Internal Control over Financial Reporting. Our responsibility is to express an opinion on the company’s internal control over financial reporting based on our audit.
We conducted our audit in accordance with the standards of the Public Company Accounting Oversight Board (United States). Those standards require that we plan and perform the audit to obtain reasonable assurance about whether effective internal control over financial reporting was maintained in all material respects. Our audit included obtaining an understanding of internal control over financial reporting, assessing the risk that a material weakness exists, testing and evaluating the design and operating effectiveness of internal control based on the assessed risk, and performing such other procedures as we considered necessary in the circumstances. We believe that our audit provides a reasonable basis for our opinion.
A company’s internal control over financial reporting is a process designed to provide reasonable assurance regarding the reliability of financial reporting and the preparation of financial statements for external purposes in accordance with generally accepted accounting principles. A company’s internal control over financial reporting includes those policies and procedures that (1) pertain to the maintenance of records that, in reasonable detail, accurately and fairly reflect the transactions and dispositions of the assets of the company; (2) provide reasonable assurance that transactions are recorded as necessary to permit preparation of financial statements in accordance with generally accepted accounting principles, and that receipts and expenditures of the company are being made only in accordance with authorizations of management and directors of the company; and (3) provide reasonable assurance regarding prevention or timely detection of unauthorized acquisition, use, or disposition of the company’s assets that could have a material effect on the financial statements.
Because of its inherent limitations, internal control over financial reporting may not prevent or detect misstatements. Also, projections of any evaluation of effectiveness to future periods are subject to the risk that controls may become inadequate because of changes in conditions, or that the degree of compliance with the policies or procedures may deteriorate.
A material weakness is a deficiency, or combination of deficiencies, in internal control over financial reporting, such that there is a reasonable possibility that a material misstatement of the company’s annual or interim financial statements will not be prevented or detected on a timely basis. The following material weakness has been identified and included in management’s assessment. Management has identified a material weakness in controls related to the company’s accounting for business combinations process. We also have audited, in accordance with the standards of the Public Company Accounting Oversight Board (United States), the consolidated balance sheet of Real Industry, Inc. as of December 31, 2015, and the related consolidated statements of operations, comprehensive income (loss), stockholders’ equity and cash flows for the year then ended. This material weakness was considered in determining the nature, timing and extent of audit tests applied in our audit of the 2015 financial statements, and this report does not affect our report dated March 14, 2016, which expressed an unqualified opinion on those financial statements.
In our opinion, because of the effect of the material weakness described above on the achievement of the objectives of the control criteria, Real Industry, Inc. has not maintained effective internal control over financial reporting as of December 31, 2015, based on the COSO criteria.
/s/ Ernst & Young LLP
Cleveland, Ohio
March 14, 2016
None.
56
The information required by this item is set forth under the captions “Election of Directors,” “Executive Officers,” “Code of Conduct,” “Section 16(a) Beneficial Ownership Reporting Compliance,” and “Corporate Governance and Board Matters” in the Company’s Definitive Proxy Statement to be filed with the SEC for our 2016 Proxy Statement, and is incorporated herein by reference.
The information required by this item is set forth under the captions “Executive Compensation and Other Information,” “Corporate Governance and Board Matters—Director Compensation,” “Compensation Discussion and Analysis,” “Compensation Committee Interlocks,” “Compensation Committee Report,” and “Payments Upon Termination and Change in Control” in the 2016 Proxy Statement, and is incorporated herein by reference.
|
Item 12. |
Security Ownership of Certain Beneficial Owners and Management and Related Stockholder Matters |
The information required by this item is set forth under the captions “Equity Compensation Plan Information” and “Security Ownership of Management and Certain Beneficial Owners,” in the 2016 Proxy Statement, and is incorporated herein by reference.
The information required by this item is set forth under the captions “Certain Relationships and Related Transactions” and “Corporate Governance and Board Matters—Director Independence,” in the 2016 Proxy Statement, and is incorporated herein by reference.
The information required by this item is set forth under the caption “Audit Information—Fees Paid to Independent Registered Public Accounting Firms,” in the 2016 Proxy Statement, and is incorporated herein by reference.
57
|
|
(a) |
We have omitted financial statement schedules because they are not required or are not applicable or the required information is shown in the consolidated financial statements and notes thereto. See Item 8. |
Documents filed as part of this Annual Report:
|
Exhibit Number |
|
|
Description |
|
Form |
|
File No. |
|
Exhibit Number |
|
Filing Date |
|
Filed Herewith |
|
2.1 |
|
|
Stock Purchase Agreement, dated July 29, 2011, among Signature Group Holdings, Inc., North American Breaker Co., Inc. and the shareholders of North American Breaker Co., Inc. |
|
8-K |
|
001-08007 |
|
2.11 |
|
August 1, 2011 |
|
|
|
2.2 |
|
|
Agreement and Plan of Merger, dated November 25, 2013, among Signature Group Holdings, Inc., a Nevada corporation, SGH Holdco, Inc., a Delaware corporation, and SGH Merger Sub LLC, a Delaware limited liability company |
|
424(b)(3) |
|
333-191685 |
|
Annex A |
|
November 27, 2013 |
|
|
|
2.3 |
|
|
Purchase and Sale Agreement, dated as of October 17, 2014, by and among Aleris Corporation, Aleris International, Inc., Aleris Aluminum Netherlands, B.V., Aleris Deutschland Holding GmbH, Aleris Holding Canada Limited, Dutch Aluminum C.V., Aleris Deutschland Vier GmbH Co KG, SGH Acquisition Holdco, Inc., Evergreen Holding Germany GmbH and Signature Group Holdings, Inc. |
|
8-K |
|
001-08007 |
|
2.1 |
|
October 21, 2014 |
|
|
|
2.4 |
|
|
Purchase Agreement, dated as of January 9, 2015, by and among Signature Group Holdings, Inc., SGGH, LLC, North American Breaker Co., LLC, NABCO Holding Company, LLC and North American Breaker Co., Inc. |
|
8-K |
|
001-08007 |
|
2.1 |
|
January 12, 2015 |
|
|
|
2.5 |
|
|
Amendment No. 1 to Purchase and Sale Agreement, dated as of January 26, 2015, by and between Real Alloy Holding, Inc. and Aleris Corporation |
|
8-K |
|
001-08007 |
|
2.1 |
|
January 27, 2015 |
|
|
|
2.6 |
|
|
Amendment No. 2 to Purchase and Sale Agreement, dated as of February 26, 2015, by and among Aleris Corporation and Real Alloy Holding, Inc. |
|
8-K |
|
001-08007 |
|
2.1 |
|
March 5, 2015 |
|
|
|
3.1 |
|
|
Certificate of Amendment to the Company's Second Amended and Restated Certificate of Incorporation |
|
8-K |
|
001-08007 |
|
3.1 |
|
June 1, 2015 |
|
|
|
3.2 |
|
|
Third Amended and Restated Bylaws of the Registrant |
|
10-Q |
|
001-08007 |
|
3.1 |
|
November 9, 2015 |
|
|
|
3.3 |
|
|
Form of Stock Certificate for Common Stock of Real Industry, Inc |
|
8-K |
|
001-08007 |
|
3.1 |
|
January 2, 2014 |
|
|
|
3.4 |
|
|
Certificate of Designation of Series B Non-Participating Preferred Stock of Signature Group Holdings, Inc. |
|
8-K |
|
001-08007 |
|
3.1 |
|
March 5, 2015 |
|
|
|
4.1 |
|
|
Rights Agreement, dated October 23, 2007, between the Successor Registrant (as successor in interest to Signature Nevada) and Computershare Inc. (as successor in interest to Mellon Investor Services LLC), as Rights Agent between the Company and Mellon Investor Services LLC dated October 23, 2007 |
|
8-K |
|
001-08007 |
|
4.1 |
|
October 24, 2007 |
|
|
|
4.2 |
|
|
First Amendment to the Rights Agreement, dated July 28, 2011 |
|
8-K |
|
001-08007 |
|
4.1 |
|
August 3, 2011 |
|
|
58
|
Exhibit Number |
|
|
Description |
|
Form |
|
File No. |
|
Exhibit Number |
|
Filing Date |
|
Filed Herewith |
|
|
|
Rights Agreement Amendment and Assignment, dated January 2, 2014, between Signature Nevada and Computershare |
|
8-K |
|
000-15569 |
|
4.3 |
|
January 2, 2014 |
|
|
|
|
4.4 |
|
|
Form of Certificate of Designations of Series A Junior Participating Preferred Stock of the Successor Registrant |
|
8-K |
|
000-15569 |
|
4.2 |
|
January 2, 2014 |
|
|
|
4.5 |
|
|
Form of Warrant to purchase shares of Common Stock |
|
8-K |
|
001-08007 |
|
10.2 |
|
June 17, 2010 |
|
|
|
4.6 |
|
|
Form of Registration Rights Agreement entered into between the Company and the investors thereto |
|
8-K |
|
001-08007 |
|
10.3 |
|
June 17, 2010 |
|
|
|
4.7 |
|
|
Indenture, dated January 8, 2015, by and among SGH Escrow Corporation, Real Alloy Intermediate Holding, LLC, and Wilmington Trust, National Association, as trustee. |
|
8-K |
|
001-08007 |
|
4.1 |
|
January 12, 2015 |
|
|
|
4.8 |
|
|
Form of 10% Senior Secured Note due 2019 |
|
8-K |
|
001-08007 |
|
Exhibit A1 to Exhibit 4.1 |
|
January 12, 2015 |
|
|
|
4.9 |
|
|
First Supplemental Indenture, dated as of February 27, 2015, by and among Real Alloy Holding, Inc., Real Alloy Intermediate Holding, LLC, each of the guarantors listed on the signature pages thereto, and Wilmington Trust, National Association (as trustee and notes collateral trustee). |
|
8-K |
|
001-08007 |
|
4.1 |
|
March 5, 2015 |
|
|
|
4.10 |
|
|
Form of Rule 144A 10% Senior Secured Note due 2019. |
|
8-K |
|
001-08007 |
|
4.2 |
|
March 5, 2015 |
|
|
|
4.11 |
|
|
Form of Regulation S 10% Senior Secured Note due 2019. |
|
8-K |
|
001-08007 |
|
4.3 |
|
March 5, 2015 |
|
|
|
4.12 |
|
|
Form of Series B Preferred Stock Certificate. |
|
8-K |
|
001-08007 |
|
4.4 |
|
March 5, 2015 |
|
|
|
4.13 |
|
|
Form of Indenture with respect to Debt Securities |
|
S-3 |
|
333-207311 |
|
4.5 |
|
October 7, 2015 |
|
|
|
4.14 |
|
|
Form of Debt Securities |
|
S-3 |
|
333-207311 |
|
4.6 |
|
October 7, 2015 |
|
|
|
4.15 |
|
|
Form of Warrant |
|
S-3 |
|
333-207311 |
|
4.7 |
|
October 7, 2015 |
|
|
|
4.16 |
|
|
Form of Warrant Agreement |
|
S-3 |
|
333-207311 |
|
4.8 |
|
October 7, 2015 |
|
|
|
4.17 |
|
|
Form of Subscription Rights Agreement (including form of rights certificate) |
|
S-3 |
|
333-207311 |
|
4.9 |
|
October 7, 2015 |
|
|
|
4.18 |
|
|
Form of Unit Agreement |
|
S-3 |
|
333-207311 |
|
4.1 |
|
October 7, 2015 |
|
|
|
10.1 |
* |
|
Amended and Restated Signature Group Holdings, Inc. 2006 Performance Incentive Plan |
|
S-8 |
|
001-08007 |
|
4.1 |
|
May 7, 2012 |
|
|
|
10.2 |
* |
|
Form of Restricted Stock Agreement for use with the 2006 Performance Incentive Plan |
|
10-K |
|
001-08007 |
|
10.2 |
|
April 1, 2013 |
|
|
|
10.3 |
* |
|
Form of Incentive Stock Option Agreement for use with the 2006 Performance Incentive Plan |
|
10-K |
|
001-08007 |
|
10.3 |
|
April 1, 2013 |
|
|
|
10.4 |
* |
|
Form of Nonqualified Stock Option Agreement for use with the 2006 Performance Incentive Plan |
|
10-K |
|
001-08007 |
|
10.4 |
|
April 1, 2013 |
|
|
|
10.5 |
* |
|
Real Industry, Inc. Amended and Restated 2015 Equity Award Plan |
|
8-K |
|
001-08007 |
|
10.1 |
|
June 1, 2015 |
|
|
|
10.6 |
* |
|
Form of Real Industry, Inc. Amended and Restated 2015 Equity Award Plan Restricted Stock Award Agreement for Directors |
|
10-Q |
|
001-08007 |
|
4.1 |
|
August 17, 2015 |
|
|
|
10.7 |
* |
|
Form of Real Industry, Inc. Amended and Restated 2015 Equity Award Plan Restricted Stock Award Agreement for Employees |
|
10-Q |
|
001-08007 |
|
4.2 |
|
August 17, 2015 |
|
|
|
10.8 |
* |
|
Form of Real Industry, Inc. Amended and Restated 2015 Equity Award Plan Incentive Stock Option Award Agreement |
|
10-Q |
|
001-08007 |
|
4.3 |
|
August 17, 2015 |
|
|
59
|
Exhibit Number |
|
|
Description |
|
Form |
|
File No. |
|
Exhibit Number |
|
Filing Date |
|
Filed Herewith |
|
* |
|
Form of Real Industry, Inc. Amended and Restated 2015 Equity Award Plan Nonqualified Stock Option Award Agreement |
|
10-Q |
|
001-08007 |
|
4.4 |
|
August 17, 2015 |
|
|
|
|
10.10 |
* |
|
Form of Real Industry, Inc. Amended and Restated 2015 Equity Award Plan Restricted Stock Unit Agreement |
|
10-Q |
|
001-08007 |
|
4.5 |
|
August 17, 2015 |
|
|
|
10.11 |
* |
|
Amended and Restated Real Industry, Inc. 2015 Equity Award Plan TSR Performance Award Agreement |
|
8-K |
|
001-08007 |
|
10.1 |
|
February 25, 2016 |
|
|
|
10.12 |
* |
|
Employment Agreement, dated June 4, 2013, by and between Signature Group Holdings, Inc. and Craig T. Bouchard |
|
8-K |
|
001-08007 |
|
10.2 |
|
June 5, 2013 |
|
|
|
10.13 |
* |
|
Letter Agreement, dated November 8, 2013, by and between Signature Group Holdings, Inc. and Craig T. Bouchard, related to his Employment Agreement, dated June 4, 2013, reflecting adjustments related to the Reverse Split |
|
10-Q |
|
001-08007 |
|
10.1 |
|
November 13, 2013 |
|
|
|
10.14 |
* |
|
Restricted Stock Agreement, dated June 5, 2013, by and between Signature Group Holdings, Inc. and Craig T. Bouchard |
|
8-K |
|
001-08007 |
|
10.2 |
|
June 5, 2013 |
|
|
|
10.15 |
* |
|
Amendment to Restricted Stock Agreement, dated July 16, 2013, by and between Signature Group Holdings, Inc. and Craig T. Bouchard |
|
8-K |
|
001-08007 |
|
10.1 |
|
July 18, 2013 |
|
|
|
10.16 |
* |
|
Nonqualified Stock Option Agreement, dated June 5, 2013, by and between Signature Group Holdings, Inc. and Craig T. Bouchard |
|
8-K |
|
001-08007 |
|
10.2 |
|
June 5, 2013 |
|
|
|
10.17 |
* |
|
Performance Share Agreement, dated as of June 1, 2015, between the Company and Craig T. Bouchard |
|
8-K |
|
001-08007 |
|
10.2 |
|
June 1, 2015 |
|
|
|
10.18 |
* |
|
Evergreen Employment Agreement, dated August 1, 2014, between Kyle C. Ross and the Company |
|
8-K |
|
001-08007 |
|
10.1 |
|
August 5, 2014 |
|
|
|
10.19 |
* |
|
Evergreen Employment Agreement dated March 31, 2015 between John Miller and Signature Group Holdings, Inc. |
|
8-K |
|
001-08007 |
|
10.1 |
|
April 2, 2015 |
|
|
|
10.20 |
* |
|
Release and Waiver Agreement, dated as of May 27, 2015, between the Company and Christopher Manderson |
|
8-K |
|
001-08007 |
|
10.3 |
|
June 1, 2015 |
|
|
|
10.21 |
|
|
Form of Indemnification Agreement |
|
8-K |
|
001-08007 |
|
10.7 |
|
June 17, 2010 |
|
|
|
10.22 |
|
|
Stock Purchase Agreement by and between Signature Group Holdings, Inc., a Delaware corporation, and Kettle Hill Partners, LP and Kettle Hill Partners II, LP, dated October 27, 2014 |
|
8-K |
|
001-08007 |
|
10.1 |
|
October 29, 2014 |
|
|
|
10.23 |
|
|
Registration Rights Agreement by and between Signature Group Holdings, Inc., a Delaware corporation, and Kettle Hill Partners, LP and Kettle Hill Partners II, LP, dated October 27, 2014 |
|
8-K |
|
001-08007 |
|
10.2 |
|
October 29, 2014 |
|
|
|
10.24 |
|
|
Purchase Agreement, dated December 23, 2014, between SGH Escrow Corporation and Goldman Sachs & Co., Deutsche Bank Securities Inc. As Representatives of the several Purchasers named in Schedule I hereto |
|
8-K |
|
001-08007 |
|
10.1 |
|
December 24, 2014 |
|
|
|
10.25 |
|
|
Pledge and Security Agreement, dated as of February 27, 2015, by and among each of the grantor parties listed on the signature page thereto and Wilmington Trust, National Association (as notes collateral trustee). |
|
8-K |
|
001-08007 |
|
10.1 |
|
March 5, 2015 |
|
|
60
|
Exhibit Number |
|
|
Description |
|
Form |
|
File No. |
|
Exhibit Number |
|
Filing Date |
|
Filed Herewith |
|
|
|
Revolving Credit Agreement, dated as of February 27, 2015, by and among Real Alloy Recycling, Inc. (formerly known as Aleris Recycling, Inc.) for itself and as representative of other borrowers, Real Alloy Canada Ltd. (formerly known as Aleris Specification Alloy Products Canada Company), General Electric Capital Corporation, for itself as a lender, letter of credit issuer, and swingline lender and as agent for all lenders, and Wintrust Bank, as a lender. |
|
8-K |
|
001-08007 |
|
10.2 |
|
March 5, 2015 |
|
|
|
|
10.27 |
|
|
U.S. Revolving Guarantee and Security Agreement, dated as of February 27, 2015, by and among Real Alloy Recycling, Inc. (formerly known as Aleris Recycling, Inc.), each other U.S. borrower and grantor thereunder from time to time, and General Electric Capital Corporation, as agent. |
|
8-K |
|
001-08007 |
|
10.3 |
|
March 5, 2015 |
|
|
|
10.28 |
|
|
Canadian Revolving Guarantee and Security Agreement, dated as of February 27, 2015, by and among Real Alloy Canada Ltd. (formerly known as Aleris Specification Alloy Products Canada Company), each other grantor thereunder from time to time, and General Electric Capital Corporation, as agent. |
|
8-K |
|
001-08007 |
|
10.4 |
|
March 5, 2015 |
|
|
|
10.29 |
|
|
Intercreditor Agreement, dated as of February 27, 2015, by and among General Electric Capital Corporation, as North America ABL Agent, and Wilmington Trust, National Association, as Notes Collateral Trustee, and acknowledged and agreed to by Real Alloy Intermediate Holding, LLC, Real Alloy Holding, Inc. |
|
8-K |
|
001-08007 |
|
10.5 |
|
March 5, 2015 |
|
|
|
10.30 |
|
|
Factoring Agreement, dated as of February 27, 2015, by and between GE Capital Bank AG and Aleris Recycling (German Works) GmbH. |
|
8-K |
|
001-08007 |
|
10.6 |
|
March 5, 2015 |
|
|
|
10.31 |
* |
|
Employment Agreement dated March 12, 2015 between Real Alloy Holding, Inc. and Terrance J. Hogan. |
|
8-K |
|
001-08007 |
|
10.1 |
|
March 13, 2015 |
|
|
|
10.32 |
|
|
Amendment to Commitment Letter, dated January 7, 2015, by and among Chatham Asset Management, LLC, Zell Credit Opportunities Master Fund L.P., and Signature Group Holdings, Inc. |
|
8-K |
|
001-08007 |
|
10.1 |
|
January 12, 2015 |
|
|
|
10.33 |
|
|
Amendment to Commitment Letter, dated January 8, 2015, by and among General Electric Capital Corporation, GE Capital Markets, Inc., and Signature Group Holdings, Inc. |
|
8-K |
|
001-08007 |
|
10.2 |
|
January 12, 2015 |
|
|
|
10.34 |
|
|
Amendment to Commitment Letter, dated January 14, 2015, by and between GE Capital Bank AG and Signature Group Holdings, Inc. |
|
8-K |
|
001-08007 |
|
10.1 |
|
January 21, 2015 |
|
|
|
10.35 |
|
|
Amended and Restated Backstop Agreement, dated as of January 26, 2015, by and between Signature Group Holdings, Inc. and Aleris Corporation |
|
8-K |
|
001-08007 |
|
10.1 |
|
January 27, 2015 |
|
|
|
16.1 |
|
|
Letter from Squar, Milner, Peterson, Miranda & Williamson, LLP addressed to the Securities and Exchange Commission, dated as of March 16, 2015 |
|
8-K |
|
001-08007 |
|
16.1 |
|
March 19, 2015 |
|
X |
|
21 |
|
|
Subsidiaries of the Company |
|
|
|
|
|
|
|
|
|
X |
|
23.1 |
|
|
Consent of Ernst & Young LLP |
|
|
|
|
|
|
|
|
|
X |
61
|
Exhibit Number |
|
|
Description |
|
Form |
|
File No. |
|
Exhibit Number |
|
Filing Date |
|
Filed Herewith |
|
|
|
Consent of Squar Milner LLP |
|
|
|
|
|
|
|
|
|
X |
|
|
31.1 |
|
|
Certification of Chief Executive Officer Pursuant to Rules 13a-14(a) or 15d-14(a) under the Securities Exchange Act of 1934, as amended |
|
|
|
|
|
|
|
|
|
X |
|
31.2 |
|
|
Certification of Chief Financial Officer Pursuant to Rules 13a-14(a) or 15d-14(a) under the Securities Exchange Act of 1934, as amended |
|
|
|
|
|
|
|
|
|
X |
|
32.1 |
|
|
Certification of Chief Executive Officer Pursuant to 18 U.S.C. Section 1350 |
|
|
|
|
|
|
|
|
|
X |
|
32.2 |
|
|
Certification of Chief Financial Officer Pursuant to 18 U.S.C. Section 1350 |
|
|
|
|
|
|
|
|
|
X |
|
101.INS |
|
|
XBRL Instance Document |
|
|
|
|
|
|
|
|
|
X |
|
101.SCH |
|
|
XBRL Taxonomy Extension Schema Document |
|
|
|
|
|
|
|
|
|
X |
|
101.CAL |
|
|
XBRL Taxonomy Extension Calculation Linkbase Document |
|
|
|
|
|
|
|
|
|
X |
|
101.DEF |
|
|
XBRL Taxonomy Extension Definition Linkbase Document |
|
|
|
|
|
|
|
|
|
X |
|
101.LAB |
|
|
XBRL Taxonomy Extension Label Linkbase Document |
|
|
|
|
|
|
|
|
|
X |
|
101.PRE |
|
|
XBRL Taxonomy Extension Presentation Linkbase Document |
|
|
|
|
|
|
|
|
|
X |
|
|
* |
|
Management or compensatory plans or arrangements. |
|
|
|
|
|
|
|
|
|
|
62

Real Industry, Inc.
|
INDEX TO CONSOLIDATED FINANCIAL STATEMENTS |
Page |
|
|
|
|
Report of Independent Registered Public Accounting Firm – Consolidated Financial Statements – 2015 |
F-2 |
|
|
|
|
F-3 |
|
|
Consolidated Financial Statements: |
|
|
|
|
|
Consolidated Balance Sheets as of December 31, 2015 and 2014 |
F-4 |
|
|
|
|
Consolidated Statements of Operations for the years ended December 31, 2015, 2014 and 2013 |
F-5 |
|
|
|
|
F-6 |
|
|
|
|
|
F-7 |
|
|
|
|
|
Consolidated Statements of Cash Flows for the years ended December 31, 2015, 2014 and 2013 |
F-9 |
|
|
|
|
F-10 |
REPORT OF INDEPENDENT REGISTERED PUBLIC ACCOUNTING FIRM
To the Board of Directors and Stockholders of
Real Industry, Inc.
We have audited the accompanying consolidated balance sheet of Real Industry, Inc. as of December 31, 2015, and the related consolidated statements of operations, comprehensive income (loss), stockholders’ equity and cash flows for the year then ended. These financial statements are the responsibility of the Company’s management. Our responsibility is to express an opinion on these financial statements based on our audit.
We conducted our audit in accordance with the standards of the Public Company Accounting Oversight Board (United States). Those standards require that we plan and perform the audit to obtain reasonable assurance about whether the financial statements are free of material misstatement. An audit includes examining, on a test basis, evidence supporting the amounts and disclosures in the financial statements. An audit also includes assessing the accounting principles used and significant estimates made by management, as well as evaluating the overall financial statement presentation. We believe that our audit provides a reasonable basis for our opinion.
In our opinion, the financial statements referred to above present fairly, in all material respects, the consolidated financial position of Real Industry, Inc. at December 31, 2015, and the consolidated results of its operations and its cash flows for the year then ended in conformity with U.S. generally accepted accounting principles.
We also have audited, in accordance with the standards of the Public Company Accounting Oversight Board (United States), Real Industry, Inc.’s internal control over financial reporting as of December 31, 2015, based on criteria established in Internal Control-Integrated Framework issued by the Committee of Sponsoring Organizations of the Treadway Commission (2013 framework) and our report dated March 14, 2016, expressed an adverse opinion thereon.
/s/ Ernst & Young LLP
Cleveland, Ohio
March 14, 2016
F-2
REPORT OF INDEPENDENT REGISTERED PUBLIC ACCOUNTING FIRM
To the Board of Directors and Stockholders of
Real Industry, Inc.
We have audited the accompanying consolidated balance sheet of Real Industry, Inc. and subsidiaries (the “Company”) as of December 31, 2014, and the related consolidated statements of operations, comprehensive loss, changes in stockholders’ equity, and cash flows for each of the two years in the period ended December 31, 2014. These financial statements are the responsibility of the Company’s management. Our responsibility is to express an opinion on these financial statements based on our audits.
We conducted our audits in accordance with the standards of the Public Company Accounting Oversight Board (United States). Those standards require that we plan and perform the audit to obtain reasonable assurance about whether the financial statements are free of material misstatement. An audit includes examining, on a test basis, evidence supporting the amounts and disclosures in the financial statements. An audit also includes assessing the accounting principles used and significant estimates made by management, as well as evaluating the overall financial statement presentation. We believe that our audits provide a reasonable basis for our opinion.
In our opinion, the consolidated financial statements referred to above present fairly, in all material respects, the financial position of the Company as of December 31, 2014, and the results of their operations and their cash flows for each of the two years in the period ended December 31, 2014, in conformity with U.S. generally accepted accounting principles.
/s/ Squar Milner LLP
Los Angeles, California
October 6, 2015
F-3
PART I - FINANCIAL INFORMATION
|
Item 1. |
Financial Statements. |
REAL INDUSTRY, INC.
|
|
December 31, |
|
|||||
|
(In millions, except share and per share amounts) |
|
2015 |
|
|
|
2014 |
|
|
ASSETS |
|
|
|
|
|
|
|
|
Current assets: |
|
|
|
|
|
|
|
|
Cash and cash equivalents |
$ |
35.7 |
|
|
$ |
61.9 |
|
|
Trade accounts receivable, net |
|
77.2 |
|
|
|
— |
|
|
Financing receivable |
|
32.7 |
|
|
|
— |
|
|
Inventories |
|
101.2 |
|
|
|
— |
|
|
Prepaid expenses, supplies, and other current assets |
|
24.7 |
|
|
|
1.0 |
|
|
Current assets of discontinued operations |
|
0.3 |
|
|
|
18.1 |
|
|
Total current assets |
|
271.8 |
|
|
|
81.0 |
|
|
Debt and equity offering costs |
|
— |
|
|
|
14.5 |
|
|
Property, plant and equipment, net |
|
301.5 |
|
|
|
0.1 |
|
|
Intangible assets, net |
|
15.1 |
|
|
|
0.1 |
|
|
Goodwill |
|
104.3 |
|
|
|
— |
|
|
Deferred income taxes |
|
— |
|
|
|
4.9 |
|
|
Other noncurrent assets |
|
8.2 |
|
|
|
1.1 |
|
|
Noncurrent assets of discontinued operations |
|
— |
|
|
|
20.0 |
|
|
TOTAL ASSETS |
$ |
700.9 |
|
|
$ |
121.7 |
|
|
LIABILITIES, REDEEMABLE PREFERRED STOCK AND STOCKHOLDERS’ EQUITY |
|
|
|
|
|
||
|
Current liabilities: |
|
|
|
|
|
|
|
|
Trade payables |
$ |
100.9 |
|
|
$ |
— |
|
|
Accrued liabilities |
|
51.8 |
|
|
|
7.1 |
|
|
Long-term debt due within one year |
|
2.3 |
|
|
|
— |
|
|
Current liabilities of discontinued operations |
|
0.1 |
|
|
|
8.1 |
|
|
Total current liabilities |
|
155.1 |
|
|
|
15.2 |
|
|
Accrued pension benefits |
|
38.0 |
|
|
|
— |
|
|
Environmental liabilities |
|
11.7 |
|
|
|
— |
|
|
Long-term debt, net |
|
312.1 |
|
|
|
— |
|
|
Common stock warrant liability |
|
6.9 |
|
|
|
5.6 |
|
|
Deferred income taxes |
|
6.7 |
|
|
|
— |
|
|
Other noncurrent liabilities |
|
5.4 |
|
|
|
0.1 |
|
|
Noncurrent liabilities of discontinued operations |
|
0.7 |
|
|
|
15.2 |
|
|
TOTAL LIABILITIES |
|
536.6 |
|
|
|
36.1 |
|
|
Redeemable Preferred Stock, Series B; $1,000 liquidation preference per share; 100,000 and zero shares designated; 26,502 and zero shares issued and outstanding as of December 31, 2015 and 2014, respectively |
|
21.9 |
|
|
|
— |
|
|
Stockholders’ equity: |
|
|
|
|
|
|
|
|
Preferred stock, Series A Junior Participating; $0.001 par value; 665,000 shares authorized; none issued or outstanding |
|
— |
|
|
|
— |
|
|
Common stock; $0.001 par value; 66,500,000 shares authorized; 28,901,464 and 17,099,882 shares issued; and 28,891,766 and 17,099,882 shares outstanding as of December 31, 2015 and 2014, respectively |
|
— |
|
|
|
— |
|
|
Additional paid-in capital |
|
546.0 |
|
|
|
482.0 |
|
|
Accumulated deficit |
|
(403.3 |
) |
|
|
(396.3 |
) |
|
Treasury stock, at cost; 9,698 and zero shares as of December 31, 2015 and 2014, respectively |
|
(0.1 |
) |
|
|
— |
|
|
Accumulated other comprehensive loss |
|
(1.0 |
) |
|
|
— |
|
|
Total stockholders’ equity—Real Industry, Inc. |
|
141.6 |
|
|
|
85.7 |
|
|
Noncontrolling interest |
|
0.8 |
|
|
|
(0.1 |
) |
F-4
|
|
142.4 |
|
|
|
85.6 |
|
|
|
TOTAL LIABILITIES, REDEEMABLE PREFERRED STOCK AND STOCKHOLDERS’ EQUITY |
$ |
700.9 |
|
|
$ |
121.7 |
|
The accompanying notes are an integral part of these consolidated financial statements.
F-5
CONSOLIDATED STATEMENTS OF OPERATIONS
|
|
Year Ended December 31, |
|
|||||||||
|
(In millions, except per share amounts) |
|
2015 |
|
|
|
2014 |
|
|
|
2013 |
|
|
Revenues |
$ |
1,145.6 |
|
|
$ |
2.1 |
|
|
$ |
5.3 |
|
|
Cost of sales |
|
1,070.7 |
|
|
|
— |
|
|
|
— |
|
|
Gross profit |
|
74.9 |
|
|
|
2.1 |
|
|
|
5.3 |
|
|
Selling, general and administrative expenses |
|
56.0 |
|
|
|
10.0 |
|
|
|
12.9 |
|
|
Losses on derivative financial instruments |
|
4.2 |
|
|
|
— |
|
|
|
— |
|
|
Amortization of intangibles |
|
2.0 |
|
|
|
0.1 |
|
|
|
— |
|
|
Other operating expense, net |
|
2.5 |
|
|
|
0.4 |
|
|
|
0.1 |
|
|
Operating profit (loss) |
|
10.2 |
|
|
|
(8.4 |
) |
|
|
(7.7 |
) |
|
Nonoperating expense (income): |
|
|
|
|
|
|
|
|
|
|
|
|
Interest expense (income), net |
|
34.9 |
|
|
|
(0.1 |
) |
|
|
2.0 |
|
|
Change in fair value of common stock warrant liability |
|
1.5 |
|
|
|
(3.7 |
) |
|
|
6.9 |
|
|
Acquisition-related costs and expenses |
|
14.8 |
|
|
|
3.4 |
|
|
|
— |
|
|
Foreign exchange loss on intercompany loans |
|
1.3 |
|
|
|
— |
|
|
|
— |
|
|
Other, net |
|
(1.5 |
) |
|
|
0.5 |
|
|
|
(0.1 |
) |
|
Total nonoperating expense |
|
51.0 |
|
|
|
0.1 |
|
|
|
8.8 |
|
|
Loss from continuing operations before income taxes |
|
(40.8 |
) |
|
|
(8.5 |
) |
|
|
(16.5 |
) |
|
Income tax benefit |
|
(9.1 |
) |
|
|
(8.4 |
) |
|
|
(2.3 |
) |
|
Loss from continuing operations |
|
(31.7 |
) |
|
|
(0.1 |
) |
|
|
(14.2 |
) |
|
Earnings from discontinued operations, net of income taxes |
|
24.9 |
|
|
|
5.5 |
|
|
|
4.2 |
|
|
Net earnings (loss) |
|
(6.8 |
) |
|
|
5.4 |
|
|
|
(10.0 |
) |
|
Earnings (loss) from continuing operations attributable to noncontrolling interest |
|
0.1 |
|
|
|
(0.1 |
) |
|
|
— |
|
|
Net earnings (loss) attributable to Real Industry, Inc. |
$ |
(6.9 |
) |
|
$ |
5.5 |
|
|
$ |
(10.0 |
) |
|
EARNINGS (LOSS) PER SHARE |
|
|
|
|
|
|
|
|
|
|
|
|
Net earnings (loss) attributable to Real Industry, Inc. |
$ |
(6.9 |
) |
|
$ |
5.5 |
|
|
$ |
(10.0 |
) |
|
Dividends and accretion on Redeemable Preferred Stock |
|
(2.3 |
) |
|
|
— |
|
|
|
— |
|
|
Net earnings (loss) available to common stockholders |
$ |
(9.2 |
) |
|
$ |
5.5 |
|
|
$ |
(10.0 |
) |
|
Basic and diluted earnings (loss) per share: |
|
|
|
|
|
|
|
|
|
|
|
|
Continuing operations |
$ |
(1.28 |
) |
|
$ |
— |
|
|
$ |
(1.11 |
) |
|
Discontinued operations |
|
0.93 |
|
|
|
0.41 |
|
|
|
0.32 |
|
|
Basic and diluted earnings (loss) per share |
$ |
(0.35 |
) |
|
$ |
0.41 |
|
|
$ |
(0.79 |
) |
The accompanying notes are an integral part of these consolidated financial statements.
F-6
CONSOLIDATED STATEMENTS OF COMPREHENSIVE INCOME (LOSS)
|
|
Year Ended December 31, |
|
|||||||||
|
(In millions) |
|
2015 |
|
|
|
2014 |
|
|
|
2013 |
|
|
Net earnings (loss) |
$ |
(6.8 |
) |
|
$ |
5.4 |
|
|
$ |
(10.0 |
) |
|
Other comprehensive income (loss): |
|
|
|
|
|
|
|
|
|
|
|
|
Currency translation adjustments |
|
(6.0 |
) |
|
|
— |
|
|
|
— |
|
|
Pension benefit adjustments |
|
7.1 |
|
|
|
— |
|
|
|
— |
|
|
Deferred tax benefit on pension benefit adjustments |
|
(2.1 |
) |
|
|
— |
|
|
|
— |
|
|
Net change in unrealized gains during the period: |
|
|
|
|
|
|
|
|
|
|
|
|
Investment securities, available for sale |
|
— |
|
|
|
— |
|
|
|
0.2 |
|
|
Reclassification of realized amount included in net loss |
|
— |
|
|
|
— |
|
|
|
(0.4 |
) |
|
Comprehensive income (loss) |
|
(7.8 |
) |
|
|
5.4 |
|
|
|
(10.2 |
) |
|
Comprehensive income (loss) attributable to noncontrolling interest |
|
0.1 |
|
|
|
(0.1 |
) |
|
|
— |
|
|
Comprehensive income (loss) attributable to Real Industry, Inc. |
$ |
(7.9 |
) |
|
$ |
5.5 |
|
|
$ |
(10.2 |
) |
The accompanying notes are an integral part of these consolidated financial statements.
F-7
CONSOLIDATED STATEMENTS OF STOCKHOLDERS’ EQUITY
|
|
Preferred Stock |
|
|
Common Stock |
|
|
Treasury Stock |
|
|
|
|
|
|
|
|
|
|
|
|
|
|
|
|
|
|
|
|
|
|||||||||||||||
|
(In millions, except shares) |
Shares |
|
|
Amount |
|
|
Shares |
|
|
Amount |
|
|
Shares |
|
|
Amount |
|
|
Additional Paid-in Capital |
|
|
Accumulated Deficit |
|
|
Accumulated Other Comprehensive Income (Loss) |
|
|
Noncontrolling Interest |
|
|
Total |
|
|||||||||||
|
Balance, December 31, 2012 |
|
— |
|
|
$ |
— |
|
|
|
12,074,314 |
|
|
$ |
— |
|
|
|
— |
|
|
$ |
— |
|
|
$ |
449.8 |
|
|
$ |
(391.8 |
) |
|
$ |
0.2 |
|
|
$ |
— |
|
|
$ |
58.2 |
|
|
Net loss attributable to Real Industry, Inc. |
|
— |
|
|
|
— |
|
|
|
— |
|
|
|
— |
|
|
|
— |
|
|
|
— |
|
|
|
— |
|
|
|
(10.0 |
) |
|
|
— |
|
|
|
— |
|
|
|
(10.0 |
) |
|
Common stock acquired |
|
— |
|
|
|
— |
|
|
|
(32,885 |
) |
|
|
— |
|
|
|
32,885 |
|
|
|
(0.3 |
) |
|
|
— |
|
|
|
— |
|
|
|
— |
|
|
|
— |
|
|
|
(0.3 |
) |
|
Issuance of restricted common stock, net of forfeitures |
|
— |
|
|
|
— |
|
|
|
139,005 |
|
|
|
— |
|
|
|
(20,768 |
) |
|
|
0.2 |
|
|
|
(0.2 |
) |
|
|
— |
|
|
|
— |
|
|
|
— |
|
|
|
— |
|
|
Common stock options exercised |
|
— |
|
|
|
— |
|
|
|
20,668 |
|
|
|
— |
|
|
|
— |
|
|
|
— |
|
|
|
0.1 |
|
|
|
— |
|
|
|
— |
|
|
|
— |
|
|
|
0.1 |
|
|
Common stock warrant consideration |
|
— |
|
|
|
— |
|
|
|
— |
|
|
|
— |
|
|
|
— |
|
|
|
— |
|
|
|
0.1 |
|
|
|
— |
|
|
|
— |
|
|
|
— |
|
|
|
0.1 |
|
|
Share-based compensation expense |
|
— |
|
|
|
— |
|
|
|
— |
|
|
|
— |
|
|
|
— |
|
|
|
— |
|
|
|
2.1 |
|
|
|
— |
|
|
|
— |
|
|
|
— |
|
|
|
2.1 |
|
|
Change in accumulated other comprehensive income (loss) |
|
— |
|
|
|
— |
|
|
|
— |
|
|
|
— |
|
|
|
— |
|
|
|
— |
|
|
|
— |
|
|
|
— |
|
|
|
(0.2 |
) |
|
|
— |
|
|
|
(0.2 |
) |
|
Balance, December 31, 2013 |
|
— |
|
|
|
— |
|
|
|
12,201,102 |
|
|
|
— |
|
|
|
12,117 |
|
|
|
(0.1 |
) |
|
|
451.9 |
|
|
|
(401.8 |
) |
|
|
— |
|
|
|
— |
|
|
|
50.0 |
|
|
Net earnings attributable to Real Industry, Inc. |
|
— |
|
|
|
— |
|
|
|
— |
|
|
|
— |
|
|
|
— |
|
|
|
— |
|
|
|
— |
|
|
|
5.5 |
|
|
|
— |
|
|
|
— |
|
|
|
5.5 |
|
|
Loss from continuing operations attributable to noncontrolling interest |
|
— |
|
|
|
— |
|
|
|
— |
|
|
|
— |
|
|
|
— |
|
|
|
— |
|
|
|
— |
|
|
|
— |
|
|
|
— |
|
|
|
(0.1 |
) |
|
|
(0.1 |
) |
|
Common stock issued, net |
|
— |
|
|
|
— |
|
|
|
4,684,615 |
|
|
|
— |
|
|
|
— |
|
|
|
— |
|
|
|
28.3 |
|
|
|
— |
|
|
|
— |
|
|
|
— |
|
|
|
28.3 |
|
|
Common stock acquired |
|
— |
|
|
|
— |
|
|
|
(9,229 |
) |
|
|
— |
|
|
|
9,229 |
|
|
|
(0.1 |
) |
|
|
— |
|
|
|
— |
|
|
|
— |
|
|
|
— |
|
|
|
(0.1 |
) |
|
Issuance of restricted common stock, net of forfeitures |
|
— |
|
|
|
— |
|
|
|
73,394 |
|
|
|
— |
|
|
|
(21,346 |
) |
|
|
0.2 |
|
|
|
(0.2 |
) |
|
|
— |
|
|
|
— |
|
|
|
— |
|
|
|
(0.0 |
) |
|
Common stock options exercised |
|
— |
|
|
|
— |
|
|
|
150,000 |
|
|
|
— |
|
|
|
— |
|
|
|
— |
|
|
|
0.8 |
|
|
|
— |
|
|
|
— |
|
|
|
— |
|
|
|
0.8 |
|
|
Common stock warrant consideration |
|
— |
|
|
|
— |
|
|
|
— |
|
|
|
— |
|
|
|
— |
|
|
|
— |
|
|
|
0.1 |
|
|
|
— |
|
|
|
— |
|
|
|
— |
|
|
|
0.1 |
|
|
Share-based compensation expense |
|
— |
|
|
|
— |
|
|
|
— |
|
|
|
— |
|
|
|
— |
|
|
|
— |
|
|
|
1.1 |
|
|
|
— |
|
|
|
— |
|
|
|
— |
|
|
|
1.1 |
|
|
Balance, December 31, 2014 |
|
— |
|
|
|
— |
|
|
|
17,099,882 |
|
|
|
— |
|
|
|
— |
|
|
|
— |
|
|
|
482.0 |
|
|
|
(396.3 |
) |
|
|
— |
|
|
|
(0.1 |
) |
|
|
85.6 |
|
|
Net loss attributable to Real Industry, Inc. |
|
— |
|
|
|
— |
|
|
|
— |
|
|
|
— |
|
|
|
— |
|
|
|
— |
|
|
|
— |
|
|
|
(6.9 |
) |
|
|
— |
|
|
|
— |
|
|
|
(6.9 |
) |
F-8
|
operations attributable to noncontrolling interest |
|
— |
|
|
|
— |
|
|
|
— |
|
|
|
— |
|
|
|
— |
|
|
|
— |
|
|
|
— |
|
|
|
— |
|
|
|
— |
|
|
|
0.1 |
|
|
|
0.1 |
|
|
Common stock issued, net |
|
— |
|
|
|
— |
|
|
|
11,304,673 |
|
|
|
— |
|
|
|
— |
|
|
|
— |
|
|
|
63.3 |
|
|
|
— |
|
|
|
— |
|
|
|
— |
|
|
|
63.3 |
|
|
Common stock acquired |
|
— |
|
|
|
— |
|
|
|
(9,698 |
) |
|
|
— |
|
|
|
9,698 |
|
|
|
(0.1 |
) |
|
|
0.1 |
|
|
|
(0.1 |
) |
|
|
— |
|
|
|
— |
|
|
|
(0.1 |
) |
|
Issuance of restricted common stock, net of forfeitures |
|
— |
|
|
|
— |
|
|
|
240,990 |
|
|
|
— |
|
|
|
— |
|
|
|
— |
|
|
|
— |
|
|
|
— |
|
|
|
— |
|
|
|
— |
|
|
|
— |
|
|
Common stock options exercised |
|
— |
|
|
|
— |
|
|
|
229,892 |
|
|
|
— |
|
|
|
— |
|
|
|
— |
|
|
|
1.2 |
|
|
|
— |
|
|
|
— |
|
|
|
— |
|
|
|
1.2 |
|
|
Exercise of Warrants |
|
— |
|
|
|
— |
|
|
|
26,027 |
|
|
|
— |
|
|
|
— |
|
|
|
— |
|
|
|
0.2 |
|
|
|
— |
|
|
|
— |
|
|
|
— |
|
|
|
0.2 |
|
|
Noncontrolling interest acquired in business combination |
|
— |
|
|
|
— |
|
|
|
— |
|
|
|
— |
|
|
|
— |
|
|
|
— |
|
|
|
— |
|
|
|
— |
|
|
|
— |
|
|
|
0.8 |
|
|
|
0.8 |
|
|
Share-based compensation expense |
|
— |
|
|
|
— |
|
|
|
— |
|
|
|
— |
|
|
|
— |
|
|
|
— |
|
|
|
1.5 |
|
|
|
— |
|
|
|
— |
|
|
|
— |
|
|
|
1.5 |
|
|
Dividends and accretion on Redeemable Preferred Stock |
|
— |
|
|
|
— |
|
|
|
— |
|
|
|
— |
|
|
|
— |
|
|
|
— |
|
|
|
(2.3 |
) |
|
0 |
|
|
|
— |
|
|
|
— |
|
|
|
(2.3 |
) |
|
|
Change in accumulated other comprehensive income (loss) |
|
— |
|
|
|
— |
|
|
|
— |
|
|
|
— |
|
|
|
— |
|
|
|
— |
|
|
|
— |
|
|
|
— |
|
|
|
(1.0 |
) |
|
|
— |
|
|
|
(1.0 |
) |
|
Balance, December 31, 2015 |
|
— |
|
|
$ |
— |
|
|
|
28,891,766 |
|
|
$ |
— |
|
|
|
9,698 |
|
|
$ |
(0.1 |
) |
|
$ |
546.0 |
|
|
$ |
(403.3 |
) |
|
$ |
(1.0 |
) |
|
$ |
0.8 |
|
|
$ |
142.4 |
|
The accompanying notes are an integral part of these consolidated financial statements.
F-9
CONSOLIDATED STATEMENTS OF CASH FLOWS
|
|
Year Ended December 31, |
|
|||||||||
|
(In millions) |
|
2015 |
|
|
2014 |
|
|
|
2013 |
|
|
|
Cash flows from operating activities: |
|
|
|
|
|
|
|
|
|
|
|
|
Net earnings (loss) |
$ |
(6.8 |
) |
|
$ |
5.4 |
|
|
$ |
(10.0 |
) |
|
Adjustments to reconcile net earnings (loss) to net cash provided by (used in) operating activities: |
|
|
|
|
|
|
|
|
|
|
|
|
Earnings from discontinued operations, net of income taxes |
|
(24.9 |
) |
|
|
(5.5 |
) |
|
|
(4.2 |
) |
|
Depreciation and amortization |
|
32.5 |
|
|
|
0.1 |
|
|
|
— |
|
|
Deferred income taxes |
|
(2.1 |
) |
|
|
(5.1 |
) |
|
|
— |
|
|
Change in fair value of common stock warrant liability |
|
1.5 |
|
|
|
(3.7 |
) |
|
|
6.9 |
|
|
Share-based compensation expense included in Corporate and Other |
|
1.3 |
|
|
|
1.0 |
|
|
|
2.0 |
|
|
Amortization of debt issuance costs |
|
4.3 |
|
|
|
— |
|
|
|
— |
|
|
Unrealized losses on derivative financial instruments |
|
0.8 |
|
|
|
— |
|
|
|
— |
|
|
Amortization of purchase accounting adjustments |
|
9.2 |
|
|
|
— |
|
|
|
— |
|
|
Proceeds from sale of loans held for sale, net |
|
— |
|
|
|
— |
|
|
|
27.1 |
|
|
Gain on sale of loans held for sale, net |
|
— |
|
|
|
— |
|
|
|
(5.0 |
) |
|
Other |
|
1.5 |
|
|
|
(1.2 |
) |
|
|
(0.2 |
) |
|
Changes in assets and liabilities: |
|
|
|
|
|
|
|
|
|
|
|
|
Trade accounts receivable, net |
|
3.7 |
|
|
|
— |
|
|
|
— |
|
|
Financing receivable |
|
33.4 |
|
|
|
— |
|
|
|
— |
|
|
Inventories |
|
44.6 |
|
|
|
— |
|
|
|
— |
|
|
Prepaid expenses, supplies, and other current assets |
|
3.7 |
|
|
|
2.1 |
|
|
|
2.7 |
|
|
Debt and equity offering costs |
|
— |
|
|
|
(14.5 |
) |
|
|
— |
|
|
Other noncurrent assets |
|
(5.4 |
) |
|
|
0.2 |
|
|
|
(2.0 |
) |
|
Trade payables |
|
(8.2 |
) |
|
|
— |
|
|
|
— |
|
|
Accrued liabilities |
|
19.1 |
|
|
|
5.1 |
|
|
|
0.7 |
|
|
Other noncurrent liabilities |
|
(1.7 |
) |
|
|
0.3 |
|
|
|
0.1 |
|
|
Net cash provided by (used in) operating activities of discontinued operations |
|
(14.0 |
) |
|
|
1.8 |
|
|
|
4.7 |
|
|
Net cash provided by (used in) operating activities |
|
92.5 |
|
|
|
(14.0 |
) |
|
|
22.8 |
|
|
Cash flows from investing activities: |
|
|
|
|
|
|
|
|
|
|
|
|
Acquisition of business, net of cash |
|
(524.7 |
) |
|
|
— |
|
|
|
— |
|
|
Proceeds from sale of NABCO, net of $3.9 million held in escrow |
|
74.1 |
|
|
|
— |
|
|
|
— |
|
|
Purchases of property and equipment |
|
(26.0 |
) |
|
|
(0.1 |
) |
|
|
— |
|
|
Other |
|
(0.7 |
) |
|
|
3.1 |
|
|
|
6.2 |
|
|
Net cash provided by (used in) investing activities of discontinued operations |
|
— |
|
|
|
(0.1 |
) |
|
|
2.5 |
|
|
Net cash provided by (used in) investing activities |
|
(477.3 |
) |
|
|
2.9 |
|
|
|
8.7 |
|
|
Cash flows from financing activities: |
|
|
|
|
|
|
|
|
|
|
|
|
Retirement of long-term debt |
|
— |
|
|
|
— |
|
|
|
(37.2 |
) |
|
Payment of NABCO outstanding debt |
|
(14.3 |
) |
|
|
— |
|
|
|
— |
|
|
Proceeds from Asset-Based Facility, net of issuance costs |
|
126.1 |
|
|
|
— |
|
|
|
— |
|
|
Repayments on capital leases and the Asset-Based Facility |
|
(108.3 |
) |
|
|
— |
|
|
|
— |
|
|
Proceeds from issuance of Senior Secured Notes, net of debt issuance costs |
|
290.2 |
|
|
|
— |
|
|
|
— |
|
|
Proceeds from exercise of common stock options and Warrants |
|
1.4 |
|
|
|
0.9 |
|
|
|
0.1 |
|
|
Proceeds from issuance of common stock, net of issuance costs |
|
63.3 |
|
|
|
28.3 |
|
|
|
— |
|
|
Net cash provided by (used in) financing activities of discontinued operations |
|
(0.4 |
) |
|
|
(3.1 |
) |
|
|
2.9 |
|
|
Net cash provided by (used in) financing activities |
|
358.0 |
|
|
|
26.0 |
|
|
|
(34.5 |
) |
|
Effect of exchange rate changes on cash and cash equivalents |
|
(0.3 |
) |
|
|
— |
|
|
|
— |
|
|
Increase (decrease) in cash and cash equivalents |
|
(27.1 |
) |
|
|
14.9 |
|
|
|
(3.0 |
) |
|
Cash and cash equivalents, beginning of period |
|
62.9 |
|
|
|
48.0 |
|
|
|
51.0 |
|
|
Cash and cash equivalents, end of period |
$ |
35.8 |
|
|
$ |
62.9 |
|
|
$ |
48.0 |
|
|
Cash and cash equivalents, end of period—continuing operations |
$ |
35.7 |
|
|
$ |
61.9 |
|
|
$ |
47.8 |
|
F-10
|
Cash and cash equivalents, end of period—discontinued operations |
|
0.1 |
|
|
|
1.0 |
|
|
|
0.2 |
|
|
Cash and cash equivalents, end of period |
$ |
35.8 |
|
|
$ |
62.9 |
|
|
$ |
48.0 |
|
The accompanying notes are an integral part of these consolidated financial statements.
F-11
NOTES TO CONSOLIDATED FINANCIAL STATEMENTS
NOTE 1—BUSINESS AND OPERATIONS
Real Industry, Inc. (“Real Industry,” the “Company,” “we,” “us” or “our”), formerly known as Signature Group Holding, Inc., is a Delaware holding company that operates through its operating subsidiaries. Management expects to grow the Company through acquisitions, as well as through organic efforts within existing operations described below. Our current business strategy seeks to leverage our public company status, considerable United States (“U.S.”) federal net operating tax loss carryforwards (“U.S. NOLs”) and the experience of our executive management team to acquire operating businesses at prices and on terms that are aligned with our growth plans.
During the first quarter of 2015, the Company underwent a considerable transformation. On January 9, 2015, we completed the sale of North American Breaker Co., LLC (“NABCO”), previously the primary business within our former industrial supply segment. On February 27, 2015, we acquired the global recycling and specification alloys business (the “Real Alloy Business”) of Aleris Corporation (“Aleris”) (the “Real Alloy Acquisition”). A portion of the proceeds of the sale of NABCO were used to fund the Real Alloy Acquisition.
The Real Alloy Business, as Real Alloy Holding, Inc. (“Real Alloy”), is a global leader in third-party aluminum recycling, which includes the processing of scrap aluminum and by-products and the manufacturing of wrought, cast and specification or foundry alloys. Real Alloy offers a broad range of products and services to wrought alloy processors, automotive original equipment manufacturers, and foundries and casters. Real Alloy’s customers include companies that participate in or sell to the automotive, consumer packaging, aerospace, building and construction, steel, and durable goods industries. Real Alloy processes aluminum scrap and by-products and delivers recycled metal in liquid or solid form according to customer specifications. Real Alloy’s facilities are capable of processing industrial (new) scrap, post-consumer (old/obsolete) scrap, and various aluminum by-products, providing a great degree of flexibility in reclaiming high-quality recycled aluminum. Real Alloy currently operates twenty-four facilities strategically located throughout North America and Europe.
The closing of the Real Alloy Acquisition was the culmination of a series of equity and debt financing transactions that began in the fourth quarter of 2014, raising the capital required to fund the Real Alloy Acquisition and pay transaction costs as summarized below (collectively, the “Financings”):
|
|
· |
In October 2014, Real Industry issued 0.3 million shares of common stock at $10.00 per share in a private placement, providing gross proceeds of $3.0 million; |
|
|
· |
In December 2014, Real Industry issued approximately 4.4 million shares of common stock at $6.50 per share in an underwritten public offering providing gross proceeds of $28.5 million; |
|
|
· |
In January 2015, Real Alloy, as successor to SGH Escrow Corporation (“SGH Escrow”), issued $305.0 million in senior secured notes due January 15, 2019 (the “Senior Secured Notes”) at a price of 97.206% of the principal amount, providing gross proceeds of $296.5 million; |
|
|
· |
In February 2015, Real Industry issued approximately 9.8 million shares of common stock to existing common stockholders in a stapled rights offering (the “Rights Offering”), providing gross proceeds of $55.0 million; |
|
|
· |
In February 2015, the U.S., Canadian and German operating subsidiaries of Real Alloy entered into new credit facilities, including a $110.0 million asset-based lending facility (the “Asset-Based Facility”) secured by assets of certain of Real Alloy’s North American subsidiaries, and a €50.0 million factoring facility (the “Factoring Facility”) for the purchase of eligible accounts receivable of Real Alloy’s German operations; and |
|
|
· |
In February 2015, Real Industry issued 25,000 shares, at a $1,000 liquidation preference per share, of a new series of non-participating preferred stock (the “Redeemable Preferred Stock”) to Aleris. |
On April 21, 2015, our common stock began trading on the Nasdaq Stock Market (“NASDAQ”) under the symbol “RELY” as part of the NASDAQ Global Select Market. On May 28, 2015, our stockholders approved an amendment to our charter to change our name to Real Industry, Inc. In June 2015, Real Industry became a member of the Russell Global®, Russell 2000® and Russell Microcap® indexes.
As a result of the transformative nature of the acquisition, divestiture and financing activities described above, our operations in 2015 have been and will be substantially different from that reported in the previous periods covered by this Annual Report on Form 10-K (the “Annual Report”). See Note 19— Segment and Geographic Information for additional information about our reportable segments.
F-12
The assets and liabilities and results of operations of NABCO are included in discontinued operations for all periods presented as a result of its sale in the first quarter of 2015. Discontinued operations also includes certain assets and liabilities related to the former businesses of our subsidiary, SGGH, LLC (“SGGH”), then known as Fremont General Corporation (“Fremont”) and its primary operating subsidiary, Fremont Investment & Loan (“FIL”). See Note 20—Discontinued Operations for additional information about NABCO and other discontinued operations.
NOTE 2—FINANCIAL STATEMENT PRESENTATION AND SIGNIFICANT ACCOUNTING POLICIES
The accompanying consolidated financial statements comprise the accounts of Real Industry, its wholly owned and majority owned subsidiaries, and have been prepared in accordance with accounting principles generally accepted in the United States of America (“GAAP”). All intercompany transactions have been eliminated in the consolidated financial statements. The Company evaluates subsequent events through the date of filing with the Securities and Exchange Commission (“SEC”).
Certain amounts in the accompanying consolidated financial statements have been reclassified to conform to the current presentation, including the classification of NABCO as a discontinued operation, the reclassification of acquisition-related fees and costs from selling, general and administrative expenses in 2014, and the reclassification of interest income from operating revenues to interest expense (income), net.
Use of estimates
Management has made a number of estimates and assumptions relating to the reporting of assets, liabilities, revenues and expenses and the disclosure of contingent assets and liabilities to prepare these consolidated financial statements in accordance with GAAP. Significant areas requiring the use of management estimates relate primarily to valuation of long-lived assets, including goodwill and intangible assets, environmental liabilities, asset retirement obligations, pension benefits, litigation reserves, valuation of deferred income taxes, and the loan repurchase reserve. Actual results could differ from those estimates.
Revenue recognition, shipping and handling costs, and advertising costs
Revenues are recognized when title transfers and the risk of loss passes to the customer. This typically occurs when the goods reach their destination, depending on individual shipping terms. For customer-owned toll material, revenue is recognized upon the performance of the tolling service for the customers. For material that is consigned, revenue is not recognized until the product is used by the customer. Shipping and handling costs are included within cost of sales in the consolidated statements of operations included elsewhere in this Annual Report. Advertising costs, totaling $0.3 million for the year ended December 31, 2015, are expensed as incurred. There were no advertising costs incurred in the years ended December 31, 2014 and 2013.
During the year ended December 31, 2015, one customer accounted for approximately 14.4% of consolidated revenues, and the top ten customers accounted for 60.5% of consolidated revenues.
Business combinations
Business combinations are accounted for using the acquisition method where the purchase price paid is allocated to the assets acquired and liabilities assumed, and noncontrolling interest, if applicable, based on their estimated fair values. Any excess purchase price over the fair value of the net assets acquired is recorded as goodwill.
Cash and cash equivalents and restricted cash
Cash and cash equivalents include cash on hand, cash on deposit at financial institutions and other short-term liquid investments. Cash and cash equivalents are stated at cost, which approximates fair value. All highly liquid investment instruments with maturities of three months or less at the acquisition date are classified as cash equivalents. Cash that is subject to legal restrictions or is unavailable for general operating purposes is considered restricted cash and classified in other assets, including $3.9 million in an escrow fund to support NABCO’s representations and warranties under the NABCO purchase agreement as of December 31, 2015.
F-13
Accounts receivable allowances and credit risk
Credit is extended to our customers based on an evaluation of their financial condition; generally, collateral is not required. We maintain an allowance against our accounts receivable for the estimated probable losses on uncollectible accounts. The allowance is based upon our historical loss experience, current economic conditions within the industries we serve as well as our determination of the specific risk related to certain customers. Accounts receivable are charged off against the reserve when, in management’s estimation, further collection efforts would not result in a reasonable likelihood of receipt, or later as proscribed by statutory regulations. As of December 31, 2015 and 2014, the trade accounts receivable allowance totaled $0.3 million and zero, respectively.
As of December 31, 2015, two customers accounted for more than 10% of our accounts receivable, both were less than 20% and the top ten customers represented approximately 59.7% of the total accounts receivable as of December 31, 2015.
Financing receivable
Real Alloy has an agreement to sell certain of its trade accounts receivables in Europe. The agreement results in true sales of transferred receivables, as defined in Financial Accounting Standards Board (“FASB”) Accounting Standards Codification (“ASC”) Topic 860, Transfers and Servicing, which occurs when receivables are transferred to a purchaser without recourse to the Company. Such amounts are reported as financing receivable in the consolidated balance sheets until proceeds from such sales are received from the counterparty, and are categorized as a Level 2 measurement in the fair value hierarchy. Cash proceeds from such sales are generally received within thirty days and are included in operating cash flows.
The transferred receivables are isolated from Real Alloy’s accounts, as debtors pay into a segregated escrow account maintained by the counterparty. Real Alloy maintains continuing involvement with the transferred receivables through limited servicing obligations, primarily related to recordkeeping. Real Alloy retains no right to the receivables, or associated collateral, and does not collect a servicing fee. Following transfer, Real Alloy has no further rights to receive any cash flows or other benefits from the transferred receivables and has no further obligations to provide additional cash flows or other assets to any party related to the transfer.
Inventories
Inventories are stated at the lower of cost or net realizable value. At Real Alloy, cost is determined primarily on the average cost method and includes material, labor and overhead related to the manufacturing process, as applicable. Cosmedicine acquires its specialty cosmetics inventory as fully packaged finished goods, ready for sale to consumers. Cosmedicine’s inventory cost is determined on the average cost method. The value of inventories acquired in business combinations is recorded at fair value and any fair value adjustment is amortized to cost of sales over the applicable inventory turn.
During the year ended December 31, 2015, no single supplier represented more than 10% of metal purchases. The top ten suppliers accounted for 22.0% of total metal purchases during the year ended December 31, 2015.
Debt and equity offering costs
Debt and equity offering costs represents fees, costs and expenses associated with ongoing capital raising efforts. Fees, costs and expenses associated with completed debt offerings are recorded as a reduction to the carrying value of the associated debt and amortized to interest expense over the life of the underlying instruments. Fees, costs and expenses associated with completed equity offerings are recorded as a reduction of additional paid-in capital. Fees, costs and expenses associated with commitments that are not utilized or debt and equity offerings that are not completed are expensed in the period that the underlying commitment expires or offering is terminated.
Property, plant and equipment
Property, plant and equipment is stated at cost, net of depreciation and asset impairments. The cost of property, plant and equipment acquired in business combinations represents the fair value of the acquired assets at the time of acquisition.
The estimated fair value of asset retirement obligations incurred after the Real Alloy Acquisition are capitalized to the related long-lived asset at the time the obligations are incurred and are depreciated over the estimated remaining useful life of the related asset.
F-14
Major renewals and improvements that extend an asset’s useful life are capitalized to property, plant and equipment. Major repair and maintenance projects are expensed over periods not exceeding twenty-four months, while normal maintenance and repairs are expensed as incurred. Depreciation is computed using the straight-line method over the estimated useful lives of the related assets, as follows:
|
|
Estimated Useful Lives |
|
Buildings and improvements |
5 - 33 years |
|
Production equipment and machinery |
2 - 25 years |
|
Office furniture, equipment and other |
3 - 10 years |
Property, plant and equipment, identifiable intangible assets, and other long-lived assets that have definite lives are evaluated for impairment when events or changes in circumstances, or a triggering event, indicate that the carrying value of the assets may not be recoverable. Upon the occurrence of a triggering event, the impacted assets are reviewed to assess whether the undiscounted cash flows expected for the use of the asset, plus residual value from the ultimate disposal, exceeds the carrying value of the assets. If the carrying value exceeds the estimated recoverable amounts, the assets are written down to fair value. As of December 31, 2015, no impairment on property, plant and equipment, identifiable intangible assets, or other long-lived assets has been recognized.
Goodwill and intangible assets
Goodwill is tested for impairment as of October 1 of each year and may be tested more frequently if changes in circumstances or the occurrence of events indicates that a potential impairment exists. We evaluate goodwill based upon our reporting units, which are defined as operating segments or, in certain situations, one level below the operating segment.
The impairment test is a two-step process, which requires us to make judgments in determining what assumptions to use in the calculations. The first step of the process consists of estimating the fair value of each reporting unit based on discounted cash flow models and guideline public company (“GPC”) information, using revenue and profit forecasts, and comparing those estimated fair values with the carrying values, which include allocated goodwill. These projections include assumptions about prices, margins and other operating costs. Other key assumptions included in the fair value of our reporting units include estimated cash flow periods, terminal values based on our anticipated growth rate and the discount rate used, which is based on our current cost of capital, adjusted for the risks associated with our operations. If the determined fair value is less than the carrying value, a second step is performed to compute the amount of the impairment by determining an “implied fair value” of goodwill, which is compared to the corresponding carrying value. See Note 8—Goodwill and Intangible Assets, Net for additional information about the results of the annual impairment tests.
Intangible assets consist primarily of customer relationships recognized in business combinations. Intangible assets with finite lives are amortized over their estimated useful lives, which represent the period over which the asset is expected to contribute directly or indirectly to future cash flows. Intangible assets with finite lives are reviewed for impairment whenever events and circumstances indicate the carrying value of such assets or liabilities may not be recoverable and exceed their fair value. If an impairment loss exists, the carrying amount of the intangible asset is adjusted to a new cost basis. The new cost basis is amortized over the remaining useful life of the asset. Tests for impairment or recoverability require significant management judgment, and future events affecting cash flows and market conditions could adversely impact the valuation of these assets and result in impairment losses.
As of December 31, 2015 and 2014, no impairment has been recognized on identifiable intangible assets or goodwill.
Deferred financing costs
Costs related to the issuance of long-term debt are capitalized and classified as a reduction of the associated debt in the consolidated balance sheets and are amortized over the term of the related debt agreements as interest expense using the effective interest method. Costs related to the Factoring Facility are capitalized and classified as other assets in the consolidated balance sheets and are amortized over the term of the arrangement on a straight-line basis as interest expense.
F-15
Common stock warrant liability
In June 2010, warrants to purchase an aggregate of 1.5 million shares of the Company’s common stock (the “Warrants”) were issued for an aggregate cash purchase price of $0.3 million. The Warrants have a term of ten years and had an original exercise price of $10.30 per share. The Warrants include anti-dilution and pricing protection provisions that provide for a reduction in the exercise price of the Warrants if any common stock (or equivalents) of the Company are issued at a price per share less than the exercise price during the term of the Warrants, excluding issuances under the Company’s equity award and incentive programs. As a result of the Rights Offering in February 2015, in which the Company issued shares for $5.64 per share, the exercise price of the Warrants was reduced to, and as of December 31, 2015 remains, $5.64. The Warrants are financial instruments classified as derivative liabilities and are re-measured at fair value at each reporting date and on each Warrant exercise date. The fair value of Warrants exercised are reclassified to additional paid-in capital. Other changes in the common stock warrant liability are recognized in earnings.
Derivatives and hedging
Real Alloy is engaged in activities that expose it to various market risks, including changes in the prices of aluminum alloys, aluminum scrap, copper, silicon, and natural gas, as well as changes in currency exchange rates. Certain of these financial exposures are managed as an integral part of its risk management program, which seeks to reduce the potentially adverse effects that the volatility of the markets may have on operating results. Real Alloy may enter into forward contracts or swaps to manage the exposure to market risk. The fair value of these instruments is reflected in the consolidated balance sheets and the impact of these instruments is reflected in the consolidated statements of operations. Real Alloy does not hold or issue derivative financial instruments for trading purposes.
The estimated fair values of derivative financial instruments are recognized as assets or liabilities as of the balance sheet date. Fair values for metal and natural gas derivative financial instruments are determined based on the differences between contractual and forward rates of identical hedge positions as of the balance sheet date. In developing these fair values, Real Alloy includes an estimate of the risk associated with nonperformance by either its counterparty or itself.
Real Alloy does not account for its derivative financial instruments as hedges. The changes in fair value of derivative financial instruments and the associated gains and losses realized upon settlement are recorded in losses on derivative financial instruments in the consolidated statements of operations. All realized gains and losses are included within net cash provided by operating activities in the consolidated statements of cash flows. Real Alloy is exposed to losses in the event of nonperformance by its derivative counterparties. The counterparties’ creditworthiness is monitored on an ongoing basis, and credit levels are reviewed to ensure appropriate concentrations of credit outstanding to any particular counterparty. Although nonperformance by counterparties is possible, we do not currently anticipate nonperformance by any of these parties.
Currency translation
Certain of Real Alloy’s international subsidiaries use the local currency as their functional currency. Real Alloy translates all of the amounts included in the consolidated statements of operations from its international subsidiaries into U.S. dollars at average monthly exchange rates, which management believes is representative of the actual exchange rates on the dates of the transactions. Adjustments resulting from the translation of the assets and liabilities into U.S. dollars at the balance sheet date exchange rates are reflected as a separate component of the Company’s stockholders’ equity. Currency translation adjustments accumulate in the Company’s stockholders’ equity until the disposition or liquidation of the international entities. Currency transactional gains and losses associated with receivables and payables denominated in currencies other than the functional currency are included within other, net in the consolidated statements of operations. The translation of accounts receivables and payables denominated in currencies other than the functional currencies resulted in transactional gains of $ 0.3 million for the year ended December 31, 2015.
Additionally, Real Alloy maintains intercompany long-term loans between its U.S. and foreign jurisdiction entities, which were established in the subsidiaries’ functional currency and due to their long-term nature, any currency related effects are recorded as a component of accumulated other comprehensive loss. The effects of exchange rates on intercompany loans held by Real Alloy’s international subsidiaries that are not long-term in nature are recognized in current period earnings. The Company recorded $1.3 million of foreign exchange losses on intercompany loans during the year ended December 31, 2015.
F-16
Environmental and asset retirement obligations
Environmental obligations that are not legal or contractual asset retirement obligations and that relate to existing conditions caused by past operations with no benefit to future operations are expensed, while expenditures that extend the life, increase the capacity or improve the safety of an asset, or mitigate or prevent future environmental contamination are capitalized in property, plant and equipment. Obligations are recorded when their occurrence is probable and the associated costs can be reasonably estimated. While accruals are based on management’s current best estimate of the future costs of remedial action, these liabilities can change substantially due to factors such as the nature and extent of contamination, changes in the required remedial actions and technological advancements. Existing environmental liabilities are not discounted to their present values, as the amount and timing of the expenditures are not fixed or reliably determinable. Environmental liabilities that represent short-term remediation costs are classified in accrued liabilities.
Asset retirement obligations represent the present value of estimated future obligations associated with the retirement of tangible long-lived assets. Our asset retirement obligations relate primarily to capping our three landfills, as well as costs related to the future removal of asbestos and underground storage tanks at various recycling facilities. The estimated fair value of such legal obligations is recognized in the period in which the obligations are incurred, and capitalized as part of the carrying amount of the associated long-lived asset. These estimated fair values are based upon the present value of future cash flows expected to be required to satisfy the obligations. Determining the estimated fair value of asset retirement obligations requires judgment, including estimates of the credit adjusted interest rate and estimates of future cash flows. Estimates of future cash flows are obtained primarily from engineering consulting firms. The present value of the obligations is accreted over time while the capitalized costs are depreciated over the remaining estimated useful life of the related asset. Short-term asset retirement obligations are classified in accrued liabilities, while long-term asset retirement obligations are classified as other noncurrent liabilities.
Pension benefits
The Company measures the costs of its obligations for under defined pension plans based on its health care cost trends and actuarial assumptions, including discount rates, mortality rates, assumed rates of return, compensation increases, and turnover rates. Pension benefit costs are accrued based on annual analyses performed by actuaries. These analyses are based on assumptions including a discount rate and the expected rate of return on plan assets. Both the discount rate and expected rate of return on plan assets require estimates and projections by management and can fluctuate from period to period. Real Alloy’s objective in selecting a discount rate is to select the best estimate of the rate at which the benefit obligations could be effectively settled. In making this estimate, projected cash flows are developed and matched with a yield curve based on an appropriate universe of high-quality corporate bonds. Assumptions for long-term rates of return on plan assets are based upon historical returns and future expectations for returns (calculated using the fair value of plan assets). See Note 3—Business Combinations and Note 15—Employee Benefit Plans for more information about the assumptions used to determine the pension benefit obligation as of the date of the Real Alloy Acquisition and as of December 31, 2015.
Management reviews its assumptions on an annual basis and makes modifications to the assumptions based on current rates and trends when it is appropriate to do so. The effect of modifications to those assumptions is recorded in accumulated other comprehensive income (loss) and amortized to net periodic cost over future periods using the corridor method. The Company believes that the assumptions utilized in recording its obligations under its plans are reasonable based on its experience and market conditions. Net periodic costs are recognized as employees render the services necessary to earn these post-retirement benefits. Management does not believe differences in actual experience or reasonable changes in assumptions will materially affect the Company’s financial position or results of operations.
Management believes these assumptions are appropriate; however, the actuarial assumptions used to determine pension benefits may differ from actual results due to changing market and economic conditions, higher or lower withdrawal rates, or longer or shorter life spans of participants. Management does not believe differences in actual experience or reasonable changes in assumptions will materially affect the Company’s financial position or results of operations.
Income taxes
Deferred income taxes are computed using the liability method, under which deferred income taxes represent the tax effect of differences between the financial and income tax bases of assets and liabilities. As a result of generating operating losses since 2006, among other factors, the Company has determined that sufficient uncertainty exists as to the realizability of certain of its deferred tax assets and, as such, has placed a full valuation allowance of $382.4 million and $385.6 million on its U.S. deferred tax assets as of December 31, 2015 and 2014, respectively. In the year ended December 31, 2014, the Company released $5.1 million of the deferred tax valuation allowance based on expected future taxable income. In future years, U.S. tax benefits and related U.S. deferred tax assets will be recognized if the Company considers realization of the net U.S. deferred tax assets to be more likely than not, or to the extent that U.S. deferred tax liabilities are recognized in connection with business combinations.
F-17
Uncertain tax positions that meet the more likely than not recognition threshold are measured to determine the amount of benefit to recognize. An uncertain tax position is measured at the largest amount of benefit that management believes has a greater than 50% likelihood of realization upon settlement. The Company classifies interest and penalties as a component of income tax expense.
Comprehensive income (loss)
Comprehensive income (loss) consists of net earnings (loss) attributable to Real Industry, net unrealized gains on investment securities, available for sale, foreign currency translation adjustments and pension benefit adjustments, and is presented in the consolidated statements of comprehensive income (loss). As of December 31, 2015, $7.2 million of accumulated other comprehensive loss is related to gains and losses on the foreign currency effect on intercompany loans that are of a long-term investment nature. See Note 13—Accumulated Other Comprehensive Income (Loss) for additional information about the components of and activity in accumulated other comprehensive income (loss).
Discontinued operations
GAAP requires the results of operations of a component of an entity that either has been disposed of or is classified as held for sale to be reported as discontinued operations in the consolidated financial statements if the sale or disposition represents a strategic shift that has (or will have) a major effect on an entity’s operations and financial results.
In January 2015, SGGH sold all of its interest in NABCO to provide a portion of the funding of the Real Alloy Acquisition, which represented a strategic shift in our operations.
As of December 31, 2015, discontinued operations includes only legacy litigation, primarily home mortgage foreclosure cases in which the Company has no ongoing association with the mortgage or foreclosure, and a mortgage loan repurchase reserve. Refer to Note 20—Discontinued Operations for assets, liabilities, and financial results of the components of the Company designated as discontinued operations. Significant accounting policies specific to assets and liabilities of discontinued operations are described under “Repurchase reserve” below.
Repurchase reserve
Pursuant to Fremont’s subprime residential mortgage business, Fremont’s primary operating subsidiary FIL sold loans and made customary standard industry representations and warranties about the loans. SGGH may be required to repurchase certain loans should a court find that FIL breached certain representations and warranties provided to counterparties that purchased the loans. SGGH maintains a repurchase reserve pursuant to Topic 460, Guarantees and Topic 450, Contingencies, for the estimated losses expected to be incurred due to outstanding loan repurchase claims, as well as potential future loan repurchase claims. The reserve is based on historical repurchase settlements, expected future repurchase trends for loans sold in whole loan sale transactions, and the expected valuation of such loans when repurchased. The estimated reserve is based upon currently available information and is subject to known and unknown uncertainties using multiple assumptions requiring significant judgment. Actual results may vary significantly from the current estimate. The repurchase reserve is relieved when a claim is settled or as our exposure decreases as the statute of limitations run on existing claims.
Recent accounting pronouncements
In February 2016, the FASB issued Accounting Standards Update (“ASU”) 2016-02, Leases (Topic 842) (“ASU 2016-02”), to make leasing activities more transparent and comparable, and requires substantially all leases be recognized by lessees on their balance sheet as a right-of-use asset and corresponding lease liability, including leases currently accounted for as operating leases. ASU 2016-02 is effective for all interim and annual reporting periods beginning after December 15, 2018, and early adoption is permitted. We are currently evaluating the impact of ASU 2016-02 on the Company’s consolidated financial statements and disclosures.
In November 2015, the FASB issued ASU 2015-17, Income Taxes (Topic 740): Balance Sheet Classification of Deferred Taxes (“ASU 2015-17”), which provides for the simplification of reporting deferred income taxes in the balance sheet. ASU 2015-17 requires that deferred taxes be reported as noncurrent assets and liabilities when presented in a classified balance sheet. ASU 2015-17 is effective for fiscal years beginning after December 15, 2016, and interim periods within those annual periods, with early application permitted. ASU 2015-17 may be applied either prospectively to all deferred tax assets and liabilities, or retrospectively to all periods presented. We adopted the retrospective guidance provided in ASU 2015-17 in the year ended December 31, 2015. The retrospective application to the December 31, 2014 consolidated balance sheet resulted in the reclassification of $5.1 million of current deferred income tax assets to noncurrent deferred income tax assets.
F-18
In September 2015, the FASB issued ASU 2015-16, Business Combinations (Topic 805) (“ASU 2015-16”), which provides that an acquirer recognize adjustments to provisional amounts during the measurement period in which the adjustments are identified. ASU 2015-16 requires that an acquirer record, in the same period’s financial statements, the effect on earnings of changes in depreciation, amortization, or other income effects, if any, as a result of the change to the provisional amounts, calculated as if the accounting had been completed as of the acquisition date. ASU 2015-16 requires an entity to present separately on the face of the statements of operations, or disclose in the notes, the portion of the amount recorded in current period earnings, by line item, that would have been recorded in previous reporting periods if the adjustment to the provisional amounts had been recognized as of the acquisition date. ASU 2015-16 is effective for fiscal years beginning after December 15, 2015, and interim periods within those fiscal years. We adopted the guidance provided in ASU 2015-16 in the year ended December 31, 2015, and such guidance had no impact on the Company’s consolidated financial statements.
In April 2015, the FASB issued ASU 2015-03, Interest—Imputation of Interest (Topic 835-30) (“ASU 2015-03”), and in August 2015, the FASB issued ASU 2015-15, Interest—Imputation of Interest (Topic 835-30) (“ASU 2015-15”). Both updates relate to the presentation and recognition of debt issuance costs. ASU 2015-15 provides that given the absence of authoritative guidance within ASU 2015-03, for debt issuance costs related to line-of-credit arrangements, the SEC staff would not object to an entity deferring and presenting the debt issuance costs as an asset and subsequently amortizing the deferred debt issuance costs ratably over the term of the line-of-credit arrangement, regardless of whether there are any outstanding borrowings on the line-of-credit arrangement. The Company’s presentation of debt issuance costs associated with line-of-credit arrangements follows the guidance of ASU 2015-03 and ASU 2015-15 and, therefore, had no impact on the Company’s consolidated financial statements.
In July 2015, the FASB issued ASU 2015-11, Inventory (Topic 330) (“ASU 2015-11”), which provides that an entity measure inventory at the lower of cost or net realizable value. Net realizable value is the estimated selling prices in the ordinary course of business, less reasonably predictable costs of completion, disposal, and transportation. ASU 2015-11 will be effective for fiscal years beginning after December 15, 2016, will be applied prospectively, and early adoption is permitted as of the beginning of an interim or annual period. We adopted the guidance of ASU 2015-11 in the year ended December 31, 2015, and it did not have a material impact on the Company’s financial statements or disclosures.
In May 2014, the FASB issued ASU 2014-09, Revenue from Contracts with Customers (Topic 606) (“ASU 2014-09”), which was the result of a joint project by the FASB and the International Accounting Standards Board to clarify the principles for recognizing revenue and to develop a common revenue standard for GAAP and International Financial Reporting Standards. The issuance of a comprehensive and converged standard on revenue recognition is expected to enable financial statement users to better understand and consistently analyze an entity’s revenue across industries, transactions and geographies. The standard will require additional disclosures to help financial statement users better understand the nature, amount, timing, and potential uncertainty of the revenue that is recognized. ASU 2014-09 will be effective for the Company on January 1, 2018, and will require either retrospective application to each prior reporting period presented or retrospective application with the cumulative effect of initially applying the standard recognized at the date of adoption. We are currently evaluating the impact the application of ASU 2014-09 will have on the Company’s financial statements and disclosures.
NOTE 3—BUSINESS COMBINATIONS
On February 27, 2015, Real Industry, through its indirect wholly owned subsidiary, Real Alloy, acquired 100% of the voting interests of the Real Alloy Business from Aleris, under a purchase agreement (the “Real Alloy Purchase Agreement”). Upon closing, we paid $496.2 million to Aleris, and an additional $5.0 million of cash and the Redeemable Preferred Stock were placed into escrow to satisfy the indemnification obligations of Aleris under the Real Alloy Purchase Agreement, in which Aleris has agreed to indemnify Real Alloy and its affiliates for certain claims and losses. During the second quarter, we paid an additional $31.3 million of the purchase price representing the initial working capital adjustment under the Real Alloy Purchase Agreement. The final working capital adjustment totaled $2.4 million and was paid on September 3, 2015.
As part of the transaction, Real Alloy and Aleris entered into a transition services agreement (“TSA”), under which Aleris provides certain customary post-closing transition services to Real Alloy, including information technology services, treasury services, accounts payable, cash management and payroll, credit/collection services, environmental services, and human resource services for periods ranging from three to twenty-four months following the acquisition date. For the year ended December 31, 2015, Real Alloy incurred $7.4 million of transition services expenses under the TSA.
We incurred acquisition and financing-related costs and expenses associated with the Real Alloy Acquisition totaling approximately $14.8 million during the year ended December 31, 2015, which are classified as nonoperating expenses in the consolidated statements of operations. Acquisition and financing-related costs and expenses associated with the Real Alloy Acquisition recognized in 2014 totaled $3.4 million.
F-19
The acquisition was accounted for as a business combination, with the purchase price allocated based on the estimated fair values of the assets acquired and liabilities assumed, with goodwill totaling $104.6 million. As a result of finalizing the purchase accounting in the fourth quarter ended December 31, 2015, goodwill was increased by $19.6 million from the amount reported as of September 30, 2015. The adjustments primarily related to the final fair value adjustments of property, plant and equipment, deferred taxes, and environmental liabilities. The changes to goodwill during the year ended December 31, 2015 from our initial preliminary purchase price allocation are reflected in the following table:
|
(In millions, before currency translation adjustments) |
|
|
|
|
Balance, December 31, 2014 |
$ |
— |
|
|
Preliminary purchase price allocation for the Real Alloy Acquisition reported as of March 31, 2015 |
|
102.3 |
|
|
Adjustments to preliminary purchase price allocation recorded in the measurement period |
|
2.3 |
|
|
Balance, December 31, 2015 |
$ |
104.6 |
|
Goodwill was allocated to our reporting units, Real Alloy North America (“RANA”) and Real Alloy Europe (“RAEU”), as of the acquisition date on a relative fair value basis, with $95.4 million and $9.2 million allocated to RANA and RAEU, respectively. See Note 19— Segment and Geographic Information for additional information about our reportable segments.
The following tables provide summary information about the purchase consideration, identifiable assets acquired, liabilities assumed, and goodwill.
|
(In millions) |
|
|
|
|
Purchase consideration: |
|
|
|
|
Cash paid at closing |
$ |
501.2 |
|
|
Fair value of Redeemable Preferred Stock issued |
|
19.6 |
|
|
Initial working capital adjustment |
|
31.3 |
|
|
Final working capital adjustment |
|
2.4 |
|
|
Total purchase consideration |
$ |
554.5 |
|
|
|
|
|
|
|
Purchase price allocation: |
|
|
|
|
Assets: |
|
|
|
|
Cash |
$ |
10.2 |
|
|
Trade accounts receivable |
|
150.1 |
|
|
Inventories |
|
157.7 |
|
|
Property, plant and equipment |
|
311.7 |
|
|
Deferred income taxes |
|
0.7 |
|
|
Prepaid expenses, supplies, and other current assets |
|
19.9 |
|
|
Identifiable intangible assets |
|
17.0 |
|
|
Total assets |
|
667.3 |
|
|
Liabilities: |
|
|
|
|
Trade payables |
|
112.4 |
|
|
Accrued liabilities |
|
26.9 |
|
|
Accrued pension benefits |
|
46.0 |
|
|
Environmental liabilities |
|
12.1 |
|
|
Noncurrent asset retirement obligations |
|
5.9 |
|
|
Deferred income taxes |
|
7.5 |
|
|
Other |
|
6.6 |
|
|
Total liabilities |
|
217.4 |
|
|
Estimated fair value of net assets acquired |
$ |
449.9 |
|
|
|
|
|
|
|
Total purchase consideration |
$ |
554.5 |
|
|
Estimated fair value of net assets acquired |
|
449.9 |
|
|
Goodwill |
$ |
104.6 |
|
The estimated fair value of trade accounts receivable is based on the undiscounted receivables management expected to receive from the $150.4 million of total trade accounts receivable at the acquisition date. Due to the short-term nature of the receivables, the undiscounted receivables expected to be collected are estimated to approximate fair value.
F-20
Inventories include the estimated fair value of finished goods, work in process and raw materials. The estimated fair value of finished goods was based on analyses of future selling prices and the profit associated with the manufacturing effort. The estimated fair value of work in process considered costs to complete to finished goods and was based on analyses of future selling prices and the profit associated with the manufacturing effort. The estimated fair value of raw materials was based on replacement cost. The $157.7 million of estimated fair value of inventories includes $4.2 million in fair value adjustments, all of which was amortized as noncash charges in cost of sales during the year ended December 31, 2015. See Note 5—Inventories for additional information about inventory as of December 31, 2015.
Property, plant and equipment includes land, site improvements, buildings and building improvements, and machinery, equipment, furniture and fixtures. The estimated fair value of property, plant and equipment was based on appraisals and replacement cost analyses. The estimated fair value of construction in progress was based on replacement cost, which approximated carrying value. See Note 7—Property, Plant and Equipment, Net for additional information about property, plant and equipment as of December 31, 2015.
The fair value of property, plant and equipment acquired was estimated as follows:
|
(In millions) |
Estimated Fair Value |
|
|
|
Land and improvements |
$ |
62.9 |
|
|
Buildings and improvements |
|
56.6 |
|
|
Machinery, equipment, furniture and fixtures |
|
181.9 |
|
|
Construction work in progress |
|
10.3 |
|
|
Property, plant and equipment |
$ |
311.7 |
|
Identifiable intangible assets represent the estimated fair value of customer relationships. The valuation of intangible assets acquired was based on management’s estimates, available information, and reasonable and supportable assumptions and used an excess earnings approach. Significant assumptions included forecast revenues, customer retention rates and profit margins, a discount rate of 13.5% based on our overall cost of equity, adjusted for perceived business risks related to these customer relationships, and an estimated economic useful life of twenty years. Due to uncertainties related to the expected cash flows, the customer relationships are amortized on a straight-line basis over the weighted average life of the expected cash flows, or seven years. See Note 8—Goodwill and Intangible Assets, Net for additional information about intangible assets as of December 31, 2015.
The fair value of prepaid, supplies, and other assets includes a $6.4 million fair value adjustment related to inventory supplies, which under Real Alloy’s accounting policy had been expensed, but remained available for use as of the acquisition date. The estimated fair value of the supplies is based on replacement cost. $5.6 million of the fair value adjustment related to supplies was amortized as noncash charges in cost of sales during the year ended December 31, 2015.
The fair value of trade payables and accrued liabilities were estimated to approximate carrying value due to the short-term nature of the liabilities, except for the toll liability, which was adjusted by $0.6 million as part of the inventory fair value adjustment, all of which was recognized in cost of sales in the year ended December 31, 2015 See Note 12—Prepaid Expenses, Other Assets, and Accrued and Other Liabilities for additional information about accrued liabilities as of December 31, 2015.
Accrued pension benefits include defined benefit plans for German employees. The plans are based on final pay and service, but some senior officers are entitled to receive enhanced pension benefits. Benefit payments are financed, in part, by contributions to a relief fund that establishes a life insurance contract to secure future pension payments. Based on statutory pension contribution calculations proscribed under German law, the plans are substantially underfunded. The unfunded statutory accrued pension costs are covered under a pension insurance association under German law should Real Alloy, or its subsidiaries, be unable to fulfill their pension obligations. See Note 15—Employee Benefit Plans for additional information about pension benefits.
The following assumptions were utilized to measure accrued pension benefits as of the acquisition date:
|
Discount rate |
|
1.7 |
% |
|
Rate of compensation increase |
|
3.0 |
% |
|
Pension increase |
|
1.8 |
% |
|
Turnover |
|
2.0 |
% |
F-21
Environmental liabilities represent estimated reserves for long-term environmental remediation costs that have been recognized based on the guidance in FASB ASC 450, Contingencies, and FASB ASC 410, Asset Retirement and Environmental Obligations. Real Alloy is subject to various environmental laws and regulations governing, among other things, the handling, disposal and remediation of hazardous substances and wastes, and employee safety. Short-term environmental remediation costs totaling $3.2 million are classified in accrued liabilities as of the acquisition date. Given the changing nature of environmental legal requirements, Real Alloy may be required to take environmental control measures at some of its facilities to meet future requirements. See Note 23—Commitments and Contingencies for additional information regarding environmental liabilities.
The estimated fair value of the Redeemable Preferred Stock was determined based on a discounted cash flow using estimates of market rates and redemption probabilities. See Note 9—Debt and Redeemable Preferred Stock and Note 18—Derivative and Other Financial Instruments and Fair Value Measurements for additional information about the Redeemable Preferred Stock as of December 31, 2015.
Deferred income taxes represent the differences between the book and tax bases of the assets acquired, which as of the acquisition date totaled $0.7 million of deferred tax assets and $7.5 million of deferred tax liabilities in Germany, the United Kingdom, Norway, Canada and Mexico. As a result of an election under section 338(h)(10) of the Internal Revenue Code of 1986, as amended (the “Tax Code”), the tax bases of U.S. assets acquired and most liabilities assumed were adjusted to the acquisition date fair values. Approximately $66.3 million of the goodwill is expected to be deductible for U.S. income tax reporting purposes. See Note 14—Income Taxes for additional information regarding deferred income taxes as of December 31, 2015.
Other liabilities assumed include asset retirement obligations, which represent obligations associated with the retirement of tangible long-lived assets, which primarily relate to the requirement to cap three landfills, as well as costs related to the future removal of asbestos and underground storage tanks at various facilities. The estimated fair value is based upon the present value of the future cash flows expected to be required to satisfy the obligation using discount rates ranging from 6.7% to 13.2%. Determining the fair value of asset retirement obligations requires judgment, including estimates of the credit adjusted interest rate and estimates of future cash flows. The present value of the obligations is accreted over the useful life of the associated assets. See Note 11—Asset Retirement Obligations for additional information about the asset retirement obligations as of December 31, 2015, and Note 12—Prepaid Expenses, Other Assets, and Accrued and Other Liabilities for additional information about other liabilities as of December 31, 2015.
Based on the estimated fair value of assets acquired and liabilities assumed, goodwill of $104.6 million is attributable to Real Alloy’s strong management team, assembled workforce and its defensible market share. See Note 8—Goodwill and Intangible Assets, Net for additional information about goodwill as of December 31, 2015.
The operating results of Real Alloy are included in the Company’s consolidated financial statements from the acquisition date. For the period from the acquisition date to December 31, 2015, Real Alloy’s total revenues and loss from continuing operations before income taxes were $1,145.6 million and $23.3 million, respectively.
The following selected unaudited pro forma results of operations of the Company for the years ended December 31, 2015 and 2014, give effect to this business combination as though the transaction occurred on January 1, 2014:
|
|
Year Ended December 31, |
|
|||||
|
(In millions) |
|
2015 |
|
|
|
2014 |
|
|
Total revenues: |
|
|
|
|
|
|
|
|
As reported |
$ |
1,145.6 |
|
|
$ |
2.1 |
|
|
Pro forma |
|
1,382.6 |
|
|
|
1,523.4 |
|
|
Loss from continuing operations before income taxes: |
|
|
|
|
|
|
|
|
As reported |
$ |
(40.8 |
) |
|
$ |
(8.5 |
) |
|
Pro forma |
|
(22.8 |
) |
|
|
(53.6 |
) |
F-22
NOTE 4—FINANCING RECEIVABLE
The financing receivable relates to proceeds receivable from the sale of trade accounts receivable under the Factoring Facility, net of advances taken against the sales proceeds and administrative fees and costs. The following table provides information about the Factoring Facility and financing receivable as of December 31, 2015:
|
|
December 31, |
|
|
|
(In millions) |
2015 |
|
|
|
Balance, beginning of period |
$ |
— |
|
|
Sales of trade accounts receivable |
|
431.5 |
|
|
Proceeds from sales of trade accounts receivable |
|
(395.3 |
) |
|
Advances, net against financing receivable |
|
(2.8 |
) |
|
Currency translation adjustments |
|
(0.7 |
) |
|
Balance, end of period |
$ |
32.7 |
|
On February 27, 2015, an indirect wholly owned German subsidiary of Real Alloy, entered into the €50.0 million Factoring Facility, which provides for nonrecourse sales of certain of its trade accounts receivables to a financial institution, subject to certain limitations and eligibility requirements. The Factoring Facility has a termination date of January 15, 2019.
Prior to the collection of proceeds from the transferred receivables, advances against such proceeds are available to the Real Alloy subsidiary, subject to certain limitations and eligibility requirements. Such advances, which totaled $2.8 million as of December 31, 2015, are recorded as a reduction to the financing receivable in the consolidated balance sheets, due to the counterparty’s right of set off.
The interest rate applicable to advances under the Factoring Facility is the three-month EURIBOR (daily rate) fixed on the last business day of a month for the following month, plus 1.65%. Interest expense on advances was $0.1 million for the year ended December 31, 2015.
NOTE 5—INVENTORIES
The following table presents the components of inventories as of December 31, 2015 and 2014:
|
|
December 31, |
|
|||||
|
(In millions) |
2015 |
|
|
2014 |
|
||
|
Real Alloy: |
|
|
|
|
|
|
|
|
Finished goods |
$ |
32.2 |
|
|
$ |
— |
|
|
Raw materials and work in process |
|
68.1 |
|
|
|
— |
|
|
Total Real Alloy inventories |
|
100.3 |
|
|
|
— |
|
|
Cosmedicine - finished goods |
|
0.9 |
|
|
|
|
|
|
Total inventories |
$ |
101.2 |
|
|
$ |
— |
|
NOTE 6—DEBT AND EQUITY OFFERING COSTS
In connection with the Company’s capital raising and acquisition activities, we have incurred fees, costs and expenses associated with various financing transactions that were in process as of December 31, 2015 and 2014. The debt and equity offering costs are summarized in the following table:
|
|
December 31, |
|
|||||
|
(In millions) |
2015 |
|
|
|
2014 |
|
|
|
Debt costs associated with acquisitions |
$ |
— |
|
|
$ |
3.7 |
|
|
Backstops commitments associated with acquisitions |
|
— |
|
|
|
10.5 |
|
|
Rights and other equity offering costs |
|
— |
|
|
|
0.3 |
|
|
Total debt and equity offering costs |
$ |
— |
|
|
$ |
14.5 |
|
As of December 31, 2015, all of the capitalized debt and equity offering costs capitalized as of December 31, 2014 had been reclassified with the associated debt issued or additional paid-in capital with the associated equity issued and $10.5 million was recognized as expense in 2015 as commitments expired.
F-23
NOTE 7—PROPERTY, PLANT AND EQUIPMENT, NET
The following table presents the components of property, plant and equipment, net as of December 31, 2015 and 2014:
|
|
December 31, |
|
|||||
|
(In millions) |
2015 |
|
|
|
2014 |
|
|
|
Land and improvements |
$ |
65.5 |
|
|
$ |
— |
|
|
Buildings and improvements |
|
58.4 |
|
|
|
0.1 |
|
|
Machinery, equipment, furniture and fixtures |
|
201.7 |
|
|
|
0.1 |
|
|
Construction work in progress |
|
6.2 |
|
|
|
— |
|
|
Property, plant and equipment |
|
331.8 |
|
|
|
0.2 |
|
|
Accumulated depreciation |
|
(30.3 |
) |
|
|
(0.1 |
) |
|
Property, plant and equipment, net |
$ |
301.5 |
|
|
$ |
0.1 |
|
Capital lease assets totaled $4.5 million and zero as of December 31, 2015 and 2014, respectively. Capital lease amortization is included in depreciation expense. Accumulated depreciation for capital lease assets totaled $0.5 million and zero as of December 31, 2015 and 2014, respectively. During the year ended December 31, 2015, $0.6 million of interest was capitalized in connection with capital projects.
The following table provides depreciation expense and repair and maintenance expense for the years ended December 31, 2015, 2014 and 2013:
|
|
Year Ended December 31, |
|
|||||||||
|
(In millions) |
2015 |
|
|
2014 |
|
|
2013 |
|
|||
|
Depreciation expense included in cost of sales |
$ |
29.9 |
|
|
$ |
— |
|
|
$ |
— |
|
|
Depreciation expense included in selling, general and administrative expenses |
|
0.6 |
|
|
|
0.1 |
|
|
|
0.1 |
|
NOTE 8—GOODWILL AND INTANGIBLE ASSETS, NET
Accounting for acquired goodwill in accordance with GAAP requires significant judgment with respect to the determination of the valuation of the acquired assets and liabilities assumed in order to determine the final amount of goodwill recorded in a business combination. Goodwill is not amortized, rather, it is evaluated for impairment on an annual basis, or more frequently when a triggering event occurs between annual tests that would more likely than not reduce the fair value of the reporting unit below its carrying value. The reporting units evaluated for goodwill impairment have been determined to be the same as the Company’s operating segments.
Annual goodwill impairment testing
In the first step of the goodwill impairment test, the fair value of each reporting unit is compared to its carrying amount. The Company utilizes a combination of a discounted cash flow (“DCF”) approach and a GPC approach in order to value the Company's reporting units required to be tested for impairment. Each of the DCF and GPC approaches were weighted 50%. These nonrecurring fair value measurements are primarily determined using unobservable inputs. Accordingly, these fair value measurements are categorized within Level 3 of the fair value hierarchy.
Under the DCF, we estimate the fair value of a reporting unit based on the present value of future cash flows. Cash flow projections are based on management’s estimate of revenue growth rates and operating margins and take into consideration industry and market conditions, as well as company specific economic factors. The DCF calculations also include a terminal value calculation that is based on an expected long-term growth rate for the applicable reporting unit. The discount rate is based on the weighted average cost of capital adjusted for the relevant risk associated with the business specific characteristics and the uncertainty associated with the reporting unit's ability to execute on the projected cash flows. The weighted average cost of capital used in the income approach was 10.5%. For 2015, a long-term growth rate of three percent was used and was determined based on estimated future gross domestic product. Other significant assumptions include future capital expenditures and changes in working capital requirements.
F-24
Under the GPC we identify a group of comparable companies giving consideration to, among other relevant characteristics, similar lines of business, business risks, growth prospects, business maturity, market presence, leverage, and size and scale of operations. The analysis compares the public market implied fair value for each comparable public company to its historical and projected revenues and EBITDA. The calculated range of multiples for the comparable companies used was generally consistent with the purchase multiples in the Real Alloy Acquisition, which was applied to projected EBITDA and revenues to determine a range of fair values as of October 1, 2015, which is applied to our historical and projected EBITDA and revenues, respectively, to determine a range of fair values as of October 1, 2015.
The DCF and GPC analyses are based on our projected financial information, which includes a variety of estimates and assumptions. While we consider such estimates and assumptions reasonable, they are inherently subject to uncertainties and a wide variety of significant business, economic and competitive risks, many of which are beyond our control and may not materialize. Changes in these estimates and assumptions may have a significant effect on the estimation of the fair value of our reporting units.
Results of the October 1, 2015 testing of both RANA and RAEU indicated fair values for these reporting units in excess of their respective carrying amounts. No interim indicators of impairment were identified in 2015.
The following table reflects the activity associated with goodwill during the year ended December 31, 2015:
|
(In millions) |
RANA |
|
|
RAEU |
|
|
Total |
|
|||
|
Balance, December 31, 2014 |
$ |
— |
|
|
$ |
— |
|
|
$ |
— |
|
|
Acquisition of Real Alloy |
|
95.4 |
|
|
|
9.2 |
|
|
|
104.6 |
|
|
Currency translation adjustments |
|
— |
|
|
|
(0.3 |
) |
|
|
(0.3 |
) |
|
Balance, December 31, 2015 |
$ |
95.4 |
|
|
$ |
8.9 |
|
|
$ |
104.3 |
|
Intangible assets consisted of the following as of December 31, 2015 and 2014:
|
|
December 31, |
|
|||||
|
(In millions) |
2015 |
|
|
2014 |
|
||
|
Customer relationships |
$ |
17.0 |
|
|
$ |
— |
|
|
Product formulations |
|
0.2 |
|
|
|
0.2 |
|
|
Accumulated amortization |
|
(2.1 |
) |
|
|
(0.1 |
) |
|
Intangible assets, net |
$ |
15.1 |
|
|
$ |
0.1 |
|
The following table presents the estimated amortization of intangible assets in future periods:
|
(In millions) |
|
|
|
|
|
|
|
2016 |
|
$ |
2.5 |
|
|
|
2017 |
|
|
2.4 |
|
|
|
2018 |
|
|
2.5 |
|
|
|
2019 |
|
|
2.4 |
|
|
|
2020 |
|
|
2.5 |
|
|
Thereafter |
|
|
2.8 |
|
|
|
Amortization of intangible assets |
|
$ |
15.1 |
|
|
F-25
NOTE 9—DEBT AND REDEEMABLE PREFERRED STOCK
The following table presents the Company’s long-term debt as of December 31, 2015 and 2014:
|
|
December 31, |
|
|||||
|
(In millions) |
2015 |
|
|
2014 |
|
||
|
Senior Secured Notes: |
|
|
|
|
|
|
|
|
Principal amount outstanding |
$ |
305.0 |
|
|
$ |
— |
|
|
Unamortized original issue discount and issuance costs |
|
(14.3 |
) |
|
|
— |
|
|
Senior Secured Notes, net |
|
290.7 |
|
|
|
— |
|
|
Asset-Based Facility: |
|
|
|
|
|
|
|
|
Principal amount outstanding |
|
22.0 |
|
|
|
— |
|
|
Unamortized debt issuance costs |
|
(2.4 |
) |
|
|
— |
|
|
Asset-Based Facility, net |
|
19.6 |
|
|
|
— |
|
|
Capital leases |
|
4.1 |
|
|
|
— |
|
|
Current portion of long-term debt |
|
(2.3 |
) |
|
|
— |
|
|
Total long-term debt, net |
$ |
312.1 |
|
|
$ |
— |
|
Long-term debt
Senior Secured Notes
On January 8, 2015, Real Alloy, as successor to SGH Escrow, completed a private placement of $305.0 million aggregate principal of 10% Senior Secured Notes at a price of 97.206% of the principal amount thereof to qualified institutional purchasers in accordance with Rule 144A and Regulation S under the Securities Act. The Senior Secured Notes were issued pursuant to an indenture, dated as of January 8, 2015 (the “Indenture”) between Real Alloy, as successor to SGH Escrow, Real Alloy Parent, and Wilmington Trust, National Association (“Wilmington”), as trustee and notes collateral trustee.
Under the terms of the Pledge and Security Agreement, dated as of February 27, 2015, by and between each of Real Alloy, Real Alloy Parent and the other parties signatory thereto, and Wilmington as notes collateral trustee, the Senior Secured Notes and related guarantees are secured by first priority security interests in the fixed assets of Real Alloy, Real Alloy Parent and the Subsidiary Guarantors (as defined in the Pledge and Security Agreement) and by second priority security interests in certain other collateral of Real Alloy, Real Alloy Parent and the Subsidiary Guarantors.
The Indenture, among other things, limits Real Alloy and its restricted subsidiaries’ (as defined in the Indenture) ability to: incur additional indebtedness or issue certain preferred stock; pay dividends or make other distributions on capital stock or prepay subordinated indebtedness; purchase or redeem any equity interests; make investments; create liens; sell assets; enter into agreements that restrict dividends or other payments by restricted subsidiaries; consolidate, merge or transfer all or substantially all of its assets; engage in transactions with Real Alloy’s affiliates; or enter into any sale and leaseback transactions. These covenants are subject to important exceptions and qualifications. As of December 31, 2015, Real Alloy was in compliance with all applicable covenants under the Indenture and Pledge and Security Agreement.
The Senior Secured Notes mature on January 15, 2019 and interest is payable on January 15 and July 15 of each year, commencing on July 15, 2015, through the date of maturity. For the year ended December 31, 2015, interest expense associated with the Senior Secured Notes was $33.4 million, including $3.6 million of noncash expense related to the amortization of the original issue discount and debt issuance costs.
F-26
On February 27, 2015, a wholly owned domestic subsidiary of Real Alloy and an affiliate of Real Alloy entered into the $110.0 million Asset-Based Facility that matures on October 17, 2018. The Asset-Based Facility is secured by a first priority lien on the borrowers and, to the extent no adverse tax impact would be incurred, Real Alloy’s foreign subsidiaries’ accounts receivable, inventory, instruments representing receivables, guarantees and other credit enhancements related to receivables, and bank accounts into which receivables are deposited, among other related assets. The Asset-Based Facility is also secured by a second priority lien on the assets that secure the Senior Secured Notes. The borrowing base under the Asset-Based Facility is determined based on eligible accounts receivable and eligible inventory. U.S. dollar denominated loans under the U.S. sub-facility of the Asset-Based Facility will bear interest, at the borrowers’ option, either (i) at 1, 2, 3 or 6-month interest periods at LIBOR, or (ii) the Base Rate (as defined below), in each case plus a margin based on the amount of the excess availability under the Asset-Based Facility. The “Base Rate” is equal to the greater of (a) the U.S. prime rate, (b) the U.S. Federal Funds Rate plus 50 basis points, and (c) the sum of LIBOR plus a margin based on the amount of the excess availability under the Asset-Based Facility. Canadian dollar denominated loans under the Canadian sub-facility of the Asset-Based Facility will bear interest, at the borrowers’ option, either (i) at 1, 2, 3 or 6-month interest periods at an average Canadian interbank rate, or (ii) floating at the greater of the Canadian prime rate or the average 30-day Canadian interbank rate plus 1.35%, in each case plus a margin based on the amount of the excess availability under the Asset-Based Facility. Events of default will trigger an increase of 2.0% in all interest rates. Interest is payable monthly in arrears, except for LIBOR loans and Canadian interbank rate loans, for which interest is payable at the end of each relevant interest period. The Asset-Based Facility provides for the issuance of up to $25.0 million of letters of credit. In addition to paying interest on any outstanding principal under the Asset-Based Facility, the borrowers are required to pay commitment fees in respect of unutilized commitments ranging from 0.25% to 0.38% based on average utilization for the applicable period. On the initial funding date, the borrowers paid a 1.0% funding fee. For the year ended December 31, 2015, interest expense associated with the Asset-Based Facility was $1.2 million, including $0.7 million related to the amortization of debt issuance costs.
As of December 31, 2015, Real Alloy had available borrowing capacity of $42.1 million under the Asset-Based Facility, after giving effect to the outstanding letters of credit of $3.7 million. As of December 31, 2015, the borrowers were in compliance with all applicable covenants under the Asset-Based Facility.
Capital Leases
As part of the Real Alloy Acquisition, existing capital leases of the Real Alloy Business, primarily mobile and office equipment, were assumed. In the normal course of operations, Real Alloy enters into capital leases to finance office, mobile, and other equipment for its operations. As of December 31, 2015, $2.3 million of the $4.1 million in total capital lease obligations are due within the next twelve months.
Redeemable Preferred Stock
The Redeemable Preferred Stock was issued to Aleris on February 27, 2015 as a portion of the purchase price for the Real Alloy Acquisition. The Redeemable Preferred Stock pays quarterly dividends at a rate of 7% for the first eighteen months after the date of issuance, 8% for the next twelve months, and 9% thereafter. Dividends may be paid in kind for the first two years, and thereafter will be paid in cash. All accrued and accumulated dividends on the Redeemable Preferred Stock will be prior and in preference to any dividend on any of the Company’s common stock or other junior securities.
The shares of Redeemable Preferred Stock are generally non-voting, however the consent of the holders of a majority of the outstanding shares of Redeemable Preferred Stock are required, among other requirements, (i) until February 27, 2017, to (x) declare or pay cash dividends on Real Industry common stock; or (y) purchase, redeem or acquire shares of Real Industry common stock, other than, among others, certain shares of common stock issued to employees; (ii) so long as at least $10.0 million in aggregate principal amount of Redeemable Preferred Stock is outstanding, to make acquisitions valued at more than 5% of the consolidated assets of the Company and its subsidiaries; (iii) to take actions that would adversely affect the rights of the holders of the Redeemable Preferred Stock; and (iv) to undertake certain merger activities unless the Redeemable Preferred Stock remains outstanding or is purchased at the liquidation preference.
F-27
The Company may generally redeem the shares of Redeemable Preferred Stock at any time at the liquidation preference, and the holders may require the Company to redeem their shares of Redeemable Preferred Stock at the liquidation preference upon a change of control under the Senior Secured Notes (or any debt facility that replaces or redeems the Senior Secured Notes) to the extent that the change of control does not provide for such redemption at the liquidation preference. A holder of Redeemable Preferred Stock may require the Company to redeem all, but not less than all, of such holder’s Redeemable Preferred Stock sixty-six months after the issuance date. In addition, the Company may redeem shares of Redeemable Preferred Stock to the extent Aleris is required to indemnify the Company under the Real Alloy Purchase Agreement for the Real Alloy Acquisition. The Redeemable Preferred Stock held by Aleris and its subsidiaries has a liquidation preference of $26.5 million, as of December 31, 2015, and is not transferrable (other than to another subsidiary of Aleris) for eighteen months following issuance (or such longer period in connection with any ongoing indemnity claims under the Real Alloy Purchase Agreement). The maximum redemption amount, including future in kind dividends, if redeemed by the holder on August 27, 2020, their earliest redemption date, is $28.5 million.
The carrying value of Redeemable Preferred Stock is based on the estimated fair value of the instrument as of the issuance date. The difference between the redemption value and the estimated fair value as of the issuance date is being accreted to the redemption value over the period preceding the holder’s right to redeem the instrument, or sixty-six months.
The following table presents the activity related to the carrying value of Redeemable Preferred Stock during the year ended December 31, 2015:
|
(In millions) |
|
|
|
|
Balance, December 31, 2014 |
$ |
— |
|
|
Fair value of Redeemable Preferred Stock issued |
|
19.6 |
|
|
Dividends and accretion |
|
2.3 |
|
|
Balance, December 31, 2015 |
$ |
21.9 |
|
The following table presents contractual maturities of long-term debt as of December 31, 2015:
|
(In millions) |
|
|
|
|
|
|
|
2016 |
|
$ |
2.4 |
|
|
|
2017 |
|
|
1.2 |
|
|
|
2018 |
|
|
22.5 |
|
|
|
2019 |
|
|
305.1 |
|
|
|
2020 |
|
|
— |
|
|
Total |
|
$ |
331.2 |
|
|
NOTE 10—COMMON STOCK WARRANT LIABILITY
On June 11, 2010, warrants to purchase an aggregate of 1.5 million shares of Real Industry’s common stock were issued. The aggregate purchase price for the Warrants was $0.3 million, due in equal installments as the Warrants vested, 20% upon issuance and, thereafter, 20% annually on the anniversary of the issuance date and, as of June 30, 2015, the Warrants were 100% vested. The Warrants expire in June 2020 and had an original exercise price of $10.30 per share. The Warrants were issued without registration in reliance on the exemption set forth in Section 4(a)(2) of the Securities Act of 1933, as amended.
The Warrants include customary terms that provide for certain adjustments of the exercise price and the number of shares of common stock to be issued upon the exercise of the Warrants in the event of stock splits, stock dividends, pro rata distributions and certain other fundamental transactions. Additionally, the Warrants are subject to pricing protection provisions. During the term of the Warrants, the pricing protection provisions provide that certain issuances of new shares of common stock at prices below the current exercise price of the Warrants automatically reduce the exercise price of the Warrants to the lowest per share purchase price of common stock issued. In February 2015, the Company issued shares of common stock in the Rights Offering at $5.64 per share, thereby reducing the exercise price of the Warrants to $5.64 per share as of December 31, 2015.
In May 2015, 15,000 Warrants were exercised, including 7,500 on a cashless basis, resulting in the issuance of 9,360 shares of common stock and gross proceeds of $0.1 million. In September 2015, 16,667 Warrants were exercised on a cashless basis, resulting in the issuance of 6,969 shares of common stock. Upon exercise, the fair value of the Warrants exercised are reclassified to additional paid-in capital. As of December 31, 2015, 1,468,333 Warrants remain outstanding.
F-28
The Company utilizes a Monte Carlo simulation to estimate the fair value of the common stock warrant liability. See Note 12—Derivative and Other Financial Instruments and Fair Value Measurements for a discussion about the estimated fair values determined using the Monte Carlo simulation option pricing model. A decrease in the common stock warrant liability results in other nonoperating income, while an increase in the common stock warrant liability results in other nonoperating expense. The following table presents changes in the fair value of the common stock warrant liability during the years ended December 31, 2015, 2014 and 2013:
|
|
Year Ended December 31, |
|
|||||||||
|
(In millions) |
2015 |
|
|
2014 |
|
|
2013 |
|
|||
|
Balance, beginning of period |
$ |
5.6 |
|
|
$ |
9.3 |
|
|
$ |
2.4 |
|
|
Warrants exercised |
|
(0.2 |
) |
|
|
— |
|
|
|
— |
|
|
Change in fair value of common stock warrant liability |
|
1.5 |
|
|
|
(3.7 |
) |
|
|
6.9 |
|
|
Balance, end of period |
$ |
6.9 |
|
|
$ |
5.6 |
|
|
$ |
9.3 |
|
NOTE 11—ASSET RETIREMENT OBLIGATIONS
The following table presents activity for asset retirement obligations for the year ended December 31, 2015:
|
(In millions) |
|
|
|
|
Balance, December 31, 2014 |
$ |
— |
|
|
Obligations assumed in business combination |
|
6.5 |
|
|
Revisions and liabilities incurred |
|
(1.0 |
) |
|
Accretion expense |
|
0.4 |
|
|
Payments |
|
(0.9 |
) |
|
Balance, December 31, 2015 |
$ |
5.0 |
|
Of the total asset retirement obligations as of December 31, 2015, $0.9 million is classified as accrued liabilities, with the remaining $4.1 million classified as other noncurrent liabilities in the consolidated balance sheets.
NOTE 12—PREPAID EXPENSES, SUPPLIES, OTHER ASSETS, AND ACCRUED AND OTHER LIABILITIES
The following tables provide details of prepaid expenses, other assets, accrued liabilities and other noncurrent liabilities within continuing operations as of December 31, 2015 and 2014:
|
Prepaid Expenses, Supplies, and Other Current Assets |
|
|
|
|
|
|
|
|
|
December 31, |
|
|||||
|
(In millions) |
2015 |
|
|
2014 |
|
||
|
Prepaid expenses |
$ |
8.0 |
|
|
$ |
0.7 |
|
|
Supplies |
|
11.6 |
|
|
|
— |
|
|
Restricted cash |
|
3.9 |
|
|
|
— |
|
|
Other |
|
1.2 |
|
|
|
0.3 |
|
|
Total prepaid expenses, supplies, and other current assets |
$ |
24.7 |
|
|
$ |
1.0 |
|
|
Other Noncurrent Assets |
|
|
|
|
|
|
|
|
|
December 31, |
|
|||||
|
(In millions) |
2015 |
|
|
2014 |
|
||
|
Loans receivable, net |
$ |
1.0 |
|
|
$ |
1.1 |
|
|
Utility and other deposits |
|
6.8 |
|
|
|
— |
|
|
Other |
|
0.4 |
|
|
|
— |
|
|
Total other noncurrent assets |
$ |
8.2 |
|
|
$ |
1.1 |
|
F-29
|
|
|
|
|
|
|
|
|
|
|
December 31, |
|
|||||
|
(In millions) |
2015 |
|
|
2014 |
|
||
|
Employee-related costs |
$ |
13.5 |
|
|
$ |
0.8 |
|
|
Accrued interest |
|
14.0 |
|
|
|
— |
|
|
Toll liability |
|
8.2 |
|
|
|
— |
|
|
Income taxes payable |
|
2.0 |
|
|
|
— |
|
|
Environmental liabilities |
|
4.3 |
|
|
|
— |
|
|
Asset retirement obligations |
|
0.9 |
|
|
|
— |
|
|
Derivative liabilities, net |
|
0.7 |
|
|
|
— |
|
|
Other |
|
8.2 |
|
|
|
6.3 |
|
|
Total accrued liabilities |
$ |
51.8 |
|
|
$ |
7.1 |
|
|
Other Noncurrent Liabilities |
|
|
|
|
|
|
|
|
|
December 31, |
|
|||||
|
(In millions) |
2015 |
|
|
2014 |
|
||
|
Asset retirement obligations |
$ |
4.1 |
|
|
$ |
— |
|
|
Other |
|
1.3 |
|
|
|
0.1 |
|
|
Total other noncurrent liabilities |
$ |
5.4 |
|
|
$ |
0.1 |
|
NOTE 13—ACCUMULATED OTHER COMPREHENSIVE INCOME (LOSS)
The following table summarizes the activity within accumulated other comprehensive income (loss) for the years ended December 31, 2015, 2014 and 2013:
|
(In millions) |
Unrealized Gains on Investment Securities, Available for Sale |
|
|
Currency Translation |
|
|
Pension Benefit Adjustment |
|
|
Accumulated Other Comprehensive Income (Loss) |
|
||||
|
Balance, December 31, 2012 |
$ |
0.2 |
|
|
$ |
— |
|
|
$ |
— |
|
|
$ |
0.2 |
|
|
Unrealized gains |
|
0.2 |
|
|
|
— |
|
|
|
— |
|
|
|
0.2 |
|
|
Amounts realized in earnings |
|
(0.4 |
) |
|
|
— |
|
|
|
— |
|
|
|
(0.4 |
) |
|
Balance, December 31, 2013 and 2014 |
|
— |
|
|
|
— |
|
|
|
— |
|
|
|
— |
|
|
Currency translation adjustments |
|
— |
|
|
|
(6.0 |
) |
|
|
— |
|
|
|
(6.0 |
) |
|
Pension benefit adjustments |
|
— |
|
|
|
— |
|
|
|
7.1 |
|
|
|
7.1 |
|
|
Deferred tax expense on pension benefit adjustments |
|
— |
|
|
|
— |
|
|
|
(2.1 |
) |
|
|
(2.1 |
) |
|
Balance, December 31, 2015 |
$ |
— |
|
|
$ |
(6.0 |
) |
|
$ |
5.0 |
|
|
$ |
(1.0 |
) |
NOTE 14—INCOME TAXES
The following table reflects earnings (loss) from continuing operations before income taxes by domestic and foreign tax jurisdictions:
|
|
Year Ended December 31, |
|
|||||||||
|
(In millions) |
2015 |
|
|
2014 |
|
|
2013 |
|
|||
|
U.S. |
$ |
(43.8 |
) |
|
$ |
(8.5 |
) |
|
$ |
(16.5 |
) |
|
Foreign |
|
3.0 |
|
|
|
— |
|
|
|
— |
|
|
Loss from continuing operations |
$ |
(40.8 |
) |
|
$ |
(8.5 |
) |
|
$ |
(16.5 |
) |
F-30
The following table summarizes income tax benefit, within continuing operations, for the years ended December 31, 2015, 2014 and 2013:
|
|
Year Ended December 31, |
|
|||||||||
|
(In millions) |
2015 |
|
|
2014 |
|
|
2013 |
|
|||
|
Current income tax expense (benefit): |
|
|
|
|
|
|
|
|
|
|
|
|
Federal |
$ |
(13.9 |
) |
|
$ |
(3.1 |
) |
|
$ |
(2.4 |
) |
|
State |
|
0.4 |
|
|
|
(0.7 |
) |
|
|
(0.5 |
) |
|
Foreign |
|
6.5 |
|
|
|
— |
|
|
|
— |
|
|
Total current income tax benefit |
|
(7.0 |
) |
|
|
(3.8 |
) |
|
|
(2.9 |
) |
|
Deferred income tax expense (benefit): |
|
|
|
|
|
|
|
|
|
|
|
|
Federal |
|
1.3 |
|
|
|
(4.6 |
) |
|
|
0.5 |
|
|
State |
|
(0.1 |
) |
|
|
— |
|
|
|
0.1 |
|
|
Foreign |
|
(3.3 |
) |
|
|
— |
|
|
|
— |
|
|
Total deferred income tax expense (benefit) |
|
(2.1 |
) |
|
|
(4.6 |
) |
|
|
0.6 |
|
|
Total income tax benefit |
$ |
(9.1 |
) |
|
$ |
(8.4 |
) |
|
$ |
(2.3 |
) |
The following table provides a reconciliation of the effective tax rates in the consolidated statements of operations from continuing operations with the statutory U.S. federal income tax rate of 34.0%:
|
|
Year Ended December 31, |
|
|||||||||
|
(In millions) |
2015 |
|
|
2014 |
|
|
2013 |
|
|||
|
U.S. federal statutory rate |
|
34.0 |
% |
|
|
34.0 |
% |
|
|
34.0 |
% |
|
State income taxes |
|
(0.6 |
)% |
|
|
4.9 |
% |
|
|
2.2 |
% |
|
Foreign income taxes |
|
(0.4 |
)% |
|
|
0.0 |
% |
|
|
0.0 |
% |
|
Deferred tax valuation allowance |
|
(26.5 |
)% |
|
|
(131.3 |
)% |
|
|
(10.6 |
)% |
|
Fair value adjustments |
|
(1.2 |
)% |
|
|
14.7 |
% |
|
|
(14.9 |
)% |
|
Revisions to prior years |
|
19.1 |
% |
|
|
171.4 |
% |
|
|
2.1 |
% |
|
Other permanent items |
|
(2.1 |
)% |
|
|
(0.1 |
)% |
|
|
(0.2 |
)% |
|
Other |
|
0.0 |
% |
|
|
4.7 |
% |
|
|
2.3 |
% |
|
Effective tax rate |
|
22.3 |
% |
|
|
98.3 |
% |
|
|
14.9 |
% |
The following table provides a summary of the activity in the amount of unrecognized tax benefits for the years ended December 31, 2015, 2014 and 2013:
|
|
Year Ended December 31, |
|
|||||||||
|
(In millions) |
2015 |
|
|
2014 |
|
|
2013 |
|
|||
|
Balance, beginning of period |
$ |
— |
|
|
$ |
0.3 |
|
|
$ |
0.4 |
|
|
Additions |
|
0.3 |
|
|
|
0.3 |
|
|
|
— |
|
|
Reductions |
|
— |
|
|
|
— |
|
|
|
(0.1 |
) |
|
Settlements |
|
— |
|
|
|
(0.6 |
) |
|
|
— |
|
|
Balance, end of period |
$ |
0.3 |
|
|
$ |
— |
|
|
$ |
0.3 |
|
Unrecognized tax benefits as of December 31, 2015 were $0.3 million, the recognition of which would impact the effective tax rate. Interest and penalties related to unrecognized tax benefits are recognized as a component of income tax expense. For the year ended December 31, 2015, the Company recognized no income tax expense related to interest and penalties.
The Company has not provided for U.S. income taxes on undistributed earnings of certain non-U.S. subsidiaries, as such amounts are considered permanently reinvested outside the U.S. To the extent foreign earnings previously treated as permanently reinvested are repatriated, the related U.S. tax liability may be reduced by any foreign income taxes paid on these earnings. It is not practicable to determine the U.S. federal income tax liability that would be payable, if any, should such earnings not be permanently reinvested. As of December 31, 2015, non-U.S. subsidiaries have cumulative unremitted earnings of $12.4 million.
F-31
Deferred income taxes are a component of continuing operations and include the net tax effects of temporary differences between the carrying amounts of assets and liabilities for financial reporting purposes and for income tax reporting purposes. The components of the Company’s deferred tax assets, liabilities and valuation allowances as of December 31, 2015 and 2014 are summarized in the following table:
|
|
December 31, |
|
|||||
|
(In millions) |
2015 |
|
|
2014 |
|
||
|
Deferred tax assets: |
|
|
|
|
|
|
|
|
Net operating loss carryforwards |
$ |
366.9 |
|
|
$ |
375.2 |
|
|
Alternative minimum tax credits |
|
11.8 |
|
|
|
10.9 |
|
|
Repurchase reserve |
|
0.2 |
|
|
|
2.1 |
|
|
Inventory |
|
0.4 |
|
|
|
0.6 |
|
|
Compensation |
|
1.1 |
|
|
|
0.9 |
|
|
Pension obligations |
|
5.7 |
|
|
|
— |
|
|
Other |
|
2.1 |
|
|
|
1.0 |
|
|
Total deferred tax assets |
|
388.2 |
|
|
|
390.7 |
|
|
Deferred tax valuation allowance |
|
(382.4 |
) |
|
|
(385.6 |
) |
|
Deferred tax assets, net of valuation allowance |
|
5.8 |
|
|
|
5.1 |
|
|
Deferred tax liabilities: |
|
|
|
|
|
|
|
|
Property, plant and equipment |
|
(11.4 |
) |
|
|
— |
|
|
Intangible assets |
|
(1.1 |
) |
|
|
(0.6 |
) |
|
Other |
|
— |
|
|
|
0.4 |
|
|
Total deferred tax liabilities |
|
(12.5 |
) |
|
|
(0.2 |
) |
|
Net deferred assets (liabilities) |
$ |
(6.7 |
) |
|
$ |
4.9 |
|
The Company assesses deferred tax assets to consider whether it is more likely than not that the deferred tax assets will be realized. The ultimate realization of deferred tax assets depends on the ability to generate taxable income during the periods and in jurisdictions in which the temporary difference become deductible. As a result of generating losses since 2006, among other factors, the Company determined that sufficient uncertainty existed as to the realizability of its deferred tax assets and placed a full valuation allowance on its U.S. deferred tax assets. Based on the Company’s analysis of estimated taxable income, including the NABCO sale and the Real Alloy Acquisition, $5.1 million of the deferred tax valuation allowance was released in the year ended December 31, 2014. The following table provides information about the activity of our deferred tax valuation allowance:
|
|
Year Ended December 31, |
|
|||||||||
|
(In millions) |
2015 |
|
|
2014 |
|
|
2013 |
|
|||
|
Balance, beginning of period |
$ |
385.6 |
|
|
$ |
375.0 |
|
|
$ |
373.7 |
|
|
Additions (reductions) recorded in the provision for income taxes |
|
(5.8 |
) |
|
|
10.6 |
|
|
|
1.3 |
|
|
Business acquired |
|
2.6 |
|
|
|
— |
|
|
|
— |
|
|
Balance, end of period |
$ |
382.4 |
|
|
$ |
385.6 |
|
|
$ |
375.0 |
|
The Company and its subsidiaries file income tax returns in the U.S. federal jurisdiction, various state and local jurisdictions, as well as foreign jurisdictions located in Canada, Mexico, Germany, Norway, and the United Kingdom. With few exceptions, the 2009 through 2014 tax years remain open to examination. The activity in 2013 and 2014 relates to an IRS examination of the Company’s 2003, 2004, 2005 and 2008 tax years, which was completed in March 2014. Due to the existing NOL carryforwards, the Company is still subject to audit for certain loss years prior to 2008 by the Internal Revenue Service and by various state taxing authorities as the NOL for a particular year is utilized. As of December 31, 2015, the Company has no tax years under examination.
As of December 31, 2015, the Company has estimated U.S. NOLs of $871.8 million and non-U.S. net operating tax loss carryforwards of $27.6 million. The U.S. NOLs have a 20-year life and begin to expire after the 2027 tax year. Additionally, the Company has state net operating loss tax carryforwards in amounts that are comparable to the U.S. NOLs.
F-32
NOTE 15—EMPLOYEE BENEFIT PLANS
Defined Contribution Plans
The Company’s defined contribution plans cover substantially all U.S. employees. The plans provide for employer contributions and, in some cases, an age and salary based contribution. The match of employee contributions under defined contribution plans and supplemental employer contributions for the years ended December 31, 2015, 2014 and 2013 were as follows:
|
|
Year Ended December 31, |
|
|||||||||
|
(In millions) |
2015 |
|
|
2014 |
|
|
2013 |
|
|||
|
Company match of employee contributions |
$ |
1.1 |
|
|
$ |
0.2 |
|
|
$ |
0.2 |
|
|
Supplemental employer contribution |
|
0.4 |
|
|
|
— |
|
|
|
— |
|
Defined Benefit Pension Plans
Real Alloy sponsors three defined benefit pension plans for its German employees. The plans are based on final pay and service, but some senior employees are entitled to receive enhanced pension benefits. Benefit payments are financed, in part, by contributions to a relief fund that establishes a life insurance contract to secure future pension payments (which represents a Level 2 measurement within the fair value hierarchy). The plans, however, are substantially underfunded under German law. The unfunded accrued pension benefits are covered under a pension insurance association under German law, should Real Alloy be unable to fulfill its obligations under the plans.
The following table presents the components of the net periodic benefit expense under the German defined benefit pension plans for the year ended December 31, 2015:
|
|
Year Ended December 31, |
|
|
|
(In millions) |
2015 |
|
|
|
Service cost |
$ |
0.9 |
|
|
Interest cost |
|
0.7 |
|
|
Expected return on plan assets |
|
(0.1 |
) |
|
Net periodic benefit expense |
$ |
1.5 |
|
The following table reflects changes in projected benefit obligations and plan assets during the year ended December 31, 2015:
|
|
Year Ended December 31, |
|
|
|
(In millions) |
2015 |
|
|
|
Changes in projected benefit obligations: |
|
|
|
|
Projected benefit obligations, beginning of period |
$ |
— |
|
|
Projected benefit obligations assumed in business combination |
|
49.8 |
|
|
Service cost |
|
0.9 |
|
|
Interest cost |
|
0.7 |
|
|
Actuarial gain |
|
(7.2 |
) |
|
Benefits paid |
|
(0.8 |
) |
|
Currency translation and other |
|
(1.2 |
) |
|
Projected benefit obligations, end of period |
|
42.2 |
|
|
Changes in plan assets: |
|
|
|
|
Fair value of plan assets, beginning of period |
|
— |
|
|
Fair value of plan assets acquired in business combination |
|
3.8 |
|
|
Employer contributions |
|
0.5 |
|
|
Actual return on plan assets |
|
0.1 |
|
|
Currency translation and other |
|
(0.2 |
) |
|
Fair value of plan assets, end of period |
|
4.2 |
|
|
Net amount recognized |
$ |
38.0 |
|
F-33
The following table provides additional information about amounts recognized in the consolidated balance sheet as of December 31, 2015:
|
|
Year Ended December 31, |
|
|
|
(In millions) |
2015 |
|
|
|
Pension benefit obligations |
$ |
38.0 |
|
|
Net actuarial gain recognized in accumulated other comprehensive income (before tax) |
|
7.1 |
|
|
Amortization of net actuarial gain expected to be recognized during the next fiscal year (before tax) |
|
0.3 |
|
|
Accumulated benefit obligation |
|
37.5 |
|
|
Projected employer contribution for 2016 |
|
0.6 |
|
Plan Assumptions. The Company makes assumptions regarding such variables as the expected long-term rate of return on plan assets and the discount rate applied to determine service and interest cost. The discount rate is selected to provide management’s best estimate of the rate at which the benefit obligation could effectively be settled. In making this estimate, projected cash flows are developed and matched with a yield curve based on an appropriate universe of high-quality corporate bonds.
Assumptions for long-term rates of return on plan assets are based upon historical returns, future expectations for returns for each asset class and the effect of periodic target asset allocation rebalancing. We believe these assumptions are appropriate based upon the mix of the investments and the long-term nature of the plans’ investments. The following table provides assumptions used to determine benefit obligations as of December 31, 2015:
|
|
December 31, |
|
|
|
|
2015 |
|
|
|
Discount rate |
|
2.4 |
% |
|
Rate of compensation increase |
|
2.8 |
% |
|
Pension increase |
|
1.6 |
% |
|
Turnover |
|
2.0 |
% |
The following table reflects the assumptions used to determine the net periodic benefit cost for the year ended December 31, 2015:
|
|
Year Ended December 31, |
|
|
|
|
2015 |
|
|
|
Discount rate |
|
1.7 |
% |
|
Expected return on plan assets |
|
1.5 |
% |
|
Rate of compensation increase |
|
3.0 |
% |
Expected Future Benefit Payments. The following table provides estimated benefit payments for the Company’s pension plans, which reflect expected future service:
|
|
Years Ended December 31, |
|
|||||||||||||||||||||
|
(In millions) |
2016 |
|
|
2017 |
|
|
2018 |
|
|
2019 |
|
|
2020 |
|
|
2021 - 2025 |
|
||||||
|
Expected future benefit payments |
$ |
0.9 |
|
|
$ |
1.0 |
|
|
$ |
1.1 |
|
|
$ |
1.2 |
|
|
$ |
1.3 |
|
|
$ |
7.5 |
|
F-34
Incentive Plans
At the 2015 Annual Meeting of Stockholders, our stockholders approved the Signature Group Holdings, Inc. 2015 Equity Award Plan, and following our corporate name change, the Amended and Restated Real Industry, Inc. 2015 Equity Award Plan (the “2015 Equity Plan”), which provides for the grant of restricted common stock, common stock options, performance shares, stock appreciation rights, and restricted stock units to employees, nonexecutive directors and consultants. The 2015 Equity Plan replaces the Amended and Restated 2006 Signature Group Holdings, Inc. Performance Incentive Plan (the “Incentive Plan”). Including the carryover shares from the Incentive Plan, the Board is authorized to issue up to 1.9 million shares of common stock, or its equivalent, under the 2015 Equity Plan. The terms and conditions of awards outstanding under the Incentive Plan are not affected by the termination of the Incentive Plan, as their terms survive any termination. As of December 31, 2015 and 2014, there were no stock appreciation rights or restricted stock units outstanding. As of December 31, 2014, under the Incentive Plan, there were approximately 0.5 million shares available for grant. As of December 31, 2015, there are 259,323 shares of unvested restricted common stock, 775,650 fully vested and exercisable common stock options, and 260,000 unvested performance shares outstanding under the Incentive Plan and 2015 Equity Plan. As of December 31, 2015, under the 2015 Equity Plan, there were approximately 1.7 million shares available for grant.
Director Compensation Program
The Director Compensation Program provides for annual grants of restricted shares of the Company’s common stock on the first business day of each calendar year to each nonexecutive Board member, under both the 2015 Equity Plan and the Incentive Plan. Through the year ended December 31, 2015, these grants had a grant date fair value of $75,000 per nonexecutive director, and vested on January 1 of the following year. Beginning January 1, 2016, these grants will have a grant date fair value of $85,000. Compensation to nonexecutive directors joining the Company after January 1 is prorated for the time of service and those awards also vest on January 1 of the following year.
Restricted common stock
Restricted common stock awards are granted with various vesting schedules ranging from immediately to five years. Grants that vest immediately have restrictions on transfer of the common stock for approximately one year. The following table provides activity of restricted common stock for the years ended December 31, 2015, 2014 and 2013:
|
|
Shares |
|
|
Weighted Average Grant Date Fair Value Per Share |
|
||
|
Balance, December 31, 2012 |
|
357,522 |
|
|
$ |
4.32 |
|
|
Restricted common stock vested |
|
(356,886 |
) |
|
|
4.61 |
|
|
Restricted common stock granted |
|
139,005 |
|
|
|
5.70 |
|
|
Balance, December 31, 2013 |
|
139,641 |
|
|
|
4.94 |
|
|
Restricted common stock vested |
|
(98,530 |
) |
|
|
5.76 |
|
|
Restricted common stock granted |
|
73,394 |
|
|
|
9.89 |
|
|
Balance, December 31, 2014 |
|
114,505 |
|
|
|
4.94 |
|
|
Restricted common stock vested |
|
(96,172 |
) |
|
|
6.92 |
|
|
Restricted common stock granted |
|
255,151 |
|
|
|
6.89 |
|
|
Restricted common stock forfeited |
|
(14,161 |
) |
|
|
8.08 |
|
|
Balance, December 31, 2015 |
|
259,323 |
|
|
$ |
7.05 |
|
Share-based compensation related to restricted common stock awards was $0.8 million, $0.7 million and $1.2 million for the years ended December 31, 2015, 2014 and 2013, respectively. As of December 31, 2015, the aggregate unamortized value of share-based restricted common stock awards was $1.1 million, and will be recognized over a weighted average period of 2.1 years from December 31, 2015.
During the years ended December 31, 2015, 2014 and 2013, employees were granted 32,412, 17,986 and 10,871 shares of restricted common stock, respectively; executive officers were granted 172,529, 27,500 and 25,000 shares of restricted common stock, respectively; and directors were granted 50,210, 27,908, and 103,134 shares of restricted common stock, respectively.
F-35
The Company issued common stock options to employees under the Incentive Plan, with various vesting schedules ranging from immediately to four years. The fair value of each common stock option award is estimated on the grant date using either a Black-Scholes option pricing model for service-based awards or a trinomial lattice option pricing model for market-based awards. Expected volatilities were based on historical volatility of the Company’s common stock. The common stock option awards expire eight to ten years following the grant date and the expected lives are based on the simplified method as the Company does not have sufficient common stock option exercise experience to support a reasonable estimate of expected term. The risk-free rate is the yield available on U.S. Treasury zero-coupon issues with remaining maturities approximating the expected term at the grant date. There were no common stock option awards granted in the years ended December 31, 2015 and 2014. The following table provides assumptions used in determining the fair value of common stock option grants for the year ended December 31, 2013:
|
|
Year Ended December 31, |
|||
|
(Weighted averages) |
2013 |
|||
|
Expected volatility |
|
55.00 |
|
% |
|
Risk-free interest rate |
|
1.15 |
|
% |
|
Expected term (in years) |
|
5.60 |
|
|
|
Dividend yield |
|
— |
|
% |
|
Grant date fair value per share |
$ |
2.75 |
|
|
The following table presents activity of nonvested common stock options during the years ended December 31, 2015, 2014 and 2013:
|
|
Options |
|
|
Weighted Average Exercise Price Per Share |
|
||
|
Balance, December 31, 2012 |
|
872,373 |
|
|
$ |
5.41 |
|
|
Common stock options granted |
|
205,000 |
|
|
|
9.52 |
|
|
Common stock options vested |
|
(383,208 |
) |
|
|
5.47 |
|
|
Common stock options forfeited |
|
(20,332 |
) |
|
|
3.62 |
|
|
Balance, December 31, 2013 |
|
673,833 |
|
|
|
6.59 |
|
|
Common stock options vested |
|
(592,433 |
) |
|
|
6.29 |
|
|
Balance, December 31, 2014 |
|
81,400 |
|
|
|
7.62 |
|
|
Common stock options vested |
|
(31,400 |
) |
|
|
3.84 |
|
|
Common stock options forfeited |
|
(50,000 |
) |
|
|
10.00 |
|
|
Balance, December 31, 2015 |
|
— |
|
|
$ |
— |
|
The following table presents activity of exercisable common stock options during the years ended December 31, 2015, 2014 and 2013:
|
|
Options |
|
|
Weighted Average Exercise Price Per Share |
|
||
|
Balance, December 31, 2012 |
|
181,327 |
|
|
$ |
5.21 |
|
|
Common stock options exercised |
|
(20,668 |
) |
|
|
3.00 |
|
|
Common stock options vested |
|
383,208 |
|
|
|
5.47 |
|
|
Balance, December 31, 2013 |
|
543,867 |
|
|
|
5.76 |
|
|
Common stock options exercised |
|
(150,000 |
) |
|
|
5.72 |
|
|
Common stock options vested |
|
592,433 |
|
|
|
6.29 |
|
|
Balance, December 31, 2014 |
|
986,300 |
|
|
|
6.08 |
|
|
Common stock options exercised |
|
(242,050 |
) |
|
|
5.16 |
|
|
Common stock options vested |
|
31,400 |
|
|
|
3.84 |
|
|
Balance, December 31, 2015 |
|
775,650 |
|
|
$ |
6.28 |
|
F-36
The following table provides information pertaining to the intrinsic value of common stock options outstanding and exercisable as of December 31, 2015 and 2014:
|
|
December 31, |
|
|||||
|
(In millions) |
2015 |
|
|
2014 |
|
||
|
Intrinsic value of common stock options outstanding |
$ |
1.6 |
|
|
$ |
1.5 |
|
|
Intrinsic value of common stock options exercisable |
|
1.6 |
|
|
|
1.4 |
|
The following table provides information presents the intrinsic value of common stock options exercised and the fair value of common stock options that vested during the years ended December 31, 2015, 2014 and 2013:
|
|
Year Ended December 31, |
|
|||||||||
|
(In millions) |
2015 |
|
|
2014 |
|
|
2013 |
|
|||
|
Intrinsic value of common stock options exercised (1) |
$ |
0.6 |
|
|
$ |
0.4 |
|
|
$ |
0.1 |
|
|
Fair value of common stock options vested(2) |
|
0.1 |
|
|
|
1.2 |
|
|
|
0.8 |
|
|
|
(1) |
The intrinsic value of common stock options exercised is the difference between the fair value of the Company’s common stock on the exercise date and the exercise price. |
|
|
(2) |
The fair value of common stock options vested is based on the grant date fair value. |
Share-based compensation related to common stock option awards was $0.1 million, $0.6 million and $0.9 million for the years ended December 31, 2015, 2014 and 2013, respectively. As of December 31, 2015, there was no unamortized share-based expense related to common stock options, and the weighted average remaining contractual life for common stock options outstanding and exercisable as of December 31, 2015 was 5.4 years.
Performance Shares
The Company issues performance share awards as part of long-term incentive compensation to certain employees under the 2015 Plan. The fair value of each performance share award is estimated on the grant date using a Monte Carlo simulation. The awards have a three-year cliff vesting, and the percentage of the award that vests is based upon the market appreciation of the Company’s common stock. Upon vesting, the performance shares are issued in the form of unrestricted common stock. The following table provides assumptions used in determining the fair value of performance share awards granted during the year ended December 31, 2015:
|
|
Year Ended December 31, |
|||
|
(Weighted averages) |
2015 |
|||
|
Grant date fair value |
$ |
7.53 |
|
|
|
Grant date closing stock price |
$ |
11.05 |
|
|
|
Volatility |
|
48.90 |
|
% |
|
Risk-free rate |
|
0.84 |
|
% |
|
Dividend yield |
|
— |
|
% |
|
Probability of death or disability |
|
5.00 |
|
% |
The following table presents activity of outstanding performance share awards during the year ended December 31, 2015:
|
|
Performance Shares |
|
|
Grant Date Fair Value per Share |
|
||
|
Balance, December 31, 2014 |
|
— |
|
|
$ |
— |
|
|
Performance shares awarded |
|
260,000 |
|
|
|
7.53 |
|
|
Balance, December 31, 2015 |
|
260,000 |
|
|
$ |
7.53 |
|
Share-based compensation related to performance share awards was $0.4 million for the year ended December 31, 2015. As of December 31, 2015 and 2014, the aggregate unamortized value of share-based performance share awards was $1.6 million. The unamortized value of share-based performance awards will be recognized over a weighted average period of 2.0 years from December 31, 2015.
F-37
NOTE 17—EARNINGS (LOSS) PER SHARE
The Company computes earnings (loss) per share using the two-class method, as unvested restricted common stock contains nonforfeitable rights to dividends and meets the criteria of a participating security. Under the two-class method, earnings are allocated between common stock and participating securities. The presentation of basic and diluted earnings per share is required only for each class of common stock and not for participating securities. As such, the Company presents basic and diluted earnings per share for its one class of common stock.
The two-class method includes an earnings allocation formula that determines earnings per share for each class of common stock according to dividends declared and undistributed earnings for the period. The Company’s reported net earnings is reduced by the amount allocated to participating securities to arrive at the earnings allocated to common stockholders for purposes of calculating earnings per share.
Basic earnings per share is computed by dividing net earnings attributable to Real Industry, Inc. by the weighted average number of common shares outstanding for the reporting period. In connection with the Rights Offering, the Company distributed subscription rights to all of its existing stockholders as of January 28, 2015, and the subscription rights price represented a discount to the market value of the Company’s common stock upon the closing of the Rights Offering on February 27, 2015, with respect to the common stockholders. The discount in the Rights Offering with respect to common stockholders represented an implied stock dividend, for which the weighted average shares outstanding have been retroactively adjusted. Adjustments to the weighted average shares outstanding in all reporting periods prior to January 1, 2015 disclosed in this Annual Report reflect an 8.3% increase from originally reported weighted average shares outstanding, based on the fair value per share immediately preceding the closing of the Rights Offering, with respect to common stockholders, and the fair value of the common stock as of February 27, 2015. The computation of weighted average shares outstanding for the year ended December 31, 2015 includes an 8.3% adjustment related to the discount in the Rights Offering. Diluted earnings per share reflects the potential dilution that could occur if securities or other contracts to issue common stock were exercised or converted into common stock. For the calculation of diluted earnings per share, the basic weighted average number of common shares outstanding is increased by the dilutive effect of unvested restricted common stock awards, common stock options, unvested performance shares and the Warrants, determined using the treasury stock method.
The following table sets forth the computation of basic and diluted earnings (loss) per share for the years ended December 31, 2015, 2014 and 2013:
|
(In millions, except share |
Year Ended December 31, |
|
|||||||||
|
and per share amounts) |
2015 |
|
|
2014 |
|
|
2013 |
|
|||
|
Loss from continuing operations |
$ |
(31.7 |
) |
|
$ |
(0.1 |
) |
|
$ |
(14.2 |
) |
|
Earnings from discontinued operations, net of income taxes |
|
24.9 |
|
|
|
5.5 |
|
|
|
4.2 |
|
|
Net earnings (loss) |
|
(6.8 |
) |
|
|
5.4 |
|
|
|
(10.0 |
) |
|
Earnings (loss) from continuing operations attributable to noncontrolling interest |
|
0.1 |
|
|
|
(0.1 |
) |
|
|
— |
|
|
Net earnings (loss) attributable to Real Industry, Inc. |
|
(6.9 |
) |
|
|
5.5 |
|
|
|
(10.0 |
) |
|
Dividends and accretion on Redeemable Preferred Stock |
|
(2.3 |
) |
|
|
— |
|
|
|
— |
|
|
Numerator for basic and diluted earnings (loss) per share— Net earnings (loss) available to common stockholders |
$ |
(9.2 |
) |
|
$ |
5.5 |
|
|
$ |
(10.0 |
) |
|
Denominator for basic and diluted earnings (loss) per share— Weighted average shares outstanding |
|
26,657,832 |
|
|
|
13,403,083 |
|
|
|
12,836,071 |
|
|
Basic and diluted earnings (loss) per share: |
|
|
|
|
|
|
|
|
|
|
|
|
Continuing operations |
$ |
(1.28 |
) |
|
$ |
— |
|
|
$ |
(1.11 |
) |
|
Discontinued operations |
|
0.93 |
|
|
|
0.41 |
|
|
|
0.32 |
|
|
Basic and diluted earnings (loss) per share |
$ |
(0.35 |
) |
|
$ |
0.41 |
|
|
$ |
(0.79 |
) |
Unvested restricted common stock, common stock options, unvested performance shares and the Warrants are antidilutive and excluded from the computation of diluted earnings per share if the assumed proceeds upon exercise or vesting are greater than the cost to reacquire the same number of shares at the average market price during the period. For the years ended December 31, 2015, 2014 and 2013, the impact of all outstanding unvested shares of restricted common stock, common stock options, unvested performance shares and the Warrants are excluded from diluted earnings (loss) per share as their impact would be antidilutive.
F-38
The following table provides details on the average market price of Real Industry common stock and the weighted average number of outstanding shares of unvested restricted common stock, common stock options, unvested performance shares and Warrants that were potentially dilutive for each of the periods presented:
|
|
Year Ended December 31, |
|
|||||||||
|
|
2015 |
|
|
2014 |
|
|
2013 |
|
|||
|
Average market price of Real Industry common stock |
$ |
9.22 |
|
|
$ |
9.58 |
|
|
$ |
8.57 |
|
|
Potentially dilutive common stock equivalents: |
|
|
|
|
|
|
|
|
|
|
|
|
Unvested restricted common stock |
|
234,109 |
|
|
|
106,001 |
|
|
|
331,660 |
|
|
Common stock options |
|
710,555 |
|
|
|
1,041,673 |
|
|
|
1,033,484 |
|
|
Unvested performance shares |
|
152,438 |
|
|
|
— |
|
|
|
— |
|
|
Warrants |
|
1,485,941 |
|
|
|
1,500,000 |
|
|
|
1,500,000 |
|
|
Total potentially dilutive common stock equivalents |
|
2,583,043 |
|
|
|
2,647,674 |
|
|
|
2,865,144 |
|
The following table provides summary information about the potentially dilutive common stock equivalents:
|
|
Year Ended December 31, |
|
|||||||||
|
(In millions, except exercise prices) |
2015 |
|
|
2014 |
|
|
2013 |
|
|||
|
Average unamortized share-based compensation expense: |
|
|
|
|
|
|
|
|
|
|
|
|
Unvested restricted common stock awards |
$ |
1.3 |
|
|
$ |
0.6 |
|
|
$ |
0.7 |
|
|
Unvested common stock options |
|
— |
|
|
|
0.1 |
|
|
|
0.7 |
|
|
Unvested performance share awards |
|
1.0 |
|
|
|
— |
|
|
|
— |
|
|
Range of exercise prices on common stock options |
$ 3.00 - $ 10.00 |
|
|
$ 3.00 - $ 10.00 |
|
|
$ 3.00 - $ 10.00 |
|
|||
|
Weighted average exercise price of the Warrants |
$ |
5.73 |
|
|
$ |
6.66 |
|
|
$ |
6.68 |
|
NOTE 18—DERIVATIVE AND OTHER FINANCIAL INSTRUMENTS AND FAIR VALUE MEASUREMENTS
Derivatives
Real Alloy may use forward contracts and options, as well as contractual price escalators, to reduce the risks associated with its metal, natural gas and certain currency exposures. Generally, Real Alloy enters into master netting arrangements with counterparties and offsets net derivative positions with the same counterparties against amounts recognized for the right to reclaim cash collateral or the obligation to return cash collateral under those arrangements in the consolidated balance sheets. For classification purposes, Real Alloy records the net fair value of each type of derivative position expected to settle in less than one year (by counterparty) as a net current asset or liability and each type of long-term position as a net noncurrent asset or liability.
Metal hedging
As metal is purchased to fill fixed-price customer sales orders at RAEU, London Metal Exchange (“LME”) future swaps or forward contracts may be sold. As sales orders are priced, LME future or forward contracts may be purchased, which contracts generally settle within six months. Real Alloy can also buy put option contracts for managing metal price exposures. Option contracts require the payment of a premium, which is recorded as a realized loss upon settlement or expiration of the option contract. Upon settlement of put option contracts, Real Alloy receives cash and recognizes a related gain if the LME closing price is less than the strike price of the put option. If the put option strike price is less than the LME closing price, no amount is paid and the option expires. As of December 31, 2015, Real Alloy had 24.6 thousand metric tonnes of metal buy and sell derivative contracts.
Natural gas hedging
To manage the price exposure for natural gas purchases, Real Alloy may fix the future price of a portion of its natural gas requirements by entering into financial hedge agreements. Under these swap agreements, payments are made or received based on the differential between the monthly closing price on the New York Mercantile Exchange (“NYMEX”) and the contractual hedge price. Natural gas cost can also be managed through the use of cost escalators included in some long-term supply contracts with customers, which limits exposure to natural gas price risk. As of December 31, 2015, Real Alloy had 1.9 trillion of British thermal unit forward buy contracts.
Currency exchange hedging
From time to time, Real Alloy may enter into currency forwards, futures, call options and similar derivative financial instruments to limit its exposure to fluctuations in currency exchange rates. As of December 31, 2015, no currency derivative contracts were outstanding.
F-39
Real Alloy is exposed to losses in the event of nonperformance by the counterparties to the derivative financial instruments discussed above; however, management does not anticipate any nonperformance by the counterparties. The counterparties are evaluated for creditworthiness and risk assessment prior to initiating trading activities with the brokers and periodically throughout each year while actively trading. As of December 31, 2015, no cash collateral was posted or held.
The table below presents gross amounts of recognized assets and liabilities, the amounts offset in the consolidated balance sheets and the net amounts of assets and liabilities presented therein. As of December 31, 2015, there were no amounts subject to enforceable master netting arrangements or similar agreements that have not been offset in the consolidated balance sheets.
|
|
Fair Value of Derivatives |
|
|||||
|
|
as of December 31, 2015 |
|
|||||
|
(In millions) |
Asset |
|
|
Liability |
|
||
|
Metal |
$ |
0.2 |
|
|
$ |
(0.3 |
) |
|
Natural gas |
|
— |
|
|
|
(0.6 |
) |
|
Total |
|
0.2 |
|
|
|
(0.9 |
) |
|
Effect of counterparty netting arrangements |
|
(0.2 |
) |
|
|
0.2 |
|
|
Net derivatives as classified in the consolidated balance sheets |
$ |
— |
|
|
$ |
(0.7 |
) |
The following table presents details of the fair value of Real Alloy’s derivative financial instruments as of December 31, 2015, as recorded in the consolidated balance sheets:
|
|
|
|
December 31, |
|
|
|
(In millions) |
Balance Sheet Location |
|
2015 |
|
|
|
Derivative liabilities |
|
|
|
|
|
|
Metal |
Accrued liabilities |
|
$ |
0.1 |
|
|
Natural gas |
Accrued liabilities |
|
|
0.6 |
|
|
Total |
|
|
$ |
0.7 |
|
Common stock warrant liability
Common stock warrant liability is considered a derivative liability as a result of the anti-dilution and pricing protection provisions of the Warrants. The fair value of the common stock warrant liability is based on a Monte Carlo simulation that utilizes various assumptions, including estimated volatility of 49.9% and an expected term of 4.4 years as of December 31, 2015, along with a 60% equity raise probability at a 15% discount to the 10-Day volume weighted average price (“VWAP”) assumption in the periods following December 31, 2015, and 52.0% volatility and an expected term of 5.8 years as of December 31, 2014, along with a 25% equity raise probability at a 15% discount to the 10-Day VWAP assumption in the periods following December 31, 2014. Significant decreases in the expected term or the equity raise probability and related assumptions would result in a decrease in the estimated fair value of the common stock warrant liability, while significant increases in the expected term or the equity raise probability and related assumptions would result in an increase in the estimated fair value of the common stock warrant liability. However, the most significant input in determining the fair value of the common stock warrant liability is the price of our common stock on the measurement date. A 10% increase or decrease in any or all of the unobservable inputs would not have a material impact on the estimated fair value of the common stock warrant liability.
Fair values
Derivative contracts are recorded at fair value using quoted market prices and significant other observable inputs. Fair value is defined as the price that would be received to sell an asset or paid to transfer a liability in an orderly transaction between market participants at the measurement date. The fair value hierarchy distinguishes between (1) market participant assumptions developed based on market data obtained from independent sources (observable inputs) and (2) an entity’s own assumptions about market participant assumptions developed based on the best information available in the circumstances (unobservable inputs). The fair value hierarchy consists of three broad levels, which gives the highest priority to unadjusted quoted prices in active markets for identical assets or liabilities (Level 1) and the lowest priority to unobservable inputs (Level 3). The three levels of the fair value hierarchy are described below:
Level 1—Unadjusted quoted prices in active markets that are accessible at the measurement date for identical, unrestricted assets or liabilities.
F-40
Level 2—Inputs other than quoted prices included within Level 1 that are observable for the asset or liability, either directly or indirectly, including quoted prices for similar assets or liabilities in active markets; quoted prices for identical or similar assets or liabilities in markets that are not active; inputs other than quoted prices that are observable for the asset or liability (e.g., interest rates); and inputs that are derived principally from or corroborated by observable market data by correlation or other means.
Level 3—Inputs that are both significant to the fair value measurement and unobservable.
We endeavor to utilize the best available information in measuring fair value. Where appropriate, valuations are adjusted for various factors such as liquidity, bid/offer spreads, and credit considerations. Such adjustments are generally based on available market evidence and unobservable inputs. Financial assets and liabilities are classified in their entirety based on the lowest level of input that is significant to the fair value measurement. The following tables set forth financial assets and liabilities and their level in the fair value hierarchy that are accounted for at fair value on a recurring basis as of December 31, 2015 and 2014:
|
|
|
|
Estimated Fair Value |
|
|||||
|
|
Fair Value |
|
December 31, |
|
|||||
|
(In millions) |
Hierarchy |
|
2015 |
|
|
2014 |
|
||
|
Derivative assets |
Level 2 |
|
$ |
0.2 |
|
|
$ |
— |
|
|
Derivative liabilities |
Level 2 |
|
|
(0.9 |
) |
|
|
— |
|
|
Net derivative liabilities |
|
|
$ |
(0.7 |
) |
|
$ |
— |
|
|
Common stock warrant liability |
Level 3 |
|
$ |
(6.9 |
) |
|
$ |
(5.6 |
) |
The common stock warrant liability is the only asset or liability measured at fair value on a recurring basis using significant unobservable inputs (Level 3) as of December 31, 2015 and 2014. Please see Note 10—Common Stock Warrant Liability for a reconciliation from the beginning to the ending balance of the common stock warrant liability for the years ended December 31, 2015, 2014 and 2013.
Both realized and unrealized gains and losses on derivative financial instruments are included within losses on derivative financial instruments in the consolidated statements of operations. The following table presents realized losses on derivative financial instruments during the year ended December 31, 2015:
|
|
Year Ended December 31, |
|
|
|
(In millions) |
|
2015 |
|
|
Metal |
$ |
2.9 |
|
|
Natural gas |
|
0.5 |
|
|
Total |
$ |
3.4 |
|
Other Financial Instruments
The following tables present the carrying values and fair value estimates of other financial instruments as of December 31, 2015 and 2014:
|
|
|
|
December 31, 2015 |
|
|||||
|
(In millions) |
Fair Value Hierarchy |
|
Carrying Amount |
|
|
Estimated Fair Value |
|
||
|
Assets |
|
|
|
|
|
|
|
|
|
|
Cash and cash equivalents |
Level 1 |
|
$ |
35.7 |
|
|
$ |
35.7 |
|
|
Financing receivable |
Level 2 |
|
|
32.7 |
|
|
|
32.7 |
|
|
Restricted cash held in escrow (other current assets) |
Level 1 |
|
|
3.9 |
|
|
|
3.9 |
|
|
Loans receivable, net (other assets) |
Level 3 |
|
|
1.1 |
|
|
|
1.1 |
|
|
Liabilities |
|
|
|
|
|
|
|
|
|
|
Long-term debt: |
|
|
|
|
|
|
|
|
|
|
Senior Secured Notes |
Level 1 |
|
$ |
290.7 |
|
|
$ |
310.9 |
|
|
Asset-Based Facility |
Level 2 |
|
|
19.6 |
|
|
|
22.0 |
|
|
Redeemable Preferred Stock |
Level 3 |
|
$ |
21.9 |
|
|
$ |
18.7 |
|
F-41
|
|
|
|
December 31, 2014 |
|
|||||
|
(In millions) |
Fair Value Hierarchy |
|
Carrying Amount |
|
|
Estimated Fair Value |
|
||
|
Assets |
|
|
|
|
|
|
|
|
|
|
Continuing operations: |
|
|
|
|
|
|
|
|
|
|
Cash and cash equivalents |
Level 1 |
|
$ |
61.9 |
|
|
$ |
61.9 |
|
|
Loans receivable, net (other noncurrent assets) |
Level 3 |
|
|
1.2 |
|
|
|
1.2 |
|
|
Discontinued operations: |
|
|
|
|
|
|
|
|
|
|
Cash and cash equivalents |
Level 1 |
|
|
1.0 |
|
|
|
1.0 |
|
|
Liabilities |
|
|
|
|
|
|
|
|
|
|
Discontinued operations: |
|
|
|
|
|
|
|
|
|
|
Line of credit |
Level 3 |
|
$ |
1.0 |
|
|
$ |
1.0 |
|
|
Long-term debt |
Level 3 |
|
|
13.6 |
|
|
|
13.6 |
|
The Company used the following methods and assumptions to estimate the fair value of each financial instrument as of December 31, 2015 and 2014:
Cash and cash equivalents and restricted cash held in escrow
Cash and cash equivalents and restricted cash held in escrow are recorded at historical cost. The carrying value is a reasonable estimate of fair value as these instruments have short-term maturities and market interest rates.
Financing receivable
Financing receivable represents the net amount due from the sale and transfer of trade accounts receivable under the Factoring Facility. The carrying value is a reasonable estimate of fair value as the financing receivable is generally outstanding for no more than thirty days and the counterparty is a large creditworthy financial institution.
Loans receivable, net
Loans receivable, net, consists of commercial real estate loans. The estimated fair value considers the collateral coverage of assets securing the loans and estimated credit losses, as well as variable interest rates, which approximate market interest rates.
Long-term debt – Senior Secured Notes
The estimated fair value of the Senior Secured Notes as of December 31, 2015 is based on observable market prices.
Long-term debt – Asset-Based Facility
The estimated fair value of the Asset-Based Facility as of December 31, 2015 is based on market characteristics, including interest rates and maturity dates generally consistent with market terms.
Redeemable Preferred Stock
The carrying value of Redeemable Preferred Stock is based on the estimated fair value of the instrument at issuance, calculated using a discounted cash flow analysis using the Hull & White model, with an original term of sixty-six months, assuming either the holder will put or the issuer will call at the redemption date. The cash dividend yield and the Redeemable Preferred Stock, including the payment-in-kind Redeemable Preferred Stock, were discounted at the spot rate plus a 17.5% credit spread adjustment to a zero coupon yield curve, which is being accreted to redemption value over the period preceding the holder’s right to mandatorily redeem the instrument, or sixty-six months from issuance, using the effective interest method. An increase in the discount rate would result in a decrease in the estimated fair value of the Redeemable Preferred Stock, while a decrease in the discount rate would result in an increase in the estimated fair value of the Redeemable Preferred Stock. There have been no significant changes in the fair value of the Redeemable Preferred Stock subsequent to issuance.
Line of credit – discontinued operations
The line of credit was a short-term borrowing facility, used primarily to support ongoing operations of NABCO. The carrying value was a reasonable estimate of fair value, as this instrument had a short-term maturity and a market interest rate.
F-42
Long-term debt – discontinued operations
NABCO’s long-term debt included term loans, the fair value of which was based on the market characteristics of the individual loan terms, including interest rates, scheduled principal amortization and maturity dates, generally consistent with market terms.
The Company’s Level 3 assets and liabilities are determined using valuation techniques that incorporate unobservable inputs that require significant judgment or estimation. The following tables present quantitative information about the valuation techniques and unobservable inputs applied to Level 3 fair value measurements as of December 31, 2015 and 2014:
|
|
December 31, 2015 |
|
|||||||||
|
(In millions) |
Estimated Fair Value |
|
|
Valuation Technique |
|
Unobservable Input |
|
Input Value |
|
||
|
Common stock warrant liability |
$ |
6.9 |
|
|
Monte Carlo Simulation |
|
Volatility |
|
|
49.9 |
% |
|
|
|
|
|
|
|
|
Expected term |
|
4.4 years |
|
|
|
|
|
|
|
|
|
|
Equity raise probability |
|
|
60 |
% |
|
|
|
|
|
|
|
|
Issue price discount to fair value |
|
|
15 |
% |
|
Redeemable Preferred Stock |
$ |
18.7 |
|
|
Discounted cash flow |
|
Credit spread |
|
|
17.5 |
% |
|
|
|
|
|
|
|
|
Redemption period |
|
56 months |
|
|
|
|
December 31, 2014 |
|
|||||||||
|
(In millions) |
Estimated Fair Value |
|
|
Valuation Technique |
|
Unobservable Input |
|
Input Value |
|
||
|
Common stock warrant liability |
$ |
5.6 |
|
|
Monte Carlo Simulation |
|
Volatility |
|
|
52.0 |
% |
|
|
|
|
|
|
|
|
Expected term |
|
5.8 years |
|
|
|
|
|
|
|
|
|
|
Equity raise probability |
|
|
25 |
% |
|
|
|
|
|
|
|
|
Issue price discount to fair value |
|
|
15 |
% |
Significant unobservable inputs used in the fair value measurement of the common stock warrant liability include volatility, expected term, the probability of an equity raise, and the offering price discount to fair value, presuming the equity raise is a rights offering. The December 31, 2015 and 2014 estimated fair values were determined using a Monte Carlo simulation. Significant decreases in volatility, expected term or the equity raise probability would result in a decrease in the estimated fair value of the common stock warrant liability, while significant increases in volatility, expected term or the equity raise probability would result in an increase in the estimated fair value of the common stock warrant liability. The primary driver in the estimated fair value of the common stock warrant liability is the measurement date common stock price.
Significant unobservable inputs used in the fair value measurement of the Redeemable Preferred Stock include the estimated credit spread and redemption period. The Company used these unobservable inputs in a discounted cash flow model to estimate the fair value as of December 31, 2015. Decreases in the redemption period and credit spread would result in an increase in the estimated fair value of the Redeemable Preferred Stock, while increases in the redemption period and credit spread would result in a decrease in the estimated fair value of the Redeemable Preferred Stock.
NOTE 19—SEGMENT AND GEOGRAPHIC INFORMATION
Segment information is prepared on the same basis that our chief operating decision-maker (“CODM”), who is our chief executive officer, manages the segments, evaluates financial results, and makes key operating decisions, and for which discrete financial information is available. As of December 31, 2015, the Company had two reportable segments; RANA and RAEU, each of which is also an operating segment.
F-43
Measurement of segment income or loss and segment assets and liabilities
The accounting policies of the reportable segments are the same as those described in Note 2—Financial Statement Presentation and Significant Accounting Policies. Our measure of profitability for our reportable segments is earnings before interest, taxes, depreciation and amortization and excludes certain other items (“Adjusted EBITDA”). Certain of the Company’s assets and liabilities have not been allocated to our reportable segments, including corporate cash, the common stock warrant liability, deferred income taxes, and long-term debt, none of which our CODM uses to evaluate the performance of our reportable segments. Additionally, certain of the Company’s corporate administrative expenses are not allocated to the reportable segments.
Reportable segment information
The following tables show segment revenues and Adjusted EBITDA for the year ended December 31, 2015 and a reconciliation of Adjusted EBITDA to operating profit. For the years ended December 31, 2014 and 2013, there were no reportable segments.
|
|
Year Ended December 31, 2015 |
|
|||||||||
|
(In millions) |
RANA |
|
|
RAEU |
|
|
Total |
|
|||
|
Revenues |
$ |
711.4 |
|
|
$ |
434.2 |
|
|
$ |
1,145.6 |
|
|
Adjusted EBITDA |
$ |
49.0 |
|
|
$ |
21.3 |
|
|
$ |
70.3 |
|
|
(In millions) |
Year Ended December 31, 2015 |
|
|
|
Adjusted EBITDA |
$ |
70.3 |
|
|
Unrealized losses on derivative financial instruments |
|
0.8 |
|
|
Depreciation and amortization |
|
32.5 |
|
|
Amortization of purchase accounting adjustments |
|
9.2 |
|
|
Corporate and Other: |
|
|
|
|
Operating loss—excludes share-based compensation expense |
|
12.6 |
|
|
Share-based compensation expense |
|
1.3 |
|
|
Other |
|
3.7 |
|
|
Operating profit |
$ |
10.2 |
|
F-44
The following tables present summarized balance sheet information for each of our reportable segments and a reconciliation to consolidated assets and liabilities as of December 31, 2015:
|
(In millions) |
RANA |
|
|
RAEU |
|
||
|
Segment Assets |
|
|
|
|
|
|
|
|
Current assets: |
|
|
|
|
|
|
|
|
Cash and cash equivalents |
$ |
8.1 |
|
|
$ |
7.2 |
|
|
Trade accounts receivable, net |
|
63.7 |
|
|
|
13.5 |
|
|
Financing receivable |
|
— |
|
|
|
32.7 |
|
|
Inventories |
|
61.7 |
|
|
|
38.5 |
|
|
Prepaid expenses, supplies, and other current assets |
|
12.5 |
|
|
|
6.8 |
|
|
Total current assets |
|
146.0 |
|
|
|
98.7 |
|
|
Property, plant and equipment, net |
|
199.3 |
|
|
|
102.2 |
|
|
Intangible assets, net |
|
15.0 |
|
|
|
— |
|
|
Goodwill |
|
95.4 |
|
|
|
8.9 |
|
|
Other noncurrent assets |
|
4.9 |
|
|
|
1.9 |
|
|
Total segment assets |
$ |
460.6 |
|
|
$ |
211.7 |
|
|
Segment Liabilities |
|
|
|
|
|
|
|
|
Current liabilities: |
|
|
|
|
|
|
|
|
Trade payables |
$ |
58.1 |
|
|
$ |
42.3 |
|
|
Accrued liabilities |
|
34.3 |
|
|
|
14.6 |
|
|
Total current liabilities |
|
92.4 |
|
|
|
56.9 |
|
|
Accrued pension benefits |
|
— |
|
|
|
38.0 |
|
|
Environmental liabilities |
|
11.7 |
|
|
|
— |
|
|
Other noncurrent liabilities |
|
4.1 |
|
|
|
1.4 |
|
|
Total segment liabilities |
$ |
108.2 |
|
|
$ |
96.3 |
|
|
(In millions) |
|
|
|
|
Assets: |
|
|
|
|
Real Alloy North America |
$ |
460.6 |
|
|
Real Alloy Europe |
|
211.7 |
|
|
Unallocated |
|
28.6 |
|
|
Total consolidated assets |
$ |
700.9 |
|
|
Liabilities: |
|
|
|
|
Real Alloy North America |
$ |
108.2 |
|
|
Real Alloy Europe |
|
96.3 |
|
|
Unallocated |
|
332.1 |
|
|
Total consolidated liabilities |
$ |
536.6 |
|
Geographic Information
The following tables provide information about our consolidated revenues for the year ended December 31, 2015, and consolidated long-lived tangible assets, net of accumulated depreciation, as of December 31, 2015:
|
Revenues |
|
|
|
|
|
Year Ended December 31, |
|
|
|
(In millions) |
2015 |
|
|
|
United States |
$ |
545.2 |
|
|
International: |
|
|
|
|
Europe |
|
434.2 |
|
|
Canada and Mexico |
|
166.2 |
|
|
Total international |
|
600.4 |
|
|
Total revenues |
$ |
1,145.6 |
|
F-45
|
|
|
|
|
|
|
December 31, |
|
|
|
(In millions) |
2015 |
|
|
|
United States |
$ |
167.9 |
|
|
International: |
|
|
|
|
Europe |
|
102.2 |
|
|
Canada and Mexico |
|
31.4 |
|
|
Total international |
|
133.6 |
|
|
Total long-lived tangible assets |
$ |
301.5 |
|
Capital expenditures in RANA and RAEU for the year ended December 31, 2015 were $19.4 million and $6.6 million, respectively.
NOTE 20—DISCONTINUED OPERATIONS
The following table presents the assets and liabilities, as of December 31, 2015 and 2014, of the components of the Company designated as discontinued operations as of December 31, 2015:
|
|
December 31, |
|
|||||
|
(In millions) |
2015 |
|
|
2014 |
|
||
|
Current assets: |
|
|
|
|
|
|
|
|
Cash and cash equivalents |
$ |
0.1 |
|
|
$ |
1.0 |
|
|
Trade accounts receivable, net |
|
— |
|
|
|
4.5 |
|
|
Inventories |
|
— |
|
|
|
11.4 |
|
|
Prepaid expenses, supplies, and other current assets |
|
0.2 |
|
|
|
1.2 |
|
|
Total current assets of discontinued operations |
$ |
0.3 |
|
|
$ |
18.1 |
|
|
Noncurrent assets: |
|
|
|
|
|
|
|
|
Property, plant and equipment, net |
$ |
— |
|
|
$ |
0.3 |
|
|
Intangible assets, net |
|
— |
|
|
|
1.6 |
|
|
Goodwill |
|
— |
|
|
|
17.8 |
|
|
Other noncurrent assets |
|
— |
|
|
|
0.3 |
|
|
Total noncurrent assets of discontinued operations |
$ |
— |
|
|
$ |
20.0 |
|
|
Current liabilities: |
|
|
|
|
|
|
|
|
Trade payables |
$ |
— |
|
|
$ |
2.9 |
|
|
Accrued liabilities |
|
0.1 |
|
|
|
0.3 |
|
|
Line of credit |
|
— |
|
|
|
1.0 |
|
|
Long-term debt due within one year |
|
— |
|
|
|
3.9 |
|
|
Total current liabilities of discontinued operations |
$ |
0.1 |
|
|
$ |
8.1 |
|
|
Noncurrent liabilities: |
|
|
|
|
|
|
|
|
Long-term debt |
$ |
— |
|
|
$ |
9.7 |
|
|
Repurchase reserve |
|
0.7 |
|
|
|
5.5 |
|
|
Total noncurrent liabilities of discontinued operations |
$ |
0.7 |
|
|
$ |
15.2 |
|
On January 9, 2015, we sold all of our interests in NABCO (previously reported as the Industrial Supply segment) for $77.9 million, including a final working capital adjustment of $0.1 million. As a result of the sale, the gain on sale of NABCO, along with the assets, liabilities and results of operations of NABCO are included in discontinued operations for all periods presented.
Repurchase reserve
Through the first quarter of 2015, SGGH maintained a repurchase reserve that represented estimated losses from repurchase claims, both known and unknown, based on claimed breaches of certain representations and warranties provided by FIL to counterparties that purchased residential real estate loans, predominantly from 2002 through 2007. Management estimated the likely range of the loan repurchase liability based on a number of factors, including, but not limited to, the timing of such claims relative to the loan origination date, the quality of the documentation supporting such claims, the number and involvement of cross-defendants, if any, related to such claims, and a time and expense estimate if a claim were to result in litigation. The estimate was based on then-currently available information and was subject to known and unknown uncertainties using multiple assumptions requiring significant judgment.
F-46
In June 2015, the New York State Court of Appeals affirmed the decision of the New York State Supreme Court, Appellate Division in ACE Securities Corp v. DB Structured Products, Inc. (the “ACE Securities Case”), whereby the New York state six-year statute of limitations on loan repurchase demands begins to run as of the closing date on which the representations were made, which, in the ACE Securities Case, was the date of the mortgage loan purchase agreements. Based on the final decision in the ACE Securities Case, management has reassessed its exposure to losses from repurchase demands and believes a repurchase reserve of $0.7 million is adequate as of December 31, 2015.
The Company did not settle or receive any repurchase claims during the years ended December 31, 2015 and 2014. The repurchase reserve liability was $0.7 million and $5.5 million as of December 31, 2015 and 2014, respectively. As a result of the decision in the ACE Securities Case, we reassessed the estimates for losses associated with repurchase claims and, consequently, reduced the allowance for repurchase reserves by $4.3 million in the quarter ended June 30, 2015. During the years ended December 31, 2015, 2014 and 2013, the repurchase reserve was reduced by $4.8 million, $1.0 million and $1.0 million, respectively. As a result of the change in estimate as a result of the ACE Securities Case, the reduction in the repurchase reserve in excess of our previous estimate increased earnings from discontinued operations, net of income tax by $2.1 million or $0.08 per share for the year ended December 31, 2015.
The following table presents the operating results, for the years ended December 31, 2015, 2014 and 2013, for the components of the Company designated as discontinued operations as of December 31, 2015:
|
|
Year Ended December 31, |
|
|||||||||
|
(In millions) |
|
2015 |
|
|
|
2014 |
|
|
|
2013 |
|
|
Revenues |
$ |
0.7 |
|
|
$ |
39.8 |
|
|
$ |
37.8 |
|
|
Cost of sales |
|
0.4 |
|
|
|
25.3 |
|
|
|
23.4 |
|
|
Gross profit |
|
0.3 |
|
|
|
14.5 |
|
|
|
14.4 |
|
|
Selling, general and administrative expenses |
|
0.5 |
|
|
|
6.5 |
|
|
|
6.9 |
|
|
Amortization of intangibles |
|
— |
|
|
|
1.1 |
|
|
|
1.6 |
|
|
Operating profit (loss) |
|
(0.2 |
) |
|
|
6.9 |
|
|
|
5.9 |
|
|
Nonoperating income |
|
44.7 |
|
|
|
2.3 |
|
|
|
0.8 |
|
|
Earnings before income taxes |
|
44.5 |
|
|
|
9.2 |
|
|
|
6.7 |
|
|
Income tax expense |
|
19.6 |
|
|
|
3.7 |
|
|
|
2.5 |
|
|
Earnings from discontinued operations, net of income taxes |
$ |
24.9 |
|
|
$ |
5.5 |
|
|
$ |
4.2 |
|
The nonoperating income for the year ended December 31, 2015 is primarily related to the $39.7 million gain on sale of NABCO and the $4.8 million reduction of the repurchase reserve.
NOTE 21—SUPPLEMENTAL CASH FLOW INFORMATION
The following table provides supplemental cash flow information for the years ended December 31, 2015, 2014 and 2013:
|
|
Year Ended December 31, |
|
|||||||||
|
(In millions) |
|
2015 |
|
|
2014 |
|
|
|
2013 |
|
|
|
Cash paid for interest: |
|
|
|
|
|
|
|
|
|
|
|
|
Continuing operations |
$ |
16.7 |
|
|
$ |
— |
|
|
3..4 |
|
|
|
Discontinued operations |
|
— |
|
|
|
0.8 |
|
|
|
0.5 |
|
|
Cash paid for income taxes: |
|
|
|
|
|
|
|
|
|
|
|
|
Continuing operations |
$ |
4.3 |
|
|
$ |
0.5 |
|
|
$ |
0.4 |
|
|
Discontinued operations |
|
— |
|
|
|
0.1 |
|
|
|
0.2 |
|
NOTE 22—UNAUDITED QUARTERLY FINANCIAL INFORMATION
The following tables present unaudited quarterly financial information, which has been prepared on a basis consistent with that of the audited consolidated financial statements and includes all necessary material adjustments, consisting of normal recurring accruals and adjustments, to present fairly the unaudited quarterly financial information. The quarterly financial results of operations for these periods are not necessarily indicative of future financial results of operations. The quarterly per share calculations are based on the weighted average number of shares for each period; therefore, the sum of the quarters may not necessarily be equal to the full year per share amounts.
F-47
|
|
Unaudited 2015 Information for the Three Months Ended |
|
|||||||||||||
|
(In millions, except per share amounts) |
March 31, |
|
|
June 30, |
|
|
September 30, |
|
|
December 31, |
|
||||
|
Revenues |
$ |
137.8 |
|
|
$ |
368.7 |
|
|
$ |
338.6 |
|
|
$ |
300.5 |
|
|
Cost of sales |
|
133.0 |
|
|
|
347.4 |
|
|
|
313.2 |
|
|
|
277.1 |
|
|
Gross profit |
|
4.8 |
|
|
|
21.3 |
|
|
|
25.4 |
|
|
|
23.4 |
|
|
Operating costs |
|
7.6 |
|
|
|
18.5 |
|
|
|
18.0 |
|
|
|
20.6 |
|
|
Operating profit (loss) |
|
(2.8 |
) |
|
|
2.8 |
|
|
|
7.4 |
|
|
|
2.8 |
|
|
Net earnings (loss) attributable to Real Industry, Inc. |
|
6.7 |
|
|
|
(10.9 |
) |
|
|
1.2 |
|
|
|
(3.9 |
) |
|
Earnings per share - basic |
$ |
0.30 |
|
|
$ |
(0.42 |
) |
|
$ |
0.02 |
|
|
$ |
(0.16 |
) |
|
Earnings per share - diluted |
|
0.30 |
|
|
|
(0.42 |
) |
|
|
0.02 |
|
|
|
(0.16 |
) |
During the three months ended March 31, 2015, we sold NABCO (January 9, 2015) and acquired Real Alloy (February 27, 2015). NABCO is presented in discontinued operations for all periods presented. We recognized a $39.7 million pretax gain on the sale of NABCO. In the three months ended June 30, 2015, we revised the estimated exposure to SGGH’s repurchase reserve, within discontinued operations, and recognized a $4.3 million recovery of the repurchase reserve.
|
|
Unaudited 2014 Information for the Three Months Ended |
|
|||||||||||||
|
(In millions, except per share amounts) |
March 31, |
|
|
June 30, |
|
|
September 30, |
|
|
December 31, |
|
||||
|
Revenues |
$ |
0.1 |
|
|
$ |
— |
|
|
$ |
— |
|
|
$ |
2.0 |
|
|
Cost of sales |
|
— |
|
|
|
— |
|
|
|
— |
|
|
|
— |
|
|
Gross profit |
|
0.1 |
|
|
|
— |
|
|
|
— |
|
|
|
2.0 |
|
|
Operating costs |
|
2.6 |
|
|
|
0.2 |
|
|
|
3.8 |
|
|
|
3.9 |
|
|
Operating profit (loss) |
|
(2.5 |
) |
|
|
(0.2 |
) |
|
|
(3.8 |
) |
|
|
(1.9 |
) |
|
Net earnings (loss) attributable to Real Industry, Inc. |
|
0.1 |
|
|
|
(0.5 |
) |
|
|
0.8 |
|
|
|
5.1 |
|
|
Earnings per share - basic |
$ |
0.01 |
|
|
$ |
(0.04 |
) |
|
$ |
0.06 |
|
|
$ |
0.41 |
|
|
Earnings per share - diluted |
|
0.01 |
|
|
|
(0.04 |
) |
|
|
0.06 |
|
|
|
0.41 |
|
NOTE 23—COMMITMENTS AND CONTINGENCIES
Environmental Matters
Real Alloy’s operations are subject to environmental laws and regulations governing air emissions, wastewater discharges, the handling, disposal and remediation of hazardous substances and wastes, and employee health and safety. These laws can impose joint and several liabilities for releases or threatened releases of hazardous substances upon statutorily defined parties, including us, regardless of fault or the lawfulness of the original activity or disposal. Given the changing nature of environmental legal requirements, we may be required, from time to time, to take environmental control measures at some of our facilities to meet future requirements. Real Alloy is under regulatory consent orders or directives to install environmental control measures by agencies in two states.
The following table provides a summary of changes in accrued environmental liabilities for the year ended December 31, 2015:
|
|
Year Ended December 31, |
|
|
|
(In millions) |
2015 |
|
|
|
Balance, December 31, 2014 |
$ |
— |
|
|
Environmental liabilities assumed in business combination |
|
15.3 |
|
|
Revisions and liabilities incurred |
|
1.0 |
|
|
Translation and other charges |
|
(0.3 |
) |
|
Balance, December 31, 2015 |
|
16.0 |
|
|
Less amount classified as accrued liabilities |
|
(4.3 |
) |
|
Environmental liabilities |
$ |
11.7 |
|
These amounts are in addition to asset retirement obligations discussed in Note 11—Asset Retirement Obligations, and represent the most probable costs of remedial actions. Management estimates that costs related to identified remedial actions will be paid out, primarily, over the next ten years.
F-48
The Company leases various types of property and equipment, primarily office space and equipment used in manufacturing and office equipment. Rent expense during the years ended December 31, 2015, 2014 and 2013 was $3.1 million, $0.2 million and $0.2 million, respectively. The following table provides a summary of future minimum lease payments required under operating leases that have initial or remaining noncancellable terms in excess of one year, which may also contain renewal options, and scheduled capital lease payments as of December 31, 2015:
|
|
Future Minimum Lease Payments |
|
|||||
|
(In millions) |
Operating Leases |
|
|
Capital Leases |
|
||
|
2016 |
$ |
2.8 |
|
|
$ |
2.4 |
|
|
2017 |
|
1.3 |
|
|
|
1.2 |
|
|
2018 |
|
0.6 |
|
|
|
0.5 |
|
|
2019 |
|
0.5 |
|
|
|
0.1 |
|
|
2020 |
|
0.5 |
|
|
|
— |
|
|
Thereafter |
|
2.3 |
|
|
|
— |
|
|
|
$ |
8.0 |
|
|
$ |
4.2 |
|
Capital lease obligations are classified as long-term debt in the consolidated balance sheets. See Note 9—Debt and Redeemable Preferred Stock for additional information about capital leases.
Purchase Obligations
The Company’s noncancellable purchase obligations are principally for the purchase of natural gas and services related to waste disposal. The purchase obligations are long-term arrangements to purchase services that are enforceable and legally binding on the Company and specify all significant terms and conditions, including fixed or minimum services to be purchased: fixed, minimum or variable price provisions; and the approximate timing of the transactions. As a result of the variability in pricing the purchase obligations, actual amounts paid may vary from the amounts shown in the following table, which present amounts due under long-term noncancellable purchase obligations.
|
|
Year Ending December 31, |
|
|||||||||||||||||
|
(In millions) |
2016 |
|
|
2017 |
|
|
2018 |
|
|
2019 |
|
|
Total |
|
|||||
|
Purchase obligations |
$ |
1.9 |
|
|
$ |
1.6 |
|
|
$ |
0.5 |
|
|
$ |
0.5 |
|
|
$ |
4.5 |
|
Amounts purchased under long-term purchase obligations during the year ended December 31, 2015 approximated amounts projected for 2016.
Employees
As of December 31, 2015, approximately 21% of our U.S. employees and substantially all of our non-U.S. employees are covered under collective bargaining agreements.
Legal Proceedings
Real Industry, Real Alloy and SGGH have been named as a defendant in or as a party to a number of legal actions or proceedings that arose in the ordinary course of business. In some of these actions and proceedings, claims for monetary damages are asserted. In view of the inherent difficulty of predicting the outcome of such legal actions and proceedings, management generally cannot predict what the eventual outcome of the pending matters will be, what the timing of the ultimate resolution of these matters will be, or what the eventual loss related to each pending matter may be, if any.
In accordance with applicable accounting guidance, management establishes an accrued liability for litigation when those matters present loss contingencies that are both probable and reasonably estimable. In such cases, there may be an exposure to loss in excess of any amounts accrued. The estimated loss is based upon currently available information and is subject to significant judgment, a variety of assumptions, and known and unknown uncertainties. The matters underlying the estimated loss may change from time to time, and actual results may vary significantly from the current estimate. Therefore, an estimate of loss represents what management believes to be an estimate of loss only for certain matters meeting these criteria. It does not represent the Company’s maximum loss exposure.
F-49
Based on management’s current understanding of these pending legal actions and proceedings, it does not believe that judgments or settlements arising from pending or threatened legal matters, individually or in the aggregate, would have a material adverse effect on the consolidated financial position, results of operations or cash flows of the Company. However, in light of the inherent uncertainties involved in these matters, some of which are beyond the Company’s control, and the very large or indeterminate damages sought in some of these matters, an adverse outcome in one or more of these matters could be material to the Company’s results of operations or cash flows for any particular reporting period.
The legal proceedings summarized below include material matters that were resolved or concluded since December 31, 2014, as well as ongoing matters that may have an adverse effect on our business and future financial results.
SGGH Matters
Colburn Matter. Gwyneth Colburn, the former Executive Vice President of Fremont’s Commercial Real Estate group, filed both a lawsuit and a bankruptcy proof of claim seeking in excess of $2.5 million under a contract known as a management continuity agreement (“MCA”). The Company prevailed on Ms. Colburn’s lawsuit and the bankruptcy court disallowed her proof of claim. With appeals from those rulings pending, in October 2015, SGGH and Ms. Colburn entered into a settlement and release agreement whereby Ms. Colburn dismissed her claims and all pending appeals in exchange for a waiver of SGGH’s rights to recover costs. As of December 31, 2015, this matter is now concluded with SGGH prevailing in full.
Walker Matter. Kyle Walker, the former Chief Executive Officer and President of FIL, filed both a lawsuit and a bankruptcy proof of claim seeking in excess of $3.5 million under an MCA. The Company prevailed on Mr. Walker’s lawsuit and the bankruptcy court disallowed his proof of claim. With an appeal from the disallowance of the bankruptcy proof of claim pending (all appeals from the judgment in the lawsuit having been exhausted) in October 2015, SGGH and Mr. Walker entered into a settlement and release agreement whereby Mr. Walker dismissed his claims and the bankruptcy appeal in exchange for a waiver of SGGH’s rights to recover costs. As of December 31, 2015, this matter is now concluded with SGGH prevailing in full.
RMBS Defense, Indemnity and Contribution Matters. In connection with residential mortgage-backed securities offerings (“RMBS Offerings”) involving loans originated by FIL, either or both of FIL and its subsidiary entered into loan purchase agreements, underwriting agreements and indemnification and contribution agreements, which contained or incorporated various representations and warranties relating to the loans. Investment banks involved in these RMBS Offerings have been sued in a number of actions concerning their activities related to subprime mortgages (“RMBS Actions”), where SGGH or its former businesses is not a named defendant. SGGH has received demands for defense, indemnity and contribution from defendants in various RMBS Actions. SGGH has rejected each of these demands on several grounds. There is no assurance that SGGH or its former businesses will not be named as defendants in additional RMBS Actions, be sued to enforce claimed rights to defense, indemnity and contribution, or receive additional demands for defense, indemnity and contribution. It is SGGH’s intention to vigorously defend any such claims, but SGGH cannot presently predict whether such claims will be pursued or what the outcome would be.
Subpoenas for Information and Documents. In addition to the above-described RMBS Actions, SGGH has received and responded to a number of subpoenas for information from federal agencies and other third-parties in civil litigation matters in which SGGH is not a defendant, but which concern home mortgage transactions involving the Fremont’s origination and sale of whole loans, and certain RMBS Offerings.
F-50
Pursuant to the requirements of Section 13 or 15(d) of the Securities Exchange Act of 1934, the Registrant has duly caused this Annual Report to be signed on its behalf by the undersigned, thereunto duly authorized.
|
|
|
REAL INDUSTRY, INC. |
|
|
|
|
|
|
|
|
|
|
|
/s/ Craig T. Bouchard |
|
|
|
|
|
Craig T. Bouchard |
|
|
|
|
|
Chairman of the Board and |
|
|
|
|
|
Chief Executive Officer |
|
|
Pursuant to the requirements of the Securities Exchange Act of 1934, this Annual Report has been signed below by the following persons on behalf of the Registrant, in the capacities and on the dates indicated.
|
Name |
|
Title |
|
Date |
|
|
|
|
|
|
|
/s/ Craig T. Bouchard |
|
Chairman of the Board and |
|
|
|
Craig T. Bouchard |
|
Chief Executive Officer |
|
March 14, 2016 |
|
|
|
|
|
|
|
/s/ Kyle Ross |
|
Executive Vice President and |
|
|
|
Kyle Ross |
|
Chief Financial Officer |
|
March 14, 2016 |
|
|
|
|
|
|
|
/s/ Peter C.B. Bynoe |
|
|
|
|
|
Peter C.B. Bynoe |
|
Director |
|
March 14, 2016 |
|
|
|
|
|
|
|
/s/ Patrick Deconinck |
|
|
|
|
|
Patrick Deconinck |
|
Director |
|
March 14, 2016 |
|
|
|
|
|
|
|
/s/ William Hall |
|
|
|
|
|
William Hall |
|
Director |
|
March 14, 2016 |
|
|
|
|
|
|
|
/s/ Patrick E. Lamb |
|
|
|
|
|
Patrick E. Lamb |
|
Director |
|
March 14, 2016 |
|
|
|
|
|
|
|
/s/ Raj Maheshwari |
|
|
|
|
|
Raj Maheshwari |
|
Director |
|
March 14, 2016 |
|
|
|
|
|
|
|
/s/ Philip Tinkler |
|
|
|
|
|
Philip Tinkler |
|
Director |
|
March 14, 2016 |