Attached files

This presentation contains Forward Looking Statements and other information designed to convey
our projections and expectations regarding future results. There are a number of factors which
could cause our actual results to vary materially from those projected in this presentation. The
principal risk factors that may cause these differences are described in various documents we file
with the Securities and Exchange Commission, such as our Current Reports on Form 8-K, and our
regular reports on Forms 10-Q and 10-K, particularly in “Item 1A, Risk Factors.” Please review
this presentation in conjunction with a thorough reading and understanding of these risk factors.
This presentation contains Non-GAAP measures, and we may reference Non-GAAP measures in
our remarks and discussions. A reconciliation of these measures to GAAP measures is available in
our latest quarterly news release, which is available in the Investor Relations section of our website,
www.ProAssurance.com, and in the related Current Reports on Form 8K disclosing that release.
our remarks and discussions. A reconciliation of these measures to GAAP measures is available in
our latest quarterly news release, which is available in the Investor Relations section of our website,
www.ProAssurance.com, and in the related Current Reports on Form 8K disclosing that release.
FORWARD LOOKING STATEMENTS
1
NON-GAAP MEASURES

ProAssurance Overview
We are the only pure-play, publicly-traded
healthcare professional liability (HCPL)
insurance company in America.
healthcare professional liability (HCPL)
insurance company in America.

ProAssurance Corporate Profile
Specialty writer of professional liability insurance
Primarily Healthcare Professional Liability (HCPL)
Only pure play public company writing predominately
HCPL
HCPL
Market Cap: ~$2.7 billion
Shareholders’ Equity: $2.2 billion
Total Assets: $5 billion
Annualized dividend yield is 1.1% / $0.25/share
Rated “A” by Fitch and A. M. Best
3
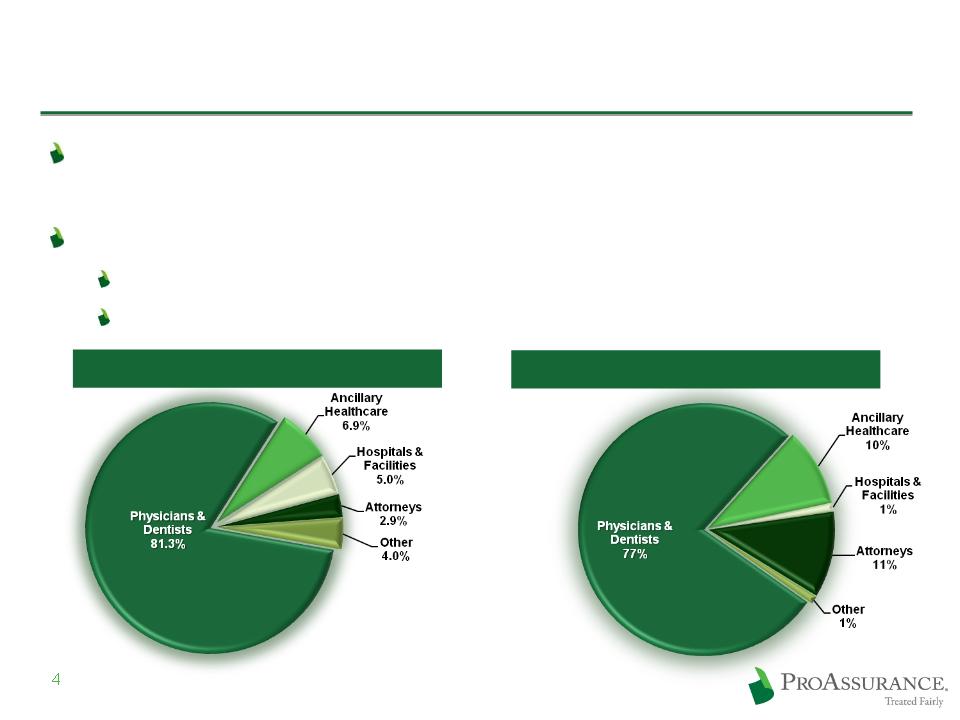
ProAssurance Corporate Profile
Evolving strategy is successfully adding business across the
risk spectrum as the delivery of healthcare changes
risk spectrum as the delivery of healthcare changes
Distribution is Independent Agent (62%) and Direct (38%)
Direct in Alabama, Florida and in all states for Podiatric business
Dual distribution in DC, Texas and parts of Missouri
Q1 2011 Policyholders: ~71,000
2011 Gross Written Premium: $566 million
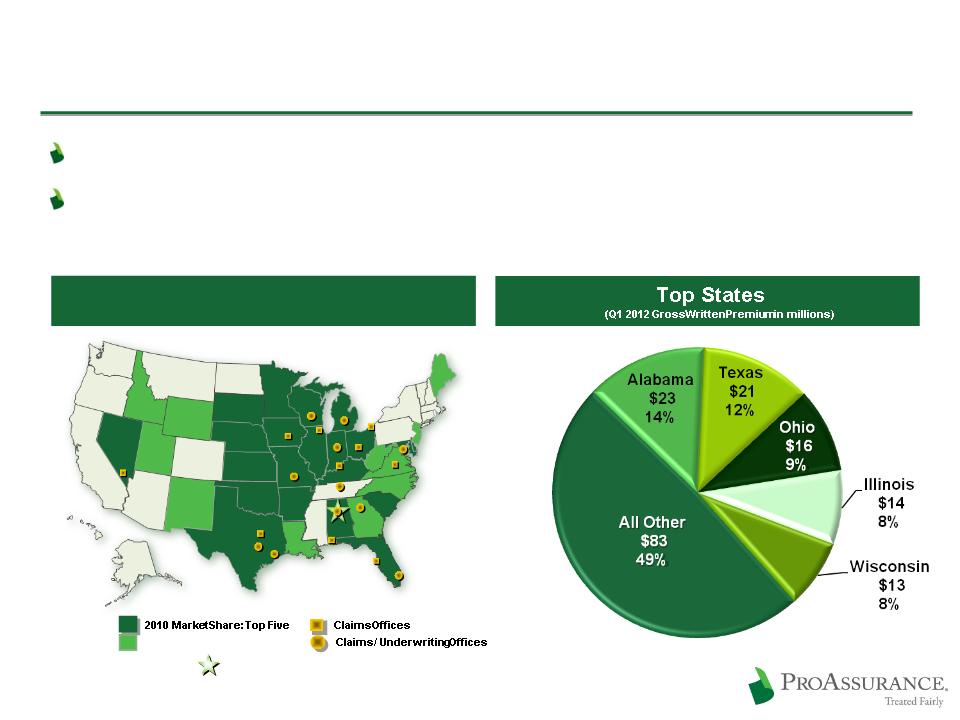
ProAssurance Geographic Profile
Broad geographic diversification
Locally-based decision-making differentiates ProAssurance by
addressing each state’s unique medical/legal challenges
addressing each state’s unique medical/legal challenges
5
Corporate Headquarters
Corporate Headquarters
(Birmingham)
2010 Market Share: Six-Ten
2010 Market Share: Six-Ten
ProAssurance Footprint
March 31, 2012

This is What Differentiates our Company
Our commitment to Treated Fairly
Unwavering dedication to the defense of
non-meritorious lawsuits
non-meritorious lawsuits
Allows our insureds the right to an unfettered defense of
their claims where permitted by law
their claims where permitted by law
Steadfast dedication to in-depth underwriting and
adequate pricing
adequate pricing
An unsurpassed level of customer service
Unquestioned financial strength consistently
delivering value for insureds and shareholders
delivering value for insureds and shareholders
6
Success Throughout the Insurance Cycle
7
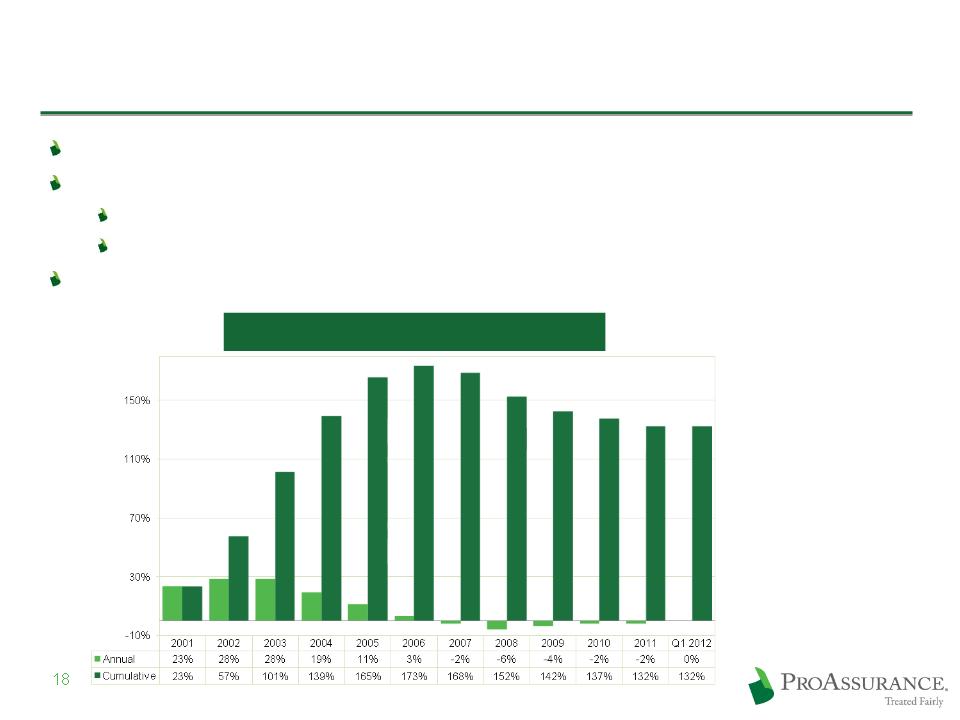
Historical Book Value Per Share
Inception to 3/31/12
CAGR: 16%
CAGR: 16%
Cumulative:1872%
10 Year Summary (2002 -2011)
CAGR: 16%
CAGR: 16%
Cumulative: 342%
Inception to 5/15/12
CAGR: 15%
CAGR: 15%
Cumulative:1606%
10 Year Summary (2002 -2011)
CAGR: 16%
CAGR: 16%
Cumulative: 280%

Healthcare Professional Liability is Unique
Differs greatly from personal lines and
commercial lines insurance.
commercial lines insurance.
Understanding the tale of the “tail.”

HCPL Stands Apart in Insurance
HCPL claims may not be filed for years after an
incident and may take years to resolve: Long-tail
incident and may take years to resolve: Long-tail
Personal lines are short tail
Introduces long periods of uncertainty
Loss trends may change expected severity from time of
initial pricing
initial pricing
Can provide a false sense of security for start-ups and
companies seeking to aggregate market share based on price
companies seeking to aggregate market share based on price
Float can be meaningful
HCPL claims are almost always lawsuits
High cost to defend, even if you win
9
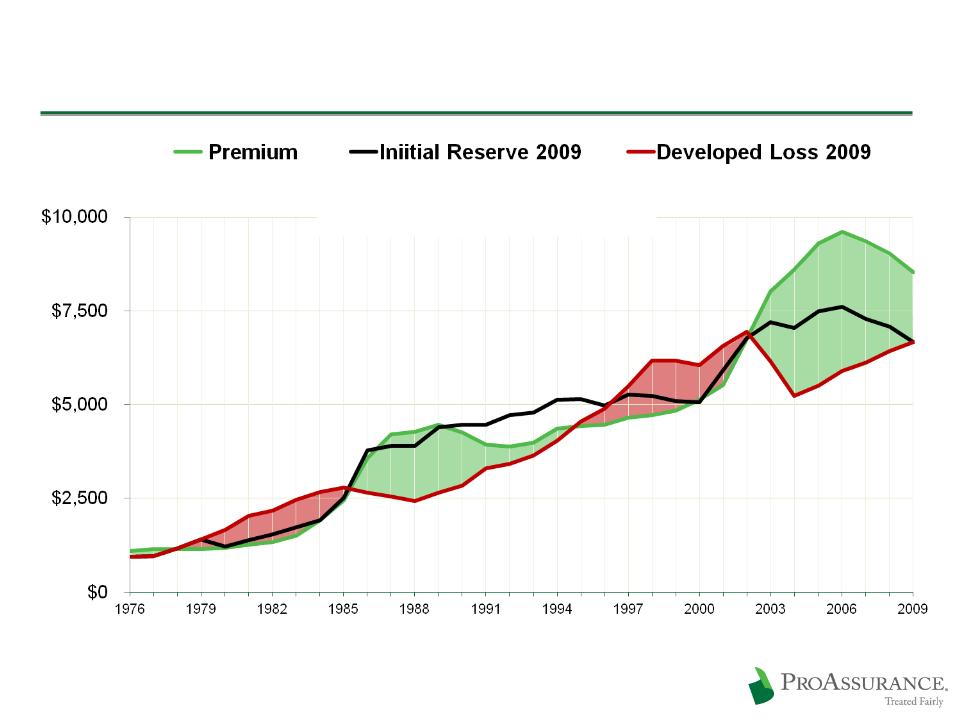
The HCPL Industry Cycle
10
(Estimated)
(Actual)
Premium in
millions
millions
Industry Data 1976 Through 2009
Source: A. M. Best Aggregates and Averages
Medical Malpractice Industry, Net Basis Occurrence and Claims-Made Combined
Medical Malpractice Industry, Net Basis Occurrence and Claims-Made Combined

The HCPL Market Today
Prolonged period of “benign profitability”
Premiums levels remain well above levels of 2000
Significant policyholder retention by all companies
despite fierce competition
despite fierce competition
No large commercial carriers have entered the market
in a meaningful manned
in a meaningful manned
Significant barriers to entry in underwriting and claims
handling
handling
Psychological barriers exist—failures in the past
No Catastrophe exposure
11

The HCPL Market Today
Changes in healthcare delivery are changing the
underlying dynamics
underlying dynamics
Physicians are combining into larger groups
Physician practices are being brought into hospitals through
purchase or affiliation
purchase or affiliation
Hospitals are combining into large networks requiring
greater insurance expertise and greater financial security
greater insurance expertise and greater financial security
Larger companies with geographical reach and
financial strength will have an advantage in attracting
new business and continuing to consolidate
financial strength will have an advantage in attracting
new business and continuing to consolidate
12

The HCPL Market Today
Market remains fragmented even after two
decades of consolidation
decades of consolidation
More than 100 writers
Largest market share is <8%
100 companies have <1%
13

ProAssurance in the Marketplace
We ensure that we deliver an unparalleled level of
service and financial stability that truly
differentiates our coverage and our Company.
service and financial stability that truly
differentiates our coverage and our Company.

Local Knowledge and National Reach
Medical/Legal environment varies by state
Often varies within states
Regulatory environment differs greatly
May limit the ability to ensure that rates accurately
reflect loss trends
reflect loss trends
Can affect the ability to introduce policy or
procedural changes
procedural changes
Overall business climate differs and can change
Demographics of the medical population and
consumers
consumers
15

ProAssurance Operational Philosophy
Maintain our profitability and grow book value
Ensure outstanding performance in a challenging
financial market and a demanding line of insurance
financial market and a demanding line of insurance
Focus on long-term
Maintaining balance sheet strength and institutional
expertise to prepare for a changing market
expertise to prepare for a changing market
Leverage financial strength
Protects the balance sheet
Maintains our leading market position
Build strength for the next cycle turn
16

Underwriting for Profitability Not Market Share
Underwriting process driven by individual risk
selection and assessment of loss history, areas
of practice, and location
selection and assessment of loss history, areas
of practice, and location
Rates contemplate specific ROE expectations
Frequent rate/loss reviews ensure adequate prices
Rate filings consider the results of the past five to
seven years to ensure a single year does not unduly
influence results
seven years to ensure a single year does not unduly
influence results
Stringent underwriting standards maintain rate
structure and enhance profitability
structure and enhance profitability
17
ProAssurance and Today’s Market
Peak pricing was in 2006
Improved frequency trends are reflected in recent rate declines
Improvement in frequency has outweighed the steady, manageable rise in severity
Loss trends have improved in states with and without tort reforms
Rate changes (up or down) through 2012 will likely be low-to-mid single digits
MD/DO Rate Change History
PICA excluded to facilitate accurate comparisons over time
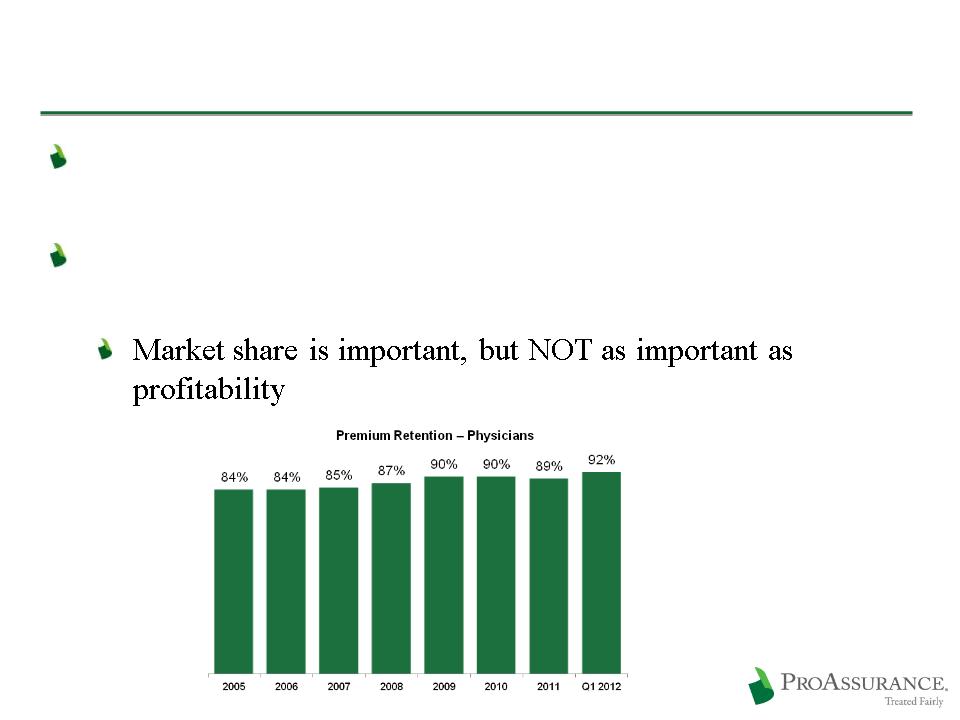
ProAssurance and Today’s Market
ProAssurance’s retention remains at historically high
levels
levels
Continued underwriting vigilance is being used today
to ensure future success
to ensure future success
19
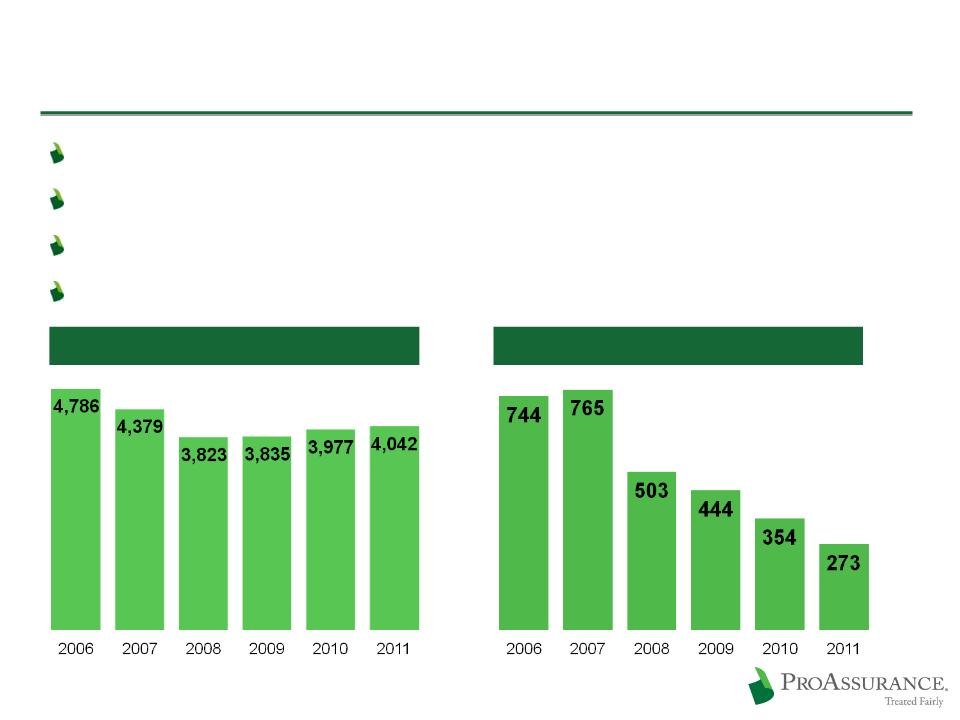
New Claims Opened Each Year
Claims Trends Remain Favorable
Fewer cases to try following significant decline in frequency
Severity trends steady and manageable
No observed effect from the economic downturn
Trends are much the same in states with or without Tort Reform
20
ProAssurance Claims Tried to a Verdict
Understanding Recent Loss Trends
Frequency stable after
historic declines
historic declines
Lawyers are the gatekeepers
Must weigh the cost of a trial vs.
chances of success
chances of success
Likelihood of success is affected
by many factors
by many factors
Societal perceptions of lawsuits
against physicians
against physicians
Effects of the overall tort reform
debate and headlines across the
country
debate and headlines across the
country
Reforms enacted in some states
Better quality of care reduces the
number of medical misadventures
number of medical misadventures
21
Severity uptrend remains
steady at 3%-4%
steady at 3%-4%
Closely tied to inflation
Primarily medical cost inflation
Jury sentiment in reaction to
headlines has moderated, but
not eliminated, runaway
verdicts in recent years
headlines has moderated, but
not eliminated, runaway
verdicts in recent years
Tort Reforms have limited
non-economic damages in a
number of states
non-economic damages in a
number of states

ProAssurance Business Outlook
We ARE writing new business that we believe
will meet our profitability goals
will meet our profitability goals
$68 million in new physician business in 2011
Approximately $48 million due to AMPH
Includes approximately $6.5 million in first year claims-
made premium in the Certitudetm program
made premium in the Certitudetm program
Major competitors continue to be largely
disciplined in pricing
disciplined in pricing
No new market entrants
22
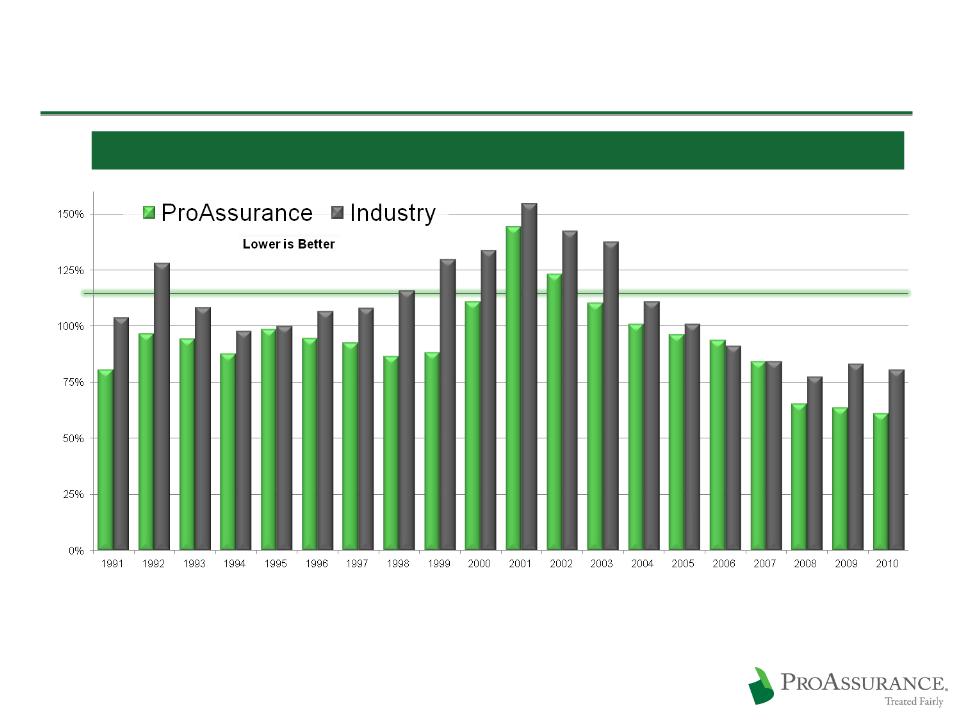
Calendar Year Combined Ratio: ProAssurance Consistently Outperforms
ProAssurance Outperforms the Industry
23
Five Years: ProAssurance Average: 73.5% / Industry Average: 83.3%
Ten Years: ProAssurance Average: 94.2% / Industry Average: 106.3%
All Years: ProAssurance Average: 93.6% / Industry Average: 109.7%
Source: A.M. Best Aggregates and Averages, Medical Malpractice Lines of Business
Consistent Approach to Reserves
Consistent reserving practices provide protection
against a loss trend reversal and capital erosion
against a loss trend reversal and capital erosion
Net Favorable Reserve Development
Net Reserve per Open MPL Claim1
1 Statutory basis; Loss & LAE
Acquired company data included at end of acquiring year
Acquired company data included at end of acquiring year
Differentiate Through Claims Defense
We leverage our financial strength to gives our insureds the opportunity for
an uncompromising defense of their claim
an uncompromising defense of their claim
Differentiates our product
Provides long-term financial and marketing advantages
Retains business and deters future lawsuits
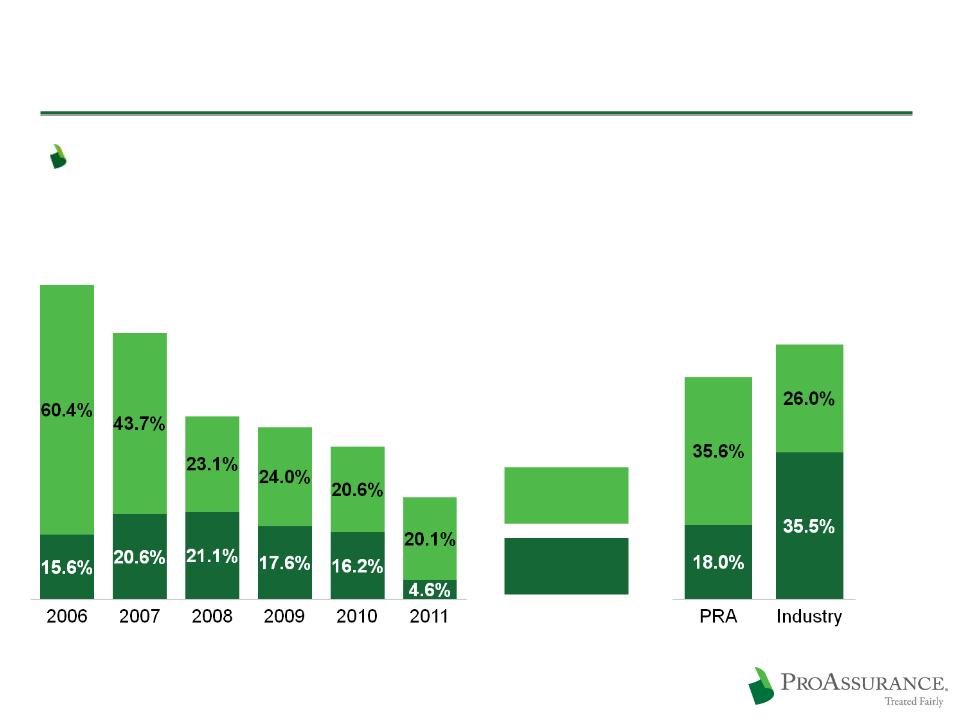
Increasingly important as claims data becomes public
Malpractice outcomes now public in 26 states
ProAssurance: 79% No Paid Losses
Industry: 72% No Paid Losses
Source: PIAA 2010 Claim Trend Analysis
ProAssurance Excluded
ProAssurance Excluded
Five Year Average
2006-2010
2006-2010
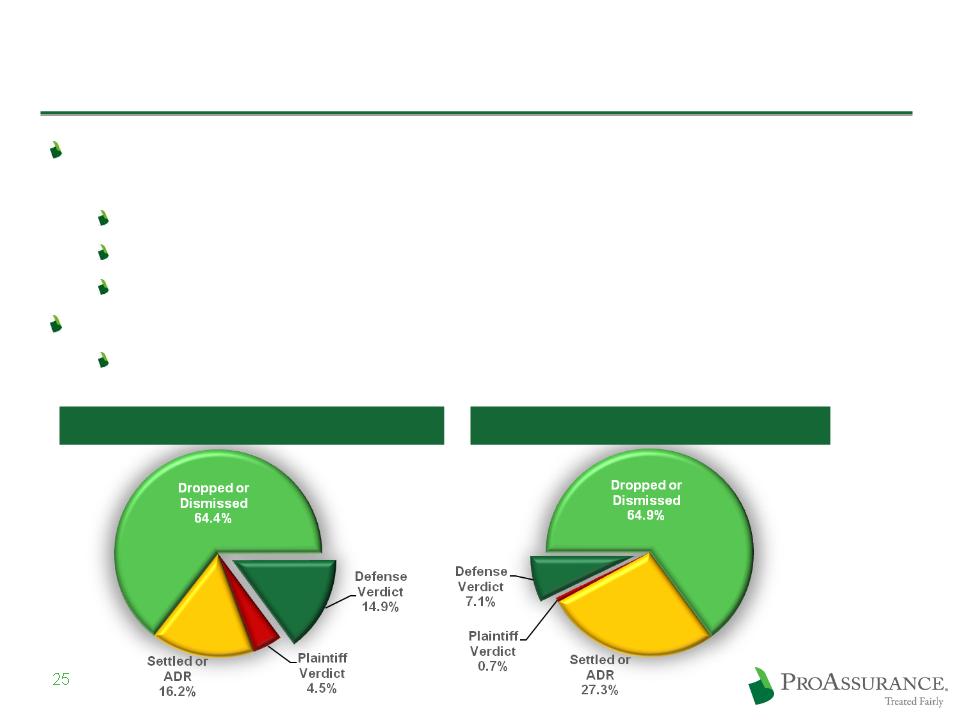
The Ohio Example: 2005 - 2010 Data
Comprehensive, reliable data provided by the Ohio Department of Insurance
Broad range of competitors and business approaches
26
www.insurance.ohio.gov/Legal/Reports/Documents/2010ClosedClaimReport.pdf
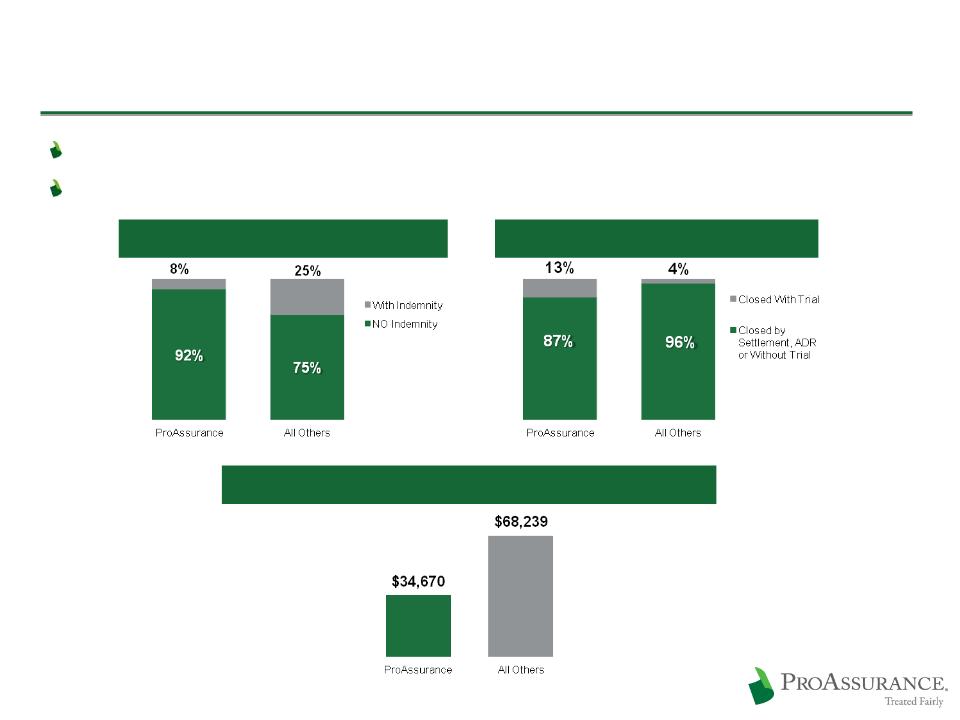
Fewer Claims Closed With Indemnity
More Claims Defended in Court
2x Lower Average Indemnity Payment per Closed Claim
The Bottom Line Benefits of Strong Defense
Our ability and willingness to defend claims allows us
to achieve better results
to achieve better results
27
Source: Statutory Basis, A.M. Best Aggregates & Averages
Some totals may not agree due to rounding
Some totals may not agree due to rounding
ProAssurance vs. Industry
Average Loss Ratio (2006-2010)
Legal
Payments
Payments
Loss
Payments
Payments
64.3%
44.2%
61.5%
53.6%
41.6%
76.0%
36.8%
ProAssurance Stand Alone
Loss Ratio (2006-2011)
24.7%
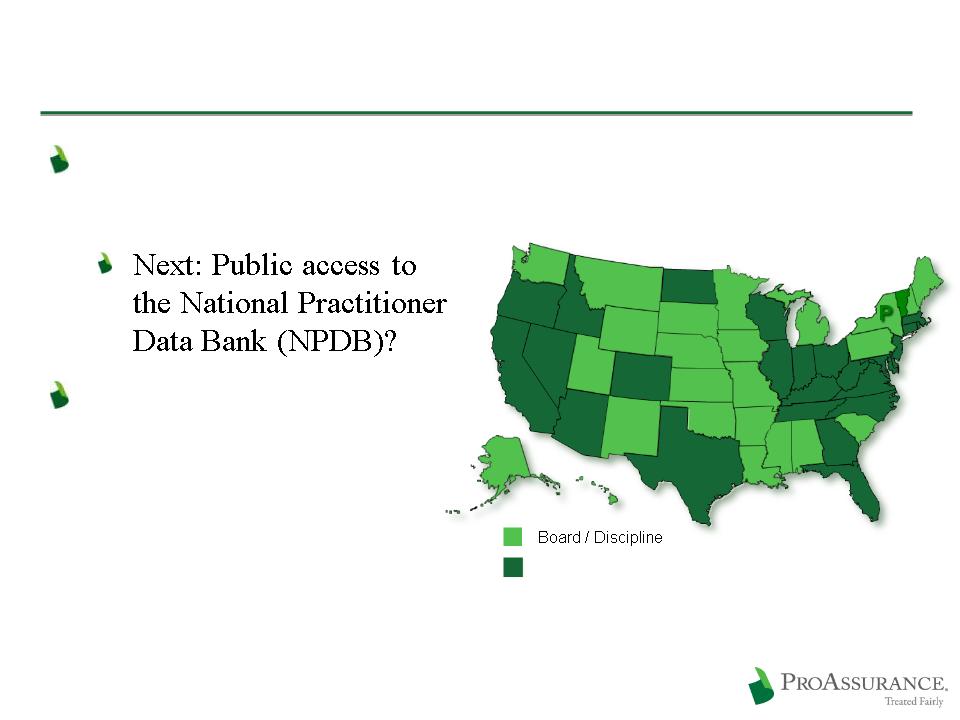
Malpractice Made Public
Malpractice judgments/settlements now
disclosed in 26 states
disclosed in 26 states
Disciplinary actions
now disclosed in
all states
now disclosed in
all states
Board / Discipline / Med-Mal
Med-Mal disclosure
legislation proposed
legislation proposed
P
Source: Federation of State Medical Boards National Clearinghouse and
ProAssurance research
ProAssurance research

The Residual Cost of a Plaintiff Verdict
Financial Effects
Higher MPL premiums
May affect quality scoring under new payment regimes
Credentialing Implications
Disclosure required when applying for licensing, privileges
and treatment panels throughout their medical career
and treatment panels throughout their medical career
Reputational Damage
May affect referrals
Online disclosure can affect acquisition of new patients
Emotional Stress before, during and after
Influences future treatment behavior and patient relationships
29
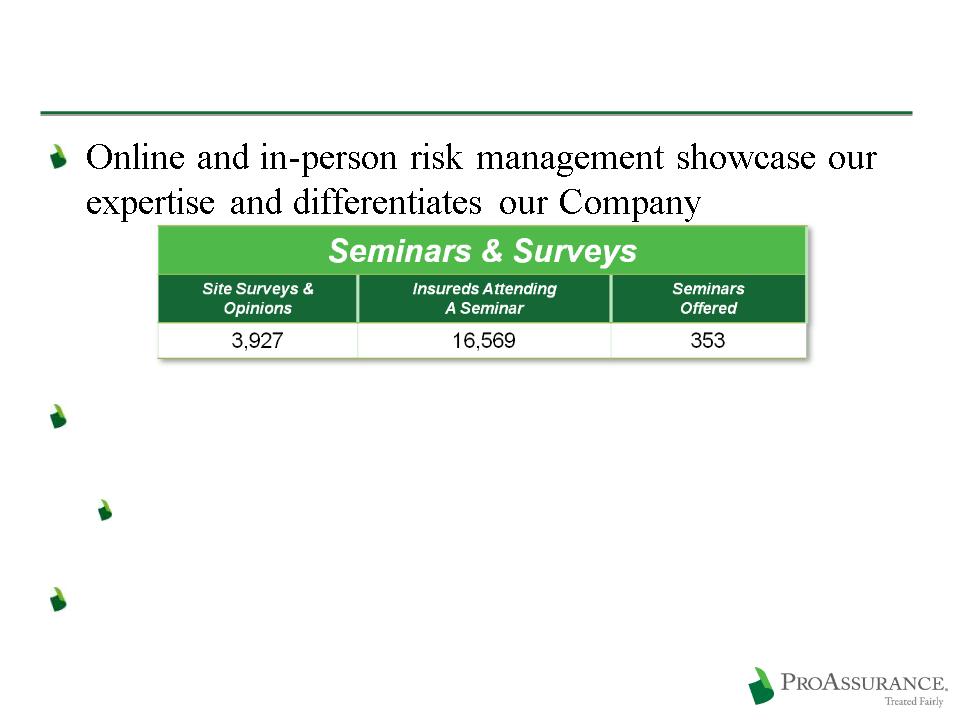
Effective Risk Management
Allows us to touch even those insureds not currently
involved in a claim
involved in a claim
Over 70% of insured physicians were touched by risk
management in 2011
management in 2011
Over 84,000 specialty-specific risk management
publications delivered each year
publications delivered each year
30

Involving Insureds
Claims & Underwriting Committees in key states
45 meetings in 15 states for 2012
Representation by specialty and geography
Regional Advisory Boards
Hundreds of meetings each year involve our insureds at the
county level in key states
county level in key states
Ensures that we stay close to our risk and know the
market
market
Spreads our message back to our target market
31

The Reform Discussions
We prepare for the worst case
legal or legislative outcome.

Healthcare Reform
Known: More customers for us
May accelerate the growth of hospital-owned practices and
consolidation into larger groups
consolidation into larger groups
Provides an opportunity for us due to our geographic reach,
long-term experience in hospitals and our financial strength
long-term experience in hospitals and our financial strength
We have enhanced our ability to write new classes of
business through acquisitions
business through acquisitions
May hasten the need for consolidation of smaller insurers
Unknown: Effect on the medical/legal environment
Increased patient frustration with the system
Possibility of more unexpected outcomes
33

Tort Reform
No meaningful Tort Reform in healthcare reform laws
No prospect for Federal Tort Reform despite recent
positive action on H.R. 5
positive action on H.R. 5
State Tort Reform battles now being fought in the
courts with mixed results
courts with mixed results
We do not depend on Tort Reform for success
Our results are solid in states with and without Tort
Reforms
Reforms
Prices are set, and reserves established, as if there is no tort
reform, until results reflect otherwise
reform, until results reflect otherwise
34

ProAssurance’s Growth Strategy
We are confident that our deep expertise and solid
financial strength have prepared us for the
challenges of the evolving healthcare market
financial strength have prepared us for the
challenges of the evolving healthcare market

Driving ProAssurance’s Growth
Growth opportunities will be shaped by a healthcare
landscape that will see enormous changes—with or
without federal healthcare reform
landscape that will see enormous changes—with or
without federal healthcare reform
We are expanding our hospital capabilities and
commitment
commitment
Building on two decades of hospital experience
We continue to enhance our commitment to
individual providers and small groups
individual providers and small groups
There will be M&A in our future but our growth may
be less dependent on M&A than in the past
be less dependent on M&A than in the past
36
ProAssurance’s Growth Strategy
Leverage our reach, expertise and financial strength with larger
accounts
accounts
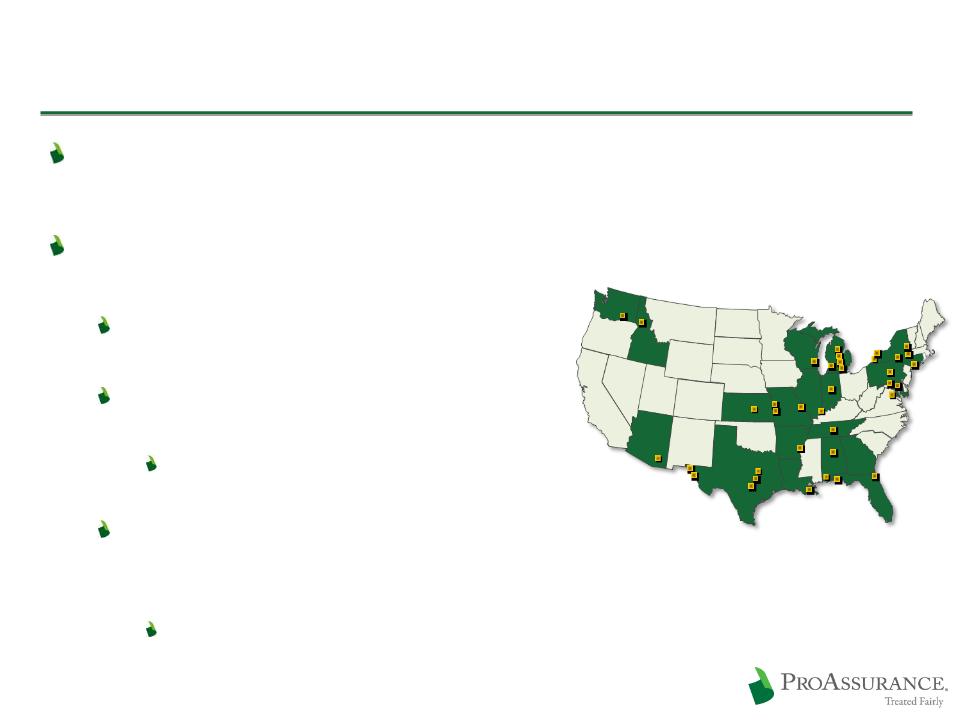
Example: The Certitudetm program
with Ascension Health
with Ascension Health
Largest non-profit healthcare
system in the US
system in the US
Now in Michigan, Florida,
Indiana and Texas
Indiana and Texas
Expanding into other states
throughout 2012
throughout 2012
Insuring Ascension-affiliated
physicians through coordinated,
jointly insured programs
physicians through coordinated,
jointly insured programs
Financial involvement of both entities creates
incentive to reduce risk
incentive to reduce risk
37
*www.ascensionhealth.org/annualreport/health.php
Ascension Health’s Ministry Locations*

ProAssurance’s Growth Strategy
Joint physician/hospital insurance products to
addresses the unique risk tolerance and claims-
handling expectation of each insured
addresses the unique risk tolerance and claims-
handling expectation of each insured
Already creating broad interest in the market with
several policies in force
several policies in force
Providing sophisticated alternative risk
programs for organizations as they increase in
size and sophistication
programs for organizations as they increase in
size and sophistication
We have proven experience in facilitating self-
insurance and captive insurance programs
insurance and captive insurance programs
38
ProAssurance’s M&A Strategy
Consolidation will continue and will remain episodic
Fewer significant targets
Remaining companies of size are in important strategic areas
We prefer “health care centric” but will consider closely related
liability lines
liability lines
Legal/regulatory environment must be favorable
Not all M&A opportunities should be pursued
We do not “bet the company” on any transaction
39
Soft Market
Hard Market
M & A
de novo
Expansion
Expansion
Internal
Growth
Growth
All avenues
open
because of
pricing
power
open
because of
pricing
power
M & A is
preferable
because of
pricing
pressure
preferable
because of
pricing
pressure
M & A and the Insurance Cycle
Successful M&A History
40
2009: Consolidation of:
Mid-Continent General Agency
Mid-Continent General Agency
2009: Consolidation of:
Mid-Continent General Agency
Mid-Continent General Agency
Georgia Lawyers Insurance Co.
Georgia Lawyers Insurance Co.
2004: Purchased Selected Renewal Rights from:
OHIC Insurance Company
OHIC Insurance Company
2004: Purchased Selected Renewal Rights from:
OHIC Insurance Company
OHIC Insurance Company
1994: Consolidation of:
West Virginia Hosp. Ins Co.
West Virginia Hosp. Ins Co.
1994: Consolidation of:
West Virginia Hosp. Ins Co.
West Virginia Hosp. Ins Co.
1995: Consolidation of;
1995: Consolidation of;
Physicians Ins Co of Indiana
Physicians Ins Co of Indiana
Assumed business of:
Physicians Ins Co of Ohio
Physicians Ins Co of Ohio
Assumed business of:
Physicians Ins Co of Ohio
Physicians Ins Co of Ohio
1996: Consolidation of:
1996: Consolidation of:
Missouri Medical Ins Co
Missouri Medical Ins Co
1995: Assumed business of:
Associated Physicians Ins Co. (IL)
Associated Physicians Ins Co. (IL)
1995: Assumed business of:
Associated Physicians Ins Co. (IL)
Associated Physicians Ins Co. (IL)
1998: Consolidation of:
Physicians Protective Trust Fund (FL)
Physicians Protective Trust Fund (FL)
1998: Consolidation of:
Physicians Protective Trust Fund (FL)
Physicians Protective Trust Fund (FL)
1996: Assumed business of:
American Medical Ins Exchange (IN)
American Medical Ins Exchange (IN)
1996: Assumed business of:
American Medical Ins Exchange (IN)
American Medical Ins Exchange (IN)
Founding in the 1970s
Founding in the 1970s
1999: Assumed business of:
Medical Defense Associates (MO)
Medical Defense Associates (MO)
1999: Assumed business of:
Medical Defense Associates (MO)
Medical Defense Associates (MO)
Mutual Assurance
Physicians Ins. Co. of Michigan
Professionals Group
Creation of:
Creation of:
2005: Consolidation of:
NCRIC Group
NCRIC Group
2005: Consolidation of:
NCRIC Group
NCRIC Group
2006: Consolidation of:
PIC Wisconsin Group
PIC Wisconsin Group
2006: Consolidation of:
PIC Wisconsin Group
PIC Wisconsin Group
2007: PRI renewal rights deal
2002: SERTA renewal rights deal
2001: OUM renewal rights deal
2000: DPM Merger
1999: PACO Acquisition
Completed
11/30/10
11/30/10

ProAssurance Performs
Delivering meaningful value for our shareholders
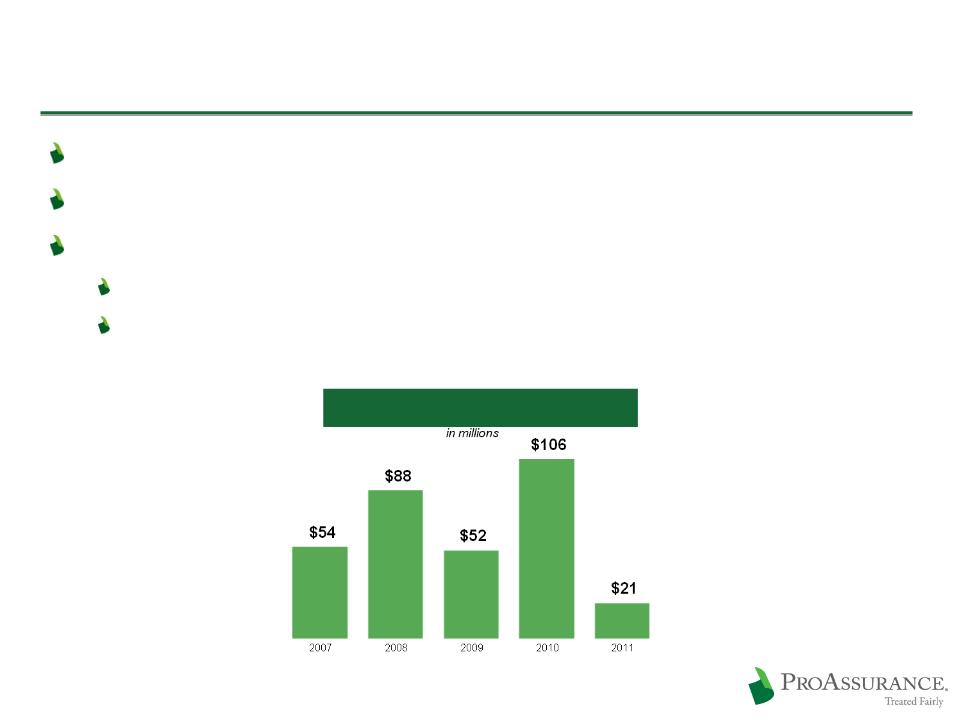
Committed to Effective Capital Management
Balancing future needs with current market reality
Dividend is current $1.00/share/year
Complements our prudent share repurchase program
$321 million spent to repurchase 6.1 million shares since 2005
Enhancing shareholder value by repurchasing shares
at prices that build Book Value
at prices that build Book Value
42
Share Repurchase History
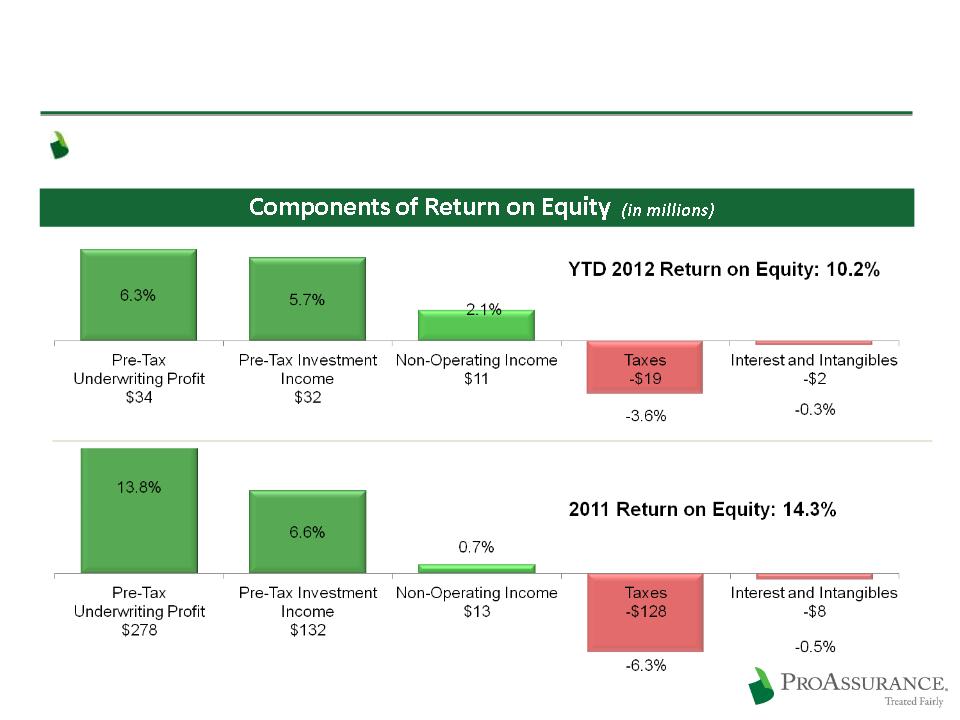
Steady Returns
Long-term ROE target: 12% -14%
43
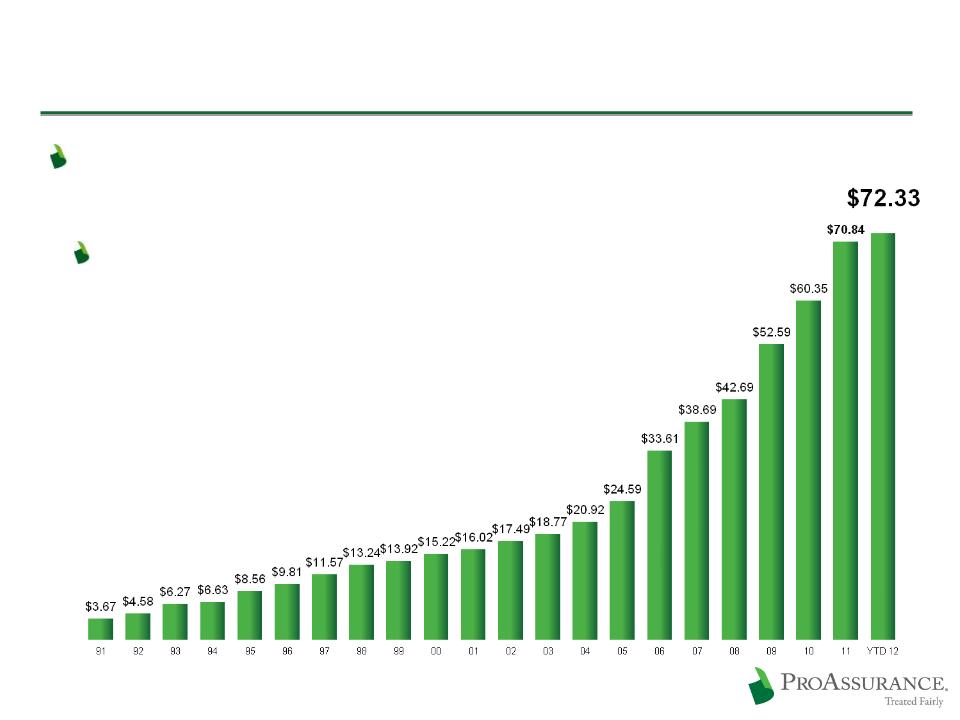
Focused on Book Value
Book Value per Share captures our focus on long-term
excellence
excellence
Increased every year we have been public
44
Inception to 3/31/12
CAGR: 16%
CAGR: 16%
Cumulative:1872%
10 Year Summary (2002 -2011)
CAGR: 16%
CAGR: 16%
Cumulative: 342%
Historical Book Value Per Share
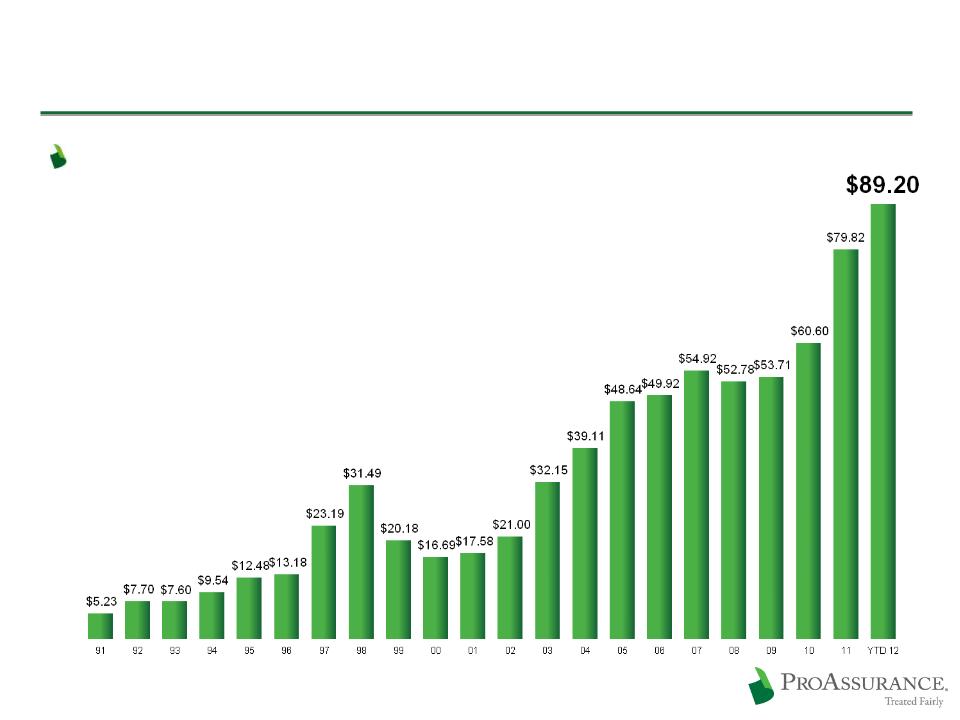
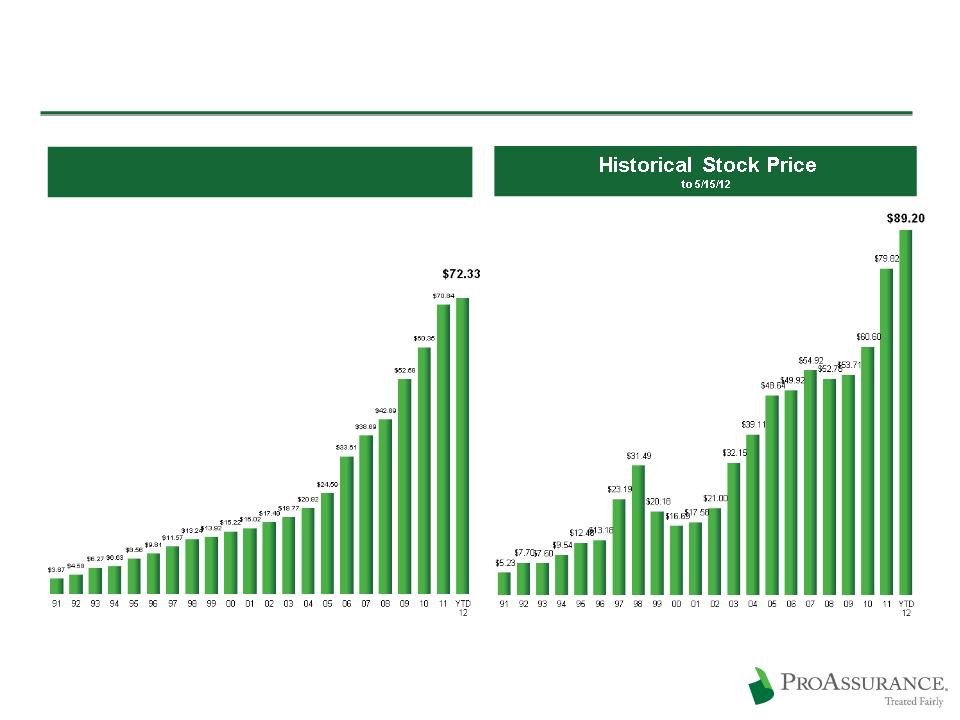
Driving Share Prices Higher
Share price reflects investor confidence in our
business decisions and long-term strategy
business decisions and long-term strategy
45
Historical Share Price
Inception to 5/15/12
CAGR: 15%
CAGR: 15%
Cumulative:1606%
10 Year Summary (2002 -2011)
CAGR: 16%
CAGR: 16%
Cumulative: 280%
Driven to Excel / Focused on Shareholder Value
Maintaining profitability
Sustaining book value growth
Producing sustainable shareholder value
Focusing on long-term—ready for the market turn
46
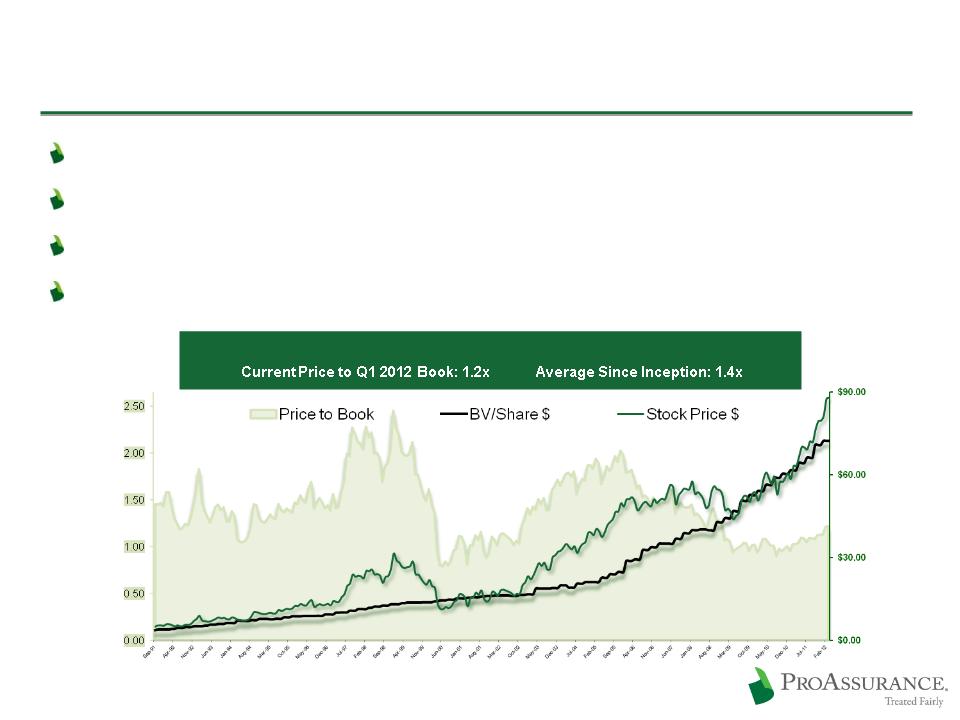
Current Prices Continue to Offer a Compelling Buying Opportunity

Management is Experienced & Invested
Effective management remains in place—15 years average tenure at ProAssurance
Average ProAssurance tenure through the VP level is 15 years, with an average of 25 years
industry experience
industry experience
Management and employees are invested, owning ~4% of ProAssurance stock
47
|
W. Stancil Starnes, JD
Chairman & Chief Executive Officer
Company Tenure: 5 Years
Prior MPL Experience: 29 Years
Total Industry & Related Experience: 34 Years
Formerly in the private practice of law in MPL defense and
complex corporate litigation. |
Victor T. Adamo, JD, CPCU
President
Company Tenure: 27 Years
Prior MPL Experience: 5 Years
Total Industry & Related Experience: 32Years
Formerly in the private practice of corporate law. President of
Professionals Group, prior to formation of ProAssurance. |
Ross E. Taubman, DPM
President of PICA
Company Tenure: 1 Year
Prior MPL Experience: -
Total Industry & Related Experience: 27 Years
Formerly in the private practice of podiatry . Leader in
organized podiatric medicine; former president and Trustee of the American Podiatric Medical Association. |
|
Jeffrey L. Bowlby, ARM
Sr. Vice-President & Chief Marketing Office
Company Tenure: 14Years
Prior MPL Experience: -
Total Industry & Related Experience: 28 Years
Career-long experience in insurance sales and marketing,
most recently as SVP for Marketing with Meadowbrook. |
Howard H. Friedman, ACAS
Sr. Vice-President & Chief Underwriting Officer
Company Tenure: 15Years
Prior MPL Experience: 16 Years
Total Industry & Related Experience: 31 Years
Career-long experience in MPL company operations
and management. Former ProAssurance CFO. |
Jeffrey P. Lisenby, JD
Sr. Vice-President, General Counsel & Secretary
Company Tenure: 11 Years
Prior MPL Experience: -
Total Industry & Related Experience: 11 Years
Formerly in the private practice of law.
|
|
Duncan Y. Manley
Vice-President, Operations and Information Systems
Company Tenure: 12 Years
Prior MPL Experience: 7 Years
Total Industry & Related Experience: 19 Years
Career-long experience in MPL company operations as an
executive and consultant. |
Frank B. O’Neil
Sr. Vice-President & Chief Communications Officer
Company Tenure: 24 Years
Prior MPL Experience: -
Total Industry & Related Experience: 24 Years
Formerly a television news executive and anchor.
|
Edward L. Rand, Jr., CPA
Sr. Vice-President & Chief Financial Officer
Company Tenure: 7 Years
Prior MPL Experience: -
Total Industry & Related Experience: 19Years
Career-long experience in insurance finance and accounting.
Most recently Chief Accounting Officer for Partner Re. |
|
Darryl K. Thomas, JD
Sr. Vice-President & Chief Claims Officer
Company Tenure: 17 Years
Prior MPL Experience: 10 Years
Total Industry & Related Experience: 27 Years
Career-long experience in MPL claims management.
|
Hayes V. Whiteside, MD, FACS
Sr. Vice-President & Chief Medical Officer
Company Tenure: 8 Years
Prior MPL Experience: -
Total Industry & Related Experience: 28 Years
Formerly in the private practice of Urology.
|
Adam P. Wilczek
Sr. Vice-President & Chief Operating Officer of PICA
Company Tenure: 16 Years
Prior MPL Experience: 21 Years
Total Industry & Related Experience: 36 Years
Former executive with Medical Inter-Insurance Exchange
(MIIX) and Chubb. |

Further Discussion Materials
1. Investment Portfolio Detail
2. Additional Financial Data

Investment Portfolio Detail
ProAssurance remains conservatively
invested, to ensure our ability to keep our
long-term promise of insurance protection
invested, to ensure our ability to keep our
long-term promise of insurance protection
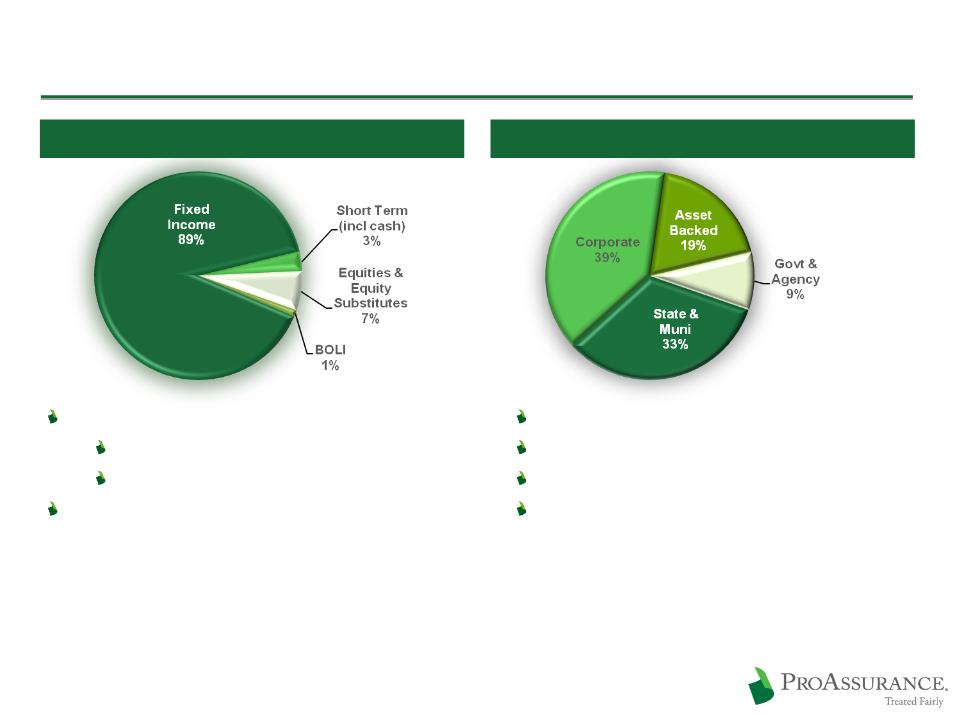
ProAssurance: Investment Profile
50
$4.1 Billion Overall Portfolio
$3.7 Billion Fixed Income Portfolio
Average duration: 4.1 years
Average tax-equivalent Income yield: 4.4%
Investment grade: 96%
Weighted average: AA-
3/31/12
Key portfolio actions in Q1 2012
Added dividend-paying equities
Added to high yield investments
CUSIP-level portfolio disclosure on our website:
www.proassurance.com/investorrelations/supplemental.aspx
www.proassurance.com/investorrelations/supplemental.aspx
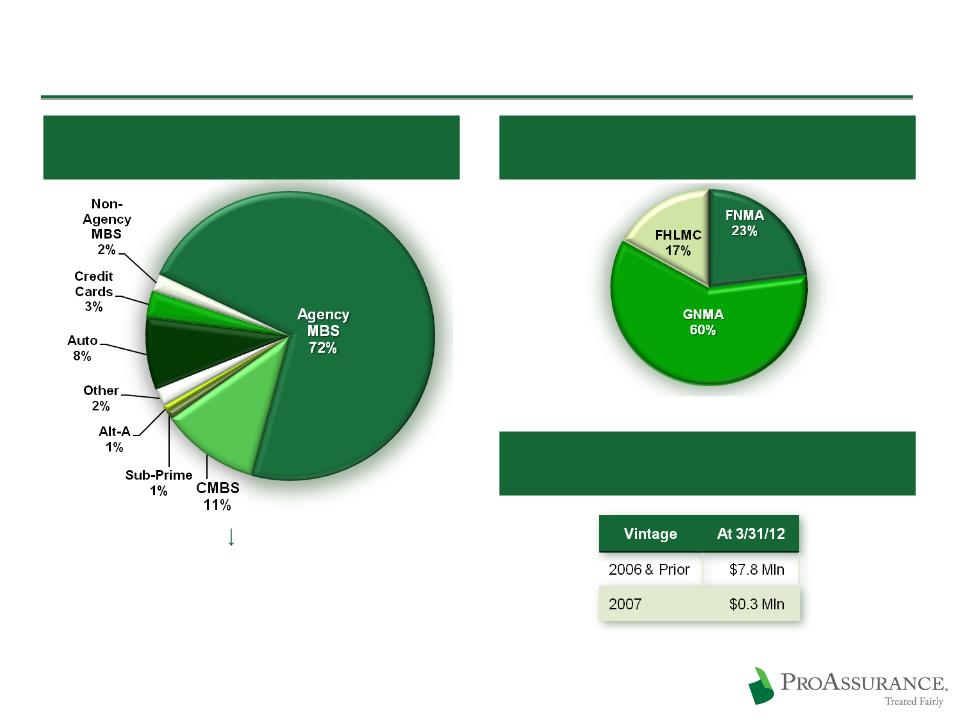
ProAssurance Portfolio Detail: Asset Backed
51
03/31/12
Subject to Rounding
Asset Backed: $687 Million
Weighted Average Rating: “AA+”
Breakdown of Agency MBS Holdings
Key CMBS Details Provided on Following Page
Sub-Prime: $8.1 mil Market Value (AFS)
$0.9 mil net unrealized loss
$0.9 mil net unrealized loss
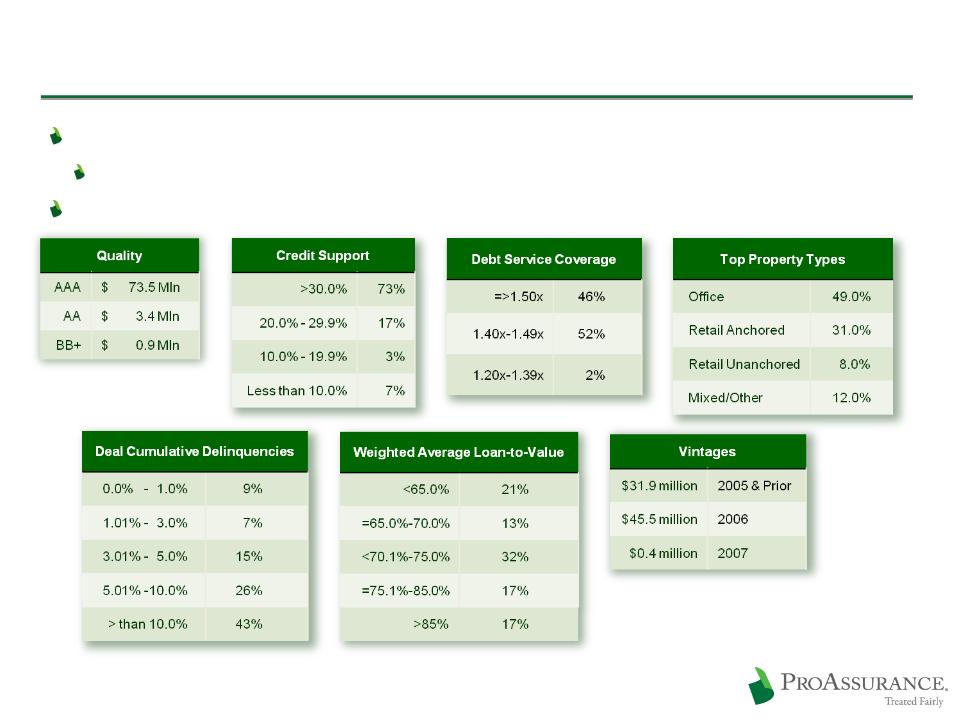
ProAssurance Portfolio Detail: CMBS
$77.8 million Fair Value in non-agency CMBS
Book Value: $72.3 million (2% of fixed income portfolio)
We have experienced no losses on our CMBS positions
52
03/31/12
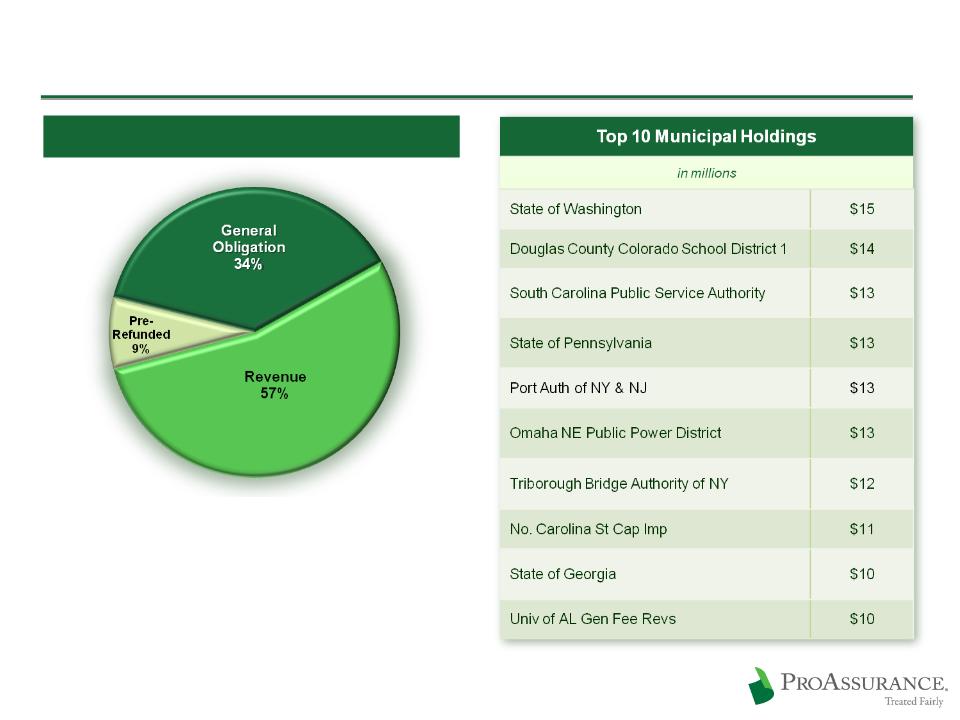
ProAssurance Portfolio Detail: Municipals
53
Municipals: $1.2 Billion / Average Rating is AA
Investment policy has always required
investment grade rating prior to applying the
effect of insurance
investment grade rating prior to applying the
effect of insurance
Weighted Average Rating: AA
03/31/12
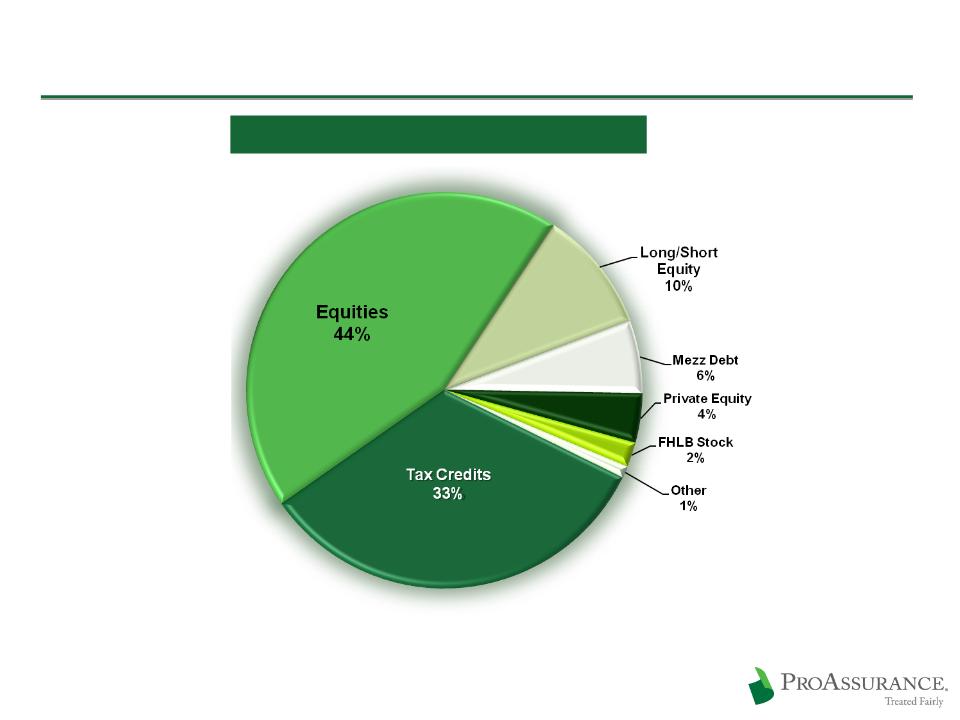
ProAssurance Portfolio Detail: Equities & Other
54
Equities & Other: $276 Million
3/31/12
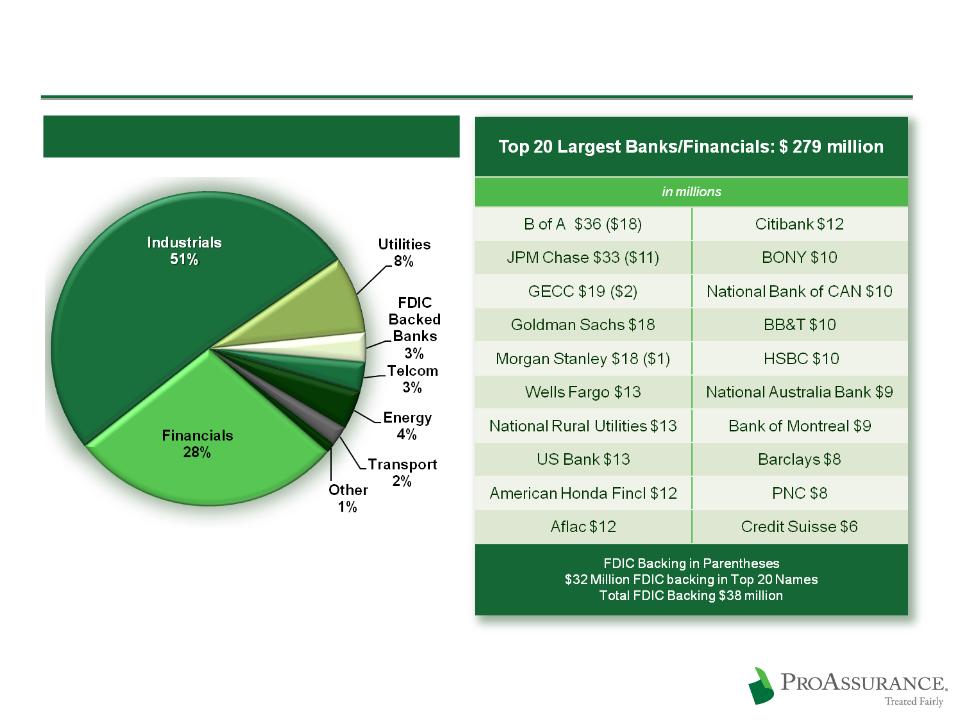
ProAssurance Portfolio Detail: Corporate
55
Corporates: $1.4 Billion
Weighted Average Rating: A-
12/31/11
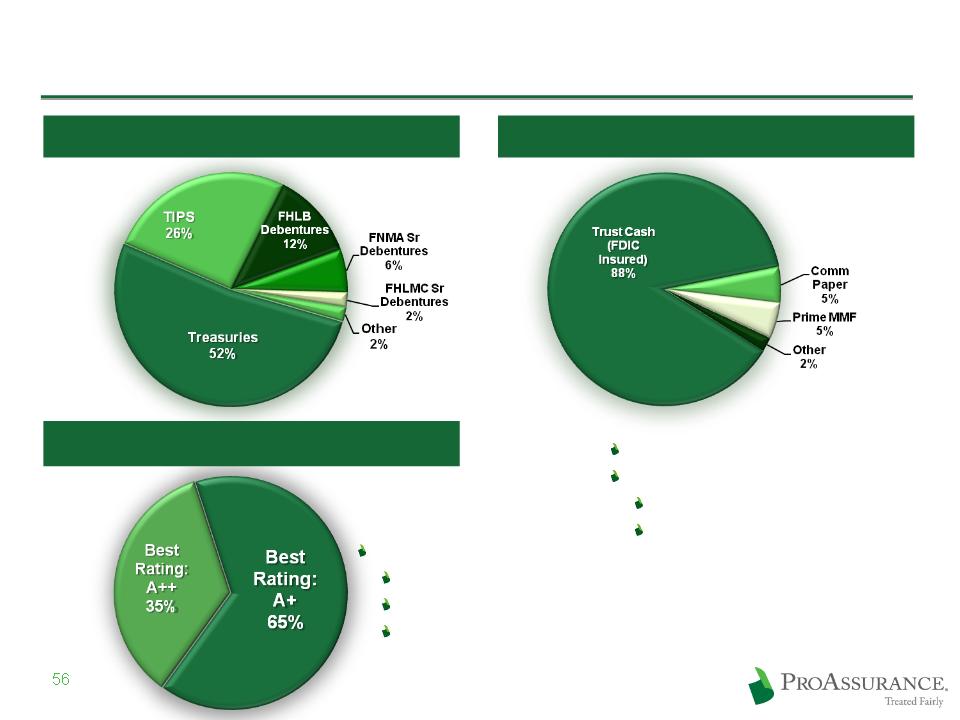
ProAssurance Portfolio Detail: Various
Rated A1/P1 or better
Money Markets:
Moody’s: Aaa
S&P: AAA
Weighted average rating
Moody’s: AA3
S&P: AA-
A. M. Best: A+
Treasury / GSE: $319 Million
Short Term: $133 Million
BOLI: $53 Million
03/31/12

Additional Financial Data
ProAssurance remains conservatively
invested, to ensure our ability to keep our
long-term promise of insurance protection
invested, to ensure our ability to keep our
long-term promise of insurance protection

2011 Financial Highlights
58
|
|
Year Ended December 31,
|
|
|
|
2011
|
2010
|
|
Gross Premiums Written
|
$ 565,895
|
$ 533,205
|
|
Net Premiums Earned
|
$ 565,415
|
$ 519,107
|
|
Net Investment Income
|
$ 140,956
|
$ 146,380
|
|
Net Income (Includes Investment Losses)
|
$ 287,096
|
$ 231,598
|
|
Operating Income
|
$ 278,514
|
$ 219,457
|
|
Net Income per Diluted Share
|
$ 9.31
|
$ 7.20
|
|
Operating Income per Diluted Share
|
$ 9.03
|
$ 6.82
|
Q1 2012 Financial Highlights
59
|
|
Quarter Ended,
|
|
|
|
3/31/2012
|
3/31/2011
|
|
Gross Premiums Written
|
$ 170,448
|
$ 160,813
|
|
Net Premiums Earned
|
$ 136,659
|
$ 132,077
|
|
Net Investment Income
|
$ 33,492
|
$ 36,161
|
|
Net Income (Includes Investment Losses)
|
$ 55,645
|
$ 47,693
|
|
Operating Income
|
$ 48,226
|
$ 44,984
|
|
Net Income per Diluted Share
|
$ 1.80
|
$ 1.55
|
|
Operating Income per Diluted Share
|
$ 1.56
|
$ 1.46
|
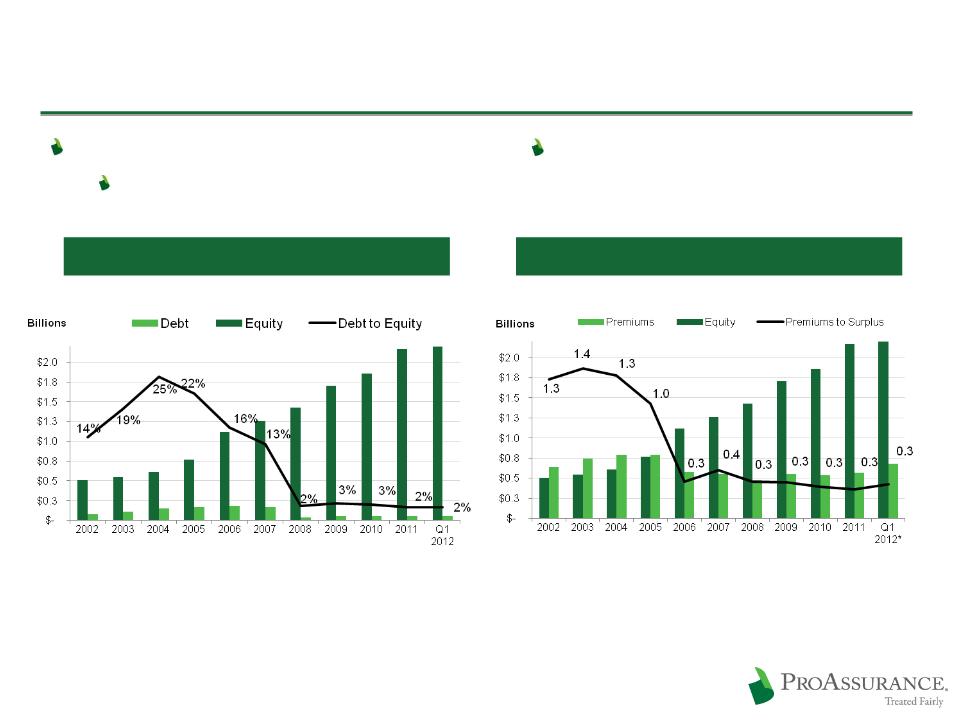
Conservative Use of Debt / Low Leverage
Low Debt to Cap Ratio
No strain on cash flow
60
Debt to Equity
No Debt Prior to 2001
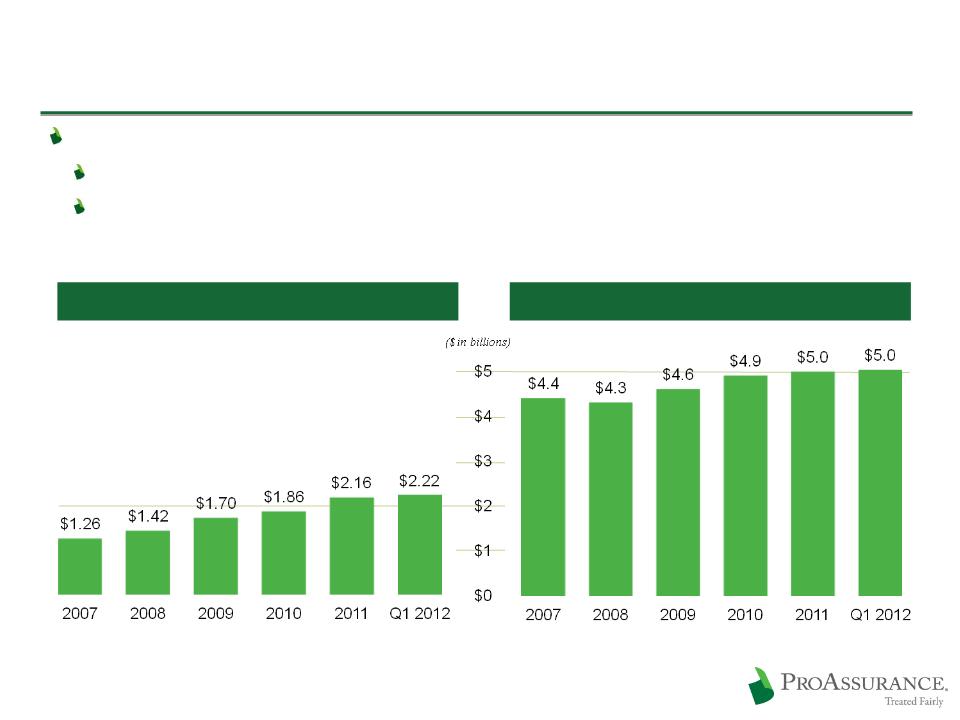
Strong Capital Position
Prepared for an improving market
*
Annualized 2012 premium
for presentation purposes
only. Specifically disclaimed
as a projection of premiums
Annualized 2012 premium
for presentation purposes
only. Specifically disclaimed
as a projection of premiums
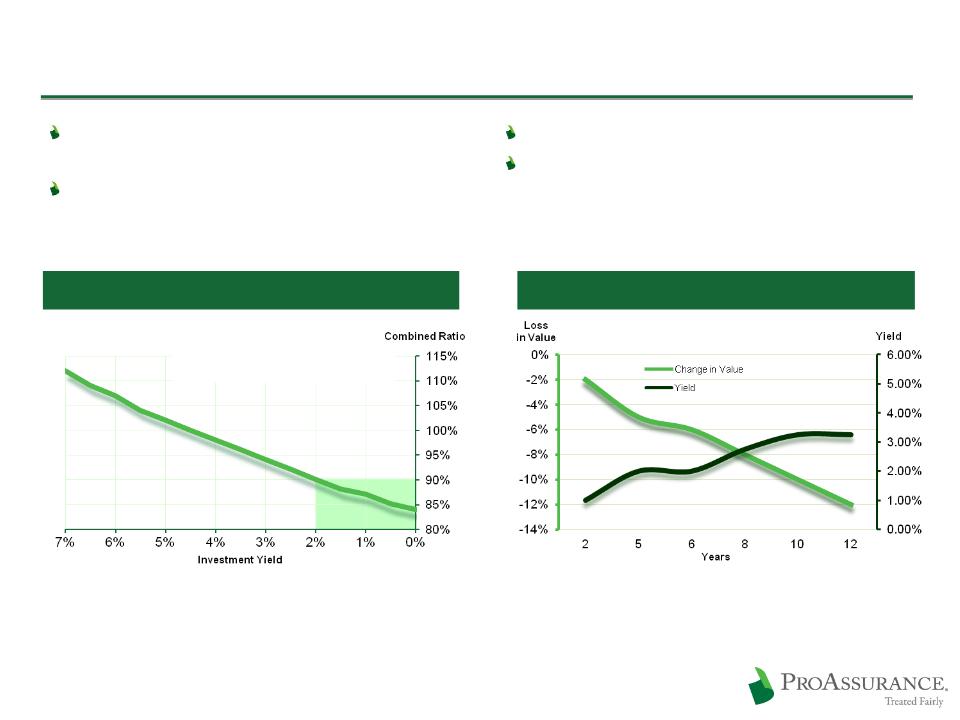
Pricing discipline becomes even more
critical in a low interest rate environment
critical in a low interest rate environment
Lack of investment yield may be a hard
market catalyst
market catalyst
Return on Equity and Investment Returns
61
Assumes a 1:1 premium to surplus ratio for physicians
professional liability claims-made coverages
professional liability claims-made coverages
Combined Ratio Required to
Generate a 13% Return on Equity
Generate a 13% Return on Equity
Long-Term ROE Target is 13%
The choice: chase yield or extend duration
We are maintaining duration, looking for
opportunities
opportunities
The Yield Trap
Revised to reflect yields at 12/31/11
Long-Term Financial Strength Sets Us Apart
Ensuring the strength of our balance sheet is our top financial priority
Financial strength differentiates us in the market
The claims defense philosophy that differentiates us in the market leverages our
financial strength
financial strength
62
Shareholders’ Equity
77% Increase Since 12/31/07
Total Assets
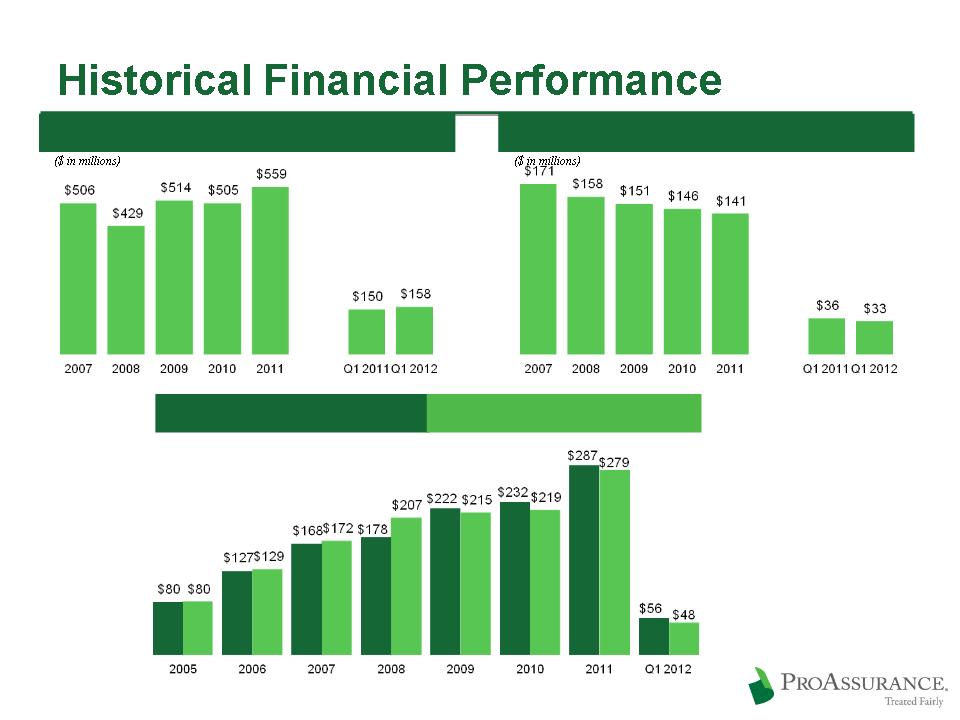
Net Investment Income
Net Premiums Written
($ in millions. Excludes discontinued operations)
Net Income
Operating Income1
63
1 Excludes the after-tax effects of net realized gains or losses, and, in 2012, the effect of
$714,000 in confidential settlements that do not reflect normal operating results
$714,000 in confidential settlements that do not reflect normal operating results
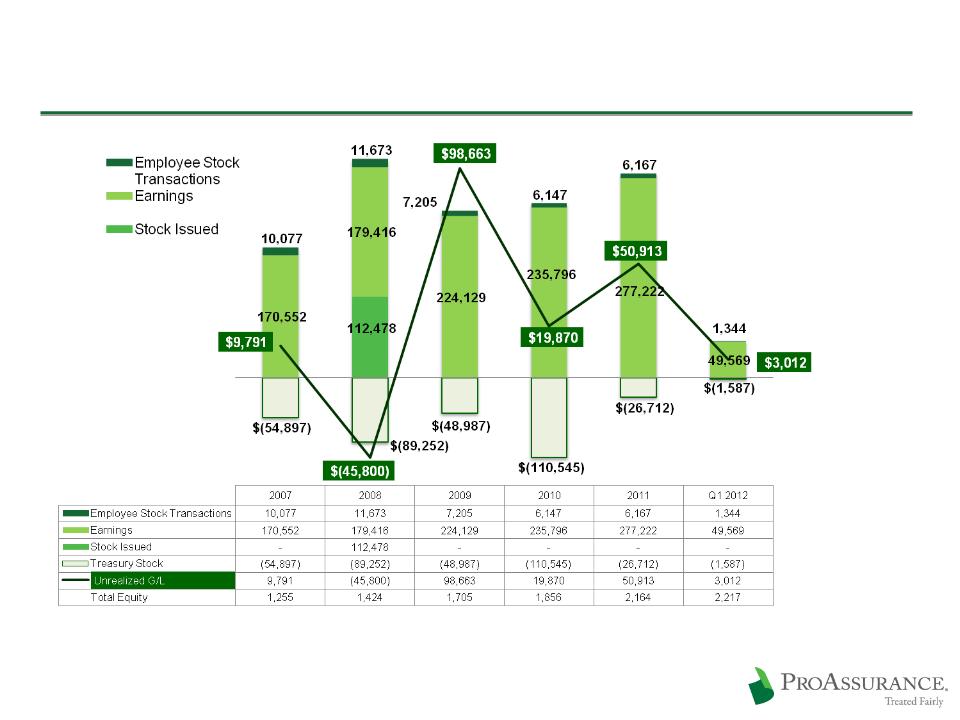
Capital Growth: 2007-2011
64
in $000’s except total equity (000,000’s)