Attached files
| file | filename |
|---|---|
| 8-K - U. S. Premium Beef, LLC | esuspb8k-may.htm |
![]()
.
|
First transaction since sale of majority interest in National Beef
USPB Class B Units In April 2012, 727 Class B units were sold for $175 per unit. That sale represents the first completed transaction since USPB sold the majority of its ownership interest in National Beef to Leucadia National Corporation in December 2012. Complete listings of “matches” for all Classes of USPB units can be viewed at www.agstocktrade.com. Matches do not constitute a completed transaction until the conditions for closing have been met.♦ |
||
|
Benchmark Performance Data Table |
||
|
Base Grid Cattle Harvested in KS Plants 04/08/12 to 05/05/12 |
||
|
(Numbers |
Base Grid |
|
|
All |
Top 25% |
|
|
Yield |
64.74 |
65.45 |
|
Prime |
2.13 |
3.11 |
|
CH & PR |
72.39 |
78.50 |
|
CAB |
21.49 |
28.03 |
|
BCP |
15.65 |
17.70 |
|
Ungraded |
0.82 |
0.43 |
|
Hard Bone |
0.58 |
0.18 |
|
YG1 |
14.52 |
9.16 |
|
YG2 |
41.33 |
39.35 |
|
YG3 |
36.35 |
42.26 |
|
YG4 |
7.36 |
8.62 |
|
YG5 |
0.44 |
0.61 |
|
Light Weight |
0.48 |
0.18 |
|
Heavy Weight |
2.44 |
1.80 |
|
Average Grid Premiums/Discounts ($/Head) |
||
|
Quality Grade |
$16.15 |
$24.59 |
|
Yield Benefit |
$22.12 |
$39.25 |
|
Yield Grade |
-$2.72 |
-$4.11 |
|
Out Weight |
-$3.75 |
-$2.60 |
|
ASV |
$11.43 |
$23.71 |
|
Natural |
$1.12 |
$1.97 |
|
Total Premium |
$44.35 |
$82.81 |
|
Did You Know... üUSPB has adjusted its Age and Source Verified (ASV) premiums. A $30 per head ASV premium floor has been put in place for the months of July through October. The ASV premium remains at $30 per head through June 2012. Currently, ASV reservations for May and June are filled. As a reminder, ASV cattle projections are required from feedyards who want to receive USPB’s ASV premiums. ASV premiums are based on market conditions and will be adjusted accordingly as conditions warrant. Please call our office at 866-877-2525 when you place ASV cattle on feed to ensure that your cattle have a reservation in our program. üIf you have delivery rights you do not plan on using in delivery year 2012, which ends August 25, and would like USPB to help you get them leased to other producers, please call our office at 866-877-2525.♦ |
||
|
Research Roundup...data summarized on more than 440,000 head
How Profit Relates to By Brian Bertelsen, VP, Field Operations Feedyard performance does not have to suffer to achieve high Quality grade and grid results. In fact, they go hand-in-hand to result in greater profit. That is the conclusion drawn by Shawn Walter and Ron Hale of Professional Cattle Consultants (PCC), a feedlot consulting firm, after analyzing feedlot closeouts and grid results on 443,129 steers fed at 55 feedlots. The data was provided by PCC customers and the Certified Angus Beef (CAB) Feedlot Licensing Program. All cattle were marketed on value-based grids from 2004 through 2009. The objectives were to identify and quantify key factors that affect feedlot profitability and to understand the relationship between feeding and carcass performance. In PCC’s data no Holsteins, Mexican origin cattle, Non-Hormone Treated Cattle (NHTC) or Natural cattle were included. Purchase prices were standardized by using a weekly feeder cattle index with a five cent slide up or down from 750 pounds. All other data was taken from the actual closeout and grid information. Cattle closed out during each month were categorized into three groups (Low, Middle, High) by profit. This allowed for some standardization in seasonal differences in feed costs and fed cattle markets. During the six year period, ration prices more than doubled from $153/ton to $315/ton and fed cattle prices ranged from $75/cwt to $100/cwt on a live basis. A summary of the data sorted by profit level is presented in the table below. One of the most notable trends is that the higher the profit group, the more total weight was gained in about the same amount of time (days on feed) resulting in significant differences in average daily gain. Differences were also evident on the carcass side as well. Since the cattle were marketed on a carcass weight basis, there was a strong trend for heavier average carcass weight as profit increased. The same was true for percentage grading Choice or higher and also percentage of CAB or upper two-thirds Choice branded premium carcasses. High profit lots had fewer Yield Grade 1 and 2 carcasses. ...continued on page 2 |
|||
|
|
Profit Profile |
||
|
|
Low |
Middle |
High |
|
Placement Weight, lbs. |
736 |
729 |
719 |
|
Live Finish Weight, lbs. |
1,270 |
1,290 |
1,311 |
|
Days on Feed |
181.4 |
181.3 |
181.6 |
|
Feedlot Gain, lbs. |
501 |
559 |
591 |
|
Ave. Daily Gain, lbs. |
2.80 |
3.13 |
3.31 |
|
Yield, % |
63.86 |
64.11 |
64.00 |
|
Ave. Carcass Wt., lbs. |
811 |
827 |
839 |
|
Choice or Higher, % |
49.38 |
51.66 |
56.20 |
|
CAB or Upper 2/3 Choice Premium, % |
9.60 |
10.88 |
12.28 |
|
YG 1 & 2, % |
51.75 |
51.47 |
46.54 |
|
YG 3, % |
37.24 |
36.41 |
40.50 |
|
YG 4 & 5, % |
11.01 |
12.12 |
12.96 |
|
Calculated Profit/Loss, $/head |
-39.15 |
27.90 |
90.26 |
Reproduction of any part of this newsletter is expressly forbidden without written permission of U.S. Premium Beef.
|
How Profit Relates to Feeding and Grid... |
continued from page 1 |
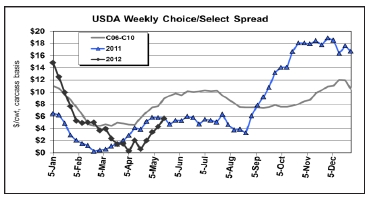
upon profitability when marketing on a grid. The lots with higher profit had greater Quality Grade and were harvested at a fatter endpoint and all other benefits outweighed any Yield Grade discounts. Since this analysis was done, USPB premiums have been at record high levels. Therefore, the grid rewards are even greater today. We don’t collect closeout information to accurately know feedlot performance and profit; however, we can calculate total feedlot gain and apparent daily gain from in weights. In fourteen years, total feedlot gain of USPB steers has increased by 90 pounds and apparent average daily gain was record high during the 2011 delivery year. Next month we will look at another set of real world data analyzed by Kansas State animal scientist, Dr. Chris Reinhardt, on more than 17,000 head of individual Angus steers fed at a single feedyard.♦ USDA’s Choice/Select Spread Widens Seasonally
FY 2012 Annual Meeting Set For March 26, 2013 As a result of moving the company’s fiscal year to a calendar year, U.S. Premium Beef’s fiscal year 2012 annual meeting will be conducted in Kansas City, MO, at the Kansas City Airport Hilton on March 26, 2013. A pre-annual meeting reception will be held on the evening of March 25 at the Airport Hilton. Watch upcoming UPDATES for more information on the annual meeting.♦ |
|
The percentage of Yield Grade 4 and 5 carcasses actually increased slightly as profit increased. In general, the High profit cattle were fatter. This trend is also evident when we sort USPB lots by premium. The USPB lots with higher premiums also have more Yield Grade 4 and 5 carcasses and fewer Yield Grade 1 and 2 carcasses. Incidentally, the PCC High profit group had the greatest percentage of Yield Grade 3 carcasses. Likewise, USPB has reported a very strong relationship between a high Yield Grade 3 percentage, greater Quality Grade and higher premiums. It is possible that more of the PCC cattle in the High profit lots were sorted for greater uniformity when marketed. In the complete report which you can read at www.us-premiumbeef.com/Briansblog.aspx, the authors also report additional sorts, or third-group profiles, in addition to sorting by profit. Sorting by level of Choice or higher percentage reinforces the fact that as Quality Grade increases, so does total gain, average daily gain and carcass weight. Days on feed and in weight did not differ. However, percentage of Yield Grade 1 and 2 carcasses decreased and Yield Grade 4 and 5 percentage increased as Quality increased. Yet, profit still increased by $17.18 per head as Quality increased from the Low to the High Quality group. Sorting by average daily gain further reinforced its strong relationship with profit. As daily gain increased, Quality Grade also increased, as did carcass weight and Yield Grade. Dressing percentage, or yield, decreased. However, profit increased by $41.08 per head from the Low to the High gaining group. The data was also sorted into average carcass weight third-groups. As carcass weight increased, placement weight and gains increased. Quality Grade increased slightly and Yield Grade also increased as hot weight increased. Since all lots were sold on a carcass basis, profit increased by $31.92 from the Low to the High carcass weight group. In the complete report the authors also illustrate in more detail how daily gain differences were even more pronounced and impactful upon profit during the more recent years when feed costs have been higher. Likewise, interactions have occurred with placement weight over the years as feed costs have changed. Overall, this real-world data shows the importance of feedlot performance, specifically daily gain and carcass weight, |
||