Attached files
| file | filename |
|---|---|
| 8-K - FORM 8-K - U.S. SILICA HOLDINGS, INC. | d353246d8k.htm |
 Investor Presentation
May 2012
U.S. Silica
U.S. Silica
Exhibit 99.1 |
 Disclaimers
This presentation contains forward-looking statements that reflect, when made,
our current views with respect to current events and financial performance.
Such forward- looking statements are subject to many risks, uncertainties
and factors relating to our operations and business environment, which may
cause our actual results to be materially different from any future results,
express or implied, by such forward-looking statements. All statements
that address future operating, financial or business performance or our
strategies or expectations are forward-looking statements. In some
cases, you can identify these statements by forward-looking words such as
“may,” “might,”
“will,”
“should,”
“expects,”
“plans,”
“anticipates,”
“believes,”
“estimates,”
“predicts,”
“projects,”
“potential,”
“outlook”
or “continue,”
and other comparable
terminology. Factors that could cause actual results to differ materially from
these forward-looking statements include, but are not limited to, those
discussed in our filings with the Securities and Exchange Commission,
including our most recent annual report on Form 10-K and our quarterly
reports on Form 10-Q. New risks and uncertainties arise from time
to time, and it is impossible for us to predict these events or how they
may
affect
us.
We
disclaim
any
intention
or
obligation
to
update
or
revise
any
forward-
looking statements, whether as a result of new information, future events and/or
otherwise, except to the extent required by law.
This presentation includes certain non-GAAP financial measures, including
Adjusted EBITDA and Total Segment Contribution Margin. For a
reconciliation of such measures to
the
most
directly
comparable
GAAP
term,
please
see
Appendix
A
to
this
presentation.
2 |
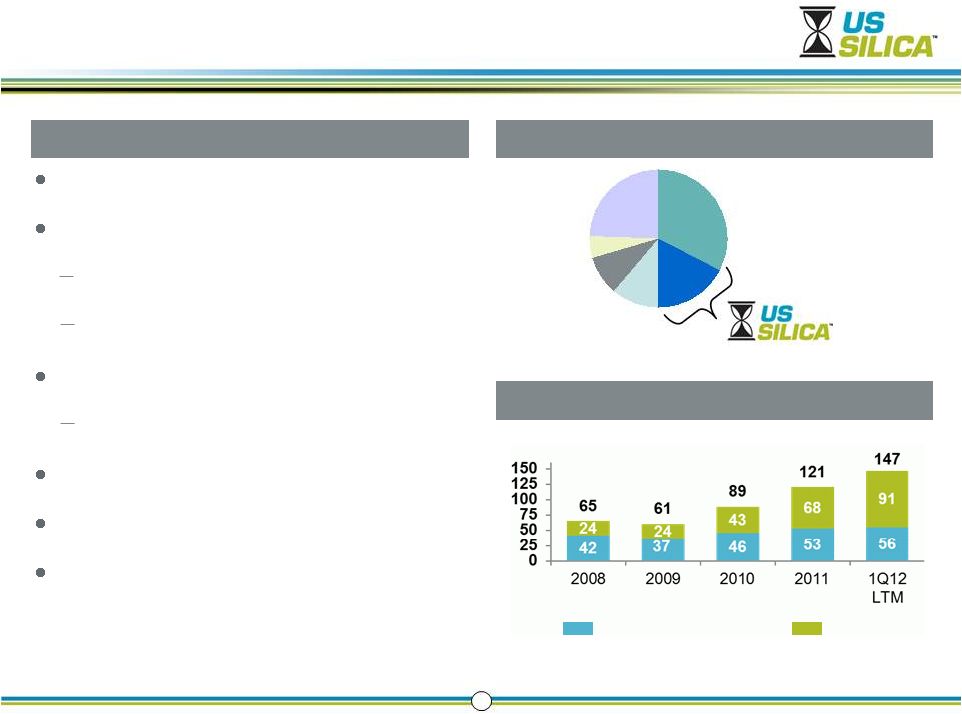 U.S.
Silica is Attractively Positioned Leading industrial minerals supplier
Over 200 products and 1,400 customers
Oil & Gas Proppants: Frac sand
Industrial & Specialty: Glass, coatings, foundry
13 facilities, many over 100 years old
Flagship Ottawa site home of ‘Ottawa White’
315 million tons of high quality reserves
6.3 million tons sold in 2011
LTM revenues of $334 million and LTM adjusted
EBITDA of $114 million
(1)
3
Company Profile
(1)
See Appendix A for EBITDA reconciliation
(2)
Totals may not equal segments due to rounding
(3)
Includes combined results for our predecessors
Commercial Silica Market Share
Segment
Contribution
Margin
(2)
($MM)
(3)
Industrial and Specialty
Oil and Gas
Source:
Company Estimates
Other |
 4
Rapid Demand
Growth
Shale drilling has revolutionized U.S. energy supply
Proppant volume demand growing faster than shale drilling activity
Supply is
Constrained
Large API spec reserves and permission to operate are barriers to
entry Complex logistics and industrial end markets are barriers to
success Sustainable
Competitive
Advantages
147 million tons of API spec frac sand reserves
Integrated supply chain with access to all major shale basins
Significant cost advantage due to heritage infrastructure
Line of Site
Organic Growth
55% projected frac sand capacity growth in 2012, with several take-or-pay
contracts New resin coated sand (“RCS”) facility targeted for 1Q
2013 Additional greenfield raw sand facility targeted for 2Q 2013
Leadership and Growth in a Transformative Market |
 (MM
Tons) Year End Rig Count
Frac Sand Demand Outstrips Drilling Activity
5
Horizontal
Rig Count
Wells
per Rig
Stages per
Lateral
Proppant Demand
Proppant
per Stage
2.0x
North America Horizontal Drilling Rig Count
Oil and Gas Silica Consumption
Technology Enabled
Lateral
Length
Rig count: Baker Hughes; Consumption: For 2009, USGS, for 2010, internal estimates compiled through
consultation with third parties and management
Source:
|
 New
Projects Face High Hurdles 6
Sphericity, solubility,
size, crush strength
(14 API specifications)
Large-Scale High
Quality Reserves
Rail access to
major basins
Long approval
process (1 –
3 years)
Federal / state / local
mining, air, water,
reclamation permits
Premium on know-
how and expertise
Logistics and
On-Site
Infrastructure
Permission
and
Experience to
Operate
Diversified
Customers
Ability
to “spec-in”
to industrial
customer
production
processes
High
Quality,
Cost
Effective
Supply
Barriers to Entry
Barriers to Success |
 Supply redundancy
Low transportation costs
Single source supplier
Spec’d in to customer formulas
Low customer turnover
U.S. Silica Advantages
Irreplaceable Industrial & Specialty Market Position
7
Growth Drivers
GDP growth
Pricing
New products and innovation
Geographic expansion
Age of
Relationship
USS
Locations
Customer
Locations
Avg. Ship
Distance
(Mi)
Logistics Complexity
>90 Years
>40 Years
>50 Years
>75 Years
>20 Years
6
5
5
5
4
5
8
243
10
7
7
7
11
648
241
145
172
266
Average
>55 Years |
 Railroad access on BNSF,
Union Pacific, CN, and CSX
Barge access
13 in-basin transloads
Transportation Assets
Differentiated Footprint and Logistics Capability
8
Scale
Reliability
Flexibility
Cost effectiveness
U.S. Silica Advantages
Right Product, Right Place, Right Time |
 9
Plant Production Cost Per Ton
(1)
U.S. Silica Primary Frac Plants vs. New Project
Royalties
Lack of onsite
rail
Yield loss due to
lack of industrial
customers
Scale
(%)
Adjusted EBITDA Margin
Source:
Company Estimates
(1)
Excludes delivery costs
(2)
Represents the U.S. Silica four principal plants used for frac sand, and excludes
the other facilities, which have higher plant production costs (3)
Assumes new projects are built for frac sand product
(3)
(2)
Structural Cost Advantage Within Industry
USS (Primary Frac Sand
Plants)
Estimated New Project
40
30
20
10
0
2008
2009
2010
2011
1Q12
LTM
21.2
26.1
29.5
31.7
34.1 |
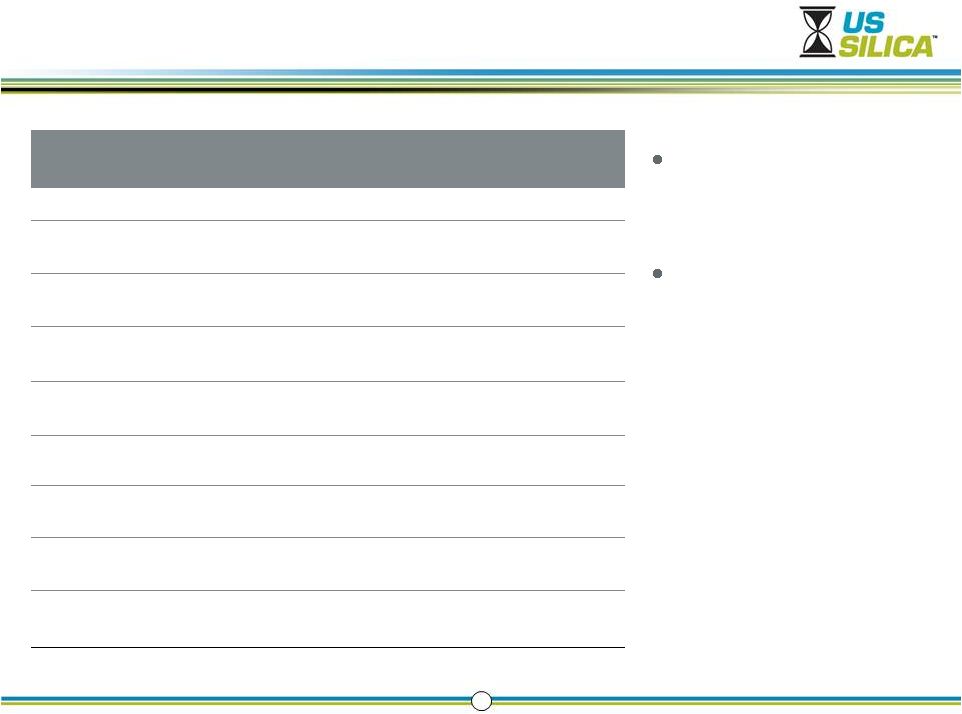
 Line-of-Sight Oil & Gas Organic Growth Elements
10
Initiatives
Description
2012: Incremental
Frac Sand Capacity
Expansion
1.1 million ton expansion at
the Ottawa, IL and Rockwood,
MI plants, with several take-
or-pay contracts
Construction complete
1Q 2013:
Rochelle Resin-
Coated Proppant
Product and process
development underway
Startup 1Q13
2Q 2013: Sparta
Greenfield Mine
Construction began 2Q12
Startup 2Q13
38M coarse, northern white
reserves
(1)
Assumes
same
margin
as
for
existing
1Q12
LTM
Oil
&
Gas.
Calculated
assuming
that
the
additional
capacity
had
been
in
place
since
April
1,
2011
and
assuming
that
all
of
it
was
sold
and that such capacity achieved the same margins as existing capacity. Actual
results could differ materially based on (i) our ability to sell all such capacity at comparable prices and (ii)
our ability to achieve comparable margins on such additional capacity. In addition,
future results are likely to differ from results in prior periods U.S. Silica
Execution of High Return Frac Projects New Frac Sand Tons (MM)
1.1
1Q12 LTM O & G Contribution Margin
$40.28 / ton
1Q12
LTM
Implied
Additional
Contribution
Margin
(1)
$44MM
Estimated Project Capital Expenditures
~$50-
60MM
U.S. Silica Implied Payback Period
~1.3 Years
2012E Oil and Gas Proppants Production Growth
(MM tons)
Potential Future
Initiatives
(2013+)
Phase II of resin coating
expansion
Phase II of Sparta greenfield
project
Additional Wisconsin
greenfield projects
International growth
55% Oil and
Gas Proppants
Growth
Frac Sand
Expansions
2011
2012E
3.5
2.5
1.5
0.5
2.0
1.1
3.1 |
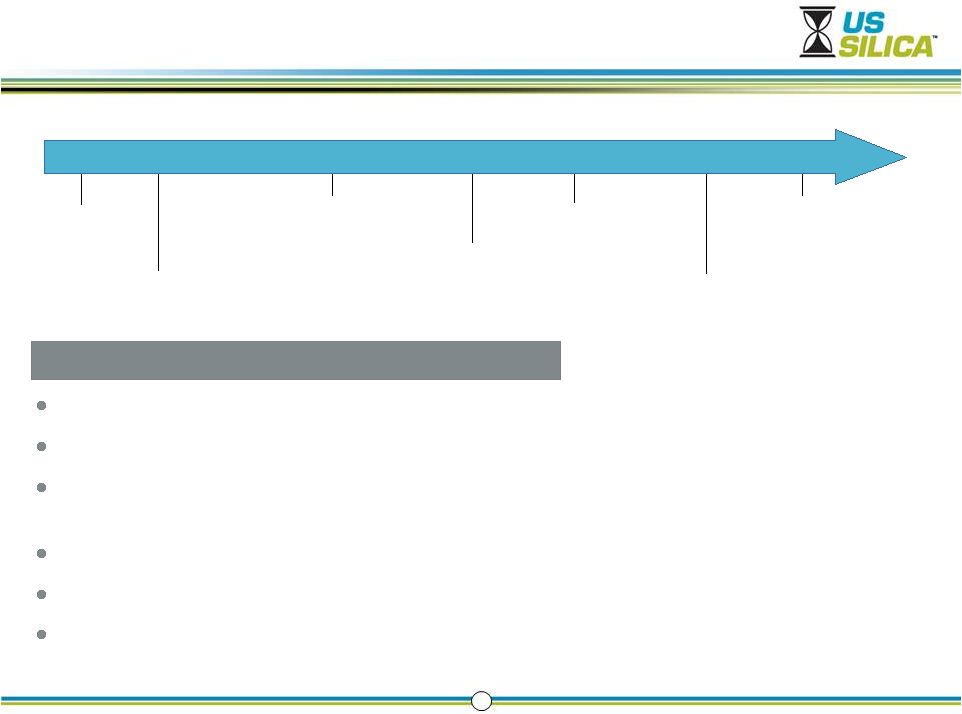
 Entry
into Resin-Coating 11
U.S. Silica RCS Positioning
Experienced, best-in-class team
Access to high quality coarse substrate required for oil and
liquid rich basins
Flexible, vertically integrated production
Access to two class one railroads and barging for outbound
shipping
Ability to double production capacity of plant
All Permits
Received
1Q12
Site Development and
Begin Construction
1Q12
Start Up
1Q2013
Phase II?
2013 / 2014
Break Ground
4Q11
Product
Testing
2Q12/3Q12
Illustrative Project Timeline
Phase 1 Capacity: 200,000 tons
Phase 1 Capital: $42-$44 million |
 New
Plant in Sparta, Wisconsin 12
U.S. Silica Sparta Positions
Experienced, best-in-class management team
Over 38M tons of coarse, northern white reserves
Received all necessary permitting to begin construction in
January 2012
Board of Directors approved construction of facility
Direct access to class one railroad
Facility designed with scalability to cost effectively increase
capacity in the future
All Permits
Received
3Q12
Site Development and
Begin Construction
2Q12
Start Up
2Q13
Phase II
2013 / 2014
Long Lead Time
Items Ordered
1Q12
Dredge
Operation
Begins
3Q12
Illustrative Project Timeline
Phase 1 Capacity: 750-850 ktons
Phase 1 Capital: $50-$60 million
Land Acquired
4Q11 |
 Historical Financial Summary
13
($MM)
Adjusted EBITDA
(2)
($MM)
Volume
(1)
Revenue
(1)
Capital Expenditures
Industrial and Specialty
Oil and Gas
($MM)
(MM Tons)
(1)
Totals may not equal segments due to rounding
(2)
See Appendix A for EBITDA reconciliation |
 Low
End Guidance
First Quarter 2012 Performance and Momentum
14
Revenue
(1)
($MM)
Adjusted EBITDA and Margin
(1) (2)
($MM)
Net Income
($MM)
Today
Momentum
Revenue growth with mix shift to higher margin
oil and gas segment
Strong EBITDA growth and expanding margins
Sharply accelerating net income growth
55%+ expansion in oil and gas capacity
(19%+ expansion in total capacity)
Continued mix shift to oil and gas with
contribution margins >60%
RCS start up in 1Q 2013
Sparta start up in 2Q 2013
(1)
Figures presented for 2012 Forecast represents the low end of guidance; no guidance
has been provided for 2012 FY Adjusted EBITDA Margin (2)
For full list of adjustments please see EBITDA bridge in Appendix A
(%)
Margin
Revenue
High End
Guidance
EBITDA
Low End
Guidance
High End
Guidance |
 Strong Balance Sheet to Fund Growth Initiatives
15
Summary Capitalization
(US$ in thousands)
3/31/2012
12/31/2011
Cash and Cash Equivalents
$ 84,641
$ 59,199
Asset-Based Revolving
Line-of-Credit
–
–
Term Loan Facility
258,050
258,700
Other Borrowings
3,932
3,932
Total Debt
261,982
262,632
Net Debt
177,341
203,433
Leverage (Debt/Adj EBITDA)
(1)
2.3x
2.8x
Net Leverage (Net Debt/Adj EBITDA)
(1)
1.6x
2.2x
$24.0MM capacity under
asset-based revolving
line-of-credit
Total adjusted liquidity of
~$108.6MM for growth
initiatives as of March 31,
2012
(1)
Leverage and Net Leverage as of March 31, 2012 is calculated using LTM Adj EBITDA
as of the reporting date |
 16
Leadership and Growth in a Transformative Market
Rapid Demand Growth
Proppant demand growth outpacing
unprecedented shale drilling activity
Supply is Constrained
Barriers to entry and success will
continue to limit new capacity
Sustainable Competitive Advantages
Scale, asset efficiency and logistics
infrastructure create advantaged position
Line of Site Organic Growth
Near-term, high return growth projects
with excellent probability of success |
 Appendix A
 |
 Reconciliation (Adjusted EBITDA to Net Income)
18
Reconciliation of Adjusted EBITDA
$ in thousands
Three Months Ended
March 31, 2012
LTM
March 31, 2012
Net Income
19,113
45,856
Total Interest Expense, Net of Interest Income
3,763
16,669
Provisions of Taxes (Benefit)
7,032
12,547
Total Depreciation, Depletion and Amortization Expenses
5,978
21,888
EBITDA
35,886
96,960
Non-Cash
Deductions,
Losses
and
Charges
(1)
-
(526)
Non-Recurring
Expenses
(Income)
(2)
(439)
(2,467)
Transaction
Expenses
(3)
156
6,199
Permitted
Management
Fees
and
Expenses
(4)
-
8,937
Non-Cash
Incentive
Compensation
(5)
654
1,795
Post-Employment
Expenses
(Excluding
Service
Costs)
(6)
605
1,666
Other
Adjustments
Allowable
Under
Existing
Credit
Agreements
(7)
125
1,251
Adjusted EBITDA
36,987
113,815
See following page for explanation of adjustments to EBITDA
|
 Reconciliation (Adjusted EBITDA to Net Income)
19
(1)
Includes non-cash deductions, losses and charges arising from adjustments to estimates of a
future litigation liability.
(2)
Includes the gain on the sale of assets and non-recurring expenses related to a former
insurer’s
liquidation.
(3)
Includes fees and expenses related to amendments of our Term Loan Facility and ABL Facility. (4)
Includes fees and expense paid to Golden Gate Capital for ongoing consulting and management
services provided pursuant to an Advisory Agreement entered into in connection with Golden Gate
Capital Acquisition.
(5)
Includes vesting of incentive equity compensation issued to our employees. (6)
Includes costs relating to pension and other post-retirement benefit obligations during the
applicable period, but in each case excluding the service cost relating to benefits earned
during such period.
(7)
Reflects miscellaneous adjustments permitted under our existing credit agreements, including such
items as expenses related to reviewing potential acquisitions and costs associated with
relocating the corporate headquarters. |
 Non-GAAP Financial Performance Measures
20
Segment
Contribution
Margin
Adjusted EBITDA
The Company organizes its business into two reportable segments, Oil & Gas Proppants and
Industrial & Specialty Products, based on end markets. The reportable segments are
consistent with how management views the markets served by the Company and the financial
information reviewed by the chief operating decision maker. The Company manages its Oil &
Gas Proppants and Industrial & Specialty Products businesses as components of an enterprise for
which separate information is available and is evaluated regularly by the chief operating decision
maker in deciding how to allocate resources and assess performance.
An operating segment’s performance is primarily evaluated based on segment contribution margin,
which excludes certain corporate costs not associated with the operations of the segment. These
corporate costs are separately stated below and include costs that are related to functional
areas such as operations management, corporate purchasing, accounting, treasury, information
technology, legal and human resources. The Company believes that segment contribution margin,
as defined above, is an appropriate measure for evaluating the operating performance of its
segments. However, this measure should be considered in addition to, not a substitute for, or superior to,
income from operations or other measures of financial performance prepared in accordance with
generally accepted accounting principles.
Adjusted EBITDA is not a measure of our financial performance or liquidity under GAAP and should not
be considered as an alternative to net income as a measure of operating performance, cash flows
from operating activities as a measure of liquidity or any other performance measure derived in
accordance with GAAP. Additionally, Adjusted EBITDA is not intended to be a measure of free
cash flow for management’s discretionary use, as it does not consider certain cash
requirements such as interest payments, tax payments and debt service requirements. Adjusted
EBITDA contains certain other limitations, including the failure to reflect our cash expenditures, cash
requirements for working capital needs and cash costs to replace assets being depreciated and
amortized, and excludes certain non-recurring charges that may recur in the future.
Management compensates for these limitations by relying primarily on our GAAP results and by
using Adjusted EBITDA only as a supplement. Our measure of Adjusted EBITDA is not necessarily
comparable to other similarly titled captions of other companies due to potential
inconsistencies in the methods of calculation.
|