Attached files
| file | filename |
|---|---|
| 8-K - 8-K - Rouse Properties, LLC | a12-12283_18k.htm |
| EX-99.1 - EX-99.1 - Rouse Properties, LLC | a12-12283_1ex99d1.htm |
Exhibit 99.2
|
|
Supplemental Information for the Quarter Ended March 31, 2012 |
|
|
Q1 2012 Supplemental Package 1 Basis of Presentation Background Rouse is a publicly traded real estate investment trust (REIT) focused on the management, redevelopment, repositioning and acquisition of regional malls and the portfolio consists of 31 geographically diverse enclosed malls, encompassing approximately 22 million square feet in 19 states. On January 12, 2012, General Growth Properties, Inc. (NYSE: GGP) completed the spin-off of Rouse Properties, Inc. (NYSE: RSE) through the distribution of shares of Rouse common stock to holders of GGP common stock. General Information Unless the context indicates otherwise, references in the accompanying financial information (the "Supplemental") to the "Corporation", "Rouse", or the "Company" refer to Rouse Properties Inc. Additionally, where reference is made to "GAAP", this refers to accounting principles generally accepted in the United States. Non-GAAP Measures The Company makes reference to net operating income (“NOI”) and funds from operations (“FFO”). NOI is defined as operating revenues (minimum rents, including lease termination fees, tenant recoveries, overage rents, and other income) less property and related expenses (real estate taxes, repairs and maintenance, marketing, other property operating costs, and provision for doubtful accounts). We use FFO, as defined by the National Association of Real Estate Investment Trusts, as a supplemental measure for our operating performance. FFO is defined as net income (loss) attributable to common stockholders in accordance with GAAP, excluding impairment write-downs on depreciable real estate, gains (or losses) from cumulative effects of accounting changes, extraordinary items and sales of properties, plus real estate related depreciation and amortization. In order to present operations in a manner most relevant to its future operations, Core FFO and Core NOI have been presented to exclude certain non-cash and non-recurring revenue and expenses. A reconciliation of NOI to Core NOI and FFO to Core FFO has been included in the "Reconciliation of Core NOI and Core FFO" schedule included within. NOI, FFO and derivations thereof, are not alternatives to GAAP operating income (loss) or net income (loss) available to common stockholders. For reference, as an aid in understanding management's computation of NOI and FFO, a reconciliation of NOI to operating income and FFO to net income (loss) in accordance with GAAP has been included in the "Reconciliation of Non-GAAP to GAAP Financial Measures" schedule. |
|
|
Q1 2012 Supplemental Package 2 Table of Contents The presentation contains forward-looking statements. Actual results may differ materially from the results suggested by these forward-looking statements, for a number of reasons. Readers are referred to the documents filed by Rouse Properties, Inc. with the Securities and Exchange Commission, which further identify the important risk factors which could cause actual results to differ materially from the forward-looking statements in the Supplemental. The Company disclaims any obligation to update any forward-looking statements. Company Information 3 Financial Overview Consolidated and Combined Balance Sheets 4 Consolidated and Combined Statements of Operations 5 Financial Schedules Reconciliation of Core NOI and Core FFO 6 Core NOI Summary 7 Reconciliation of Non-GAAP to GAAP Financial Measures 8 Mortgages, Notes and Loans Payable 9 Prepaid Expenses and Other Assets & Accounts Payable and Accrued Expenses 10 Portfolio Operating Metrics Key Operating Performance Indicators 11 Summary of Properties 12 Lease Expiration and Top Ten Tenants 13 Leasing Activity 14 Glossary of Terms 15 |
|
|
Q1 2012 Supplemental Package 3 Company Information Company Contacts Andrew Silberfein Benjamin Schall Rael Diamond Brian Harper Brad Cohen / Nikki Sacks Chief Executive Officer Chief Operating Officer Chief Financial Officer Executive Vice President, Leasing ICR, Investor Relations and Communications (212) 608.5108 IR@rouseproperties.com Dividend The Board of Directors declared a common stock dividend of $0.07 per share payable on July 30, 2012 to stockholders of record on July 16, 2012. Common Share Trading Statistics Period Ended (1) March 31, 2012 High 14.81 $ Low 10.70 $ Close 13.54 $ Volume 30,825,189 (1) Excludes trading on a when issued basis. Shares Outstanding March 31, 2012 March 31, 2011 Common shares outstanding 49,214,511 35,546,639 Class B common shares outstanding 359,056 359,056 49,573,567 35,905,695 Unexercised options 1,615,986 - Common shares outstanding - fully diluted 51,189,553 35,905,695 Weighted average common shares outstanding - basic (2) 36,785,376 35,905,695 Weighted average common shares outstanding - diluted (2) 36,785,376 35,905,695 (2) Calculated in accordance with US GAAP. |
|
|
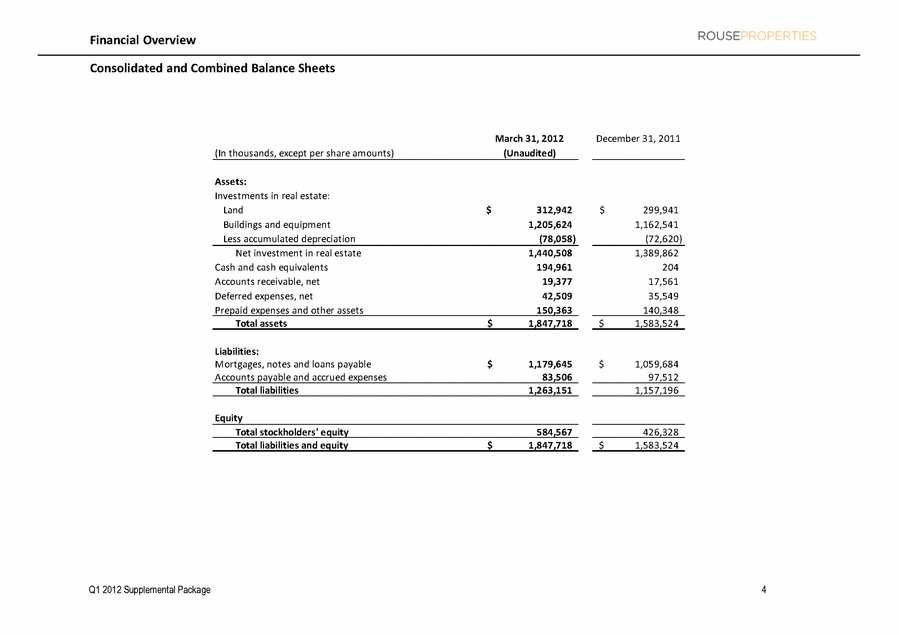
Q1 2012 Supplemental Package 4 Consolidated and Combined Balance Sheets Financial Overview March 31, 2012 December 31, 2011 (In thousands, except per share amounts) (Unaudited) Assets: Investments in real estate: Land 312,942 $ 299,941 $ Buildings and equipment 1,205,624 1,162,541 Less accumulated depreciation (78,058) (72,620) Net investment in real estate 1,440,508 1,389,862 Cash and cash equivalents 194,961 204 Accounts receivable, net 19,377 17,561 Deferred expenses, net 42,509 35,549 Prepaid expenses and other assets 150,363 140,348 Total assets 1,847,718 $ 1,583,524 $ Liabilities: Mortgages, notes and loans payable 1,179,645 $ 1,059,684 $ Accounts payable and accrued expenses 83,506 97,512 Total liabilities 1,263,151 1,157,196 Equity Total stockholders' equity 584,567 426,328 Total liabilities and equity 1,847,718 $ 1,583,524 $ |
|
|
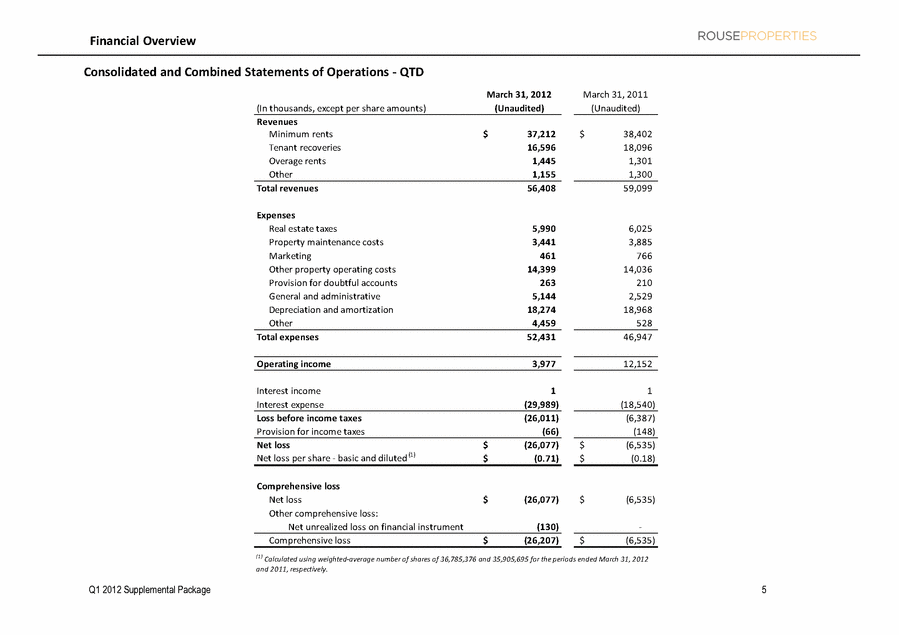
Q1 2012 Supplemental Package 5 Consolidated and Combined Statements of Operations - QTD Financial Overview March 31, 2012 March 31, 2011 (In thousands, except per share amounts) (Unaudited) (Unaudited) Revenues Minimum rents 37,212 $ 38,402 $ Tenant recoveries 16,596 18,096 Overage rents 1,445 1,301 Other 1,155 1,300 Total revenues 56,408 59,099 Expenses Real estate taxes 5,990 6,025 Property maintenance costs 3,441 3,885 Marketing 461 766 Other property operating costs 14,399 14,036 Provision for doubtful accounts 263 210 General and administrative 5,144 2,529 Depreciation and amortization 18,274 18,968 Other 4,459 528 Total expenses 52,431 46,947 Operating income 3,977 12,152 Interest income 1 1 Interest expense (29,989) (18,540) Loss before income taxes (26,011) (6,387) Provision for income taxes (66) (148) Net loss (26,077) $ (6,535) $ Net loss per share - basic and diluted (1) (0.71) $ (0.18) $ Comprehensive loss Net loss (26,077) $ (6,535) $ Other comprehensive loss: Net unrealized loss on financial instrument (130) - Comprehensive loss (26,207) $ (6,535) $ (1) Calculated using weighted-average number of shares of 36,785,376 and 35,905,695 for the periods ended March 31, 2012 and 2011, respectively. |
|
|
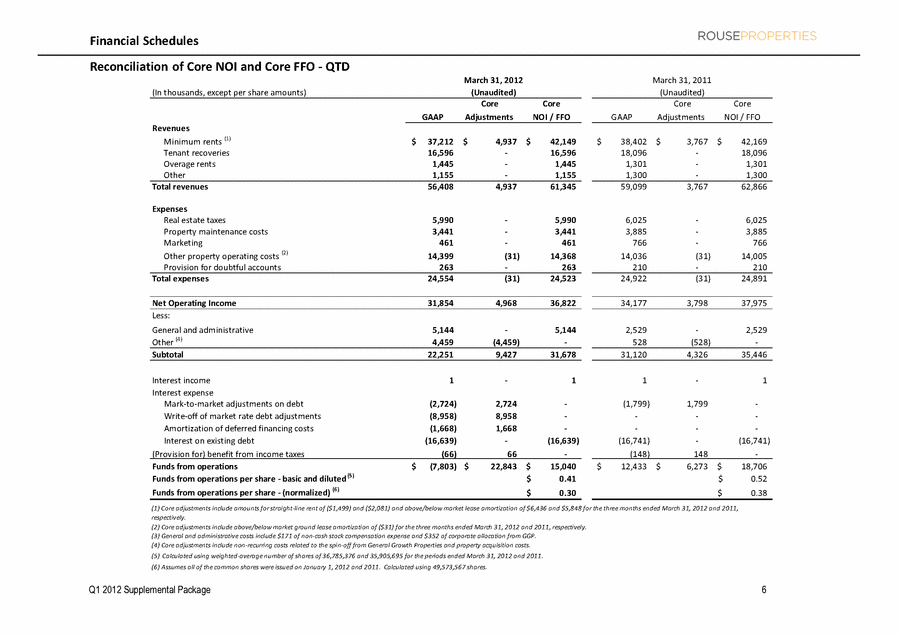
Q1 2012 Supplemental Package 6 Financial Schedules Reconciliation of Core NOI and Core FFO - QTD (In thousands, except per share amounts) Core Core Core Core GAAP Adjustments NOI / FFO GAAP Adjustments NOI / FFO Revenues Minimum rents (1) 37,212 $ 4,937 $ 42,149 $ 38,402 $ 3,767 $ 42,169 $ Tenant recoveries 16,596 - 16,596 18,096 - 18,096 Overage rents 1,445 - 1,445 1,301 - 1,301 Other 1,155 - 1,155 1,300 - 1,300 Total revenues 56,408 4,937 61,345 59,099 3,767 62,866 Expenses Real estate taxes 5,990 - 5,990 6,025 - 6,025 Property maintenance costs 3,441 - 3,441 3,885 - 3,885 Marketing 461 - 461 766 - 766 Other property operating costs (2) 14,399 (31) 14,368 14,036 (31) 14,005 Provision for doubtful accounts 263 - 263 210 - 210 Total expenses 24,554 (31) 24,523 24,922 (31) 24,891 Net Operating Income 31,854 4,968 36,822 34,177 3,798 37,975 Less: General and administrative 5,144 - 5,144 2,529 - 2,529 Other (4) 4,459 (4,459) - 528 (528) - Subtotal 22,251 9,427 31,678 31,120 4,326 35,446 Interest income 1 - 1 1 - 1 Interest expense Mark-to-market adjustments on debt (2,724) 2,724 - (1,799) 1,799 - Write-off of market rate debt adjustments (8,958) 8,958 - - - - Amortization of deferred financing costs (1,668) 1,668 - - - - Interest on existing debt (16,639) - (16,639) (16,741) - (16,741) (Provision for) benefit from income taxes (66) 66 - (148) 148 - Funds from operations (7,803) $ 22,843 $ 15,040 $ 12,433 $ 6,273 $ 18,706 $ Funds from operations per share - basic and diluted (5) 0.41 $ 0.52 $ Funds from operations per share - (normalized) (6) 0.30 $ 0.38 $ (2) Core adjustments include above/below market ground lease amortization of ($31) for the three months ended March 31, 2012 and 2011, respectively. (3) General and administrative costs include $171 of non-cash stock compensation expense and $352 of corporate allocation from GGP. (4) Core adjustments include non-recurring costs related to the spin-off from General Growth Properties and property acquisition costs. (5) Calculated using weighted-average number of shares of 36,785,376 and 35,905,695 for the periods ended March 31, 2012 and 2011. (6) Assumes all of the common shares were issued on January 1, 2012 and 2011. Calculated using 49,573,567 shares. March 31, 2012 March 31, 2011 (1) Core adjustments include amounts for straight-line rent of ($1,499) and ($2,081) and above/below market lease amortization of $6,436 and $5,848 for the three months ended March 31, 2012 and 2011, respectively. (Unaudited) (Unaudited) |
|
|
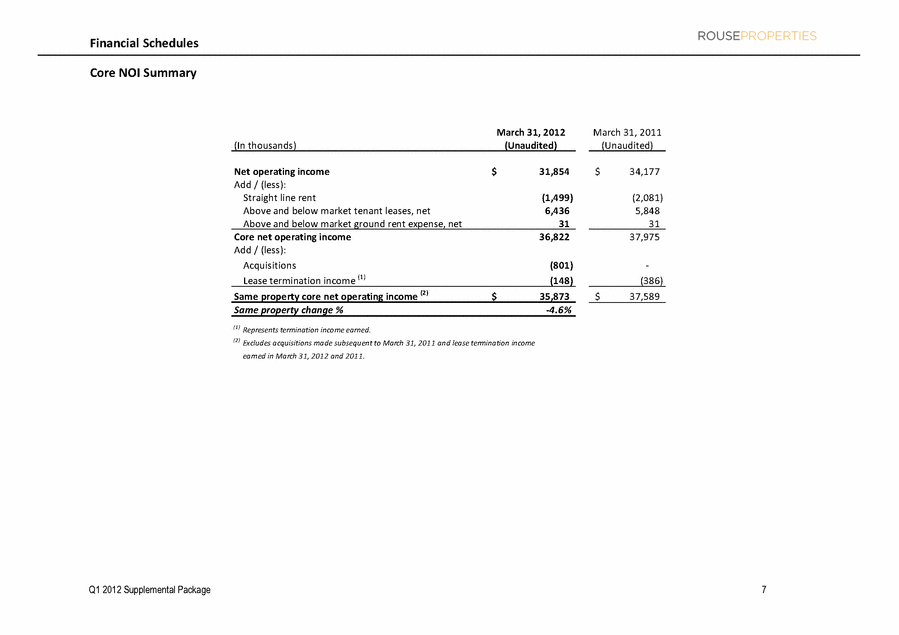
Q1 2012 Supplemental Package 7 Financial Schedules Core NOI Summary March 31, 2012 March 31, 2011 (In thousands) (Unaudited) (Unaudited) Net operating income 31,854 $ 34,177 $ Add / (less): Straight line rent (1,499) (2,081) Above and below market tenant leases, net 6,436 5,848 Above and below market ground rent expense, net 31 31 Core net operating income 36,822 37,975 Add / (less): Acquisitions (801) - Lease termination income (1) (148) (386) Same property core net operating income (2) 35,873 $ 37,589 $ Same property change % -4.6% (1) Represents termination income earned. (2) Excludes acquisitions made subsequent to March 31, 2011 and lease termination income earned in March 31, 2012 and 2011. |
|
|
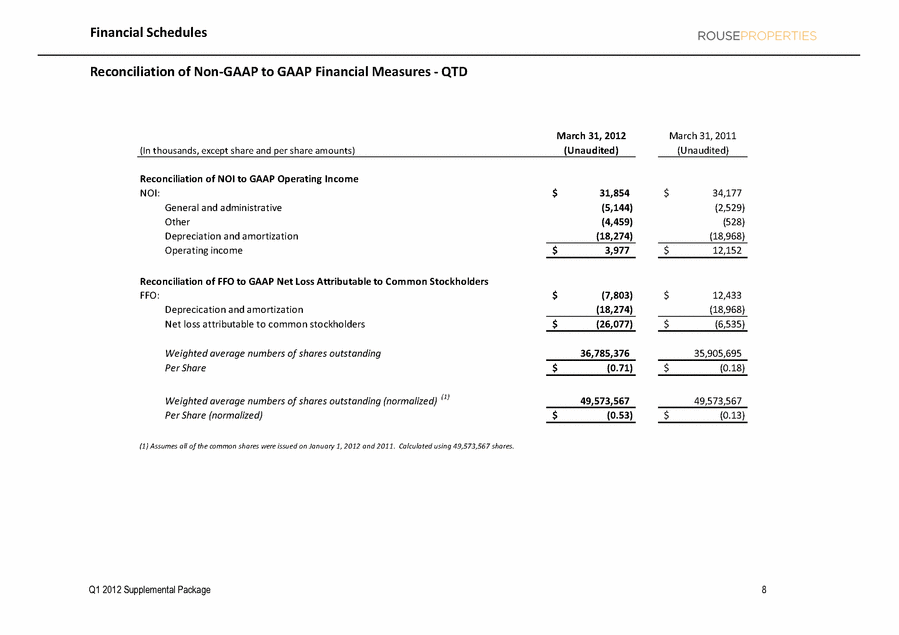
Q1 2012 Supplemental Package 8 Financial Schedules Reconciliation of Non-GAAP to GAAP Financial Measures - QTD March 31, 2012 March 31, 2011 (In thousands, except share and per share amounts) (Unaudited) (Unaudited) Reconciliation of NOI to GAAP Operating Income NOI: 31,854 $ 34,177 $ General and administrative (5,144) (2,529) Other (4,459) (528) Depreciation and amortization (18,274) (18,968) Operating income 3,977 $ 12,152 $ Reconciliation of FFO to GAAP Net Loss Attributable to Common Stockholders FFO: (7,803) $ 12,433 $ Deprecication and amortization (18,274) (18,968) Net loss attributable to common stockholders (26,077) $ (6,535) $ Weighted average numbers of shares outstanding 36,785,376 35,905,695 Per Share (0.71) $ (0.18) $ Weighted average numbers of shares outstanding (normalized) (1) 49,573,567 49,573,567 Per Share (normalized) (0.53) $ (0.13) $ (1) Assumes all of the common shares were issued on January 1, 2012 and 2011. Calculated using 49,573,567 shares. |
|
|
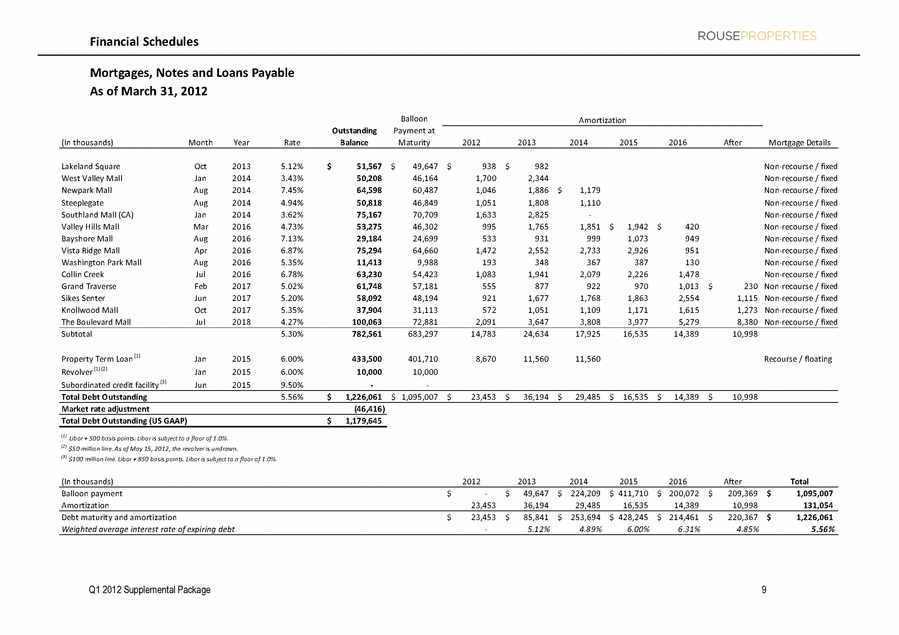
Q1 2012 Supplemental Package 9 Financial Schedules Mortgages, Notes and Loans Payable As of March 31, 2012 (In thousands) Month Year Rate 2012 2013 2014 2015 2016 After Mortgage Details Lakeland Square Oct 2013 5.12% 51,567 $ 49,647 $ 938 $ 982 $ Non-recourse / fixed West Valley Mall Jan 2014 3.43% 50,208 46,164 1,700 2,344 Non-recourse / fixed Newpark Mall Aug 2014 7.45% 64,598 60,487 1,046 1,886 1,179 $ Non-recourse / fixed Steeplegate Aug 2014 4.94% 50,818 46,849 1,051 1,808 1,110 Non-recourse / fixed Southland Mall (CA) Jan 2014 3.62% 75,167 70,709 1,633 2,825 - Non-recourse / fixed Valley Hills Mall Mar 2016 4.73% 53,275 46,302 995 1,765 1,851 1,942 $ 420 $ Non-recourse / fixed Bayshore Mall Aug 2016 7.13% 29,184 24,699 533 931 999 1,073 949 Non-recourse / fixed Vista Ridge Mall Apr 2016 6.87% 75,294 64,660 1,472 2,552 2,733 2,926 951 Non-recourse / fixed Washington Park Mall Aug 2016 5.35% 11,413 9,988 193 348 367 387 130 Non-recourse / fixed Collin Creek Jul 2016 6.78% 63,230 54,423 1,083 1,941 2,079 2,226 1,478 Non-recourse / fixed Grand Traverse Feb 2017 5.02% 61,748 57,181 555 877 922 970 1,013 230 $ Non-recourse / fixed Sikes Senter Jun 2017 5.20% 58,092 48,194 921 1,677 1,768 1,863 2,554 1,115 Non-recourse / fixed Knollwood Mall Oct 2017 5.35% 37,904 31,113 572 1,051 1,109 1,171 1,615 1,273 Non-recourse / fixed The Boulevard Mall Jul 2018 4.27% 100,063 72,881 2,091 3,647 3,808 3,977 5,279 8,380 Non-recourse / fixed Subtotal 5.30% 782,561 683,297 14,783 24,634 17,925 16,535 14,389 10,998 Property Term Loan (1) Jan 2015 6.00% 433,500 401,710 8,670 11,560 11,560 Recourse / floating Revolver (1) (2) Jan 2015 6.00% 10,000 10,000 Subordinated credit facility (3) Jun 2015 9.50% - - Total Debt Outstanding 5.56% 1,226,061 $ 1,095,007 $ 23,453 $ 36,194 $ 29,485 $ 16,535 $ 14,389 $ 10,998 $ Market rate adjustment (46,416) Total Debt Outstanding (US GAAP) 1,179,645 $ (1) Libor + 500 basis points. Libor is subject to a floor of 1.0%. (2) $50 million line. As of May 15, 2012, the revolver is undrawn. (3) $100 million line. Libor + 850 basis points. Libor is subject to a floor of 1.0%. (In thousands) 2012 2013 2014 2015 2016 After Total Balloon payment - $ 49,647 $ 224,209 $ 411,710 $ 200,072 $ 209,369 $ 1,095,007 $ Amortization 23,453 36,194 29,485 16,535 14,389 10,998 131,054 Debt maturity and amortization 23,453 $ 85,841 $ 253,694 $ 428,245 $ 214,461 $ 220,367 $ 1,226,061 $ Weighted average interest rate of expiring debt - 5.12% 4.89% 6.00% 6.31% 4.85% 5.56% Amortization Outstanding Balance Balloon Payment at Maturity |
|
|
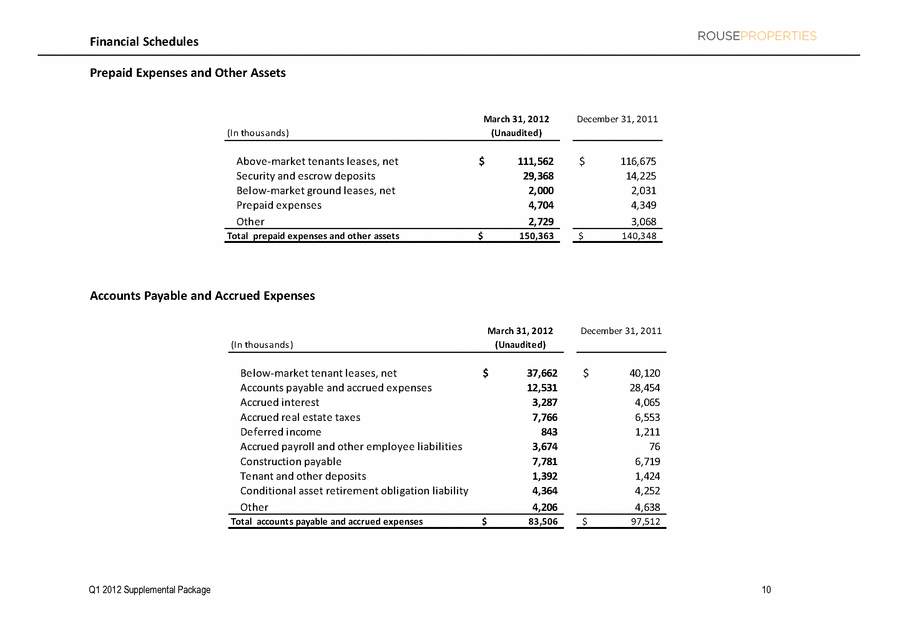
Q1 2012 Supplemental Package 10 Financial Schedules Prepaid Expenses and Other Assets Accounts Payable and Accrued Expenses March 31, 2012 December 31, 2011 (In thousands) (Unaudited) Above-market tenants leases, net 111,562 $ 116,675 $ Security and escrow deposits 29,368 14,225 Below-market ground leases, net 2,000 2,031 Prepaid expenses 4,704 4,349 Other 2,729 3,068 Total prepaid expenses and other assets 150,363 $ 140,348 $ March 31, 2012 December 31, 2011 (In thousands) (Unaudited) Below-market tenant leases, net 37,662 $ 40,120 $ Accounts payable and accrued expenses 12,531 28,454 Accrued interest 3,287 4,065 Accrued real estate taxes 7,766 6,553 Deferred income 843 1,211 Accrued payroll and other employee liabilities 3,674 76 Construction payable 7,781 6,719 Tenant and other deposits 1,392 1,424 Conditional asset retirement obligation liability 4,364 4,252 Other 4,206 4,638 Total accounts payable and accrued expenses 83,506 $ 97,512 $ |
|
|
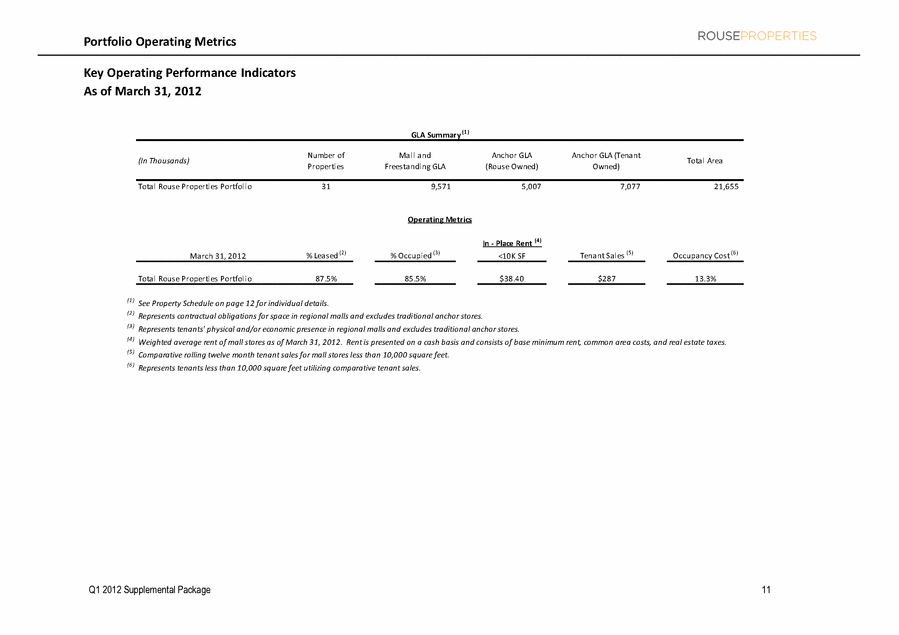
Q1 2012 Supplemental Package 11 Portfolio Operating Metrics Key Operating Performance Indicators (In Thousands) Number of Properties Mall and Freestanding GLA Anchor GLA (Rouse Owned) Anchor GLA (Tenant Owned) Total Area Total Rouse Properties Portfolio 31 9,571 5,007 7,077 21,655 In - Place Rent (4) March 31, 2012 % Leased (2) % Occupied (3) <10K SF Tenant Sales (5) Occupancy Cost (6) Total Rouse Properties Portfolio 87.5% 85.5% $38.40 $287 13.3% (1) See Property Schedule on page 12 for individual details. (2) Represents contractual obligations for space in regional malls and excludes traditional anchor stores. (3) Represents tenants' physical and/or economic presence in regional malls and excludes traditional anchor stores. (4) Weighted average rent of mall stores as of March 31, 2012. Rent is presented on a cash basis and consists of base minimum rent, common area costs, and real estate taxes. (5) Comparative rolling twelve month tenant sales for mall stores less than 10,000 square feet. (6) Represents tenants less than 10,000 square feet utilizing comparative tenant sales. GLA Summary (1) Operating Metrics As of March 31, 2012 |
|
|
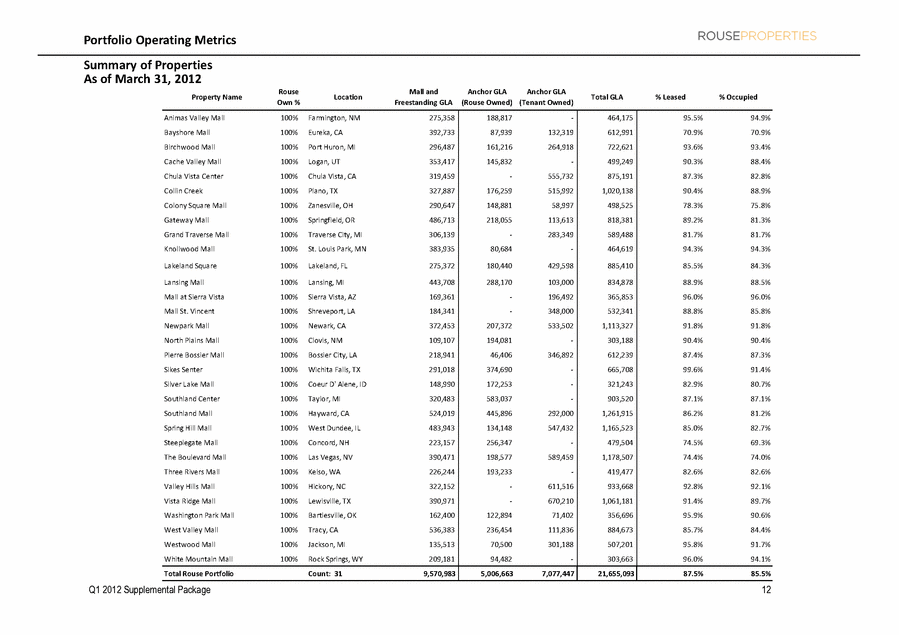
Q1 2012 Supplemental Package 12 Portfolio Operating Metrics Summary of Properties Property Name Rouse Own % Location Mall and Freestanding GLA Anchor GLA (Rouse Owned) Anchor GLA (Tenant Owned) Total GLA % Leased % Occupied Animas Valley Mall 100% Farmington, NM 275,358 188,817 - 464,175 95.5% 94.9% Bayshore Mall 100% Eureka, CA 392,733 87,939 132,319 612,991 70.9% 70.9% Birchwood Mall 100% Port Huron, MI 296,487 161,216 264,918 722,621 93.6% 93.4% Cache Valley Mall 100% Logan, UT 353,417 145,832 - 499,249 90.3% 88.4% Chula Vista Center 100% Chula Vista, CA 319,459 - 555,732 875,191 87.3% 82.8% Collin Creek 100% Plano, TX 327,887 176,259 515,992 1,020,138 90.4% 88.9% Colony Square Mall 100% Zanesville, OH 290,647 148,881 58,997 498,525 78.3% 75.8% Gateway Mall 100% Springfield, OR 486,713 218,055 113,613 818,381 89.2% 81.3% Grand Traverse Mall 100% Traverse City, MI 306,139 - 283,349 589,488 81.7% 81.7% Knollwood Mall 100% St. Louis Park, MN 383,935 80,684 - 464,619 94.3% 94.3% Lakeland Square 100% Lakeland, FL 275,372 180,440 429,598 885,410 85.5% 84.3% Lansing Mall 100% Lansing, MI 443,708 288,170 103,000 834,878 88.9% 88.5% Mall at Sierra Vista 100% Sierra Vista, AZ 169,361 - 196,492 365,853 96.0% 96.0% Mall St. Vincent 100% Shreveport, LA 184,341 - 348,000 532,341 88.8% 85.8% Newpark Mall 100% Newark, CA 372,453 207,372 533,502 1,113,327 91.8% 91.8% North Plains Mall 100% Clovis, NM 109,107 194,081 - 303,188 90.4% 90.4% Pierre Bossier Mall 100% Bossier City, LA 218,941 46,406 346,892 612,239 87.4% 87.3% Sikes Senter 100% Wichita Falls, TX 291,018 374,690 - 665,708 99.6% 91.4% Silver Lake Mall 100% Coeur D' Alene, ID 148,990 172,253 - 321,243 82.9% 80.7% Southland Center 100% Taylor, MI 320,483 583,037 - 903,520 87.1% 87.1% Southland Mall 100% Hayward, CA 524,019 445,896 292,000 1,261,915 86.2% 81.2% Spring Hill Mall 100% West Dundee, IL 483,943 134,148 547,432 1,165,523 85.0% 82.7% Steeplegate Mall 100% Concord, NH 223,157 256,347 - 479,504 74.5% 69.3% The Boulevard Mall 100% Las Vegas, NV 390,471 198,577 589,459 1,178,507 74.4% 74.0% Three Rivers Mall 100% Kelso, WA 226,244 193,233 - 419,477 82.6% 82.6% Valley Hills Mall 100% Hickory, NC 322,152 - 611,516 933,668 92.8% 92.1% Vista Ridge Mall 100% Lewisville, TX 390,971 - 670,210 1,061,181 91.4% 89.7% Washington Park Mall 100% Bartlesville, OK 162,400 122,894 71,402 356,696 95.9% 90.6% West Valley Mall 100% Tracy, CA 536,383 236,454 111,836 884,673 85.7% 84.4% Westwood Mall 100% Jackson, MI 135,513 70,500 301,188 507,201 95.8% 91.7% White Mountain Mall 100% Rock Springs, WY 209,181 94,482 - 303,663 96.0% 94.1% Total Rouse Portfolio Count: 31 9,570,983 5,006,663 7,077,447 21,655,093 87.5% 85.5% As of March 31, 2012 |
|
|
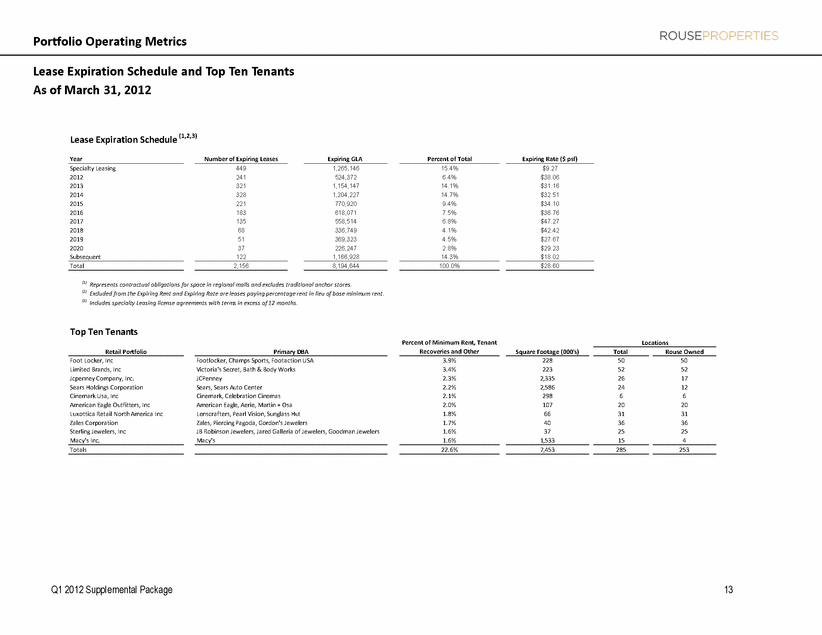
Q1 2012 Supplemental Package 13 Portfolio Operating Metrics Lease Expiration Schedule and Top Ten Tenants As of March 31, 2012 Lease Expiration Schedule (1,2,3) Year Expiring GLA Specialty Leasing 1,265,146 2012 524,372 2013 1,154,147 2014 1,204,227 2015 770,920 2016 618,071 2017 558,514 2018 336,749 2019 369,323 2020 226,247 Subsequent 1,166,928 Total 8,194,644 (1) Represents contractual obligations for space in regional malls and excludes traditional anchor stores. (2) Excluded from the Expiring Rent and Expiring Rate are leases paying percentage rent in lieu of base minimum rent. (3) Includes specialty Leasing license agreements with terms in excess of 12 months. Total Rouse Owned Foot Locker, Inc Footlocker, Champs Sports, Footaction USA 228 50 50 Limited Brands, Inc Victoria's Secret, Bath & Body Works 223 52 52 Jcpenney Company, Inc. JCPenney 2,335 26 17 Sears Holdings Corporation Sears, Sears Auto Center 2,586 24 12 Cinemark Usa, Inc Cinemark, Celebration Cinemas 298 6 6 American Eagle Outfitters, Inc American Eagle, Aerie, Martin + Osa 107 20 20 Luxottica Retail North America Inc Lenscrafters, Pearl Vision, Sunglass Hut 66 31 31 Zales Corporation Zales, Piercing Pagoda, Gordon's Jewelers 40 36 36 Sterling Jewelers, Inc JB Robinson Jewelers, Jared Galleria of Jewelers, Goodman Jewelers 37 25 25 Macy's Inc. Macy's 1,533 15 4 7,453 285 253 Top Ten Tenants Totals Retail Portfolio Number of Expiring Leases Percent of Total Expiring Rate ($ psf) 15.4% $9.27 241 6.4% $38.06 449 14.1% $31.16 328 14.7% $32.51 321 221 9.4% $34.10 Locations $42.42 $27.67 $29.23 183 7.5% $36.76 135 6.8% $47.27 3.9% 122 14.3% $18.02 2,156 100.0% $28.60 Primary DBA Percent of Minimum Rent, Tenant Recoveries and Other Square Footage (000's) 3.4% 2.3% 2.2% 2.1% 2.0% 1.8% 22.6% 1.7% 1.6% 1.6% 37 51 68 2.8% 4.5% 4.1% |
|
|
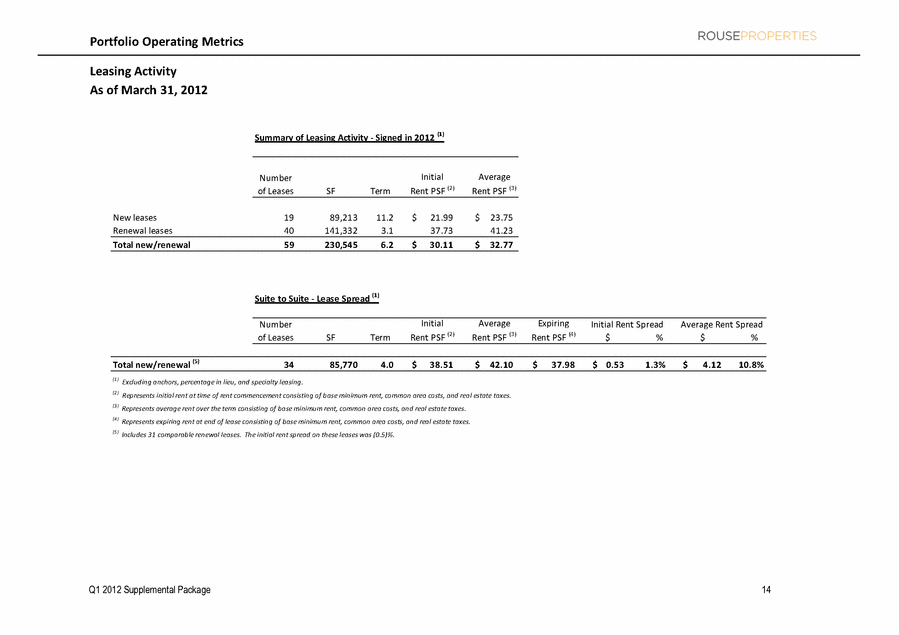
Q1 2012 Supplemental Package 14 Portfolio Operating Metrics Leasing Activity As of March 31, 2012 Summary of Leasing Activity - Signed in 2012 (1) Number of Leases SF Term Initial Rent PSF (2) Average Rent PSF (3) New leases 19 89,213 11.2 21.99 $ 23.75 $ Renewal leases 40 141,332 3.1 37.73 41.23 Total new/renewal 59 230,545 6.2 30.11 $ 32.77 $ Suite to Suite - Lease Spread (1) Number of Leases SF Term Initial Rent PSF (2) Average Rent PSF (3) Expiring Rent PSF (4) Total new/renewal (5) 34 85,770 4.0 38.51 $ 42.10 $ 37.98 $ 0.53 $ 1.3% 4.12 $ 10.8% (1) Excluding anchors, percentage in lieu, and specialty leasing. (2) Represents initial rent at time of rent commencement consisting of base minimum rent, common area costs, and real estate taxes. (3) Represents average rent over the term consisting of base minimum rent, common area costs, and real estate taxes. (4) Represents expiring rent at end of lease consisting of base minimum rent, common area costs, and real estate taxes. (5) Includes 31 comparable renewal leases. The initial rent spread on these leases was (0.5)%. Initial Rent Spread $ % Average Rent Spread $ % |
|
|
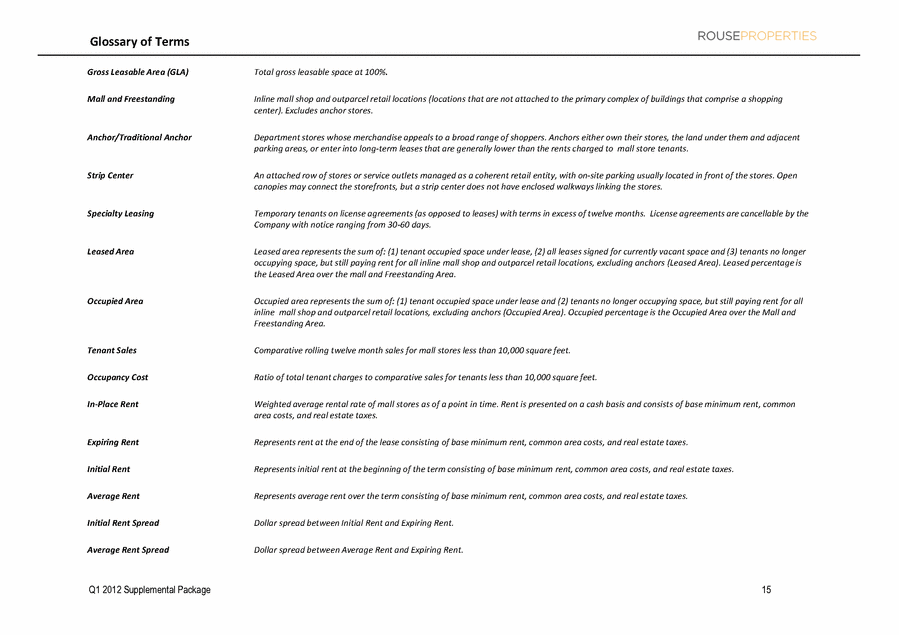
Q1 2012 Supplemental Package 15 Glossary of Terms Gross Leasable Area (GLA) Total gross leasable space at 100%. Mall and Freestanding Inline mall shop and outparcel retail locations (locations that are not attached to the primary complex of buildings that comprise a shopping center). Excludes anchor stores. Anchor/Traditional Anchor Department stores whose merchandise appeals to a broad range of shoppers. Anchors either own their stores, the land under them and adjacent parking areas, or enter into long-term leases that are generally lower than the rents charged to mall store tenants. Strip Center An attached row of stores or service outlets managed as a coherent retail entity, with on-site parking usually located in front of the stores. Open canopies may connect the storefronts, but a strip center does not have enclosed walkways linking the stores. Specialty Leasing Temporary tenants on license agreements (as opposed to leases) with terms in excess of twelve months. License agreements are cancellable by the Company with notice ranging from 30-60 days. Leased Area Leased area represents the sum of: (1) tenant occupied space under lease, (2) all leases signed for currently vacant space and (3) tenants no longer occupying space, but still paying rent for all inline mall shop and outparcel retail locations, excluding anchors (Leased Area). Leased percentage is the Leased Area over the mall and Freestanding Area. Occupied Area Occupied area represents the sum of: (1) tenant occupied space under lease and (2) tenants no longer occupying space, but still paying rent for all inline mall shop and outparcel retail locations, excluding anchors (Occupied Area). Occupied percentage is the Occupied Area over the Mall and Freestanding Area. Tenant Sales Comparative rolling twelve month sales for mall stores less than 10,000 square feet. Occupancy Cost Ratio of total tenant charges to comparative sales for tenants less than 10,000 square feet. In-Place Rent Weighted average rental rate of mall stores as of a point in time. Rent is presented on a cash basis and consists of base minimum rent, common area costs, and real estate taxes. Expiring Rent Represents rent at the end of the lease consisting of base minimum rent, common area costs, and real estate taxes. Initial Rent Represents initial rent at the beginning of the term consisting of base minimum rent, common area costs, and real estate taxes. Average Rent Represents average rent over the term consisting of base minimum rent, common area costs, and real estate taxes. Initial Rent Spread Dollar spread between Initial Rent and Expiring Rent. Average Rent Spread Dollar spread between Average Rent and Expiring Rent. |

