Attached files
| file | filename |
|---|---|
| 8-K - 8-K - APPVION, INC. | d354402d8k.htm |
| EX-99.3 - EX-99.3 - APPVION, INC. | d354402dex993.htm |
| EX-99.2 - EX-99.2 - APPVION, INC. | d354402dex992.htm |
 0
Innovative Coating & Microencapsulation Product Solutions
Business Combination with Hicks Acquisition Company II, Inc.
May 2012
™
Exhibit 99.1 |
 Disclaimer
1
Securities Law Information
In connection with the proposed transactions with Appleton Papers Inc. (together with
its successor after converting into a limited liability company, “Appvion”) and its current owner, Paperweight Development
Corp. (“PDC”), Hicks Acquisition Company II, Inc.
(“HACII”) intends to file with the SEC a proxy statement and mail a definitive proxy statement and other relevant documents to HACII stockholders. HACII
stockholders and other interested persons are advised to read, when available,
HACII’s preliminary proxy statement, and any amendments thereto, and the definitive proxy statement in connection with
HACII’s solicitation of proxies for the special meeting to be held to approve
the transactions because these proxy statements will contain important information about Appvion, HACII, and the proposed
transactions. The definitive proxy statement will be mailed to HACII
stockholders as of a record date to be established for voting on the proposed transactions. Stockholders will also be able to obtain a copy
of
the
preliminary
and
definitive
proxy
statements
once
they
are
available,
without
charge,
at
the
Securities
and
Exchange
Commission’s
(“SEC”)
website
at
http://www.sec.gov
or
by
directing
a
request
to
Hicks Acquisition Company II, Inc., 100 Crescent Court, Suite 1200, Dallas, Texas
75201, telephone 214-615-2300. HACII and its directors and officers
may be deemed participants in the solicitation of proxies to HACII’s stockholders. A list of the names of those directors and officers and a description of their interests in
HACII is contained in HACII’s annual report on Form 10-K for the fiscal
year ended December 31, 2011, which is filed with the SEC, and will also be contained in HACII’s proxy statement when it becomes
available. HACII’s stockholders may obtain additional information about
the interests of the directors and officers of HACII in the transactions in reading HACII’s proxy statement and other materials to be filed
with the SEC when such information becomes available.
Safe Harbor Statement
This
presentation
has
been
prepared
exclusively
for
the
purpose
of
providing
summary
information
about
Appvion
and
its
business
to
HACII
stockholders
pending
the
distribution
of
the
definitive
proxy
statement. It does not constitute a solicitation for or an offer by or, on
behalf of HACII or Appvion or, of any securities or investment advisory services.
This
presentation
includes
“forward-looking
statements”
within
the
meaning
of
the
safe
harbor
provisions
of
the
United
States
Private
Securities
Litigation
Reform
Act
of
1995.
Words
such
as
“expect,”
“estimate,”
“project,”
“budget,”
“forecast,”
“anticipate,”
“intend,”
“plan,”
“may,”
“will,”
“could,”
“should,”
“poised”, “believes,”
“predicts,”
“potential,”
“continue,”
and similar expressions are intended to identify such
forward-looking statements. Forward-looking statements in this presentation
include matters that involve known and unknown risks, uncertainties and other factors that may cause actual results, levels of
activity, performance or achievements to differ materially from results expressed or
implied by this presentation. Such risk factors include, among others: uncertainties as to the timing of the transaction,
approval of the transaction by HACII’s stockholders; the satisfaction of other
closing conditions to the transaction, including the receipt of any required regulatory approvals; costs related to the transaction;
costs and potential liabilities of Appvion relating to environmental regulation and
litigation (including Lower Fox River); potential failure of Appvion’s former parent to comply with its indemnification obligations;
costs of compliance with environmental laws; Appvion’s substantial amount of
indebtedness; the ability of Appvion to develop and introduce new and enhanced products, improve productivity and reduce
operating
costs;
Appvion’s
reliance
on
a
relatively
small
number
of
customers
and
third
parties
suppliers;
the
cessation
of
papermaking
and
transition
to
base
stock
supplied
under
the
long-term
supply
agreement with Domtar; the global credit market crisis and economic weakness;
competitors in its various markets; volatility of raw materials costs; Appvion’s underfunded pension plans; future legislation or
regulations intended to reform pension and other employee benefit plans; and
Appvion’s current owner PDC’s legal obligations to repurchase common stock from employees and former employees, which
may lead to a default under the Appvion’s agreements governing its indebtedness
or constrain Appvion’s ability to reinvest and make new investments. Actual results may differ materially from those
contained in the forward-looking statements in this presentation. Appvion
and HACII undertake no obligation and do not intend to update these forward-looking statements to reflect events or circumstances
occurring
after
the
date
of
this
presentation.
You
are
cautioned
not
to
place
undue
reliance
on
these
forward-looking
statements,
which
speak
only
as
of
the
date
of
this
presentation.
All
forward-looking
statements are qualified in their entirety by this cautionary statement.
Notes Regarding Financial Information of Appvion
The financial information and data contained in this presentation is derived from
Appvion’s unaudited financial statements and may not conform to Regulation S-X. Accordingly, such information and data may
be adjusted and presented differently in the proxy statement materials to be mailed
to HACII stockholders. Non-GAAP Information
Appvion is providing Adjusted EBITDA information, which is defined as net income of
Appvion, including net income attributable to any non-controlling interest, determined in accordance with all applicable and
effective
U.S.
generally
accepted
accounting
principles
(“GAAP”)
pronouncements
up
to
December
31,
2011,
before
interest
income
or
expense,
income
taxes
and
any
gains
or
losses
resulting
from
the
change in estimate relating to the Tax Receivable Agreement, depreciation,
amortization, losses or gains resulting from adjustments to the fair value of the contingent consideration, stock-based
compensation expense, extraordinary or non-recurring expenses and all other
extraordinary non-cash items for the applicable period as a complement to GAAP results. Adjusted EBITDA measures are
commonly used by management and investors as a measure of leverage capacity, debt
service ability and liquidity. Adjusted EBITDA is not considered a measure of financial performance under GAAP, and
the items excluded from Adjusted EBITDA are significant components in understanding
and assessing our financial performance. Adjusted EBITDA should not be considered in isolation or as an alternative
to,
or
superior
to,
such
GAAP
measures
as
net
income,
cash
flows
provided
by
or
used
in
operating,
investing,
or
financing
activities
or
other
financial
statement
data
presented
in
our
consolidated
financial
statements
as
an
indicator
of
financial
performance
or
liquidity.
Reconciliations
of
non-GAAP
financial
measures
are
provided
in
the
accompanying
tables.
Since
Adjusted
EBITDA
is
not
a
measure
determined
in
accordance
with
GAAP
and
is
susceptible
to
varying
calculations,
Adjusted
EBITDA,
as
presented,
may
not
be
comparable
to
other
similarly
titled
measures
of
other
companies. |
 Why
Appvion? 2
•
Company focused on specialty coating formulations, microencapsulation and related
know-how •
#1 market position in all markets with >50% share
•
High growth areas including direct thermal coated products and Encapsys
segment Appvion
Leadership
•
Asset-light model freeing up capital for growth investments
•
Low execution risk on business plan (Domtar strategic alliance, non-core asset
divestitures complete)
•
HACII merger accelerates balance sheet transformation / deleveraging
Transformation
Complete
•
Successfully repositioned company for growth
•
Senior management rolling equity into the combined company
Management
Invested in Future
Success
•
Best-in-class margins (+582bps since 2009) and FCF (+$63 million/yr)
•
Conservative 2012PF EBITDA target of $131 million
•
Enhanced FCF available to fund growth, debt reduction, and shareholder value
(equity repurchases/dividends)
Strong Free Cash
Flow
(1)
Profile
(1) Defined as PF Adj. EBITDA less Capital Expenditures
|
 Experienced and Proven Management Team
3
•
Chairman, President and CEO of Appvion since 2005
•
Prior
to
joining,
served
in
a
variety
of
senior
management
roles
within
a
diverse
range
of
sectors
that include industrial manufacturing, drug and medical devices
•
MBA, Northwestern University’s Kellogg School of Management
Mark Richards
Chairman, President
and CEO
•
Senior Vice President of Finance and CFO of Appvion since 2006
•
Prior to joining, served in a variety of senior financial roles within a diverse
range of industries that include banking, manufacturing and consumer
packaged goods •
Masters degree in finance and BBA in business, University of Iowa
Tom Ferree
Senior Vice President
and CFO
•
Vice President of Human Resources of Appvion since July 2009
•
Previously
served
in
a
variety
of
HR
roles
since
joining
Appvion
in
1982
•
Business Administration, Human Resources from the University of
Wisconsin-Oshkosh •
Senior Professional Human Resources certification since 2005
Kerry Arent
VP, Human
Resources
•
Senior Vice President since January 2012
•
Joined the Company in November 2005 as Vice President of Marketing and
Strategy •
Prior to joining, served in a variety of executive marketing positions with
Kimberly-Clark •
MBA, Northwestern University’s Kellogg School of Management
Kent Willetts
SVP, Encapsys®
Business Unit
•
Vice President of Thermal since April 2012
•
Joined the Company in April 1993 as a procurement manager
•
Previous roles in direct thermal and successful start-up of
Encpasys® Jamie Hillend
VP, Thermal |
 Global
Leader in Specialty Coating Formulation and Microencapsulation •
Appvion was created from over 100 years of Appleton experience, technology and
know-how •
Leading global converter of direct thermal coated paper and specialty carbonless
products –
Market leading innovative products and services
–
#1 North American market position with over 50% share
–
Exclusive distribution with key partners
•
High-growth
Encapsys
®
business
with
leadership
position
in
chemical
microencapsulation
technology
–
Highly attractive global P&G partnership
–
Robust growth profile with blue chip partners in established brands
–
Validation
of
strategic
plan
and
growth
outlook
from
widely
recognized
3 party
industry
consultant
–
Expanded business to other commercial customers
•
Globally recognized brands with blue-chip customers across diverse and attractive
end markets –
Include
NCR
Paper*,
Appleton
®
and
Encapsys
®
•
Low-cost, high velocity, flexible, lean inspired business model
–
Established culture of excellence with demonstrated ability to reduce operating
costs and improve quality and service •
High margins, low capital intensity and working capital needs
•
Reputable
and
trusted
history
of
operating
as
a
public
reporting
company
–
Seasoned public filer and Sarbanes-Oxley (SOX) compliant
–
Independent board; adhere to best practices in corporate governance
4
* NCR Paper is a registered trademark of NCR Corporation licensed to Appleton
Papers Inc. rd |
 Appvion: Successfully Repositioned
5
•
Domtar
strategic
alliance
–
a
paradigm
shift
(2012)
–
Industry comments: “Elegant”, “innovative”,
“creative” –
Strips out fixed costs and substantially reduces go forward capital
expenditures –
Facilitates a significant reduction of working capital
–
Frees up cash flow and management attention to focus on growth areas
•
Direct
thermal
market
leadership
–
investing
in
our
future
(2008)
–
State-of-the-art asset base installed and operating
–
Expanding margins and cash flow with mix shift, Domtar alliance and lean sigma
operational excellence –
Demonstrated ability to grow 2-3x market using coating capabilities and
geographic growth •
Encapsys
–
leveraging
a
core
technology
(2007)
–
50+ years of microencapsulation expertise applied to a broad range of attractive,
high-growth, global markets –
Rich in intellectual property and technical know-how; robust development
pipeline –
Proven lower capital intensity, high cash flow, scalable business model
•
Optimize balance of the portfolio (ongoing)
–
Carbonless is redirecting substantial cash flow into growing, global and profitable
segments –
Divested non-core assets
(1) Defined as Adj. EBITDA less Capital Expenditures.
|
 ASSET-LIGHT SPECIALTY
TRADITIONAL
COATING, FORMULATION
PAPER BUSINESS
& APPLICATION BUSINESS
MODEL
FOCUS ON GROWING,
GLOBAL DIRECT THERMAL
AND MICROENCAPSULATION
+$107 million revenue growth (4.5% CAGR)
+582 bps EBITDA margin expansion
+20% reduction in CapEx
+$63 million increase in Free Cash Flow
(1)
Appvion: Delivering Results
6
2009
2012
(1) Defined as Adj. EBITDA less Capital Expenditures.
Note: Segment figures do not include corporate overhead.
(EBITDA in $ Millions)
$141
$131
$73
Appvion’s Business Transformation
15.9%
15.1%
9.6%
% Margin |
 Appvion: Attractive Long-Term Equity Returns
7
•
Compelling free cash flow
(1)
across Appvion portfolio
–
Well positioned in growing end markets
–
Improving margins through direct thermal mix shift
–
Domtar
strategic
alliance
strengthens
free
cash
flow
(1)
–
Provides opportunity to reinvest, pay down debt and consider a dividend
•
Transaction substantially enhances Appvion’s balance sheet and credit
profile –
Enables accelerated growth
–
Eliminates ESOP repurchase obligations
–
Provides a significant deleveraging event
–
Opportunity to refinance existing indebtedness and further increase free cash
flow •
Potential for additional upside returns
–
Encapsys
®
technology and operating model scalable across global markets and blue chip
companies –
Scale and market position provide opportunity for international expansion
–
Opportunistically
acquire
and
integrate
additional
technological
capabilities
(1) Defined as PF Adj. EBITDA less Capital Expenditures.
|
 Business Overview |
 Segment
Snapshot 9
Specialty Coatings
Microencapsulation
–
Direct Thermal –
A World Leader
–
Carbonless –
The World Leader
–
Direct Thermal: Point of Sale products, mission-
critical labels and transportation and gaming
products
–
Carbonless: Multipart business forms and non-bank
note security papers
•
Trusted supplier to industry leading global customers
•
Proprietary technologies backed by patents and 60+
years of technical “know-how”
•
Business Segment
–
Encapsys
®
–
Redefining the Market
•
Products
–
Microcapsules that improve product performance
and reduce cost
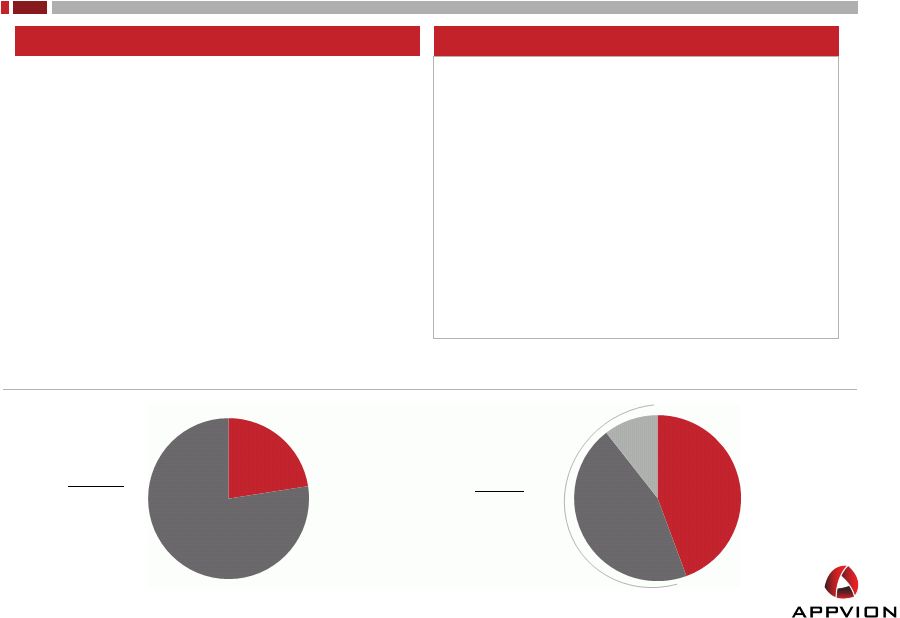
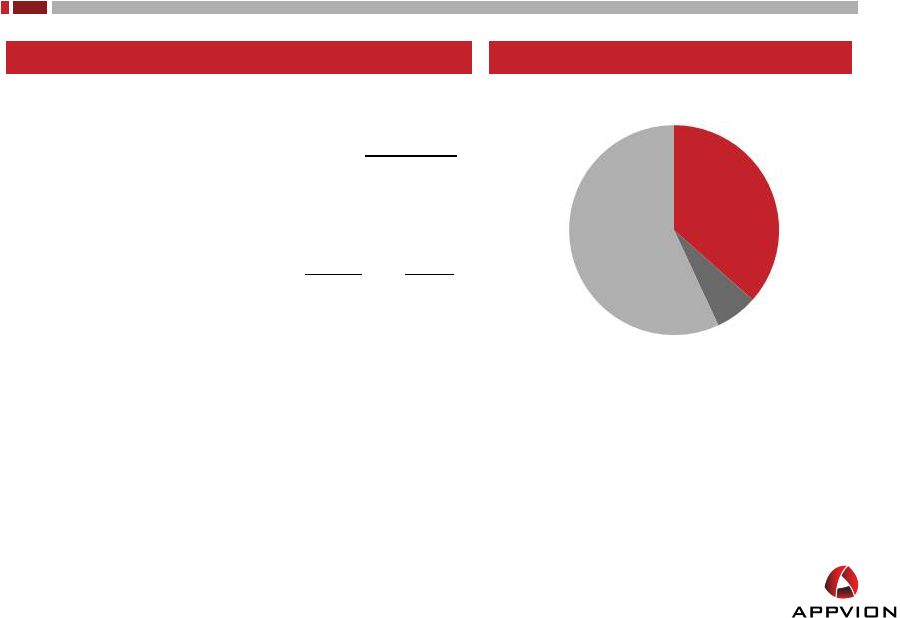
2012PF Financial
Breakdown
(1)
EBITDA
56% from Growth
Segments
Revenue
(1)
Pro Forma for the Domtar supply agreement.
•
•
•
•
Business Segments
Products
Global leader with exclusive distribution to key partners
Leading converter of specialty coated paper products,
including direct thermal and carbonless papers
International
23%
North
America
77%
Carbonless
44%
Thermal
45%
Encapsys
11% |
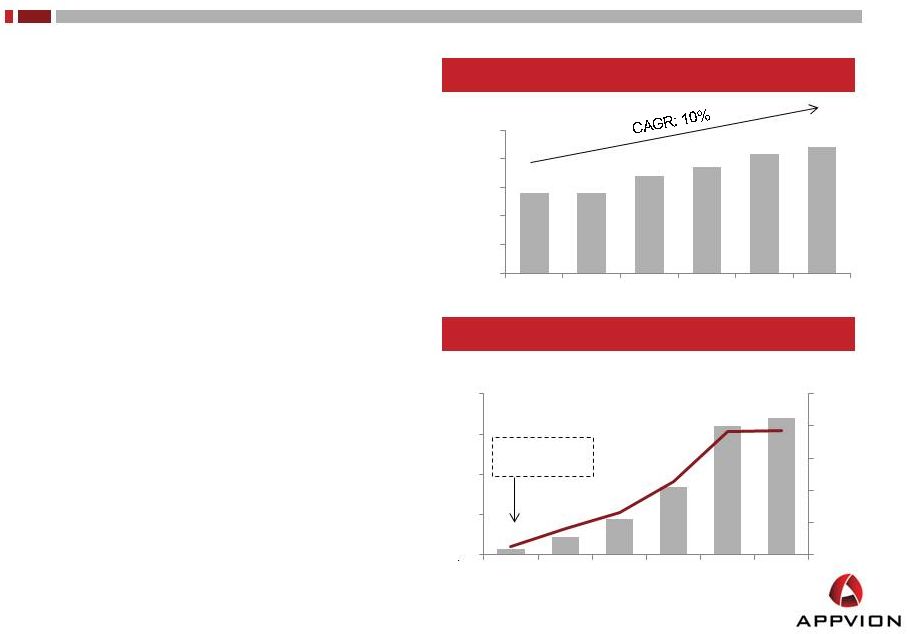 Direct
Thermal Products: A Phenomenal Growth Story •
A global leader with #1 market position in North America
–
Trusted partner to leading global customers
–
Well-invested, state-of-the-art low cost coating
capabilities
–
Robust proprietary technology developed over 50+
years
•
Produced by applying a complex thermal sensitive coating
to paper or film base stocks
–
Developed the technology in late 1960’s
–
Led market with every major enhancement
•
+$2.1bn global market growing at 4-7% annually
–
Demand driven by consumer transactions
–
Not susceptible to typical paper industry cycles
•
Primary applications include:
–
POS products for retail receipts and coupons
–
Mission-critical label, tag and ticket products
–
Transportation and gaming products
•
Key Customers
–
3M, Avery Dennison, RR Donnelley and UPM Raflatac
10
($ Millions)
($ Millions)
(Margin %)
Demonstrated Revenue Growth
$280
$281
$342
$371
$417
$442
$0
$100
$200
$300
$400
$500
2008
2009
2010
2011
2012PF
2013E
Substantial Adj. EBITDA Improvement
$3
$9
$18
$34
$64
$68
0%
4%
8%
12%
16%
20%
$0
$20
$40
$60
$80
2008
2009
2010
2011
2012PF
2013E
July 2008:
Coater startup
Note: 2012PF and 2013E projections based on management guidance. Excludes intercompany eliminations
and corporate overhead. |
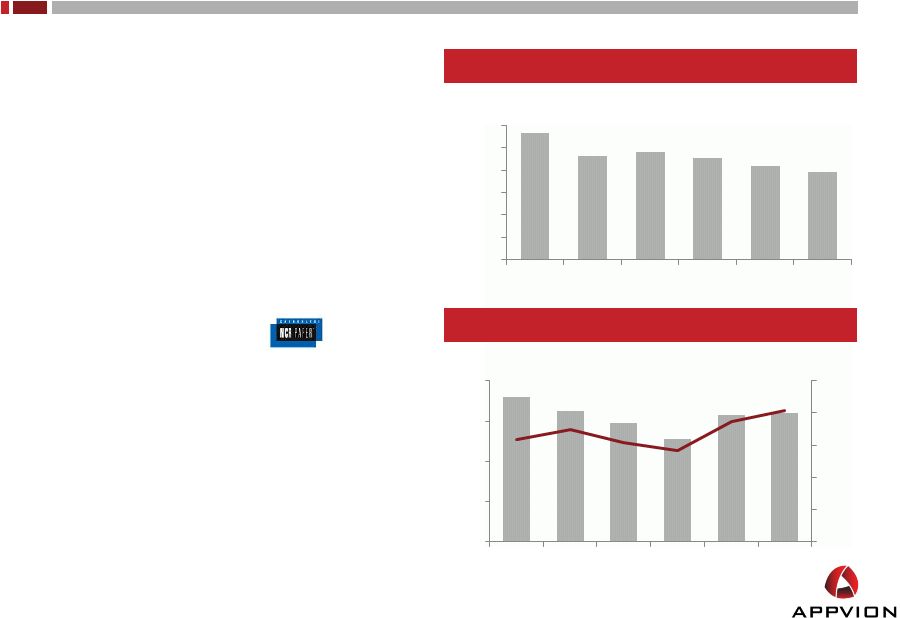 Carbonless Paper: The Market Leader
•
Leader in a mature, global $2.5bn market
–
#1 market share in North America and worldwide
–
Top two industry participants account for over 90% of the
domestic market
–
Exclusive distribution with largest merchants
•
Technology innovator with demonstrated ability to manage
market decline
–
Introduced digital product that can run on offset or digital
press
–
Selective export opportunities
•
Carbonless products used in multipart business forms (i.e.,
invoices, packing lists, application forms and receipts)
–
Most recognized global brand:
•
Security products incorporate secure technologies
(watermarks, taggants, embedded fibers, machine-readable)
•
Significant free cash flow generation
–
Minimal ongoing capital expenditure requirements
–
Ability to redeploy into growth segments, debt reduction
or dividends
11
Historical and Projected Revenue
Stable Adj. EBITDA Profile
($ Millions)
($ Millions)
(Margin %)
$567
$464
$479
$453
$420
$392
$0
$100
$200
$300
$400
$500
$600
2008
2009
2010
2011
2012PF
2013E
$72
$65
$59
$51
$63
$64
0%
8%
16%
$0
$20
$40
$60
$80
2008
2009
2010
2011
2012PF
2013E
4%
12%
20%
Note: 2012PF and 2013E projections based on management guidance. Excludes intercompany eliminations
and corporate overhead. |
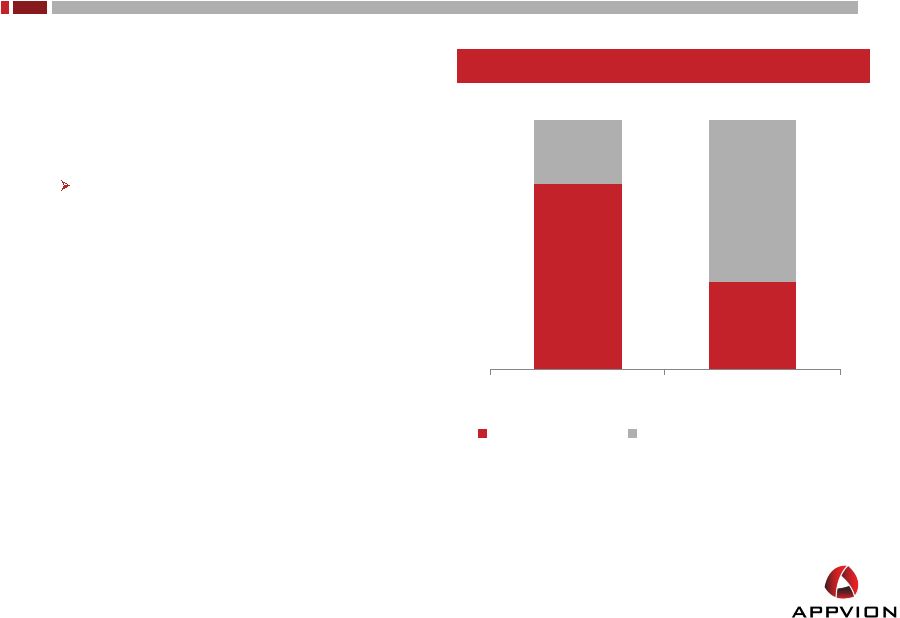 Key
Event: Transformational Base Stock Supply Agreement •
15-year strategic alliance with Domtar provides access to high
quality, integrated base stock
–
Announced February 2012
–
Provides ~$30 million in annual EBITDA improvement
–
Eliminates high-cost, out-dated manufacturing facility
–
No net cash costs
~$30 million working capital reduction funds shutdown
costs
•
Continues transformation to a higher-margin, higher value-add,
lower fixed-cost converter
–
Focus management and capital on core competencies
–
Reduces commodity exposures and “locks-in”
purchasing
of base stock paper
–
Shutter high-cost, non-integrated base stock paper
production assets in West Carrollton
–
Significantly improves cash flow generation profile
•
Contractual;
implementation
underway
–
substantially
complete
by Q4 2012
12
Base Stock Transformation
75%
35%
25%
65%
2011
Pro Forma
Internal Production
Purchased from 3rd Parties |
 13
•
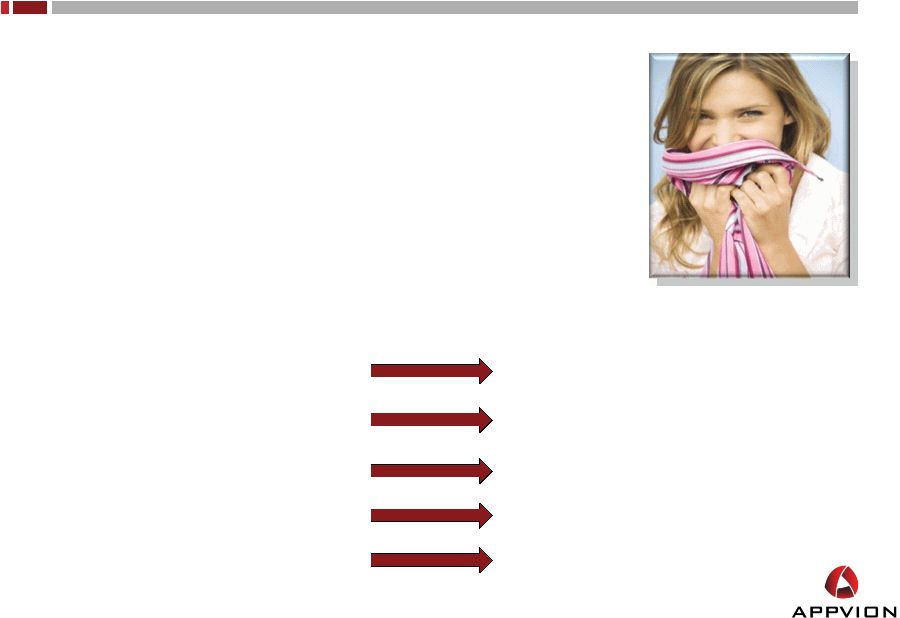
Microencapsulation is the delivery of chemistry in very small capsules to provide
for the controlled release of active ingredients
•
Produced using a chemical wall polymerization process
–
Low capital intensity process
•
Leveraged technical know how from carbonless business to
commercialize technology
–
Original technology introduced in the 1950s
–
Refreshed technology with over 60 granted patents in the
last five years
–
Rapidly expanding capabilities with new capsule wall technologies
•
Technology delivers significant value by improving product
performance at a lower cost
–
Extends existing product useful life by adding new benefits
–
Enabling technology for new products
–
Drives reformulations that lower product costs
–
Many proven applications including fragrances, flavor masking,
nutrauceuticals, adhesives, biocides, and herbicides
•
Encapsys®
recognized as industry leader
–
Trusted partner to leading global customer base
–
Well-invested, state-of-the-art, scalable coating
capabilities –
“Big”
company friendly with best-in-class operating controls
and processes
Microencapsulation: Proven technology
(5-15 microns) |
 Encapsys
®
Partners
Procter & Gamble
•
•
Encapsys
®
provided unique solution for P&G product line
•
Encapsys
®
partnered with P&G and perfected fragrance encapsulation for Liquid
Downy –
Improved efficacy
–
Significant reduction in product cost
•
Relationship began with one product and proliferated across multiple business units
and product lines
•
P&G has adopted Encapsys as a strategic business platform, deploying it across
its global business units
Other Partners
14
Priority
Markets
Products
Household
•
Laundry care
•
Toilet products
•
Acquisition targets
Food / Pharma
•
Physical encapsulation
•
FDA compliant
•
Phase change material
Industrial
•
Biocides
•
Paints and coatings
Personal Care
•
Antiperspirants
•
Hair care
•
Herbicides
AgChem
•
Insecticides
•
Fungicides
Launched partnership with P&G in 2007 by encapsulating fragrance for laundry products |
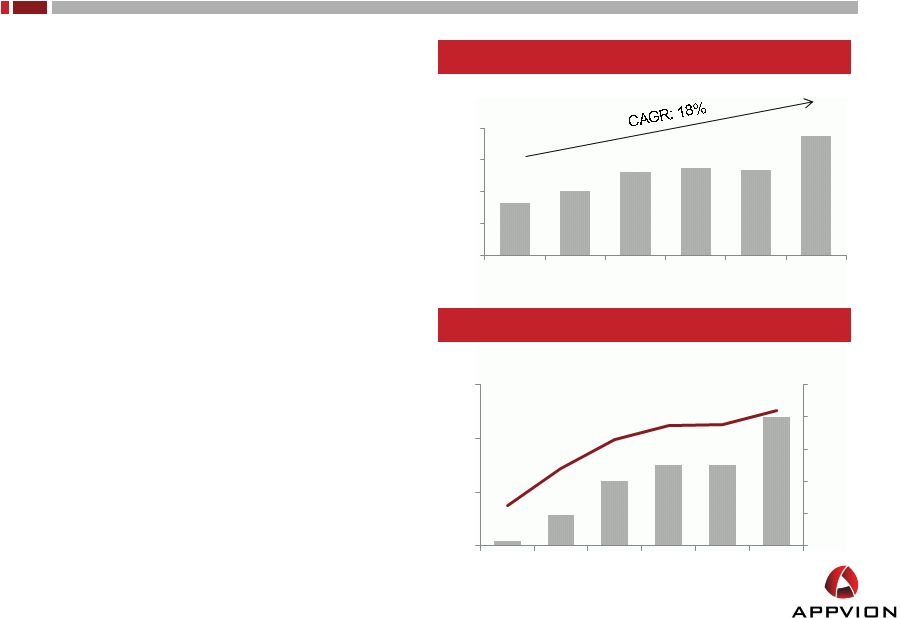 Microencapsulation: Serving a sizeable growing market
15
•
$4 billion global market growing 10% annually
–
Wide market appeal with applications in food, pharma,
AgChem, industrial, paints & coatings, oil & gas,
personal and household care, and nutraceuticals
•
Strategic review by widely recognized specialty chemical
consulting firm
–
Endorsed projections that Encapsys®
can grow to
multiples of its current size by 2016
–
Addressable market increased from $2 billion to $4
billion
–
Opportunity to grow faster than current model by
acquiring capabilities and products
•
Focused on large joint development pipeline to drive
growth
–
16 development partners and greater than 20 active
projects under development (preponderance with
Fortune 500 companies)
–
Partners include Troy, Entropy and a global Fortune
500 consumer packaged goods companies
Demonstrated Revenue Growth
Robust Adj. EBITDA Growth Profile
($ Millions)
($ Millions)
(Margin %)
$33
$40
$52
$55
$54
$75
$0
$20
$40
$60
$80
2008
2009
2010
2011
2012PF
2013E
$1
$6
$12
$15
$15
$24
(10%)
0%
10%
20%
30%
40%
$0
$10
$20
$30
2008
2009
2010
2011
2012PF
2013E
Note: 2012PF and 2013E projections based on management guidance. Excludes intercompany eliminations
and corporate overhead. |
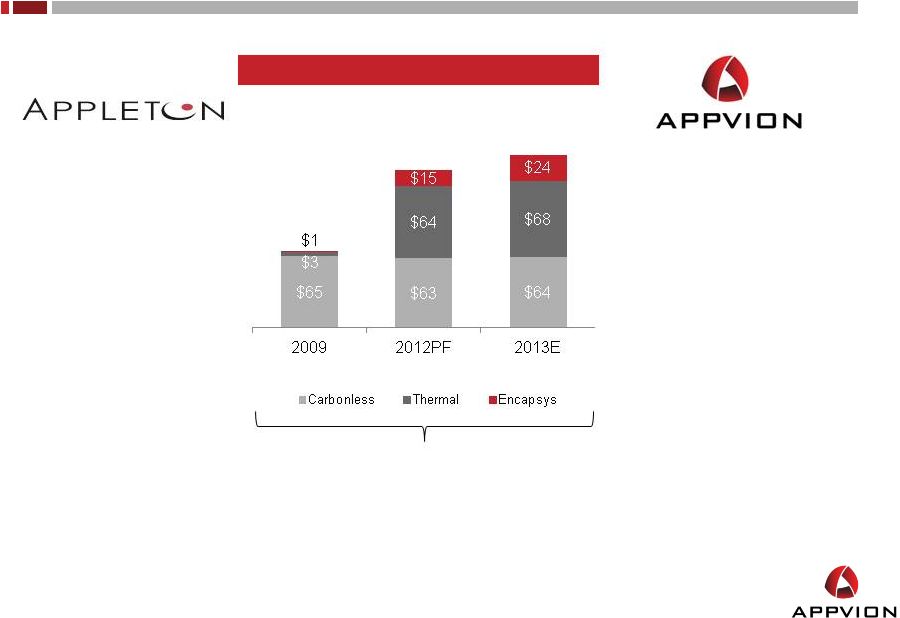
 Financial Summary |
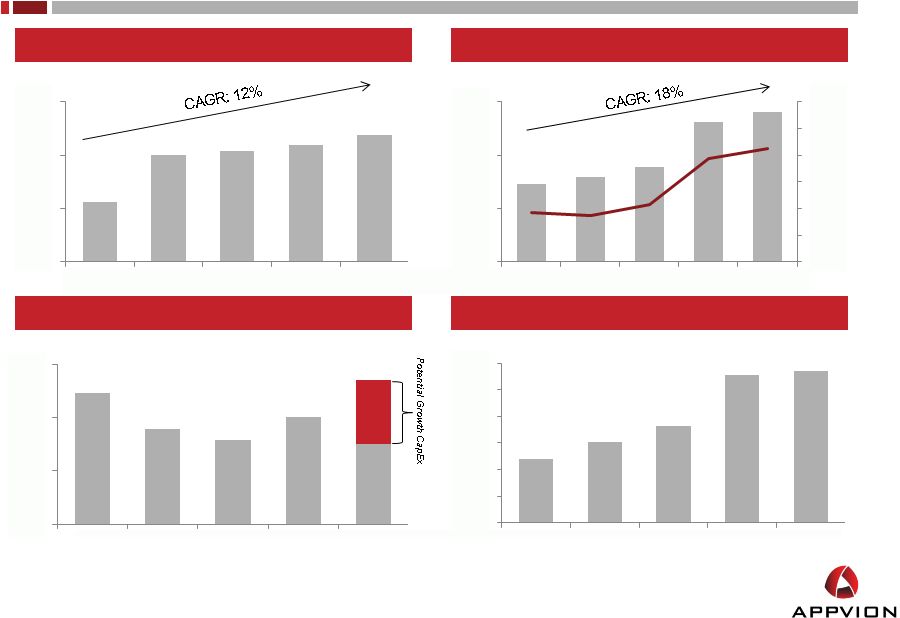 Consolidated Financial Summary
Note:
2012PF
and
2013E
projections
based
on
management
guidance.
2012
PF
Adj.
EBITDA
and
capital
expenditures
Pro
Forma
for
Domtar
transaction.
See
EBITDA
reconciliation on page 29.
(1) Excludes Capital Expenditures related to Domtar transaction implementation in
2012 and 2013. (2) Defined as Adj. EBITDA less Capital Expenditures.
17
($ Millions)
($ Millions)
($ Millions)
($ Millions)
(EBITDA Margin %)
Revenue
Capital Expenditures
(1)
Adjusted EBITDA
Free Cash Flow
(1)(2)
$762
$850
$857
$869
$887
$650
$750
$850
$950
2009
2010
2011
2012PF
2013E
$15
$12
$25
$18
$16
$20
$27
$0
$10
$20
$30
2009
2010
2011
2012E
2013E
$73
$79
$89
$131
$141
5%
8%
10%
13%
15%
18%
20%
$0
$50
$100
$150
2009
2010
2011
2012PF
2013E
$48
$61
$73
$111
$114
$0
$20
$40
$60
$80
$100
$120
2009
2010
2011
2012PF
2013E |
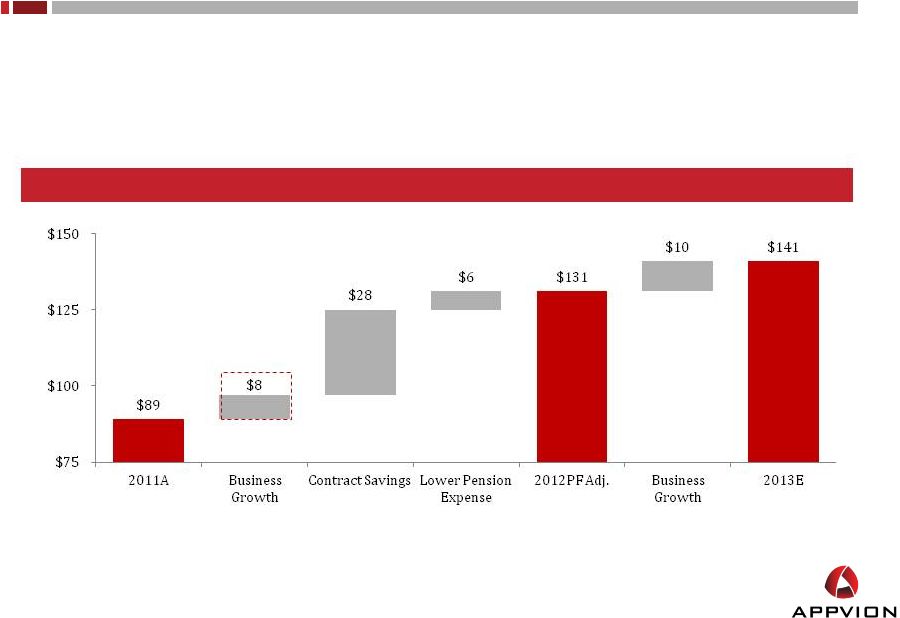 EBITDA
Bridge Analysis 18
2011A to 2013E
(2)
(1)
Unaudited run-rate EBITDA for the four months ending May 2012. Excludes pension
benefit and contract savings. (2)
Contracted EBITDA improvement is annualized to reflect full-year impact of
Domtar Supply Agreement. (3)
Impact of lower pension expense due to freeze of salaried defined benefit.
•
Base
business
EBITDA
ahead
of
plan
(1)
•
Additional ~$30 million in contracted annualized EBITDA improvement
•
Ongoing EBITDA benefit due to reduced pension expense
$102
Run-Rate
(1)
(3) |
 Current and
Post-Transaction Balance Sheet 19
Assumes
net
proceeds
from
the
transaction
are
applied
as
cash
to
balance sheet that will be utilized for general corporate purposes, debt reduction and potential
warrant repurchases.
Includes
$18.2
million
of
additional
2
Lien
notes
issued
upon
change
of
control.
Assumes 2012E PF Adj. EBITDA of $131 million.
Actual as of
As Adjusted for
4/1/2012
this Transaction
(1)
Interest Rate
Maturity
Call Date
Cash & Equivalents
7
$
117
$
Revolving Credit Facility
-
$
-
$
Variable
Feb -
2015
Senior Secured 1st Lien Notes
301
301
10.500%
Jun -
2015
Mar -
2013
2nd Lien Notes
162
180
11.250%
Dec -
2015
NA
Senior Subordinated Notes
32
32
9.750%
Jun -
2014
Jun -
2012
Industrial Revenue Bonds
9
9
Variable
2013 / 2017
State of Ohio Loan
8
8
Variable
May -
2017
Columbia County, Wisconsin Forgivable Note
0
0
Variable
May -
2019
Total Debt
512
$
530
$
Net Debt
505
$
413
$
Net Debt / PF Adj. EBITDA
(2)
3.9x
3.1x
(1)
(2)
Note: Assumes no HACII shareholder redemptions.
nd |
 Transaction Summary |
 Transaction Overview
•
Appvion
to
become
publicly
traded
through
a
business
combination
with
Hicks
Acquisition Company II, Inc. (Nasdaq: HKAC)
•
Post-closing Appvion will trade on Nasdaq under ticker APVN
•
Appvion
enterprise
value
of
$675
million
(1)
Transaction
•
Appvion will receive up to $149.3 million in cash, less fees, expenses and HACII
redemptions, which will be used to delever balance sheet
•
Pro Forma net debt of $413 million (3.1x 2012E PF Adjusted EBITDA) at close
•
Appvion employee shareholders will receive 9.6 million shares and retain
approximately
37%
ownership
(2)
•
Earn-out shares provide significant shareholder-aligned incentive
Consideration
•
Management team led by Mark Richards, Chairman and CEO
•
Management intends to roll a substantial portion of its long-term incentive
earnings •
Board will be comprised of 9 members (6 independent directors with the remaining
representatives from Appvion and Hicks)
Management and Board
•
July 2012
Expected Closing
21
(1)
Excludes value of 3.0 million earnout shares issued in connection with the
transaction. (2)
Ownership percentages are calculated as basic ownership and exclude warrants,
options and redemptions from the ownership calculation. Any redemptions by HACII
shareholders would proportionally lower HACII’s ownership percentage and raise
the ownership percentage of ESOP participants. |
 Transaction Valuation and
Ownership Pro Forma Valuation
Pro Forma Appvion Ownership
(1)
(1)
Excludes 1.0 million earnout shares with a strike price of $12.50 and 2.0 million earnout shares with
a strike price of $15.00 issued in connection with the transaction. (2)
Based on PF Adj. EBITDA of $131 and $141 million and capital expenditures of $20 and $15 million in
2012E and 2013E, respectively. (3)
Includes current and former employees.
22
Implied Enterprise Value
675
$
Pro Forma Net Debt
(413)
Pro Forma Fully Diluted Equity Value
262
$
Fully
Diluted
Shares
(mm)
(1)
26.3
Implied Share Price
9.95
$
Implied
Multiple
(2)
2012PF
2013E
TEV / PF Adj. EBITDA
5.1x
4.8x
TEV
/
PF
Adj.
EBITDA
-
CapEx
6.1x
5.4x
Appleton
Employees
37%
HAC
Founders
7%
Public
57%
(3) |
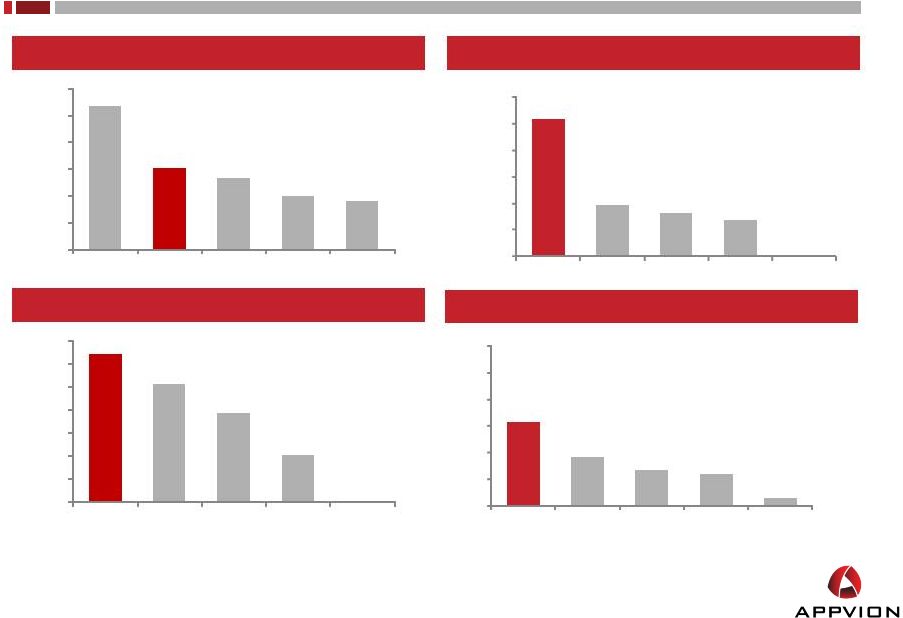 Comparable Companies –
Financial Benchmarking
Net Debt / 2012E EBITDA
23
Note: As of 5/11/2012. Comparable companies includes: Wausau Paper (WPP), Neenah
Paper (NP), Schweitzer-Mauduit (SWM) and Glatfelter Paper (GLT).
(1)
Based on PF Adj. EBITDA of $131 and $141 million in 2012E and 2013E,
respectively. (2)
Excludes $152 million of capital expenditures related to tissue expansion.
(3)
As presented in the offering contemplated herein. Assumes 0% HACII shareholder
redemptions. (3)
2012E EBITDA Margin %
2011A –
2013E EBITDA Growth
2012E EBITDA –
CapEx Margin %
(1)
(1)
(1)
(2)
(1)
26.6%
15.1%
13.3%
10.0%
9.0%
0.0%
5.0%
10.0%
15.0%
20.0%
25.0%
30.0%
SWM
APVN
NP
GLT
WPP
12.8%
10.2%
7.7%
4.0%
NA
0.0%
2.0%
4.0%
6.0%
8.0%
10.0%
12.0%
14.0%
APVN
NP
WPP
GLT
SWM
25.7%
9.7%
8.0%
6.7%
NA
0.0%
5.0%
10.0%
15.0%
20.0%
25.0%
30.0%
APVN
WPP
GLT
SWM
NP
3.1x
1.8x
1.3x
1.2x
0.3x
0.0x
1.0x
2.0x
3.0x
4.0x
5.0x
6.0x
APVN
NP
WPP
GLT
SWM |
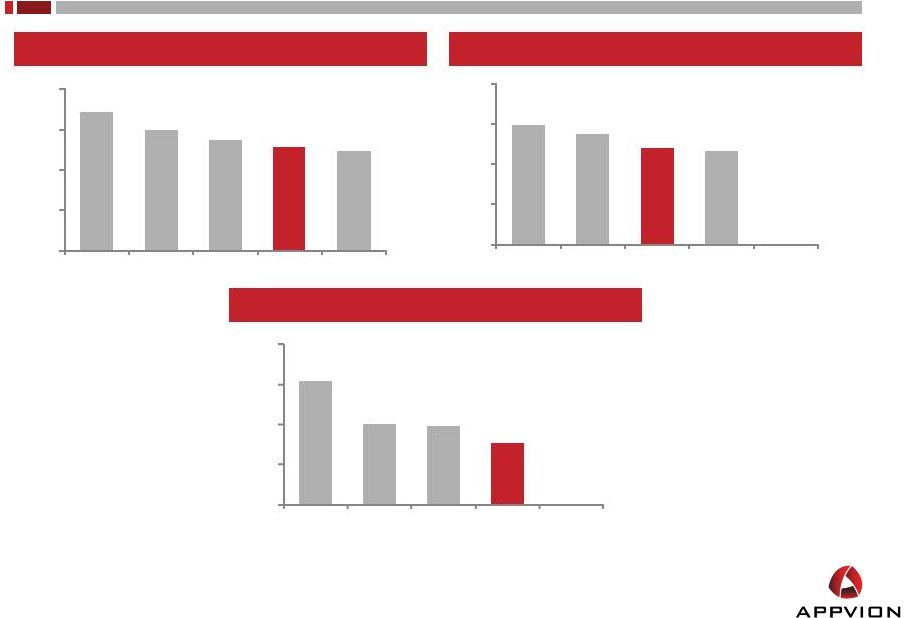 Comparable Companies –
Valuation Benchmarking
24
TEV / 2012E EBITDA
(1)
Note: As of 5/11/2012. Comparable companies include Specialty Paper peers: Wausau
Paper (WPP), Neenah Paper (NP), Schweitzer-Mauduit (SWM) and Glatfelter Paper (GLT).
(1)
As presented in the offering contemplated herein. Assumes 0% HACII shareholder
redemptions. (2)
Based on PF Adj. EBITDA of $131 and $141 million in 2012E and 2013E,
respectively. (3)
Excludes $152 million of capital expenditures related to tissue expansion.
TEV / 2013E EBITDA
(1)
TEV / 2012E EBITDA -
CapEx
(1)(2)
(3)
6.8x
5.9x
5.4x
5.1x
4.9x
0.0x
2.0x
4.0x
6.0x
8.0x
WPP
NP
SWM
APVN
GLT
5.9x
5.4x
4.8x
4.6x
NA
0.0x
2.0x
4.0x
6.0x
8.0x
WPP
SWM
APVN
GLT
NP
12.3x
8.0x
7.7x
6.1x
NA
0.0x
4.0x
8.0x
12.0x
16.0x
GLT
WPP
NP
APVN
SWM |
 Multiple Avenues to Deliver Shareholder Value
25
Blue Chip
Sponsor
Proven and
Experienced
Management
Team
Deleveraging
Story
Strong Free
Cash Flow
Asset Light
Model
Technology
Innovator
Attractively
Priced
Leading
Market
Positions in
Growth
Markets |
 Appendix |
 Hicks
Equity Partners •
Led by Tom Hicks, Chairman of the Board
–
Founder of one of the most successful private investment firms with 35+ years of
private equity investing experience
•
Supported by team of experienced investment professionals who, combined with Tom
Hicks, have over 150 years of private equity and public company
experience •
Extensive relationships with other financial sponsors, management teams and
financial intermediaries
•
Raised $150 million in October 2010 for Hicks Acquisition Company II, Inc.
(“HAC II”) •
Successfully raised $552 million for Hicks Acquisition Company I, Inc. in September
2007 –
Merged with Resolute Energy in September 2009
–
One of the most successful transactions for SPACs of similar size
Blue Chip Sponsor
27 |
 Sources & Uses and
Historical Financial Summary 28
($ Millions)
(1)
Figures do not reflect the impact of the Business Combination with Hicks Acquisition Company II,
Inc. (2)
Excludes Capital Expenditures related to Domtar transaction implementation in 2012 and 2013.
(3)
Based on actual cash held in trust as of April 1, 2012, net of assumed redemption of 0%. Net of
Deferred Underwriting & Selling Group fees of $6.7 million. (4)
Assumes
net
proceeds
from
the
transaction
are
applied
as
cash
to
balance
sheet
that
will
be
utilized
for
general
corporate
purposes,
debt
reduction
and
potential
warrant repurchases.
(5)
Includes costs associated with existing incentive plans and necessary consents.
Sources & Uses
Financial Summary
2008A
2009A
2010A
2011A
2012PF
2013E
(1)
Revenue
855
$
762
$
850
$
857
$
869
$
887
$
% Growth
NA
(10.9%)
11.6%
0.9%
1.3%
2.1%
Gross Profit
171
$
159
$
165
$
170
$
216
$
229
$
% Margin
20.1%
20.8%
19.5%
19.8%
24.9%
25.8%
Adjusted EBITDA
66
$
73
$
79
$
89
$
131
$
141
$
% Margin
7.7%
9.6%
9.3%
10.4%
15.1%
15.9%
Adjusted EBIT
13
$
17
$
30
$
41
$
91
$
98
$
% Margin
1.5%
2.2%
3.5%
4.7%
10.4%
11.1%
Capital Expenditures
(2)
95
$
25
$
18
$
16
$
20
$
27
$
% Sales
11.1%
3.2%
2.1%
1.8%
2.3%
3.0%
Sources of Funds
Cash
Held
in
Trust
(3)
143
$
Total Sources
143
$
Uses of Funds
Cash
to
Balance
Sheet
(4)
110
$
Change
of
Control
Payments
(5)
13
Legal & Accounting
5
Fees, incl. ESOP Advisory
12
Other Transaction Costs
1
Total Uses
143
$ |
 Pro Forma Adjusted EBITDA
Reconciliation 29
($ Millions)
(1) Represents the median of management forecast. Figures do not reflect the impact of the Business
Combination with Hicks Acquisition Company II, Inc.
2009
2010
2011
2012PF
2013E
(1)
(Loss) Income from Continuing Operations Before Income Taxes
24
$
(35)
$
(2)
$
(103)
$
55
$
Depreciation, Amortization and Other
57
51
49
40
43
Net Interest Expense
(43)
65
61
54
48
Restructuring Expense
-
-
-
123
(5)
Net Debt Extinguishment Expense
51
7
-
-
-
Litigation Settlement, net
-
-
(23)
-
-
Foreign Exchange (Gain) Loss
(2)
1
1
-
-
Other Income
-
(1)
0
4
-
EBITDA
87
$
88
$
86
$
117
$
141
$
Environmental Insurance Expense Recovery
-
(9)
-
-
-
Debt Extinguishment Expenses
4
-
-
-
-
Alternative Fuels Tax Credit
(18)
-
-
-
-
Litigation Settlement, net
-
-
3
-
-
Domtar Suppy Agreement Run-Rate Adjustment
-
-
-
14
-
Adjusted EBITDA
73
$
79
$
89
$
131
$
141
$ |