Attached files
| file | filename |
|---|---|
| 8-K - FORM 8-K - HANCOCK WHITNEY CORP | d351920d8k.htm |
 Gulf South Bank
Conference
May 14, 2012
Gulf South Bank
Conference
May 14, 2012 |
 Carl Chaney
President & CEO |
 Forward-Looking
Statements
Forward-Looking
Statements
During this presentation we may make forward-looking
statements. Forward-looking statements provide projections of
results of operations or of financial condition or state other
forward-looking information, such as expectations about future
conditions and descriptions of plans and strategies for the future.
Hancock’s ability to accurately project results or predict
the effects of future plans or strategies is inherently
limited.
We believe that the expectations reflected in the forward-looking
statements are based on reasonable assumptions, but actual
results and performance could differ materially from
those set forth in the forward-looking statements. Factors
that could cause actual results to differ from those expressed
in the Company's forward-looking statements include, but are
not limited to, those outlined in Hancock's SEC filings, including the “Risk Factors”
section of the Company’s form 10-K and 10-Q.
Hancock does not intend, and undertakes no obligation, to update
or revise any forward-
looking statements, and you are cautioned not to place undue reliance
on such forward- looking statements.
3 |
 •
Systems integration
completed March 16,
2012
•
Approximately $1.6B
of assets transferred
•
Consolidated 30
branches
Whitney Integration
Completed
4 |
 •
Professional consulting
groups assisted with the
integration
•
Over 300 associates logged
over 1 million hours
•
Executed almost 13,500 test
scripts; completed more than
1,700 separate tasks
•
Extremely satisfied with the
success of the conversion
A Successful
A Successful
Systems Conversion
Systems Conversion
5 |
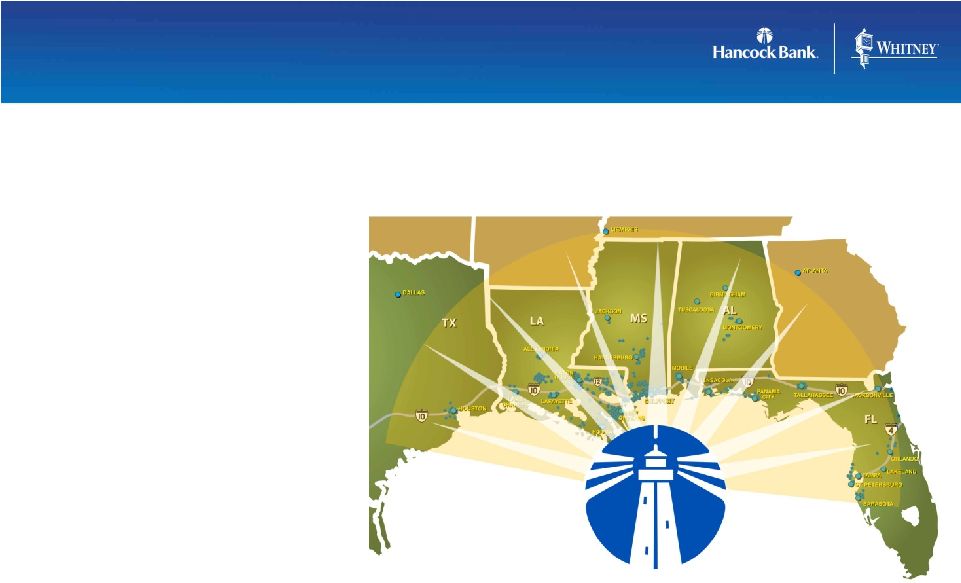
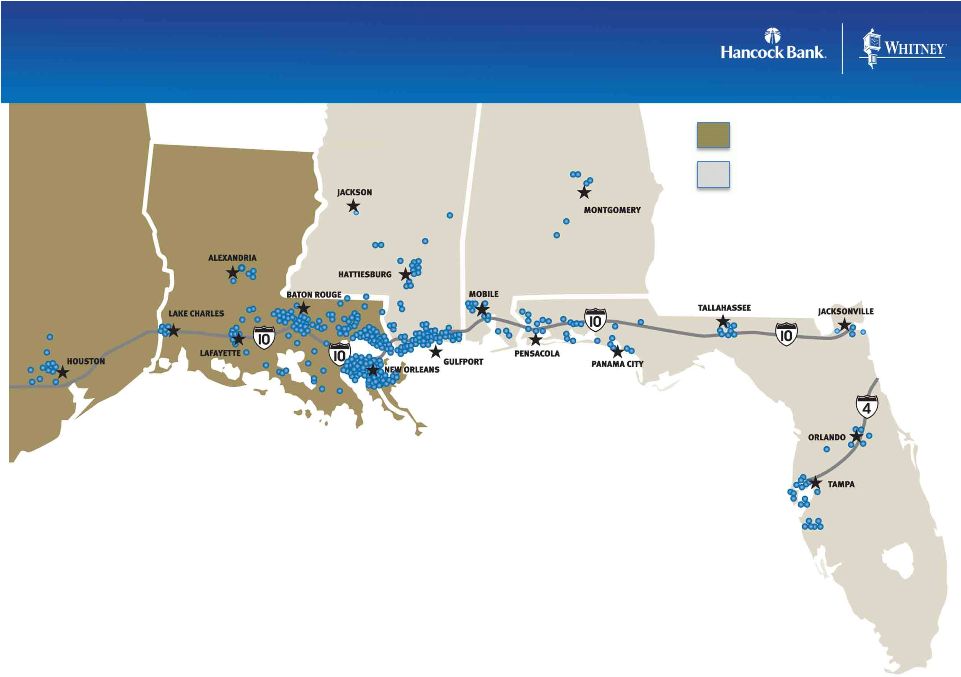 •
Diversified footprint across the Gulf South
•
2 well-known Gulf Coast brands
•
Loyal customer base and attractive deposit funding
•
Diversified revenue stream with strong earnings momentum
•
Leading market share in key MSAs
A Premier Gulf South
Financial Services Franchise
Whitney Bank
Hancock Bank
6 |
 •
Basically in line with our expectations
•
Reflect comments made during 4Q11 earnings conference call
•
Reflect a certain level of distraction from systems conversion
•
Reflect in part beginning of the year seasonality of both balance
sheet and operating expense
•
Fundamentals of the combined company remain strong
•
Focused on achieving remaining merger efficiencies and growing
these two well-known Gulf South brands
First Quarter
First Quarter
2012 Results
2012 Results
As of March 31, 2012
7 |
 Michael Achary
Chief Financial Officer |
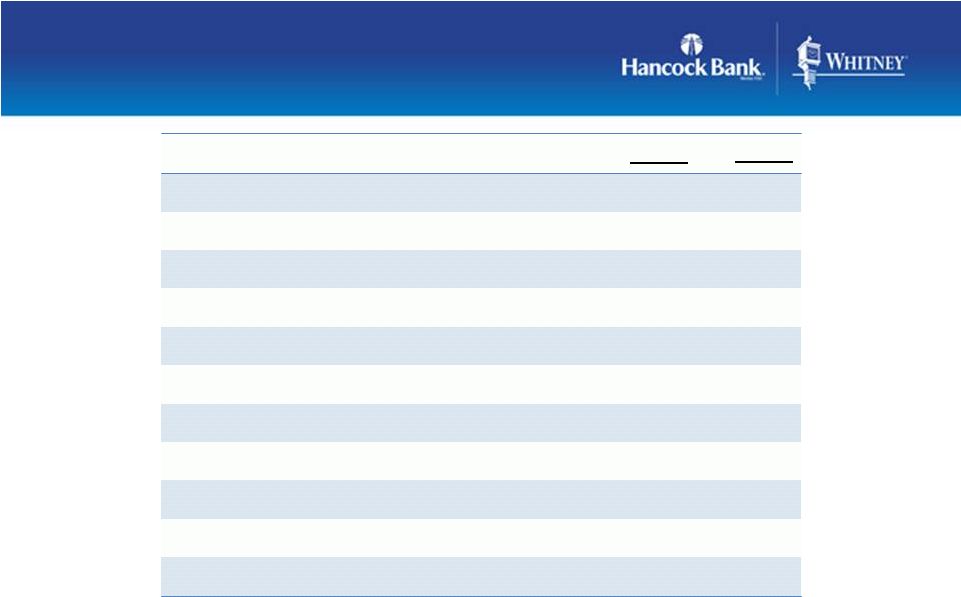 First Quarter 2012
Earnings Summary
First Quarter 2012
Earnings Summary
* A reconciliation of net income to operating income and pre-tax,
pre-provision income is included in the appendix. **
Noninterest expense
as
a
percent
of
total
revenue
(TE)
before
amortization
of
purchased
intangibles,
securities
transactions
and
merger
expenses.
As of March 31, 2012
9
($s in millions; except per share data)
Operating Income*
$40.5
$45.1
Operating E.P.S.(diluted)*
$.47
$.53
Return on
Assets (operating)*
0.85%
0.93%
Merger Costs
$33.9
$40.2
Net Income
$18.5
$19.0
Earnings Per Share
(diluted)
$.21
$.22
Pre-
Tax, Pre-Provision Income*
$69.2
$76.5
Net Interest Margin
4.43%
4.39%
Net Charge
offs non
covered
0.25%
0.40%
Tangible Common Equity
8.27%
7.96%
Efficiency Ratio**
67.81%
65.39%
1Q12
4Q11
-
- |
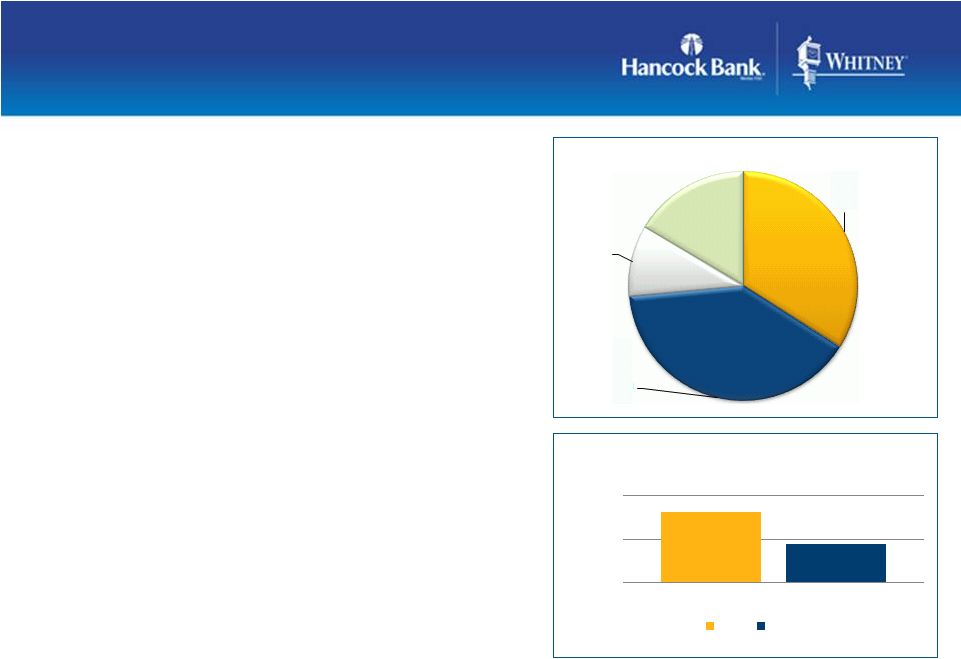
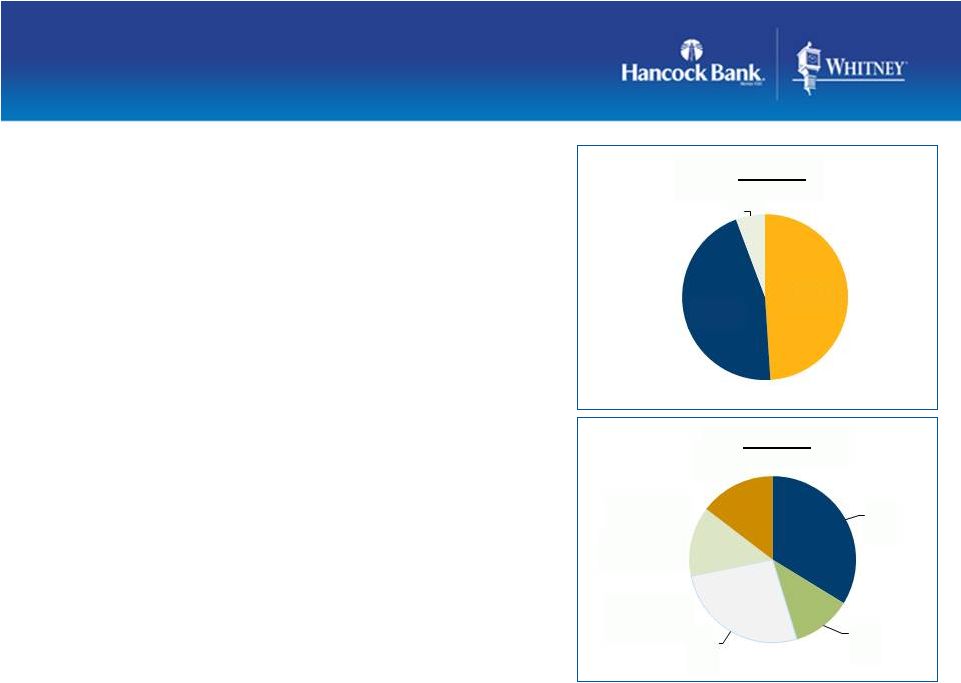 Retaining Legacy Business;
Generating New Business
Generating New Business
•
Total loans $11.1B
(Average loans increased $50 million compared to 4Q11)
•
Loans virtually flat linked-quarter
(after adjusting for the decline in the covered Peoples First
portfolio) •
Funded over $500 million of new loans
throughout the company’s footprint from
both existing and new customers
•
Growth in construction, residential mortgage,
consumer loans
•
Seasonal payoffs on C&I credits
•
Decline in commercial real estate loans reflect in part
scheduled payoffs and paydowns
As of March 31, 2012
10
Originated
49%
Acquired
45%
Peoples First
Loan Mix
6%
C&I
34%
C&D
11%
CRE
%
Residential
mortgage
14%
Consumer
14%
Loan Mix
27 |
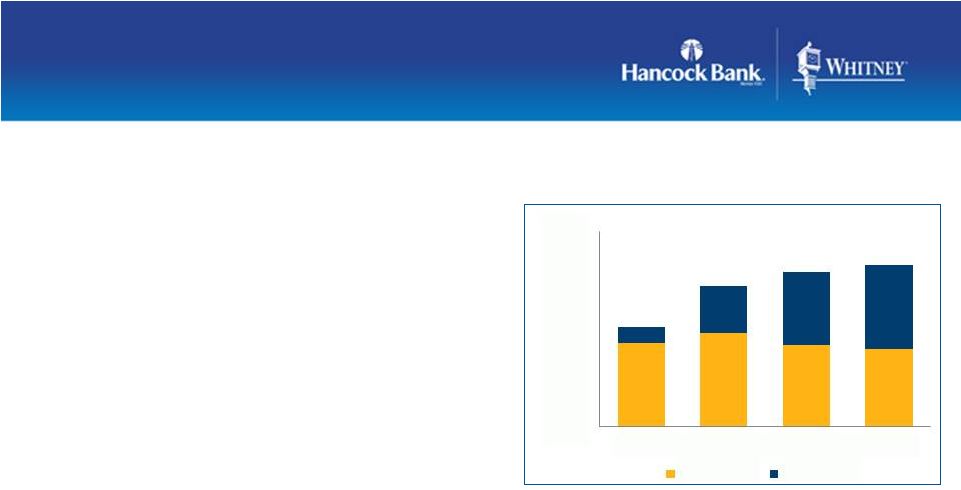
 Strong Core Deposit
Funding
Funding
•
Total deposits $15.4B
(Average deposits virtually unchanged from 4Q11)
•
Historically both banks build deposits at
year-end with some deposit runoff in the
first quarter
•
Funding mix remained strong
–
Low cost of funds (38bps); down 6bps from 4Q11
–
Noninterest bearing demand deposits (DDA)
comprised 34% of total period-end deposits
•
$1.2B in CDs maturing over the next 2
quarters at average rate of .92%
As of March 31, 2012
11
$0
$500
$1,000
CDs Maturing
CDs Maturing
2Q12
3Q12
funds
10%
Deposit Mix
DDA
35%
Public
Time
deposits
18%
Interest
bearing
transaction
37% |
 Strong, Stable
Net Interest Margin
Net Interest Margin
•
Net interest margin 4.43% up 4bps
linked-quarter
–
Approximately 43bps of the NIM was related to
net accretion of Whitney purchase accounting
adjustments
–
Accretion amounts are reevaluated quarterly
•
Reflects a favorable shift in funding
sources, a decline in funding costs,
offset by a decline in loan yields
•
Expect the NIM will remain relatively
stable over the next couple of quarters
–
Deployment of excess liquidity and CD repricing
will continue to favorably impact margin and help
offset earning asset repricing headwinds
* Excludes impact of Whitney purchase accounting adjustments
** Impact of Whitney purchase accounting adjustments.
As of March 31, 2012
Net Interest Margin
12
4.03%
4.08%
4.02%
4.00%
0.08%
0.24%
0.37%
0.43%
3.60%
3.80%
4.00%
4.20%
4.40%
4.60%
2Q11
3Q11
4Q11
1Q12
"Core" NIM*
PAA** |
 Working To Enhance
Fee Growth
Fee Growth
•
Noninterest income totaled $61.5 million in 1Q12
•
Remaining restrictions on interchange rates related to the Durbin
Amendment anticipated in 3Q12
–
Expected to cost an additional $2 million per quarter compared to
current levels –
New products and services expected to offset approximately 40% of the
anticipated loss of income •
Cross-sell opportunities expected to generate additional fee
income –
Private Banking
–
Treasury Management
–
International Banking
–
Insurance
As of March 31, 2012
13 |
 Focused On Realization
Of Remaining Cost Synergies
Of Remaining Cost Synergies
•
Operating expense totaled $172 million in 1Q12, up $6 million from
4Q11* –
Amortization of intangibles increased $1.1 million
–
Personnel expense increased $3.4 million, primarily related to an
increase in benefits –
ORE expense increased $2.3 million
•
Additional cost savings were not expected during the first quarter of
2012 due to the core systems conversion
–
Additional cost savings will be generated beginning in the second
quarter as a result of completing the systems conversion and
closing branches •
Efficiency ratio 67.81% in 1Q12**
–
Short term target: 62-63%
–
Longer term target: less than 60%
As of March 31, 2012
* Excludes merger costs
** Noninterest expense as a percent of total revenue (TE) before
amortization of purchased intangibles and securities transactions and
merger expenses 14 |
 Sam Kendricks
Chief Credit Officer |
 Credit Quality
Stable
Stable
•
Allowance for loan losses was $142 million, up from $125 million
at year-end 2011
–
Most of the increase related to the FDIC covered Peoples First
portfolio •
Provision for loan losses was $10 million
•
Net charge-offs totaled $7 million, or 0.25%, related to the
non- covered portfolio
•
ALLL/loans was 1.55% (excluding the impact of the Whitney
acquired loans and FDIC covered loans)
•
Total nonperforming assets increased $11 million
linked-quarter –
Mainly related to an increase in legacy Hancock NPLs
As of March 31, 2012
16 |
 Whitney Acquired Portfolio
Performing Positively
Performing Positively
•
Whitney acquired portfolio performing positively
•
Peoples First portfolio covered by a FDIC loss-sharing
agreement •
Increase in legacy Hancock nonaccrual loans
•
Impacted by a few credits previously identified as problems
•
Mainly commercial real estate credits in Louisiana
•
Remain cautious on the economic recovery
•
Conservative in our review of credits
As of March 31, 2012
17 |
 Carl
Chaney
President
&
CEO |
 •
Organic/
De Novo Growth
•
Organic/
De Novo Growth
Opportunities For
Growth
Opportunities For
Growth
•
Live Bank
Transactions
•
Live Bank
Transactions
•
FDIC-Assisted
Acquisitions
•
FDIC-Assisted
Acquisitions
19 |
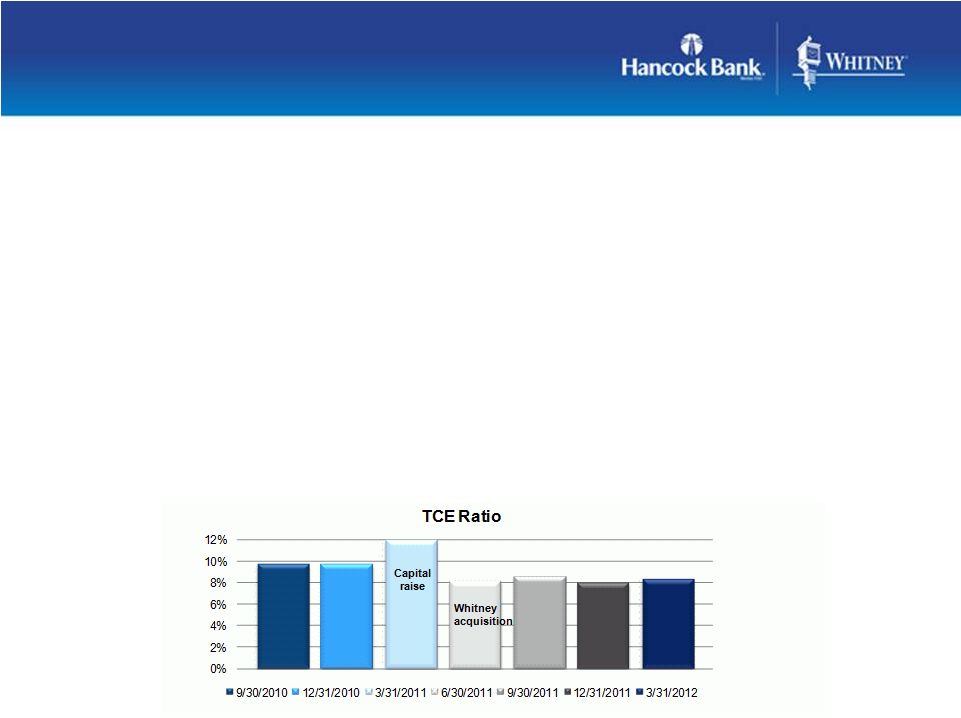 •
TCE ratio improved to 8.27% from year-end 2011
•
TCE ratio target: 8% minimum
•
Expect to build capital in the near term
•
Many opportunities to deploy excess capital
•
Primary: Expansion through organic growth and M&A
•
Secondary: Stock buybacks or increased dividends
Well-Capitalized
Well-Capitalized
Company
Company
As of March 31, 2012
20 |
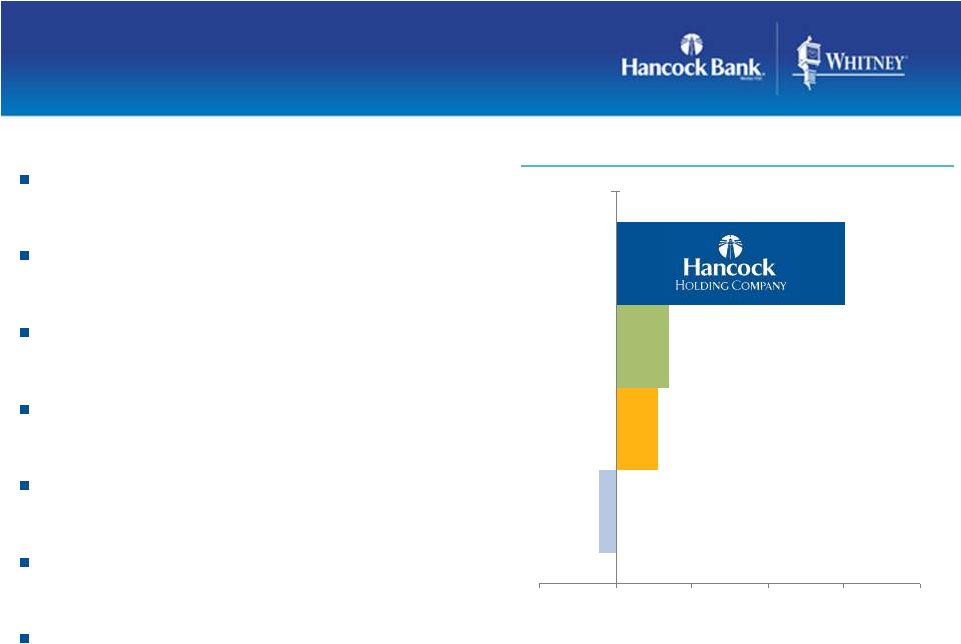 Well Positioned For
The Future
The Future
Premier Gulf South franchise
History of effective capital management
Superior liquidity
Conservative credit culture
Enhanced earnings potential
Well positioned for future growth
Focused on shareholder value creation
Notes:
1.
As of 12/31/2011
2.
KRX index of 50 regional U.S. banks
3.
BKX index of 24 large-cap U.S. banks
10-Year
Total
Return
(1)
180%
42%
33%
(13%)
(60)
0
60
120
180
240
Large Cap
Peers
(3)
Regional
Peers
(2)
S&P 500
Index
21 |
 Gulf South Bank
Conference
May 14, 2012
Gulf South Bank
Conference
May 14, 2012 |
 Appendix |
  Non-GAAP
Reconciliation
Non-GAAP
Non-GAAP
Reconciliation
Reconciliation
(amounts in thousands)
(unaudited)
3/31/2012
12/31/2011
3/31/2011
Income Statement
Interest income
$191,716
$196,500
$82,533
Interest income (TE)
194,665
199,453
85,405
Interest expense
15,428
18,131
15,769
Net interest income (TE)
179,237
181,322
69,636
Provision for loan losses
10,015
11,512
8,822
Noninterest income excluding
securities transactions
61,494
60,592
34,183
Securities transactions gains/(losses)
12
(20)
(51)
Noninterest expense
205,463
205,610
73,019
Income before income taxes
22,316
21,819
19,055
Income tax expense
3,821
2,854
3,727
Net income
$18,495
$18,965
$15,328
Merger-related expenses
33,913
40,202
1,588
Securities transactions gains/(losses)
12
(20)
(51)
Taxes on adjustments
11,865
14,078
574
Operating income (a)
$40,531
$45,109
$16,393
Difference between interest income and interest income (TE)
$2,949
$2,953
$2,872
Provision for loan losses
10,015
11,512
8,822
Merger-related expenses
33,913
40,202
1,588
Less securities transactions gains/(losses)
12
(20)
(51)
Income tax expense
3,821
2,854
3,727
Pre-tax, pre-provision profit (PTPP) (b)
$69,181
$76,506
$32,388
Three Months Ended
(a) Net income less tax-effected merger costs and securities gains/losses. Management believes
that this is a useful financial measure because it enables investors to assess ongoing
operations. (b) Pre-tax pre-provision profit (PTPP) is total revenue less
noninterest expense, merger items, and securities transactions. Management believes that PTPP
profit is a useful financial measure because it enables investors and others to assess the Company’s ability to generate capital to cover credit
losses through a credit cycle.
24 |
 Investor
Contacts
Investor
Investor
Contacts
Contacts
Carl J. Chaney –
President & CEO
carl.chaney@hancockbank.com
Trisha
Voltz
Carlson
-
SVP,
Investor
Relations
trisha.carlson@hancockbank.com
Hancock Holding Company
P.O. Box 4019, Gulfport, MS 39502
Phone: 228.868.4000 or 1.800.522.6542
www.hancockbank.com
or www.whitneybank.com
Michael M. Achary –
EVP & CFO
michael.achary@hancockbank.com
25 |