Attached files
| file | filename |
|---|---|
| 8-K - MAY 10 2012 8-K - WASHINGTON FEDERAL INC | wafd8-k.htm |

1 14th Annual Financial Services Conference May 9th, 2012 Exhibit 99.1
2 Forward Looking Statements This presentation contains forward-looking statements within the meaning of the Private Securities Litigation Reform Act of 1995. Such statements are based upon the current beliefs and expectations of Washington Federal’s management and are subject to significant risks and uncertainties. The forward-looking statements in this presentation speak only as of the date of the presentation, and Washington Federal assumes no duty, and does not undertake, to update them. Actual results or future events could differ, possibly materially, from those that we anticipated in these forward-looking statements.

3 • Since 1917 • 166 Branches in Eight Western States • Consumer Lending • Commercial Real Estate • Business Banking • Strong Capital, Asset Quality, Low-cost provider • Portfolio Lender • Profitable every year since 1982 IPO • 16 Acquisitions since IPO PROFILE
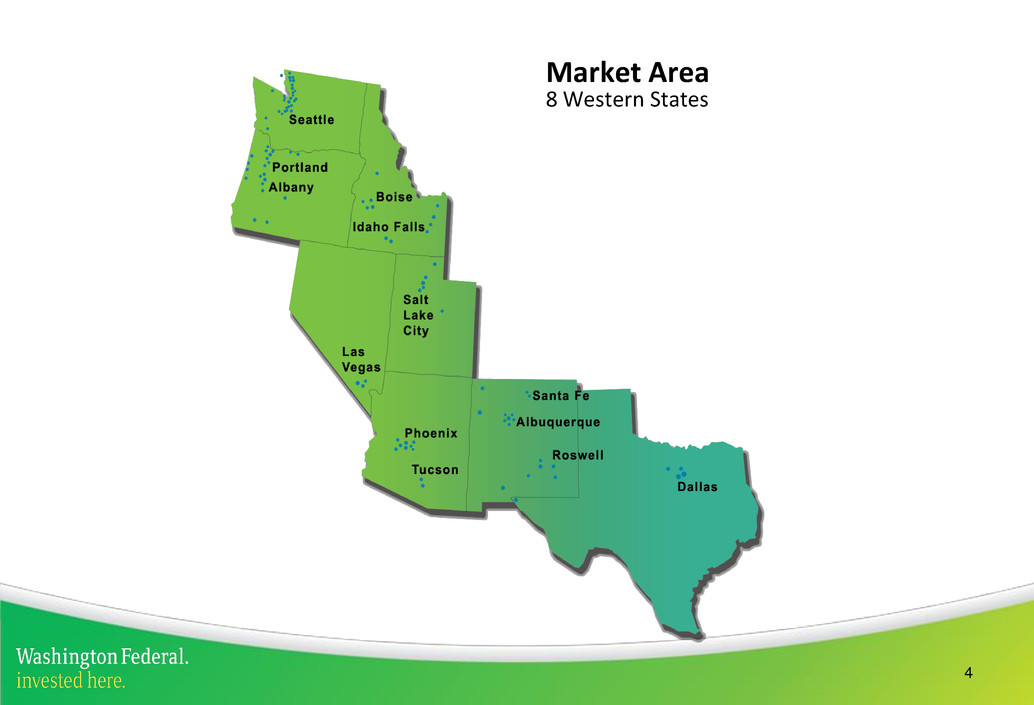
4 Market Area 8 Western States

Washington Federal, Inc. to Acquire South Valley Bancorp, Inc. • Announced April 4, 2012, expected closing in the 3rd calendar quarter • All stock, WAFD to Issued 1,996,387 shares or 1.87% of total shares outstanding • Expected to be accretive to earnings immediately • WAFD stock consideration is 51% of SV Tangible Book Value • $39 million pool of earn out assets: • Pre-close - 100% of collections to SV shareholders • Post-close – 51.2% of collections to SV shareholders and 48.8% to WAFD WAFD SVBT COMBINED Gross Loans (including covered) 8,663,731$ 93.4% 609,366$ 6.6% 9,273,097$ 100.0% Estimated Duration 3 of loan portfolios 2.33 1.30 2.26 % Variable Rate 10.3% 70.3% 14.2% % Fixed Rate 89.7% 29.7% 85.8% 100.0% 100.0% 100.0% 3 Duration is defined as the weighted average years until estimated loan cash flows are to be received WAFD SVBT COMBINED Total Deposits 8,875,675$ 92.1% 766,507$ 7.9% 9,642,182$ 100.0% Weighted Average Cost of Deposits 1.03% 0.56% 0.99% Transaction Accounts as % of Total 32.1% 70.4% 35.2% 5

Washington Federal Branches South Valley Branches Map of Oregon Locations - Proforma 6

Washington Federal Acquired Western National Bank in an FDIC Assisted Transaction • Closed December 16, 2011 • Total Assets of $177 million, loans of $143 million, discount of $53 million • No FDIC loss share protection • WAFD can work out the loans based on business judgment • WNB had three branches, two were consolidated • Fully converted and integrated into WAFD platform system in March 2012 Washington Federal Acquired Six Branches in New Mexico • Closed on October 14, 2011 • Acquired $253 million of deposits only • No loans were acquired • Added four branches in Albuquerque and two branches in Santa Fe • Branches were formerly part of Charter Bank, that was an FDIC failure in Jan 2010 • Fully converted and integrated into WAFD platform system in October 2011 7

MARKET UPDATES Current vs. Prior Year Unemployment Rate (UR) Median Home Price 8 Source: DA Davidson Research Report 5/8/12

9 $0 $2,000 $4,000 $6,000 $8,000 $10,000 $12,000 $14,000 Total Assets (in millions) $13.5
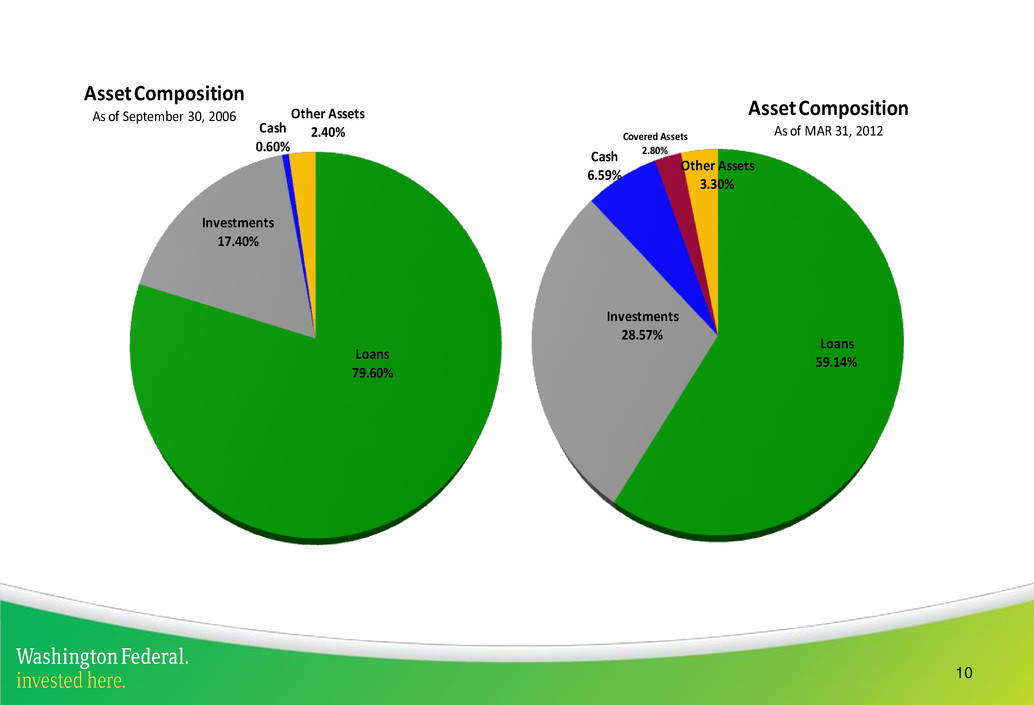
10 Loans 79.60% Investments 17.40% Cash 0.60% Other Assets 2.40% Asset Composition As of September 30, 2006 Loans 59.14% Investments 28.57% Cash 6.59% Covered Assets 2.80% Other Assets 3.30% Asset Composition As of MAR 31, 2012
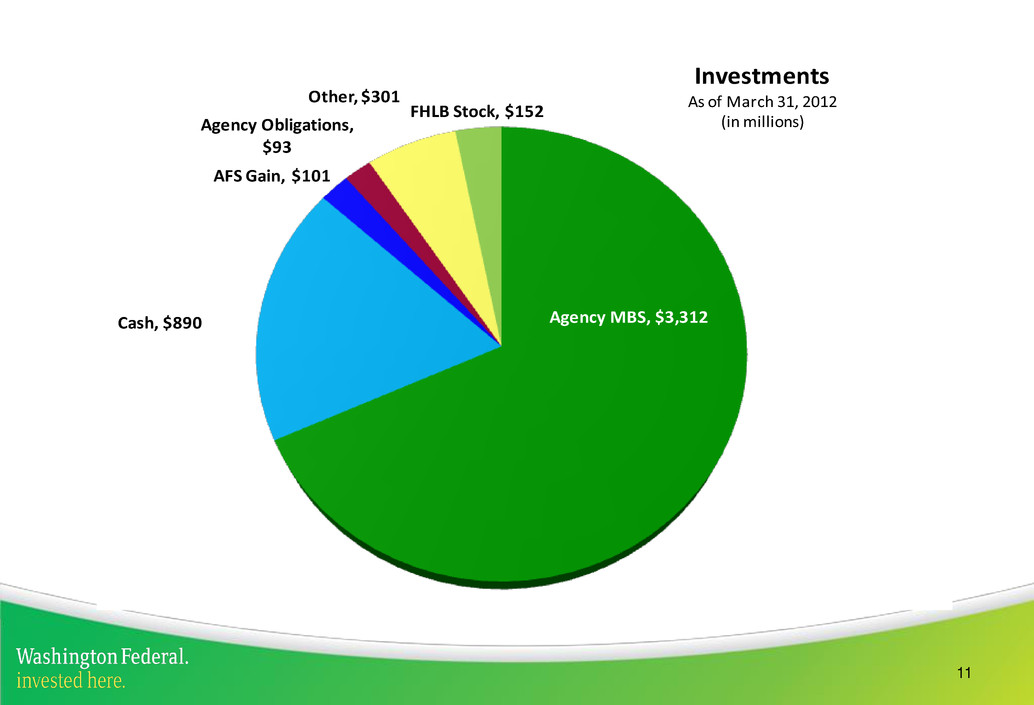
11 Agency MBS, $3,312Cash, $890 AFS Gain, $101 Agency Obligations, $93 Other, $301 FHLB Stock, $152 Investments As of March 31, 2012 (in millions)

12 $0 $1,000 $2,000 $3,000 $4,000 $5,000 $6,000 $7,000 $8,000 $9,000 $10,000 $5,388 $9,502 $7,979 Net Loans (in millions)

13 184 98 0.00% 0.50% 1.00% 1.50% 2.00% 2.50% Net Loan Charge Offs As a % of Loans Outstanding

Outstanding $ Outstanding % Cumulative1 Charge Offs $ % of Cumulative1 Charge Offs Single-Family Residential 5,974$ 74% 114$ 26% Construction - Speculative 129 2% 63 14% Construction - Custom 236 3% 1 0% Land - Acquisition & Development 156 2% 207 47% Land - Consumer Lot Loans 150 2% 6 1% Multi-Family 688 9% 6 1% Commercial Real Estate 394 5% 2 0% Commercial & Industrial 103 1% 19 4% HELOC 131 2% 1 0% Consumer 71 1% 16 4% 8,031$ 100% 436$ 100% 1 Net charge offs 10/1/08 - 3/31/12 14 Charge Offs By Loan Type March 31, 2012 (in millions)

15 Accounting Guidance – A modification is a Troubled Debt Restructuring if: 1) Borrower is experiencing financial difficulties 2) A concession is made. Most importantly – Current GAAP says once a TDR, always a TDR Balance Count Avg Balance Performing TDR's 372,825,472$ 87.4% 1,461 255,185$ Perf. Del 30 to 90 days 14,184,496 3.3% 76 186,638 Non-Performing TDR's 39,779,018 9.3% 188 211,591 Total TDR's 426,788,986 100% 1,725 247,414 3 Mo 93,093,288 25.0% 6 Mo 69,261,243 18.6% 9 Mo 38,142,103 10.2% 12 Mo 25,899,813 6.9% 15 Mo 30,754,976 8.2% 18 Mo 18,316,992 4.9% Over 18 Mo 97,357,058 26.1% Total Current TDR's 372,825,472 100% Performing TDR's Months since Modification Total TDR's as of 03/31/12

The accounting treatment of TDR’s is causing peer group comparisons to be confusing and potentially misleading. This is based on commonly used industry data providers.
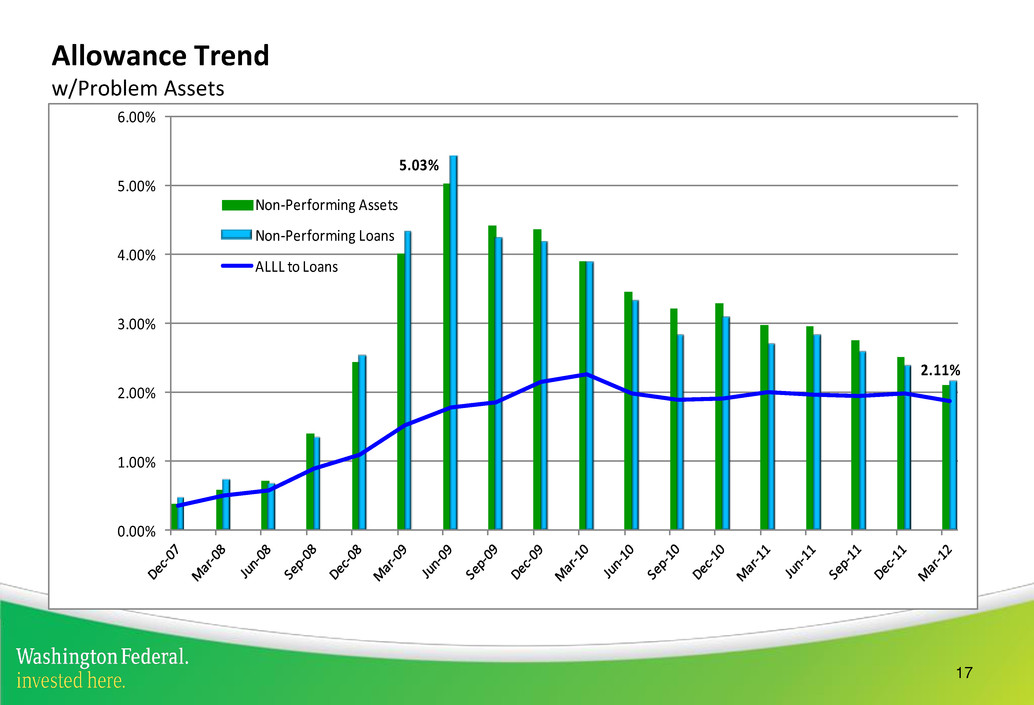
17 Allowance Trend w/Problem Assets 5.03% 2.11% 0.00% 1.00% 2.00% 3.00% 4.00% 5.00% 6.00% Non-Performing Assets Non-Performing Loans ALLL to Loans
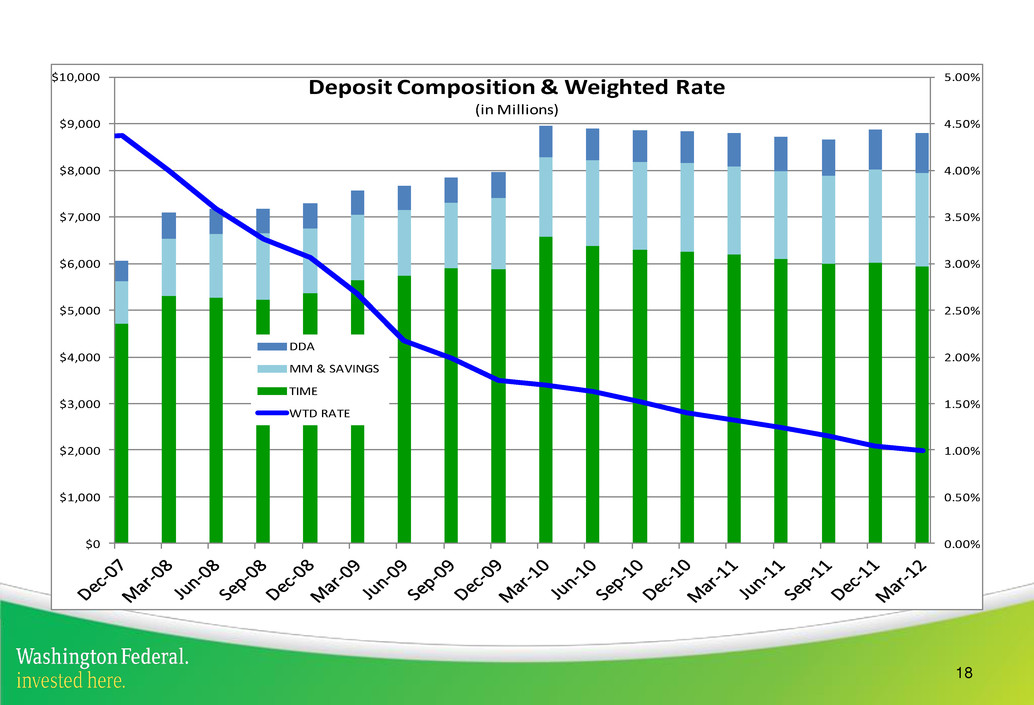
18 0.00% 0.50% 1.00% 1.50% 2.00% 2.50% 3.00% 3.50% 4.00% 4.50% 5.00% $0 $1,000 $2,000 $3,000 $4,000 $5,000 $6,000 $7,000 $8,000 $9,000 $10,000 Deposit Composition & Weighted Rate (in Millions) DDA MM & SAVINGS TIME WTD RATE
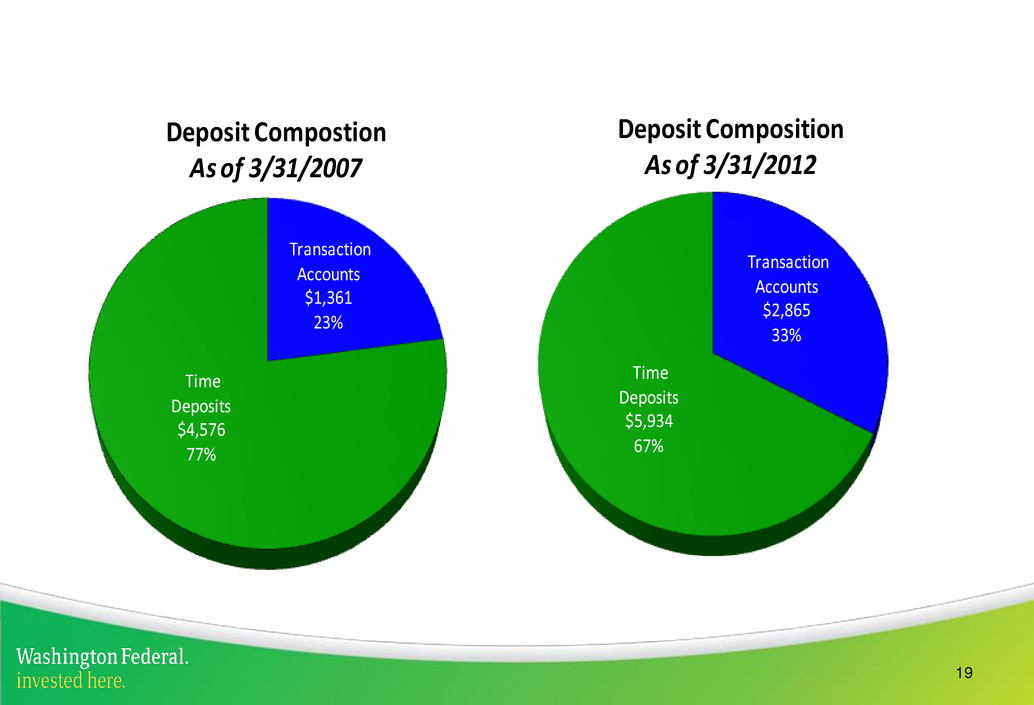
19 Transaction Accounts $1,361 23% Time Deposits $4,576 77% Deposit Compostion As of 3/31/2007 Transaction Accounts $2,865 33% Time Deposits $5,934 67% Deposit Composition As of 3/31/2012

20 Capital – Market Comparison (in billions) Source: SNL as of March 2012 Company Name Total Assets Asset Rank Tangible Assets Tang Common Eqty/ Tang Assts (%) TCE / TA RANK JPMorgan Chase & Co. 2,265.8 1 2,214.4 5.62 95 Bank of America Corp. 2,136.6 2 2,058.6 6.50 86 Citigroup Inc. 1,873.9 3 1,841.9 7.90 56 Wells Fargo & Co. 1,313.9 4 1,279.8 7.40 69 U.S. Bancorp 340.1 5 330.0 6.43 89 Bank of New York Mellon Corp. 325.8 6 302.7 3.42 99 PNC Financial Services Group 271.4 7 262.4 8.91 37 State Street Corp. 216.4 8 208.3 5.18 97 Capital One Financial Corp. 206.1 9 191.9 8.06 54 SunTrust Banks Inc. 176.9 10 170.5 7.77 62 Washington Federal, Inc. 13.6 52 13.3 12.19 5

21 Net Interest Spread is the difference between the weighted averaged rate earned on assets and the weighted average rate paid on liabilities 2.16% 3.81% 2.17% 4.14% 2.57% 2.04% 3.01% 2.05% 3.01% 1.00% 1.50% 2.00% 2.50% 3.00% 3.50% 4.00% 4.50% 5.00% Net Interest Spread
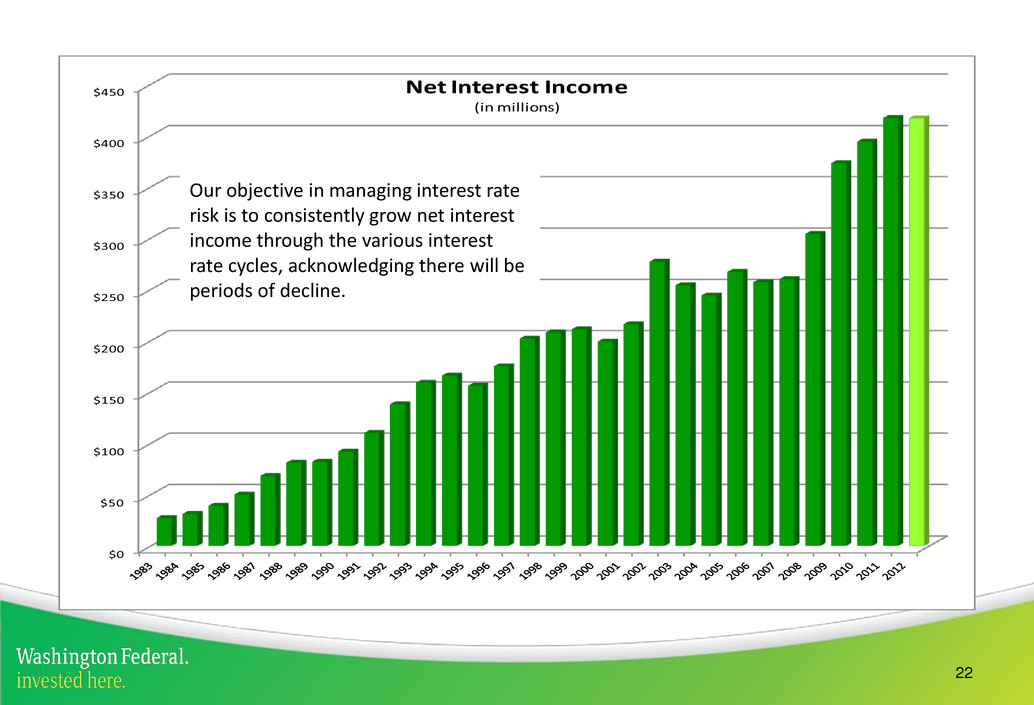
22 $0 $50 $100 $150 $200 $250 $300 $350 $400 $450 Net Interest Income (in millions) Our objective in managing interest rate risk is to consistently grow net interest income through the various interest rate cycles, acknowledging there will be periods of decline.

23 This assumes immediate increases in rates and no change is size or composition of balance sheet. Investing cash and lagging deposit rates are options that would be available. $250 $270 $290 $310 $330 $350 $370 $390 $410 $430 Year 1 Year 2 Year 3 Potential Impact of Rising Rates NII Base (no changes) NII up 200 NII up 300S 100L
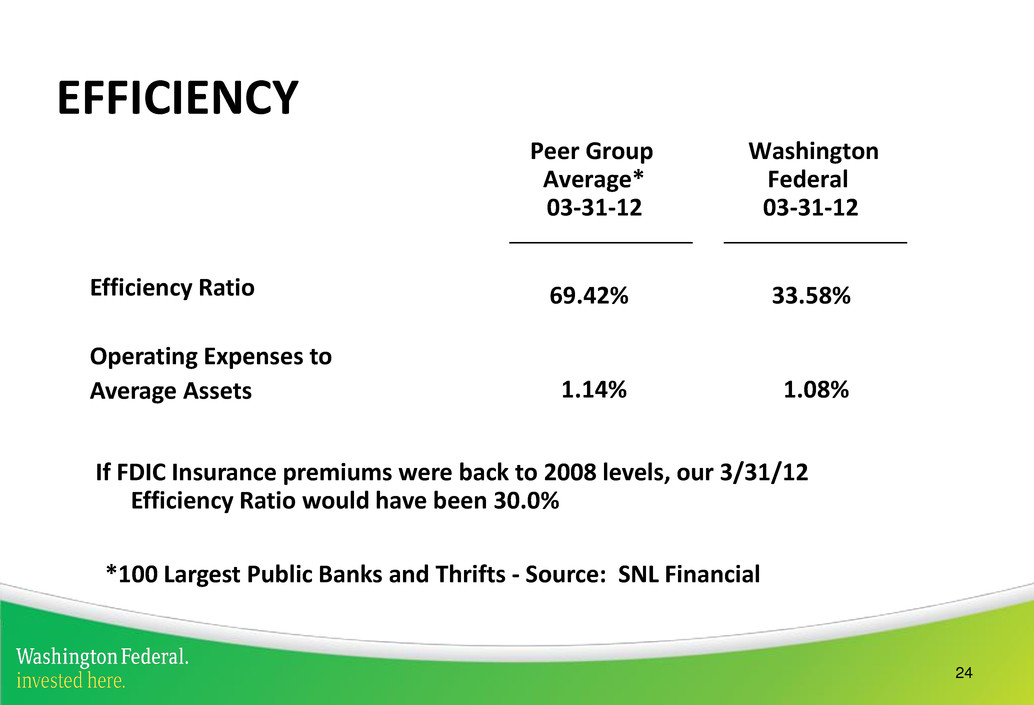
24 Peer Group Average* 03-31-12 69.42% 1.14% Efficiency Ratio Operating Expenses to Average Assets 33.58% 1.08% *100 Largest Public Banks and Thrifts - Source: SNL Financial EFFICIENCY Washington Federal 03-31-12 If FDIC Insurance premiums were back to 2008 levels, our 3/31/12 Efficiency Ratio would have been 30.0%

25 $0 $20 $40 $60 $80 $100 $120 $140 $160 $148 $67 YTD Net Income (in millions)

26 $- $0.05 $0.10 $0.15 $0.20 $0.25 $0.30 $0.35 $- $5 $10 $15 $20 $25 $30 $35 $40 Jun-10 Sep-10 Dec-10 Mar-11 Jun-11 Sep-11 Dec-11 Mar-12 Net Income - Last 8 Quarters and EPS (in Millions) Net Income EPS

27 Peer Group Average* 3-31-12 7.89% .81% Return on Average Equity (ROE) Return on Average Assets (ROA) 7.12% 1.00% *100 Largest Public Banks and Thrifts - Source: SNL Financial PERFORMANCE RATIOS Washington Federal 3-31-12

28 Returning Capital to Shareholders WFSL has paid 117 consecutive quarterly cash dividends Increased cash dividend $.02 or 33% in December Current cash dividend of $.08 provides a yield of 1.8% based on recent prices Year to date the Company has returned 70% of net income to shareholders

29 $0 $5 $10 $15 $20 $25 $30 Stock Price per Share and Book Price per Share Stock Price Book Price Book Value per Share $17.85 Tangible Book Value per Share $15.45

30 14th Annual Financial Services Conference May 9th, 2012
