Attached files
| file | filename |
|---|---|
| 8-K - FORM 8-K - Carbonite Inc | d348469d8k.htm |
 Tuesday, May 08, 2012
©
Carbonite, Inc | Company Confidential
Carbonite, Inc. (NASDAQ: CARB)
Investor Presentation
May 2012
1
Exhibit 99.1 |
 2
©
Carbonite, Inc | Company Confidential
Safe Harbor Statement
Cautionary Language Concerning Forward-Looking Statements
These slides and the accompanying oral presentation contain
"forward-looking statements" within the meaning of the Securities Act of
1933, as amended, the Securities Exchange Act of 1934, as amended, and the Private
Securities Litigation Reform Act of 1995. These forward-looking
statements represent the Company’s views as of the date that they were first made based on the current intent,
belief or expectations, estimates, forecasts, assumptions and projections of the
Company and members of our management team. Words
such
as
“expect,”
“anticipate,”
“should,”
“believe,”
“hope,”
“target,”
“project,”
“goals,”
“estimate,”
“potential,”
“predict,”
“may,”
“will,”
“might,”
“could,”
“intend,”
and any variations of these terms or the negative of these terms and similar
expressions are intended to identify these forward-looking statements.
Those statements include, but are not limited to, statements regarding guidance on our
future financial results and other projections or measures of future performance,
and our expectations concerning market opportunities and our ability to
capitalize on them. Forward-looking statements are subject to a number of risks and uncertainties, many of which
involve factors or circumstances that are beyond the Company’s control. The
Company’s actual results could differ materially from those stated or
implied in forward-looking statements due to a number of factors, including, but not limited to, the Company’s ability to
profitably attract new customers and retain existing customers, the Company’s
dependence on the market for online computer backup services, the
Company’s ability to manage growth, and changes in economic or regulatory conditions or other trends affecting the
Internet and the information technology industry. These and other important risk
factors are discussed or referenced in our Quarterly Report
on
Form
10-Q
for
the
fiscal
quarter
ended
March
31,
2012,
which
is
available
on
www.sec.gov,
under
the
heading
“Risk
Factors”
and elsewhere, and any subsequent periodic or current reports filed by us with the
SEC. The Company anticipates that subsequent events and developments will
cause its views to change. Except as required by applicable law or regulation, the Company
does not undertake any obligation to update our forward-looking statements to
reflect future events or circumstances. |
 3
©
Carbonite, Inc | Company Confidential
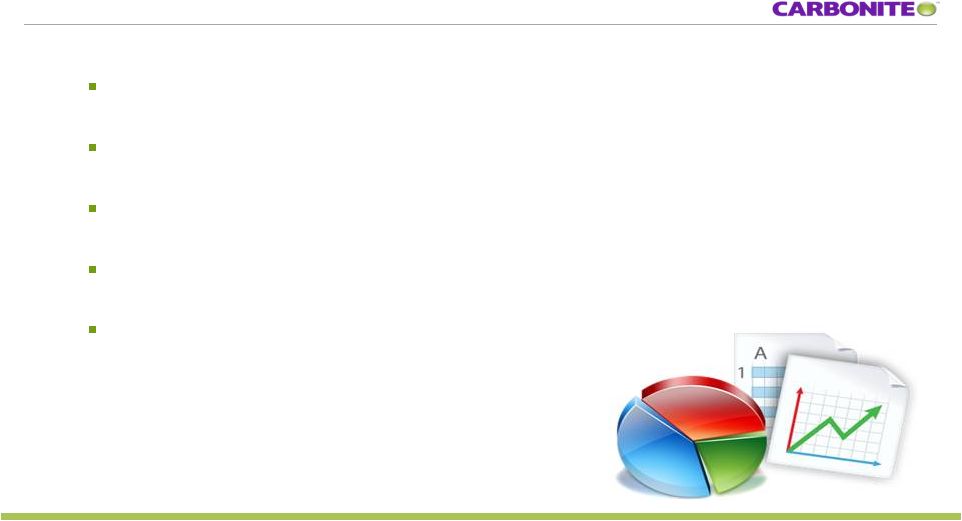
Rapid growth
in bookings, customers and revenue
Highly scalable
subscription-based model with strong visibility
New products
driving higher ASP, ARPU and margins
High
retention rates
Approaching
free cash flow breakeven
Financial highlights |
 4
©
Carbonite, Inc | Company Confidential
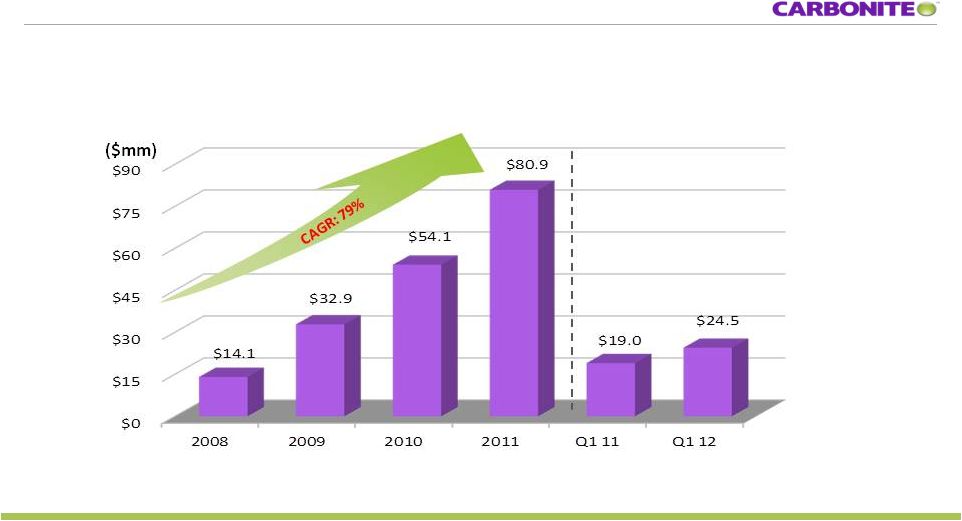
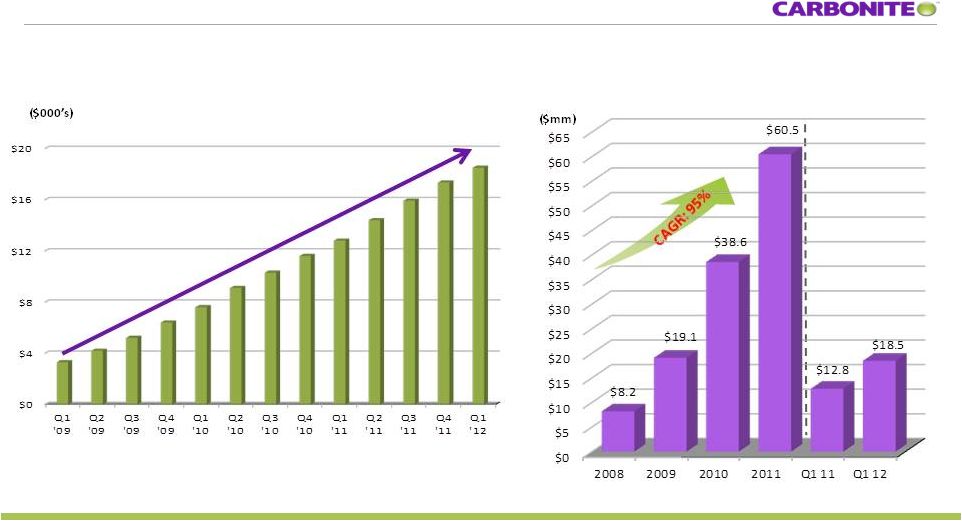
Consistent bookings growth
Highly predictable subscription-based model with consistent bookings
growth Source: Carbonite SEC Filings
Note: Bookings during a period is defined as revenue recognized during the period
plus change in deferred revenue. See appendix for a reconciliation of
bookings to revenue for the periods presented. |
 5
©
Carbonite, Inc | Company Confidential
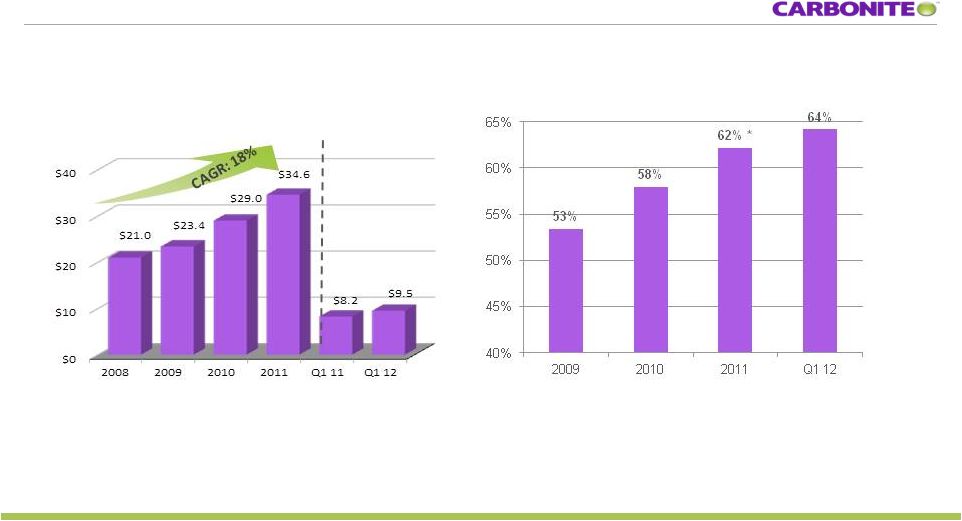
Rapid revenue growth
Predictable revenue growth: record revenue every quarter since launch
Source: Carbonite SEC Filings |
 6
©
Carbonite, Inc | Company Confidential
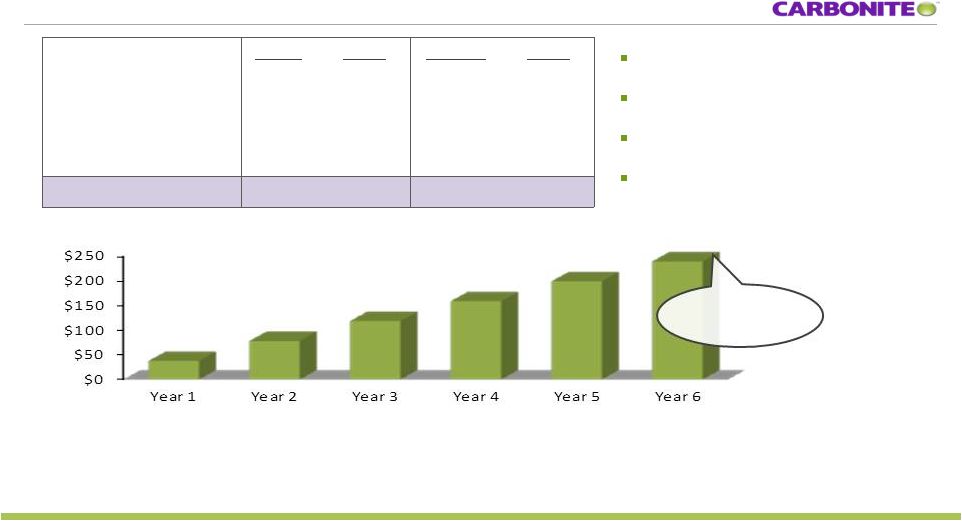
Our highly scalable business model
High lifetime value
Highly scalable
Strong visibility
Significant operating leverage
Cumulative gross margin per customer
$38
$78
$119
$159
$240
Source: Carbonite filings and management estimates
Based
on
1
year
Home
subscription,
5.99
year
customer
life
based
on
85.7%
annual
retention
rate
for
today’s
core
business
and
cost
structure.
Does
not
account
for
projected
future
decline
in storage, bandwidth costs or customer support. Excludes stock based compensation.
CAC represents $43.14 average customer acquisition costs based on full year 2011 advertising expense/
new
bookings
during
the
same
period
times
$59
purchase
price
for
a
one
year
Home
product
subscription.
Year 1
% rev
Lifetime
% rev
Revenue per customer
$59
100%
$354
100%
Depreciation & hosting
(13)
(22%)
(80)
(23%)
Customer support
(8)
(14%)
(34)
(10%)
Gross margin
$38
64%
$240
68%
$200
Business model illustration
5.6x gross
margin return
on CAC |
 Tuesday, May 08, 2012
©
Carbonite, Inc | Company Confidential
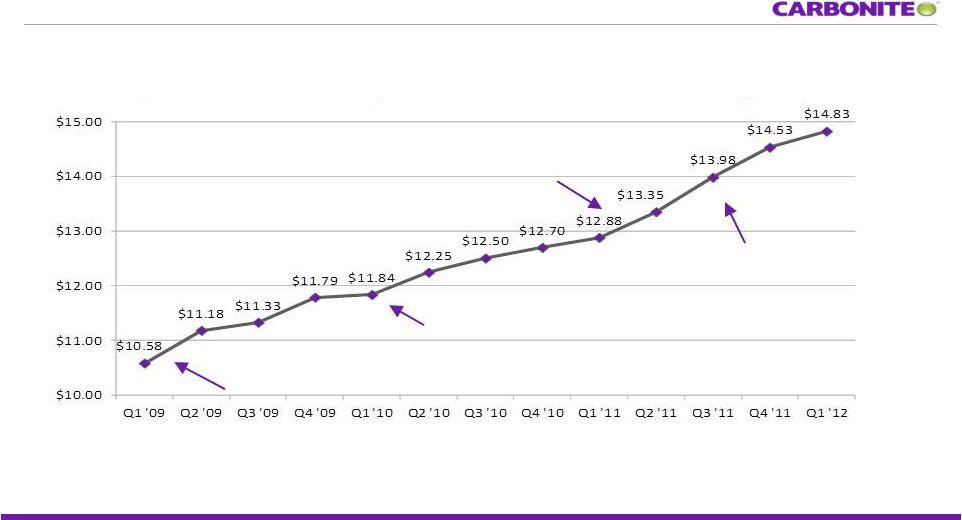
Increasing revenue per customer
Consistent growth in revenue per customer, with further upside
potential from the recently launched Consumer and SMB offerings
Price increase and release of second
generation business products
Release of first generation
business product
Price increase
Release of two new
consumer products
Source: Carbonite filings
Note:
Calculated
as
revenue
for
any
given
quarter
divided
by
the
average
number
of
subscribers
during
that
quarter.
Average
number
of
subscribers
is
the
sum
of
the
total
number
of
subscribers
at
the
end
of
a
quarter
plus
the
total
number
of
subscribers
at
the
end
of
the
prior
quarter,
divided
by
2.
7 |
 8
©
Carbonite, Inc | Company Confidential
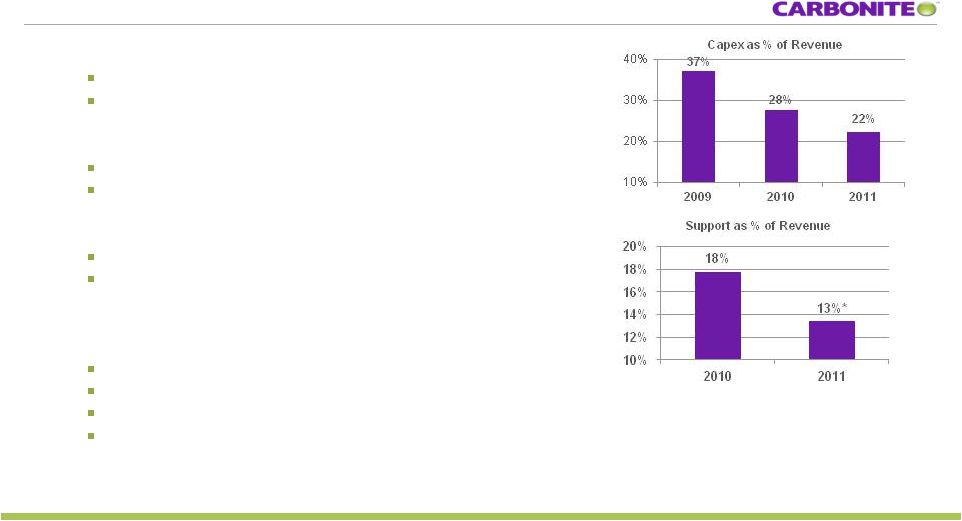
Mix shift toward new products
Adoption and upsell upon renewal ramps over time
Higher ASP and higher gross margins
Rapid decline in storage costs at ~30-40% per year
4 year depreciable life, delayed impact to P&L
Temporary flattening in 2012 from Thailand flooding
Unlimited free support: major differentiator to our offerings
50% of lifetime support contacts during trial and year 1,
remainder over next ~5 years of a customer's life
Electricity and broadband: largest components of COS
after support and depreciation
Datacenter locations moving to lower cost electricity areas
Economies achieved by increasing equipment density
High BB consumption during initial upload
Purchasing power at scale
Source: Carbonite filings and management estimates. Support excludes stock based
compensation expense. Drivers of margin expansion
*2011 Included transition
of support to US |
 Tuesday, May 08, 2012
©
Carbonite, Inc | Company Confidential
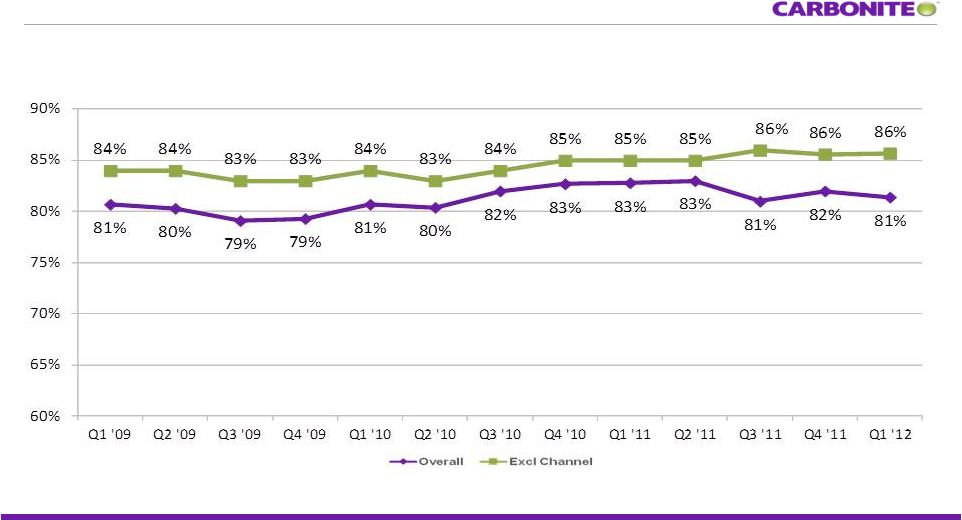
Strong customer retention
Consistently high customer retention rates, key to our model
Overall includes discontinued channel including force
churn customers (20K in Q3 2011 and 15K in Q1 12)
9
Source: Carbonite filings
Note: Annual retention rate is the percentage of customers on the last day of the
prior period who remain customers on the last day of the current period.
Channel sales being deliberately phased out. |
 10
©
Carbonite, Inc | Company Confidential
Business model with declining costs per customer leading to
expanding margin profile:
Gross profit
per customer
Source: Carbonite SEC Filings
1. Adjusted for stock-based compensation and amortization of intangibles.
Improving
margins
Gross Margin
*2011 included costs of transition support to US
and duplicate datacenter cost
(DC relocation completed end of Q1 2012)
1
1 |
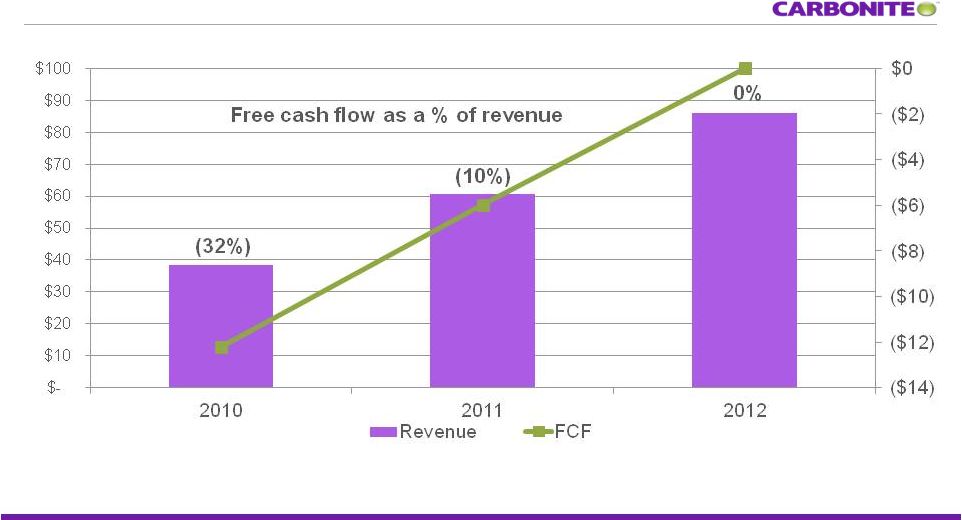 Revenue
and free cash flow trajectory (in million’s)
Source: Carbonite filings
2012 FCF expectation and revenue at mid point of guidance range provided in Q1 2012
earnings release. FCF expected at or near breakeven and excludes cash impact
of non GAAP adjustments Revenue
FCF (Burn)
11
©
Carbonite, Inc | Company Confidential |
 12
©
Carbonite, Inc | Company Confidential
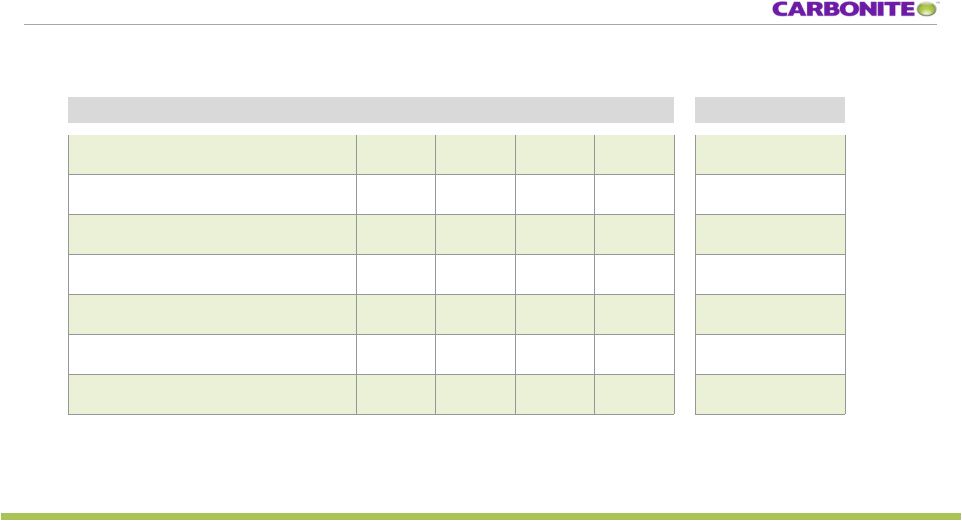
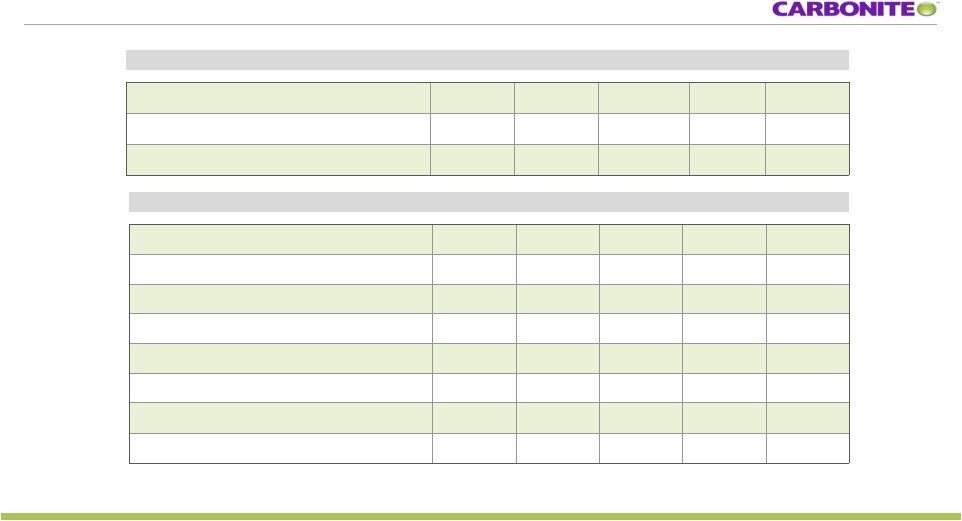
Long term financial model
Financial metric
Historical performance¹
LT Objectives²
2008
2009
2010
2011
% of revenue
Revenue
100%
100%
100%
100%
100%
Gross margin*
48%
53%
58%
62%
76-78%
Research & development*
56%
32%
28%
26%
19-21%
General & administrative*
28%
12%
10%
9%
8-9%
Sales & marketing*
179%
110%
86%
62%
34-36%
EBITDA margin*
(197%)
(85%)
(53%)
(22%)
20-25%
FCF margin*
(151%)
(42%)
(32%)
(10%)
25-30%
1.
Source: Carbonite filings. Financials exclude stock based compensation,
amortization of intangibles and patent litigation expenses. 2.
These objectives are forward-looking, are subject to significant business,
economic, regulatory and competitive uncertainties and contingencies, many of which are beyond the
control
of
the
Company
and
its
management,
and
are
based
upon
assumptions
with
respect
to
future
decisions,which
are
subject
to
change.
Actual
results
will
vary
and
those
variations
may
be
material.
For
discussion
of
some
of
the
important
factors
that
could
cause
these
variations,
please
consult
the
“Risk
Factors”
section
of
the
preliminary
prospectus.
Nothing
in
this
presentation
should
be
regarded
as
a
representation
by
any
person
that
these
objectives
will
be
achieved
and
the
Company
undertakes
no
duty
to
update its objectives.
Business model with significant operating leverage
* Percent of revenue |
 13
©
Carbonite, Inc | Company Confidential
Strong balance sheet
Cash and short-term investments
$68.1
Working capital (deficit)
$9.1
Total assets
$98.3
Deferred revenue, including current portion
$65.6
Total liabilities
$78.5
Total
stockholders’
equity
(deficit)
$19.9
Source: Carbonite SEC Filings
$ in millions
As of March 31, 2012
($mm) |
 14
©
Carbonite, Inc | Company Confidential
Investment highlights
•
Enormous world-wide market opportunity
•
“Category killer”
with established brand leadership
•
Personal cloud important market opportunity
•
Proprietary technology & scale
•
Strong competitive advantages
•
Proven direct marketing expertise
•
Multiple avenues for sustained growth |
 ©
Carbonite, Inc | Company Confidential
Questions?
15 |
 16
©
Carbonite, Inc | Company Confidential
Non-GAAP reconciliation
Source: Carbonite SEC Filings
1. Excludes $586k from acquisitions
$ in thousands
2008
2009
2010
2011
Q1 2012
Revenue
$8,202
$19,114
$38,563
$60,512
18,547
Plus: Change in deferred revenue
5,867
13,743
15,578
20,388
(1)
5,947
Bookings
$14,069
$32,857
$54,141
$80,900
$24,494
$ in thousands
2008
2009
2010
2011
Q1 2012
GAAP Loss from Operations
$(17,852)
$(19,602)
$(25,896)
$(23,554)
$(9,103)
Add: Stock-based Compensation
203
390
542
1,445
956
Add: Amortization of Intangibles
0
0
0
155
67
Add: Patent Litigation Expenses
0
0
39
966
207
Add: Lease exit charge
0
0
0
0
1,174
Non-GAAP Loss from Operations
$(17,649)
$(19,212)
$(25,315)
$(20,988)
$(6,699)
Plus: D&A Less Amort. Of Intangibles
1,481
2,977
5,060
7,715
2,337
Adjusted EBITDA
$(16,168)
$(16,235)
$(20,255)
$(13,273)
$(4,362) |