Attached files
| file | filename |
|---|---|
| EX-10.36 - EX-10.36 - Carbonite Inc | a12312015ex-1036.htm |
| EX-21.1 - EX-21.1 - Carbonite Inc | a12312015ex-211.htm |
| EX-10.35 - EX-10.35 - Carbonite Inc | a12312015ex-1035.htm |
| EX-31.2 - EX-31.2 - Carbonite Inc | a12312015ex-312.htm |
| EX-31.1 - EX-31.1 - Carbonite Inc | a12312015ex-311.htm |
| EX-32.1 - EX-32.1 - Carbonite Inc | a12312015ex-321.htm |
| EX-24.1 - EX-24.1 - Carbonite Inc | a12312015ex-241.htm |
| EX-32.2 - EX-32.2 - Carbonite Inc | a12312015ex-322.htm |
| EX-23.1 - EX-23.1 - Carbonite Inc | a12312015ex-231.htm |
UNITED STATES
SECURITIES AND EXCHANGE COMMISSION
Washington, D.C. 20549
FORM 10-K
x | ANNUAL REPORT PURSUANT TO SECTION 13 OR 15(d) OF THE SECURITIES EXCHANGE ACT OF 1934 |
For the fiscal year ended December 31, 2015
OR
¨ | TRANSITION REPORT PURSUANT TO SECTION 13 OR 15(d) OF THE SECURITIES EXCHANGE ACT OF 1934 |
For the transition period from to
Commission file number: 001-35264
CARBONITE, INC.
(Exact name of registrant as specified in its charter)
Delaware | 33-1111329 | |
(State or other jurisdiction of incorporation) | (I.R.S. Employer Identification No.) | |
Two Avenue de Lafayette Boston, Massachusetts | 02111 | |
(Address of principal executive offices) | (Zip Code) | |
(617) 587-1100
(Registrant’s telephone number, including area code)
Securities Registered pursuant to Section 12(b) of the Act:
Title of Each Class | Name of Exchange on Which Registered | |
Common Stock, par value $0.01 per share | The NASDAQ Stock Market LLC | |
Securities Registered pursuant to Section 12(g) of the Act:
None
Indicate by check mark if the registrant is a well-known seasoned issuer, as defined in Rule 405 of the Securities Act. Yes ¨ No x
Indicate by check mark if the registrant is not required to file reports pursuant to Section 13 or Section 15(d) of the Act. Yes ¨ No x
Indicate by check mark whether the registrant: (1) has filed all reports required to be filed by Section 13 or 15(d) of the Securities Exchange Act of 1934 during the preceding 12 months (or for such shorter period that the registrant was required to file such reports), and (2) has been subject to such filing requirements for the past 90 days. Yes x No ¨
Indicate by check mark whether the registrant has submitted electronically and posted on its corporate Web site, if any, every Interactive Data File required to be submitted and posted pursuant to Rule 405 of Regulation S-T during the preceding 12 months (or for such shorter period that the registrant was required to submit and post such files). Yes x No ¨
Indicate by check mark if disclosure of delinquent filers pursuant to Item 405 of Regulation S-K is not contained herein, and will not be contained, to the best of registrant’s knowledge, in definitive proxy or information statements incorporated by reference in Part III of this Form 10-K or any amendment to this Form 10-K. ¨
Indicate by check mark whether the registrant is a large accelerated filer, an accelerated filer, a non-accelerated filer, or a smaller reporting company. See the definitions of “large accelerated filer,” “accelerated filer” and “smaller reporting company” in Rule 12b-2 of the Exchange Act. (Check one):
Large accelerated filer | ¨ | Accelerated filer | x | |||
Non-accelerated filer | ¨ (Do not check if a smaller reporting company) | Smaller reporting company | ¨ | |||
Indicate by check mark whether the registrant is a shell company (as defined in Rule 12b-2 of the Exchange Act). Yes ¨ No x
As of June 30, 2015, the last business day of the registrant’s most recently completed second quarter, the aggregate market value of the voting stock held by non-affiliates of the registrant was $242,932,539.
As of February 29, 2016, there were 26,969,626 shares of the registrant’s common stock, par value $0.01 per share, outstanding.
DOCUMENTS INCORPORATED BY REFERENCE
Portions of the registrant’s definitive proxy statement for its 2016 Annual Meeting of Stockholders are incorporated by reference into Part III of this Annual Report on Form 10-K.
CARBONITE, INC.
Table of Contents
Page | ||
Item 1. | ||
Item 1A. | ||
Item 1B. | ||
Item 2. | ||
Item 3. | ||
Item 4. | ||
Item 5. | ||
Item 6. | ||
Item 7. | ||
Item 7A. | ||
Item 8. | ||
Item 9. | ||
Item 9A. | ||
Item 9B. | ||
Item 10. | ||
Item 11. | ||
Item 12. | ||
Item 13. | ||
Item 14. | ||
Item 15. | ||
PART I
SPECIAL NOTE REGARDING FORWARD LOOKING STATEMENTS
This Annual Report on Form 10-K (this "Annual Report"), including the sections entitled “Business,” “Risk Factors,” and “Management’s Discussion and Analysis of Financial Condition and Results of Operations,” includes forward-looking statements. The words “believe,” “may,” “will,” “estimate,” “continue,” “anticipate,” “intend,” “expect,” “predict,” “potential,” and similar expressions, as well as the negatives thereof, as they relate to us, our business, our management, and our industry, are intended to identify forward-looking statements. In light of risks and uncertainties discussed in this Annual Report, the forward-looking events and circumstances discussed in this Annual Report may not occur and actual results could differ materially from those anticipated or implied in the forward-looking statements. We have based these forward-looking statements on our current expectations and projections about future events and financial trends affecting the financial condition of our business. Forward-looking statements should not be read as a guarantee of future performance or results, and will not necessarily be accurate indications of the times at or by which such performance or results will be achieved. Forward-looking statements are based on information available at the time those statements are made and/or management’s good faith belief as of that time with respect to future events, and are subject to risks and uncertainties that could cause actual performance or results to differ materially from those expressed in or suggested by the forward-looking statements. These risks include, but are not limited to, those set forth under Item 1A of this Annual Report.
Forward-looking statements speak only as of the date of this Annual Report. We may not actually achieve the plans, intentions, or expectations disclosed in our forward-looking statements, and you should not place undue reliance on our forward-looking statements. Actual results or events could differ materially from the plans, intentions, and expectations disclosed in the forward-looking statements we make. In addition, our forward-looking statements do not reflect the potential impact of any future acquisitions, mergers, dispositions, joint ventures, or investments that we may make.
You should read this Annual Report completely and with the understanding that our actual future results may be materially different from what we expect. We do not assume any obligation to update any forward-looking statements, whether as a result of new information, future events, or otherwise, except as required by law. If we update one or more forward-looking statements, no inference should be drawn that we will make additional updates with respect to those or other forward-looking statements.
ITEM 1. | BUSINESS |
Overview
Carbonite, Inc. (together with its subsidiaries, "Carbonite", the "Company", "our", "we", or "us") provides cloud and hybrid business continuity solutions. Our solutions provide powerful features packaged in a cost-effective, simple and secure manner and are designed to address the specific needs of small and medium-sized businesses ("SMBs"), and individuals.
Carbonite was incorporated on February 10, 2005 and is a Delaware corporation. Our principal executive offices are located at 2 Avenue de Lafayette, Boston, Massachusetts. We founded Carbonite on one simple idea: all computers need to be backed up, and in this always connected and highly mobile world, cloud backup is the ideal approach. Our goal is to enable a world in which important data is always protected, available and useful. Today, our cloud and hybrid business continuity solutions help keep businesses in business.
We derive our revenue principally from subscription fees, with a consistently strong customer retention rate and a scalable infrastructure to support our growth. We generated revenue of $136.6 million in 2015. We continue to invest in customer acquisition, and as a result our bookings have grown from $80.9 million in 2011 to $144.1 million in 2015. For a reconciliation of bookings to revenue for the last five years, see “Selected Consolidated Financial and Other Data.”
Industry Trends
Trends on several fronts are fueling growth opportunities for Carbonite.
The first is the proliferation of data. International Data Corporation ("IDC") predicts the amount of data users create and copy will increase exponentially from 4.4 zettabytes in 2013 to 44 zettabytes in 2020, and IT professionals will deal with around 230 gigabytes ("GB") of data per person1. We believe that this rapid growth in data will continue to drive demand for business continuity solutions.
1
The second driver is threats to data. The number of cyberattacks where malware holds user data “hostage” is expected to grow in 2016 as hackers target more companies and advanced software is able to compromise more types of data. Research indicates more than 4 million attacks in the second quarter of 2015, compared to fewer than 1.5 million in the third quarter of 2013. We expect this trend to drive adoption of business continuity solutions as consumers and small businesses seek solutions to protect their data to avoid falling prey to criminals.2
Finally, research indicates that business continuity and disaster recovery will continue to grow, demonstrating continued spend in our core markets. IDC estimates the worldwide data protection and recovery software market will reach $8.2 billion in 20193 and Gartner, Inc. ("Gartner"), an industry analyst firm, expects the disaster recovery as a service sector ("DRaaS") to grow at a robust 30% CAGR, outpacing the traditional disaster recovery market by 20184.
As data growth and data threats continue to drive the need for data protection and recovery solutions, we believe research indicates that Carbonite is well-positioned to take full advantage of future spending trends in cloud and hybrid business continuity.
___________________________
1EMC Digital Universe Study, with data and analysis by IDC, April 2014.
2McAfee 2016 Threats Predictions, 2016
3IDC Market Forecast: Worldwide Data Protection and Recovery Software Forecast, 2015-2019, September 2015
4Gartner Magic Quadrant for Disaster Recovery as a Service, April 2015
Our Solutions
We believe that our customers purchase our cloud and hybrid business continuity solutions because they provide powerful features packaged in a cost-effective, simple and secure manner. We make it easy for customers to recover their files, and we provide anytime, anywhere access and high quality customer support.
We believe that our solutions provide the following benefits to all of our customers:
Power: Full-featured cloud and hybrid solutions that rival complex and expensive enterprise solutions, designed to meet the needs of SMBs and individuals.
Simplicity: Consumer-like user interface that makes our solutions easy to use and maintain.
Security: Proven, modern technology that provides peace of mind that our customers' data is safe. We encrypt all customer files before they are transmitted to our data centers, guarding against unauthorized access to stored files and ensuring a high level of data security. In addition, we employ state-of-the-art data center security measures intended to prevent intrusions.
Value: We provide comprehensive solutions at an affordable, predictable price, from a single vendor.
Our Key Competitive Strengths
We believe that our key competitive strengths include the following:
Proprietary backup architecture. Our entire infrastructure is designed and optimized for business continuity, which is a low transaction speed, high volume, write mostly application. We believe that our average storage costs per subscriber are lower than those realized by typical general purpose data center storage systems, providing us with lower cost of service and greater return on investment.
Significant intellectual property portfolio. We have a significant intellectual property portfolio relating to our solutions, including 27 patents and 20 patents pending. CARBONITE is a registered trademark in the U.S. and in over 30 other countries, including countries in the European Union.
Comprehensive customer support. We believe that our customer support is more comprehensive than that offered by our primary competitors in the cloud backup market and aids in our customer retention. Telephone, live chat, and email customer support are included in our subscription fee.
2
Brand awareness. We believe that we have among the highest brand awareness in the cloud backup market. We promote our brand through our multi-channel marketing program, which includes a broad presence in radio, online display advertising, print advertising, paid and natural search, and an affiliate and reseller network.
Our Offerings
We intend to be a leading provider of business continuity solutions that keep businesses in business. Our suite of solutions include:
Carbonite Personal: For individuals, we offer annual plans that include unlimited cloud backup for one computer at three different service levels including Personal Basic, Personal Plus and Personal Prime. All plans offer discounts for multi-year subscriptions.
Carbonite Pro: Our small business solutions automatically back up files to the cloud and include an unlimited number of devices for an annual flat fee based on the amount of storage needed. We offer annual plans at three different service levels:
• | Pro Basic - Automatic cloud backup for unlimited computers, external hard drives and NAS devices, includes 250GB of starter cloud storage. |
• | Pro Prime -All the protection of Pro Basic plus support for windows file servers, remote deployment & management for PCs and 500GB of starter cloud storage. |
• | Pro Advanced Bundle - A complete disaster recovery solution with bare metal recovery for unlimited servers and automatic cloud backup for unlimited computers. |
Carbonite Server Backup: Our hybrid server backup solution protects an unlimited number of physical and virtual servers, and offers advanced management capabilities including scheduling, retention, bandwidth and compression settings, and detailed monitoring and reporting via a personalized server dashboard. We offer annual plans at three different service levels:
• | Server Essentials - Protects an unlimited number of physical or virtual servers, both locally and in the cloud, with no per server or per application licensing. |
• | Server Advanced - A true backup and disaster recovery solution that gives businesses bare metal recovery and flexible, granular protection for their critical server data. |
• | Server Pro Bundle - A complete disaster recovery solution with bare metal recovery for unlimited servers and automatic cloud backup for unlimited workstations. |
MailStore: MailStore offers comprehensive market solutions in terms of performance, stability, functionality and simplicity to meet the specific email archiving needs of SMBs. Our three solutions include MailStore Server, MailStore Provider Edition and MailStore Home.
The following table sets forth key features of our powerful yet simple solutions:
Carbonite Personal | Carbonite Pro | Carbonite Server | MailStore | |||||
Pricing | From $60/year | From $270/year | From $900/year | From $190 | ||||
Features | Automatic cloud backup for 1 PC or Mac with unlimited cloud storage Protection of photos, documents, music and more | Automatic cloud backup for unlimited computers, NAS, and external drives Remote deployment and management of custom backup policies Easily access, restore and manage files from the web portal and free apps | Software-based hybrid backup and recovery for unlimited servers Bare metal restore allows complete recovery from system image Granular protection for SQL, Exchange, Hyper-V, System State and more | Creates 1:1 copies of all emails in a central archive to ensure long-term security and availability of data Supports archiving of Microsoft Exchange, Office 365, Gmail and other leading systems | ||||
We use sophisticated encryption technology to ensure the privacy of our customers’ stored files. We encrypt files using a secure key before the files leave the customer’s computer and transmit the encrypted files over the internet to one of our secure data centers. Customers’ files remain encrypted on our servers to guard against unauthorized access. We employ outside security analysis firms, including anti-hacking specialists, to review and test our defenses and internal procedures.
3
Our Proprietary Server Software
At the core of our offerings is our proprietary server software designed specifically for cloud backup. The server software is comprised of two major components: the Carbonite Communications System ("CCS") and the Carbonite File System ("CFS"). CCS moves customer data between our software installed on our customers’ computers and CFS running on our storage servers. CCS also balances loads across our server network. CFS manages the write-mostly database of stored files with the flexibility to operate on a wide variety of readily available third-party storage hardware.
We invest heavily in the development of our technologies. In 2015, 2014 and 2013, we spent $28.1 million, $24.1 million and $20.9 million, respectively, on research and development. Our proprietary technologies are fundamental to our value proposition as they enable us to deliver the following benefits:
Scalability. We add storage capacity at the rate of approximately one petabyte every month. CCS allows us to automatically balance processing and storage capacity across our large and expanding server network. CFS allows us to easily add storage capacity across multiple physical locations by automatically integrating new storage servers into our existing infrastructure.
Reliability. We designed CCS and CFS to eliminate single points of failure. The modular design of these components uses well-defined protocols intended to ensure that customer stored files are accurate and free from errors. CFS provides proprietary disk error detection for errors that can occur over years of storage. Our software also incorporates checks and balances to verify data integrity.
Cost effectiveness. Storage cost is the biggest component of our cost of revenue. CCS enables us to dynamically load balance among servers to allow higher overall utilization. CFS enables us to reduce storage costs by utilizing almost every block of physical disk space to store customer files. We can choose the most cost-effective hardware solutions for our data centers because CFS allows us to operate in a heterogeneous hardware environment.
Marketing and Sales
Our marketing and sales efforts are focused on three primary goals: building brand awareness, acquiring customers at a low cost, and retaining existing customers. Our advertising reinforces our brand by emphasizing ease of use, affordability, security and reliability. We use radio advertising, online display advertising, print advertising, paid search, direct marketing, and affiliate and reseller marketing. Our public relations efforts include engaging the traditional press, new media, industry influencers and social networks. Our distribution strategy is designed to sell large volumes of our solutions through our sales channel relationships including resellers.
Marketing. Our revenue is derived from two primary sources: consumers who sign up for Carbonite solutions on our website in response to our direct marketing campaigns, and small and midsized businesses who buy directly from our website, our inside sales team or from our network of reseller partners. Our marketing efforts are designed to attract prospective customers and enroll them as paying customers, either through immediate sale, free trials or communication of the benefits of our solutions and development of ongoing relationships.
Channel distribution. In order to further penetrate the extensive and diverse population of small businesses, we have and will continue to invest in our sales channel relationships. Our network of sales channel relationships includes distributors, resellers and retailers and is designed to sell large volumes of our relatively low-priced solutions to SMB customers.
Retention. Our customer retention efforts are focused on establishing and maintaining long-term relationships with our customers by delivering a compelling customer experience and superior value, communicating regularly with customers through email, on-site messaging, and other media, and creating positive interactions with our customer support team. We monitor developing trends in subscription durations, renewals, and customer satisfaction to maximize our customer retention. We offer incentives to customers to purchase multi-year subscriptions, which we believe helps to increase our customer retention. As of December 31, 2015, 2014 and 2013, 27%, 25%, and 28%, respectively, of our customers had multi-year subscriptions.
Intellectual Property
We believe that the strength of our brand and the functionality of our software help differentiate us from our competitors. As such, our success depends upon our ability to protect our technologies and intellectual property, including our proprietary server software, which allows us to move and store vast amounts of customer data. To protect our intellectual property, we rely on a combination of trademark, patent, copyright, and trade secret laws, as well as confidentiality procedures and contractual
4
restrictions. CARBONITE is a registered trademark in the U.S. and in over 30 other countries, including countries in the European Union. Carbonite also has additional registrations and/or pending applications for additional marks in the U.S. and/or other countries, including but not limited to “Carbonite The Better Backup Plan”, “Back it up. Get it back”, “Because Your Life is On Your Computer” Logo, "Carbonite" and the Green Dot Logo, Carbonite Lock Logo, Phanfare, Zmanda and the Z logo and Chinese character representations for Carbonite. In addition, we have 27 issued patents, expiring at various times between 2021 and 2031, and 20 pending patent applications in the U.S. and internationally that cover both our technical infrastructure and our key usability and design concepts.
Competition
Our market is rapidly evolving due to technological advances that are driving changes in the way SMBs operate. Over the past few years, competition has intensified, and we expect this to continue with market consolidation, the introduction of new technologies, and introduction of new market entrants. We compete against many companies across the data protection, disaster recovery and storage industries, ranging from those who provide a wide array of IT services, to those who provide only a specific business continuity product, to distributors and resellers. We expect many of our actual and potential competitors and solutions to change, as we expand further into the SMB market and as the markets we compete in continue to evolve.
We believe key factors to successfully compete in any of our markets include ease of installation and use, value, cloud storage, data security, reliability, and brand reputation. We believe that Carbonite competes favorably with respect to each of the key factors by providing powerful, yet simple cloud and hybrid business continuity solutions. Our offerings are easy-to-use, affordable, secure, include a variety of storage capacity options, and enable anytime, anywhere access to files.
Employees
As of December 31, 2015, we had 611 full-time and 12 part-time employees. Of our full-time employees, 295 were in operations and support, 115 were in sales and marketing, 106 were in research and development, and 95 were in general and administrative functions. None of our employees are covered by collective bargaining agreements.
Subsequent Events
On January 13, 2016, Carbonite, Inc. and its wholly owned subsidiaries, Carbonite Cloud Backup (Canada) Inc., Carbonite GmbH, and Carbonite Operations BV, completed the acquisition of the North American cloud-based business continuity and disaster recovery assets of EVault, Inc. (“EVault”) as contemplated by that certain Asset Purchase Agreement, dated as of December 15, 2015, with EVault and Seagate Technology (US) Holdings, Inc. as sole shareholder of EVault (the "EVault Acquisition"). We acquired substantially all of the assets utilized in EVault's operations for cash consideration of $14 million. We expect to complete the acquisition of the European Union assets of EVault in the first quarter of 2016, subject to applicable laws, compliance requirements and customary closing conditions.
We are in the process of gathering information to complete our preliminary valuation of certain assets and liabilities acquired as part of the transaction in order to complete acquisition accounting.
Available Information
We file reports with the Securities and Exchange Commission (SEC), including annual reports on Form 10-K, quarterly reports on Form 10-Q, current reports on Form 8-K, and other filings required by the SEC. We make available on our website (www.carbonite.com) our annual reports on Form 10-K, quarterly reports on Form 10-Q, current reports on Form 8-K, and all amendments to those reports as soon as reasonably practicable after such material is electronically filed with or furnished to the SEC. These materials are available free of charge on or through our website via the Investor Relations page at www.carbonite.com. References to our website address in this report are intended to be inactive textual references only, and none of the information contained on our website is part of this Annual Report or incorporated in this Annual Report by reference.
The public may read and copy any materials that we file with the SEC at the SEC’s Public Reference Room at 100 F Street, NE, Washington, DC 20549. The public may obtain information on the operation of the Public Reference Room by calling the SEC at 1-800-SEC-0330. The SEC maintains an internet site (www.sec.gov) that contains reports, proxy and information statements, and other information regarding issuers that file electronically with the SEC.
5
ITEM 1A. | RISK FACTORS |
An investment in our common stock involves a high degree of risk. You should carefully consider the risks described below and the other information in this Annual Report before making an investment decision. Our business, prospects, financial condition, or operating results could be harmed by any of these risks, as well as other risks not currently known to us or that we currently consider immaterial. The trading price of our common stock could decline due to any of these risks, and, as a result, you may lose all or part of your investment.
Risks Related to Our Business
We have experienced periods of losses and negative cash flow since our inception, and we may not be able to sustain profitability or positive cash flow in the future.
We experienced net losses of $10.6 million for 2013, $9.4 million for 2014, and $21.6 million for 2015 and we have an accumulated deficit of approximately $160.9 million as of December 31, 2015. While we have experienced revenue growth over these same periods, we may not be able to achieve profitability in the future or on a consistent basis. We expect to continue making significant expenditures to develop and expand our business, including for advertising, customer acquisition, technology infrastructure, storage capacity, product development, and international expansion, in an effort to increase and service our customer base. We also expect that our results may fluctuate due to a variety of factors described elsewhere in this Annual Report, including the timing and amount of our advertising expenditures, which are seasonal, the timing and amount of expenditures related to the development of technologies and solutions, and to defend intellectual property infringement and other claims. We may also incur increased losses and negative cash flow in the future for a variety of reasons, and we may encounter unforeseen expenses, difficulties, complications, delays, and other unknown events.
The market for cloud solutions is competitive, and if we do not compete effectively, our operating results could be harmed.
We compete with cloud backup providers and providers of traditional hardware-based backup systems. Many of our actual and potential competitors benefit from competitive advantages over us, such as greater name recognition, longer operating histories, more varied services, and larger marketing budgets, as well as greater financial, technical, and other resources. In addition, many of our competitors have established marketing relationships and major distribution agreements with computer manufacturers, internet service providers, and resellers, giving them access to larger customer bases. Some of our competitors may make acquisitions or enter into strategic relationships to offer a more comprehensive service than we do. These combinations may make it more difficult for us to compete effectively. We expect these trends to continue as competitors attempt to strengthen or maintain their market positions.
Demand for our cloud and hybrid backup solutions is sensitive to price. Many factors, including our advertising, customer acquisition and technology costs, and our current and future competitors’ pricing and marketing strategies, can significantly affect our pricing strategies. Certain of our competitors offer, or may in the future offer, lower-priced or free solutions or services that compete with our solutions. Similarly, certain competitors may use internet-based marketing strategies that enable them to acquire customers at a lower cost than us. There can be no assurance that we will not be forced to engage in price-cutting initiatives, or to increase our advertising and other expenses to attract and retain customers in response to competitive pressures, either of which could have a material adverse effect on our revenue and operating results.
Over the long term, we intend to invest in research and development activities, and these investments may achieve delayed, or lower than expected, benefits which could harm our operating results.
While we intend to focus on managing our costs and expenses, over the long term, we also intend to invest in research and development activities as we focus on organic growth through internal innovation. We are likely to recognize the costs associated with these investments earlier than some of the anticipated benefits, and the return on these investments may be lower, or may develop more slowly, than we expect. If we do not achieve the benefits anticipated from these investments, or if the achievement of these benefits is delayed, our operating results may be adversely affected.
We have in the past incurred, and will continue to incur, significant research and development expenses as we strive to remain competitive. New product development and market introduction involves a significant commitment of time and resources and is subject to a number of risks and challenges including:
• | the difficulty in forecasting customer preferences or demand accurately; |
6
• | the inability to expand solution capacity to meet demand for new solutions; |
• | the inability to successfully manage the transition from older solutions; |
• | the impact of customers’ demand for new solutions on the solutions being replaced, thereby causing a decline in sales of existing solutions and an excessive, obsolete supply of inventory; |
• | delays in initial shipments of new solutions; |
• | adapting to emerging and evolving industry standards and to technological developments by our competitors and customers; |
• | entering into new or unproven markets with which we have limited experience |
• | the response of competitors to the introductions of new solutions; and |
• | the desire by customers to evaluate new solutions for extended periods of time. |
Our failure to introduce new or enhanced solutions on a timely basis, keep pace with rapid industry, technological or market changes or effectively manage the transitions to new solutions or new technologies could have a material adverse effect on our business, results of operations or financial condition.
We may not be able to respond to rapid technological changes with new solutions, which could have a material adverse effect on our operating results.
The cloud and hybrid business continuity market is characterized by rapid technological change and frequent new solution and service introductions. Our ability to attract new customers and increase revenue from existing customers will depend in large part on our ability to enhance and improve our existing solutions, introduce new features and solutions, and sell into new markets. We are in the process of addressing the challenges of dynamic and accelerating market trends, such as the decline in the PC market, the market shift towards tablets within mobility and architectural shifts in the provision of security and storage solutions, all of which has made it more difficult for us to compete effectively and requires us to improve our solutions and service offerings. Customers may require features and capabilities that our current solutions do not have. Our failure to develop solutions that satisfy customer preferences in a timely and cost-effective manner may harm our ability to renew our subscriptions with existing customers and to create or increase demand for our solutions, and may adversely impact our operating results.
Additionally, the process of developing new technology is complex and uncertain, and if we fail to accurately predict customers’ changing needs and emerging technological trends or if we fail to achieve the benefits expected from our investments, our business could be harmed. We believe that we must continue to dedicate a significant amount of resources to our research and development efforts to maintain our competitive position and we must commit significant resources to developing new solutions before knowing whether our investments will result in solutions the market will accept. Our new solutions or solution enhancements could fail to attain sufficient market acceptance for many reasons, including:
• | delays in releasing our new solutions or enhancements to the market; |
• | failure to accurately predict market demand or customer demands; |
• | inability to protect against new types of attacks or techniques used by hackers; |
• | defects, errors or failures in their design or performance; |
• | negative publicity about their performance or effectiveness; |
• | introduction or anticipated introduction of competing solutions by our competitors; |
• | poor business conditions for our customers, causing them to delay IT purchases; |
• | the perceived value of our solutions or enhancements relative to their cost; |
7
• | easing of regulatory requirements around security or storage; and |
• | reluctance of customers to purchase solutions incorporating open source software. |
The introduction of new services by competitors or the development of entirely new technologies to replace existing offerings could make our solutions obsolete or adversely affect our business and operating results. In addition, any new markets or countries into which we attempt to sell our solutions may not be receptive. We may experience difficulties with software development, design, or marketing that could delay or prevent our development, introduction, or implementation of new solutions and enhancements. We have in the past experienced delays in the planned release dates of new features and upgrades, and have discovered defects in new solutions after their introduction. There can be no assurance that new solutions or upgrades will be released according to schedule, or that when released they will not contain defects. Either of these situations could result in adverse publicity, loss of revenue, delay in market acceptance, or claims by customers brought against us, all of which could have a material adverse effect on our reputation, business, operating results, and financial condition. Moreover, upgrades and enhancements to our solutions may require substantial investment and we have no assurance that such investments will be successful.
A decline in demand for our solutions or for cloud solutions in general could cause our revenue to decline.
We derive, and expect to continue to derive, substantially all of our revenue from the sale of our cloud and hybrid backup solutions, a rapidly changing market. Changes in customer preferences for cloud solutions may have a disproportionately greater impact on us than if we offered multiple solutions and services. The market for cloud solutions is subject to rapidly changing customer demand and trends in preferences. Some of the potential factors that could affect interest in and demand for cloud solutions include:
• | awareness of our brand and the cloud and hybrid backup solutions category generally; |
• | the appeal and reliability of our solutions; |
• | the price, performance, features, and availability of solutions and services that compete with ours; |
• | public concern regarding privacy and data security; |
• | our ability to maintain high levels of customer satisfaction; and |
• | the rate of growth in cloud solutions generally. |
In addition, substantially all of our revenue is currently derived from customers in the U.S. Consequently, a decrease of interest in and demand for cloud backup solutions in the U.S. could have a disproportionately greater impact on us than if our geographic mix of revenue was less concentrated.
If we are unable to attract new customers to our solutions on a cost-effective basis, our revenue and operating results would be adversely affected.
We generate substantially all of our revenue from the sale of subscriptions to our solutions. In order to grow, we must continue to attract a large number of customers on a cost-effective basis, many of whom have not previously used cloud backup solutions. We use and periodically adjust a diverse mix of advertising and marketing programs to promote our solutions. Significant increases in the pricing of one or more of our advertising channels would increase our advertising costs or cause us to choose less expensive and perhaps less effective channels. As we add to or change the mix of our advertising and marketing strategies, we may expand into channels with significantly higher costs than our current programs, which could adversely affect our operating results. We may incur advertising and marketing expenses significantly in advance of the time we anticipate recognizing any revenue generated by such expenses, and we may only at a later date, or never, experience an increase in revenue or brand awareness as a result of such expenditures. Additionally, because we recognize revenue from customers over the terms of their subscriptions, a large portion of our revenue for each quarter reflects deferred revenue from subscriptions entered into during previous quarters, and downturns or upturns in subscription sales or renewals may not be reflected in our operating results until later periods. We have made in the past, and may make in the future, significant investments to test new advertising, and there can be no assurance that any such investments will lead to the cost-effective acquisition of additional customers. If we are unable to maintain effective advertising programs, our ability to attract new customers could be adversely affected, our advertising and marketing expenses could increase substantially, and our operating results may suffer.
8
A portion of our potential customers locate our website through search engines, such as Google, Bing, and Yahoo!. Our ability to maintain the number of visitors directed to our website is not entirely within our control. If search engine companies modify their search algorithms in a manner that reduces the prominence of our listing, or if our competitors’ search engine optimization efforts are more successful than ours, fewer potential customers may click through to our website. In addition, the cost of purchased listings has increased in the past and may increase in the future. A decrease in website traffic or an increase in search costs could adversely affect our customer acquisition efforts and our operating results.
A significant portion of our customers first try our solutions through free trials. We seek to convert these free trial users to paying customers of our solutions. If our rate of conversion suffers for any reason, our revenue may decline and our business may suffer.
If we are unable to retain our existing customers, our revenue and operating results would be adversely affected.
If our efforts to satisfy our existing customers are not successful, we may not be able to retain them, and as a result, our revenue and ability to grow would be adversely affected. We may not be able to accurately predict future trends in customer renewals. Customers choose not to renew their subscriptions for many reasons, including if customer service issues are not satisfactorily resolved, a desire to reduce discretionary spending, or a perception that they do not use the service sufficiently, that the solution is a poor value, or that competitive services provide a better value or experience. If our customer retention rate decreases, we may need to increase the rate at which we add new customers in order to maintain and grow our revenue, which may require us to incur significantly higher advertising and marketing expenses than we currently anticipate, or our revenue may decline. A significant decrease in our customer retention rate would therefore have an adverse effect on our business, financial condition, and operating results.
Our relationships with our partners and distributors may be terminated or may not continue to be beneficial in generating new customers, which could adversely affect our ability to increase our customer base.
We maintain a network of active partners and distributors, which refer customers to us through links on their websites or outbound promotion to their customers. The number of customers that we are able to add through these relationships is dependent on the marketing efforts of our partners and distributors, over which we have little control. If we are unable to maintain our contractual relationships with existing partners and distributors, or establish new contractual relationships with potential partners and distributors, we may experience delays and increased costs in adding customers, which could have a material adverse effect on us.
If we are unable to expand our base of small business customers, our business could be adversely affected.
We have committed and continue to commit substantial resources to the expansion and increased marketing of our small business solutions. If we are unable to market and sell our solutions to small businesses with competitive pricing and in a cost-effective manner, our ability to grow our revenue and achieve profitability will be harmed. We believe that it is more difficult and expensive to attract and retain small business customers than individuals, because small businesses:
• | are difficult to reach without using more expensive, targeted sales campaigns; |
• | may have different or much more complex needs than those of individual consumers, such as archiving, version control, enhanced security requirements, and other forms of encryption and authentication, which our solutions may not adequately address; and |
• | frequently cease operations due to the sale or failure of their business. |
In addition, small businesses frequently have limited budgets and are more likely to be significantly affected by economic downturns than larger, more established companies. As a result, they may choose to spend funds on items other than our solutions, particularly during difficult economic times. If we are unsuccessful in meeting the needs of potential small business customers, it could adversely affect our future growth and operating results.
If we are unable to sustain market recognition of and loyalty to our brand, or if our reputation were to be harmed, we could lose customers or fail to increase the number of our customers, which could harm our revenue, operating results, and financial condition.
Given our small business and consumer market focus, maintaining and enhancing the Carbonite brand is critical to our success. We believe that the importance of brand recognition and loyalty will increase in light of increasing competition in our
9
markets. We plan to continue investing substantial resources to promote our brand, both domestically and internationally, but there is no guarantee that our brand development strategies will enhance the recognition of our brand. Some of our existing and potential competitors have well-established brands with greater recognition than we have. If our efforts to promote and maintain our brand are not successful, our operating results and our ability to attract and retain customers may be adversely affected. In addition, even if our brand recognition and loyalty increases, this may not result in increased use of our solutions or higher revenue.
Our solutions, as well as those of our competitors, are regularly reviewed in computer and business publications. Negative reviews, or reviews in which our competitors’ solutions and services are rated more highly than our solutions, could negatively affect our brand and reputation. From time-to-time, our customers express dissatisfaction with our solutions, including, among other things, dissatisfaction with our customer support, our billing policies, and the way our solutions operate. If we do not handle customer complaints effectively, our brand and reputation may suffer, we may lose our customers’ confidence, and they may choose not to renew their subscriptions. In addition, many of our customers participate in online blogs about computers and internet services, including our solutions, and our success depends in part on our ability to generate positive customer feedback through such online channels where consumers seek and share information. If actions that we take or changes that we make to our solutions upset these customers, their blogging could negatively affect our brand and reputation. Complaints or negative publicity about our solutions or billing practices could adversely impact our ability to attract and retain customers and our business, financial condition, and operating results.
The termination of our relationship with any major credit card company would have a severe, negative impact on our ability to collect revenue from customers. Increases in credit card processing fees would increase our operating expenses and adversely affect our operating results.
Substantially all of our customers purchase our solutions online with credit cards, and our business depends upon our ability to offer credit card payment options. The termination of our ability to process payments on any major credit card would significantly impair our ability to operate our business and significantly increase our administrative costs related to customer payment processing. If we fail to maintain our compliance with the data protection and documentation standards adopted by the major credit card issuers and applicable to us, these issuers could terminate their agreements with us, and we could lose our ability to offer our customers a credit card payment option. If these issuers increase their credit card processing fees because we experience excessive chargebacks or refunds or for other reasons, it could adversely affect our business and operating results.
Any significant disruption in service on our websites, in our computer systems, or caused by our third party storage and system providers could damage our reputation and result in a loss of customers, which would harm our business, financial condition, and operating results.
Our brand, reputation, and ability to attract, retain and serve our customers are dependent upon the reliable performance of our websites, network infrastructure and payment systems, and our customers’ ability to readily access their stored files. We have experienced interruptions in these systems in the past, including server failures that temporarily slowed down our websites’ performance and our customers’ ability to access their stored files, or made our websites and infrastructure inaccessible, and we may experience interruptions in the future.
In addition, while we operate and maintain elements of our websites and network infrastructure, some elements of this complex system are operated by third parties that we do not control and that would require significant time to replace. We expect this dependence on third parties to increase. In particular, we utilize Amazon Web Services and Google Cloud Storage to provide us with some computing and storage capacity pursuant to agreements that continue until terminated upon written notice by either party. All of these third-party systems are located in data center facilities operated by third parties. Our data center leases expire at various times in 2016 and 2018 with rights of extension. If we are unable to renew these agreements on commercially reasonable terms, we may be required to transfer that portion of our computing and storage capacity to new data center facilities, and we may incur significant costs and possible service interruption in connection with doing so.
Interruptions in our own systems, the third-party systems on which we rely, or the use of our data center facilities, whether due to system failures, computer viruses, physical or electronic break-ins, damage or interruption from human error, power losses, natural disasters or terrorist attacks, hardware failures, systems failures, telecommunications failures or other factors, could affect the security or availability of our websites and infrastructure, prevent us from being able to continuously back up our customers’ data or our customers from accessing their stored data, and may damage our customers’ stored files. Any financial difficulties, such as bankruptcy, faced by our third-party data center operators or any of the service providers with whom we or they contract may have negative effects on our business, the nature and extent of which are difficult to predict. Moreover, if our third-party data center providers are unable to keep up with our growing needs for capacity, this could have an
10
adverse effect on our business. Interruptions in our services might reduce our revenue, cause us to issue credits or refunds to customers, subject us to potential liability, or harm our renewal rates.
In addition, prolonged delays or unforeseen difficulties in connection with adding storage capacity or upgrading our network architecture when required may cause our service quality to suffer. Problems with the reliability or security of our systems could harm our reputation. Damage to our reputation and the cost of remedying these problems could negatively affect our business, financial condition, and operating results.
Our proprietary systems provide redundancy at the disk level, but do not keep separate, redundant copies of stored customer files. Instead, we rely on the fact that our customers, in effect, back up our system by maintaining the primary instance of their files. We do not intend to create redundant backup sites for our solutions. As such, a total failure of our systems, or the failure of any of our systems, could result in the loss of or a temporary inability to back up our customers’ data and result in our customers being unable to access their stored files. If one of our data centers fails at the same time that our customers’ computers fail, we would be unable to provide stored copies of their data. If this were to occur, our reputation could be compromised and we could be subject to liability to the customers that were affected.
Our success depends on our customers’ continued high-speed access to the internet and the continued reliability of the internet infrastructure.
Our business depends on our customers’ high-speed access to the internet, as well as the continued maintenance and development of the internet infrastructure. The future delivery of our solutions will depend on third-party internet service providers to expand high-speed internet access, to maintain a reliable network with the necessary speed, data capacity and security, and to develop complementary solutions and services, including high-speed modems, for providing reliable and timely internet access and services. All of these factors are out of our control. To the extent that the internet continues to experience an increased number of users, frequency of use, or bandwidth requirements, the internet may become congested and be unable to support the demands placed on it, and its performance or reliability may decline. Any internet outages or delays could adversely affect our ability to provide services to our customers.
If the security of our customers’ confidential information stored in our systems is breached or their stored files are otherwise subjected to unauthorized access, our reputation and business may be harmed, and we may be exposed to liability.
Our customers rely on our solutions to store digital copies of their files, including financial records, business information, photos, and other personally meaningful content. We also store credit card information and other personal information about our customers. An actual or perceived breach of our network security and systems or other events that cause the loss or public disclosure of, or access by third parties to, our customers’ stored files could have serious negative consequences for our business, including possible fines, penalties and damages, reduced demand for our solutions, an unwillingness of customers to provide us with their credit card or payment information, an unwillingness of our customers to use our solutions, harm to our reputation and brand, loss of our ability to accept and process customer credit card orders, and time-consuming and expensive litigation. If this occurs, our business and operating results could be adversely affected. Third parties may be able to circumvent our security by deploying viruses, worms, and other malicious software programs that are designed to attack or attempt to infiltrate our systems and networks and we may not immediately discover these attacks or attempted infiltrations. Further, outside parties may attempt to fraudulently induce our employees, consultants, or affiliates to disclose sensitive information in order to gain access to our information or our customers’ information. The techniques used to obtain unauthorized access, disable or degrade service, or sabotage systems change frequently, often are not recognized until launched against a target, and may originate from less regulated or remote areas around the world. As a result, we may be unable to proactively address these techniques or to implement adequate preventative or reactionary measures. In addition, employee or consultant error, malfeasance, or other errors in the storage, use, or transmission of personal information could result in a breach of customer or employee privacy. We maintain insurance coverage to mitigate the potential financial impact of these risks; however, our insurance may not cover all such events or may be insufficient to compensate us for the potentially significant losses, including the potential damage to the future growth of our business, that may result from the breach of customer or employee privacy.
Many states have enacted laws requiring companies to notify individuals of data security breaches involving their personal data. These mandatory disclosures regarding a security breach often lead to widespread negative publicity, which may cause our customers to lose confidence in the effectiveness of our data security measures. Any security breach, whether successful or not, would harm our reputation and could cause the loss of customers. Similarly, if a well-publicized breach of data security at any other cloud backup service provider or other major consumer website were to occur, there could be a general public loss of confidence in the use of the internet for cloud backup services or commercial transactions generally. Any of these events could have material adverse effects on our business, financial condition, and operating results.
11
Our solutions are complex and operate in a wide variety of environments, systems, applications and configurations, which could result in errors or solution failures.
Because we offer very complex solutions, undetected errors, failures, or bugs may occur, especially when solutions are first introduced or when new versions are released. Our solutions are often installed and used in large-scale computing environments with different operating systems, system management software, and equipment and networking configurations, which may cause errors or failures in our solutions or may expose undetected errors, failures, or bugs in our solutions. Our customers’ computing environments are often characterized by a wide variety of standard and non-standard configurations that make pre-release testing for programming or compatibility errors very difficult and time-consuming. In addition, despite testing by us and others, errors, failures, or bugs may not be found in new solutions or releases until after distribution. In the past, we have discovered software errors, failures, and bugs in certain of our solution offerings after their introduction and, in some cases, have experienced delayed or lost revenues as a result of these errors.
Errors, failures, or bugs in solutions released by us could result in negative publicity, damage to our brand, returns, loss of or delay in market acceptance of our solutions, loss of competitive position, or claims by customers or others. Many of our end-user customers use our solutions in applications that are critical to their businesses and may have a greater sensitivity to defects in our solutions than to defects in other, less critical, software solutions. In addition, if an actual or perceived breach of information integrity or availability occurs in one of our end-user customer’s systems, regardless of whether the breach is attributable to our solutions, the market perception of the effectiveness of our solutions could be harmed. Alleviating any of these problems could require significant expenditures of our capital and other resources and could cause interruptions, delays, or cessation of our solution licensing, which could cause us to lose existing or potential customers and could adversely affect our operating results.
We process, store and use personal information and other data, which subjects us to governmental regulation and other legal obligations related to privacy, and our actual or perceived failure to comply with such obligations could harm our business.
We receive, store, and process personal information and other customer data. Personal privacy has become a significant issue in the United States and in many other countries where we offer our solutions. The regulatory framework for privacy issues worldwide is currently complex and evolving, and it is likely to remain uncertain for the foreseeable future. There are numerous federal, state, local, and foreign laws regarding privacy and the storing, sharing, use, processing, disclosure and protection of personal information and other customer data, the scope of which are changing, subject to differing interpretations, and may be inconsistent among countries or conflict with other rules. We generally seek to comply with industry standards and are subject to the terms of our privacy policies and privacy-related obligations to third parties. We strive to comply with all applicable laws, policies, legal obligations, and industry codes of conduct relating to privacy and data protection to the extent possible. However, it is possible that these obligations may be interpreted and applied in a manner that is inconsistent from one jurisdiction to another and may conflict with other rules or our practices. Any failure or perceived failure by us to comply with our privacy policies, our privacy-related obligations to customers or other third parties, our privacy-related legal obligations, or any compromise of security that results in the unauthorized release or transfer of personally identifiable information or other customer data, may result in governmental enforcement actions, litigation, or public statements against us by consumer advocacy groups or others and could cause our customers to lose trust in us, which could have an adverse effect on our reputation and business. Our customers may also accidentally disclose their passwords or store them on a mobile device that is lost or stolen, creating the perception that our systems are not secure against third-party access. Additionally, if third parties that we work with, such as vendors or developers, violate applicable laws or our policies, such violations may also put our customers’ information at risk and could in turn have an adverse effect on our business. Any significant change to applicable laws, regulations, or industry practices regarding the use or disclosure of our customers’ data, or regarding the manner in which the express or implied consent of customers for the use and disclosure of such data is obtained, could require us to modify our solutions and features, possibly in a material manner, and may limit our ability to develop new services and features that make use of the data that our customers voluntarily share with us.
Our solutions are used by customers in the health care industry and we must comply with numerous federal and state laws related to patient privacy in connection with providing our solutions to these customers.
Our solutions are used by customers in the health care industry and we must comply with numerous federal and state laws related to patient privacy in connection with providing our solutions to these customers. In particular, the Health Insurance Portability and Accountability Act of 1996, or HIPAA, and the Health Information Technology for Economic and Clinical Health Act, or HITECH, include privacy standards that protect individual privacy by limiting the uses and disclosures of individually identifiable health information and implementing data security standards. Because our solutions may backup individually identifiable health information for our customers, our customers are mandated by HIPAA to enter into written
12
agreements with us-known as business associate agreements-that require us to safeguard individually identifiable health information. Business associate agreements typically include:
• | a description of our permitted uses of individually identifiable health information; |
• | a covenant not to disclose that information except as permitted under the agreement and to make our subcontractors, if any, subject to the same restrictions; |
• | assurances that appropriate administrative, physical, and technical safeguards are in place to prevent misuse of that information; |
• | an obligation to report to our customers any use or disclosure of that information other than as provided for in the agreement; |
• | a prohibition against our use or disclosure of that information if a similar use or disclosure by our customers would violate the HIPAA standards; |
• | the ability of our customers to terminate their subscription to our solution if we breach a material term of the business associate agreement and are unable to cure the breach; |
• | the requirement to return or destroy all individually identifiable health information at the end of the customer’s subscription; and |
• | access by the Department of Health and Human Services to our internal practices, books, and records to validate that we are safeguarding individually identifiable health information. |
We may not be able to adequately address the business risks created by HIPAA or HITECH implementation or comply with our obligations under our business associate agreements. Furthermore, we are unable to predict what changes to HIPAA, HITECH or other laws or regulations might be made in the future or how those changes could affect our business or the costs of compliance. Failure by us to comply with any of the federal and state standards regarding patient privacy may subject us to penalties, including civil monetary penalties and, in some circumstances, criminal penalties, which could have an adverse effect on our business, financial condition, and operating results.
Our operating results have fluctuated in the past and may continue to do so in the future. As a result, we may fail to meet or exceed the expectations of securities analysts or investors, which could cause our stock price to decline.
Our quarterly and annual operating results may fluctuate as a result of a variety of factors, many of which are outside of our control. If our quarterly or annual operating results or guidance fall below the expectations of securities analysts or investors, the price of our common stock could decline substantially. The following factors, among others, could cause fluctuations in our quarterly or annual operating results or guidance:
• | our ability to attract new customers and retain existing customers; |
• | our ability to accurately forecast revenue and appropriately plan our expenses; |
• | our ability to introduce new solutions; |
• | the actions of our competitors, including pricing changes or the introduction of new solutions; |
• | our ability to effectively manage our growth; |
• | the mix of annual and multi-year subscriptions at any given time; |
• | seasonal variations or other cyclicality in the demand for our solutions, including the purchasing and budgeting cycles of our small business customers; |
• | the timing and cost of advertising and marketing efforts; |
• | the timing and cost of developing or acquiring technologies, services, or businesses; |
13
• | the timing, operating cost, and capital expenditures related to the operation, maintenance, and expansion of our business; |
• | service outages or security breaches and any related impact on our reputation; |
• | our ability to successfully manage any future acquisitions of businesses, solutions, or technologies; |
• | the impact of worldwide economic, industry, and market conditions and those conditions specific to internet usage and online businesses; |
• | costs associated with defending intellectual property infringement and other claims; and |
• | changes in government regulation affecting our business. |
We believe that our quarterly and annual revenue and operating results may vary significantly in the future and that period-to-period comparisons of our operating results may not be meaningful. You should not rely on the results of one period as an indication of future performance.
Seasonal variations in our business may also cause fluctuations in our financial results. For example, we generally spend more on advertising during the first and third quarters of each year to capitalize on lower advertising rates in these periods and increased sales of devices that create or store data during post-holiday and back to school periods and our bookings tend to be higher in these periods. While we believe that these seasonal trends have affected and will continue to affect our quarterly and annual results, our trajectory of rapid growth may have overshadowed these effects to date. We believe that our business may become more seasonal in the future as our growth rate slows, and that such seasonal variations in advertising expenditures and customer purchasing patterns may result in fluctuations in our financial results.
If we fail to maintain proper and effective internal controls, our ability to produce accurate and timely financial statements could be impaired, which could harm our operating results, our ability to operate our business, and our investors views of us.
Ensuring that we have adequate internal financial and accounting controls and procedures in place so that we can produce accurate financial statements on a timely basis is a costly and time-consuming effort that needs to be evaluated frequently. As part of our process of documenting and testing our internal control over financial reporting, we may identify areas for further attention and improvement. Implementing any appropriate changes to our internal controls may distract our officers and employees, entail substantial costs to modify our existing processes, and take significant time to complete. These changes may not, however, be effective in maintaining the adequacy of our internal controls, and any failure to maintain that adequacy, or consequent inability to produce accurate financial statements on a timely basis, could increase our operating costs and harm our business. In addition, investors perceptions that our internal controls are inadequate or that we are unable to produce accurate financial statements on a timely basis may harm our stock price and make it more difficult for us to effectively market and sell our solutions to new and existing customers.
We do not expect that disclosure controls or internal controls over financial reporting will prevent all errors and all fraud. A control system, no matter how well designed and operated, can provide only reasonable, not absolute, assurance that the control system’s objectives will be met. Further, the design of a control system must reflect the fact that there are resource constraints and the benefits of controls must be considered relative to their costs. Because of the inherent limitations in all control systems, no evaluation of controls can provide absolute assurance that all control issues and instances of fraud, if any, have been detected. Failure of our control systems to prevent error or fraud could materially and adversely impact us.
If our estimates or judgments relating to our critical accounting policies are based on assumptions that change or prove to be incorrect, our operating results could fall below expectations of securities analysts and investors, resulting in a decline in our stock price.
The preparation of financial statements in conformity with GAAP requires management to make estimates and assumptions that affect the amounts reported in the consolidated financial statements and accompanying notes. We base our estimates on historical experience and on various other assumptions that we believe to be reasonable under the circumstances, the results of which form the basis for making judgments about the carrying values of assets and liabilities that are not readily apparent from other sources. Significant assumptions and estimates used in preparing our consolidated financial statements include those related to revenue recognition, stock-based compensation, valuation of inventory and accounting for income taxes. Our operating results may be adversely affected if our assumptions change or if actual circumstances differ from those in
14
our assumptions, which could cause our operating results to fall below the expectations of securities analysts and investors, resulting in a decline in our stock price.
Changes in financial accounting standards or practices may cause adverse, unexpected financial reporting fluctuations and affect our reported results of operations.
Changes in financial accounting standards or practices can have a significant effect on our reported results and may even affect our reporting of transactions completed before the change is effective. New accounting pronouncements and varying interpretations of accounting pronouncements have occurred and may occur in the future. Changes to existing rules or the questioning of current practices may adversely affect our business and financial results.
Growth may place significant demands on our management and our infrastructure.
We have experienced substantial growth in our business. This growth has placed and may continue to place significant demands on our management and our operational and financial infrastructure. As our operations grow in size, scope, and complexity, we will need to improve and upgrade our systems and infrastructure to attract, service, and retain an increasing number of customers. The expansion of our systems and infrastructure will require us to commit substantial financial, operational, and technical resources in advance of an increase in the volume of business, with no assurance that the volume of business will increase. Any such additional capital investments will increase our cost base. Continued growth could also strain our ability to maintain reliable service levels for our customers, develop and improve our operational, financial, and management controls, enhance our reporting systems and procedures, and recruit, train, and retain highly skilled personnel. If we fail to achieve the necessary level of efficiency in our organization as we grow, our business, financial condition, and operating results could be harmed.
We may expand by continuing to acquire or invest in other companies, which may divert our management’s attention, result in additional dilution to our stockholders, and consume resources that are necessary to sustain our business.
We may in the future continue to acquire complementary solutions, services, technologies, or businesses. We may also enter into relationships with other businesses to expand our portfolio of solutions or our ability to provide our solutions in foreign jurisdictions, which could involve preferred or exclusive licenses, additional channels of distribution, discount pricing, or investments in other companies. We do not have substantial experience with integrating and managing acquired businesses or assets. Negotiating these transactions can be time-consuming, difficult and expensive, and our ability to complete these transactions may often be subject to conditions or approvals that are beyond our control. Consequently, these transactions, even if undertaken and announced, may not close.
Acquisitions may also disrupt our business, divert our resources, and require significant management attention that would otherwise be available for the development of our business. Moreover, the anticipated benefits of any acquisition, investment, or business relationship may not be realized or we may be exposed to unknown liabilities, including litigation against the companies that we may acquire. In connection with any such transaction, we may:
• | issue additional equity securities that would dilute our stockholders; |
• | use cash that we may need in the future to operate our business; |
• | incur debt on terms unfavorable to us, that we are unable to repay, or that may place burdensome restrictions on our operations; |
• | incur large charges or substantial liabilities; or |
• | become subject to adverse tax consequences or substantial depreciation, deferred compensation, or other acquisition-related accounting charges. |
Any of these risks could harm our business and operating results.
Integration of an acquired company’s operations may present challenges.
The integration of an acquired company requires, among other things, coordination of administrative, sales and marketing, accounting and finance functions, and expansion of information and management systems. Integration may prove to be difficult due to the necessity of coordinating geographically separate organizations and integrating personnel with disparate business
15
backgrounds and accustomed to different corporate cultures. We may not be able to retain key employees of an acquired company. Additionally, the process of integrating a new solution or service may require a disproportionate amount of time and attention of our management and financial and other resources. Any difficulties or problems encountered in the integration of a new solution or service could have a material adverse effect on our business.
The integration of an acquired company may cost more than we anticipate, and it is possible that we will incur significant additional unforeseen costs in connection with such integration, which may negatively impact our earnings.
In addition, we may only be able to conduct limited due diligence on an acquired company’s operations. Following an acquisition, we may be subject to liabilities arising from an acquired company’s past or present operations, including liabilities related to data security, encryption and privacy of customer data, and these liabilities may be greater than the warranty and indemnity limitations that we negotiate. Any liability that is greater than these warranty and indemnity limitations could have a negative impact on our financial condition.
Even if successfully integrated, there can be no assurance that our operating performance after an acquisition will be successful or will fulfill management’s objectives.
We may be unsuccessful in managing or expanding our operations, which could adversely affect our operating results.
We have office locations throughout the United States and in various international locations, including Germany, the Netherlands and Switzerland. If we are unable to effectively manage a large and geographically dispersed group of employees or to anticipate our future growth and personnel needs, our business may be adversely affected. As we expand our business, we add complexity to our organization and must expand and adapt our operational infrastructure and effectively coordinate throughout our organization. As a result, we have incurred and expect to continue to incur additional expense related to our continued growth. Failure to manage any future growth effectively could result in increased costs, negatively impact our customers’ satisfaction with our solutions, and harm our operating results.
The loss of one or more of our key personnel, or our failure to attract, integrate, and retain other highly qualified personnel, could harm our business.
We depend on the continued service and performance of our key personnel. We do not have long-term employment agreements with any of our officers or key employees. In addition, many of our key technologies and systems are custom-made for our business by our personnel. The loss of key personnel, including key members of our management team, as well as certain of our key marketing, sales, products development, or technology personnel, could disrupt our operations and have an adverse effect on our ability to grow our business. In addition, several of our key personnel have only recently been employed by us, and we are still in the process of integrating these personnel into our operations. Our failure to successfully integrate these key employees into our business could adversely affect our business.
To execute our growth plan, we must attract and retain highly qualified personnel. Competition for these employees is intense, and we may not be successful in attracting and retaining qualified personnel. We have from time to time in the past experienced, and we expect to continue to experience, difficulty in hiring and retaining highly skilled employees with appropriate qualifications. New hires require significant training and, in most cases, take significant time before they achieve full productivity. Our recent hires and planned hires may not become as productive as we expect, and we may be unable to hire or retain sufficient numbers of qualified individuals. Many of the companies with which we compete for experienced personnel have greater resources than we have. In addition, in making employment decisions, particularly in the internet and high-technology industries, job candidates often consider the value of the equity that they are to receive in connection with their employment. In addition, employees may be more likely to voluntarily exit the Company if the shares underlying their vested and unvested options, as well as unvested restricted stock units, have significantly depreciated in value resulting in the options they are holding being significantly above the market price of our common stock and the value of the restricted stock units decreasing. If we fail to attract new personnel, or fail to retain and motivate our current personnel, our business and growth prospects could be severely harmed.
Our corporate culture has contributed to our success, and if we cannot maintain this culture as we grow, we could lose the innovation, creativity, and teamwork fostered by our culture, and our business may be harmed.
We believe that our corporate culture has been a key contributor to our success. If we do not continue to develop our corporate culture as we grow and evolve, including maintaining our culture of transparency with our employees, it could harm our ability to foster the innovation, creativity, and teamwork that we believe that we need to support our growth. As our organization grows and we are required to implement more complex organizational structures, we may find it increasingly
16
difficult to maintain the beneficial aspects of our corporate culture, which could negatively impact our future success. In addition, the availability of a public market for our securities could create disparities of wealth among our employees, which could adversely impact relations among employees and our corporate culture in general.
Unanticipated changes in effective tax rates or adverse outcomes resulting from examination of our income or other tax returns could adversely affect our operating results and financial condition.
We are subject to income taxes in the United States and various foreign jurisdictions, and our domestic and international tax liabilities will be subject to the allocation of expenses in differing jurisdictions. Our future effective tax rates could be subject to volatility or adversely affected by a number of factors, including:
• | changes in the valuation of our deferred tax assets and liabilities; |
• | expected timing and amount of the release of tax valuation allowances; |
• | expiration of, or detrimental changes in, research and development tax credit laws; |
• | tax effects of stock-based compensation; |
• | costs related to intercompany restructurings; |
• | changes in tax laws, regulations, accounting principles or interpretations thereof; or |
• | future earnings being lower than anticipated in countries where we have lower statutory tax rates and higher than anticipated earnings in countries where we have higher statutory tax rates. |
In addition, we may be subject to audits of our income and sales taxes by the Internal Revenue Service and other foreign and state tax authorities. Outcomes from these audits could have an adverse effect on our operating results and financial condition.
Our ability to use net operating losses to offset future taxable income may be subject to certain limitations.
As of December 31, 2015, we had federal, state, and foreign net operating loss carryforwards, or NOLs, of $110.1 million, $73.4 million, and $5.5 million, respectively, available to offset future taxable income, which expire in various years through 2033 if not utilized. A lack of future taxable income would adversely affect our ability to utilize these NOLs before they expire. Under the provisions of the Internal Revenue Code of 1986, as amended, or the Internal Revenue Code, substantial changes in our ownership may limit the amount of pre-change NOLs that can be utilized annually in the future to offset taxable income. Section 382 of the Internal Revenue Code, or Section 382, imposes limitations on a company’s ability to use NOLs if a company experiences a more-than-50-percent ownership change over a three-year testing period. Based upon our analysis as of December 31, 2015, there was no ownership change experienced during 2015. If changes in our ownership occur in the future, our ability to use NOLs may be further limited. For these reasons, we may not be able to utilize a material portion of the NOLs, even if we achieve profitability. If we are limited in our ability to use our NOLs in future years in which we have taxable income, we will pay more taxes than if we were able to fully utilize our NOLs. This could adversely affect our operating results and the market price of our common stock.
We face many risks associated with our plans to expand internationally, which could harm our business, financial condition, and operating results.
We anticipate that our efforts to expand internationally will entail the marketing and advertising of our services and brand and the development of localized websites. We do not have substantial experience in selling our solutions in international markets or in conforming to the local cultures, standards, or policies necessary to successfully compete in those markets, and we must invest significant resources in order to do so. We may not succeed in these efforts or achieve our customer acquisition or other goals. For some international markets, customer preferences and buying behaviors may be different, and we may use business or pricing models that are different from our traditional subscription model to provide cloud backup and related services to customers. Our revenue from new foreign markets may not exceed the costs of establishing, marketing, and maintaining our international solutions, and therefore may not be profitable on a sustained basis, if at all.
In addition, conducting international operations subjects us to new risks that we have not generally faced in the U.S. These risks include:
17
• | localization of our solutions, including translation into foreign languages and adaptation for local practices and regulatory requirements; |
• | lack of experience in other geographic markets; |
• | strong local competitors; |
• | cost and burden of complying with, lack of familiarity with, and unexpected changes in foreign legal and regulatory requirements, including consumer and data privacy laws; |
• | difficulties in managing and staffing international operations; |
• | fluctuations in currency exchange rates or restrictions on foreign currency; |
• | potentially adverse tax consequences, including the complexities of transfer pricing, foreign value added or other tax systems, double taxation and restrictions, and/or taxes on the repatriation of earnings; |
• | dependence on third parties, including channel partners with whom we do not have extensive experience; |
• | compliance with the Foreign Corrupt Practices Act, economic sanction laws and regulations, export controls, and other U.S. laws and regulations regarding international business operations; |
• | increased financial accounting and reporting burdens and complexities; |
• | political, social, and economic instability abroad, terrorist attacks, and security concerns in general; and |
• | reduced or varied protection for intellectual property rights in some countries. |
Operating in international markets also requires significant management attention and financial resources. The investment and additional resources required to establish operations and manage growth in other countries may not produce desired levels of revenue or profitability.
Our software contains encryption technologies, certain types of which are subject to U.S. and foreign export control regulations and, in some foreign countries, restrictions on importation and/or use. Any failure on our part to comply with encryption or other applicable export control requirements could result in financial penalties or other sanctions under the U.S. export regulations, including restrictions on future export activities, which could harm our business and operating results. Regulatory restrictions could impair our access to technologies that we seek for improving our solutions and may also limit or reduce the demand for our solutions outside of the U.S.
Risks Related to Intellectual Property
Assertions by a third party that our solutions infringe its intellectual property, whether or not correct, could subject us to costly and time-consuming litigation or expensive licenses.
There is frequent litigation in the software and technology industries based on allegations of infringement or other violations of intellectual property rights. Any such claims or litigation may be time-consuming and costly, divert management resources, require us to change our services, require us to credit or refund subscription fees, or have other adverse effects on our business. Many companies are devoting significant resources to obtaining patents that could affect many aspects of our business. Third parties may claim that our technologies or solutions infringe or otherwise violate their patents or other intellectual property rights. As we face increasing competition and become increasingly visible as a publicly-traded company, or if we become more successful, the possibility of new third-party claims may increase.
If we are forced to defend ourselves against intellectual property infringement claims, whether they have merit or are determined in our favor, we may face costly litigation, diversion of technical and management personnel, limitations on our ability to use our current websites and technologies, and an inability to market or provide our solutions. As a result of any such claim, we may have to develop or acquire non-infringing technologies, pay damages, enter into royalty or licensing agreements, cease providing certain services, adjust our marketing and advertising activities, or take other actions to resolve the claims. These actions, if required, may be costly or unavailable on terms acceptable to us, or at all.
18
Furthermore, we have licensed proprietary technologies from third parties that we use in our technologies and business, and we cannot be certain that the owners’ rights in their technologies will not be challenged, invalidated, or circumvented. In addition to the general risks described above associated with intellectual property and other proprietary rights, we are subject to the additional risk that the seller of such technologies may not have appropriately created, maintained, or enforced their rights in such technology.
Our success depends in large part on our ability to protect and enforce our intellectual property rights. If we are not able to adequately protect our intellectual property and proprietary technologies to prevent use or appropriation by our competitors, the value of our brand and other intangible assets may be diminished, and our business may be adversely affected.
Our future success and competitive position depend in large part on our ability to protect our intellectual property and proprietary technologies. We rely on a combination of trademark, patent, copyright, and trade secret laws, as well as confidentiality procedures and contractual restrictions, to establish and protect our proprietary rights, all of which provide only limited protection and may not now or in the future provide us with a competitive advantage. CARBONITE is a registered trademark in the U.S. and in over 30 other countries, including countries in the European Union. Carbonite also has additional registrations and pending applications for additional marks in the U.S. and other countries. We cannot assure you that any future trademark registrations will be issued for pending or future applications or that any registered trademarks will be enforceable or provide adequate protection of our proprietary rights. We currently have 27 issued patents and 20 pending patent applications in the U.S. and internationally. We cannot assure you that any patents will issue from any such patent applications, that patents that issue from such applications will give us the protection that we seek, or that any such patents will not be challenged, invalidated, or circumvented. Any patents that may issue in the future from our pending or future patent applications may not provide sufficiently broad protection and may not be enforceable in actions against alleged infringers. To counter infringement or unauthorized use, we may be required to file patent infringement claims, which can be expensive and time-consuming to litigate. In addition, in an infringement proceeding, a court may decide that a patent of ours is not valid or is unenforceable, or may refuse to stop others from using the technology at issue on the grounds that our patent(s) do not cover such technology. An adverse determination of any litigation or defense proceedings could put one or more of our patents at risk of being invalidated or interpreted narrowly and could put our patent applications at risk of not being issued.
There can be no assurance that the steps that we take will be adequate to protect our technologies and intellectual property, that our trademark and patent applications will lead to registered trademarks or issued patents, that others will not develop or patent similar or superior technologies, solutions, or services, or that our trademarks, patents, and other intellectual property will not be challenged, invalidated, or circumvented by others. Furthermore, effective trademark, patent, copyright, and trade secret protection may not be available in every country in which our services are available or where we have employees or independent contractors. In addition, the legal standards relating to the validity, enforceability, and scope of protection of intellectual property rights in internet-related industries are uncertain and still evolving. If our efforts to protect our technologies and intellectual property are inadequate, the value of our brand and other intangible assets may be diminished and competitors may be able to mimic our solutions and methods of operations. Any of these events could have a material adverse effect on our business, financial condition, and operating results.
Confidentiality agreements with employees and others may not adequately prevent disclosure of our trade secrets and proprietary information. Failure to protect our proprietary information could make it easier for third parties to compete with our solutions and harm our business.
We have devoted substantial resources to the development of our proprietary technologies and related processes. In order to protect our proprietary technologies and processes, we rely in part on trade secret laws and confidentiality agreements with our employees, licensees, independent contractors, and other advisors. These agreements may not effectively prevent disclosure of confidential information and may not provide an adequate remedy in the event of unauthorized disclosure of confidential information. In addition, others may independently discover our trade secrets, in which case we would not be able to assert trade secret rights, or develop similar technologies and processes. Further, laws in certain jurisdictions may afford little or no trade secret protection, and any changes in, or unexpected interpretations of, the intellectual property laws in any country in which we operate may compromise our ability to enforce our intellectual property rights. Costly and time-consuming litigation could be necessary to enforce and determine the scope of our proprietary rights, and failure or inability to obtain or maintain trade secret protection or otherwise protect our proprietary rights could adversely affect our business.
Our use of “open source” software could negatively affect our ability to sell our solutions and subject us to possible litigation.
A portion of the technologies licensed by us to our customers incorporates so-called “open source” software, and we may incorporate open source software in the future. Such open source software is generally licensed by its authors or other third
19
parties under open source licenses. These licenses may subject us to certain unfavorable conditions, including requirements that we offer our solutions that incorporate the open source software for no cost, that we make publicly available source code for modifications or derivative works we create based upon, incorporating, or using the open source software, and/or that we license such modifications or derivative works under the terms of the particular open source license. Additionally, if a third-party software provider has incorporated open source software into software that we license from such provider, we could be required to disclose any of our source code that incorporates or is a modification of such licensed software. If an author or other third party that distributes open source software that we use or license were to allege that we had not complied with the conditions of the applicable license, we could be required to incur significant legal expenses defending against such allegations and could be subject to significant damages, enjoined from the sale of our solutions that contained the open source software, and required to comply with the foregoing conditions. Any of the foregoing could disrupt the distribution and sale of our solutions and harm our business.
We rely on third-party software, including server software and licenses from third parties to use patented intellectual property, that is required to develop and provide our solutions.
We rely on software licensed from third parties to develop and offer our solutions. In addition, we may need to obtain future licenses from third parties to use intellectual property associated with the development of our solutions, which might not be available to us on acceptable terms, or at all. Any loss of the right to use any software required for the development and maintenance of our solutions could result in delays in the provision of our solutions until equivalent technology is either developed by us, or, if available from others, is identified, obtained, and integrated, which delay could harm our business. Any errors or defects in third-party software could result in errors or a failure of our solutions, which could harm our business.
If we are unable to protect our domain names, our reputation, brand, customer base, and revenue, as well as our business and operating results, could be adversely affected.
We have registered domain names for websites, or URLs, that we use in our business, such as www.carbonite.com. If we are unable to maintain our rights in these domain names, our competitors or other third parties could capitalize on our brand recognition by using these domain names for their own benefit. In addition, although we own the Carbonite domain name under various global top level domains such as .com and .net, as well as under various country-specific domains, we might not be able to, or may choose not to, acquire or maintain other country-specific versions of the Carbonite domain name or other potentially similar URLs. Domain names similar to ours have already been registered in the U.S. and elsewhere, and our competitors or other third parties could capitalize on our brand recognition by using domain names similar to ours. The regulation of domain names in the U.S. and elsewhere is generally conducted by internet regulatory bodies and is subject to change. If we lose the ability to use a domain name in a particular country, we may be forced to either incur significant additional expenses to market our solutions within that country, including the development of a new brand and the creation of new promotional materials, or elect not to sell our solutions in that country. Either result could substantially harm our business and operating results. Regulatory bodies could establish additional top-level domains, appoint additional domain name registrars, or modify the requirements for holding domain names. As a result, we may not be able to acquire or maintain the domain names that utilize the name Carbonite in all of the countries in which we currently conduct or intend to conduct business. Further, the relationship between regulations governing domain names and laws protecting trademarks and similar proprietary rights varies among jurisdictions and is unclear in some jurisdictions. We may be unable to prevent third parties from acquiring and using domain names that infringe, are similar to, or otherwise decrease the value of, our brand or our trademarks. Protecting and enforcing our rights in our domain names and determining the rights of others may require litigation, which could result in substantial costs, divert management attention, and not be decided favorably to us.
Material defects or errors in our software could harm our reputation, result in significant costs to us, and impair our ability to sell our solutions.
The software applications underlying our solutions are inherently complex and may contain material defects or errors, particularly when first introduced or when new versions or enhancements are released. We have from time to time found defects or errors in our solutions, and new defects or errors in our existing solutions may be detected in the future by us or our customers. The costs incurred in correcting such defects or errors may be substantial and could harm our operating results. In addition, we rely on hardware purchased or leased and software licensed from third parties to offer our solutions. Any defects in, or unavailability of, our or third-party software or hardware that cause interruptions to the availability of our solutions could, among other things:
• | cause a reduction in revenue or delay in market acceptance of our solutions; |
• | require us to issue credits or refunds to our customers or expose us to claims for damages; |
20
• | cause us to lose existing customers and make it more difficult to attract new customers; |
• | divert our development resources or require us to make extensive changes to our solutions or software, which would increase our expenses; |
• | increase our technical support costs; and |
• | harm our reputation and brand. |
Risks Related to Ownership of our Common Stock
Our stock price may be volatile due to fluctuations in our operating results and other factors, each of which could cause our stock price to decline and you may be unable to sell your shares at or above the price at which you purchased your stock.
Shares of our common stock were sold in our initial public offering in August 2011 at a price of $10.00 per share, and our common stock has subsequently traded as high as $21.10 and as low as $5.75. An active, liquid, and orderly market for our common stock may not be developed or sustained, which could depress the trading price of our common stock. The market price for shares of our common stock could be subject to significant fluctuations in response to various factors, some of which are beyond our control. Some of the factors that may cause the market price for shares of our common stock to fluctuate include:
• | price and volume fluctuations in the overall stock market from time to time; |
• | fluctuations in our quarterly financial results or the quarterly financial results of companies perceived to be similar to us; |
• | actual or anticipated fluctuations in our key operating metrics, financial condition, and operating results; |
• | loss of existing customers or inability to attract new customers; |
• | actual or anticipated changes in our growth rate; |
• | announcements of technological innovations or new offerings by us or our competitors; |
• | our announcement of actual results for a fiscal period that are lower than projected or expected or our announcement of revenue or earnings guidance that is lower than expected; |
• | changes in estimates of our financial results or recommendations by securities analysts; |
• | failure of any of our solutions to achieve or maintain market acceptance; |
• | changes in market valuations of similar companies; |
• | success of competitive solutions or services; |
• | changes in our capital structure, such as future issuances of securities or the incurrence of debt; |
• | announcements by us or our competitors of significant solutions or services, contracts, acquisitions, or strategic alliances; |
• | regulatory developments in the U.S. or foreign countries; |
• | actual or threatened litigation involving us or our industry; |
• | additions or departures of key personnel; |
• | general perception of the future of the cloud backup market or our solutions; |
21
• | share price and volume fluctuations attributable to inconsistent trading volume levels of our shares; |
• | sales of our shares of common stock by our existing stockholders; |
• | changes in general economic, industry, and market conditions; and |
• | major changes in our Board of Directors or management or departures of key personnel. |
In addition, the stock market in general, and the market for internet-related companies in particular, has experienced extreme price and volume fluctuations that have often been unrelated or disproportionate to the operating performance of those companies. The trading price of our common stock might also decline in reaction to events that affect other companies in our industry even if these events do not directly affect us. Securities class action litigation has often been instituted against companies following periods of volatility in the overall market and in the market price of a company’s securities. Such litigation, if instituted against us, could result in very substantial costs, divert our management’s attention and resources, and harm our business, financial condition, and operating results. In addition, recent fluctuations in the financial and capital markets have resulted in volatility in securities prices.
Our failure to raise additional capital or generate the cash flows necessary to expand our operations and invest in our business could reduce our ability to compete successfully.
Although we currently anticipate that our available funds will be sufficient to meet our cash needs for the next 12 months, we may require additional financing in the future. Our ability to obtain financing will depend, among other things, on our development efforts, business plans, operating performance and condition of the capital markets at the time we seek financing. If we need to raise additional funds, we may not be able to obtain debt or equity financing on favorable terms, if at all. If we raise additional equity financing, our stockholders may experience significant dilution of their ownership interests, and the per share value of our common stock could decline. If we engage in debt financing, we may be required to accept terms that restrict our ability to incur additional indebtedness and force us to maintain specified liquidity or other ratios. If we need additional capital and cannot raise it on acceptable terms, we may not be able to, among other things:
• | develop or enhance our solutions; |
• | continue to expand our development, sales, and marketing organizations; |
• | acquire complementary technologies, solutions, or businesses; |
• | expand our operations in the U.S. or internationally; |
• | hire, train, and retain employees; |
• | respond to competitive pressures or unanticipated working capital requirements; or |
• | continue our operations. |
Future sales of shares of our common stock by existing stockholders could depress the market price of our common stock.
If our existing stockholders sell, or indicate an intent to sell, a substantial number of shares of our common stock in the public market, the trading price of our common stock could decline significantly. Two of our largest shareholders are venture capital funds, which are typically structured to have a finite life. As these venture capital funds approach or pass the respective terms of their funds, their decision to sell or hold our common stock may be based not only on the underlying investment merits of our securities but also on the requirements of their internal fund structure. Additionally, our directors, executive officers, and holders of more than 5% of our common stock, and their respective affiliates beneficially own approximately 12.3 million shares of our common stock, which represents 43.5% of our issued and outstanding shares of common stock as of December 31, 2015. If these shares are sold, or if it is perceived that they will be sold in the public market, the trading price of our common stock could decline substantially.
22
Our directors, executive officers, and principal stockholders have substantial control over us and could delay or prevent a change in corporate control.
Our directors, executive officers, and holders of more than 5% of our common stock, together with their affiliates, beneficially hold a majority of our outstanding shares of common stock and have the ability to control the outcome of matters submitted to our stockholders for approval, including the election of directors and any merger, consolidation, or sale of all or substantially all of our assets. In addition, these stockholders, acting together, have the ability to control or influence the management and affairs of our company. This concentration of ownership could limit your ability to influence corporate matters and may have the effect of delaying or preventing a change in control of our company.
We do not currently intend to pay dividends on our common stock and, consequently, your ability to achieve a return on your investment will depend on appreciation in the price of our common stock.
We have never declared or paid any cash dividends on our common stock and do not intend to do so for the foreseeable future. We currently intend to invest our future earnings, if any, to fund our growth and continuing operations. Therefore, you are not likely to receive any dividends on your shares of common stock for the foreseeable future and the success of an investment in shares of our common stock will depend upon any future appreciation in their value. Our common stock may not appreciate in value or even maintain the price at which our stockholders have purchased their shares.
We cannot guarantee that we will repurchase our common stock pursuant to our stock repurchase program or that our stock repurchase program will enhance long-term stockholder value. Stock repurchases could also increase the volatility of the price of our common stock and could diminish our cash reserves.
In May 2015, our board of directors authorized a stock repurchase program. Under the program, we are authorized to repurchase shares of our common stock for an aggregate purchase price not to exceed $20 million. Although our board of directors has authorized the stock repurchase program, the stock repurchase program does not obligate us to repurchase any specific dollar amount or to acquire any specific number of shares and may be suspended or terminated at any time. Stock may be purchased from time to time, in the open market or through private transactions, subject to market condition, in compliance with applicable state and federal securities laws. The timing and amount of repurchases, if any, will depend upon several factors, including market and business conditions, the trading price of our common stock and the nature of other investment opportunities. In addition, repurchases of our common stock pursuant to our stock repurchase program could affect the market price of our common stock or increase its volatility. For example, the existence of a stock repurchase program could cause our stock price to be higher than it would be in the absence of such a program and could potentially reduce the market liquidity for our stock. Additionally, our stock repurchase program could diminish our cash reserves, which may impact our ability to finance future growth and to pursue possible future strategic opportunities and acquisitions. There can be no assurance that any stock repurchases will enhance stockholder value because the market price of our common stock may decline below the levels at which we determine to repurchase our stock. Although our stock repurchase program is intended to enhance long-term stockholder value, there is no assurance that it will do so and short-term stock price fluctuations could reduce the program’s effectiveness.
Anti-takeover provisions contained in our certificate of incorporation, bylaws as well as provisions of Delaware law, could impair a takeover attempt.
Our certificate of incorporation and bylaws contain provisions that could have the effect of delaying or preventing changes in control or changes in our management without the consent of our board of directors. These provisions include:
• | a classified board of directors with three-year staggered terms, which may delay the ability of stockholders to change the membership of a majority of our board of directors; |
• | no cumulative voting in the election of directors, which limits the ability of minority stockholders to elect director candidates; |
• | the exclusive right of our board of directors to elect a director to fill a vacancy created by the expansion of the board of directors or the resignation, death, or removal of a director, which prevents stockholders from being able to fill vacancies on our board of directors; |
• | the ability of our board of directors to determine to issue shares of preferred stock and to determine the price and other terms of those shares, including preferences and voting rights, without stockholder approval, which could be used to significantly dilute the ownership of a hostile acquirer; |
23
• | a prohibition on stockholder action by written consent, which forces stockholder action to be taken at an annual or special meeting of our stockholders; |
• | the requirement that a special meeting of stockholders may be called only by the chairman of the board of directors, the chief executive officer, or the board of directors, which may delay the ability of our stockholders to force consideration of a proposal or to take action; |
• | limiting the liability of, and providing indemnification to, our directors and officers; |
• | controlling the procedures for the conduct and scheduling of stockholder meetings; |
• | providing the board of directors with the express power to postpone previously scheduled annual meetings of stockholders and to cancel previously scheduled special meetings of stockholders; |
• | providing that directors may be removed prior to the expiration of their terms by stockholders only for cause; and |
• | advance notice procedures that stockholders must comply with in order to nominate candidates to our board of directors or to propose matters to be acted upon at a stockholders’ meeting, which may discourage or deter a potential acquiror from conducting a solicitation of proxies to elect the acquiror’s own slate of directors or otherwise attempting to obtain control of us. |
As a Delaware corporation, we are also subject to provisions of Delaware law, including Section 203 of the Delaware General Corporation Law, which prevents some stockholders holding more than 15% of our outstanding common stock from engaging in certain business combinations without approval of the holders of substantially all of our outstanding common stock. Any provision of our certificate of incorporation or bylaws or Delaware law that has the effect of delaying or deterring a change in control could limit the opportunity for our stockholders to receive a premium for their shares of our common stock, and could also affect the price that some investors are willing to pay for our common stock.
24
ITEM 1B. | UNRESOLVED STAFF COMMENTS |
None.
ITEM 2. | PROPERTIES |
Our principal executive offices are located in Boston, Massachusetts, in a 52,588, square-foot facility, under a lease expiring on December 31, 2024. We also have our former corporate headquarters, which is a 39,775 square-foot facility in Boston, Massachusetts, under a lease and sublease expiring on December 31, 2016, and a 22,592 square-foot customer support facility in Lewiston, Maine under a lease expiring on June 1, 2018. We also maintain small offices in Sunnyvale, California, Longmont, Colorado, Munich, Germany and Viersen, Germany.
Our data centers are located in Massachusetts and Arizona. After the renewal of certain of our data center leases in February 2016, our data center leases expire between September 2016 and January 2019. Our Somerville, Massachusetts data center arrangement ended on January 31, 2015.
ITEM 3. | LEGAL PROCEEDINGS |
See Note 12 – Commitments and Contingencies – Litigation to our consolidated financial statements included in this Annual Report for information concerning litigation. From time to time, we have been and may become involved in legal proceedings arising in the ordinary course of our business. Although the results of litigation and claims cannot be predicted with certainty, we are not presently involved in any legal proceeding in which the outcome, if determined adversely to us, would be expected to have a material adverse effect on our business, operating results, or financial condition. Regardless of the outcome, litigation can have an adverse impact on us because of defense and settlement costs, diversion of management resources, and other factors.
ITEM 4. | MINE SAFETY DISCLOSURES |
Not Applicable.
25
ITEM 5. | MARKET FOR REGISTRANT’S COMMON EQUITY, RELATED STOCKHOLDER MATTERS AND ISSUER PURCHASES OF EQUITY SECURITIES |
Market Information
Our common stock is traded on The NASDAQ Global Market under the symbol “CARB.” The following table shows the high and low sale prices per share of our common stock as reported on The NASDAQ Global Market for the periods indicated:
2015 | 2014 | ||||||||||||||
High | Low | High | Low | ||||||||||||
First Quarter | $ | 15.43 | $ | 13.62 | $ | 13.80 | $ | 9.07 | |||||||
Second Quarter | $ | 14.23 | $ | 9.90 | $ | 12.00 | $ | 8.26 | |||||||
Third Quarter | $ | 12.09 | $ | 10.78 | $ | 12.66 | $ | 9.17 | |||||||
Fourth Quarter | $ | 11.35 | $ | 8.40 | $ | 14.89 | $ | 9.55 | |||||||
Holders
On February 29, 2016, the closing price as reported on The NASDAQ Global Market, of our common stock was $7.57 per share. As of February 29, 2016, we had approximately 42 holders of record of our common stock. This does not include the number of persons whose stock is held in nominee or “street” name accounts through brokers.
Dividends
We have never declared or paid, and do not anticipate declaring or paying, any cash dividends on our common stock. Any future determination as to the declaration and payment of dividends, will be at the discretion of our board of directors and will depend on then existing conditions, including our financial condition, operating results, contractual restrictions, capital requirements, business prospects, and other factors that our board of directors may deem relevant.
Securities Authorized for Issuance under Equity Compensation Plans
Our equity plan information required by this item is incorporated by reference to the information in Part III, Item 12 of this Annual Report.
Recent Sales of Unregistered Securities
There were no unregistered sales of our equity securities during the twelve months ended December 31, 2015.
Issuer Purchases of Equity Securities
Period | Total Number of Shares Purchased (1) | Average Price Paid per Share | Total Number of Shares Purchased as Part of Publicly Announced Plans or Programs (2) | Maximum Number (or Approximate Dollar Value) of Shares that May Yet be Purchased Under the Plans or Programs (2) | |||||||||
October 1, 2015 - October 31, 2015 | 216 | $ | 11.28 | — | $ | 17,011,264 | |||||||
November 1, 2015 - November 30, 2015 | 227,610 | $ | 10.33 | 227,610 | $ | 14,659,841 | |||||||
December 1, 2015 - December 31, 2015 | 32,500 | $ | 9.05 | — | $ | 14,659,841 | |||||||
Total | 260,326 | 227,610 | |||||||||||
(1) In October and December 2015 shares of Common Stock were withheld by the Company from the recipient when the vested restricted stock units were settled in order to satisfy withholding obligations of the Company as a result of the vesting of restricted stock units.
(2) In May 2015, our Board of Directors authorized a $20.0 million share repurchase program, announced on May 14, 2015, expiring on May 15, 2018.
26
Performance Graph
The following performance graph compares the cumulative total return to holders of our common stock for the period from August 11, 2011, the date our common stock commenced trading on The NASDAQ Global Market, through December 31, 2015, against the cumulative total return of The NASDAQ Composite Index and The NASDAQ-100 Technology Sector Index.
The comparison assumes that $100.00 was invested in our common stock, The NASDAQ Composite Index and The NASDAQ-100 Technology Sector Index. The graph assumes the initial value of our common stock on August 11, 2011 was the closing sale price on that day of $12.35 per share and not the initial offering price to the public of $10.00 per share. The performance shown on the graph below is based on historical results and is not intended to suggest future performance.
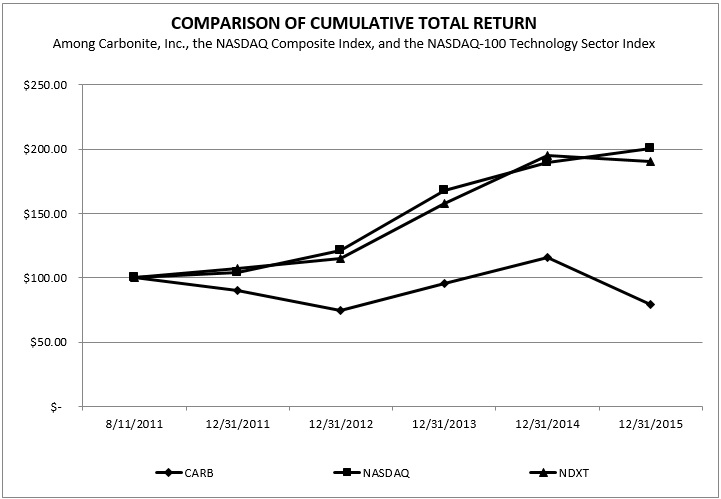
This performance graph shall not be deemed “soliciting material” or to be “filed” with the Securities and Exchange Commission for purposes of Section 18 of the Securities Exchange Act of 1934, as amended (the "Exchange Act"), or otherwise subject to the liabilities under that Section, and shall not be deemed to be incorporated by reference into any filing of Carbonite, Inc. under the Securities Act of 1933, as amended.
PART II
ITEM 6. | SELECTED CONSOLIDATED FINANCIAL AND OTHER DATA |
You should read the following selected consolidated financial and other data below in conjunction with “Management’s Discussion and Analysis of Financial Condition and Results of Operations” and the consolidated financial statements, related notes, and other financial information included in this Annual Report. The selected consolidated financial and other data in this section are not intended to replace the consolidated financial statements and are qualified in their entirety by the consolidated financial statements and related notes included elsewhere in this Annual Report.
27
The consolidated statements of operations data for the years ended December 31, 2015, 2014, and 2013 and the consolidated balance sheets data as of December 31, 2015 and 2014 are derived from our audited consolidated financial statements included elsewhere in this Annual Report. The consolidated statements of operations data for the years ended December 31, 2012 and 2011 and the consolidated balance sheets data as of December 31, 2013, 2012 and 2011 are derived from our audited consolidated financial statements not included in this Annual Report. Historical results are not necessarily indicative of the results to be expected in the future.
Years Ended December 31, | |||||||||||||||||||
2015 | 2014 | 2013 | 2012 | 2011 | |||||||||||||||
(in thousands, except share and per share data) | |||||||||||||||||||
Consolidated statements of operations data: | |||||||||||||||||||
Revenue | $ | 136,616 | $ | 122,620 | $ | 107,194 | $ | 84,043 | $ | 60,512 | |||||||||
Cost of revenue (1) | 38,784 | 38,567 | 34,881 | 29,060 | 23,202 | ||||||||||||||
Gross profit | 97,832 | 84,053 | 72,313 | 54,983 | 37,310 | ||||||||||||||
Operating expenses (1): | |||||||||||||||||||
Research and development | 28,085 | 24,132 | 20,919 | 19,925 | 16,511 | ||||||||||||||
General and administrative | 37,265 | 17,862 | 14,275 | 9,928 | 6,631 | ||||||||||||||
Sales and marketing | 53,671 | 49,882 | 47,349 | 42,719 | 37,722 | ||||||||||||||
Restructuring charges | 469 | 762 | 322 | 1,345 | — | ||||||||||||||
Total operating expenses | 119,490 | 92,638 | 82,865 | 73,917 | 60,864 | ||||||||||||||
Loss from operations | (21,658 | ) | (8,585 | ) | (10,552 | ) | (18,934 | ) | (23,554 | ) | |||||||||
Interest and other income (expense), net | 145 | (398 | ) | 2 | 38 | 41 | |||||||||||||
Loss before income taxes | (21,513 | ) | (8,983 | ) | (10,550 | ) | (18,896 | ) | (23,513 | ) | |||||||||
Provision for income taxes | (102 | ) | (367 | ) | (55 | ) | (40 | ) | (23 | ) | |||||||||
Net loss | (21,615 | ) | (9,350 | ) | (10,605 | ) | (18,936 | ) | (23,536 | ) | |||||||||
Accretion of redeemable convertible preferred stock | — | — | — | — | (128 | ) | |||||||||||||
Net loss attributable to common stockholders | $ | (21,615 | ) | $ | (9,350 | ) | $ | (10,605 | ) | $ | (18,936 | ) | $ | (23,664 | ) | ||||
Basic and diluted net loss per share attributable to common stockholders | $ | (0.80 | ) | $ | (0.35 | ) | $ | (0.41 | ) | $ | (0.74 | ) | $ | (1.84 | ) | ||||
Weighted-average number of common shares used in computing basic and diluted net loss per share | 27,187,910 | 26,816,879 | 26,166,554 | 25,503,068 | 12,841,233 | ||||||||||||||
(1) Stock-based compensation included in the consolidated statements of operations data above was as follows:
Years Ended December 31, | |||||||||||||||||||
2015 | 2014 | 2013 | 2012 | 2011 | |||||||||||||||
(in thousands) | |||||||||||||||||||
Cost of revenue | $ | 730 | $ | 539 | $ | 508 | $ | 440 | $ | 207 | |||||||||
Research and development | 1,171 | 1,285 | 955 | 1,199 | 511 | ||||||||||||||
General and administrative | 7,226 | 3,216 | 2,250 | 1,579 | 346 | ||||||||||||||
Sales and marketing | 1,089 | 1,025 | 1,064 | 913 | 381 | ||||||||||||||
28
As of December 31, | |||||||||||||||||||
2015 | 2014 | 2013 | 2012 | 2011 | |||||||||||||||
(in thousands) | |||||||||||||||||||
Consolidated balance sheet data: | |||||||||||||||||||
Cash | $ | 63,936 | $ | 46,084 | $ | 50,392 | $ | 40,341 | $ | 59,842 | |||||||||
Working (deficit) capital | (28,217 | ) | (23,767 | ) | (11,080 | ) | (11,685 | ) | 18,838 | ||||||||||
Total assets | 125,990 | 131,754 | 109,161 | 100,925 | 99,606 | ||||||||||||||
Deferred revenue, including current portion | 98,703 | 91,424 | 84,000 | 75,206 | 59,696 | ||||||||||||||
Total liabilities | 124,917 | 117,216 | 96,340 | 86,994 | 72,004 | ||||||||||||||
Total stockholders’ equity | 1,073 | 14,538 | 12,821 | 13,931 | 27,602 | ||||||||||||||
Years Ended December 31, | |||||||||||||||||||
2015 | 2014 | 2013 | 2012 | 2011 | |||||||||||||||
(in thousands, except percentage data) | |||||||||||||||||||
Key metrics: | |||||||||||||||||||
Bookings (1) | $ | 144,106 | $ | 128,183 | $ | 115,988 | $ | 98,488 | $ | 80,900 | |||||||||
Annual retention rate (2) | 84 | % | 83 | % | 84 | % | 84 | % | 82 | % | |||||||||
Renewal rate (3) | 82 | % | 80 | % | 80 | % | 82 | % | 82 | % | |||||||||
Free cash flow (4) | $ | 14,251 | $ | 15,072 | $ | 5,974 | $ | (4,065 | ) | $ | (5,972 | ) | |||||||
(1) | We define bookings as revenue recognized during the period plus the change in total deferred revenue, excluding deferred revenue recorded in connection with acquisitions, net of foreign exchange during the same period |
(2) | We define annual retention rate as the percentage of customers on the last day of the prior year who remain customers on the last day of the current year. |
(3) | We define renewal rate for a period as the percentage of customers who renew annual or multi-year subscriptions that expire during the period presented. |
(4) | We define free cash flow as net cash provided by (used in) operating activities, less capital expenditures, and adjusted for the cash portion of the lease exit charge, payments related to corporate headquarter relocation, acquisition-related payments, tender offer-related expenses, and CEO transition payments. |
Bookings and free cash flow are financial data that are not calculated in accordance with generally accepted accounting principles in the U.S. ("GAAP"). The tables below provide reconciliation of bookings and free cash flow to revenue and cash provided by operating activities, respectively, the most directly comparable financial measures calculated and presented in accordance with GAAP.
Our management uses annual retention rate to determine the stability of our customer base and to evaluate the lifetime value of our customer relationships. As customers’ annual and multi-year subscriptions come up for renewal throughout the calendar year based on the dates of their original subscriptions, measuring retention on a trailing twelve month basis at the end of each quarter provides our management with useful and timely information about the stability of our customer base. Management uses renewal rate to monitor trends in customer renewal activity.
Our management uses bookings as a proxy for cash receipts. Bookings represent the aggregate dollar value of customer subscriptions and software arrangements received by us during a period. We initially record a subscription fee as deferred revenue and then recognize it as revenue ratably, on a daily basis, over the life of the subscription period. Management uses free cash flow as a measure of our operating performance; for planning purposes, including the preparation of our annual operating budget; to allocate resources to enhance the financial performance of our business; to evaluate the effectiveness of our business strategies; to provide consistency and comparability with past financial performance; to determine capital requirements; to facilitate a comparison of our results with those of other companies; and in communications with our board of directors concerning our financial performance. We also use free cash flow as a factor when determining management’s incentive compensation. Management believes that the use of free cash flow provides consistency and comparability with our past financial performance, facilitates period to period comparisons of operations, and also facilitates comparisons with other peer companies, many of which use similar non-GAAP financial measures to supplement their GAAP results.
29
Although bookings and free cash flow are frequently used by investors and securities analysts in their evaluations of companies, bookings and free cash flow have limitations as analytical tools, and you should not consider them in isolation or as substitutes for analysis of our results of operations as reported under GAAP. For example:
• | bookings do not reflect our receipt of payment from subscribers; |
• | free cash flow does not reflect our future requirements for contractual commitments to vendors; |
• | free cash flow does not reflect the non-cash component of employee compensation or depreciation and amortization of property and equipment; and |
• | other companies in our industry may calculate bookings or free cash flow or similarly titled measures differently than we do, limiting their usefulness as comparative measures. |
The following tables present reconciliations of our bookings and free cash flow to revenue and cash provided by operating activities, respectively, the most directly comparable financial measures calculated and presented in accordance with GAAP.
Years Ended December 31, | |||||||||||||||||||
2015 | 2014 | 2013 | 2012 | 2011 | |||||||||||||||
(in thousands) | |||||||||||||||||||
Revenue | $ | 136,616 | $ | 122,620 | $ | 107,194 | $ | 84,043 | $ | 60,512 | |||||||||
Add change in deferred revenue, net of foreign exchange (excluding acquisition) | 7,490 | 5,563 | 8,794 | 14,445 | 20,388 | ||||||||||||||
Bookings | $ | 144,106 | $ | 128,183 | $ | 115,988 | $ | 98,488 | $ | 80,900 | |||||||||
Years Ended December 31, | |||||||||||||||||||
2015 | 2014 | 2013 | 2012 | 2011 | |||||||||||||||
(in thousands) | |||||||||||||||||||
Cash provided by operating activities | $ | 13,174 | $ | 22,678 | $ | 14,625 | $ | 9,195 | $ | 7,572 | |||||||||
Subtract capital expenditures | (9,730 | ) | (14,495 | ) | (9,801 | ) | (13,417 | ) | (13,544 | ) | |||||||||
Add payments related to corporate headquarter relocation | 1,309 | 3,872 | — | — | — | ||||||||||||||
Add acquisition-related payments | 1,406 | 2,053 | — | — | — | ||||||||||||||
Add hostile takeover-related payments | 1,791 | 100 | — | — | — | ||||||||||||||
Add CEO transition payments | 29 | 634 | — | — | — | ||||||||||||||
Add cash portion of lease exit charge | 887 | 230 | 1,150 | 157 | — | ||||||||||||||
Add litigation-related payments | 5,385 | — | — | — | — | ||||||||||||||
Free cash flow | $ | 14,251 | $ | 15,072 | $ | 5,974 | $ | (4,065 | ) | $ | (5,972 | ) | |||||||
ITEM 7. | MANAGEMENT’S DISCUSSION AND ANALYSIS OF FINANCIAL CONDITION AND RESULTS OF OPERATIONS |
The following discussion and analysis of our financial condition and results of operations should be read in conjunction with the financial statements and related notes appearing elsewhere in this Annual Report. The following discussion contains forward-looking statements that reflect our plans, estimates, and beliefs. Our actual results could differ materially from those discussed in the forward-looking statements. Factors that could cause or contribute to these differences include those discussed below and elsewhere in this Annual Report on Form 10-K, particularly in “Risk Factors.”
Overview
We are a provider of cloud and hybrid business continuity solutions. Our solutions provide powerful features packaged in a cost-effective, simple, and secure manner and are designed to address the specific needs of SMBs and individuals.
We derive the majority of our revenue from subscription fees and the remainder of our revenue from software arrangements. For our subscription sales, we generally charge customers the full subscription amount at the beginning of each subscription period. Our tiered business offerings provide a fixed amount of cloud storage for an unlimited number of connected devices and customers can purchase additional cloud storage at any time after the commencement of a subscription. For individuals, we offer three different annual cloud backup solutions, each including unlimited storage for one computer.
30
We invest in customer acquisition because the market for business continuity solutions is highly competitive. Our sales model is designed to sell large volumes of our solutions to SMBs globally both directly and through our sales network, including distributors, value-added resellers, volume resellers, and major retailers. Our inside sales force supplements our channel efforts by, for example, following up on leads generated by our marketing programs and actively working to fulfill sales through our channel relationships. We support our go-to-market network with a marketing approach that leverages our established brand in order to drive market awareness and demand generation among the broad population of SMBs and individuals.
As we grow our business, we continue to invest in additional storage and infrastructure. Our capital expenditures in 2015, 2014, and 2013 were $9.7 million, $14.5 million, and $9.8 million, respectively.
Our operating costs continue to grow as customers store more data and as a result of our investment in customer acquisition and research and development. We expect to continue to devote substantial resources to global expansion, customer acquisition, improving our technologies, and expanding our business continuity solutions. In addition, we expect to invest heavily in our operations to support anticipated growth and public company reporting and compliance obligations. We defer revenue over our customers’ subscription periods but expense marketing costs as incurred. As a result of these factors, we expect to continue to incur GAAP operating losses on an annual basis for the foreseeable future.
Our Business Model
As the majority of our business is driven by subscription services, we evaluate the profitability of a customer relationship over its lifecycle. We generally incur customer acquisition costs and capital equipment costs in advance of subscriptions while recognizing revenue ratably over the terms of the subscriptions. As a result, a customer relationship may not be profitable or result in positive cash flow at the beginning of the subscription period, even though it may be profitable or result in positive cash flow over the life of the customer relationship. While we offer monthly, annual and multi-year subscription plans, a significant majority of our customers are currently on annual subscription plans. The annual or multi-year commitments of our customers enhance management’s visibility into revenue, and charging customers at the beginning of the subscription period provides working capital.
Key Business Metrics
Our management regularly reviews a number of financial and operating metrics, including the following key metrics, to evaluate our business:
• | Bookings. We calculate bookings as revenue recognized during a particular period plus the change in total deferred revenue, excluding deferred revenue recorded in connection with acquisitions, net of foreign exchange during the same period. Our management uses this measure as a proxy for cash receipts. Bookings represent the aggregate dollar value of customer subscriptions and software arrangements received by us during a period. We initially record a subscription fee as deferred revenue and then recognize it ratably, on a daily basis, over the life of the subscription period. |
• | Annual retention rate. We calculate annual retention rate as the percentage of customers on the last day of the prior year who remain customers on the last day of the current year. Our management uses these measures to determine the stability of our customer base and to evaluate the lifetime value of our customer relationships. |
• | Renewal rate. We define renewal rate for a period as the percentage of customers who renew annual or multi-year subscriptions that expire during the period presented. Our management uses this measure to monitor trends in customer renewal activity. |
• | Free cash flow. We calculate free cash flow by subtracting the cash paid for the purchase of property and equipment and adding the payments related to corporate headquarter relocation, acquisition-related payments, hostile takeover-related payments, CEO transition payments, litigation-related payments and the cash portion of the lease exit charge from net cash provided by operating activities. Our management uses free cash flow to assess our business performance and evaluate the amount of cash generated by our business. |
Subscription renewals may vary during the year based on the date of our customers’ original subscriptions. As we recognize subscription revenue ratably over the subscription period, this generally has not resulted in a material seasonal impact on our revenue but may result in material monthly and quarterly variances in one or more of the key business metrics described above.
31
Performance Highlights
The following table presents our performance highlights for the periods presented:
Years Ended December 31, | |||||||||||
2015 | 2014 | 2013 | |||||||||
Key metrics: | (in thousands, except percentage data) | ||||||||||
Bookings | $ | 144,106 | $ | 128,183 | $ | 115,988 | |||||
Annual retention rate | 84 | % | 83 | % | 84 | % | |||||
Renewal rate | 82 | % | 80 | % | 80 | % | |||||
Free cash flow | $ | 14,251 | $ | 15,072 | $ | 5,974 | |||||
The following table presents our bookings by line of business for the periods presented:
Years Ended December 31, | 2015 versus 2014 | 2014 versus 2013 | |||||||||||||||
2015 | 2014 | 2013 | % | % | |||||||||||||
(in thousands) | |||||||||||||||||
Consumer | $ | 89,635 | $ | 87,958 | $ | 84,266 | 2 | % | 4 | % | |||||||
SMB | 54,471 | 40,225 | 31,722 | 35 | % | 27 | % | ||||||||||
Total bookings | $ | 144,106 | $ | 128,183 | $ | 115,988 | 12 | % | 11 | % | |||||||
Our total bookings increased over the periods presented, primarily due to increased sales of higher priced SMB solutions and a full year of bookings from our MailStore solutions in 2015. We continue to focus on growing our relationships with active reseller partners, with bookings for our small business solutions representing 38% of total bookings for the year ended December 31, 2015, up from 31% in the year ended December 31, 2014 and 27% in the year ended December 31, 2013. Our bookings growth rate for the year ended December 31, 2015 was impacted by a decline in the year over year growth rate in consumer bookings. We expect this trend to continue.
Free cash flow for the year ended December 31, 2015 decreased by $0.8 million compared to the year ended December 31, 2014, primarily due to an increase in receivables driven by increased sales through reseller partners. Free cash flow for the year ended December 31, 2015 increased by $8.3 million compared to the year ended December 31, 2013, primarily driven by the growth in bookings and increased efficiencies in our business model.
Key Components of our Consolidated Statements of Operations
Revenue
We derive our revenue principally from subscription fees related to our service solutions as well as the sale of software and post-contract customer support. For subscription fees, we typically charge a customer’s credit card the full price of the subscription at the commencement of the subscription period and at each renewal date, unless the customer decides not to renew the subscription. We initially record a customer subscription fee as deferred revenue and then recognize it as revenue ratably, on a daily basis, over the life of the subscription period.
Cost of revenue
Cost of revenue consists primarily of costs associated with our data center operations and customer support centers, including wages and benefits for personnel, depreciation of equipment, amortization of developed technology, rent, utilities and broadband, equipment maintenance, software license fees, and allocated overhead. The expenses related to hosting our services and supporting our customers are related to the number of customers and the complexity of our services and hosting infrastructure. On a cost-per-GB stored basis, our costs have decreased due to decreases in storage prices and greater efficiency in our data center operations. We have also experienced a downward trend in the cost of storage equipment and broadband service, which we expect will continue in the future. We expect these expenses to increase in absolute dollars, but decrease as a percentage of revenue due to improved efficiencies in supporting customers.
32
Gross profit and gross margin
Our gross margins have expanded due to the introduction of higher priced solutions targeting both SMBs and individuals, a downward trend in the cost of storage equipment and services, and efficiencies of our customer support personnel in supporting our customers. We expect these trends to continue.
Operating expenses
Research and development. Research and development expenses consist primarily of wages and benefits for development personnel, third-party outsourcing costs, hosting fees, consulting fees, rent, and depreciation. Our research and development efforts are focused on the enhancement and ease of use of our solutions. These efforts result in updated versions and new suites of our consumer and SMB solutions, while not changing the underlying technology. The majority of our research and development employees are located at our corporate headquarters in the U.S. We expect that research and development expenses will increase in absolute dollars on an annual basis as we continue to enhance and expand our services.
General and administrative. General and administrative expenses consist primarily of wages and benefits for management, finance, accounting, human resources, legal and other administrative personnel, legal and accounting fees, insurance, and other corporate expenses. We expect that general and administrative expenses will increase in absolute dollars on an annual basis as we continue to add personnel and enhance our internal information systems in connection with the anticipated growth of our business and incur costs related to operating as a public company.
Sales and marketing. Sales and marketing expenses consist primarily of wages and benefits for sales and marketing personnel, advertising costs, creative expenses for advertising programs, credit card fees, commissions paid to third-party partners and affiliates, and the cost of providing free trials. We expect that we will continue to commit significant resources to our sales and marketing efforts to grow our business and awareness of our brand and solutions. We expect that sales and marketing expenses will continue to increase in absolute dollars on an annual basis, but decrease as a percentage of revenue over the long term, as we expect to grow our revenue at a faster rate.
Restructuring charges. Restructuring charges consist of lease exit charges related to our corporate headquarter relocation and costs associated with our data center optimization program. See Note 13—Restructuring to our consolidated financial statements included in this Annual Report for additional information.
Critical Accounting Policies
Our financial statements are prepared in accordance with GAAP. The preparation of our financial statements and related disclosures requires us to make estimates, assumptions, and judgments that affect the reported amount of assets, liabilities, revenue, costs and expenses, and related disclosures. We base our estimates and assumptions on historical experience and other factors that we believe to be reasonable under the circumstances, but all such estimates and assumptions are inherently uncertain and unpredictable. We evaluate our estimates and assumptions on an ongoing basis. Actual results may differ from those estimates and assumptions, and it is possible that other professionals, applying their own judgment to the same facts and circumstances, could develop and support alternative estimates and assumptions that would result in material changes to our operating results and financial condition.
See Note 2—Summary of Significant Accounting Policies to our consolidated financial statements included in this Annual Report for additional information about these critical accounting policies, as well as a description of our other significant accounting policies.
Revenue recognition
We derive revenue from Software-as-a-Service ("SaaS") offerings, software license agreements and post-contract customer support ("PCS"). Generally, we recognize revenue when (i) persuasive evidence of an arrangement exists, (ii) delivery has occurred, (iii) the fee is fixed or determinable and (iv) collectability is probable. Our revenue recognition policies for these revenue streams are discussed below.
Software-as-a-Service Arrangements
We derive the majority of our revenue from cloud and hybrid business continuity solutions subscription services. These services are standalone independent service solutions, which are generally contracted for a one- to three-year term. Subscription arrangements include access to use our services via the internet. We recognize revenue in accordance with Accounting Standards Codification (“ASC”) 605-10, Overall Revenue Recognition ("ASC 605-10"). Subscription revenue is recognized ratably on a daily basis upon activation of service over the subscription period, when persuasive evidence of an
33
arrangement with a customer exists, the subscription period has been activated, the price is fixed or determinable, and collection is reasonably assured. Deferred revenues from SaaS arrangements represent payments received from customers for subscription services prior to recognizing the revenue related to those payments.
Software and Software-related Arrangements
We derive the remainder of our revenue from software arrangements, which often contain multiple revenue elements, such as software licenses and PCS. For multiple element software arrangements which qualify for separate element treatment, revenue is recognized for each element when each of the four basic criteria is met, which, excluding PCS, is typically upon delivery. Revenue for PCS agreements is recognized ratably over the term of the agreement, which is generally one year. Revenue is allocated to each element, excluding the software license, based on vendor-specific objective evidence ("VSOE"). VSOE is limited to the price charged when the element is sold separately or, for an element not yet being sold separately, the price established by management having the relevant authority. We do not have VSOE for our software licenses since they are seldom sold separately. Accordingly, revenue is allocated to the software license using the residual value method. Under the residual value method, revenue equal to VSOE of each undelivered element is initially deferred and any remaining arrangement fee is then allocated to the software license.
Business Combinations
In accordance with ASC 805, Business Combinations ("ASC 805"), we recognize the tangible and intangible assets acquired and liabilities assumed based on their estimated fair values. Determining these fair values requires management to make significant estimates and assumptions, especially with respect to intangible assets.
The fair value of identifiable intangible assets is based on detailed valuations that reflect management’s best estimates of inputs and assumptions that a market participant would use. Our identifiable intangible assets acquired consist of developed technology, customer relationships, tradenames, and non-compete agreements. Developed technology consists of products that have reached technological feasibility and tradenames represent acquired company and product names. Customer relationships represent the underlying relationships and agreements with customers of the acquired company’s installed base. Non-compete agreements represent the protection against the loss of business and resultant cash flows from direct competition.
Goodwill and acquired intangible assets
We record goodwill when consideration paid in a business acquisition exceeds the fair value of the net assets acquired. Our estimates of fair value are based upon assumptions believed to be reasonable at that time, but that are inherently uncertain and unpredictable. Assumptions may be incomplete or inaccurate, and unanticipated events or circumstances may occur, that may affect the accuracy or validity of such assumptions, estimates or actual results.
Goodwill is not amortized, but rather is tested for impairment annually or more frequently at the reporting unit level if facts and circumstances warrant a review. We have determined that there is a single reporting unit for the purpose of conducting this goodwill impairment assessment. For purposes of assessing potential impairment, we estimate the fair value of the reporting unit (based on our market capitalization) and compare this amount to the carrying value of the reporting unit (as reflected by our total stockholders’ equity). If we determine that the carrying value of the reporting unit exceeds its fair value, an impairment charge would be required. Our annual goodwill impairment test is performed at November 30th of each year. To date, we have not identified any impairment to goodwill.
Intangible assets acquired in a business combination are recorded at their estimated fair values at the date of acquisition. We amortize acquired intangible assets over their estimated useful lives based on the pattern of consumption of the economic benefits or, if that pattern cannot be readily determined, on a straight-line basis. We review our intangible assets with definite lives for impairment when events or changes in circumstances indicate that the carrying amount of any of these assets may not be recoverable. We have not identified any impairment of our long-lived assets as of December 31, 2015, 2014, and 2013.
Income taxes
We provide for income taxes under the liability method. Deferred tax assets and liabilities are determined based on differences between financial reporting and tax bases of assets and liabilities and are measured using the enacted tax rates in effect when the differences are expected to reverse. Deferred tax assets are reduced by a valuation allowance to reflect the uncertainty associated with their ultimate realization. We account for uncertain tax positions recognized in our consolidated financial statements by prescribing a more-likely-than-not threshold for financial statement recognition and measurement of a tax position taken or expected to be taken in a tax return.
34
Due to a history of losses, we have provided a full valuation allowance, in the U.S. and in foreign tax jurisdictions in which we operate that are in a full tax asset position, against our deferred tax assets. This is more fully described in Note 11—Income Taxes to our consolidated financial statements, included in the Annual Report. The ability to utilize these losses, any future losses, and any other tax credits or attributes may be restricted or eliminated by changes in our ownership, changes in legislation, and other rules affecting the ability to offset future taxable income with losses from prior periods. Future determinations on the need for a valuation allowance on our net deferred tax assets will be made on an annual basis.
Stock-based compensation
Accounting guidance requires employee stock-based payments to be accounted for under the fair value method. Under this method, we are required to record compensation cost based on the estimated fair value for stock-based awards granted over the requisite service periods for the individual awards, which generally equals the vesting periods. We use the straight-line amortization method for recognizing stock-based compensation expenses.
Determining the appropriate fair value model and calculating the fair value of stock-based payment awards requires the use of highly subjective estimates and assumptions, including the estimated fair value of our common stock. Following our initial public offering, we used the quoted market price of our common stock to establish the fair value of the common stock underlying our stock options. Because there was no public market for our common stock prior to our initial public offering, our board of directors determined the fair value of our common stock with input from management, based on reports of an unrelated third-party valuation specialist.
We estimate the fair value of stock options on the date of grant using the Black-Scholes option-pricing model, and the fair value of stock options with market-based vesting conditions on the date of grant using the lattice model with a Monte Carlo simulation. These models further require the use of highly subjective estimates and assumptions, including expected stock price volatility, expected term of an award, risk-free interest rate, and expected dividend yield. As a public company with limited trading history, we consider both the volatility of our stock price and that of our publicly traded peer companies. The expected life assumption is based on the simplified method for estimating expected term as we do not have sufficient stock option exercise experience to support a reasonable estimate of the expected term. The risk-free interest rate is based on the implied yield currently available on U.S. Treasury zero-coupon issues with terms approximately equal to the expected life of the stock option. We use an expected dividend rate of zero as we currently have no history or expectation of paying cash dividends on our capital stock.
Results of Operations
The following table sets forth, for the periods presented, data from our consolidated statements of operations as a percentage of revenue that each line item represents. The period-to-period comparison of financial results is not necessarily indicative of future results. The information contained in the tables below should be read in conjunction with financial statements and related notes included elsewhere in this Annual Report.
35
Years Ended December 31, | ||||||||
2015 | 2014 | 2013 | ||||||
(% of revenue) | ||||||||
Consolidated statements of operations data: | ||||||||
Revenue | 100.0 | % | 100.0 | % | 100.0 | % | ||
Cost of revenue | 28.4 | 31.5 | 32.5 | |||||
Gross profit | 71.6 | 68.5 | 67.5 | |||||
Operating expenses: | ||||||||
Research and development | 20.6 | 19.7 | 19.5 | |||||
General and administrative | 27.3 | 14.5 | 13.3 | |||||
Sales and marketing | 39.3 | 40.7 | 44.2 | |||||
Restructuring charges | 0.3 | 0.6 | 0.3 | |||||
Total operating expenses | 87.5 | 75.5 | 77.3 | |||||
Loss from operations | (15.9 | ) | (7.0 | ) | (9.8 | ) | ||
Interest and other income (expense), net | 0.2 | (0.3 | ) | — | ||||
Loss before income taxes | (15.7 | ) | (7.3 | ) | (9.8 | ) | ||
Provision for income taxes | 0.1 | 0.3 | 0.1 | |||||
Net loss | (15.8 | )% | (7.6 | )% | (9.9 | )% | ||
Comparison of Years Ended December 31, 2015, 2014, and 2013
Revenue
Years Ended December 31, | 2015 versus 2014 | 2014 versus 2013 | |||||||||||||||||||||
2015 | 2014 | 2013 | Amount | % | Amount | % | |||||||||||||||||
(in thousands, except percentage data) | |||||||||||||||||||||||
Revenue | $ | 136,616 | $ | 122,620 | $ | 107,194 | $ | 13,996 | 11.4 | % | $ | 15,426 | 14.4 | % | |||||||||
Revenue increased by $14.0 million, or 11%, for 2015 compared to 2014, primarily due to increased sales of higher priced SMB solutions and revenue from our MailStore solutions. Revenues increased by $15.4 million, or 14%, for 2014 compared to 2013, primarily due to increased sales of higher priced SMB solutions. Revenue from our SMB solutions was approximately $39.5 million in 2015 compared to $31.0 million in 2014 and $21.4 million in 2013.
Cost of revenue, gross profit, and gross margin
Years Ended December 31, | 2015 versus 2014 | 2014 versus 2013 | |||||||||||||||||||||
2015 | 2014 | 2013 | Amount | % | Amount | % | |||||||||||||||||
(in thousands, except percentage data) | |||||||||||||||||||||||
Cost of revenue | $ | 38,784 | $ | 38,567 | $ | 34,881 | $ | 217 | 0.6 | % | $ | 3,686 | 10.6 | % | |||||||||
Percent of revenue | 28.4 | % | 31.5 | % | 32.5 | % | |||||||||||||||||
Components of cost of revenue: | |||||||||||||||||||||||
Personnel-related costs | $ | 13,853 | $ | 12,614 | $ | 10,361 | $ | 1,239 | 9.8 | % | $ | 2,253 | 21.7 | % | |||||||||
Hosting and depreciation costs | 19,553 | 21,609 | 20,555 | (2,056 | ) | (9.5 | )% | 1,054 | 5.1 | % | |||||||||||||
Software, amortization and other | 5,378 | 4,344 | 3,965 | 1,034 | 23.8 | % | 379 | 9.6 | % | ||||||||||||||
Total cost of revenue | $ | 38,784 | $ | 38,567 | $ | 34,881 | $ | 217 | 0.6 | % | $ | 3,686 | 10.6 | % | |||||||||
Gross profit | $ | 97,832 | $ | 84,053 | $ | 72,313 | $ | 13,779 | 16.4 | % | $ | 11,740 | 16.2 | % | |||||||||
Gross margin | 71.6 | % | 68.5 | % | 67.5 | % | |||||||||||||||||
Our gross margin improvement for 2015 and 2014 was driven by an increasing percentage of our revenues derived from higher margin SMB solutions and efficiencies realized in our data centers. Cost of revenue increased by $0.2 million in 2015,
36
primarily driven by an increase of $1.2 million in personnel-related costs associated with supporting our customers, and an increase of $0.9 million in developed technology amortization associated with the acquisitions of MailStore and Rebit. These increases were offset by a decrease in hosting and depreciation costs of $2.1 million primarily due to a decrease in rent and utilities related to the consolidation of one of our data centers.
Cost of revenue increased by $3.7 million in 2014, primarily driven by an increase in personnel-related costs of $2.3 million associated with additional customer support and operations headcount, and an increase in hosting and depreciation costs of $1.1 million associated with rent and utilities costs in our data centers.
Operating expenses
Research and development
Years Ended December 31, | 2015 versus 2014 | 2014 versus 2013 | |||||||||||||||||||||
2015 | 2014 | 2013 | Amount | % | Amount | % | |||||||||||||||||
(in thousands, except percentage data) | |||||||||||||||||||||||
Research and development | $ | 28,085 | $ | 24,132 | $ | 20,919 | $ | 3,953 | 16.4 | % | $ | 3,213 | 15.4 | % | |||||||||
Percent of revenue | 20.6 | % | 19.7 | % | 19.5 | % | |||||||||||||||||
Components of research and development: | |||||||||||||||||||||||
Personnel-related costs | $ | 21,179 | $ | 18,556 | $ | 16,275 | $ | 2,623 | 14.1 | % | $ | 2,281 | 14.0 | % | |||||||||
Third-party outsourcing costs | 3,498 | 3,064 | 1,885 | 434 | 14.2 | % | 1,179 | 62.5 | % | ||||||||||||||
Hosting, independent contractors and other | 3,408 | 2,512 | 2,759 | 896 | 35.7 | % | (247 | ) | (9.0 | )% | |||||||||||||
Total research and development | $ | 28,085 | $ | 24,132 | $ | 20,919 | $ | 3,953 | 16.4 | % | $ | 3,213 | 15.4 | % | |||||||||
Research and development expenses increased by $4.0 million in 2015, primarily related to an increase of $2.6 million in personnel-related costs, an increase of $0.4 million in third-party outsourcing costs, and an increase of $0.9 million of hosting, independent contractors and other expenses associated with enhancing the functionality and ease of use of our solutions.
Research and development expenses increased by $3.2 million in 2014, primarily related to an increase of $2.3 million in personnel-related costs associated with additional research and development headcount and an increase of $1.2 million in third-party outsourcing costs associated with enhancing the functionality and ease of use of our solutions.
General and administrative
Years Ended December 31, | 2015 versus 2014 | 2014 versus 2013 | |||||||||||||||||||||
2015 | 2014 | 2013 | Amount | % | Amount | % | |||||||||||||||||
(in thousands, except percentage data) | |||||||||||||||||||||||
General and administrative | $ | 37,265 | $ | 17,862 | $ | 14,275 | $ | 19,403 | 108.6 | % | $ | 3,587 | 25.1 | % | |||||||||
Percent of revenue | 27.3 | % | 14.5 | % | 13.3 | % | |||||||||||||||||
Components of general and administrative: | |||||||||||||||||||||||
Personnel-related costs | $ | 17,687 | $ | 10,350 | $ | 7,413 | $ | 7,337 | 70.9 | % | $ | 2,937 | 39.6 | % | |||||||||
Professional fees | 16,451 | 4,278 | 4,365 | 12,173 | 284.5 | % | (87 | ) | (2.0 | )% | |||||||||||||
Consulting, taxes and other | 3,127 | 3,234 | 2,497 | (107 | ) | (3.3 | )% | 737 | 29.5 | % | |||||||||||||
Total general and administrative | $ | 37,265 | $ | 17,862 | $ | 14,275 | $ | 19,403 | 108.6 | % | $ | 3,587 | 25.1 | % | |||||||||
General and administrative expenses increased by $19.4 million in 2015, primarily related to an increase of $12.2 million in professional fees associated with an increase in litigation-related expenses of $6.4 million, an increase in acquisition-related expenses of $4.8 million primarily resulting from the EVault Acquisition, and an increase hostile takeover-related expenses of $1.2 million. The remaining increase in general and administrative expenses related to an increase in $7.3 million in personnel-related costs associated with additional headcount to support our overall growth. Included in the increase in personnel-related costs is a $4.0 million increase in stock-based compensation expense.
37
General and administrative expenses increased by $3.6 million in 2014, primarily related to an increase of $2.9 million in personnel-related costs associated with additional headcount. The remaining increase in expenses relates to an increase in legal fees and consulting expenses associated with our international expansion efforts.
Sales and marketing
Years Ended December 31, | 2015 versus 2014 | 2014 versus 2013 | |||||||||||||||||||||
2015 | 2014 | 2013 | Amount | % | Amount | % | |||||||||||||||||
(in thousands, except percentage data) | |||||||||||||||||||||||
Sales and marketing | $ | 53,671 | $ | 49,882 | $ | 47,349 | $ | 3,789 | 7.6 | % | $ | 2,533 | 5.3 | % | |||||||||
Percent of revenue | 39.3 | % | 40.7 | % | 44.2 | % | |||||||||||||||||
Components of sales and marketing: | |||||||||||||||||||||||
Personnel-related costs | $ | 19,498 | $ | 13,907 | $ | 8,961 | $ | 5,591 | 40.2 | % | $ | 4,946 | 55.2 | % | |||||||||
Advertising costs | 15,040 | 17,952 | 25,197 | (2,912 | ) | (16.2 | )% | (7,245 | ) | (28.8 | )% | ||||||||||||
Costs of credit card transactions and offering free trials | 7,383 | 6,245 | 5,538 | 1,138 | 18.2 | % | 707 | 12.8 | % | ||||||||||||||
Agency fees, consulting and other | 11,750 | 11,778 | 7,653 | (28 | ) | (0.2 | )% | 4,125 | 53.9 | % | |||||||||||||
Total sales and marketing | $ | 53,671 | $ | 49,882 | $ | 47,349 | $ | 3,789 | 7.6 | % | $ | 2,533 | 5.3 | % | |||||||||
Sales and marketing expenses increased by $3.8 million in 2015. This increase was primarily attributable to an increase in personnel-related costs of $5.6 million associated with increased headcount on our sales team, an increase of $1.1 million for offering free trials and presale support, partially offset by decreased advertising costs of $2.9 million associated with a reduction in our traditional radio and television advertising spend.
Sales and marketing expenses increased by $2.5 million in 2014, primarily attributable to an increase in personnel-related costs of $4.9 million associated with increased headcount on our sales team, an increase of agency fees, consulting and other of $4.1 million related to increased investments in our indirect channel organization, all partially offset by decreased advertising costs of $7.2 million associated with a reduction in our traditional radio and television advertising spend.
Restructuring
Years Ended December 31, | 2015 versus 2014 | 2014 versus 2013 | |||||||||||||||||||||
2015 | 2014 | 2013 | Amount | % | Amount | % | |||||||||||||||||
(in thousands, except percentage data) | |||||||||||||||||||||||
Restructuring | $ | 469 | $ | 762 | $ | 322 | $ | (293 | ) | (38.5 | )% | $ | 440 | 136.6 | % | ||||||||
We recorded restructuring charges of $0.5 million during 2015, primarily related to the completion of our data center optimization program as well as a change in estimate of our lease exit charge for our former Boston, Massachusetts corporate headquarters. We recorded restructuring charges of $0.8 million during 2014 consisting of a $0.4 million lease exit charge related to our corporate headquarter relocation and $0.4 million in costs related to our data center optimization program. Refer to Note 13—Restructuring to our consolidated financial statements included in this Annual Report for additional information.
Income Taxes
Years Ended December 31, | 2015 versus 2014 | 2014 versus 2013 | |||||||||||||||||||||
2015 | 2014 | 2013 | Amount | % | Amount | % | |||||||||||||||||
(in thousands, except percentage data) | |||||||||||||||||||||||
Provision for income taxes | $ | 102 | $ | 367 | $ | 55 | $ | (265 | ) | (72.2 | )% | $ | 312 | 567.3 | % | ||||||||
We recorded income tax expense of $0.1 million, $0.4 million and $0.1 million for the years ended December 31, 2015, 2014 and 2013, respectively. For the year ended December 31, 2015, our tax provision was primarily driven by Federal Alternative Minimum Tax ("AMT") and state income taxes, partially offset by a release of a reserve for an uncertain tax position due to the close of an audit for one of our German subsidiaries. For the year ended December 31, 2014, the Company’s tax provision was primarily driven by federal AMT and state income taxes.
38
Liquidity and Capital Resources
As of December 31, 2015, we had cash and cash equivalents and marketable securities of $64.9 million, which primarily consisted of cash, money market funds, U.S. agency and treasury securities and certificates of deposit. We have available borrowings under our revolving credit facility of up to $25 million, which we can draw down on through May 6, 2018.
Source of funds
We believe, based on our current operating plan, that our existing cash and cash equivalents, marketable securities, cash provided by operations, and borrowings available under our revolving credit facility will be sufficient to meet our anticipated cash needs for at least the next 12 months.
From time to time, we may explore additional financing sources to develop or enhance our solutions, fund expansion, respond to competitive pressures, acquire or to invest in complementary solutions, businesses or technologies, or to lower our cost of capital, which could include equity, equity-linked, and debt financing. There can be no assurance that any additional financing will be available to us on acceptable terms, if at all. If we raise additional funds through the issuance of equity or convertible debt or other equity-linked securities, our existing stockholders could suffer significant dilution, and any new equity securities we issue could have rights, preferences and privileges superior to those of holders of our common stock.
Our revolving credit facility allows us to borrow up to $25 million, including a $5.0 million sub-limit for letters of credit, through May 6, 2018. Our revolving credit facility may be increased by up to an additional $25.0 million if the existing or additional lenders are willing to make such increased commitments and subject to other terms and conditions. Our revolving credit facility shall be available to us at an interest rate of the Wall Street Journal prime rate plus 75 basis points or LIBOR plus 175 basis points, at our option, and is secured by substantially all of our assets and contains customary affirmative and negative covenants, including financial covenants specifying a minimum quick ratio and minimum consolidated free cash flow, in each case subject to customary and other exceptions for a credit facility of this size and type. To date, we were in compliance with these covenants and there was one letter of credit for $0.8 million outstanding under the credit facility related to the security deposit for our corporate headquarters. To date, the availability under the credit facility was $24.2 million.
Uses of funds
We have increased our operating and capital expenditures in connection with the growth in our operations and the increase in our personnel, and we anticipate that we will continue to increase such expenditures in the future. Our future capital requirements may vary materially from those now planned and will depend on many factors, including:
• | potential future acquisition opportunities; |
• | the levels of advertising and promotion required to acquire and retain customers; |
• | expansion of our data center infrastructure necessary to support our growth; |
• | growth of our operations in the U.S. and worldwide; |
• | our development and introduction of new solutions; and |
• | the expansion of our sales, customer support, research and development, and marketing organizations. |
Future capital expenditures will focus on acquiring additional data storage and hosting capacity and general corporate infrastructure. We are not currently party to any purchase contracts related to future capital expenditures, other than short-term purchase orders.
Cash flows
The following table provides a summary and description of our net cash inflows (outflow) for 2015, 2014, and 2013.
Years Ended December 31, | |||||||||||
2015 | 2014 | 2013 | |||||||||
(in thousands) | |||||||||||
Net cash provided by operating activities | $ | 13,174 | $ | 22,678 | $ | 14,625 | |||||
Net cash provided by (used in) investing activities | 8,323 | (31,126 | ) | (9,297 | ) | ||||||
Net cash (used in) provided by financing activities | (3,394 | ) | 4,239 | 4,728 | |||||||
39
Operating activities
Our cash flows from operating activities are significantly influenced by the amount of our net loss, growth in subscription sales and customer growth, changes in working capital accounts and the timing of prepayments and payments to vendors.
In 2015, cash provided by operating activities was $13.2 million, which was primarily driven by a $7.5 million increase in deferred revenue associated with an increase in sales. Net cash inflows from operating activities included other changes in working capital of $3.1 million, due to the timing of payments and customer receipts, increase in other assets and long-term liabilities of $0.7 million and non-cash charges of $23.5 million, including $13.6 million of depreciation and amortization, $10.2 million of stock-based compensation, offset by $0.2 million related to a gain on disposal of equipment and $0.1 million in other non-cash items. These cash inflows were partially offset by our net loss of $21.6 million.
In 2014, cash provided by operating activities was $22.7 million, which was primarily driven by a $5.6 million increase in deferred revenue associated with an increase in subscription sales. Net cash inflows from operating activities included other changes in working capital of $2.9 million, due to the timing of payments and customer receipts, increase in other assets and long-term liabilities of $4.5 million and non-cash charges of $19.1 million, including $12.5 million of depreciation and amortization, $6.1 million of stock-based compensation, and $0.5 million in other non-cash items. These cash inflows were partially offset by our net loss of $9.4 million.
In 2013, cash provided by operating activities was $14.6 million, which was primarily driven by an $8.8 million increase in deferred revenue associated with the increase in subscription sales and customer growth. Net cash inflows from operating activities included non-cash charges of $17.4 million, including $12.6 million of depreciation and amortization, and $4.8 million of stock-based compensation. These cash inflows were partially offset by our net loss of $10.6 million and a $0.6 million increase in prepaid expenses and other current assets.
Investing activities
In 2015, cash provided by investing activities was $8.3 million, which was primarily driven by net proceeds from maturities of marketable securities and derivatives of $18.4 million, a decrease in restricted cash of $0.7 million, and proceeds from the sales of property and equipment of $0.3 million, offset by the use of cash for capital expenditures of $9.7 million and $1.3 million for 2015 acquisitions.
In 2014, cash used in investing activities was $31.1 million, consisting primarily of capital expenditures of $14.5 million related to server equipment and other data center infrastructure as well as payments associated with new corporate headquarter buildouts, an increase in restricted cash of $0.8 million for a security deposit, and the use of $15.8 million, net of cash acquired, in connection with the acquisition of MailStore.
In 2013, cash used in investing activities was $9.3 million, consisting primarily of capital expenditures of $9.8 million, for server equipment and other data center infrastructure, partially offset by the release of $0.5 million of restricted cash as a result of the settlement of a dispute.
Financing activities
Cash used in financing activities in 2015 was $3.4 million, consisting primarily of $5.7 million of cash used to repurchase common stock, offset by $2.3 million from the proceeds from the exercise of stock options.
Cash provided by financing activities in 2014 was $4.2 million from the proceeds from the exercise of stock options.
Cash provided by financing activities in 2013 was $4.7 million from the proceeds from the exercise of stock options.
Off-balance sheet arrangements
As of December 31, 2015, we did not have any off-balance sheet arrangements.
40
Contractual obligations
The following table summarizes our contractual obligations at December 31, 2015 (in thousands):
Payment Due by Period (1) (2) | |||||||||||||||||||
Total | Less Than 1 Year | 1-3 Years | 3-5 Years | More Than 5 Years | |||||||||||||||
(in thousands) | |||||||||||||||||||
Office lease obligations | $ | 19,392 | $ | 2,324 | $ | 4,417 | $ | 6,342 | $ | 6,309 | |||||||||
Hosting facility lease obligations | 3,175 | 2,083 | 1,092 | — | — | ||||||||||||||
Hosted software solution obligations | 1,304 | 666 | 638 | — | — | ||||||||||||||
Consulting obligations | 1,387 | 1,387 | — | — | — | ||||||||||||||
Other purchase commitments | 1,199 | 988 | 205 | 6 | — | ||||||||||||||
Total | $ | 26,457 | $ | 7,448 | $ | 6,352 | $ | 6,348 | $ | 6,309 | |||||||||
(1) See Note 11—Income Taxes to the consolidated financial statements included in this Annual Report for information related to our uncertain tax positions. The future payments related to uncertain tax positions have not been presented in the table above due to the uncertainty of the amounts and timing of cash settlement with the taxing authorities. | |||||||||||||||||||
(2) This table includes amounts for agreements executed as of December 31, 2015. This table excludes $2.4 million of payments associated with the Phoenix, Arizona data center lease that was extended in February 2016 and expires in January 2019. | |||||||||||||||||||
The commitments under our office lease obligations shown above consist primarily of lease payments for our Boston, Massachusetts corporate headquarters and our Lewiston, Maine customer support facility. In May 2014, we entered into a lease agreement for our new corporate headquarters in Boston, Massachusetts. The initial term of the lease expires on December 31, 2024, and we have an option to extend the original term of the lease for one successive five-year period. Upon execution of the lease agreement, we were required to post a security deposit of $0.8 million, which we maintain as a letter of credit. Our landlord can draw against this letter of credit in the event of default by us. The facility was made available to us to begin our build-out on June 1, 2014, and as such, we began recording rent expense at that time. In accordance with the lease, we received a tenant improvement allowance. The rent expense is recorded net of the allowance over the term of the lease. The leasehold improvements associated with the initial build-out are being amortized over the initial term of the lease. Any additional leasehold improvements made during the course of occupancy will be amortized over the shorter of the useful life or remaining life of the lease.
Our Lewiston, Maine support facility lease expires in June 2018. We may terminate this lease at any time upon six months’ notice.
We also lease a small amount of general office space in Sunnyvale, California, Munich, Germany, Viersen, Germany and Longmont, Colorado under lease agreements that expire in March 2020, July 2020, August 2016 and August 2017, respectively.
The commitment under our hosting facility obligations shown above consists of Wakefield, Massachusetts, Chandler, Arizona, and Phoenix, Arizona data centers, as well as a Somerville, Massachusetts data center which ended on January 31, 2015.
Other purchase commitments shown above consist of contractual commitments to various vendors primarily for advertising, marketing, and broadband services.
Recent Accounting Pronouncements
In May 2014, the Financial Accounting Standards Board (“FASB”) issued Accounting Standards Update ("ASU") 2014-9, Revenue from Contacts with Customers (“ASU 2014-9”), updated guidance and disclosure requirements for recognizing revenue. The new revenue recognition standard provides a five-step analysis of transactions to determine when and how revenue is recognized. The revenue standard is based on the principle that revenue should be recognized to depict the transfer of promised goods or services to customers in an amount that reflects the consideration to which the entity expects to be entitled in exchange for those goods or services. The guidance will be effective for us on January 1, 2018, with early adoption
41
permitted, but not earlier than January 1, 2017. The guidance may be applied retrospectively to each prior period presented or retrospectively with the cumulative effect recognized as of the date of initial adoption. We are currently assessing the potential impact of the adoption of ASU 2014-9 on our consolidated financial statements.
In August 2014, the FASB issued ASU 2014-15, Presentation of Financial Statements — Going Concern: Disclosure of Uncertainties about an Entity’s Ability to Continue as a Going Concern (“ASU 2014-15”). The standard requires that we evaluate, at each interim and annual reporting period, whether there are conditions or events that raise substantial doubt about its ability to continue as a going concern within one year after the date the financial statements are issued, and provide related disclosures. ASU 2014-15 is effective for annual periods ending after December 15, 2016, and for annual and interim periods thereafter, and early adoption is permitted. We do not expect to early adopt ASU 2014-15, which will be effective for its fiscal year ending December 31, 2016. We do not believe the standard will have a material impact on its consolidated financial statements.
In April 2015, the FASB issued ASU 2015-05, Intangibles—Goodwill and Other—Internal-Use Software: Customer’s Accounting for Fees Paid in a Cloud Computing Arrangement (“ASU 2015-05”). The standard clarifies the circumstances under which a cloud computing customer would account for the arrangement as a license of internal-use software under ASC 350-40. ASU 2015-05 is effective for annual periods, including interim periods within those annual periods, beginning after December 15, 2015, and early adoption is permitted. We do not expect to early adopt ASU 2015-05, which will be effective for its fiscal year ending December 31, 2016. We do not believe the standard will have a material impact on its consolidated financial statements.
In September 2015, the FASB issued ASU 2015-16, Business Combinations (Topic 805): Simplifying the Accounting for Measurement-Period Adjustments ("ASU 2015-16"). The standard requires that an acquirer recognize adjustments to provisional amounts that are identified during the measurement period in the reporting period in which the adjustment amounts are determined. The standard update is effective for fiscal years beginning after December 15, 2015 and interim periods within those fiscal years. The standard update is to be applied prospectively to adjustments of provisional amounts that occur after the effective date with earlier application permitted for financial statements that have not been issued. We have elected, as permitted by the standard, to early adopt ASU 2015-16 on a prospective basis as of October 1, 2015. The adoption of ASU 2015-16 did not have a material impact on our consolidated financial statements.
In November 2015, the FASB issued ASU 2015-17, Income Taxes (Topic 740) Balance Sheet Classification of Deferred Taxes ("ASU 2015-17"). ASU 2015-17 is part of the FASB’s simplification initiative aimed at reducing complexity in accounting standards. This new standard requires that all deferred tax assets and liabilities, along with any related valuation allowance, be classified as noncurrent on the balance sheet. ASU 2015-17 is effective for annual reporting periods beginning after December 15, 2016. Early adoption is permitted on either a retrospective or prospective basis. We elected early adoption on a prospective basis and prior periods have not been restated. The adoption of ASU 2015-17 did not have a material impact on our consolidated financial statements. Refer to Note 11 - Income Taxes to our consolidated financial statement included in this Annual Report for additional information regarding deferred tax assets and liabilities.
In February 2016, the FASB issued ASU No. 2016-02, Leases ("ASU 2016-02"). ASU 2016-02 requires lessees to recognize the assets and liabilities on their balance sheet for the rights and obligations created by most leases and continue to recognize expenses on their income statements over the lease term. It will also require disclosures designed to give financial statement users information on the amount, timing, and uncertainty of cash flows arising from leases. The guidance is effective for annual reporting periods beginning after December 15, 2018 and interim periods within those fiscal years, with early adoption is permitted. We are currently evaluating the effect of the standard on our consolidated financial statements.
ITEM 7A. | QUANTITATIVE AND QUALITATIVE DISCLOSURES ABOUT MARKET RISK |
We are exposed to market risks in the ordinary course of our business. These risks include primarily interest rate fluctuation risks and foreign currency exchange risk.
Interest Rate Fluctuation Risk
We are exposed to market risk related to changes in interest rates. Our cash equivalents and short-term investments consisted of money market funds, certificates of deposit and U.S. government agency bonds. At December 31, 2015, we had cash equivalents and short-term investments of $1.0 million. The carrying amount of our cash equivalents and short-term investments reasonably approximates fair value, due to the short maturities of these instruments. The primary objective of our investment activities is to preserve principal while maximizing income without significantly increasing risk. Our cash equivalents and marketable securities are relatively insensitive to interest rate changes. Due to the short-term nature of our investment portfolio, we do not believe an immediate 10% increase or decrease in interest rates would have a material effect on
42
the fair market value of our portfolio. In the event we borrow under our revolving credit facility, which bears interest at the Wall Street Journal prime rate plus 75 basis points or LIBOR plus 175 basis points, at our option, we would be exposed to interest rate fluctuation risk.
Foreign Currency Exchange Risk
A portion of our revenues and operating expenses are incurred outside the United States and are denominated in foreign currencies, primarily the Euro. These transactions are subject to foreign currency exchange rate fluctuations when translated into U.S. dollars. Assets and liabilities of our foreign entities are translated into U.S. dollars at exchange rates in effect at the balance sheet date, and income and expense items are translated at average rates for the applicable period. Therefore, fluctuations in foreign currency exchange rates may cause us to recognize transaction gains and losses in our statement of operations. A hypothetical 10% increase or decrease in foreign currency exchange rates against the U.S. dollar from the quoted foreign currency exchange rates at December 31, 2015 would not have a material impact on our financial results.
Periodically, we enter into short-term foreign currency forward contracts to offset foreign exchange gains and losses generated by the re-measurement of certain intercompany assets and liabilities denominated in non-functional currencies. These contracts are not designated as cash flow or fair value hedges and generally are for periods of less than one year. Changes in the fair value of these derivatives, as well as re-measurement gains and losses on the underlying intercompany assets and liabilities, are recognized in our statements of operations within "interest and other income (expense), net". We had outstanding contracts with a total notional value of $36.7 million as of December 31, 2015. A hypothetical 10% increase of decrease of foreign exchange rates relative to the U.S. dollar with all other variables held constant would not have a material impact on our financial results, as any increase or decrease in the fair value of our currency exchange rate sensitive derivative instruments would be substantially offset by a corresponding decrease or increase in the fair value of the underlying intercompany assets and liabilities.
While we have implemented strategies to mitigate certain risks associated with fluctuations in foreign currency exchange rates, we cannot ensure that we will not recognize gains or losses from international transactions, as this risk is part of transacting business in an international environment. Our policy does not allow speculation in derivative instruments for profit or execution of derivative instrument contracts for which there are no underlying exposures. We do not use financial instruments for trading purposes and are not party to any leveraged derivatives. Not every exposure is or can be hedged and, where hedges are put in place based on expected foreign exchange exposure, they are based on forecasts for which actual results may differ from the original estimate. Failure to successfully hedge or anticipate currency risks properly could affect our consolidated operating results.
As we increase our operations in international markets, our exposure to potentially volatile movements in foreign currency exchange rates increases. The economic impact to us of foreign currency exchange rate movements is linked to variability in real growth, inflation, interest rates, governmental actions and other factors. These changes, if significant, could cause us to adjust our foreign currency risk strategies.
43
ITEM 8. | FINANCIAL STATEMENTS AND SUPPLEMENTARY DATA |
Carbonite, Inc.
Index to Consolidated Financial Statements
Page | |
44
REPORT OF INDEPENDENT REGISTERED PUBLIC ACCOUNTING FIRM
The Board of Directors and Shareholders of
Carbonite, Inc.
We have audited the accompanying consolidated balance sheets of Carbonite, Inc. as of December 31, 2015 and 2014, and the related consolidated statements of operations, comprehensive loss, stockholders’ equity and cash flows for each of the three years in the period ended December 31, 2015. These financial statements are the responsibility of the Company’s management. Our responsibility is to express an opinion on these financial statements based on our audits.
We conducted our audits in accordance with the standards of the Public Company Accounting Oversight Board (United States). Those standards require that we plan and perform the audit to obtain reasonable assurance about whether the financial statements are free of material misstatement. An audit includes examining, on a test basis, evidence supporting the amounts and disclosures in the financial statements. An audit also includes assessing the accounting principles used and significant estimates made by management, as well as evaluating the overall financial statement presentation. We believe that our audits provide a reasonable basis for our opinion.
In our opinion, the financial statements referred to above present fairly, in all material respects, the consolidated financial position of Carbonite, Inc. at December 31, 2015 and 2014, and the consolidated results of its operations and its cash flows for each of the three years in the period ended December 31, 2015, in conformity with U.S. generally accepted accounting principles.
We also have audited, in accordance with the standards of the Public Company Accounting Oversight Board (United States), Carbonite, Inc.’s internal control over financial reporting as of December 31, 2015, based on criteria established in Internal Control-Integrated Framework issued by the Committee of Sponsoring Organizations of the Treadway Commission (2013 framework), and our report dated March 8, 2016 expressed an unqualified opinion thereon.
/s/ Ernst & Young LLP
Boston, Massachusetts
March 8, 2016
45
Carbonite, Inc.
Consolidated Balance Sheets
December 31, | |||||||
2015 | 2014 | ||||||
(In thousands, except share and per share data) | |||||||
ASSETS | |||||||
Current assets: | |||||||
Cash and cash equivalents | $ | 63,936 | $ | 46,084 | |||
Marketable securities | 1,000 | 15,031 | |||||
Trade accounts receivable, less allowances for doubtful accounts of $139 and $156 | 3,736 | 2,412 | |||||
Prepaid expenses and other current assets | 3,188 | 5,224 | |||||
Restricted cash | 135 | 828 | |||||
Total current assets | 71,995 | 69,579 | |||||
Property and equipment, net | 22,083 | 25,944 | |||||
Other assets | 167 | 2,181 | |||||
Acquired intangible assets, net | 8,640 | 10,322 | |||||
Goodwill | 23,105 | 23,728 | |||||
Total assets | $ | 125,990 | $ | 131,754 | |||
LIABILITIES AND STOCKHOLDERS’ EQUITY | |||||||
Current liabilities: | |||||||
Accounts payable | $ | 8,384 | $ | 7,346 | |||
Accrued expenses | 11,559 | 10,506 | |||||
Current portion of deferred revenue | 80,269 | 75,494 | |||||
Total current liabilities | 100,212 | 93,346 | |||||
Deferred revenue, net of current portion | 18,434 | 15,930 | |||||
Other long-term liabilities | 6,271 | 7,940 | |||||
Total liabilities | 124,917 | 117,216 | |||||
Commitments and contingencies (Note 12) | |||||||
Stockholders’ equity: | |||||||
Preferred stock, $0.01 par value; 6,000,000 shares authorized; no shares issued | — | — | |||||
Common stock, $0.01 par value; 45,000,000 shares authorized at December 31, 2015 and 2014; 27,756,799 shares issued and 27,216,779 shares outstanding at December 31, 2015; 27,207,723 shares issued and 27,205,714 shares outstanding at December 31, 2014 | 278 | 272 | |||||
Additional paid-in capital | 165,391 | 152,920 | |||||
Accumulated deficit | (160,943 | ) | (139,328 | ) | |||
Treasury stock, at cost (540,020 and 2,009 shares as of December 31, 2015 and 2014, respectively) | (5,693 | ) | (22 | ) | |||
Accumulated other comprehensive income | 2,040 | 696 | |||||
Total stockholders’ equity | 1,073 | 14,538 | |||||
Total liabilities and stockholders’ equity | $ | 125,990 | $ | 131,754 | |||
The accompanying notes are an integral part of these consolidated financial statements.
46
Carbonite, Inc.
Consolidated Statements of Operations
Years Ended December 31, | |||||||||||
2015 | 2014 | 2013 | |||||||||
(In thousands, except share and per share data) | |||||||||||
Revenue | $ | 136,616 | $ | 122,620 | $ | 107,194 | |||||
Cost of revenue | 38,784 | 38,567 | 34,881 | ||||||||
Gross profit | 97,832 | 84,053 | 72,313 | ||||||||
Operating expenses: | |||||||||||
Research and development | 28,085 | 24,132 | 20,919 | ||||||||
General and administrative | 37,265 | 17,862 | 14,275 | ||||||||
Sales and marketing | 53,671 | 49,882 | 47,349 | ||||||||
Restructuring charges | 469 | 762 | 322 | ||||||||
Total operating expenses | 119,490 | 92,638 | 82,865 | ||||||||
Loss from operations | (21,658 | ) | (8,585 | ) | (10,552 | ) | |||||
Interest and other income (expense), net | 145 | (398 | ) | 2 | |||||||
Loss before income taxes | (21,513 | ) | (8,983 | ) | (10,550 | ) | |||||
Provision for income taxes | 102 | 367 | 55 | ||||||||
Net loss | (21,615 | ) | (9,350 | ) | (10,605 | ) | |||||
Basic and diluted net loss per share attributable to common stockholders | $ | (0.80 | ) | $ | (0.35 | ) | $ | (0.41 | ) | ||
Weighted-average number of common shares used in computing basic and diluted net loss per share | 27,187,910 | 26,816,879 | 26,166,554 | ||||||||
The accompanying notes are an integral part of these consolidated financial statements.
47
Carbonite, Inc.
Consolidated Statements of Comprehensive Loss
Years Ended December 31, | |||||||||||
2015 | 2014 | 2013 | |||||||||
(In thousands) | |||||||||||
Net loss | $ | (21,615 | ) | $ | (9,350 | ) | $ | (10,605 | ) | ||
Other comprehensive income: | |||||||||||
Net unrealized gain (loss) on marketable securities | 7 | (1 | ) | (5 | ) | ||||||
Foreign currency translation adjustments | 1,337 | 698 | (5 | ) | |||||||
Total other comprehensive income (loss) | 1,344 | 697 | (10 | ) | |||||||
Total comprehensive loss | $ | (20,271 | ) | $ | (8,653 | ) | $ | (10,615 | ) | ||
The accompanying notes are an integral part of these consolidated financial statements.
48
Carbonite, Inc.
Consolidated Statements of Stockholders’ Equity
Common Stock | Additional Paid-in Capital | Accumulated Deficit | Treasury Stock | Accumulated Other Comprehensive Income | Total Stockholders’ Equity | |||||||||||||||||||||
Number of Shares | Amount | |||||||||||||||||||||||||
in thousands, except share data | ||||||||||||||||||||||||||
Balance at December 31, 2012 | 25,806,123 | $ | 258 | $ | 133,059 | $ | (119,373 | ) | $ | (22 | ) | $ | 9 | $ | 13,931 | |||||||||||
Issuance of common stock in connection with stock option exercises | 724,327 | 7 | 4,721 | 4,728 | ||||||||||||||||||||||
Issuance of common stock in connection with exercise of warrant | 9,525 | — | ||||||||||||||||||||||||
Stock-based compensation expense | 4,777 | 4,777 | ||||||||||||||||||||||||
Other comprehensive loss | (10 | ) | (10 | ) | ||||||||||||||||||||||
Net loss | (10,605 | ) | (10,605 | ) | ||||||||||||||||||||||
Balance at December 31, 2013 | 26,539,975 | $ | 265 | $ | 142,557 | $ | (129,978 | ) | $ | (22 | ) | $ | (1 | ) | $ | 12,821 | ||||||||||
Issuance of common stock in connection with stock option exercises | 667,748 | 7 | 4,232 | 4,239 | ||||||||||||||||||||||
Stock-based compensation expense | 6,065 | 6,065 | ||||||||||||||||||||||||
Tax benefits relating to share-based payments | 66 | 66 | ||||||||||||||||||||||||
Other comprehensive income | 697 | 697 | ||||||||||||||||||||||||
Net loss | (9,350 | ) | (9,350 | ) | ||||||||||||||||||||||
Balance at December 31, 2014 | 27,207,723 | $ | 272 | $ | 152,920 | $ | (139,328 | ) | $ | (22 | ) | $ | 696 | $ | 14,538 | |||||||||||
Stock options exercised and vesting of restricted stock units | 549,076 | 6 | 2,232 | 2,238 | ||||||||||||||||||||||
Stock-based compensation expense | 10,216 | 10,216 | ||||||||||||||||||||||||
Tax benefits relating to share-based payments | 23 | 23 | ||||||||||||||||||||||||
Acquisition of treasury stock | (5,671 | ) | (5,671 | ) | ||||||||||||||||||||||
Other comprehensive income | 1,344 | 1,344 | ||||||||||||||||||||||||
Net loss | (21,615 | ) | (21,615 | ) | ||||||||||||||||||||||
Balance at December 31, 2015 | 27,756,799 | $ | 278 | $ | 165,391 | $ | (160,943 | ) | $ | (5,693 | ) | $ | 2,040 | $ | 1,073 | |||||||||||
The accompanying notes are an integral part of these consolidated financial statements.
49
Carbonite, Inc.
Consolidated Statements of Cash Flows
Years Ended December 31, | |||||||||||
2015 | 2014 | 2013 | |||||||||
(In thousands) | |||||||||||
Operating activities | |||||||||||
Net loss | $ | (21,615 | ) | $ | (9,350 | ) | $ | (10,605 | ) | ||
Adjustments to reconcile net loss to net cash provided by operating activities: | |||||||||||
Depreciation and amortization | 13,634 | 12,469 | 12,590 | ||||||||
(Gain) loss on disposal of equipment | (192 | ) | — | 63 | |||||||
Accretion of discount on marketable securities | (9 | ) | (34 | ) | (13 | ) | |||||
Stock-based compensation expense | 10,216 | 6,065 | 4,777 | ||||||||
(Reduction of) provision for reserves on accounts receivable | (20 | ) | 63 | (24 | ) | ||||||
Other non-cash items, net | (100 | ) | 506 | — | |||||||
Changes in assets and liabilities, net of acquisitions: | |||||||||||
Accounts receivable | (1,386 | ) | 17 | (303 | ) | ||||||
Prepaid expenses and other current assets | 1,019 | (830 | ) | (586 | ) | ||||||
Other assets | 2,029 | (1 | ) | (947 | ) | ||||||
Accounts payable | 2,864 | 1,952 | (1,395 | ) | |||||||
Accrued expenses | 595 | 1,715 | 2,373 | ||||||||
Other long-term liabilities | (1,372 | ) | 4,496 | (99 | ) | ||||||
Deferred revenue | 7,511 | 5,610 | 8,794 | ||||||||
Net cash provided by operating activities | 13,174 | 22,678 | 14,625 | ||||||||
Investing activities | |||||||||||
Purchases of property and equipment | (9,730 | ) | (14,495 | ) | (9,801 | ) | |||||
Proceeds from sale of property and equipment | 286 | — | — | ||||||||
Proceeds from maturities of marketable securities and derivatives | 19,149 | 16,499 | 10,254 | ||||||||
Purchases of marketable securities and derivatives | (750 | ) | (16,499 | ) | (10,250 | ) | |||||
Decrease (increase) in restricted cash | 693 | (828 | ) | 500 | |||||||
Payment for acquisitions, net of cash acquired | (1,325 | ) | (15,803 | ) | — | ||||||
Net cash provided by (used in) investing activities | 8,323 | (31,126 | ) | (9,297 | ) | ||||||
Financing activities | |||||||||||
Proceeds from exercise of stock options | 2,254 | 4,239 | 4,728 | ||||||||
Excess tax benefit from equity awards | 23 | — | — | ||||||||
Repurchase of common stock | (5,671 | ) | — | — | |||||||
Net cash (used in) provided by financing activities | (3,394 | ) | 4,239 | 4,728 | |||||||
Effect of currency exchange rate changes on cash | (251 | ) | (99 | ) | (5 | ) | |||||
Net increase (decrease) in cash and cash equivalents | 17,852 | (4,308 | ) | 10,051 | |||||||
Cash and cash equivalents, beginning of period | 46,084 | 50,392 | 40,341 | ||||||||
Cash and cash equivalents, end of period | $ | 63,936 | $ | 46,084 | $ | 50,392 | |||||
Supplemental disclosure of cash flow information | |||||||||||
Cash paid for income taxes | $ | 1,760 | $ | — | $ | — | |||||
Non cash investing and financing activities | |||||||||||
Acquisition of property and equipment included in accounts payable and accrued expenses | $ | (1,805 | ) | $ | 853 | $ | 1,755 | ||||
The accompanying notes are an integral part of these consolidated financial statements.
50
Notes to Consolidated Financial Statements
1. Nature of Business
Carbonite, Inc. (the “Company”) was incorporated in the State of Delaware on February 10, 2005 and is a provider of cloud and hybrid business continuity solutions. The Company’s solutions provide powerful features packaged in a cost-effective, simple and secure manner and are designed to address the specific needs of small and medium-sized businesses and individuals.
The Company views its operations and manages its business in one operating segment.
2. Summary of Significant Accounting Policies
Principles of Consolidation
The accompanying consolidated financial statements have been prepared in accordance with accounting principles generally accepted in the United States (“GAAP”) and include the accounts of the Company and its wholly owned subsidiaries. All intercompany accounts and transactions between the Company and its subsidiaries have been eliminated in consolidation.
Use of Estimates
The preparation of consolidated financial statements in conformity with GAAP requires management to make estimates and assumptions that affect the reported amounts of assets and liabilities, the disclosure of contingent assets and liabilities at the date of the financial statements, and the reported amounts of revenues and expenses during the reporting period. Although the Company regularly assesses these estimates, actual results could differ materially from these estimates. Changes in estimates are recorded in the period in which they become known. The Company bases its estimates on historical experience and various other assumptions that it believes to be reasonable under the circumstances. Actual results may differ from management’s estimates if past experience or other assumptions do not turn out to be substantially accurate, even if such assumptions are reasonable when made.
Translation of Foreign Currencies
The functional currency of the Company’s foreign subsidiaries is generally the local currency in which they operate. The Company translates foreign subsidiaries' assets and liabilities at the exchange rates in effect at period-end and revenues and expenses at the average exchange rates in effect during the period. Gains and losses from foreign currency translation are recorded as a component of other comprehensive loss.
Foreign currency transaction gains and losses are included in "interest and other income (expense), net" in the consolidated statements of operations, net of losses and gains from any related derivative financial instruments. Transaction losses were $3.5 million and $1.2 million during the years ended December 31, 2015 and 2014, respectively. The Company recorded an immaterial amount of transaction losses during the year ended December 31, 2013.
Concentration of Credit Risk
Financial instruments that potentially subject the Company to credit risk primarily consist of cash and cash equivalents, marketable securities, derivatives, and accounts receivable. The Company maintains its cash and cash equivalents, marketable securities, and derivatives with high-quality financial institutions and, consequently, the Company believes that such funds are subject to minimal credit risk. Cash equivalents and marketable securities consist of investment grade debt securities or money market funds investing in such securities.
The Company sells its services primarily to small and medium-sized businesses and individuals. Payment for the majority of the Company’s sales occurs via credit card. The Company regularly reviews its accounts receivable related to customers billed on traditional credit terms and provides an allowance for expected credit losses. Due to these factors, no additional credit risk beyond amounts provided for collection losses is believed by management to be probable in the Company’s accounts receivable. At both December 31, 2015 and December 31, 2014, no customer represented 10% or more of the Company’s accounts receivable balance and no customer represented 10% or more of the Company’s revenue for all periods presented.
51
Revenue Recognition
The Company derives revenue from Software-as-a-Service ("SaaS") offerings, software license agreements and post-contract customer support ("PCS"). Generally, the Company recognizes revenue when (i) persuasive evidence of an arrangement exists, (ii) delivery has occurred, (iii) the fee is fixed or determinable and (iv) collectability is probable. Our revenue recognition policies for these revenue streams are discussed below.
Software-as-a-Service Arrangements
The Company derives the majority of its revenue from cloud and hybrid business continuity solutions subscription services. These services are standalone independent service solutions, which are generally contracted for a one- to three-year term. Subscription arrangements include access to use the Company’s services via the internet. The Company recognizes revenue in accordance with Accounting Standards Codification (“ASC”) 605-10, Overall Revenue Recognition ("ASC 605-10"). Subscription revenue is recognized ratably on a daily basis upon activation of service over the subscription period, when persuasive evidence of an arrangement with a customer exists, the subscription period has been activated, the price is fixed or determinable, and collection is reasonably assured. Deferred revenues from SaaS arrangements represent payments received from customers for subscription services prior to recognizing the revenue related to those payments.
Software and Software-related Arrangements
The Company derives the remainder of its revenue from software arrangements, which often contain multiple revenue elements, such as software licenses and PCS. For multiple element software arrangements which qualify for separate element treatment, revenue is recognized for each element when each of the four basic criteria is met, which, excluding PCS, is typically upon delivery. Revenue for PCS agreements is recognized ratably over the term of the agreement, which is generally one year. Revenue is allocated to each element, excluding the software license, based on vendor-specific objective evidence ("VSOE"). VSOE is limited to the price charged when the element is sold separately or, for an element not yet being sold separately, the price established by management having the relevant authority. The Company does not have VSOE for its software licenses since they are seldom sold separately. Accordingly, revenue is allocated to the software license using the residual value method. Under the residual value method, revenue equal to VSOE of each undelivered element is initially deferred and any remaining arrangement fee is then allocated to the software license.
Cash Equivalents and Marketable Securities
The Company considers all highly liquid investments purchased with an original purchase maturity of three months or less to be the equivalent of cash for the purposes of balance sheet and statement of cash flows presentation.
Marketable securities consist of time deposits and U.S. treasury securities with initial maturities of more than 90 days. Short-term investments in marketable securities are classified as available-for-sale and are recorded at fair value with unrealized gains and losses (excluding other-than-temporary impairments) reported as a separate component of accumulated other comprehensive loss. Realized gains and losses and declines in value judged to be other-than-temporary are included in income based on the specific identification method. Fair value is determined based on quoted market prices. At December 31, 2015 and 2014, the Company's marketable securities have remaining maturities of one year or less and have a total cost basis of $1.0 million and $15.0 million, respectively.
The Company reviews its investments for other-than-temporary impairment whenever evidence indicates that an investment’s carrying amount is not recoverable within a reasonable period of time. There were no other-than-temporary impairments during the years ended December 31, 2015, 2014, and 2013.
Property and Equipment
Property and equipment are stated at cost. Expenditures for repairs and maintenance are charged to expense as incurred. Upon retirement or sale, the cost of the assets disposed of and the related accumulated depreciation are eliminated from the accounts and any resulting gain or loss is reflected in the consolidated statement of operations. Depreciation and amortization is calculated using the straight-line method over the estimated useful lives of the assets, which are as follows:
52
Asset Classification | Estimated Useful Life |
Computer equipment | 2 - 4 years |
Appliance | 3 years |
Software | 3 years |
Internal use software | 2 - 4 years |
Furniture and fixtures | 5 years |
Leasehold improvements | Shorter of useful life or remaining life of lease |
Impairment of Long-Lived Assets
The Company reviews property and equipment and intangible assets for impairment whenever events or changes in circumstances indicate that the carrying amount of an asset may not be recoverable. If the recoverability of these assets is considered to be impaired, the impairment to be recognized equals the amount by which the carrying value of the assets exceeds their estimated fair value. The Company has not identified any impairment of its long-lived assets as of December 31, 2015, 2014, and 2013.
Business Combinations
In accordance with ASC 805, Business Combinations ("ASC 805"), the Company recognizes tangible and intangible assets acquired and liabilities assumed based on their estimated fair values. Determining these fair values requires management to make significant estimates and assumptions, especially with respect to intangible assets.
The fair value of identifiable intangible assets is based on detailed valuations that use information and assumptions provided by management, which reflect management’s best estimates of inputs and assumptions that a market participant would use. The Company’s identifiable intangible assets consist of developed technology, customer relationships, tradenames, and non-compete agreements. Developed technology consists of products that have reached technological feasibility, and tradenames represent both acquired company and product names. Customer relationships represent the underlying relationships and agreements with customers of the acquired company’s installed base. Non-compete agreements represent the protection against the loss of business and resultant cash flows from direct competition.
Goodwill and Acquired Intangible Assets
The Company records goodwill when consideration paid in a business acquisition exceeds the value of the net assets acquired. The Company’s estimates of fair value are based upon assumptions believed to be reasonable at that time but that are inherently uncertain and unpredictable. Assumptions may be incomplete or inaccurate, and unanticipated events or circumstances may occur, which may affect the accuracy or validity of such assumptions, estimates or actual results.
Goodwill is not amortized, but rather is tested for impairment annually or more frequently at the reporting unit level if facts and circumstances warrant a review. The Company has determined that there is a single reporting unit for the purpose of conducting this goodwill impairment assessment. For purposes of assessing potential impairment, the Company estimates the fair value of the reporting unit (based on the Company’s market capitalization) and compares this amount to the carrying value of the reporting unit (as reflected by the Company’s total stockholders’ equity). If the Company determines that the carrying value of the reporting unit exceeds its fair value, an impairment charge would be required. The Company’s annual goodwill impairment test is performed at November 30th of each year. To date, the Company has not identified any impairment to goodwill.
Intangible assets acquired in a business combination are recorded at their estimated fair values at the date of acquisition. The Company amortizes acquired intangible assets over their estimated useful lives based on the pattern of consumption of the economic benefits or, if that pattern cannot be readily determined, on a straight-line basis. The Company reviews its intangible assets with definite lives for impairment when events or changes in circumstances indicate that the related carrying amount may not be recoverable. To date, the Company has not identified any impairment of our long-lived assets.
Internal-use Software and Website Development
The Company accounts for its software and website development costs in accordance with the guidance in ASC 350-40, Internal Use Software and ASC 350-50, Website Development Costs. The costs incurred in the preliminary stages of
53
development are expensed as incurred. Once an application has reached the development stage, internal and external costs, if direct and incremental, are capitalized until the application is substantially complete and ready for its intended use, at which point the costs are amortized over the estimated useful life of the software. As of December 31, 2015, the Company has capitalized $1.8 million of costs associated with internal-use software and capitalized $1.0 million such costs as of December 31, 2014. For the years ended December 31, 2015 and December 31, 2014, the Company recorded $0.3 million and $0.1 million of amortization expense related to capitalized internal-use software, respectively. There was no amortization expense of capitalized amounts recorded for the year ended December 31, 2013.
Advertising Expenses
The Company expenses advertising costs as incurred. During the years ended December 31, 2015, 2014, and 2013, the Company incurred approximately $15.0 million, $18.0 million, and $25.2 million of advertising expense, respectively, which is included in sales and marketing expense in the accompanying statements of operations.
Accounts Receivable
Accounts receivable are recorded at the invoiced amount. The allowance for doubtful accounts is the Company’s best estimate of the amount of probable credit losses in the Company’s existing accounts receivable. The Company specifically analyzes historical bad debts, the aging of the accounts receivable, creditworthiness, and current economic trends, to evaluate the allowance for doubtful accounts. Past due balances are reviewed individually for collectability. Account balances are charged off against the allowance after all means of collection have been exhausted, and the potential for recovery is considered remote. The Company also maintains an allowance for sales returns and credits to customers for which the Company has the ability to estimate based upon historical experience. The allowance is recorded as a reduction in revenue.
Income Taxes
The Company provides for income taxes under the liability method. Deferred tax assets and liabilities are determined based on differences between financial reporting and tax bases of assets and liabilities and are measured using the enacted tax rates in effect when the differences are expected to reverse. Deferred tax assets are reduced by a valuation allowance to reflect the uncertainty associated with their ultimate realization.
The Company accounts for uncertain tax positions recognized in the consolidated financial statements by prescribing a more-likely-than-not threshold for financial statement recognition and measurement of a tax position taken or expected to be taken in a tax return.
Segment Information
Operating segments are defined as components of an enterprise engaging in business activities for which discrete financial information is available and regularly reviewed by the chief operating decision maker in deciding how to allocate resources and in assessing performance. The Company views its operations and manages its business in one operating segment. The Company does not disclose geographic information for revenue and long-lived assets, excluding deferred tax assets, goodwill and intangible assets. Revenue and long-lived assets, excluding deferred tax assets, goodwill and intangible assets, located outside the United States do not exceed 10% of total revenue and total assets.
Stock-Based Compensation
The Company recognizes stock-based compensation as an expense in the financial statements using the estimated grant-date fair value over the individual award's requisite service period, which equals the vesting periods in all cases but for certain market-based awards. The Company uses the straight-line amortization method for recognizing stock-based compensation expense. The Company estimates the fair value of stock options on the date of grant using the Black-Scholes option-pricing model and the fair value of stock options with market-based vesting conditions on the date of grant using a lattice model with a Monte Carlo simulation. These models require the use of highly subjective estimates and assumptions, including expected stock price volatility, expected term of an award, risk-free interest rate, and expected dividend yield. The grant date fair value of restricted stock units granted is based on the fair value of the underlying common stock on the date of grant.
54
Costs Associated with Exit Activities
The Company accounts for employee termination benefits that represent a one-time benefit in accordance with ASC 420, Exit or Disposal Cost Obligations ("ASC 420"). Other costs associated with exit activities include contract termination costs, including costs related to leased facilities to be abandoned or subleased, expensed in accordance with ASC 420.
Recently Issued Accounting Pronouncements
In May 2014, the Financial Accounting Standards Board (“FASB”) issued Accounting Standards Update ("ASU") 2014-9, Revenue from Contacts with Customers (“ASU 2014-9”), updated guidance and disclosure requirements for recognizing revenue. The new revenue recognition standard provides a five-step analysis of transactions to determine when and how revenue is recognized. The revenue standard is based on the principle that revenue should be recognized to depict the transfer of promised goods or services to customers in an amount that reflects the consideration to which the entity expects to be entitled in exchange for those goods or services. The guidance will be effective for the Company on January 1, 2018, with early adoption permitted, but not earlier than January 1, 2017. The guidance may be applied retrospectively to each prior period presented or retrospectively with the cumulative effect recognized as of the date of initial adoption. The Company is currently assessing the potential impact of the adoption of ASU 2014-9 on its consolidated financial statements.
In August 2014, the FASB issued ASU 2014-15, Presentation of Financial Statements - Going Concern: Disclosure of Uncertainties about an Entity’s Ability to Continue as a Going Concern (“ASU 2014-15”). The standard requires that the Company evaluate, at each interim and annual reporting period, whether there are conditions or events that raise substantial doubt about its ability to continue as a going concern within one year after the date the financial statements are issued, and provide related disclosures. ASU 2014-15 is effective for annual periods ending after December 15, 2016, and for annual and interim periods thereafter, and early adoption is permitted. The Company does not expect to early adopt ASU 2014-15, which will be effective for its fiscal year ending December 31, 2016. The Company does not believe the standard will have a material impact on its consolidated financial statements.
In April 2015, the FASB issued ASU 2015-05, Intangibles-Goodwill and Other-Internal-Use Software: Customer’s Accounting for Fees Paid in a Cloud Computing Arrangement (“ASU 2015-05”). The standard clarifies the circumstances under which a cloud computing customer would account for the arrangement as a license of internal-use software under ASC 350-40. ASU 2015-05 is effective for annual periods, including interim periods within those annual periods, beginning after December 15, 2015, and early adoption is permitted. The Company does not expect to early adopt ASU 2015-05, which will be effective for its fiscal year ending December 31, 2016. The Company does not believe the standard will have a material impact on its consolidated financial statements.
In September 2015, the FASB issued 2015-16, Business Combinations (Topic 805): Simplifying the Accounting for Measurement-Period Adjustments ("ASU 2015-16"). The standard requires that an acquirer recognize adjustments to provisional amounts that are identified during the measurement period in the reporting period in which the adjustment amounts are determined. The standard update is effective for fiscal years beginning after December 15, 2015 and interim periods within those fiscal years. The standard update is to be applied prospectively to adjustments of provisional amounts that occur after the effective date with earlier application permitted for financial statements that have not been issued. The Company has elected, as permitted by the standard, to early adopt ASU 2015-16 on a prospective basis as of October 1, 2015. The adoption of ASU 2015-16 did not have a material impact on our consolidated financial statements.
In November 2015, the FASB issued ASU 2015-17, Income Taxes (Topic 740) Balance Sheet Classification of Deferred Taxes ("ASU 2015-17"). ASU 2015-17 is part of the FASB’s simplification initiative aimed at reducing complexity in accounting standards. This new standard requires that all deferred tax assets and liabilities, along with any related valuation allowance, be classified as noncurrent on the balance sheet. ASU 2015-17 is effective for annual reporting periods beginning after December 15, 2016. Early adoption is permitted on either a retrospective or prospective basis. We elected early adoption on a prospective basis and prior periods have not been restated. The adoption of ASU 2015-17 did not have a material impact on our consolidated financial statements. Refer to Note 11 - Income Taxes for additional information regarding deferred tax assets and liabilities.
In February 2016, the FASB issued ASU No. 2016-02, Leases ("ASU 2016-02"). ASU 2016-02 requires lessees to recognize the assets and liabilities on their balance sheet for the rights and obligations created by most leases and continue to recognize expenses on their income statements over the lease term. It will also require disclosures designed to give financial statement users information on the amount, timing, and uncertainty of cash flows arising from leases. The guidance is effective for annual reporting periods beginning after December 15, 2018 and interim periods within those fiscal years, with early adoption is permitted. The Company is currently evaluating the effect of the standard on its consolidated financial statements.
55
3. Net Loss per Share
The Company calculates basic and diluted net loss per share of common stock by dividing the net loss by the weighted average number of unrestricted common shares outstanding for the period. The following potentially dilutive common stock equivalents have been excluded from the computation of diluted weighted-average shares outstanding as of December 31, 2015, 2014, and 2013 as they would be anti-dilutive due to the Company’s net losses (in thousands):
Years Ended December 31, | ||||||||
2015 | 2014 | 2013 | ||||||
Options to purchase common stock (1) | 3,226 | 3,330 | 3,322 | |||||
Restricted stock units (2) | 1,101 | 850 | — | |||||
Total | 4,327 | 4,180 | 3,322 | |||||
(1) Includes 250,000 options with market-based vesting conditions granted to the Company's chief executive officer in December 2014.
(2) Includes 100,000 equity awards with market-based vesting conditions granted to the Company's chief financial officer in June 2015.
4. Fair Value of Financial Instruments
Derivative Instruments
Non-designated Foreign Currency Contracts
The Company uses foreign currency forward contracts as part of our strategy to manage exposure related to Euro denominated intercompany monetary assets and liabilities. The Company has not designated these forward contracts as hedging instruments pursuant to ASC 815, Derivatives and Hedging. Accordingly, the Company recorded the fair value of these contracts at the end of each reporting period in the consolidated balance sheets, with changes in the fair value recorded in earnings as "interest and other income (expense), net" in the consolidated statements of operations. Cash flows from the settlement of these non-designated foreign currency contracts are reported in cash flows from investing activities. These currency forward contracts are entered into for periods consistent with currency transaction exposures, generally less than one year. At December 31, 2015, we had outstanding contracts with a total notional value of $36.7 million.
The following table provides a quantitative summary of the fair value of derivative instruments not designated as hedging instruments as of December 31, 2015 (in thousands):
Fair Value | |||||||||
Description | Balance Sheet Classification | December 31, 2015 | December 31, 2014 | ||||||
Derivative Assets: | (in thousands) | ||||||||
Non-Designated Hedging Instruments | |||||||||
Foreign currency contracts | Prepaid expenses and other current assets | $ | — | $ | 558 | ||||
Total Derivative Assets | $ | — | $ | 558 | |||||
Derivative Liabilities: | |||||||||
Non-Designated Hedging Instruments | |||||||||
Foreign currency contracts | Accrued expenses | $ | 400 | $ | — | ||||
Total Derivative Liabilities | $ | 400 | $ | — | |||||
The following tables summarize the gains related derivative instruments not designated as hedging instruments for the year ended December 31, 2015, 2014 and 2013 (in thousands):
Years Ended December 31, | |||||||||||||
Location in Statement of Operations | 2015 | 2014 | 2013 | ||||||||||
Foreign currency contracts | Interest and other income (expense), net | $ | 3,404 | $ | 807 | $ | — | ||||||
56
Other Fair Value Measurements
The Company applies the guidance in ASC 820, Fair Value Measurements and Disclosures, ("ASC 820"), which provides that fair value is based on the price that would be received to sell an asset or paid to transfer a liability in an orderly transaction between market participants at the measurement date. In order to increase consistency and comparability in fair value measurements, ASC 820 establishes a fair value hierarchy that prioritizes observable and unobservable inputs used to measure fair value into three broad levels, which are described below:
Level 1: Quoted prices (unadjusted) in active markets that are accessible at the measurement date for assets or liabilities. The fair value hierarchy gives the highest priority to Level 1 inputs.
Level 2: Other inputs that are observable directly or indirectly, such as quoted prices for similar assets and liabilities or market corroborated inputs.
Level 3: Unobservable inputs are used when little or no market data is available, which requires the Company to develop its own assumptions about how market participants would value the assets or liabilities. The fair value hierarchy gives the lowest priority to Level 3 inputs.
In determining fair value, the Company utilizes valuation techniques that maximize the use of observable inputs and minimize the use of unobservable inputs to the extent possible in its assessment of fair value.
The Company’s assets and liabilities that are measured at fair value on a recurring basis, by level, within the fair value hierarchy are summarized as follows (in thousands):
December 31, 2015 | December 31, 2014 | ||||||||||||||||||||||||||||||
Level 1 | Level 2 | Level 3 | Total | Level 1 | Level 2 | Level 3 | Total | ||||||||||||||||||||||||
Assets: | |||||||||||||||||||||||||||||||
Cash equivalents—money market funds | $ | 19,703 | $ | — | $ | — | $ | 19,703 | $ | 15,643 | $ | — | $ | — | $ | 15,643 | |||||||||||||||
Marketable securities—U.S. treasury securities and time deposits | — | 1,000 | — | 1,000 | — | 15,031 | — | 15,031 | |||||||||||||||||||||||
Foreign currency exchange contracts | — | — | — | — | — | 558 | — | 558 | |||||||||||||||||||||||
Total | $ | 19,703 | $ | 1,000 | $ | — | $ | 20,703 | $ | 15,643 | $ | 15,589 | $ | — | $ | 31,232 | |||||||||||||||
Liabilities: | |||||||||||||||||||||||||||||||
Foreign currency exchange contracts | — | 400 | — | 400 | — | — | — | — | |||||||||||||||||||||||
Total | $ | — | $ | 400 | $ | — | $ | 400 | $ | — | $ | — | $ | — | $ | — | |||||||||||||||
The Company’s investments in money market funds are classified as Level 1 within the fair value hierarchy because they are valued using quoted market prices. Our marketable securities and foreign currency exchange contracts are classified as Level 2 within the fair value hierarchy as they are valued using professional pricing sources for identical or comparable instruments, rather than direct observations of quoted prices in active markets. No assets or liabilities are classified as Level 3 within the fair value hierarchy.
5. Acquisitions
Our consolidated financial statements include the operating results for each acquired entity from its respective date of acquisition. The Company does not present pro forma financial information for these acquisitions given their results are not material to our consolidated financial statements.
2015 Acquisitions
SMS Backup
On October 23, 2015, the Company acquired all intellectual property rights in connection with the SMS Backup & Restore and Call Log Backup & Restore applications ("SMS Backup") for total consideration of approximately $0.3 million. The results of operations for the acquisition have been included in the Company's operations since the date of acquisition and were not material for the periods presented.
The acquisition has been accounted for as a business combination and, in accordance with ASC 805, the Company has recorded the assets acquired and liabilities assumed at their respective fair values as of the acquisition date. As a result of the acquisition, the Company recorded identifiable intangible assets related to customer relationships of $0.3 million. As of the
57
acquisition date, the customer relationships had weighted-average useful lives of 6.0 years. These identifiable intangible assets are amortized over their estimated useful lives based on the pattern of consumption of the economic benefits or, if that pattern cannot be readily determined, on a straight-line basis.
Rebit, Inc.
On August 11, 2015, the Company acquired certain assets of Rebit, Inc. ("Rebit") for total consideration of approximately $1.3 million, which included an initial cash payment of $1.0 million and an estimated fair value of $0.3 million for additional consideration which is expected to be paid one year from the date of acquisition. The Company employs six of Rebit’s former employees at its current location in Longmont, Colorado.
The results of operations for the acquisition have been included in the Company's operations since the date of acquisition and were not material for the periods presented.
The acquisition of Rebit has been accounted for as a business combination and, in accordance with ASC 805, the Company has recorded the assets acquired and liabilities assumed at their respective fair values as of the acquisition date. As a result of the acquisition of Rebit, the Company recorded goodwill in the amount of $0.6 million and identifiable intangible assets of $0.7 million. As of the acquisition date, developed technology and customer relationships had weighted-average useful lives of 6.0 years and 4.0 years, respectively. These identifiable intangible assets are amortized over their estimated useful lives based on the pattern of consumption of the economic benefits or, if that pattern cannot be readily determined, on a straight-line basis.
2014 Acquisition
MailStore Software GmbH
On December 19, 2014, the Company completed the acquisition of all of the outstanding capital stock of MailStore Software GmbH (MailStore), for $15.8 million, net of cash acquired. The Company believes that this transaction advances Company's plan for global expansion and enhances the Company's portfolio of continuity solutions for SMBs, adding email archiving and indexing solutions. The Company has maintained the employees of MailStore.
The results of operations for the acquisition have been included in the Company's operations since the date of acquisition and were not material for the periods presented.
The acquisition of MailStore has been accounted for as a business combination and, in accordance with ASC 805, the Company has recorded the assets acquired and liabilities assumed at their respective fair values as of the acquisition date as follows (in thousands):
Cash acquired | $ | 2,005 | |
Accounts receivable | 633 | ||
Prepaid and other | 1,050 | ||
Deferred tax asset | 588 | ||
Intangible assets | 7,443 | ||
Goodwill | 12,502 | ||
Total assets acquired | 24,221 | ||
Less deferred revenue | 1,861 | ||
Less other liabilities assumed | 2,200 | ||
Less deferred tax liability | 2,352 | ||
Net assets acquired | $ | 17,808 | |
Goodwill of $12.5 million was recognized for the excess purchase price over the fair value of the net assets acquired. The goodwill recorded in connection with this transaction is primarily related to synergies expected to be achieved, the ability to leverage existing sales and marketing capacity and customer base with respect to the acquired product, as well as revenue and cash flow projections associated with future technologies. Goodwill from the acquisition of MailStore is included within the Company’s one reporting unit and is included in the annual review for impairment. Goodwill is not deductible for tax purposes as this acquisition was a stock purchase.
58
Identifiable definite-lived intangible assets of $7.4 million will be amortized on a straight-line basis over their estimated useful lives. Developed technology consists of products that have reached technological feasibility and tradenames represent acquired company and product names. The Company used the income approach to derive the fair value of the developed technology asset. The tradename intangible was valued using a relief from royalty method, which considers both the market approach and the income approach. Customer relationships represent the underlying relationships with certain customers to provide ongoing maintenance services for products sold. To value the customer relationships, the Company utilized the income approach, specifically a discounted cash-flow method known as the multi-period excess earnings method. The following table presents the estimated fair values and useful lives of the identifiable intangible assets acquired:
Amount | Weighted Average Useful Life | Risk-Adjusted Discount Rates used in Valuation | ||||||
(in thousands) | (in years) | |||||||
Developed technology | $ | 5,458 | 6 | 15.5 | % | |||
Customer relationships | 1,613 | 8 | 15.5 | % | ||||
Tradenames | 372 | 6 | 15.5 | % | ||||
Total identifiable intangible assets | $ | 7,443 | ||||||
6. Goodwill and Acquired Intangible Assets
As of December 31, 2015 and 2014, the carrying amount of goodwill is $23.1 million and $23.7 million, respectively. The following is a rollforward of our goodwill balance (in thousands):
December 31, | ||||||
2015 | 2014 | |||||
Balance at beginning of fiscal period | $ | 23,728 | $ | 11,536 | ||
Goodwill acquired | 606 | 12,502 | ||||
Effect of foreign exchange rates | (1,229 | ) | (310 | ) | ||
Balance at end of fiscal period | $ | 23,105 | $ | 23,728 | ||
Goodwill is not amortized. The Company reviews goodwill for impairment at least annually in the fourth quarter, or on an interim basis if an event or circumstance occurs indicating the potential for impairment. The Company completed the annual impairment review as of November 30, 2015 by estimating the fair value of the reporting unit (based on the Company’s market capitalization) and comparing this amount to the carrying value of the reporting unit (as reflected by the Company’s total stockholders’ equity). The Company determined that goodwill was not impaired. To date, the Company has had no impairments of goodwill.
Purchased intangible assets consist of the following (in thousands):
December 31, 2015 | December 31, 2014 | ||||||||||||||||||||||||
Weighted- Average Estimated Useful Life (in years) | Gross Carrying Value | Accumulated Amortization | Net Carrying Value | Gross Carrying Value | Accumulated Amortization | Net Carrying Value | |||||||||||||||||||
Developed technology | 6.4 | $ | 8,167 | $ | 2,463 | $ | 5,704 | $ | 8,303 | $ | 1,200 | $ | 7,103 | ||||||||||||
Customer relationships | 6.8 | 3,627 | 1,216 | 2,411 | 3,153 | 695 | 2,458 | ||||||||||||||||||
Tradenames | 7.1 | 726 | 213 | 513 | 763 | 108 | 655 | ||||||||||||||||||
Non-compete agreements | 3.8 | 380 | 368 | 12 | 380 | 274 | 106 | ||||||||||||||||||
Total | $ | 12,900 | $ | 4,260 | $ | 8,640 | $ | 12,599 | $ | 2,277 | $ | 10,322 | |||||||||||||
The Company recorded amortization expense of $2.0 million, $0.9 million and $0.9 million for the years ended December 31, 2015, 2014 and 2013, respectively. Amortization relating to developed technology is recorded within cost of revenue, amortization of customer relationships is recorded within sales and marketing expenses, and amortization of
59
tradenames and non-compete agreements is recorded within general and administrative expenses on the Company's consolidated statements of operations.
Future estimated amortization expense of acquired intangibles is as follows (in thousands):
2016 | $ | 1,871 | |
2017 | 1,694 | ||
2018 | 1,643 | ||
2019 | 1,585 | ||
2020 | 1,410 | ||
Thereafter | 437 | ||
Total | $ | 8,640 | |
7. Property and Equipment
Property and equipment consists of the following (in thousands):
December 31, | |||||||
2015 | 2014 | ||||||
Computer equipment | $ | 53,094 | $ | 60,169 | |||
Software | 2,243 | 2,204 | |||||
Furniture and fixtures | 1,834 | 1,862 | |||||
Leasehold improvements | 8,879 | 8,608 | |||||
Internal-use software | 1,789 | 988 | |||||
Appliances | 279 | 65 | |||||
Total property and equipment | 68,118 | 73,896 | |||||
Less accumulated depreciation and amortization | (46,035 | ) | (47,952 | ) | |||
Property and equipment, net | $ | 22,083 | $ | 25,944 | |||
Depreciation expense was $11.6 million, $11.6 million, and $11.7 million for the years ended December 31, 2015, 2014, and 2013, respectively.
8. Accrued Expenses
Accrued expenses consist of the following (in thousands):
December 31, | |||||||
2015 | 2014 | ||||||
Accrued marketing | $ | 1,727 | $ | 1,827 | |||
Accrued compensation | 3,130 | 2,288 | |||||
Accrued restructuring | 400 | 325 | |||||
Accrued tax liabilities | 435 | 2,394 | |||||
Accrued consulting and professional fees | 3,263 | 1,579 | |||||
Accrued facilities | 819 | 242 | |||||
Accrued other expenses | 1,785 | 1,851 | |||||
Total accrued expenses | $ | 11,559 | $ | 10,506 | |||
9. Stockholders' Equity
Share Repurchase Program
On May 11, 2015, the Company's Board of Directors authorized a $20.0 million share repurchase program, effective from May 15, 2015 through May 15, 2018. Share repurchases are made from time-to-time in the open market, in privately negotiated transactions or otherwise, in accordance with applicable securities laws and regulations. The timing and amount of any share repurchases are determined by the Company's management based on an evaluation of market conditions, the trading price of the stock, and other factors.
60
For the year ended December 31, 2015, the Company repurchased 502,310 shares of its common stock at an average price of $10.63 per share for a total cost of approximately $5.3 million. At December 31, 2015, approximately $14.7 million remained available under the Company's share repurchase program.
10. Stock-based Awards
The Company’s 2005 Stock Incentive Plan (the 2005 Plan) provided for granting of incentive stock options, non-qualified options, restricted stock, or other awards to the Company’s employees, officers, directors, and outside consultants up to an aggregate of 3,601,551 shares of the Company’s common stock. In conjunction with the effectiveness of the 2011 Equity Award Plan (the 2011 Plan), the Company’s Board of Directors voted that no further stock options or other equity-based awards would be granted under the 2005 Plan.
The 2011 Plan provides for the issuance of stock options, restricted stock, restricted stock units, and other stock-based awards to the employees, officers, directors, and consultants of the Company or its subsidiaries. In connection with the approval of the 2011 plan, the Company reserved 1,662,000 shares of common stock for issuance thereunder. On January 1st of each year, beginning on January 1, 2012, the number of shares reserved under the 2011 Plan increased or will increase by the lesser of 1,500,000 shares, 4.0% of the outstanding shares of common stock and common stock equivalents, or another amount determined by the Company’s Board of Directors. As of December 31, 2015, 471,316 shares of common stock were available for future grant under the 2011 Plan.
Stock-based awards granted to employees generally vest over a three- or four-year period, and, in the case of stock options, expire ten years from the date of grant. Certain awards provide for accelerated vesting if there is a change of control, as defined in the 2005 or 2011 Plan, as applicable. The Company has generally granted stock options at exercise prices not less than the fair market value of its common stock on the date of grant.
Stock Options
The Company generally estimates the fair value of stock options on the date of grant using the Black-Scholes option-pricing model. This model requires the use of highly subjective estimates and assumptions, including expected stock price volatility, expected term of an award, risk-free interest rate, and expected dividend yield. The weighted-average exercise price, weighted-average grant-date fair value, and the assumptions used to estimate the fair value of the stock options granted using the Black-Scholes option pricing model for the years ended December 31, 2015, 2014, and 2013 were as follows:
Years Ended December 31, | |||||||||||
2015 | 2014 | 2013 | |||||||||
Weighted-average exercise price | $ | 12.97 | $ | 10.45 | $ | 10.95 | |||||
Weighted-average grant-date fair value | $ | 6.33 | $ | 5.33 | $ | 5.58 | |||||
Black-Scholes Assumptions | |||||||||||
Risk-free interest rate | 1.54% to 1.85% | 1.88% to 2.10% | 0.95% to 1.71% | ||||||||
Expected dividend yield | — | — | — | ||||||||
Expected volatility | 48% to 51% | 51% to 53% | 54% | ||||||||
Expected term (in years) | 5.5 to 6.1 | 5.8 to 6.1 | 5.8 to 6.1 | ||||||||
Risk-Free Interest Rate
The Company bases the risk-free interest rate that it uses in the option valuation model on U.S. Treasury zero-coupon issues with remaining maturities similar to the expected term of the options.
Expected Dividend Yield
The Company has not paid, and does not anticipate paying, cash dividends on shares of common stock; therefore, the expected dividend yield is assumed to be zero in the option valuation model.
Expected Volatility
The Company estimates the expected volatility of its common stock at the date of grant based on the historical volatility of comparable public companies over the option’s expected term as well as its own stock price volatility since the Company’s IPO.
61
Expected Term
The Company has limited public historical information to develop reasonable expectations about future exercise patterns and post-vesting employment termination behavior for its stock option grants. As a result, for stock option grants made during the years ended December 31, 2015, 2014, and 2013 the expected term was estimated using the “simplified method.” The simplified method is based on the average of the vesting tranches and the contractual life of each grant.
Forfeitures
The Company is required to estimate forfeitures at the time of grant and revise those estimates in subsequent periods if actual forfeitures differ from those estimates. The Company uses historical data to estimate pre-vesting option forfeitures and records stock-based compensation expense only for those awards that are expected to vest.
The following table summarizes stock option activity under stock incentive plans for the twelve months ended December 31, 2015:
Number of Shares | Weighted- Average Exercise Price per Share | Weighted- Average Remaining Contractual Life (in years) | Aggregate Intrinsic Value (in thousands) (2) | |||||||||
Outstanding at December 31, 2014 | 3,080,439 | $ | 10.63 | 7.74 | $ | 11,456 | ||||||
Granted | 660,500 | 12.97 | ||||||||||
Exercised | (264,784 | ) | 8.57 | |||||||||
Cancelled | (500,482 | ) | 12.25 | |||||||||
Outstanding at December 31, 2015 | 2,975,673 | $ | 11.06 | 6.71 | $ | 724 | ||||||
Exercisable as of December 31, 2015 | 1,823,644 | $ | 10.78 | 5.70 | $ | 631 | ||||||
Vested and expected to vest as of December 31, 2015 (1) | 2,746,788 | $ | 10.99 | 6.55 | $ | 714 | ||||||
(1) | Represents the number of vested stock options as of December 31, 2015, plus the number of unvested stock options expected to vest as of December 31, 2015, based on the unvested stock options outstanding at December 31, 2015, adjusted for estimated forfeitures. |
(2) | The aggregate intrinsic value is calculated as the positive difference between the exercise price of the underlying stock options and the fair market value of the Company’s common stock on December 31, 2014 and December 31, 2015. |
The total intrinsic value of options exercised during the years ended December 31, 2015, 2014, and 2013 was approximately $1.0 million, $3.2 million, and $4.4 million, respectively.
As of December 31, 2015, 2014, and 2013, there was approximately $4.5 million, $6.2 million, and $8.3 million, respectively, of unrecognized stock-based compensation cost, net of estimated forfeitures, related to unvested stock options that is expected to be recognized over a weighted-average period of 2.18, 2.45, and 2.68 years, respectively. The total unrecognized stock-based compensation cost will be adjusted for future changes in estimated forfeitures.
Restricted Stock Units
The Company recognizes non-cash compensation expense over the vesting term of restricted stock units. The fair value is measured based upon the number of units and the closing price of the Company’s common stock underlying such units on the dates of grant. Upon vesting and settlement, each restricted stock unit entitles the holder to receive one share of common stock.
62
The following table summarizes all restricted stock unit activity for the year ended December 31, 2015:
Number of Shares | Weighted Average Grant Date Fair Value | |||||
Unvested as of December 31, 2014 | 849,619 | $ | 12.73 | |||
Restricted stock units granted | 649,646 | 13.45 | ||||
Restricted stock units vested | (244,792 | ) | 13.02 | |||
Restricted stock units cancelled | (253,109 | ) | 12.47 | |||
Unvested restricted stock units as of December 31, 2015 | 1,001,364 | $ | 13.19 | |||
As of December 31, 2015, 2014, and 2013, there was approximately $8.6 million, $7.4 million, and $0.0 million respectively, of unrecognized stock-based compensation cost, net of estimated forfeitures, related to unvested restricted stock units that is expected to be recognized over a weighted-average period of 2.91, 3.67, and 0.00 years, respectively.
Equity Awards with Market-Based Vesting Conditions
In connection with the hiring of a new president and chief executive officer in the fourth quarter of 2014, the Company granted 250,000 options with market-based vesting conditions at an exercise price equal to the fair market value per share of the common stock on the date of grant, $14.44. The vesting of these options is based on achieving target market prices of the common stock for a requisite Trading Period as described herein. There are four targets to be achieved, $15.00, $17.50, $20.00, and $22.50, with 62,500, or 25%, of the total options vesting at each target. The options shall vest on the first day after the completion of a period of twenty consecutive days in which the common stock has reached a target price, based upon the closing price (the "Trading Period").
The Company estimates the fair value and derived service period of stock options with market-based vesting conditions on the date of grant using a lattice model with a Monte Carlo simulation. The model requires the use of subjective estimates and assumptions, including grant price, expected volatility, risk-free interest rate and dividend yield. The exercise price, grant-date fair value, and assumptions used to estimate the fair value of the equity awards with market-based vesting conditions were as follows:
As of December 3, 2014 | ||
Exercise price | 14.44 | |
Grant-date fair value | 7.41 | |
Assumptions | ||
Expected Volatility | 51 | % |
Risk-free interest rate | 2.29 | % |
Expected dividend yield | — | % |
In June 2015, the Company granted its chief financial officer 100,000 restricted stock units with market-based vesting conditions. The 100,000 restricted stock units begin to accrue in 25% increments on each one-year anniversary of the date of grant, but do not become vested units until the market-based conditions are met and subject further to time-based vesting conditions and continued employment. The market-based vesting conditions are based on achieving target market prices of the common stock for a requisite Trading Period. There are two targets to be achieved, $14.00 and $18.00 per share, with 50,000, or 50%, of the total award vesting at each target. The then accrued restricted stock units shall vest on the first day after achievement of the market-based vesting condition for the Trading Period, and any vesting thereafter will be contingent only on time-based vesting and continued employment with the Company.
63
The grant-date fair value and assumptions used to estimate the derived service period of the equity awards with market-based vesting conditions were as follows:
As of June 3, 2015 | |||
Grant-date fair value | $ | 11.32 | |
Assumptions | |||
Expected Volatility | 49 | % | |
Risk-free interest rate | 2.38 | % | |
Expected dividend yield | — | % | |
As of December 31, 2015, 2014, and 2013, there was approximately $0.7 million, $1.4 million, and $0.0 million respectively, of unrecognized stock-based compensation cost, net of forfeitures, related to unvested awards with market-based vesting conditions that are expected to be recognized over a weighted-average period of 2.34, 0.87, and 0.00 years. None of the market-based performance targets were achieved for the Company's outstanding equity awards as of December 31, 2015, and as such no vesting events have occurred.
Stock-based Compensation Expense
Stock-based compensation is reflected in the consolidated statements of operations as follows for the years ended December 31, 2015, 2014, and 2013 (in thousands):
Years Ended December 31, | |||||||||||
2015 | 2014 | 2013 | |||||||||
Cost of revenues | $ | 730 | $ | 539 | $ | 508 | |||||
Research and development | 1,171 | 1,285 | 955 | ||||||||
General and administrative | 7,226 | 3,216 | 2,250 | ||||||||
Sales and marketing | 1,089 | 1,025 | 1,064 | ||||||||
Total | $ | 10,216 | $ | 6,065 | $ | 4,777 | |||||
11. Income Taxes
The domestic and foreign components of income (loss) before provision for income taxes were as follows (in thousands):
Years Ended December 31, | |||||||||||
2015 | 2014 | 2013 | |||||||||
Domestic | $ | (10,120 | ) | $ | 2,953 | $ | (10,703 | ) | |||
Foreign | (11,393 | ) | (11,936 | ) | 153 | ||||||
Total loss before provision for income taxes | $ | (21,513 | ) | $ | (8,983 | ) | $ | (10,550 | ) | ||
64
The components of the provision for income taxes are as follows (in thousands):
Years Ended December 31, | |||||||||||
2015 | 2014 | 2013 | |||||||||
Current tax provision | |||||||||||
Federal | $ | 131 | $ | 211 | $ | — | |||||
State | 113 | 239 | 14 | ||||||||
Foreign | (118 | ) | 5 | 1 | |||||||
126 | 455 | 15 | |||||||||
Deferred tax provision | |||||||||||
Federal | $ | — | $ | (89 | ) | $ | 40 | ||||
State | 4 | 1 | — | ||||||||
Foreign | (28 | ) | — | — | |||||||
(24 | ) | (88 | ) | 40 | |||||||
Total provision for income taxes | $ | 102 | $ | 367 | $ | 55 | |||||
A reconciliation of our income tax provision to the statutory federal tax rate is as follows:
Years Ended December 31, | ||||||||
2015 | 2014 | 2013 | ||||||
Expected income tax benefit using U.S. federal statutory rate | 34.0 | % | 34.0 | % | 34.0 | % | ||
Change in the valuation allowance | (38.7 | ) | 79.6 | (28.6 | ) | |||
Nondeductible stock-based compensation | (4.5 | ) | (8.0 | ) | (5.1 | ) | ||
State taxes, net of federal benefit | 1.4 | (2.1 | ) | 3.0 | ||||
Foreign rate differential | (11.8 | ) | (30.7 | ) | — | |||
Corporate restructuring | 23.0 | (55.3 | ) | — | ||||
Income tax credits | 4.3 | 5.1 | 3.1 | |||||
Provision for tax reserves | (3.5 | ) | (17.6 | ) | — | |||
State net operating loss expiration | — | (8.1 | ) | (13.0 | ) | |||
Non-deductible compensation | (3.0 | ) | — | — | ||||
Other | (1.7 | ) | (1.0 | ) | 6.1 | |||
Effective income tax rate | (0.5 | )% | (4.1 | )% | (0.5 | )% | ||
The Company recorded income tax expense of $0.1 million, $0.4 million and $0.1 million for the years ended December 31, 2015, 2014, and 2013, respectively. For the year ended December 31, 2015, the Company’s tax provision was primarily driven by federal AMT and state income taxes, partially offset by a release of a reserve for an uncertain tax position due to the close of an audit for one of its German subsidiaries. For the year ended December 31, 2014, the Company’s tax provision was primarily driven by federal AMT and state income taxes. Our effective tax rate for the year ended December 31, 2015 is lower than the U.S. federal statutory rate primarily due to changes in the valuation allowance against deferred tax assets, a foreign rate differential associated with certain foreign jurisdictions which are subject to significantly lower tax rates than the U.S. federal statutory rate and nondeductible stock based compensation, offset by corporate restructuring activities. Our effective tax rate for the year ended December 31, 2014 is lower than the U.S. federal statutory rate primarily due to corporate restructuring activities undertaken to support and grow our business internationally, a foreign rate differential associated with certain foreign jurisdictions which are subject to significantly lower tax rates than the U.S. federal statutory rate and nondeductible stock based compensation expense, offset by changes in the valuation allowance against deferred tax assets.
65
The components of the Company’s deferred tax assets and liabilities are as follows (in thousands):
2015 | 2014 | ||||||
Deferred tax assets: | |||||||
Net operating loss carryforwards | $ | 36,822 | $ | 34,908 | |||
Research and development tax credit carryforwards | 4,924 | 4,120 | |||||
Deferred revenue | 7,005 | 6,538 | |||||
Stock compensation | 4,176 | 2,540 | |||||
Other | 6,106 | 114 | |||||
Total deferred tax assets | 59,033 | 48,220 | |||||
Valuation allowance for deferred tax assets | (54,982 | ) | (46,532 | ) | |||
Total deferred tax assets, net of valuation allowance | 4,051 | 1,688 | |||||
Deferred tax liabilities: | |||||||
Amortization | (2,439 | ) | (3,289 | ) | |||
Other | (3,146 | ) | (164 | ) | |||
Total deferred tax liabilities | (5,585 | ) | (3,453 | ) | |||
Net deferred tax liabilities | $ | (1,534 | ) | $ | (1,765 | ) | |
As of December 31, 2015, the Company had U.S. federal, state and foreign net operating loss carryforwards of $110.1 million, $73.4 million, and $5.5 million, respectively. Included in the federal and state net operating loss carryforward is $9.5 million and $8.9 million that relates to excess tax deductions from stock-based payments, the tax benefit of which will be recorded as an increase in additional paid-in capital when the deductions reduce current taxes payable. The federal net operating loss carryforwards will expire at various dates beginning in 2027 through 2033. State net operating loss carryforwards will expire at various dates beginning in 2020 through 2033. At December 31, 2015, the Company had federal and state research and development tax credit carryforwards available to reduce future income taxes payable of $3.8 million and $3.0 million respectively. These credits will expire at various dates beginning in the year 2025 through 2035. As of December 31, 2015 the Company also had federal AMT credits of approximately $0.3 million, which can be carried forward indefinitely.
Management has evaluated the positive and negative evidence bearing upon the realizability of its deferred tax assets. As required by the provisions of ASC 740, management has determined that it is not more-likely-than-not that the tax benefits related to the federal, state and foreign deferred tax assets will be realized for financial reporting purposes. Accordingly, the deferred tax assets have been fully reserved at December 31, 2015 and 2014. The valuation allowance increased/(decreased) approximately $8.5 million and $(8.8) million during the years ended December 31, 2015 and 2014, respectively, due primarily to changes in the net operating loss carryforwards and increases in deferred tax assets related to stock based compensation and transaction costs.
Future changes in Company ownership may limit the amount of net operating loss carryforwards and research and development credit carryforwards that can be utilized annually to offset future taxable income and taxes, respectively. In general, an ownership change, as defined by Section 382 of the Internal Revenue Code of 1986, as amended, results from transactions increasing the ownership of certain shareholders or public groups in the stock of a corporation by more than 50 percentage points over a three-year period. Based upon the Company’s analysis as of December 31, 2015, there was no ownership change experienced during 2015.
66
Unrecognized Tax Benefits
A reconciliation of the beginning and ending amount of unrecognized tax benefits is as follows (in thousands):
2015 | 2014 | ||||||
Unrecognized tax benefits, beginning of year | $ | (2,615 | ) | $ | — | ||
Additions based on tax positions related to the current year | (1,323 | ) | (698 | ) | |||
Acquisition | — | (677 | ) | ||||
Additions for tax positions of prior years | (35 | ) | (1,240 | ) | |||
Reductions for tax positions of prior years | 142 | — | |||||
Settlements | 600 | — | |||||
Reductions due to lapse of applicable statute of limitations | — | — | |||||
Unrecognized tax benefits, end of year | $ | (3,231 | ) | $ | (2,615 | ) | |
The Company accounts for uncertain tax positions under the recognition and measurement criteria of ASC 740-10. For those tax positions for which it is more likely than not that a tax benefit will be sustained, we record the largest amount of tax benefit with a greater than 50% likelihood of being realized upon settlement with a taxing authority that has full knowledge of all relevant information. If we do not believe that it is not more likely than not that a tax benefit will be sustained, no tax benefit is recognized. As of December 31, 2015, the Company had a total amount of unrecognized tax benefits of $3.2 million, of which $0.2 million represents the amount of unrecognized tax benefits that, if recognized, would favorably affect the effective income tax rate in future periods. The difference between the total amount of unrecognized tax benefits and the amount that would impact the effective tax rate consists of items that, if recognized, would result in a corresponding increase in the valuation allowance.
The Company recognizes interest and penalties related to uncertain tax positions as a component in income tax expense. As of December 31, 2015, the Company had no accrued interest or penalties related to uncertain tax positions and no amounts have been recognized in the Company’s consolidated statements of operations. The statute of limitations for assessment by the Internal Revenue Service ("IRS") and state tax authorities is open for tax years ending December 31, 2012, 2013, 2014 and 2015, although carryforward attributes that were generated prior to tax year 2012 may still be adjusted upon examination by the IRS or state tax authorities if they either have been or will be used in a future period. The statute of limitations for assessments by foreign taxing authorities is generally not open for years prior to 2011, although carryforward attributes that were generated prior to tax year 2011 may still be adjusted upon examinations.
The Company is subject to U.S. federal income tax and various state and local taxes in both domestic and foreign jurisdictions. In the normal course of business, the Company is subject to examination by taxing authorities within these jurisdictions. The IRS completed its audit of the Company's U.S. federal income tax return for the tax year ended December 31, 2011 during 2014. The closing of the audit did not result in any proposed adjustments or assessments of tax relating to the 2011 tax year. Additionally, during 2015 the Company completed a German tax audit for Mailstore for the tax years ended December 31, 2011, 2012, 2013 and 2014 with immaterial adjustments.
The Company does not reasonably expect that the unrecognized tax benefit will change significantly within the next twelve months.
As of December 31, 2015, a deferred tax liability has not been established for approximately $0.3 million of cumulative undistributed earnings of non-U.S. subsidiaries, which are expected to be reinvested indefinitely in operations outside the U.S. Determination of the unrecognized deferred tax liability on unremitted earnings is not practical due to uncertainty regarding the remittance structure, the mix of earnings and earnings for profit pools in the year of remittance, and overall complexity of the calculation.
12. Commitments and Contingencies
Operating Leases
The Company leases various facilities under leases that expire at varying dates through 2024. Certain of these leases contain renewal options and require the Company to pay operating costs, including property taxes, insurance, and maintenance.
67
The Company has lease agreements to rent office space in Boston, Massachusetts (corporate headquarters); Lewiston, Maine; Sunnyvale, California; Longmont, Colorado; Munich, Germany; and Viersen, Germany. The Company has lease agreements to rent data center space in Wakefield, Massachusetts; Phoenix, Arizona; and Chandler, Arizona. The Company also maintained a hosting service agreement with a third-party data center vendor in Somerville, Massachusetts, which ended on January 31, 2015. The terms of several of these leases include escalating rent and free rent periods. Accordingly, the Company recorded a deferred rent liability related to the free rent and escalating rent payments, such that rent is being recognized on a straight-line basis over the terms of the leases. At December 31, 2015 and 2014, $4.9 million and $4.8 million is included in accrued expenses and other long-term liabilities related to the deferred rent, respectively.
In May 2014, the Company entered into a lease agreement for its new corporate headquarters in Boston, Massachusetts. The initial term of the lease expires on December 31, 2024, and the Company has the option to extend the original term of the lease for one successive five-year period. Upon execution of the lease agreement, the Company was required to post a security deposit of $0.8 million, which the Company maintains as a letter of credit. The Company’s landlord can draw against this letter of credit in the event of default by the Company. The facility was made available to the Company to begin its build-out on June 1, 2014, and as such, the Company began recording rent expense at that time. In accordance with the lease, the Company received a tenant improvement allowance. The rent expense is recorded net of the allowance over the term of the lease. The leasehold improvements associated with the initial build-out are being amortized over the initial term of the lease. Any additional leasehold improvements made during the course of occupancy will be amortized over the shorter of the useful life or remaining life of the lease.
Future non-cancellable minimum lease payments under all operating leases as of December 31, 2015, are as follows (in thousands):
Years Ended December 31, | Office Leases | Data Center Leases | Total | ||||||||
2016 | $ | 2,324 | $ | 2,083 | $ | 4,407 | |||||
2017 | 2,167 | 817 | 2,984 | ||||||||
2018 | 2,249 | 275 | 2,524 | ||||||||
2019 | 2,184 | — | 2,184 | ||||||||
2020 | 2,054 | — | 2,054 | ||||||||
Thereafter | 8,414 | — | 8,414 | ||||||||
Total | $ | 19,392 | $ | 3,175 | $ | 22,567 | |||||
(1) This table includes amounts for agreements executed as of December 31, 2015. This table excludes $2.4 million of payments associated with the Phoenix, Arizona data center lease that was extended in February 2016 and expires in January 2019. | |||||||||||
At December 31, 2015, the Company subleased certain office space to third parties, which sublease income will offset lease payments included in the table above. Total sublease income under contractual terms is $1.1 million, with both the sublease and the underlying lease expiring in December 2016.
Other Non-cancellable Commitments
As of December 31, 2015, the Company had non-cancellable commitments to vendors primarily consisting of advertising, marketing and broadband services contracts, as follows (in thousands):
Years Ended December 31, | Commitments | ||
2016 | $ | 3,041 | |
2017 | 692 | ||
2018 | 116 | ||
2019 | 35 | ||
2020 | 6 | ||
Total | $ | 3,890 | |
68
Litigation
On August 30, 2010, Oasis Research sued the Company and 17 other defendants in the United States Court for the Eastern District of Texas (the “Court”) alleging infringement of certain of Oasis Research’s patents. A trial was held in March 2013 and a jury verdict was returned against Oasis Research finding that all of the asserted patents were invalid. On January 8, 2015, the Court granted Oasis Research’s motion for Judgment as a Matter of Law under Rule 50(b) and Alternative Request for a New Trial under Rule 59(a). In October 2015, the parties participated in a mediation and subsequently entered into a confidential agreement to dismiss all matters in the pending cases with prejudice.
Although results of litigation and claims cannot be predicted with certainty, the Company is not presently involved in any legal proceeding in which the outcome, if determined adversely to the Company, would be expected to have a material adverse effect on our business, operating results, or financial condition. Regardless of the outcome, litigation can have an adverse impact on the Company because of defense and settlement costs, diversion of management resources, and other factors.
13. Restructuring
In 2015, the Company recorded restructuring charges of $0.5 million, primarily related to completion of our data center optimization program that was initiated in the fourth quarter of 2014, as well as recording a change in estimate of our lease exit charge for our former Boston, Massachusetts corporate headquarters.
In 2014, the Company exited office space and relocated its corporate headquarters. The relocation was made to facilitate growth of the Company and the related increase in headcount. In association with the exit of the former office space, the Company recorded a charge of $0.4 million at the cease-use date in accordance with ASC 420, Exit or Disposal Cost Obligations. Also during the fourth quarter, the Company recorded costs to optimize the operating efficiencies of its data centers which included the exit of a facility and relocation of its equipment to an existing data center. As a result of these data center optimization efforts, there were restructuring expenses totaling $0.4 million for the period ending December 31, 2014. These expenses have been recorded through the restructuring line within the Company's consolidated statements of operations.
As of December 31, 2015 and 2014, the Company had $0.4 million and $0.5 million accrued related to restructuring activities, respectively.
14. Retirement Plan
The Company has a 401(k) defined contribution savings plan for its employees who meet certain employment status and age requirements. The plan allows participants to defer a portion of their annual compensation on a pre-tax basis. Effective January 1, 2012, the Company elected to make a matching contribution of up to 4% of each employee’s wages. For the periods ending December 31, 2015, 2014 and 2013, the total expense for the Company’s matching contributions to the plan was $1.1 million, $0.9 million, and $0.7 million, respectively.
15. Revolving Credit Facility
On May 6, 2015, the Company and certain of our subsidiaries entered into a credit agreement with Silicon Valley Bank (the "Credit Facility"), which provides revolving credit financing of up to $25.0 million, including a $5.0 million sub-limit for letters of credit. The Credit Facility may be increased by up to an additional $25.0 million if the existing or additional lenders are willing to make such increased commitments and subject to other terms and conditions. The Credit Facility shall be available to the Company on a revolving basis during the period commencing on May 6, 2015 through May 6, 2018 at an interest rate of the Wall Street Journal prime rate plus 75 basis points or LIBOR plus 175 basis points, at the option of the Company.
The Credit Facility is secured by substantially all of the Company’s assets and contains customary affirmative and negative covenants, including financial covenants specifying a minimum quick ratio and minimum consolidated free cash flow, in each case subject to customary and other exceptions for a credit facility of this size and type, each as further described in the Credit Facility. On May 22, 2015, the Company entered into an amendment to the Credit Facility, with Silicon Valley Bank (the "Amendment"), which amends the Company’s existing Credit Facility. The Amendment eliminates from the events which constitute a change of control and, consequently, an event of default, the replacement, under specified circumstances, of a majority of the Company’s board of directors. The Amendment also allows the Company to repurchase its capital stock pursuant to a board of directors approved stock repurchase plan, so long as the total of such repurchases does not exceed $20 million during the term of the Credit Facility and the Company remains in pro forma compliance with the financial and other
69
covenants. On October 30, 2015, the Company entered into a second amendment to the Credit Facility with Silicon Valley Bank, which includes technical corrections relating to certain definitions and calculations of financial covenants.
As of December 31, 2015, the Company was in compliance with these covenants and there was one letter of credit for $0.8 million outstanding under the Credit Facility related to the security deposit on the lease for the Company's corporate headquarters. As of December 31, 2015, availability under the Credit Facility was $24.2 million.
16. Subsequent Events
On January 13, 2016, the Company completed the EVault Acquisition. Carbonite acquired substantially all of the assets utilized in EVault's operations for cash consideration of $14.0 million. Carbonite expects to complete the acquisition of the European Union assets of EVault in the first quarter of 2016, subject to applicable laws, compliance requirements and customary closing conditions.
The Company is in the process of gathering information to complete its preliminary valuation of certain assets and liabilities acquired as part of the transaction in order to complete acquisition accounting.
17. Quarterly Information (Unaudited)
Quarterly results of operations are as follows (in thousands, except per share amounts):
For the three months ended: | |||||||||||||||||||||||||||||||
Dec. 31, 2015 | Sept. 30, 2015 | June 30, 2015 | March 31, 2015 | Dec. 31, 2014 | Sept. 30, 2014 | June 30, 2014 | March 31, 2014 | ||||||||||||||||||||||||
Statements of Operations Data: | |||||||||||||||||||||||||||||||
Revenue | $ | 35,065 | $ | 34,553 | $ | 33,972 | $ | 33,026 | $ | 31,914 | $ | 31,274 | $ | 30,295 | $ | 29,137 | |||||||||||||||
Gross profit | $ | 25,869 | $ | 24,779 | $ | 24,172 | $ | 23,012 | $ | 21,913 | $ | 21,689 | $ | 20,574 | $ | 19,877 | |||||||||||||||
Loss from operations | $ | (5,488 | ) | $ | (5,701 | ) | $ | (4,476 | ) | $ | (5,993 | ) | $ | (4,615 | ) | $ | (481 | ) | $ | (2,547 | ) | $ | (942 | ) | |||||||
Net loss | $ | (4,599 | ) | $ | (5,966 | ) | $ | (4,820 | ) | $ | (6,230 | ) | $ | (5,133 | ) | $ | (699 | ) | $ | (2,536 | ) | $ | (982 | ) | |||||||
Basic and diluted net loss per share | $ | (0.17 | ) | $ | (0.22 | ) | $ | (0.18 | ) | $ | (0.23 | ) | $ | (0.19 | ) | $ | (0.03 | ) | $ | (0.09 | ) | $ | (0.04 | ) | |||||||
70
ITEM 9. | CHANGES IN AND DISAGREEMENTS WITH ACCOUNTANTS ON ACCOUNTING AND FINANCIAL DISCLOSURE |
None.
ITEM 9A. | CONTROLS AND PROCEDURES |
Disclosure Controls and Procedures
Our management, with the participation of our chief executive officer and chief financial officer, evaluated the effectiveness of our disclosure controls and procedures as of December 31, 2015. The term “disclosure controls and procedures,” as defined in Rules 13a-15(e) and 15d-15(e) under the Exchange Act, means controls and other procedures of a company that are designed to ensure that information required to be disclosed by a company in the reports that it files or submits under the Exchange Act is recorded, processed, summarized and reported within the time periods specified in the SEC’s rules and forms. Disclosure controls and procedures include, without limitation, controls and procedures designed to ensure that information required to be disclosed by a company in the reports that it files or submits under the Exchange Act is accumulated and communicated to the Company’s management, including its principal executive and principal financial officers, as appropriate to allow timely decisions regarding required disclosure. Management recognizes that any controls and procedures, no matter how well designed and operated, can provide only reasonable assurance of achieving their objectives and management necessarily applies its judgment in evaluating the cost-benefit relationship of possible controls and procedures. Based on the evaluation of our disclosure controls and procedures as of December 31, 2015, our chief executive officer and chief financial officer concluded that, as of such date, our disclosure controls and procedures were effective at the reasonable assurance level.
Management’s Annual Report on Internal Control Over Financing Reporting
Our management is responsible for establishing and maintaining adequate internal control over financial reporting. Internal control over financial reporting is defined in Rule 13a-15(f) and 15d-15(f) under the Exchange Act as a process designed by, or under the supervision of our principal executive and principal financial officers and effected by our board of directors, management, and other personnel to provide reasonable assurance regarding the reliability of financial reporting and the preparation of financial statements for external purposes in accordance with GAAP and includes those policies and procedures that:
• | pertain to the maintenance of records that in reasonable detail accurately and fairly reflect the transactions and disposition of our assets; |
• | provide reasonable assurance that transactions are recorded as necessary to permit preparation of financial statements in accordance with GAAP, and that our receipts and expenditures are being made only in accordance with authorizations of our management and board of directors; and |
• | provide reasonable assurance regarding prevention or timely detection of unauthorized acquisition, use, or disposition of our assets that could have a material effect on our financial statements. |
Because of its inherent limitations, internal control over financial reporting may not prevent or detect misstatements. Also, projections of any evaluation of effectiveness to future periods are subject to the risk that controls may become inadequate because of changes in conditions, or that the degree of compliance with the policies or procedures may deteriorate.
Management assessed the effectiveness of our internal control over financial reporting as of December 31, 2015. Management based its assessment on criteria established in Internal Control—Integrated Framework issued by the Committee of Sponsoring Organizations of the Treadway Commission (2013 Framework) ("COSO").
Based on management’s assessment, management has concluded that our internal control over financial reporting was effective as of December 31, 2015. The certifications of our chief executive officer and chief financial officer attached as Exhibits 31.1 and 31.2 to this Annual Report include, in paragraph 4 of such certifications, information concerning our disclosure controls and procedures and internal controls over financial reporting.
Ernst & Young LLP, an independent registered public accounting firm, has issued a report on our internal control over financial reporting, which is included below.
71
Changes in Internal Control over Financial Reporting
There was no change in our internal control over financial reporting identified in connection with the evaluation required by Rules 13a-15(d) and 15d-15(d) of the Exchange Act that occurred during the period covered by this Annual Report that has materially affected, or is reasonably likely to materially affect, our internal control over financial reporting.
REPORT OF INDEPENDENT REGISTERED PUBLIC ACCOUNTING FIRM
The Board of Directors and Shareholders of
Carbonite, Inc.
We have audited Carbonite, Inc.’s internal control over financial reporting as of December 31, 2015, based on criteria established in Internal Control-Integrated Framework issued by the Committee of Sponsoring Organizations of the Treadway Commission (2013 framework) (the COSO criteria). Carbonite, Inc.’s management is responsible for maintaining effective internal control over financial reporting, and for its assessment of the effectiveness of internal control over financial reporting included in the accompanying Management’s Annual Report on Internal Control Over Financial Reporting. Our responsibility is to express an opinion on the company’s internal control over financial reporting based on our audit.
We conducted our audit in accordance with the standards of the Public Company Accounting Oversight Board (United States). Those standards require that we plan and perform the audit to obtain reasonable assurance about whether effective internal control over financial reporting was maintained in all material respects. Our audit included obtaining an understanding of internal control over financial reporting, assessing the risk that a material weakness exists, testing and evaluating the design and operating effectiveness of internal control based on the assessed risk, and performing such other procedures as we considered necessary in the circumstances. We believe that our audit provides a reasonable basis for our opinion.
A company’s internal control over financial reporting is a process designed to provide reasonable assurance regarding the reliability of financial reporting and the preparation of financial statements for external purposes in accordance with generally accepted accounting principles. A company’s internal control over financial reporting includes those policies and procedures that (1) pertain to the maintenance of records that, in reasonable detail, accurately and fairly reflect the transactions and dispositions of the assets of the company; (2) provide reasonable assurance that transactions are recorded as necessary to permit preparation of financial statements in accordance with generally accepted accounting principles, and that receipts and expenditures of the company are being made only in accordance with authorizations of management and directors of the company; and (3) provide reasonable assurance regarding prevention or timely detection of unauthorized acquisition, use, or disposition of the company’s assets that could have a material effect on the financial statements.
Because of its inherent limitations, internal control over financial reporting may not prevent or detect misstatements. Also, projections of any evaluation of effectiveness to future periods are subject to the risk that controls may become inadequate because of changes in conditions, or that the degree of compliance with the policies or procedures may deteriorate.
In our opinion, Carbonite, Inc. maintained, in all material respects, effective internal control over financial reporting as of December 31, 2015, based on the COSO criteria.
We also have audited, in accordance with the standards of the Public Company Accounting Oversight Board (United States), the consolidated balance sheets of Carbonite, Inc. as of December 31, 2015 and 2014, and the related consolidated statements of operations, comprehensive loss, stockholders’ equity and cash flows for each of the three years in the period ended December 31, 2015 of Carbonite, Inc. and our report dated March 8, 2016 expressed an unqualified opinion thereon.
/s/ Ernst & Young LLP
Boston, Massachusetts
March 8, 2016
ITEM 9B. | OTHER INFORMATION |
None.
72
PART III
ITEM 10. | DIRECTORS, EXECUTIVE OFFICERS AND CORPORATE GOVERNANCE |
Except as set forth below with respect to the Company’s Code of Business Conduct and Ethics, the information required by this item will be set forth in the sections entitled “Board of Directors, Corporate Governance & Related Matters”, “Section 16(a) Beneficial Ownership Reporting Compliance”, “Executive Officers” and “Criteria for Director Nominations” of our definitive proxy statement to be filed with the SEC in connection with our 2016 annual meeting of stockholders (the “Proxy Statement”), which is expected to be filed not later than 120 days after the end of our fiscal year ended December 31, 2015, and is incorporated in this Annual Report by reference.
We have adopted a Code of Business Conduct and Ethics that applies to all of our directors, officers and employees, including our principal executive officer and principal financial officer. The Code of Business Conduct and Ethics is posted on our website at http://investor.carbonite.com/governance.cfm.
We intend to satisfy the disclosure requirement under Item 5.05 of Form 8-K regarding an amendment to, or waiver from, a provision of this Code of Business Conduct and Ethics by posting such information on our website, at the address and location specified above and, to the extent required by the listing standards of The NASDAQ Global Market, by filing a Current Report on Form 8-K with the SEC, disclosing such information.
ITEM 11. | EXECUTIVE COMPENSATION |
The information required by this item will be set forth in the sections entitled “Compensation Discussion and Analysis”, “Compensation Committee Interlocks and Insider Participation” and “Report of the Compensation Committee of the Board of Directors on Executive Compensation” of our Proxy Statement and is incorporated in this Annual Report by reference.
ITEM 12. | SECURITY OWNERSHIP OF CERTAIN BENEFICIAL OWNERS AND MANAGEMENT AND RELATED STOCKHOLDER MATTERS |
The information required by this item will be set forth in the sections entitled “Security Ownership of Certain Beneficial Owners and Management” and “Equity Compensation Plan Information” of our Proxy Statement and is incorporated in this Annual Report by reference.
ITEM 13. | CERTAIN RELATIONSHIPS AND RELATED TRANSACTIONS, AND DIRECTOR INDEPENDENCE |
The information, if any, required by this item will be set forth in the sections entitled “Certain Relationships And Related Transactions” and “Board of Directors, Corporate Governance & Related Matters - Independence of our Board of Directors” of our Proxy Statement and is incorporated in this Annual Report by reference.
ITEM 14. | PRINCIPAL ACCOUNTANT FEES AND SERVICES |
The information required by this item will be set forth in the section entitled “Audit-Related Matters” of our Proxy Statement and is incorporated in this Annual Report by reference.
PART IV
ITEM 15. | EXHIBITS AND FINANCIAL STATEMENT SCHEDULES |
(a)(1) Financial Statements
See Index to Consolidated Financial Statements on page 44 of this Annual Report, which is incorporated into this Item by reference.
(a)(3) Exhibits
73
See Exhibit Index to this Annual Report, which is incorporated into this Item by reference. Each management contract or compensatory plan or arrangement required to be filed has been identified.
(b) Exhibits
See Exhibit Index to this Annual Report, which is incorporated into this Item by reference.
(c) Financial Statement Schedules
No schedules are submitted because they are not applicable, not required or because the information is included in the Consolidated Financial Statements or Notes to Consolidated Financial Statements.
74
SIGNATURES
Pursuant to the requirements of Section 13 or 15(d) of the Securities Exchange Act of 1934, the registrant has duly caused this report to be signed on its behalf by the undersigned, thereunto duly authorized.
CARBONITE, INC. | |||
Dated: March 8, 2016 | By: | /s/ Mohamad Ali | |
Mohamad Ali | |||
Chief Executive Officer | |||
75
Pursuant to the requirements of the Securities Exchange Act of 1934, this report has been signed by the following persons on behalf of the registrant in the capacities and on the dates indicated.
Signature | Title | Date | ||
/s/ Mohamad Ali | Chief Executive Officer and Director (Principal Executive Officer) | March 8, 2016 | ||
Mohamad Ali | ||||
/s/ Anthony Folger | Chief Financial Officer (Principal Financial Officer) | March 8, 2016 | ||
Anthony Folger | ||||
/s/ Cassandra Hudson | Chief Accounting Officer (Principal Accounting Officer) | March 8, 2016 | ||
Cassandra Hudson | ||||
/s/ Stephen Munford* | Chairman of the Board | March 8, 2016 | ||
Stephen Munford | ||||
/s/ Jeffry Flowers* | Director | March 8, 2016 | ||
Jeffry Flowers | ||||
/s/ Charles Kane* | Director | March 8, 2016 | ||
Charles Kane | ||||
/s/ Todd Krasnow* | Director | March 8, 2016 | ||
Todd Krasnow | ||||
/s/ Peter Gyenes* | Director | March 8, 2016 | ||
Peter Gyenes | ||||
/s/ Scott Daniels* | Director | March 8, 2016 | ||
Scott Daniels | ||||
/s/ David Friend* | Director | March 8, 2016 | ||
David Friend | ||||
March 8, 2016
*By: /s/ Mohamad Ali |
*Mohamad Ali Attorney-in-Fact |
76
EXHIBIT INDEX
Exhibit No. | Description |
2.1(1) | Share Purchase Agreement relating to all shares in MailStore Software GmbH, dated as of December 12, 2014. |
2.2 (33) | Asset Purchase Agreement by and among Carbonite, Inc., Carbonite Cloud Backup (Canada) Inc., Carbonite GmbH, Carbonite Operations BV, EVault, Inc. and Seagate Technologies (US) Holdings, Inc., dated as of December 15, 2015. |
3.1(2) | Amended and Restated Certificate of Incorporation of Carbonite, Inc. |
3.2(3) | Amended and Restated By-Laws of Carbonite, Inc. |
4.1(4) | Form of Common Stock Certificate. |
4.3(6) | Form of Indenture. |
10.1(3)# | Amended and Restated 2005 Stock Incentive Plan and Form of Incentive Stock Option Agreement, Nonqualified Stock Option Agreement, and Stock Restriction Agreement under the Amended and Restated 2005 Stock Incentive Plan. |
10.2(3)# | 2011 Equity Award Plan and Form of Incentive Stock Option Agreement, Nonqualified Stock Option Agreement, and Stock Restriction Agreement under the 2011 Equity Award Plan. |
10.3(5)# | Form of Indemnification Agreement by and between Carbonite, Inc. and each of its directors and executive officers. |
10.4(5)# | Severance Agreement with David Friend, dated as of May 3, 2011. |
10.5(35) | Amended and Restated Office Lease by Trustees of Church Realty Trust to Carbonite, Inc., dated as of October 17, 2011. |
10.6(7) | Commercial Lease with Lewiston Properties, LLC, dated as of May 13, 2011. |
10.7(8) | Turn Key Datacenter Lease with GIP Wakefield, LLC, dated as of June 3, 2011. |
10.8(9) | Turn Key Datacenter Lease with Digital Phoenix Van Buren, LLC, dated as of November 29, 2011. |
10.9(10) | First Amendment to the Datacenter Lease with GIP Wakefield, LLC, dated as of September 15, 2011. |
10.10(11) | Second Amendment to the Datacenter Lease with GIP Wakefield, LLC, dated as of March 31, 2012. |
10.11(12) | Third Amendment to the Datacenter Lease with GIP Wakefield LLC, dated as of June 11, 2012. |
10.12(13)# | Offer Letter with Anthony Folger, dated as of November 21, 2012. |
10.13(14)† | Fourth Amendment to the Datacenter Lease with GIP Wakefield, LLC, dated as of February 14, 2013. |
10.14(15)† | Turnkey Datacenter Lease with Digital 2121 South Price, LLC, dated as of December 31, 2013. |
10.15(16)† | Fifth Amendment to the Datacenter Lease with GIP Wakefield, LLC, dated as of February 6, 2014. |
10.16(17)# | Form of Restricted Stock Unit Agreement under the 2011 Equity Award Plan. |
10.17(18) | Indenture of Lease by and between Abbey Lafayette Operating LLC and Carbonite, Inc. dated as of May 5, 2014. |
10.18(19)# | Form of Stock Restriction Agreement under the 2011 Equity Award Plan. |
10.19(20)# | Amended and Restated Offer Letter with Danielle Sheer, dated as of August 1, 2014. |
10.20(21)# | Promotion Letter Agreement with Cassandra Hudson, dated as of October 28, 2014. |
10.21(22)† | Sixth Amendment to the Datacenter Lease with GIP Wakefield, LLC, dated as of September 30, 2014. |
10.22(23)# | Employment Agreement with David Friend, dated as of January 8, 2015. |
10.23(24)# | Executive Employment Agreement with Mohamad Ali, dated as of December 3, 2014, as amended January 8, 2015. |
10.26(25) | Credit Agreement by and among Carbonite, Inc., the lenders party thereto and Silicon Valley Bank, dated as of May 6, 2015. |
10.27(26)# | Offer Letter with David Raissipour, dated as of May 12, 2015. |
10.28(27) | First Amendment to Credit Agreement by and among Carbonite, Inc., the lenders party thereto and Silicon Valley Bank, dated as of May 22, 2015. |
10.29(28) | Seventh Amendment to the Datacenter Lease with GIP Wakefield, LLC, dated as of September 30, 2015. |
10.30(29) | Second Amendment to Credit Agreement by and among Carbonite, Inc., the lenders party thereto and Silicon Valley Bank, dated as of October 30, 2015. |
10.31(30)# | Offer Letter with Christopher Doggett, dated as of November 27, 2015. |
77
Exhibit No. | Description |
10.32(31)# | Offer Letter with Paul Mellinger, dated as of December 15, 2015. |
10.33(32)# | Offer Letter with Norman Guadagno, dated as of January 6, 2016. |
10.34(34)# | Executive Severance Plan, dated as of February 2, 2016. |
10.35 | Performance-Based Restricted Stock Unit Award Agreement under the 2011 Equity Award Plan. |
10.36 | First Amendment to Turnkey Datacenter Lease with Digital Phoenix Van Buren, LLC, dated as of February 3, 2016. |
21.1 | List of subsidiaries. |
23.1 | Consent of Ernst & Young LLP, independent registered public accounting firm. |
24.1 | Power of Attorney. |
31.1 | Certification of Chief Executive Officer Pursuant to Section 302 of the Sarbanes-Oxley Act of 2002. |
31.2 | Certification of Chief Financial Officer Pursuant to Section 302 of the Sarbanes-Oxley Act of 2002. |
32.1 | Certifications of Chief Executive Officer Pursuant to Section 906 of the Sarbanes-Oxley Act of 2002. |
32.2 | Certifications of Chief Financial Officer Pursuant to Section 906 of the Sarbanes-Oxley Act of 2002. |
101.INS | XBRL Instance Document. |
101.SCH | XBRL Taxonomy Extension Schema Document. |
101.CAL | XBRL Taxonomy Extension Calculation Linkbase Document. |
101.DEF | XBRL Taxonomy Extension Definition Linkbase Document. |
101.LAB | XBRL Taxonomy Extension Label Linkbase Document. |
101.PRE | XBRL Taxonomy Extension Presentation Linkbase Document. |
(1) | Filed as the same numbered exhibit to Registrant's Current Report on Form 8-K filed with the Securities and Exchange Commission on December 15, 2014, and incorporated herein by reference. |
(2) | Filed as the same numbered exhibit to Registrant’s Quarterly Report on Form 10-Q filed with the Securities and Exchange Commission on November 10, 2011, and incorporated herein by reference. |
(3) | Filed as the same numbered exhibit to Amendment No. 2 to Registrant’s Registration Statement on Form S-1 filed with the Securities and Exchange Commission on July 13, 2011, and incorporated herein by reference. |
(4) | Filed as the same numbered exhibit to Amendment No. 3 to Registrant’s Registration Statement on Form S-1 filed with the Securities and Exchange Commission on July 25, 2011, and incorporated herein by reference. |
(5) | Filed as the same numbered exhibit to Registrant’s Registration Statement on Form S-1 filed with the Securities and Exchange Commission on May 12, 2011, and incorporated herein by reference. |
(6) | Filed as Exhibit 4.5 to Registrant's Registration Statement on Form S-3 filed with the Securities and Exchange Commission on November 19, 2013, and incorporated herein by reference. |
(7) | Filed as Exhibit 10.13 to Amendment No. 1 to Registrant’s Registration Statement on Form S-1 filed with the Securities and Exchange Commission on June 15, 2011, and incorporated herein by reference. |
(8) | Filed as Exhibit 10.14 to Amendment No. 1 to Registrant’s Registration Statement on Form S-1 filed with the Securities and Exchange Commission on June 15, 2011, and incorporated herein by reference. |
(9) | Filed as Exhibit 10.17 to Registrant’s Annual Report on Form 10-K filed with the Securities and Exchange Commission on March 7, 2012, and incorporated herein by reference. |
(10) | Filed as Exhibit 10.1 to Registrant’s Quarterly Report on Form 10-Q filed with the Securities and Exchange Commission on May 3, 2012, and incorporated herein by reference. |
(11) | Filed as Exhibit 10.2 to Registrant’s Quarterly Report on Form 10-Q filed with the Securities and Exchange Commission on May 3, 2012, and incorporated herein by reference. |
(12) | Filed as Exhibit 10.24 to Registrant’s Annual Report on Form 10-K filed with the Securities and Exchange Commission on March 6, 2013, and incorporated herein by reference. |
(13) | Filed as Exhibit 10.1 to Registrant’s Current Report on Form 8-K filed with the Securities and Exchange Commission on January 2, 2013, and incorporated herein by reference. |
(14) | Filed as Exhibit 10.19 to Registrant's Annual Report on Form 10-K with the Securities and Exchange Commission on March 5, 2014, and incorporated herein by reference. |
(15) | Filed as Exhibit 10.24 to Registrant's Annual Report on Form 10-K with the Securities and Exchange Commission on March 5, 2014, and incorporated herein by reference. |
(16) | Filed as Exhibit 10.25 to Registrant's Annual Report on Form 10-K with the Securities and Exchange Commission on March 5, 2014, and incorporated herein by reference. |
78
(17) | Filed as Exhibit 10.27 to Registrant's Annual Report on Form 10-K with the Securities and Exchange Commission on March 5, 2014, and incorporated herein by reference. |
(18) | Filed as Exhibit 10.1 to Registrant's Quarterly Report on Form 10-Q with the Securities and Exchange Commission on May 6, 2014, and incorporated herein by reference. |
(19) | Filed as Exhibit 10.1 to Registrant's Current Report on Form 8-K filed with the Securities and Exchange Commission on June 4, 2014, and incorporated herein by reference. |
(20) | Filed as Exhibit 10.1 to Registrant's Quarterly Report on Form 10-Q with the Securities and Exchange Commission on August 5, 2014, and incorporated herein by reference. |
(21) | Filed as Exhibit 10.1 to Registrant's Current Report on Form 8-K filed with the Securities and Exchange Commission on November 3, 2014, and incorporated herein by reference. |
(22) | Filed as Exhibit 10.1 to Registrant's Quarterly Report on Form 10-Q filed with the Securities and Exchange Commission on November 6, 2014, and incorporated herein by reference. |
(23) | Filed as Exhibit 99.1 to Registrant's Current Report on Form 8-K filed with the Securities and Exchange Commission on January 9, 2015, and incorporated herein by reference. |
(24) | Filed as Exhibit 10.1 to Registrant's Current Report on Form 8-K filed with the Securities and Exchange Commission on December 4, 2014 (Executive Employment Agreement) and Exhibit 99.2 to Registrant's Current Report on Form 8-K filed with the Securities and Exchange Commission on January 9, 2015 (Amendment to Executive Employment Agreement), and each incorporated herein by reference. |
(25) | Filed as Exhibit 10.5 to Registrant’s Quarterly Report on Form 10-Q filed with the Securities and Exchange Commission on May 6, 2015, and incorporated herein by reference. |
(26) | Filed as Exhibit 10.1 to Registrant’s Current Report on Form 8-K filed with the Securities and Exchange Commission on May 14, 2015, and incorporated herein by reference. |
(27) | Filed as Exhibit 10.1 to Registrant’s Current Report on Form 8-K filed with the Securities and Exchange Commission on May 27, 2015, and incorporated herein by reference. |
(28) | Filed as Exhibit 10.1 to Registrant’s Quarterly Report on Form 10-Q filed with the Securities and Exchange Commission on November 9, 2015, and incorporated herein by reference. |
(29) | Filed as Exhibit 10.2 to Registrant’s Quarterly Report on Form 10-Q filed with the Securities and Exchange Commission on November 9, 2015, and incorporated herein by reference. |
(30) | Filed as Exhibit 10.1 to Registrant’s Current Report on Form 8-K filed with the Securities and Exchange Commission on December 1, 2015, and incorporated herein by reference. |
(31) | Filed as Exhibit 10.1 to Registrant’s Current Report on Form 8-K filed with the Securities and Exchange Commission on December 16, 2015, and incorporated herein by reference. |
(32) | Filed as Exhibit 10.1 to Registrant’s Current Report on Form 8-K filed with the Securities and Exchange Commission on January 6, 2016, and incorporated herein by reference. |
(33) | Filed as Exhibit 2.1 to Registrant’s Current Report on Form 8-K filed with the Securities and Exchange Commission on January 13, 2016, and incorporated herein by reference. |
(34) | Filed as Exhibit 10.1 to Registrant’s Current Report on Form 8-K filed with the Securities and Exchange Commission on February 4, 2016, and incorporated herein by reference. |
(35) | Filed as Exhibit 10.5 to Registrant’s Annual Report on Form 10-K filed with the Securities and Exchange Commission on March 10, 2015, and incorporated herein by reference. |
# | Indicates a management contract or compensatory plan. |
† | Portions of this exhibit have been omitted pending a determination by the Securities and Exchange Commission as to whether these portions should be granted confidential treatment. |
79