Attached files
| file | filename |
|---|---|
| 8-K - EXELIS INC. 8-K - Exelis Inc. | a50265448.htm |
| EX-99.1 - EXHIBIT 99.1 - Exelis Inc. | a50265448ex99_1.htm |
Exhibit 99.2

First Quarter 2012 Earnings Call May 4, 2012 Dave Melcher Chief Executive Officer and President Peter Milligan Chief Financial Officer
SAFE HARBOR STATEMENT Safe Harbor Statement under the Private Securities Litigation Reform Act of 1995 (the “Act”): Certain material presented herein includes forward-looking statements intended to qualify for the safe harbor from liability established by the Private Securities Litigation Reform Act of 1995. These forward-looking statements include, but are not limited to, statements about the separation of the Company from ITT Corporation, the terms and the effect of the separation, the nature and impact of such a separation, capitalization of the Company, future strategic plans and other statements that describe the Company’s business strategy, outlook, objectives, plans, intentions or goals, and any discussion of future operating or financial performance. Whenever used, words such as “anticipate,” “estimate,” “expect,” “project,” “intend,” “plan,” “believe,” “target” and other terms of similar meaning are intended to identify such forward-looking statements. Forward-looking statements are uncertain and to some extent unpredictable, and involve known and unknown risks, uncertainties and other important factors that could cause actual results to differ materially from those expressed or implied in, or reasonably inferred from, such forward-looking statements. Factors that could cause results to differ materially from those anticipated include, but are not limited to: The Company undertakes no obligation to update any forward-looking statements, whether as a result of new information, future events or otherwise, except as required by law. In addition, forward-looking statements are subject to certain risks and uncertainties that could cause actual results to differ materially from the Company’s historical experience and our present expectations or projections. These risks and uncertainties include, but are not limited to, those described in Exelis Inc.’s Annual Report on Form 10-K, and those described from time to time in our future reports filed with the Securities and Exchange Commission. Our dependence on the defense industry and the business risks peculiar to that industry, including changing priorities or reductions in the U.S. Government or international defense budgets; Government regulations and compliance therewith, including changes to the Department of Defense procurement process; Our international operations, including sales to foreign customers; Competition, industry capacity and production rates; Misconduct of our employees, subcontractors, agents and business partners; The level of returns on postretirement benefit plan assets and potential employee benefit plan contributions and other employment and pension matters; Changes in interest rates and other factors that affect earnings and cash flows; The mix of our contracts and programs, our performance, and our ability to control costs; Governmental investigations; Our level of indebtedness and our ability to make payments on or service our indebtedness; Subcontractor performance; Economic and capital markets conditions; The availability and pricing of raw materials and components; Ability to retain and recruit qualified personnel; Protection of intellectual property rights; Changes in technology; Contingencies related to actual or alleged environmental contamination, claims and concerns; Security breaches and other disruptions to our information technology and operations; and Unanticipated changes in our tax provisions or exposure to additional income tax liabilities. In addition, there are risks and uncertainties relating to the separation including whether those transactions will result in any tax liability, the operational and financial profile of the Company or any of its businesses after giving effect to the separation, and the ability of the Company to operate as an independent entity.
Q1 2012 HIGHLIGHTS: STRONG START TO 2012 Advancing critical technology development Commercial imagery positions on GeoEye-2 and WorldView-3 DATACOMM team announced JAGWIRETM Environmental Data System Diverse Q1 Contract AwardsSolid international product awards $49M in various Electronic Systems awards$33M FMS UK Night Vision $350M+ in successful I&TS recompetes and options exercised Applied Kilovolts strategic acquisition completed
6% increase in revenue Achieved full operational tempo on several large services contracts 190 basis point year-over-year improvement in adjusted operating margin (1)Program productivity Cost controls Pension cost improvement 29% increase in adjusted operating income (1) Managing pension commitments Managing Sales Mix Transition – Creating Value Q1 2012 HIGHLIGHTS: STRONG START TO 2012 (1)Adjusted Operating Income/Margin excludes spin-related charges For Non-GAAP reconciliations, refer to appendix and www.exelisinc.com/investors
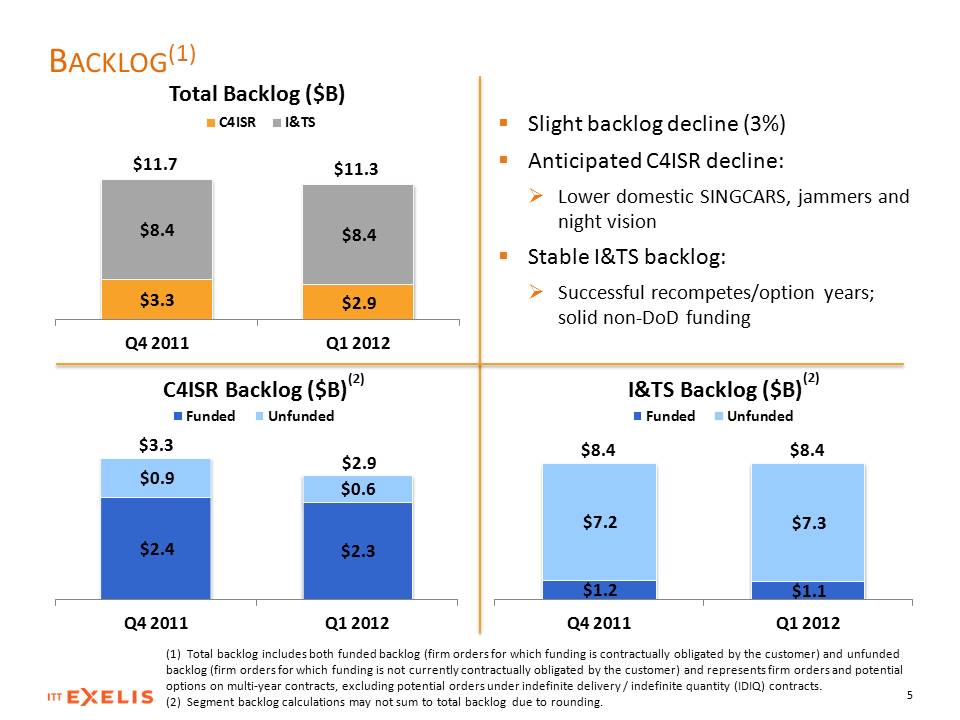
BACKLOG(1) $3.3 $2.9 $8.4 $8.4 Q4 2011 Q1 2012 Total Backlog ($B) C4ISR I&TS $2.4 $2.3 $0.9 $0.6 Q4 2011 Q1 2012 C4ISR Backlog ($B)Funded Unfunded $1.2 $1.1 $7.2 $7.3 Q4 2011Q1 2012 I&TS Backlog ($B) Funded Unfunded $11.7 $11.3 $3.3 $2.9 $8.4 $8.4 Slight backlog decline (3%) Anticipated C4ISR decline: Lower domestic SINGCARS, jammers and night vision Stable I&TS backlog: Successful recompetes/option years; solid non-DoD funding (1) Total backlog includes both funded backlog (firm orders for which funding is contractually obligated by the customer) and unfunded backlog (firm orders for which funding is not currently contractually obligated by the customer) and represents firm orders and potential options on multi-year contracts, excluding potential orders under indefinite delivery / indefinite quantity (IDIQ) contracts. (2) Segment backlog calculations may not sum to total backlog due to rounding. (2) (2)
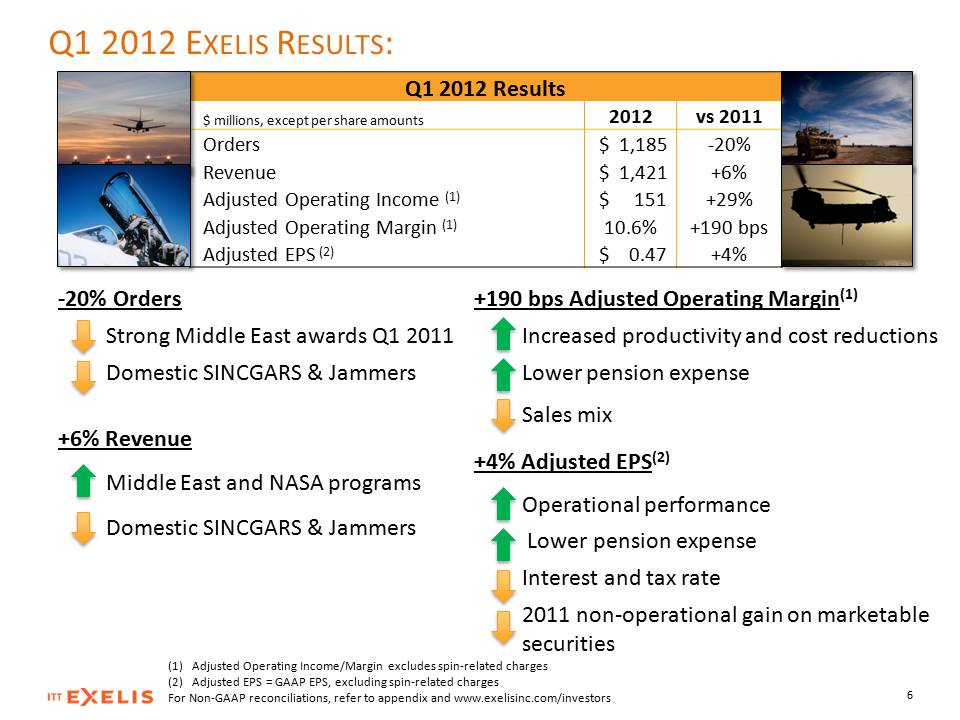
+190 bps Adjusted Operating Margin(1) Increased productivity and cost reductions Lower pension expense Sales mix +4% Adjusted EPS(2) Operational performance Lower pension expense Interest and tax rate 2011 non-operational gain on marketable securities -20% Orders Strong Middle East awards Q1 2011 Domestic SINCGARS & Jammers +6% Revenue Middle East and NASA programs Domestic SINCGARS & Jammers Q1 2012 EXELIS RESULTS: Q1 2012 Results $ millions, except per share amounts 2012 vs 2011 Orders $ 1,185 -20% Revenue $ 1,421 +6% Adjusted Operating Income (1) $ 151 +29% Adjusted Operating Margin (1) 10.6% +190 bps Adjusted EPS (2) $ 0.47 +4% (1)Adjusted Operating Income/Margin excludes spin-related charges (2)Adjusted EPS = GAAP EPS, excluding spin-related charges For Non-GAAP reconciliations, refer to appendix and www.exelisinc.com/investors
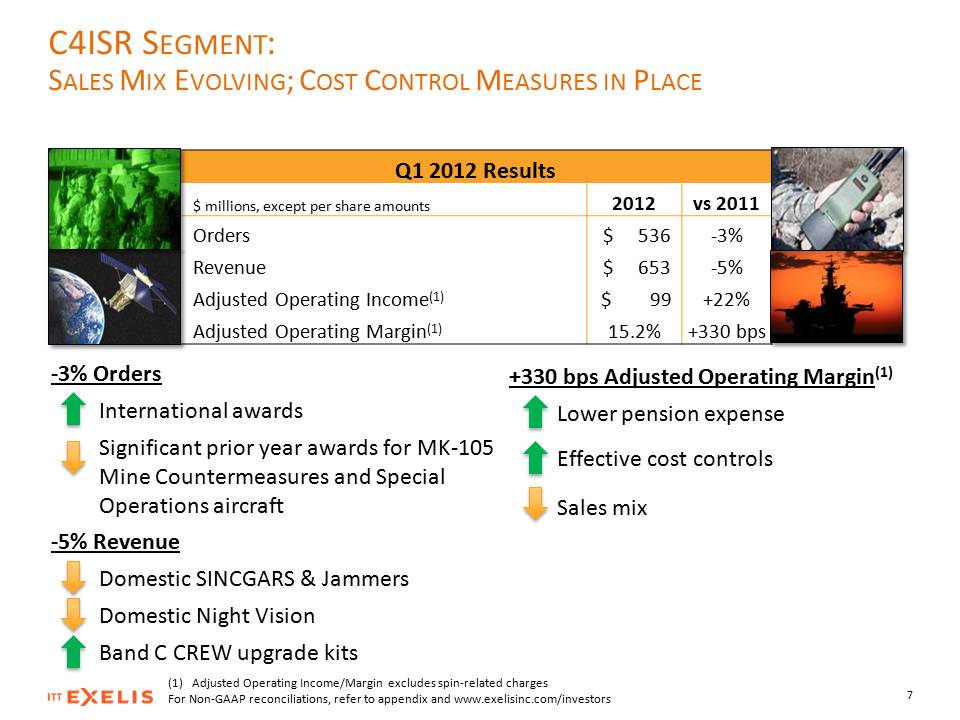
+330 bps Adjusted Operating Margin(1) Lower pension expense Effective cost controls Sales mix -3% Orders International awards Significant prior year awards for MK-105 Mine Countermeasures and Special Operations aircraft -5% Revenue Domestic SINCGARS & Jammers Domestic Night Vision Band C CREW upgrade kits C4ISR SEGMENT: SALES MIX EVOLVING; COST CONTROL MEASURES IN PLACE (1)Adjusted Operating Income/Margin excludes spin-related charges For Non-GAAP reconciliations, refer to appendix and www.exelisinc.com/investors Q1 2012 Results $ millions, except per share amounts 2012 vs 2011 Orders $ 536 -3% Revenue $ 653 -5% Adjusted Operating Income(1) $ 99 +22% Adjusted Operating Margin(1) 15.2% +330 bps
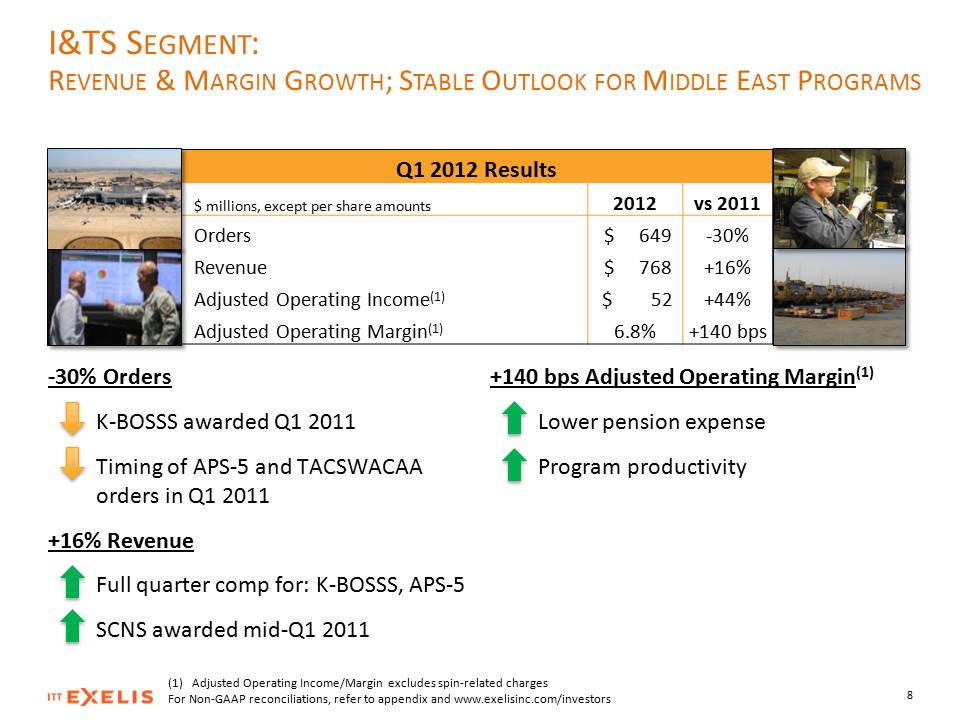
+140 bps Adjusted Operating Margin(1) Lower pension expense Program productivity -30% Orders K-BOSSS awarded Q1 2011 Timing of APS-5 and TACSWACAA orders in Q1 2011 +16% Revenue Full quarter comp for: K-BOSSS, APS-5 SCNS awarded mid-Q1 2011 I&TS SEGMENT: REVENUE & MARGIN GROWTH; STABLE OUTLOOK FOR MIDDLE EAST PROGRAMS (1)Adjusted Operating Income/Margin excludes spin-related charges For Non-GAAP reconciliations, refer to appendix and www.exelisinc.com/investors Q1 2012 Results $ millions, except per share amounts 2012 vs 2011 Orders $ 649 -30% Revenue $ 768 +16% Adjusted Operating Income(1) $ 52 +44% Adjusted Operating Margin(1) 6.8% +140 bps
FREE CASH FLOW(1) Q1 Free Cash Flow (FCF) of -$304 M $197M pension contribution A/R timing on large service contracts Anticipate quarterly improvement in FCF through the year; Stronger 2H Income tax-related receivable from ITT Corp. Full year FCF projections remain on-track for > $200M (1)Free Cash Flow = Cash Flow from Operations less Capital Expenditures. Does not include dividend payments. For Non-GAAP reconciliations, refer to appendix and www.exelisinc.com/investors
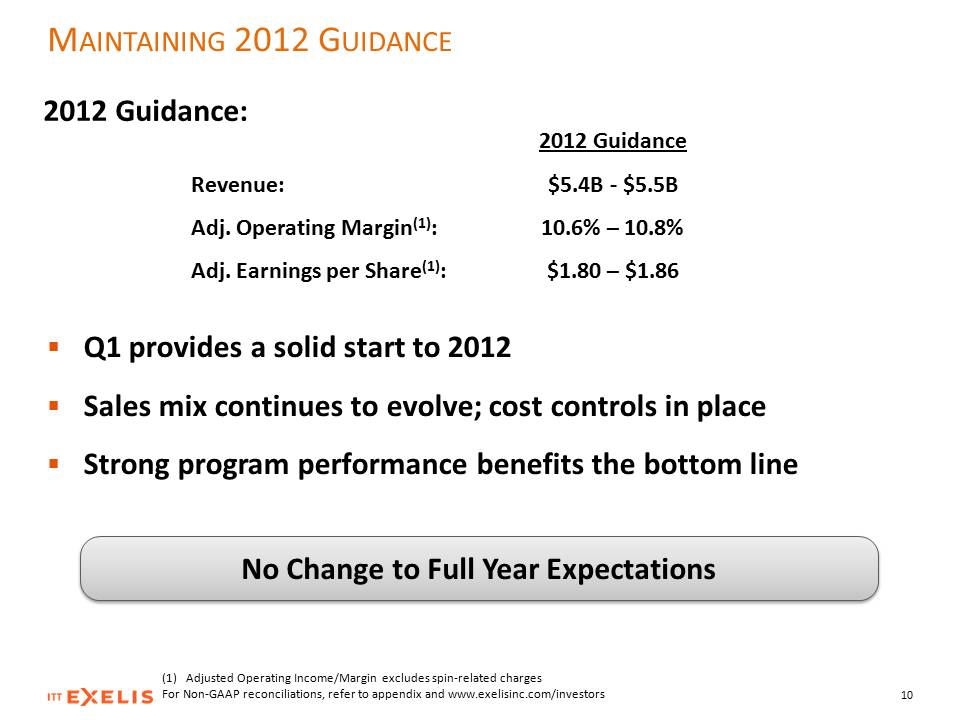
MAINTAINING 2012 GUIDANCE Revenue: Adj. Operating Margin(1): Adj. Earnings per Share(1): 2012 Guidance $5.4B - $5.5B 10.6% – 10.8% $1.80 – $1.86 (1)Adjusted Operating Income/Margin excludes spin-related charges For Non-GAAP reconciliations, refer to appendix and www.exelisinc.com/investors No Change to Full Year Expectations 2012 Guidance: Q1 provides a solid start to 2012 Sales mix continues to evolve; cost controls in place Strong program performance benefits the bottom line

Appendix
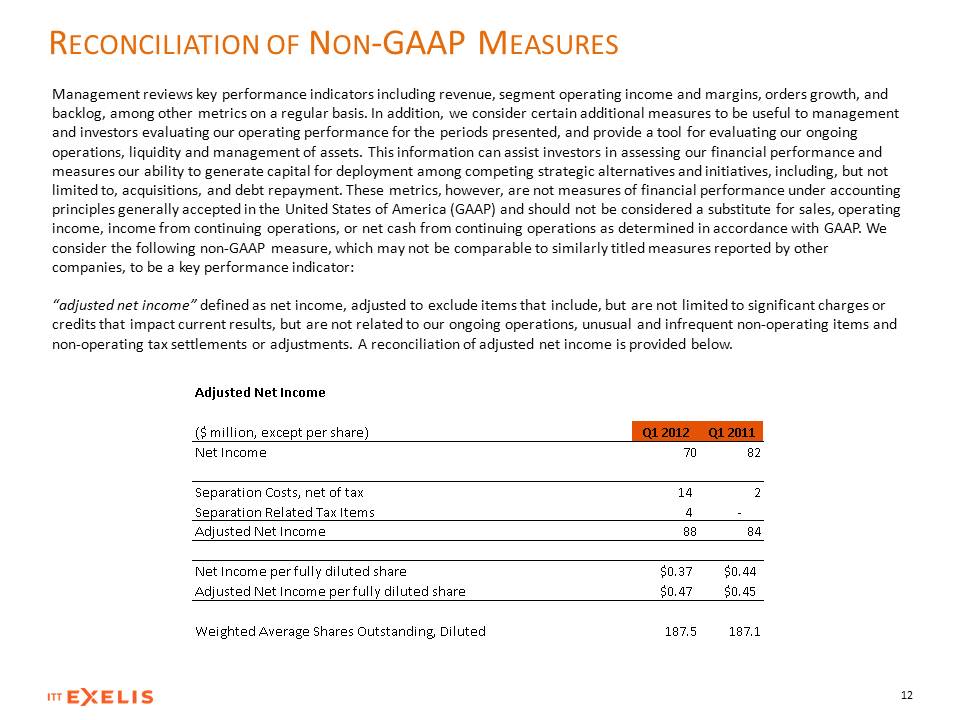
RECONCILIATION OF NON-GAAP MEASURES Management reviews key performance indicators including revenue, segment operating income and margins, orders growth, and backlog, among other metrics on a regular basis. In addition, we consider certain additional measures to be useful to management and investors evaluating our operating performance for the periods presented, and provide a tool for evaluating our ongoing operations, liquidity and management of assets. This information can assist investors in assessing our financial performance and measures our ability to generate capital for deployment among competing strategic alternatives and initiatives, including, but not limited to, acquisitions, and debt repayment. These metrics, however, are not measures of financial performance under accounting principles generally accepted in the United States of America (GAAP) and should not be considered a substitute for sales, operating income, income from continuing operations, or net cash from continuing operations as determined in accordance with GAAP. We consider the following non-GAAP measure, which may not be comparable to similarly titled measures reported by other companies, to be a key performance indicator: “adjusted net income” defined as net income, adjusted to exclude items that include, but are not limited to significant charges or credits that impact current results, but are not related to our ongoing operations, unusual and infrequent non-operating items and non-operating tax settlements or adjustments. A reconciliation of adjusted net income is provided below.
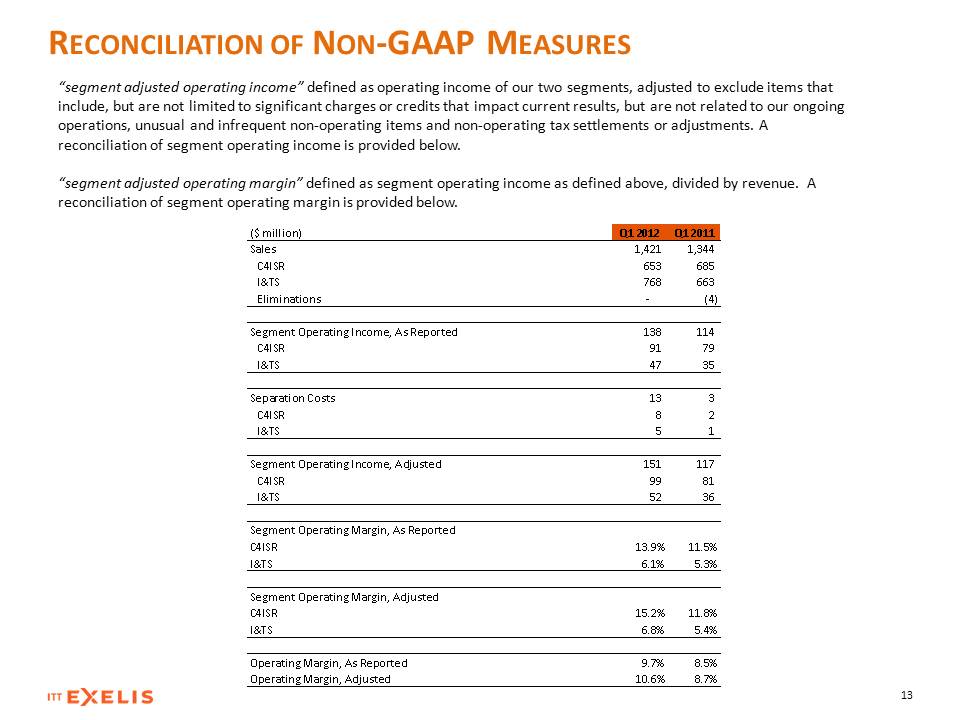
RECONCILIATION OF NON-GAAP MEASURES “segment adjusted operating income” defined as operating income of our two segments, adjusted to exclude items that include, but are not limited to significant charges or credits that impact current results, but are not related to our ongoing operations, unusual and infrequent non-operating items and non-operating tax settlements or adjustments. A reconciliation of segment operating income is provided below. “segment adjusted operating margin” defined as segment operating income as defined above, divided by revenue. A reconciliation of segment operating margin is provided below. ($ million) Q1 2012 Q1 2011 Sales C4ISR I&TS Eliminations Segment Operating Income, As Reported C4ISR I&TS Sepration Costs C4ISR I&TS Segment Operating Income, Adjusted C4ISR I&TS Segment Operating Margin, As Reported C4ISR I&TS Segment Operating Margin, Adjusted C4ISR I&TS Operating Margin, AS Reported Operating Margin, Adjusted 1,421 1,344 653 685 768 663 – (4) 138 114 91 79 47 35 13 3 8 2 5 1 151 117 99 81 52 36 13.9% 11.5% 6.1% 5.3% 15.2% 11.8% 6.8% 5.4% 9.7% 8.5% 10.6% 8.7%
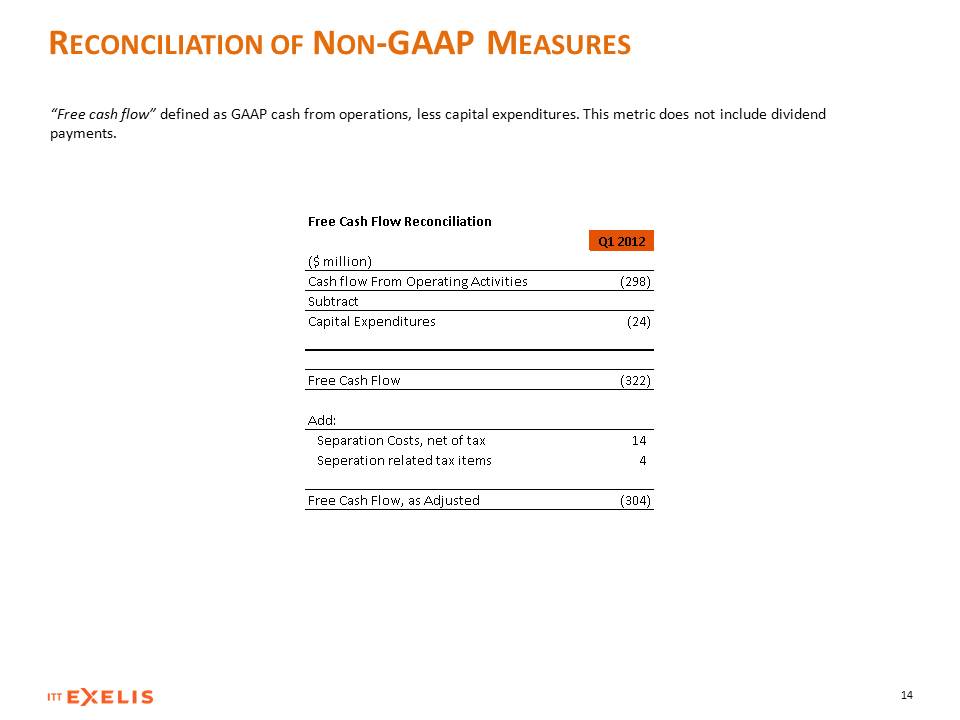
RECONCILIATION OF NON-GAAP MEASURES “Free cash flow” defined as GAAP cash from operations, less capital expenditures. This metric does not include dividend payments. Free Cash Flow Reconciliation ($ million) Q1 2012 Cash flow From Operating Activities (298) Subtract Capital Expenditures (24) Free Cash Flow (322) Add: Separation Costs, net of tax 14 Separation related tax items 4 Free Cash Flow, as Adjusted (304)