Attached files
| file | filename |
|---|---|
| 8-K - 8-K - ARIZONA PUBLIC SERVICE CO | a12-10750_18k.htm |
| EX-99.2 - EX-99.2 - ARIZONA PUBLIC SERVICE CO | a12-10750_1ex99d2.htm |
| EX-99.1 - EX-99.1 - ARIZONA PUBLIC SERVICE CO | a12-10750_1ex99d1.htm |
Exhibit 99.3
|
|
1st Quarter 2012 Results |
|
|
Forward-Looking Statements 2 This presentation contains forward-looking statements based on current expectations, including statements regarding our 2012 earnings outlook. These forward-looking statements are often identified by words such as “estimate,” “predict,” “may,” “believe,” “plan,” “expect,” “require,” “intend,” “assume” and similar words. Because actual results may differ materially from expectations, we caution you not to place undue reliance on these statements. A number of factors could cause future results to differ materially from historical results, or from outcomes currently expected or sought by Pinnacle West or APS. These factors include, but are not limited to: our ability to achieve timely and adequate rate recovery of our costs, including returns on debt and equity capital; our ability to manage capital expenditures and other costs while maintaining reliability and customer service levels; variations in demand for electricity, including those due to weather, the general economy, customer and sales growth (or decline), and the effects of energy conservation measures and distributed generation; power plant and transmission system performance and outages; volatile fuel and purchased power costs; fuel and water supply availability; regulatory and judicial decisions, developments and proceedings; new legislation or regulation, including those relating to environmental requirements and nuclear plant operations; our ability to meet renewable energy and energy efficiency mandates and recover related costs; risks inherent in the operation of nuclear facilities, including spent fuel disposal uncertainty; competition in retail and wholesale power markets; the duration and severity of the economic decline in Arizona and current real estate market conditions; the cost of debt and equity capital and the ability to access capital markets when required; changes to our credit ratings; the investment performance of the assets of our nuclear decommissioning trust, pension, and other postretirement benefit plans and the resulting impact on future funding requirements; the liquidity of wholesale power markets and the use of derivative contracts in our business; potential shortfalls in insurance coverage; new accounting requirements or new interpretations of existing requirements; generation, transmission and distribution facility and system conditions and operating costs; the ability to meet the anticipated future need for additional baseload generation and associated transmission facilities in our region; the willingness or ability of our counterparties, power plant participants and power plant land owners to meet contractual or other obligations or extend the rights for continued power plant operations; technological developments affecting the electric industry; and restrictions on dividends or other provisions in our credit agreements and Arizona Corporation Commission orders. These and other factors are discussed in Risk Factors described in Item 1A of the Pinnacle West/APS Annual Report on Form 10-K for the fiscal year ended December 31, 2011, which you should review carefully before placing any reliance on our financial statements, disclosures or earnings outlook. Neither Pinnacle West nor APS assumes any obligation to update these statements, even if our internal estimates change, except as required by law. |
|
|
In this presentation, references to net income and earnings per share (EPS) refer to amounts attributable to common shareholders. We present “gross margin” per diluted share of common stock. Gross margin refers to operating revenues less fuel and purchased power expenses. Gross margin is a “non-GAAP financial measure,” as defined in accordance with SEC rules. The appendix contains a reconciliation of this non-GAAP financial measure to the referenced revenue and expense line items on our Consolidated Statements of Income, which are the most directly comparable financial measures calculated and presented in accordance with generally accepted accounting principles in the United States of America (GAAP). We view gross margin as an important performance measure of the core profitability of our operations. We refer to “on-going earnings” in this presentation, which is also a non-GAAP financial measure. We believe on-going earnings provide investors with a useful indicator of our results that is comparable among periods because it excludes the effects of unusual items that may occur on an irregular basis. Reconciliations of on-going earnings to our net income attributable to common shareholders are included in this presentation. Investors should note that these non-GAAP financial measures may involve judgments by management, including whether an item is classified as an unusual item. These measures are key components of our internal financial reporting and are used by our management in analyzing the operations of our business. We believe that investors benefit from having access to the same financial measures that management uses. Amounts Attributable to Common Shareholders and Non-GAAP Financial Measures 3 |
|
|
CFO Agenda 1st Quarter Results Arizona Economic Outlook Liquidity and Financing Activities 4 |
|
|
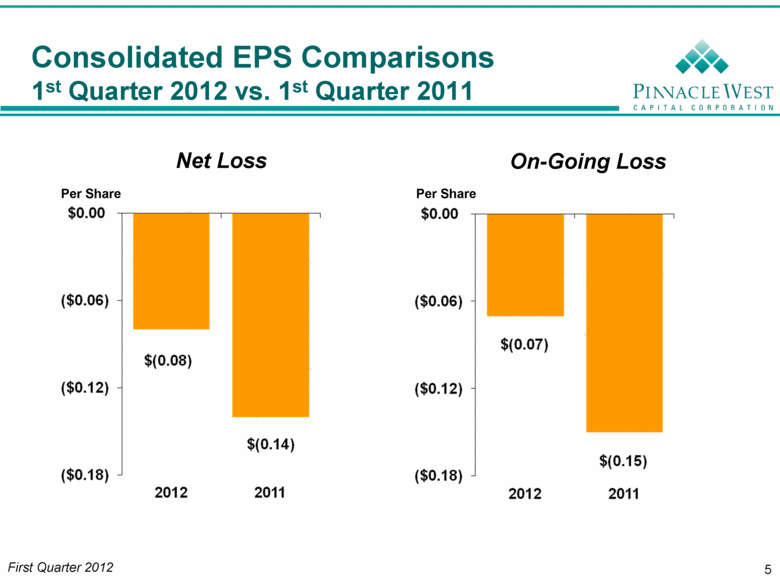
Per Share Net Loss On-Going Loss Per Share 5 Consolidated EPS Comparisons 1st Quarter 2012 vs. 1st Quarter 2011 |
|
|
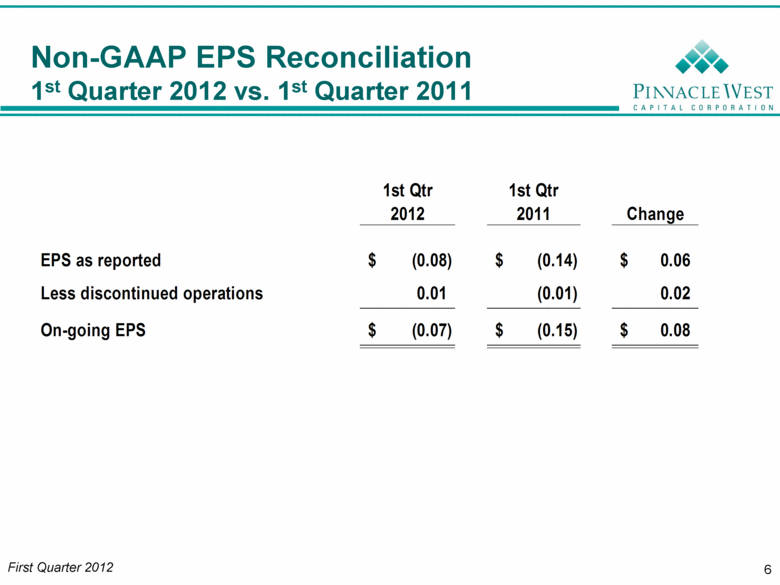
Non-GAAP EPS Reconciliation 1st Quarter 2012 vs. 1st Quarter 2011 6 1st Qtr 1st Qtr 2012 2011 Change EPS as reported (0.08) $ (0.14) $ 0.06 $ Less discontinued operations 0.01 (0.01) 0.02 On-going EPS (0.07) $ (0.15) $ 0.08 $ |
|
|
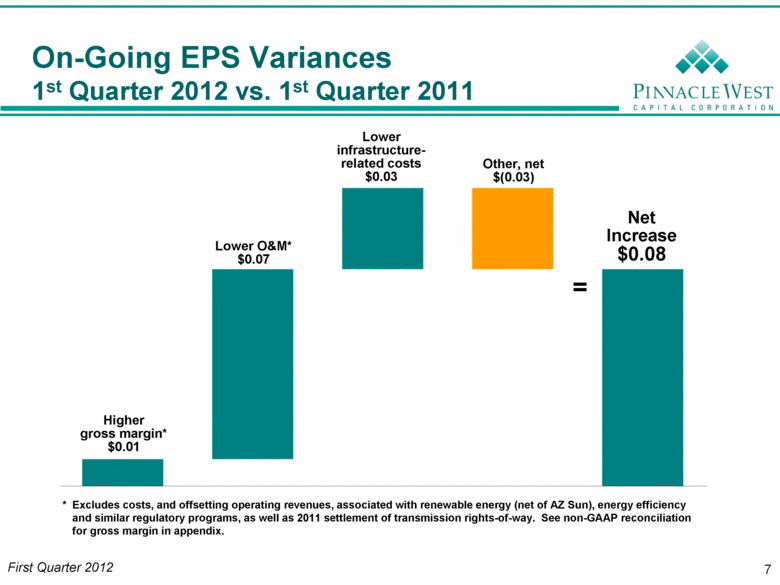
Higher gross margin* $0.01 Lower infrastructure-related costs $0.03 Lower O&M* $0.07 Net Increase $0.08 = * Excludes costs, and offsetting operating revenues, associated with renewable energy (net of AZ Sun), energy efficiency and similar regulatory programs, as well as 2011 settlement of transmission rights of-way. See non-GAAP reconciliation for gross margin in appendix. On-Going EPS Variances 1st Quarter 2012 vs. 1st Quarter 2011 Other, net $(0.03) 7 First Quarter 2012 |
|
|
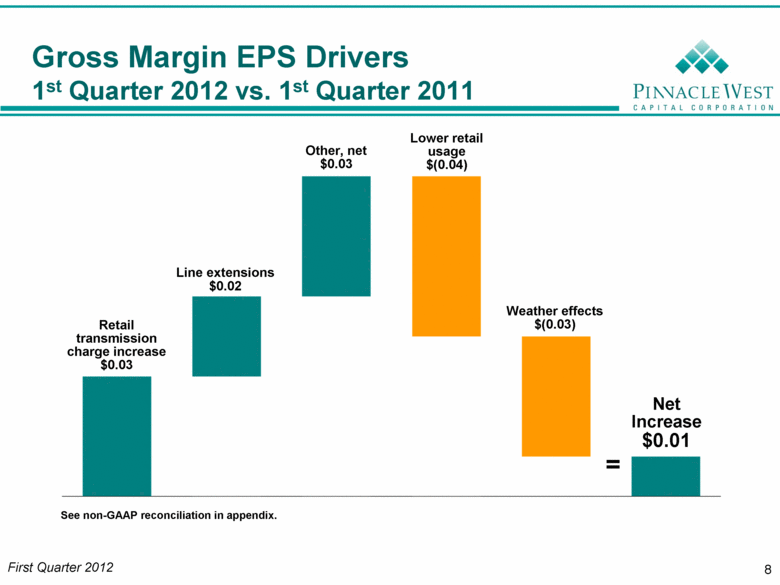
Gross Margin EPS Drivers 1st Quarter 2012 vs. 1st Quarter 2011 Net Increase $0.01 = See non-GAAP reconciliation in appendix. Lower retail usage $(0.04) Retail transmission charge increase $0.03 8 Other, net $0.03 Line extensions $0.02 Weather effects $(0.03) |
|
|
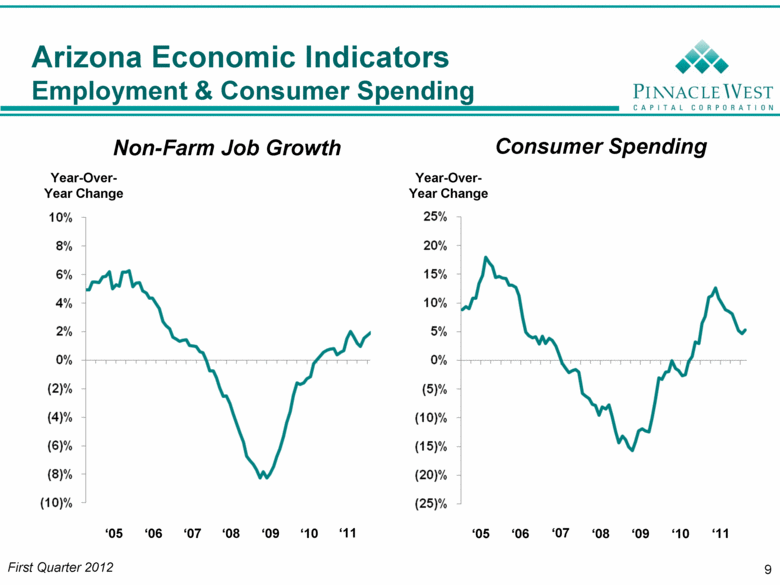
9 Arizona Economic Indicators Employment & Consumer Spending Year-Over-Year Change Non-Farm Job Growth Consumer Spending ‘05 ‘06 ‘07 ‘08 ‘09 ‘10 ‘11 ‘05 ‘06 ‘08 ‘09 ‘10 ‘11 Year-Over-Year Change ‘07 |
|
|
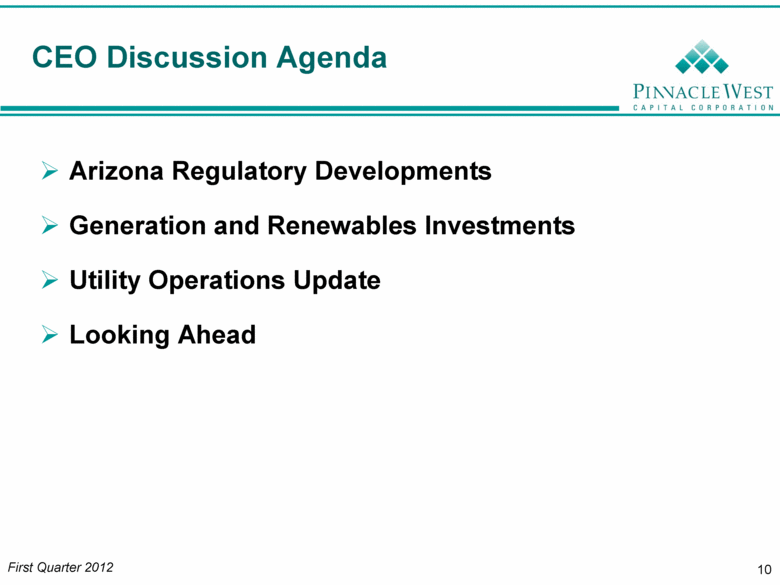
CEO Discussion Agenda Arizona Regulatory Developments Generation and Renewables Investments Utility Operations Update Looking Ahead 10 |
|
|
Appendix |
|
|
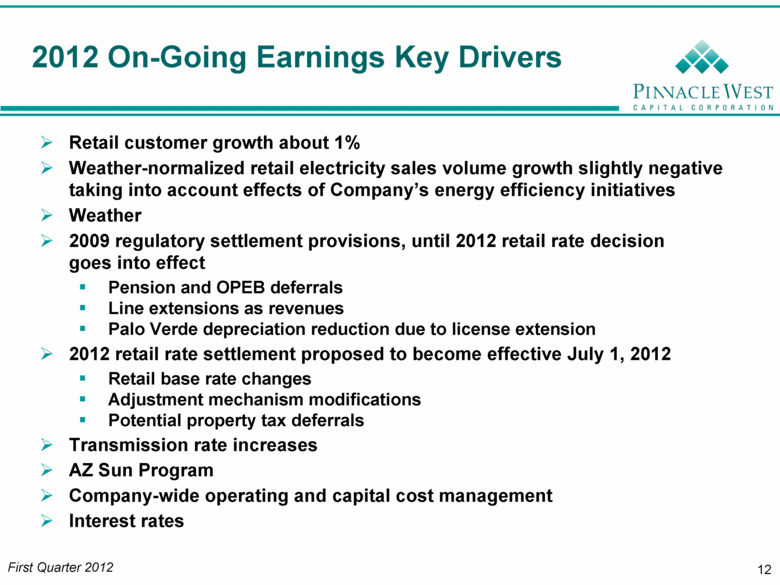
2012 On-Going Earnings Key Drivers 12 Retail customer growth about 1% Weather-normalized retail electricity sales volume growth slightly negative taking into account effects of Company’s energy efficiency initiatives Weather 2009 regulatory settlement provisions, until 2012 retail rate decision goes into effect Pension and OPEB deferrals Line extensions as revenues Palo Verde depreciation reduction due to license extension 2012 retail rate settlement proposed to become effective July 1, 2012 Retail base rate changes Adjustment mechanism modifications Potential property tax deferrals Transmission rate increases AZ Sun Program Company-wide operating and capital cost management Interest rates |
|
|
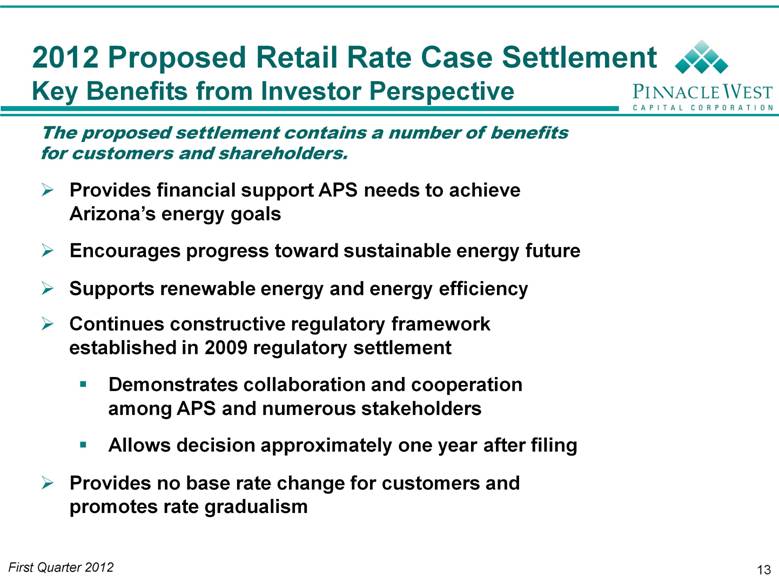
2012 Proposed Retail Rate Case Settlement Key Benefits from Investor Perspective Provides financial support APS needs to achieve Arizona’s energy goals Encourages progress toward sustainable energy future Supports renewable energy and energy efficiency Continues constructive regulatory framework established in 2009 regulatory settlement Demonstrates collaboration and cooperation among APS and numerous stakeholders Allows decision approximately one year after filing Provides no base rate change for customers and promotes rate gradualism The proposed settlement contains a number of benefits for customers and shareholders. 13 |
|
|
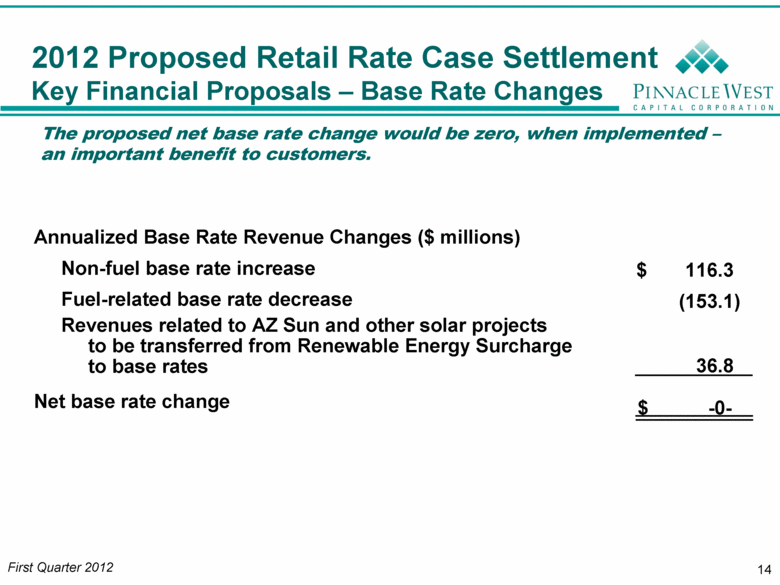
2012 Proposed Retail Rate Case Settlement Key Financial Proposals – Base Rate Changes The proposed net base rate change would be zero, when implemented – an important benefit to customers. 14 Annualized Base Rate Revenue Changes ($ millions) Non-fuel base rate increase $ 116.3 Fuel-related base rate decrease (153.1) Revenues related to AZ Sun and other solar projects to be transferred from Renewable Energy Surcharge to base rates 36.8 Net base rate change $ -0- |
|
|
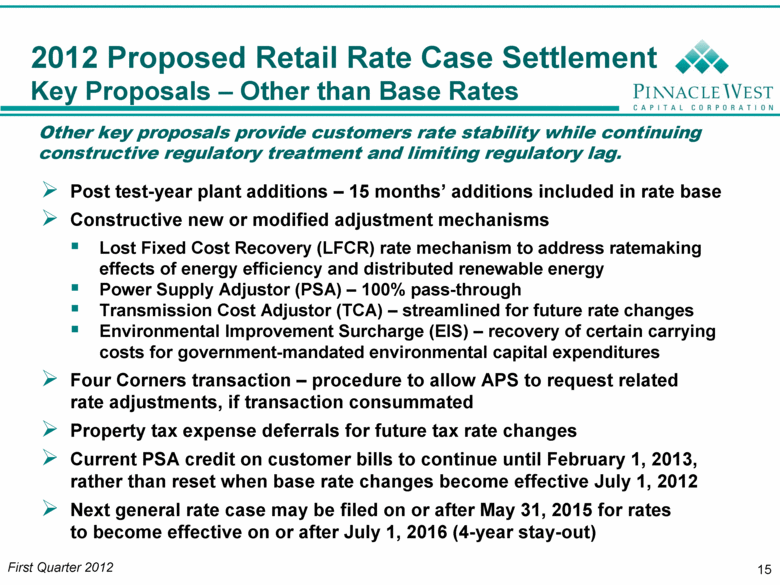
Other key proposals provide customers rate stability while continuing constructive regulatory treatment and limiting regulatory lag. 15 2012 Proposed Retail Rate Case Settlement Key Proposals – Other than Base Rates Post test-year plant additions – 15 months’ additions included in rate base Constructive new or modified adjustment mechanisms Lost Fixed Cost Recovery (LFCR) rate mechanism to address ratemaking effects of energy efficiency and distributed renewable energy Power Supply Adjustor (PSA) – 100% pass-through Transmission Cost Adjustor (TCA) – streamlined for future rate changes Environmental Improvement Surcharge (EIS) – recovery of certain carrying costs for government-mandated environmental capital expenditures Four Corners transaction – procedure to allow APS to request related rate adjustments, if transaction consummated Property tax expense deferrals for future tax rate changes Current PSA credit on customer bills to continue until February 1, 2013, rather than reset when base rate changes become effective July 1, 2012 Next general rate case may be filed on or after May 31, 2015 for rates to become effective on or after July 1, 2016 (4-year stay-out) |
|
|
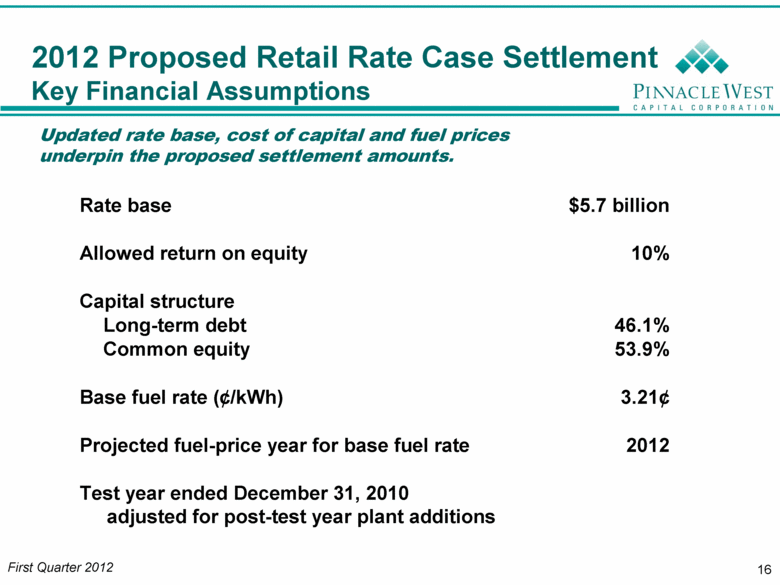
Updated rate base, cost of capital and fuel prices underpin the proposed settlement amounts. 16 2012 Proposed Retail Rate Case Settlement Key Financial Assumptions Rate base $5.7 billion Allowed return on equity 10% Capital structure Long-term debt 46.1% Common equity 53.9% Base fuel rate (¢/kWh) 3.21¢ Projected fuel-price year for base fuel rate 2012 Test year ended December 31, 2010 adjusted for post-test year plant additions |
|
|
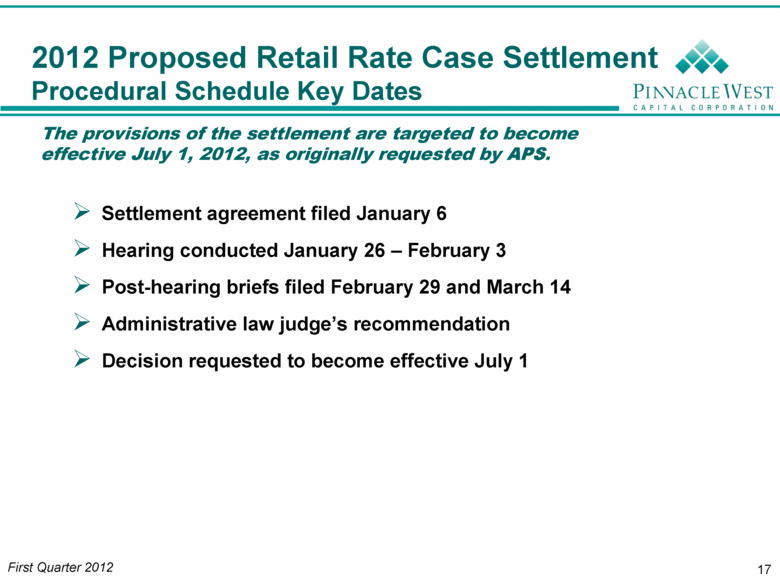
2012 Proposed Retail Rate Case Settlement Procedural Schedule Key Dates The provisions of the settlement are targeted to become effective July 1, 2012, as originally requested by APS. 17 Settlement agreement filed January 6 Hearing conducted January 26 – February 3 Post-hearing briefs filed February 29 and March 14 Administrative law judge’s recommendation Decision requested to become effective July 1 First Quarter 2012 |
|
|
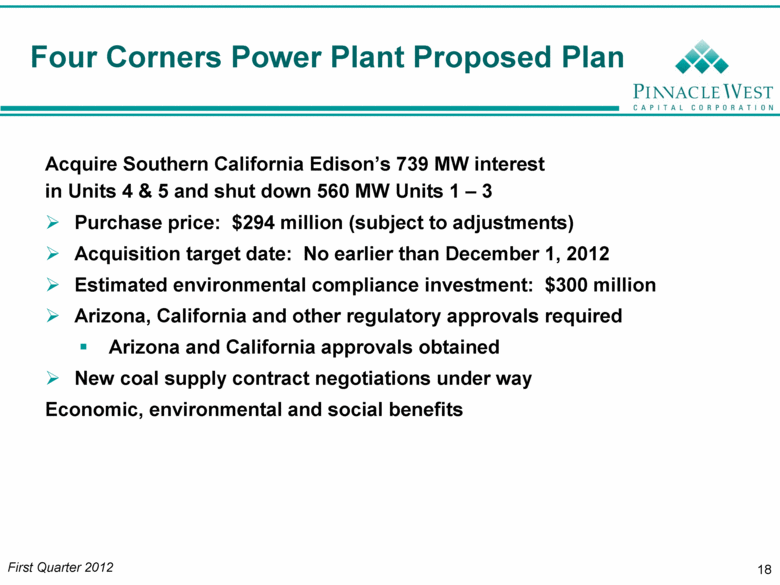
Four Corners Power Plant Proposed Plan Acquire Southern California Edison’s 739 MW interest in Units 4 & 5 and shut down 560 MW Units 1 – 3 Purchase price: $294 million (subject to adjustments) Acquisition target date: No earlier than December 1, 2012 Estimated environmental compliance investment: $300 million Arizona, California and other regulatory approvals required Arizona and California approvals obtained New coal supply contract negotiations under way Economic, environmental and social benefits 18 |
|
|
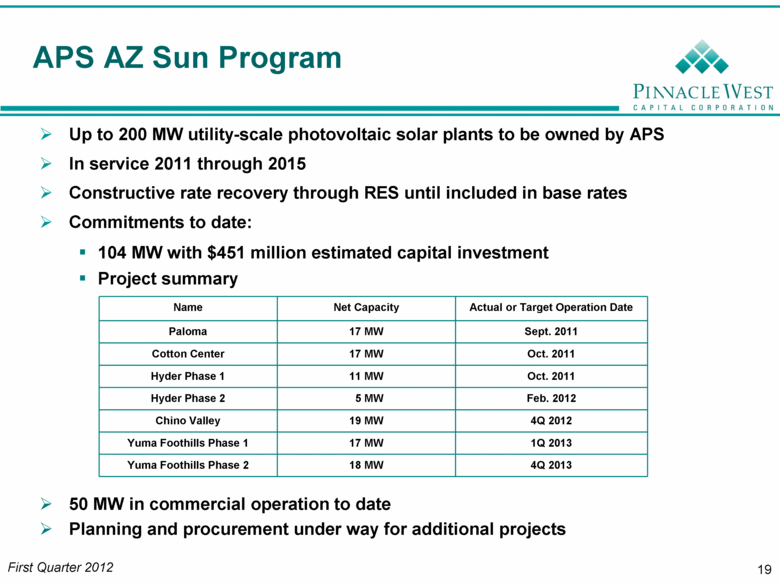
APS AZ Sun Program Up to 200 MW utility-scale photovoltaic solar plants to be owned by APS In service 2011 through 2015 Constructive rate recovery through RES until included in base rates Commitments to date: 104 MW with $451 million estimated capital investment Project summary 50 MW in commercial operation to date Planning and procurement under way for additional projects Name Net Capacity Actual or Target Operation Date Paloma 17 MW Sept. 2011 Cotton Center 17 MW Oct. 2011 Hyder Phase 1 11 MW Oct. 2011 Hyder Phase 2 5 MW Feb. 2012 Chino Valley 19 MW 4Q 2012 Yuma Foothills Phase 1 17 MW 1Q 2013 Yuma Foothills Phase 2 18 MW 4Q 2013 19 |
|
|
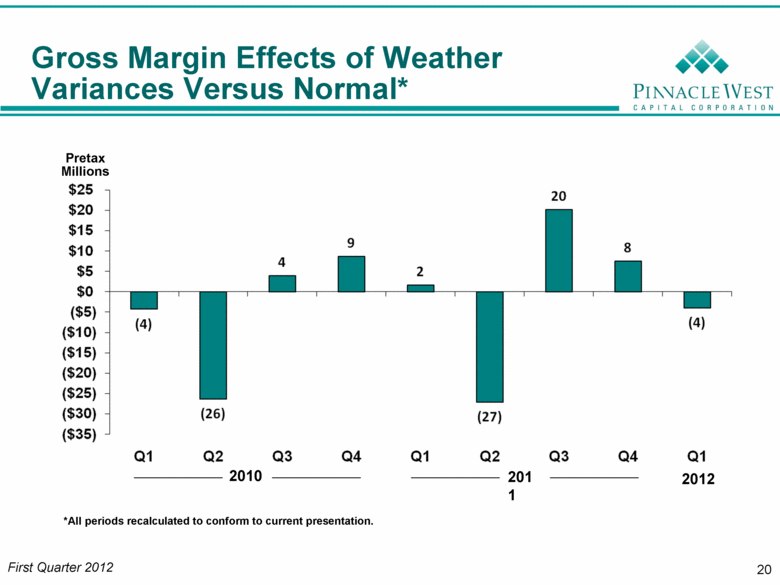
Gross Margin Effects of Weather Variances Versus Normal* Pretax Millions 2011 *All periods recalculated to conform to current presentation. 20 2012 2010 |
|
|
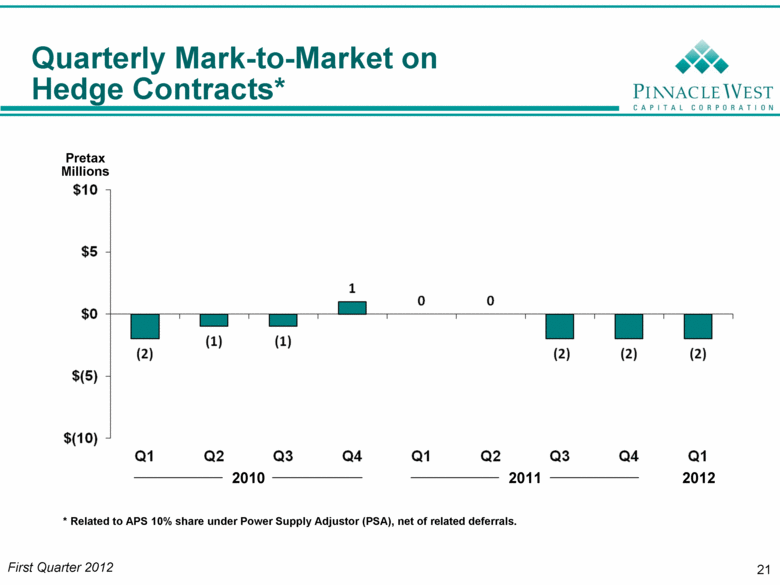
Quarterly Mark-to-Market on Hedge Contracts* Pretax Millions * Related to APS 10% share under Power Supply Adjustor (PSA), net of related deferrals. 2010 2011 21 2012 |
|
|
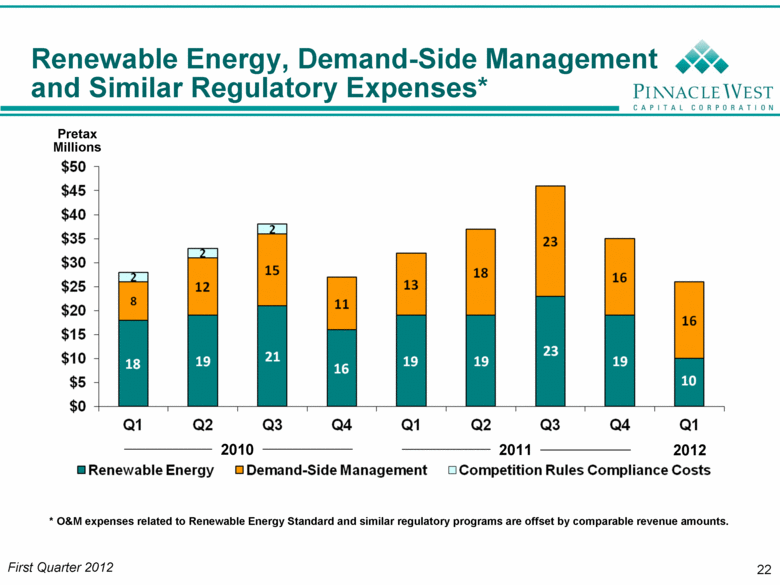
Renewable Energy, Demand-Side Management and Similar Regulatory Expenses* * O&M expenses related to Renewable Energy Standard and similar regulatory programs are offset by comparable revenue amounts. Pretax Millions 2010 2011 22 2012 |
|
|
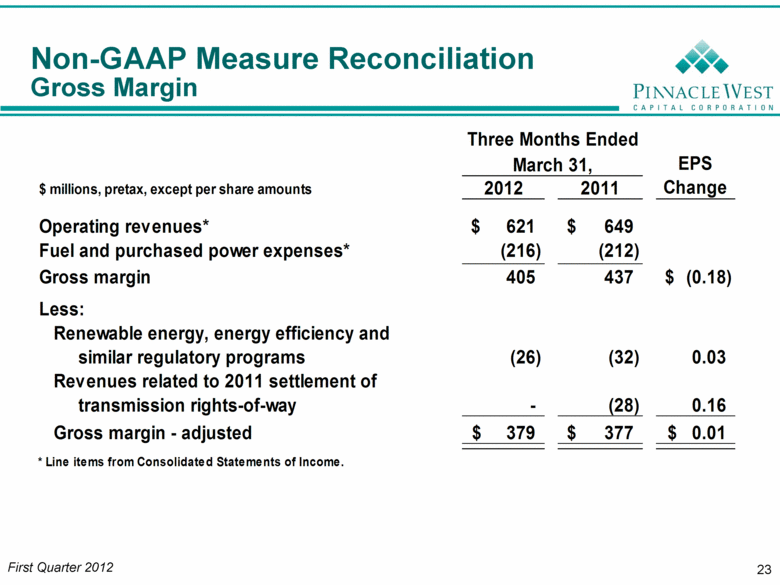
Non-GAAP Measure Reconciliation Gross Margin 23 $ millions, pretax, except per share amounts 2012 2011 Operating revenues* 621 $ 649 $ Fuel and purchased power expenses* (216) (212) Gross margin 405 437 (0.18) $ Less: Renewable energy, energy efficiency and similar regulatory programs (26) (32) 0.03 Revenues related to 2011 settlement of transmission right-of-way - (28) 0.16 Gross margin - adjusted 379 $ 377 $ 0.01 $ * Line items from Consolidated Statements of Income. Three Months Ended March 31, EPS Change First Quarter 2012 |

