Attached files
| file | filename |
|---|---|
| 8-K - FORM 8-K - MACKINAC FINANCIAL CORP /MI/ | d345782d8k.htm |
Exhibit 99.1

PRESS RELEASE
| For Release: | May 2, 2012 | |
| Nasdaq: | MFNC | |
| Contact: | Investor Relations at (888) 343-8147 | |
| Website: | www.bankmbank.com |
MACKINAC FINANCIAL CORPORATION
REPORTS FIRST QUARTER 2012 RESULTS
Manistique, Michigan) – Mackinac Financial Corporation (Nasdaq: MFNC), the bank holding company for mBank (the “Bank”), today announced first quarter 2012 income of $.498 million or $.15 per share compared to net income of $.256 million, or $.07 per share for the first quarter of 2011. The Corporation’s primary asset, mBank, recorded net income of $.800 million for the first quarter of 2012. The first quarter results include a provision for loan losses of $.495 million and negligible ORE writedowns and losses. Operating results for the same period in 2011 include no provision for loan losses, and $.467 million of ORE writedowns and losses.
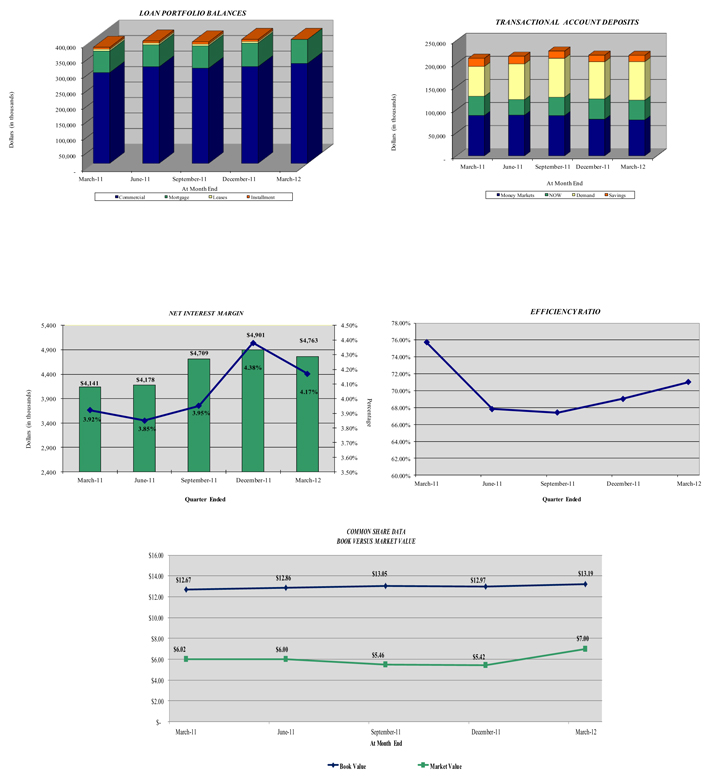
Total shareholders’ equity at March 31, 2012 totaled $56.095 million, compared to $54.097 million on March 31, 2011, an increase of $1.998 million, or 3.69%. Book value of common shareholders’ equity was $13.19 per share at March 31, 2012 compared to $12.67 per share at March 31, 2011.
Weighted average shares outstanding totaled 3,419,736 for both periods. The common stock warrants outstanding of 379,310 shares were slightly dilutive, at approximately $.01 per share, for the 2012 first quarter, as the market value of our stock remained above the $4.35 strike price.
Some highlights for the first quarter include:
| • | Strong loan production, with loan balances increasing by $13.156 million. A good backlog of over $20 million of new loans has been adjudicated and is ready to close in the next 60 days. Some of these loans are SBA transactions which will lead to improved noninterest income levels for the next couple quarters. |
| • | Improved net interest margin at 4.17% compared to 3.92% for the first quarter of 2011. |
| • | Core deposit growth of $6.462 million. |
| • | Secondary mortgage loan income of $.262 million, compared to $.079 million in the first quarter of 2011. |
| • | Improved credit quality with a Texas Ratio of 16.84% compared to 24.96% one year ago. |
Loans and Non-performing Assets
Total loans at March 31, 2012 were $414.402 million, a 10.62% increase from the $374.609 million at March 31, 2011 and up $13.156 million from year-end 2011 total loans of $401.246 million. Commenting on loan growth, Kelly W. George, President and CEO of mBank stated, “We are seeing good loan opportunities in all of our markets, but are especially pleased with the resurgence of good commercial lending opportunities in Southeast Michigan, which bodes well for our organization and is a good economic indicator for the State of Michigan. We are also highly encouraged with the 1-4 family mortgage lending momentum continuing from late last year during a traditionally slow time of the year in our Northern markets. This should bode well for increased lending activities as we enter our peak mortgage lending periods within the late second and third quarters.”
1
Nonperforming loans totaled $6.857 million, 1.65% of total loans at March 31, 2012 compared to $9.964 million, or 2.66% of total loans at March 31, 2011 and down $1.136 million from December 31, 2011. Nonperforming assets were reduced by $4.694 million from a year ago and stood at 2.04% of total assets. Total loan delinquencies resided at 1.17% or $4.8 million, almost solely made up of non-accrual commercial loans. George, commenting on credit quality, stated, “We believe that we will have further reductions of our nonperforming assets as the economy continues to improve and ORE properties become more marketable. Our nonperforming assets are manageable and our associated costs are now more in line with a normal business climate.”
Margin Analysis
Net interest margin in the first quarter of 2012 increased to $4.763 million, 4.17%, compared to $4.141 million, or 3.92%, in the first quarter of 2011. The interest margin increase was largely due to decreased funding costs. George stated, “We expect some margin pressure as we progress through the year due to increased competition on pricing for new loans and renewals. More banks are now on the offense and we expect pricing to be very competitive.”
Deposits
Total deposits of $412.088 million at March 31, 2012 increased by 2.82% from deposits of $400.783 million on March 31, 2011. Total deposits on March 31, 2012 deposits were up $7.299 million from year-end 2011 deposits of $404.789 million. The overall increase in deposits for the first three months of 2012 is comprised of an increase in noncore deposits of $.837 million and increased core deposits of $6.462 million. George, commenting on core deposits, stated, “We are now into the third full year of a low interest rate environment. Our liabilities have all repriced and we believe we are at the low point of this economic cycle. Our strategy going forward will focus on deposit retention and further reduction of interest rate risk.”
Noninterest Income/Expense
Noninterest income, at $.606 million in the first quarter of 2012, increased $.029 million from the first quarter 2011 level of $.577 million with the largest drivers of this income coming from the secondary market mortgage area, which totaled $.298 million in the first quarter.
Noninterest expense, at $3.834 million in the first quarter of 2012, decreased $.225 million, or 5.54% from the first quarter of 2011. The Corporation continues to look for ways to control costs and remains below peer levels in terms of salary and benefits as a percentage of total assets residing at 1.58%.
Assets and Capital
Total assets of the Corporation at March 31, 2012 were $506.496 million, up 2.78 % from the $492.790 million reported at March 31, 2011 and up 1.64% from the $498.311 million of total assets at year-end 2011. Common Shareholders’ equity at March 31, 2011 totaled $45.119 million, or $13.19 per share, compared to $43.340 million, or $12.67 per share on March 31, 2011. The Corporation and the Bank are both “well-capitalized” with Tier 1 Capital at the Corporation of 9.95% and 9.24% at the Bank.
Paul D. Tobias, Chairman and Chief Executive Officer, concluded, “We are pleased with our first quarter operating results. Our loan production is picking up and our pipeline is strong, which will lead to increased net interest income in future periods. Our credit quality continues to improve and we expect increased noninterest revenue, mainly from SBA/USDA loan sales later this year.”
“Looking forward, we expect to complete our recently announced investment from the Steinhardt family and our common stock rights offering later in the second quarter. This will provide the funding necessary to eliminate our TARP preferred stock and the associated 379,310 common stock warrants which are substantially ‘in the money.’ This redemption and the access to the capital and the funding that accompanies an association with the Steinhardt’s will be significant catalysts in the execution of our long-term strategic plan for franchise growth and increasing shareholder value.”
2
Mackinac Financial Corporation is a registered bank holding company formed under the Bank Holding Company Act of 1956 with assets in excess of $500 million and whose common stock is traded on the NASDAQ stock market as “MFNC.” The principal subsidiary of the Corporation is mBank. Headquartered in Manistique, Michigan, mBank has 11 branch locations; seven in the Upper Peninsula, three in the Northern Lower Peninsula and one in Oakland County, Michigan. The Company’s banking services include commercial lending and treasury management products and services geared toward small to mid-sized businesses, as well as a full array of personal and business deposit products and consumer loans.
Forward-Looking Statements
This release contains certain forward-looking statements. Words such as “anticipates,” “believes,” “estimates,” “expects,” “intends,” “should,” “will,” and variations of such words and similar expressions are intended to identify forward-looking statements: as defined by the Private Securities Litigation Reform Act of 1995. These statements reflect management’s current beliefs as to expected outcomes of future events and are not guarantees of future performance. These statements involve certain risks, uncertainties and assumptions that are difficult to predict with regard to timing, extent, likelihood, and degree of occurrence. Therefore, actual results and outcomes may materially differ from what may be expressed or forecasted in such forward-looking statements. Factors that could cause a difference include among others: changes in the national and local economies or market conditions; changes in interest rates and banking regulations; the impact of competition from traditional or new sources; and the possibility that anticipated cost savings and revenue enhancements from mergers and acquisitions, bank consolidations, branch closings and other sources may not be fully realized at all or within specified time frames as well as other risks and uncertainties including but not limited to those detailed from time to time in filings of the Company with the Securities and Exchange Commission. These and other factors may cause decisions and actual results to differ materially from current expectations. Mackinac Financial Corporation undertakes no obligation to revise, update, or clarify forward-looking statements to reflect events or conditions after the date of this release.
3
MACKINAC FINANCIAL CORPORATION AND SUBSIDIARIES
SELECTED FINANCIAL HIGHLIGHTS
| (Dollars in thousands, except per share data) | March 31, 2012 |
December 31, 2011 |
March 31, 2011 |
|||||||||
| (Unaudited) | (Unaudited) | |||||||||||
| Selected Financial Condition Data (at end of period): |
||||||||||||
| Assets |
$ | 506,496 | $ | 498,311 | $ | 492,790 | ||||||
| Loans |
414,402 | 401,246 | 374,609 | |||||||||
| Investment securities |
36,788 | 38,727 | 37,543 | |||||||||
| Deposits |
412,088 | 404,789 | 400,783 | |||||||||
| Borrowings |
35,997 | 35,997 | 36,069 | |||||||||
| Common Shareholders’ Equity |
45,119 | 44,342 | 43,340 | |||||||||
| Shareholders’ equity |
56,095 | 55,263 | 54,097 | |||||||||
| Selected Statements of Income Data: |
||||||||||||
| Net interest income |
$ | 4,763 | $ | 17,929 | $ | 4,141 | ||||||
| Income before taxes and preferred dividend |
1,040 | 3,316 | 659 | |||||||||
| Net income |
496 | 1,452 | 256 | |||||||||
| Income per common share - Basic |
.15 | .42 | .07 | |||||||||
| Income per common share - Diluted |
.14 | .41 | .07 | |||||||||
| Weighted average shares outstanding |
3,419,736 | 3,419,736 | 3,419,736 | |||||||||
| Weighted average shares outstanding- Diluted |
3,524,953 | 3,500,204 | 3,419,736 | |||||||||
| Selected Financial Ratios and Other Data: |
||||||||||||
| Performance Ratios: |
||||||||||||
| Net interest margin |
4.17 | % | 4.06 | % | 3.92 | % | ||||||
| Efficiency ratio |
71.01 | 68.43 | 75.73 | |||||||||
| Return on average assets |
.40 | .30 | .22 | |||||||||
| Return on average common equity |
4.53 | 3.30 | 2.40 | |||||||||
| Return on average equity |
3.62 | 2.66 | 1.92 | |||||||||
| Average total assets |
$ | 503,412 | $ | 489,539 | $ | 478,861 | ||||||
| Average common shareholders’ equity |
44,229 | 43,940 | 43,147 | |||||||||
| Average total shareholders’ equity |
55,418 | 54,561 | 53,870 | |||||||||
| Average loans to average deposits ratio |
98.73 | % | 98.05 | % | 98.27 | % | ||||||
| Common Share Data at end of period: |
||||||||||||
| Market price per common share |
$ | 7.00 | $ | 5.42 | $ | 6.02 | ||||||
| Book value per common share |
$ | 13.19 | $ | 12.97 | $ | 12.67 | ||||||
| Common shares outstanding |
3,419,736 | 3,419,736 | 3,419,736 | |||||||||
| Other Data at end of period: |
||||||||||||
| Allowance for loan losses |
$ | 5,382 | $ | 5,251 | $ | 6,184 | ||||||
| Non-performing assets |
$ | 10,351 | $ | 11,155 | $ | 15,045 | ||||||
| Allowance for loan losses to total loans |
1.30 | % | 1.31 | % | 1.65 | % | ||||||
| Non-performing assets to total assets |
2.04 | % | 2.24 | % | 3.05 | % | ||||||
| Texas ratio |
16.84 | % | 18.43 | % | 24.96 | % | ||||||
| Number of: |
||||||||||||
| Branch locations |
11 | 11 | 11 | |||||||||
| FTE Employees |
114 | 116 | 108 | |||||||||
4
MACKINAC FINANCIAL CORPORATION AND SUBSIDIARIES
CONSOLIDATED BALANCE SHEETS
| March 31, 2012 |
December 31, 2011 |
March 31, 2011 |
||||||||||
| (Unaudited) | (Unaudited) | |||||||||||
| ASSETS |
||||||||||||
| Cash and due from banks |
$ | 16,912 | $ | 20,071 | $ | 41,715 | ||||||
| Federal funds sold |
14,000 | 13,999 | 12,000 | |||||||||
|
|
|
|
|
|
|
|||||||
| Cash and cash equivalents |
30,912 | 34,070 | 53,715 | |||||||||
| Interest-bearing deposits in other financial institutions |
10 | 10 | 734 | |||||||||
| Securities available for sale |
36,788 | 38,727 | 37,543 | |||||||||
| Federal Home Loan Bank stock |
3,060 | 3,060 | 3,423 | |||||||||
| Loans: |
||||||||||||
| Commercial |
318,810 | 311,215 | 287,760 | |||||||||
| Mortgage |
81,953 | 83,106 | 81,404 | |||||||||
| Consumer |
13,639 | 6,925 | 5,445 | |||||||||
|
|
|
|
|
|
|
|||||||
| Total Loans |
414,402 | 401,246 | 374,609 | |||||||||
| Allowance for loan losses |
(5,382 | ) | (5,251 | ) | (6,184 | ) | ||||||
|
|
|
|
|
|
|
|||||||
| Net loans |
409,020 | 395,995 | 368,425 | |||||||||
| Premises and equipment |
9,774 | 9,627 | 9,715 | |||||||||
| Other real estate held for sale |
3,494 | 3,162 | 5,081 | |||||||||
| Deferred Tax Asset |
7,958 | 8,427 | 8,773 | |||||||||
| Other assets |
5,480 | 5,233 | 5,381 | |||||||||
|
|
|
|
|
|
|
|||||||
| TOTAL ASSETS |
$ | 506,496 | $ | 498,311 | $ | 492,790 | ||||||
|
|
|
|
|
|
|
|||||||
| LIABILITIES AND SHAREHOLDERS’ EQUITY |
||||||||||||
| LIABILITIES: |
||||||||||||
| Deposits: |
||||||||||||
| Noninterest bearing deposits |
$ | 52,470 | $ | 51,273 | $ | 39,269 | ||||||
| NOW, money market, interest checking |
151,614 | 152,563 | 154,420 | |||||||||
| Savings |
13,601 | 14,203 | 17,691 | |||||||||
| CDs<$100,000 |
137,501 | 130,685 | 104,258 | |||||||||
| CDs>$100,000 |
24,066 | 23,229 | 21,803 | |||||||||
| Brokered |
32,836 | 32,836 | 63,342 | |||||||||
|
|
|
|
|
|
|
|||||||
| Total deposits |
412,088 | 404,789 | 400,783 | |||||||||
| Borrowings |
35,997 | 35,997 | 36,069 | |||||||||
| Other liabilities |
2,316 | 2,262 | 1,841 | |||||||||
|
|
|
|
|
|
|
|||||||
| Total liabilities |
450,401 | 443,048 | 438,693 | |||||||||
| SHAREHOLDERS’ EQUITY: |
||||||||||||
| Preferred stock - No par value: |
||||||||||||
| Authorized 500,000 shares, Issued and outstanding - 11,000 shares |
10,976 | 10,921 | 10,757 | |||||||||
| Common stock and additional paid in capital - No par value |
||||||||||||
| Authorized - 18,000,000 shares |
||||||||||||
| Issued and outstanding - 3,419,736 shares |
43,525 | 43,525 | 43,525 | |||||||||
| Retained earnings |
990 | 492 | (705 | ) | ||||||||
| Accumulated other comprehensive income |
604 | 325 | 520 | |||||||||
|
|
|
|
|
|
|
|||||||
| Total shareholders’ equity |
56,095 | 55,263 | 54,097 | |||||||||
|
|
|
|
|
|
|
|||||||
| TOTAL LIABILITIES AND SHAREHOLDERS’ EQUITY |
$ | 506,496 | $ | 498,311 | $ | 492,790 | ||||||
|
|
|
|
|
|
|
|||||||
5
MACKINAC FINANCIAL CORPORATION AND SUBSIDIARIES
CONSOLIDATED STATEMENTS OF OPERATIONS
| Three Months Ended March 31, |
||||||||
| 2012 | 2011 | |||||||
| (Unaudited) | ||||||||
| INTEREST INCOME: |
||||||||
| Interest and fees on loans: |
||||||||
| Taxable |
$ | 5,580 | $ | 5,136 | ||||
| Tax-exempt |
32 | 42 | ||||||
| Interest on securities: |
||||||||
| Taxable |
264 | 282 | ||||||
| Tax-exempt |
7 | 7 | ||||||
| Other interest income |
25 | 33 | ||||||
|
|
|
|
|
|||||
| Total interest income |
5,908 | 5,500 | ||||||
|
|
|
|
|
|||||
| INTEREST EXPENSE: |
||||||||
| Deposits |
983 | 1,219 | ||||||
| Borrowings |
162 | 140 | ||||||
|
|
|
|
|
|||||
| Total interest expense |
1,145 | 1,359 | ||||||
|
|
|
|
|
|||||
| Net interest income |
4,763 | 4,141 | ||||||
| Provision for loan losses |
495 | — | ||||||
|
|
|
|
|
|||||
| Net interest income after provision for loan losses |
4,268 | 4,141 | ||||||
|
|
|
|
|
|||||
| OTHER INCOME: |
||||||||
| Deposit service fees |
194 | 217 | ||||||
| Income from secondary market loans sold |
298 | 78 | ||||||
| SBA/USDA loan sale gains |
— | 236 | ||||||
| Mortgage servicing income |
85 | — | ||||||
| Other |
29 | 46 | ||||||
|
|
|
|
|
|||||
| Total other income |
606 | 577 | ||||||
|
|
|
|
|
|||||
| OTHER EXPENSE: |
||||||||
| Salaries and employee benefits |
1,975 | 1,824 | ||||||
| Occupancy |
345 | 365 | ||||||
| Furniture and equipment |
228 | 194 | ||||||
| Data processing |
228 | 176 | ||||||
| Professional service fees |
180 | 153 | ||||||
| Loan and deposit |
141 | 179 | ||||||
| Writedowns and losses on other real estate held for sale |
11 | 467 | ||||||
| FDIC insurance assessment |
159 | 285 | ||||||
| Telephone |
55 | 51 | ||||||
| Advertising |
98 | 88 | ||||||
| Other |
414 | 277 | ||||||
|
|
|
|
|
|||||
| Total other expenses |
3,834 | 4,059 | ||||||
|
|
|
|
|
|||||
| Income before provision for income taxes |
1,040 | 659 | ||||||
| Provision for income taxes |
349 | 214 | ||||||
|
|
|
|
|
|||||
| NET INCOME |
691 | 445 | ||||||
|
|
|
|
|
|||||
| Preferred dividend and accretion of discount |
193 | 189 | ||||||
|
|
|
|
|
|||||
| NET INCOME AVAILABLE TO COMMON SHAREHOLDERS |
$ | 498 | $ | 256 | ||||
|
|
|
|
|
|||||
| INCOME PER COMMON SHARE: |
||||||||
| Basic |
$ | .15 | $ | .07 | ||||
|
|
|
|
|
|||||
| Diluted |
$ | .14 | $ | .07 | ||||
|
|
|
|
|
|||||
6
MACKINAC FINANCIAL CORPORATION AND SUBSIDIARIES
LOAN PORTFOLIO AND CREDIT QUALITY
(Dollars in thousands)
Loan Portfolio Balances (at end of period):
| March 31, 2012 |
December 31, 2011 |
March 31, 2011 |
||||||||||
| (Unaudited) | (Unaudited) | (Audited) | ||||||||||
| Commercial Loans: |
||||||||||||
| Real estate - operators of nonresidential buildings |
$ | 78,769 | $ | 75,391 | $ | 58,132 | ||||||
| Hospitality and tourism |
33,452 | 33,306 | 35,016 | |||||||||
| Lessors of nonresidential buildings |
15,460 | 16,499 | 17,091 | |||||||||
| Real estate agents and managers |
13,296 | 10,617 | 15,518 | |||||||||
| Other |
155,717 | 155,657 | 138,565 | |||||||||
|
|
|
|
|
|
|
|||||||
| Total Commercial Loans |
296,694 | 291,470 | 264,322 | |||||||||
| 1-4 family residential real estate |
81,953 | 77,332 | 75,663 | |||||||||
| Consumer |
8,524 | 6,925 | 5,445 | |||||||||
| Construction |
||||||||||||
| Commercial |
22,116 | 19,745 | 23,438 | |||||||||
| Consumer |
5,115 | 5,774 | 5,741 | |||||||||
|
|
|
|
|
|
|
|||||||
| Total Loans |
$ | 414,402 | $ | 401,246 | $ | 374,609 | ||||||
|
|
|
|
|
|
|
|||||||
Credit Quality (at end of period):
| March 31, 2012 |
December 31, 2011 |
March 31, 2011 |
||||||||||
| (Unaudited) | (Unaudited) | (Unaudited) | ||||||||||
| Nonperforming Assets : |
||||||||||||
| Nonaccrual loans |
$ | 4,457 | $ | 5,490 | $ | 9,859 | ||||||
| Loans past due 90 days or more |
— | — | — | |||||||||
| Restructured loans |
2,400 | 2,503 | 105 | |||||||||
|
|
|
|
|
|
|
|||||||
| Total nonperforming loans |
6,857 | 7,993 | 9,964 | |||||||||
| Other real estate owned |
3,494 | 3,162 | 5,081 | |||||||||
|
|
|
|
|
|
|
|||||||
| Total nonperforming assets |
$ | 10,351 | $ | 11,155 | $ | 15,045 | ||||||
|
|
|
|
|
|
|
|||||||
| Nonperforming loans as a % of loans |
1.65 | % | 1.99 | % | 2.66 | % | ||||||
|
|
|
|
|
|
|
|||||||
| Nonperforming assets as a % of assets |
2.04 | % | 2.24 | % | 3.05 | % | ||||||
|
|
|
|
|
|
|
|||||||
| Reserve for Loan Losses: |
||||||||||||
| At period end |
$ | 5,382 | $ | 5,251 | $ | 6,184 | ||||||
|
|
|
|
|
|
|
|||||||
| As a % of average loans |
1.30 | % | 1.35 | % | 1.65 | % | ||||||
|
|
|
|
|
|
|
|||||||
| As a % of nonperforming loans |
78.49 | % | 65.69 | % | 62.06 | % | ||||||
|
|
|
|
|
|
|
|||||||
| As a % of nonaccrual loans |
120.75 | % | 95.65 | % | 62.72 | % | ||||||
|
|
|
|
|
|
|
|||||||
| Texas Ratio |
16.84 | % | 18.43 | % | 24.96 | % | ||||||
|
|
|
|
|
|
|
|||||||
| Charge-off Information (year to date): |
||||||||||||
| Average loans |
$ | 404,048 | $ | 388,115 | $ | 380,066 | ||||||
|
|
|
|
|
|
|
|||||||
| Net charge-offs |
$ | 364 | $ | 3,662 | $ | 429 | ||||||
|
|
|
|
|
|
|
|||||||
| Charge-offs as a % of average loans |
.10 | % | .94 | % | .11 | % | ||||||
|
|
|
|
|
|
|
|||||||
7
MACKINAC FINANCIAL CORPORATION AND SUBSIDIARIES
QUARTERLY FINANCIAL HIGHLIGHTS
| QUARTER ENDED | ||||||||||||||||||||
| (Unaudited) | ||||||||||||||||||||
| March 31, 2012 |
December 31, 2011 |
September 30, 2011 |
June 30, 2011 |
March 31, 2011 |
||||||||||||||||
| BALANCE SHEET (Dollars in thousands) |
||||||||||||||||||||
| Total loans |
$ | 414,402 | $ | 401,246 | $ | 391,903 | $ | 394,812 | $ | 374,609 | ||||||||||
| Allowance for loan losses |
(5,382 | ) | (5,251 | ) | (5,838 | ) | (6,155 | ) | (6,184 | ) | ||||||||||
|
|
|
|
|
|
|
|
|
|
|
|||||||||||
| Total loans, net |
409,020 | 395,995 | 386,065 | 388,657 | 368,425 | |||||||||||||||
| Intangible assets |
— | — | — | — | — | |||||||||||||||
| Total assets |
506,496 | 498,311 | 498,598 | 492,373 | 492,790 | |||||||||||||||
| Core deposits |
355,186 | 348,724 | 346,843 | 329,958 | 315,638 | |||||||||||||||
| Noncore deposits (1) |
56,902 | 56,065 | 58,215 | 69,709 | 85,145 | |||||||||||||||
|
|
|
|
|
|
|
|
|
|
|
|||||||||||
| Total deposits |
412,088 | 404,789 | 405,058 | 399,667 | 400,783 | |||||||||||||||
| Total borrowings |
35,997 | 35,997 | 35,997 | 36,069 | 36,069 | |||||||||||||||
| Common shareholders’ equity |
45,119 | 44,342 | 44,613 | 43,973 | 43,340 | |||||||||||||||
| Total shareholders’ equity |
56,095 | 55,263 | 55,479 | 54,784 | 54,097 | |||||||||||||||
| Total shares outstanding |
3,419,736 | 3,419,736 | 3,419,736 | 3,419,736 | 3,419,736 | |||||||||||||||
| AVERAGE BALANCES (Dollars in thousands) |
||||||||||||||||||||
| Assets |
$ | 503,412 | $ | 487,304 | $ | 497,333 | $ | 494,481 | $ | 478,861 | ||||||||||
| Loans |
404,048 | 396,197 | 397,665 | 378,250 | 380,066 | |||||||||||||||
| Deposits |
409,250 | 390,940 | 403,957 | 401,549 | 386,743 | |||||||||||||||
| Common Equity |
44,469 | 44,325 | 44,105 | 43,354 | 43,138 | |||||||||||||||
| Equity |
55,418 | 55,219 | 54,998 | 54,138 | 53,870 | |||||||||||||||
| INCOME STATEMENT (Dollars in thousands) |
||||||||||||||||||||
| Net interest income |
$ | 4,763 | $ | 4,901 | $ | 4,709 | $ | 4,178 | $ | 4,141 | ||||||||||
| Provision for loan losses |
495 | 1,300 | 400 | 600 | — | |||||||||||||||
|
|
|
|
|
|
|
|
|
|
|
|||||||||||
| Net interest income after provision |
4,268 | 3,601 | 4,309 | 3,578 | 4,141 | |||||||||||||||
| Total noninterest income |
606 | 725 | 1,006 | 1,348 | 577 | |||||||||||||||
| Total noninterest expense |
3,834 | 4,221 | 3,960 | 3,729 | 4,059 | |||||||||||||||
|
|
|
|
|
|
|
|
|
|
|
|||||||||||
| Income before taxes |
1,040 | 105 | 1,355 | 1,197 | 659 | |||||||||||||||
| Provision for income taxes |
349 | 27 | 455 | 402 | 214 | |||||||||||||||
|
|
|
|
|
|
|
|
|
|
|
|||||||||||
| Net income |
691 | 78 | 900 | 795 | 445 | |||||||||||||||
|
|
|
|
|
|
|
|
|
|
|
|||||||||||
| Preferred dividend expense |
193 | 192 | 193 | 192 | 189 | |||||||||||||||
|
|
|
|
|
|
|
|
|
|
|
|||||||||||
| Net income (loss) available to common shareholders |
$ | 498 | $ | (114 | ) | $ | 707 | $ | 603 | $ | 256 | |||||||||
|
|
|
|
|
|
|
|
|
|
|
|||||||||||
| PER SHARE DATA |
||||||||||||||||||||
| Earnings |
$ | .15 | $ | (.03 | ) | $ | .21 | $ | .18 | $ | .07 | |||||||||
| Book value per common share |
13.19 | 12.97 | 13.05 | 12.86 | 12.67 | |||||||||||||||
| Market value, closing price |
7.00 | 5.42 | 5.46 | 6.00 | 6.02 | |||||||||||||||
| ASSET QUALITY RATIOS |
||||||||||||||||||||
| Nonperforming loans/total loans |
1.65 | % | 1.99 | % | 2.47 | % | 2.39 | % | 2.66 | % | ||||||||||
| Nonperforming assets/total assets |
2.04 | 2.24 | 2.99 | 2.89 | 3.05 | |||||||||||||||
| Allowance for loan losses/total loans |
1.30 | 1.31 | 1.49 | 1.56 | 1.65 | |||||||||||||||
| Allowance for loan losses/nonperforming loans |
78.49 | 65.69 | 60.35 | 65.19 | 62.06 | |||||||||||||||
| Texas ratio (2) |
16.84 | 18.43 | 24.28 | 23.38 | 24.96 | |||||||||||||||
| PROFITABILITY RATIOS |
||||||||||||||||||||
| Return on average assets |
.40 | % | (.09 | ) % | .56 | % | .49 | % | .22 | % | ||||||||||
| Return on average common equity |
4.53 | (1.02 | ) | 6.35 | 5.58 | 2.40 | ||||||||||||||
| Return on average equity |
3.62 | (.82 | ) | 5.10 | 4.47 | 1.92 | ||||||||||||||
| Net interest margin |
4.17 | 4.38 | 4.14 | 3.79 | 3.92 | |||||||||||||||
| Efficiency ratio |
71.01 | 69.04 | 67.39 | 67.84 | 75.73 | |||||||||||||||
| Average loans/average deposits |
98.73 | 101.34 | 98.44 | 94.20 | 98.27 | |||||||||||||||
| CAPITAL ADEQUACY RATIOS |
||||||||||||||||||||
| Tier 1 leverage ratio |
9.95 | % | 10.08 | % | 9.73 | % | 9.50 | % | 9.70 | % | ||||||||||
| Tier 1 capital to risk weighted assets |
11.55 | 11.62 | 11.65 | 11.40 | 11.61 | |||||||||||||||
| Total capital to risk weighted assets |
12.80 | 12.87 | 12.97 | 12.66 | 12.86 | |||||||||||||||
| Average equity/average assets |
11.01 | 11.33 | 11.06 | 10.95 | 11.25 | |||||||||||||||
| Tangible equity/tangible assets |
11.01 | 11.33 | 11.06 | 10.95 | 11.25 | |||||||||||||||
| (1) | Noncore deposits includes Internet CDs, brokered deposits and CDs greater than $100,000 |
| (2) | Texas ratio equals nonperforming assets divided by shareholders' equity plus allowance for loan losses |
8
MACKINAC FINANCIAL CORPORATION AND SUBSIDIARIES
QUARTERLY FINANCIAL HIGHLIGHTS
9