Attached files
| file | filename |
|---|---|
| 8-K - FORM 8-K - QUAKER CHEMICAL CORP | v311271_8k.htm |
| EX-99.1 - EXHIBIT 99.1 - QUAKER CHEMICAL CORP | v311271_ex99-1.htm |
Quaker Chemical Corporation Investor Conference Call May 1, 2012
1 Regulation G The attached charts include Company information that does not conform to generally accepted accounting principles (GAAP). Management believes that an analysis of this data is meaningful to investors because it provides insight with respect to ongoing operating results of the Company and allows investors to better evaluate the financial results of the Company. These measures should not be viewed as an alternative to GAAP measures of performance. Furthermore, these measures may not be consiste nt with similar measures provided by other Companies. This data should be read in conjunction with the Company’s first quarter earnings news release dated April 30, 2012, which has been furnished to the SEC on Form 8-K, and the Company’s Form 10-Q for the quarterly period ended March 31, 2012, which has been filed with the SEC. Forward-Looking Statements This presentation may contain forward-looking statements that are subject to certain risks and uncertainties that could cause actual results to differ materially from those projected in such statements. A major risk is that the Company’s demand is largely derived from the demand for its customers’ products, which subjects the Company to downturns in a customer’s business and unanticipated customer production shutdowns. Other major risks and uncertainties include, but are not limited to, significant increases in raw material costs, customer financial stability, worldwide economic and political conditions, foreign currency fluctuations, and future terroris t attacks such as those that occurred on September 11, 2001. Other factors could also adversely affect us. Therefore, we caution you not to place undue reliance on our forward - looking statements. This discussion is provided as permitted by the Private Securities Litigation Reform Act of 1995. Risk and Uncertainties Statement

2 1st Quarter 2012 Results » Net Income up $1.3 million or 13% in 1Q 2012 vs. 1Q 2011 EPS of $0.91 equal with 1Q 2011, including $0.08 dilutive impact related to 2Q 2011 equity offering Favorable $0.12 and $0.11 diluted EPS impact due to uncertain tax position falloff in 1Q 2012 and 1Q 2011 » Sales of $177.6 million up 11% over 1Q 2011 Led by selling price and mix increases of 8% and higher volumes of 5%, including acquisitions » Gross profit up $7.1 million, or 13%, compared to 1Q 2011 Gross margin percentage higher than 4Q 2011 and 1Q 2011 due to 2011 selling price increases implemented to restore margins » SG&A % of sales of 24.3% consistent with 1Q 2011 and below 4Q 2011 » $6.7 million of operating cash flow in 1Q 2012 vs. ($7.1) million outflow in 1Q 2012 » Leverage ratio remains a strong 0.6 X at March 31, 2012, consistent with year end 2011

3 Outlook Short - term » Global economic environment remains mixed Sluggish global economy, especially in Europe and China Raw material cost escalation toward end of 1Q 2012 and continuing in 2Q 2012 Continued recovery of manufacturing in North America and additional new business » Price increases planned to be implemented, but lag effect will impact margins » Growth through recent acquisitions and other strategic initiatives Longer - term » Continued growth in emerging markets and continued recovery of developed markets » Continued leveraging of product line adjacencies across our global platform

4 Product Volume by Quarter 25,000 30,000 35,000 40,000 45,000 50,000 55,000 4Q08 YTD Avg. 1Q09 2Q09 3Q09 4Q09 1Q10 2Q10 3Q10 4Q10 1Q11 2Q11 3Q11 4Q11 1Q12 Metalworking Process Chemicals Segment Volume increases from 4Q 2011 to 1Q 2012 Chart 1
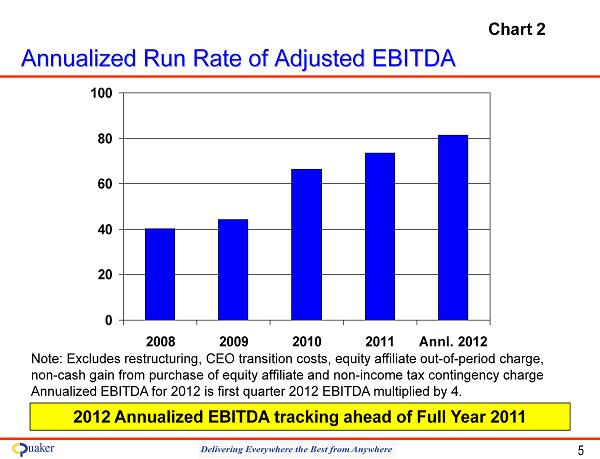
5 Annualized Run Rate of Adjusted EBITDA 2012 Annualized EBITDA tracking ahead of Full Year 2011 Note: Excludes restructuring, CEO transition costs, equity affiliate out - of - period charge, non - cash gain from purchase of equity affiliate and non - income tax contingency charge Annualized EBITDA for 2012 is first quarter 2012 EBITDA multiplied by 4. 0 20 40 60 80 100 2008 2009 2010 2011 Annl. 2012 Chart 2

6 NA Steel Market Data Chart 3

7 Summary » Significant increases in quarterly sales and net income over Q1 2011, with equity offering dilution impacting year - over - year EPS comparison » 1Q 2012 and 1Q 2011 include $0.12 and $0.11 diluted EPS of tax benefits related to falloff of uncertain tax provisions » Gross margin showed improvement compared to 1Q 2011 and 4Q 2011 due to 2011 price increases, but rising raw material costs toward the end of 1Q 2012 indicate potential lag impact on margins » SG&A as a percentage of sales improved almost 2 percentage points from 4Q 2011 and consistent with 1Q 2011 » Balance sheet and liquidity continue to be strong » Positioned for good growth over next several years in both emerging and mature markets

8 Reconciliation of Annualized Run Rate of Adjusted EBITDA 2008 2009 2010 2011 Q1 2012 Net income attributable to Quaker Chemical Corporation 11,132 16,220 31,807 43,569 11,946 Add / (subtract): Depreciation 10,879 9,525 9,867 11,455 3,057 Amortization 1,177 1,078 988 2,338 746 Interest expense 5,509 5,533 5,225 4,666 1,174 Taxes on income 4,977 7,065 12,616 14,256 3,445 Restructuring and related activities 2,916 2,289 - - - Non-income tax contingency charge - - 4,132 - - Mexico out-of-period charge - - 564 - - CEO transition costs 3,505 2,443 1,317 - Non-cash gain from purchase of equity affiliate - - - (2,718) - Adjusted EBITDA 40,095 44,153 66,516 73,566 20,368 Multiply by Annual Run Rate 1 1 1 1 4 Annualized Run Rate of Adjusted EBITDA 40,095 44,153 66,516 73,566 81,472