Attached files
| file | filename |
|---|---|
| 8-K - COVER PAGE - WESCO INTERNATIONAL INC | form8-kcoverpagex03312012p.htm |
| EX-99.1 - EARNINGS RELEASE - WESCO INTERNATIONAL INC | wcc-03312012x8kpressrelease.htm |

Supplemental Financial Data WESCO First Quarter 2012 April 19, 2012

2 Safe Harbor Statement Note: All statements made herein that are not historical facts should be considered as “forward- looking statements” within the meaning of the Private Securities Litigation Act of 1995. Such statements involve known and unknown risks, uncertainties and other factors that may cause actual results to differ materially. Such risks, uncertainties and other factors include, but are not limited to, debt level, changes in general economic conditions, fluctuations in interest rates, increases in raw materials and labor costs, levels of competition and other factors described in detail in Form 10-K for WESCO International, Inc. for the year ended December 31, 2011 and any subsequent filings with the Securities & Exchange Commission. Any numerical or other representations in this presentation do not represent guidance by management and should not be construed as such. The following presentation may also include a discussion of certain non- GAAP financial measures. Information required by Regulation G with respect to such non-GAAP financial measures can be obtained via WESCO’s website, www.wesco.com.

3 First Quarter 2012 Results Category Q1 2012 Outlook Provided Q1 2012 Performance Sales Growth Total sales growth expected to be 7% to 11%. Q1 organic sales growth rate expected to be 6% to 9%. Acquired sales expected to add approximately 2% to sales growth. Total sales growth of 12.2%; Reported organic sales growth rate of 9.8%; Normalized sales per workday organic growth of approximately 8.2%; Acquisition sales impact of 2.6%; Seventh consecutive quarter of double digit sales growth year-over- year. Gross Margin Gross margin expected to be at or above 20.0% Gross margin of 19.9% Operating Margin Operating margin expected to be at or above 5.0% Operating margin of 5.2% Effective Tax Rate Effective tax rate expected to be approximately 30% to 32% Effective tax rate of 29.0%

4 Organic Sales Versus Prior Year * Q4 2011 had one less workday versus Q4 2010. ** FY 2011 had one less workday versus FY 2010. *** Q1 2012 had one more workday versus Q1 2011 and Q1 2010. ------------------------2010------------------------ ------------------------2011------------------------ -----2012----- Q1 Q2 Q3 Q4 Full Year Q1 Q2 Q3 Q4* Full Year** Q1*** Consolidated Sales Growth (2.6%) 8.6% 14.9% 17.6% 9.5% 24.6% 21.1% 19.3% 19.4% 21.0% 12.2% F/X (1.8%) (1.9%) (0.9%) (0.7%) (1.3%) (1.1%) (1.0%) (1.1%) 0% (0.8%) 0.2% Acquisitions 0 0 (0.7%) (1.1%) (0.4%) (7.0%) (7.4%) (6.9%) (6.2%) (6.8%) (2.6%) Organic Sales Growth (4.4%) 6.7% 13.3% 15.8% 7.8% 16.5% 12.7% 11.3% 13.2% 13.4% 9.8% Workday Impact - - - - - - - - (1.6%) (0.4%) 1.6% Organic Sales Per Workday (4.4%) 6.7% 13.3% 15.8% 7.8% 16.5% 12.7% 11.3% 14.8% 13.8% 8.2% Management Estimated Price Impact 1.5% 3.0% 2.5% 3.0% 2.5% 3.5% 3.0% 3.5% 2.0% 3.0% 1.5%
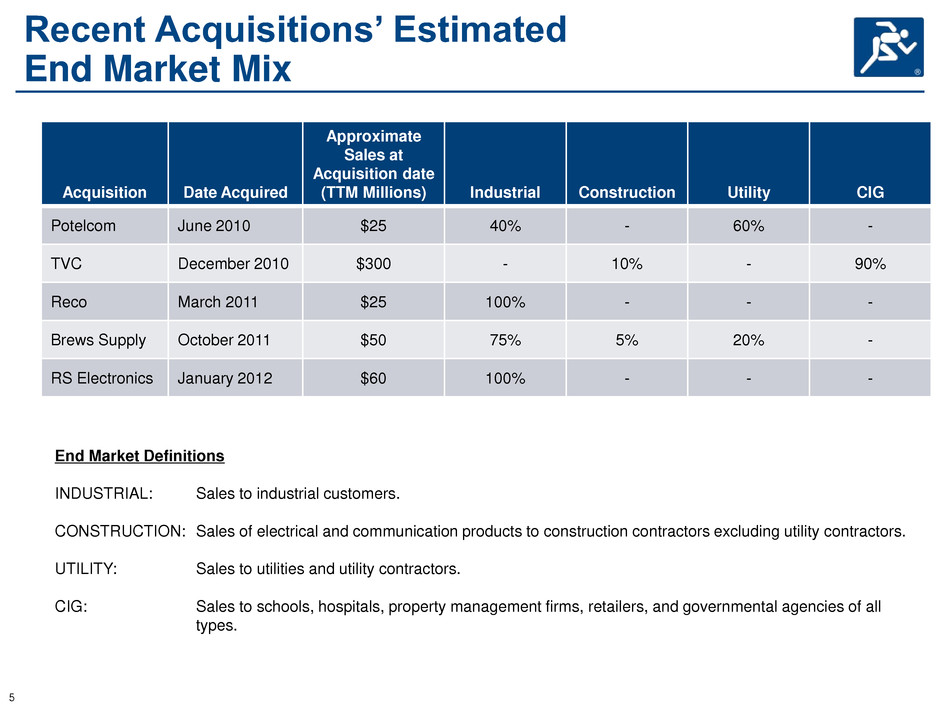
5 Recent Acquisitions’ Estimated End Market Mix Acquisition Date Acquired Approximate Sales at Acquisition date (TTM Millions) Industrial Construction Utility CIG Potelcom June 2010 $25 40% - 60% - TVC December 2010 $300 - 10% - 90% Reco March 2011 $25 100% - - - Brews Supply October 2011 $50 75% 5% 20% - RS Electronics January 2012 $60 100% - - - End Market Definitions INDUSTRIAL: Sales to industrial customers. CONSTRUCTION: Sales of electrical and communication products to construction contractors excluding utility contractors. UTILITY: Sales to utilities and utility contractors. CIG: Sales to schools, hospitals, property management firms, retailers, and governmental agencies of all types.
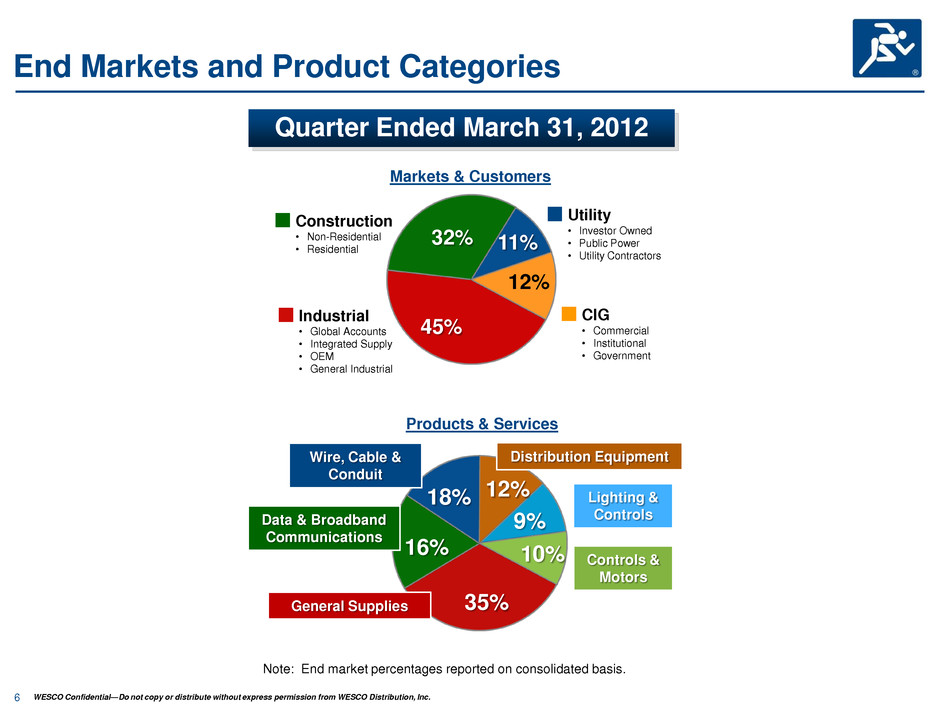
6 WESCO Confidential—Do not copy or distribute without express permission from WESCO Distribution, Inc. End Markets and Product Categories Quarter Ended March 31, 2012 45% 32% 11% 12% Markets & Customers 35% 16% 18% 12% 9% 10% Products & Services Controls & Motors Lighting & Controls General Supplies Data & Broadband Communications Wire, Cable & Conduit Distribution Equipment Utility • Investor Owned • Public Power • Utility Contractors CIG • Commercial • Institutional • Government Industrial • Global Accounts • Integrated Supply • OEM • General Industrial Construction • Non-Residential • Residential Note: End market percentages reported on consolidated basis.
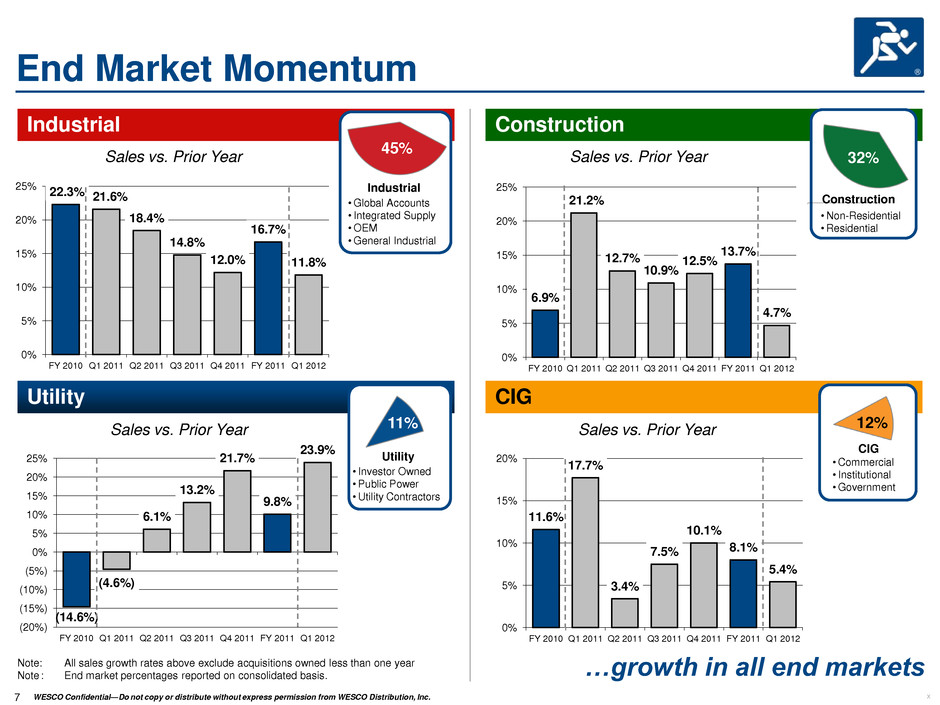
7 WESCO Confidential—Do not copy or distribute without express permission from WESCO Distribution, Inc. x Construction 6.9% 21.2% 12.7% 10.9% 12.5% 13.7% 4.7% 0% 5% 10% 15% 20% 25% FY 2010 Q1 2011 Q2 2011 Q3 2011 Q4 2011 FY 2011 Q1 2012 CIG 22.3% 21.6% 18.4% 14.8% 12.0% 16.7% 11.8% 0% 5% 10% 15% 20% 25% FY 2010 Q1 2011 Q2 2011 Q3 2011 Q4 2011 FY 2011 Q1 2012 Utility Industrial 11.6% 17.7% 3.4% 7.5% 10.1% 8.1% 5.4% 0% 5% 10% 15% 20% FY 2010 Q1 2011 Q2 2011 Q3 2011 Q4 2011 FY 2011 Q1 2012 (14.6%) (4.6%) 6.1% 13.2% 21.7% 9.8% 23.9% (20%) (15%) (10%) (5%) 0% 5% 10% 15% 20% 25% FY 2010 Q1 2011 Q2 2011 Q3 2011 Q4 2011 FY 2011 Q1 2012 End Market Momentum Sales vs. Prior Year Sales vs. Prior Year Sales vs. Prior Year Sales vs. Prior Year Note: All sales growth rates above exclude acquisitions owned less than one year Note : End market percentages reported on consolidated basis. …growth in all end markets 45% Industrial • Global Accounts • Integrated Supply •OEM •General Industrial CIG 11% Utility • Investor Owned •Public Power •Utility Contractors •Commercial • Institutional •Government 12% Construction •Non-Residential •Residential 32%
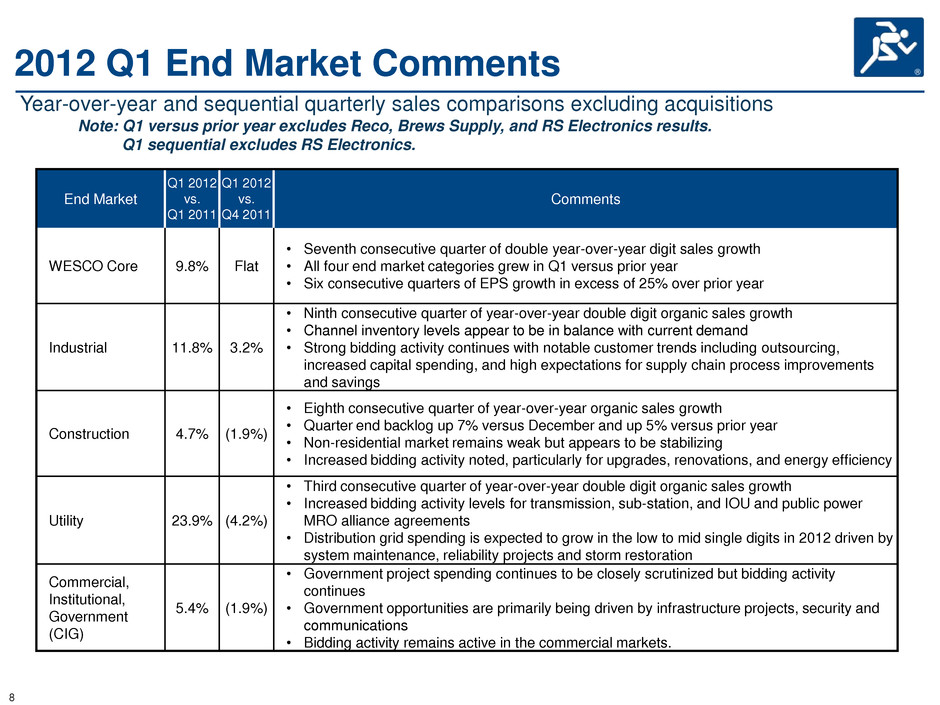
8 End Market Q1 2012 vs. Q1 2011 Q1 2012 vs. Q4 2011 Comments WESCO Core 9.8% Flat • Seventh consecutive quarter of double year-over-year digit sales growth • All four end market categories grew in Q1 versus prior year • Six consecutive quarters of EPS growth in excess of 25% over prior year Industrial 11.8% 3.2% • Ninth consecutive quarter of year-over-year double digit organic sales growth • Channel inventory levels appear to be in balance with current demand • Strong bidding activity continues with notable customer trends including outsourcing, increased capital spending, and high expectations for supply chain process improvements and savings Construction 4.7% (1.9%) • Eighth consecutive quarter of year-over-year organic sales growth • Quarter end backlog up 7% versus December and up 5% versus prior year • Non-residential market remains weak but appears to be stabilizing • Increased bidding activity noted, particularly for upgrades, renovations, and energy efficiency Utility 23.9% (4.2%) • Third consecutive quarter of year-over-year double digit organic sales growth • Increased bidding activity levels for transmission, sub-station, and IOU and public power MRO alliance agreements • Distribution grid spending is expected to grow in the low to mid single digits in 2012 driven by system maintenance, reliability projects and storm restoration Commercial, Institutional, Government (CIG) 5.4% (1.9%) • Government project spending continues to be closely scrutinized but bidding activity continues • Government opportunities are primarily being driven by infrastructure projects, security and communications • Bidding activity remains active in the commercial markets. 2012 Q1 End Market Comments Year-over-year and sequential quarterly sales comparisons excluding acquisitions . Note: Q1 versus prior year excludes Reco, Brews Supply, and RS Electronics results. Q1 sequential excludes RS Electronics.

9 Core Sales Reconciliation of Non-GAAP Financial Measures Unaudited Note: Q1 versus prior year excludes Reco, Brews Supply, and RS Electronics results. Q1 sequential excludes RS Electronics. (dollar amounts in millions) Full Year 2011 vs 2010 Q1 2012 vs. Q1 2011 Q1 2012 vs. Q4 2011 Q1 Q1 Q1 Q4 2011 2010 % Growth 2012 2011 % Growth 2012 2011 % Growth Industrial Core $ 2,632 $ 2,256 16.7 % $ 688 $ 615 11.8 % $ 703 $ 681 3.2 % Construction Core 2,097 1,845 13.7 % 510 487 4.7 % 511 521 (1.9 %) Utility Core 683 622 9.8 % 177 143 23.9 % 180 188 (4.2 %) CIG Core 388 359 8.1 % 200 190 5.4 % 201 205 (1.9 %) Total Core Gross Sales $ 5,800 $ 5,082 14.1 % $ 1,574 $ 1,435 9.8 % $ 1,595 $ 1,595 0.0 % Total Gross Sales from Acquisitions 347 - - 37 1 - 16 - - Total Gross Sales $ 6,174 $ 5,082 21.0 % $ 1,611 $ 1,436 12.2 % $ 1,611 $ 1,595 1.0 % Gross Sales Reductions/Discounts (21) (18) (5) (5) - (5) (5) - Total Net Sales $ 6,126 $ 5,064 21.0 % $ 1,606 $ 1,431 12.2 % $ 1,606 $ 1,590 1.0 %

10 Key Financial Metrics 12/31/2011 3/31/2012 Liquidity(2) $511 million $572 million 2011 Full Year & 2012 YTD Free Cash Flow(3) $134 million $54 million Financial Leverage (Par Value Debt with Reported EBITDA) 2.3x 2.1x ($Millions) Outstanding at December 31, 2011 Outstanding at March 31, 2012 Debt Maturity Schedule AR Securitization (V) $250 $240 2014 Inventory Revolver (V) $37 $6 2016 Real Estate Mortgage (F) $37 $37 2013 2017 Bonds (F) $150 $150 2017 2029 Convertible Bonds (F) (1) $345 $345 2029 Other (F) $6 $16 N/A Total Debt $825 $794 Capital Structure V= Variable Rate Debt F= Fixed Rate Debt 1= Convertible bonds – No Put 2= Asset-backed credit facilities total available plus invested cash 3= Operating cash flow less capital expenditures

11 Quarterly Financial Leverage Target Leverage 2.0x – 3.5x 2.1x 1.5 2.0 2.5 3.0 3.5 4.0 4.5 5.0 Q 4 0 7 Q 1 0 8 Q 2 0 8 Q 3 0 8 Q 4 0 8 Q 1 0 9 Q 2 0 9 Q 3 0 9 Q 4 0 9 Q 1 1 0 Q 2 1 0 Q 3 1 0 Q 4 1 0 Q 1 1 1 Q 2 1 1 Q 3 1 1 Q 4 1 1 Q 1 1 2
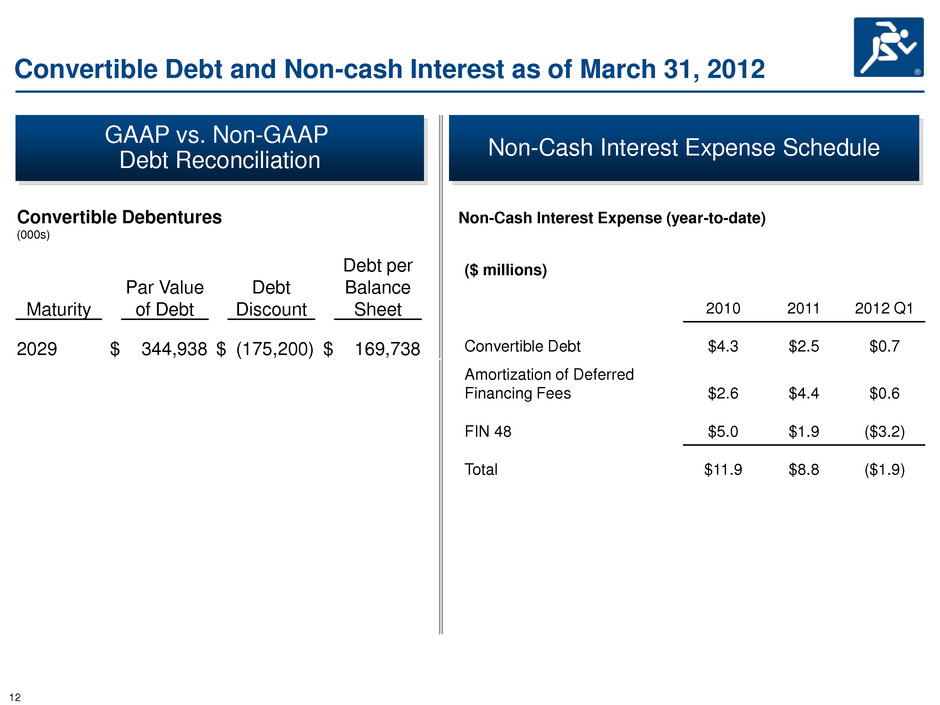
12 Convertible Debt and Non-cash Interest as of March 31, 2012 GAAP vs. Non-GAAP Debt Reconciliation Non-Cash Interest Expense Schedule Convertible Debentures (000s) Maturity Par Value of Debt Debt Discount Debt per Balance Sheet 2029 $ 344,938 $ (175,200) $ 169,738 Non-Cash Interest Expense (year-to-date) ($ millions) 2010 2011 2012 Q1 Convertible Debt $4.3 $2.5 $0.7 Amortization of Deferred Financing Fees $2.6 $4.4 $0.6 FIN 48 $5.0 $1.9 ($3.2) Total $11.9 $8.8 ($1.9)
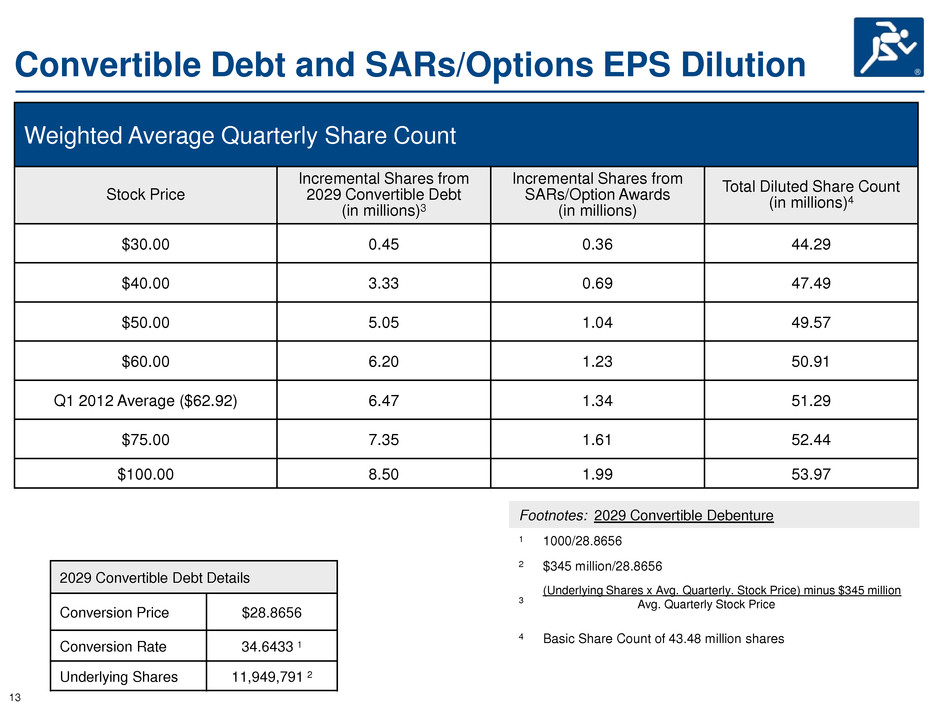
13 Convertible Debt and SARs/Options EPS Dilution Weighted Average Quarterly Share Count Stock Price Incremental Shares from 2029 Convertible Debt (in millions)3 Incremental Shares from SARs/Option Awards (in millions) Total Diluted Share Count (in millions)4 $30.00 0.45 0.36 44.29 $40.00 3.33 0.69 47.49 $50.00 5.05 1.04 49.57 $60.00 6.20 1.23 50.91 Q1 2012 Average ($62.92) 6.47 1.34 51.29 $75.00 7.35 1.61 52.44 $100.00 8.50 1.99 53.97 2029 Convertible Debt Details Conversion Price $28.8656 Conversion Rate 34.6433 1 Underlying Shares 11,949,791 2 Footnotes: 2029 Convertible Debenture 1 1000/28.8656 2 $345 million/28.8656 3 (Underlying Shares x Avg. Quarterly. Stock Price) minus $345 million Avg. Quarterly Stock Price 4 Basic Share Count of 43.48 million shares

14 Number of Work Days by Quarter Q1 Q2 Q3 Q4 FY 2010 63 64 64 64 255 2011 63 64 64 63 254 2012 64 64 63 63(1) 255 (1) Note: Updated to reflect 63 versus 64 days.
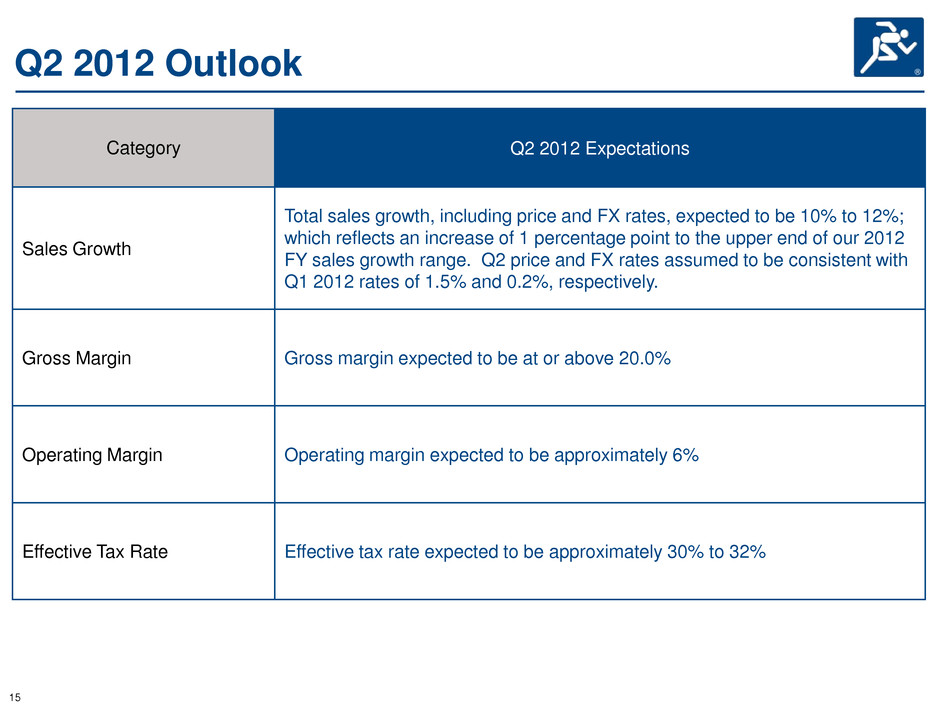
15 Q2 2012 Outlook Category Q2 2012 Expectations Sales Growth Total sales growth, including price and FX rates, expected to be 10% to 12%; which reflects an increase of 1 percentage point to the upper end of our 2012 FY sales growth range. Q2 price and FX rates assumed to be consistent with Q1 2012 rates of 1.5% and 0.2%, respectively. Gross Margin Gross margin expected to be at or above 20.0% Operating Margin Operating margin expected to be approximately 6% Effective Tax Rate Effective tax rate expected to be approximately 30% to 32%
