Attached files
| file | filename |
|---|---|
| EX-32.2 - EXHIBIT 32.2 - WESCO INTERNATIONAL INC | wcc2017ex-322.htm |
| EX-32.1 - EXHIBIT 32.1 - WESCO INTERNATIONAL INC | wcc2017ex-321.htm |
| EX-31.2 - EXHIBIT 31.2 - WESCO INTERNATIONAL INC | wcc2017ex-312.htm |
| EX-31.1 - EXHIBIT 31.1 - WESCO INTERNATIONAL INC | wcc2017ex-311.htm |
| EX-23.1 - EXHIBIT 23.1 - WESCO INTERNATIONAL INC | wcc2017ex-231.htm |
| EX-21.1 - EXHIBIT 21.1 - WESCO INTERNATIONAL INC | wcc2017ex-211.htm |
| EX-10.28 - EXHIBIT 10.28 - WESCO INTERNATIONAL INC | wcc2017ex1028minicozzite.htm |
| EX-10.26 - EXHIBIT 10.26 - WESCO INTERNATIONAL INC | wccex1026formofnoticeofpsu.htm |
| EX-10.25 - EXHIBIT 10.25 - WESCO INTERNATIONAL INC | wccex1025employeesarsagree.htm |
| EX-10.24 - EXHIBIT 10.24 - WESCO INTERNATIONAL INC | wccex1024employeersuagreem.htm |
| EX-10.23 - EXHIBIT 10.23 - WESCO INTERNATIONAL INC | wccex1023nonemployeersuagr.htm |
| EX-10.22 - EXHIBIT 10.22 - WESCO INTERNATIONAL INC | wccex1022sixthamendmentto4.htm |
UNITED STATES SECURITIES AND EXCHANGE COMMISSION
WASHINGTON, D.C. 20549
FORM 10-K
(Mark One)
þ | ANNUAL REPORT PURSUANT TO SECTION 13 OR 15(d) OF THE SECURITIES EXCHANGE ACT OF 1934 | |
For the fiscal year ended December 31, 2017 | ||
or
o | TRANSITION REPORT PURSUANT TO SECTION 13 OR 15(d) OF THE SECURITIES EXCHANGE ACT OF 1934 | |
For the transition period from to | ||
Commission file number 001-14989
WESCO International, Inc.
(Exact name of registrant as specified in its charter)
Delaware (State or other jurisdiction of incorporation or organization) | 25-1723342 (I.R.S. Employer Identification No.) | |
225 West Station Square Drive Suite 700 Pittsburgh, Pennsylvania (Address of principal executive offices) | 15219 (Zip Code) | |
(412) 454-2200
(Registrant’s telephone number, including area code)
SECURITIES REGISTERED PURSUANT TO SECTION 12(b) OF THE ACT:
Title of Class | Name of Exchange on which registered | |
Common Stock, par value $.01 per share | New York Stock Exchange | |
SECURITIES REGISTERED PURSUANT TO SECTION 12(g) OF THE ACT: None
Indicate by check mark if the registrant is a well-known seasoned issuer, as defined in Rule 405 of the Securities Act. Yes þ No o
Indicate by check mark if the registrant is not required to file reports pursuant to Section 13 or 15(d) of the Act. Yes o No þ
Indicate by check mark whether the registrant (1) has filed all reports required to be filed by Section 13 or 15(d) of the Securities Exchange Act of 1934 during the preceding 12 months (or for such shorter period that the registrant was required to file such reports), and (2) has been subject to such filing requirements for at least the past 90 days. Yes þ No o
Indicate by check mark if disclosure of delinquent filers pursuant to Item 405 of Regulation S-K is not contained herein, and will not be contained, to the best of registrant’s knowledge, in definitive proxy or information statements incorporated by reference in Part III of this Form 10-K or any amendment to this Form 10-K. þ
Indicate by check mark whether the registrant has submitted electronically and posted on its corporate Web site, if any, every Interactive Data File required to be submitted and posted pursuant to Rule 405 of Regulation S-T during the preceding 12 months (or for such shorter period that the registrant was required to submit and post such file). Yes þ No o
Indicate by check mark whether the registrant is a large accelerated filer, an accelerated filer, a non-accelerated filer, a smaller reporting company, or emerging growth company. See the definitions of “large accelerated filer,” “accelerated filer,” “smaller reporting company,” and "emerging growth company" in Rule 12b-2 of the Exchange Act. (Check one):
Large accelerated filer þ | Accelerated filer o | |||
Non-accelerated filer o | (Do not check if a smaller reporting company) | Smaller reporting company o | ||
Emerging growth company o | ||||
If an emerging growth company, indicate by check mark if the registrant has elected not to use the extended transition period for complying with any new or revised financial accounting standards provided pursuant to Section 13(a) of the Ex-change Act. o
Indicate by check mark whether the registrant is a shell company (as defined in Rule 12b-2 of the Act). Yes o No þ
The registrant estimates that the aggregate market value of the voting shares held by non-affiliates of the registrant was approximately $2.7 billion as of June 30, 2017, the last business day of the registrant’s most recently completed second fiscal quarter, based on the closing price on the New York Stock Exchange for such stock.
As of February 20, 2018, 47,056,716 shares of Common Stock, par value $.01 per share, of the registrant were outstanding.
DOCUMENTS INCORPORATED BY REFERENCE:
Part III of this Form 10-K incorporates by reference portions of the registrant’s Proxy Statement for its 2018 Annual Meeting of Stockholders.
TABLE OF CONTENTS
Page | |
PART I
Item 1. Business.
In this Annual Report on Form 10-K, “WESCO” refers to WESCO International, Inc., and its subsidiaries and its predecessors unless the context otherwise requires. References to “we,” “us,” “our” and the “Company” refer to WESCO and its subsidiaries.
The Company
WESCO International, Inc. (“WESCO International”), incorporated in 1993 and effectively formed in February 1994 upon acquiring a distribution business from Westinghouse Electric Corporation, is a leading North American-based distributor of products and provider of advanced supply chain management and logistics services used primarily in industrial, construction, utility, and commercial, institutional and government (“CIG”) markets. We are a leading provider of electrical, industrial, and communications maintenance, repair and operating ("MRO") and original equipment manufacturer ("OEM") products, construction materials, and advanced supply chain management and logistics services. Our primary product categories include general supplies, wire, cable and conduit, communications and security, electrical distribution and controls, lighting and sustainability, and automation, controls and motors.
We serve approximately 70,000 active customers globally through approximately 500 branches primarily located in North America, with operations in 15 additional countries and 10 distribution centers located in the United States and Canada. The Company employs approximately 9,100 employees worldwide. We distribute over 1,000,000 products, grouped into six categories, from more than 26,000 suppliers, utilizing a highly automated, proprietary electronic procurement and inventory replenishment system.
In addition, we offer a comprehensive portfolio of value-added capabilities, which includes supply chain management, logistics and transportation, procurement, warehousing and inventory management, as well as kitting, limited assembly of products and system installation. Our value-added capabilities, extensive geographic reach, experienced workforce and broad product and supply chain solutions have enabled us to grow our business and establish a leading position in North America.
Industry Overview
We operate in highly fragmented markets that include thousands of small regional and locally based, privately owned competitors. According to one industry publication, in 2017, the latest year for which market data is available, the five largest full-line electrical distributors in North America, including WESCO, accounted for approximately 33% of an estimated $100 billion-plus of electrical sales in North America. Our global account, integrated supply and OEM programs provide customers with regional, national, North American and global supply chain consolidation opportunities. The demand for these programs is driven primarily by the desire of companies to reduce operating expenses by outsourcing operational and administrative functions associated with the procurement, management and utilization of MRO supplies and OEM components. We believe that opportunities exist for expansion of these programs. The total potential in the United States for purchases of MRO and OEM supplies and services across all industrial distribution market segments and channels is estimated to be nearly $800 billion per a combination of industry sources.
According to various industry sources, electrical distribution industry sales have grown low-single-digits on average over the past three years, despite a low-single-digit decline in 2016. Growth in recent years has been driven by new products, technologies and applications. It is estimated that approximately 75% of electrical products sold in the United States are delivered to the end user through the distribution channel.
1
Markets and Customers
We have a large base of approximately 70,000 active customers across a diverse set of end markets. Our top ten customers accounted for approximately 17% of our sales in 2017. No one customer accounted for more than 4% of our sales in 2017.
The following table outlines our sales breakdown by end market:
Year Ended December 31, | 2017 | 2016 | 2015 | ||
(percentages based on total sales) | |||||
Industrial | 37% | 36% | 39% | ||
Construction | 33% | 34% | 32% | ||
Utility | 16% | 16% | 15% | ||
Commercial, Institutional and Government | 14% | 14% | 14% | ||
Industrial. Sales to industrial customers of MRO, OEM, and construction products and services accounted for approximately 37% of our sales in 2017, compared to 36% in 2016. Industrial sales product categories include a broad range of electrical equipment and supplies as well as lubricants, pipe, valves, fittings, fasteners, cutting tools, power transmission, and safety products. In addition, OEM customers require a reliable supply of assemblies and components to incorporate into their own products as well as value-added services such as supplier consolidation, design and technical support, just-in-time supply and electronic commerce, and supply chain management.
Construction. Sales of electrical and communications products to contractors accounted for approximately 33% of our sales in 2017, compared to 34% in 2016. Customers include a wide array of contractors and engineering, procurement and construction firms for industrial, infrastructure, commercial and data and broadband communications projects. Specific applications include projects for refineries, railways, wastewater treatment facilities, data centers, security installations, offices, and modular and mobile homes. In addition to a wide array of electrical products, we offer contractors communications products for projects related to IT/network modernization, physical security upgrades, broadband deployments, network security, and disaster recovery.
Utility. Sales to utilities and utility contractors accounted for approximately 16% of our sales in 2017 and 2016. Customers include large investor-owned utilities, rural electric cooperatives, municipal power authorities and contractors that serve these customers. We provide our utility customers with products and services to support the construction and maintenance of their generation, transmission and distribution systems along with an extensive range of products that meet their power plant MRO and capital projects needs. Materials management and procurement outsourcing arrangements are also important in this market, as cost pressures and deregulation have caused utility customers to seek improvements in the efficiency and effectiveness of their supply chains.
Commercial, Institutional and Government. Sales to CIG customers accounted for approximately 14% of our sales in 2017 and 2016. Customers include schools, hospitals, property management firms, retailers and federal, state and local government agencies of all types, including federal contractors.
Business Strategy
Our goal is to grow organically at a rate greater than that of our industry while making accretive acquisitions. Our organic growth strategy focuses on enhancing our sales, technical expertise and customer service capabilities to acquire new customers and increase our sales to current customers, broaden our product and service offerings and expand our geographic footprint. We utilize LEAN continuous improvement initiatives on a company-wide basis to deliver operational excellence and improve productivity. We also extend our LEAN initiatives to customers to improve the efficiency and effectiveness of their operations and supply chains. In addition, we seek to develop a distinct competitive advantage through talent management and employee development processes and programs.
We have identified certain growth engines that we believe provide substantial opportunities for above-market growth, and have developed strategies to address each of these areas of opportunity. These growth engines are a combination of business models, selected end markets and product categories, as discussed below.
Grow Our Global Account Customer Relationships and Base. Our typical global account customer is a large, multi-location industrial or commercial company, a large utility, a major contractor, or a government or institutional customer. Our global account program is designed to provide customers with supply chain management services and cost reductions by coordinating and standardizing activity for MRO materials and OEM direct materials across their multiple locations, utilizing our broad geographic footprint and our largely integrated information technology platform. Comprehensive account plans are developed and managed at the local, national and international levels to prioritize activities, identify key performance measures, and track progress against
2
objectives. We involve our preferred suppliers early in the implementation process to contribute expertise and product knowledge to accelerate program implementation and deliver cost savings and process improvements.
Through our growth initiatives, we plan to continue to expand the suite of products and services we offer to current customer sites, while increasing our reach to serve additional customer locations. We plan on expanding our customer base by capitalizing on our industry expertise and supply chain optimization capabilities.
Extend Our Position in Integrated Supply Programs. Our integrated supply programs focus on optimizing the supply chain and replacing the traditional multi-vendor, resource-intensive procurement process with a single, outsourced, automated process. Each integrated supply program employs our product and distribution expertise to reduce the number of suppliers, total procurement costs, and administrative expenses, while meeting the customers’ service needs and improving their operating controls. We believe that large customers will seek to utilize such services to consolidate and simplify their MRO and OEM supply chains.
We are expanding our position in North America as an integrated supply service provider by building upon established relationships within our large customer base and premier supplier network, and extending our services to additional customers and locations around the world. Our services are offered across all four of our end markets.
Expand Our Relationships with Construction Contractors. We support new construction, renovation and retrofit projects across a wide variety of vertical markets, including manufacturing, healthcare, education, enterprise data communications, telecommunications, energy and government infrastructure. We believe that significant cross selling opportunities exist for our electrical and communications products and expertise, and we are utilizing our global account and integrated supply programs, LEAN initiatives and project management expertise to capitalize on new non-residential construction opportunities.
Expand Products and Services for Utilities. Our investor-owned, public power and utility contractor customers continue to focus on improving grid reliability and operating efficiency, while reducing costs. As a result, we anticipate opportunities from distribution grid improvement and transmission expansion projects as well as the continued adoption of integrated supply programs. Accordingly, we are focused on expanding our logistical and project services and supply chain management programs to increase our scope of supply on the distribution grid, generation and other energy projects, including alternative energy projects.
Grow Industrial MRO and Safety Sales. Our sales of industrial MRO materials include a broad range of electrical and non-electrical products used in the ongoing maintenance and repair of equipment used in production processes. These products are also used for facility upkeep in manufacturing, commercial, institutional, and other operations. In addition, through acquisitions, we have expanded our safety products, personal protection safety equipment, first aid supplies, and OSHA compliance categories to complement the industrial MRO product lines.
Expand International Operations. We seek to capitalize on existing and emerging international market opportunities through the expansion of our global product and service platforms. We follow large existing global customers into international markets, extending our procurement outsourcing, integrated supply programs and supplier relationships. Once established, we also seek to develop new business opportunities in these markets. We believe this strategy of working with well-developed customer and supplier relationships significantly reduces risk and provides the opportunity to establish profitable business. Our priorities are focused on global vertical markets including energy, mining and metals, manufacturing, and infrastructure, as well as key product categories such as communications and security.
Grow Our Communications Products Position. Over the last several years, there has been a convergence of electrical and data communications contractors. Our ability to provide both electrical and communications products and services as well as automation, electromechanical, non-electrical MRO, physical security and utility products has presented cross selling opportunities across WESCO. Communications products are in continual demand due to network upgrades, low voltage security investments, data center upgrades and increasing broadband and telecommunications usage.
Grow Lighting System and Sustainability Sales. Lighting applications are undergoing significant innovation, driven by energy efficiency and sustainability trends. We have expanded our sales team and marketing initiatives and increased our presence and customer base with recent acquisitions. We expect to continue to add product and service offerings to provide lighting and energy-saving solutions.
Pursue Strategic Acquisitions. Since 2010, we have made fourteen acquisitions that have helped us broaden and strengthen our product and services portfolio, increase our customer base, and provide an important source of talent.
We believe that the highly fragmented nature of the electrical and industrial distribution industry will continue to provide acquisition opportunities.
Drive Operational Excellence. LEAN continuous improvement is a set of company-wide strategic initiatives to increase efficiency and effectiveness across the entire business enterprise, including sales, operations and administrative processes. The basic principles behind LEAN are to systematically identify and implement improvements through simplification, elimination of waste and reduction in errors. We apply LEAN in our distribution environment, and develop and deploy numerous initiatives through the Kaizen approach targeting improvements in sales, margin, warehouse operations, transportation, purchasing, working
3
capital management and administrative processes. Our objective is to continue to implement LEAN initiatives across our business enterprise and to extend LEAN services to our customers and suppliers.
Manage Our Talent. We seek to develop a distinct competitive advantage through talent management and employee engagement and development. We believe our ability to attract, develop and retain diverse human capital is imperative to ongoing business success. We improve workforce capability through various programs and processes that identify, recruit, develop and promote our talent base. Significant enhancements in these programs have been made over the last several years, and we expect to continue to refine and enhance these programs in the future.
Products and Services
Products
Our network of branches and distribution centers stock approximately 230,000 unique product stock keeping units and we provide customers with access to more than 1,000,000 different products. Each branch tailors its inventory to meet the needs of its local customers.
Representative product categories and associated product lines that we offer include:
• | General Supplies. Wiring devices, fuses, terminals, connectors, boxes, enclosures, fittings, lugs, terminations, wrap, splicing and marking equipment, tools and testers, safety, personal protection, sealants, cutting tools, adhesives, consumables, fasteners, janitorial and other MRO supplies; |
• | Wire, Cable and Conduit. Wire, cable, raceway, metallic and non-metallic conduit; |
• | Communications and Security. Structured cabling systems, broadband products, low voltage specialty systems, specialty wire and cable products, equipment racks and cabinets, access control, alarms, cameras, paging and voice solutions; |
• | Electrical Distribution and Controls. Circuit breakers, transformers, switchboards, panel boards, metering products and busway products; |
• | Lighting and Sustainability. Lamps, fixtures, ballasts and lighting control products, and |
• | Automation, Controls and Motors. Motor control devices, drives, surge and power protection, relays, timers, pushbuttons, operator interfaces, switches, sensors, and interconnects. |
The following table sets forth sales information by product category:
Year Ended December 31, | 2017 | 2016 | 2015 | ||
(percentages based on total sales) | |||||
General Supplies | 40% | 40% | 40% | ||
Wire, Cable and Conduit | 15% | 14% | 15% | ||
Communications and Security | 15% | 15% | 15% | ||
Electrical Distribution and Controls | 10% | 11% | 11% | ||
Lighting and Sustainability | 12% | 12% | 10% | ||
Automation, Controls and Motors | 8% | 8% | 9% | ||
We purchase products from a diverse group of more than 26,000 suppliers. In 2017, our ten largest suppliers accounted for approximately 33% of our purchases. Our largest supplier in 2017 was Eaton Corporation, accounting for approximately 11% of our purchases. No other supplier accounted for more than 4% of our total purchases.
Our supplier relationships are important to us, providing access to a wide range of products, services, technical training, and sales and marketing support. We have approximately 300 commercial agreements with more than 200 preferred suppliers and purchase nearly 60% of our products pursuant to these arrangements. Consistent with industry practice, most of our agreements with suppliers, including both distribution agreements and commercial agreements, are terminable by either party on 60 days notice or less.
4
Services
As part of our overall offering, we provide customers a comprehensive portfolio of value-added solutions within a wide range of service categories including construction, e-commerce, energy and sustainability, engineering services, production support, safety and security, supply chain optimization, training, and working capital. These solutions are designed to address our customers' business needs through:
• | Technical advisory strategies, including product lifecycle management and migration planning; |
• | Supply chain and inventory optimization programs, including just-in-time delivery and vendor managed inventory; |
• | Consultation on production and operational efficiencies from cross-functional, cost saving teams; |
• | Transactional process improvements utilizing a suite of e-commerce solutions; |
• | Operational safety and product training for customer's employees, and |
• | Dedicated on-site support personnel. |
Competitive Strengths
As a leading electrical distributor in a highly fragmented North American market, we compete directly with global, national, regional, and local distributors of electrical and other industrial supplies, along with buying groups formed by smaller distributors. Competition is generally based on product line breadth, product availability, service capabilities and price. We believe that our market leadership, broad product offering, value-added services, technical expertise, extensive distribution network and low-cost operator status provide distinct competitive advantages.
Market Leadership. Our ability to manage complex global supply chains, and multi-site facility maintenance programs and construction projects, which require special sourcing, technical advice, logistical support and locally based service, has enabled us to establish a strong presence in the competitive and fragmented North American electrical distribution market.
Broad Product Offering and Value-added Services. We provide a wide range of products, services, and procurement solutions, which draw on our product knowledge, supply and logistics expertise, system capabilities and supplier relationships to enable our customers to maximize productivity, minimize waste, improve efficiencies, reduce costs and enhance safety. Our broad product offering and stable source of supply enables us to consistently meet customers’ wide-ranging capital project, MRO and OEM requirements.
Extensive Distribution Network. We operate approximately 500 geographically dispersed branch locations and ten distribution centers (six in the United States and four in Canada). Our distribution centers add value for our customers, suppliers, and branches through the combination of a broad and deep selection of inventory, online ordering and next-day shipment capabilities, and central order handling and fulfillment. Our distribution center network reduces the lead time and cost of supply chain activities through its automated replenishment and warehouse management system, and provides economies of scale in purchasing, inventory management, administration and transportation. This extensive network, which would be difficult and expensive to replicate, allows us to:
• | Enhance local customer service, technical support and sales coverage; |
• | Tailor individual branch products and services to local customer needs, and |
• | Offer multi-site distribution capabilities to large customers and global accounts. |
Low-Cost Operator. Our competitiveness has been enhanced by our consistent favorable operating cost position, which is based on the use of LEAN, strategically-located distribution centers, and purchasing economies of scale. As a result of these and other factors, we believe our operating costs as a percentage of sales has historically been one of the lowest in our industry. Our selling, general and administrative expenses as a percentage of revenues for 2017 were 14.3%.
5
Geography
Our network of branches and distribution centers are located primarily in North America. We attribute revenues from external customers to individual countries on the basis of the point of sale. The following table sets forth information about us by geographic area:
Net Sales Year Ended December 31, | Long-Lived Assets December 31, | |||||||||||||||||||||||||||||||
2017 | 2016 | 2015 | 2017 | 2016 | 2015 | |||||||||||||||||||||||||||
(In thousands) | ||||||||||||||||||||||||||||||||
United States | $ | 5,775,988 | 75 | % | $ | 5,635,803 | 77 | % | $ | 5,665,962 | 75 | % | $ | 95,851 | $ | 123,465 | $ | 157,570 | ||||||||||||||
Canada | 1,521,378 | 20 | % | 1,394,657 | 19 | % | 1,533,705 | 21 | % | 56,591 | 60,372 | 63,088 | ||||||||||||||||||||
Mexico | 77,280 | 1 | % | 62,430 | 1 | % | 70,048 | 1 | % | 262 | 227 | 332 | ||||||||||||||||||||
Subtotal North American Operations | 7,374,646 | 7,092,890 | 7,269,715 | 152,704 | 184,064 | 220,990 | ||||||||||||||||||||||||||
Other International | 304,375 | 4 | % | 243,127 | 3 | % | 248,772 | 3 | % | 3,741 | 4,583 | 5,369 | ||||||||||||||||||||
Total | $ | 7,679,021 | $ | 7,336,017 | $ | 7,518,487 | $ | 156,445 | $ | 188,647 | $ | 226,359 | ||||||||||||||||||||
United States. To serve our customers in the United States, we operate a network of approximately 340 branches supported by six distribution centers located in Arkansas, Mississippi, Nevada, Pennsylvania, Texas and Wisconsin. Sales in the United States represented approximately 75% of our total sales in 2017. According to an industry source, the U.S. electrical wholesale distribution industry had estimated sales of nearly $100 billion in 2017.
Canada. To serve our Canadian customers, we operate a network of approximately 130 branches in nine provinces. Branch operations are supported by four distribution centers located in Alberta, British Columbia, Ontario and Quebec. Sales in Canada represented approximately 20% of our total sales in 2017. Total annual electrical industry sales in Canada were more than $13 billion in 2017, according to an industry source.
Mexico. We have seven branch locations in Mexico that provide various supply chain services to a broad range of end markets. Our headquarters is near Mexico City. Sales in Mexico represented approximately 1% of our total sales in 2017.
Other International. We sell to global customers through export sales offices located in Calgary, Houston, Miami, Montreal and Pittsburgh within North America and sales offices and branch operations in various international locations. Sales from other international locations represented approximately 4% of our total sales in 2017. Our branches in Aberdeen, Scotland, Dublin, Ireland and Manchester, England support sales efforts in Europe and the Middle East. We have branches in Singapore and Thailand to support our sales in Asia and a branch near Shanghai to serve customers in China. Furthermore, we support sales in South America through our branches in Chile, Ecuador and Peru, and we have operations in six additional countries. Many of our international locations have been established to serve our growing list of customers with global operations.
Intellectual Property
We currently have trademarks, patents and service marks registered with the U.S. Patent and Trademark Office and Canadian Intellectual Property Office. The trademarks and service marks registered in the U.S. include: “WESCO®”, our corporate logo and the running man logo. The Company's "EECOL" trademark is registered in Canada. In addition, trademarks, patents, and service mark applications have been filed in various foreign jurisdictions, including Argentina, Australia, Brazil, Chile, Colombia, Costa Rica, Canada, Chile, China, the European Community, Egypt, Hong Kong, India, Indonesia, Japan, Korea, Malaysia, Mexico, New Zealand, Norway, Panama, Peru, Philippines, Russia, Singapore, South Africa, Switzerland, Taiwan, Thailand, United Arab Emirates, United Kingdom, Venezuela, and Vietnam.
Environmental Matters
Our facilities and operations are subject to federal, state and local laws and regulations relating to environmental protection and human health and safety. Some of these laws and regulations may impose strict, joint and several liabilities on certain persons for the cost of investigation or remediation of contaminated properties. These persons may include former, current or future owners or operators of properties and persons who arranged for the disposal of hazardous substances. Our owned and leased real property may give rise to such investigation, remediation and monitoring liabilities under environmental laws. In addition, anyone disposing of certain products we distribute, such as ballasts, fluorescent lighting and batteries, must comply with environmental laws that regulate certain materials in these products.
We believe that we are in compliance, in all material respects, with applicable environmental laws. As a result, we do not anticipate making significant capital expenditures for environmental control matters either in the current year or in the near future.
6
Seasonality
Sales during the first quarter are affected by a reduced level of activity. Sales during the second, third and fourth quarters are generally 6 - 8% higher than the first quarter. Sales typically increase beginning in March, with slight fluctuations per month through October. During periods of economic expansion or contraction, our sales by quarter have varied significantly from this seasonal pattern.
Website Access
Our Internet address is www.wesco.com. Information contained on our website is not part of, and should not be construed as being incorporated by reference into, this Annual Report on Form 10-K. We make available free of charge under the “Investors” heading on our website our annual reports on Form 10-K, quarterly reports on Form 10-Q, current reports on Form 8-K and amendments to those reports filed or furnished pursuant to Section 13(a) or 15(d) of the Securities Exchange Act of 1934, as amended (the “Exchange Act”), as well as our Proxy Statements, as soon as reasonably practicable after such documents are electronically filed or furnished, as applicable, with the Securities and Exchange Commission (the “SEC”). You also may read and copy any materials we file with the SEC at the SEC’s Public Reference Room at 100 F Street, NE, Washington, DC 20549-0213. You may obtain information on the operation of the Public Reference Room by calling the SEC at 1-800-SEC-0330. The SEC maintains an Internet site at www.sec.gov that contains reports, proxy and information statements and other information regarding issuers like us who file electronically with the SEC.
In addition, our charters for our Executive Committee, Nominating and Governance Committee, Audit Committee and Compensation Committee, as well as our Corporate Governance Guidelines, Code of Principles for Senior Executives, Independence Policy, Global Anti-Corruption Policy, and Code of Business Ethics and Conduct for our Directors, officers and employees, are all available on our website in the “Corporate Governance” link under the “Investors” heading.
Forward-Looking Information
This Annual Report on Form 10-K contains various “forward-looking statements” within the meaning of the Private Securities Litigation Reform Act of 1995. These statements involve certain unknown risks and uncertainties, including, among others, those contained in Item 1, “Business,” Item 1A, “Risk Factors,” and Item 7, “Management’s Discussion and Analysis of Financial Condition and Results of Operations.” When used in this Annual Report on Form 10-K, the words “anticipates,” “plans,” “believes,” “estimates,” “intends,” “expects,” “projects,” “will” and similar expressions may identify forward-looking statements, although not all forward-looking statements contain such words. Such statements, including, but not limited to, our statements regarding business strategy, growth strategy, competitive strengths, productivity and profitability enhancement, competition, new product and service introductions and liquidity and capital resources, are based on management’s beliefs, as well as on assumptions made by and information currently available to management, and involve various risks and uncertainties, some of which are beyond our control. Our actual results could differ materially from those expressed in any forward-looking statement made by us or on our behalf. In light of these risks and uncertainties, there can be no assurance that the forward-looking information will in fact prove to be accurate. We have undertaken no obligation to publicly update or revise any forward-looking statements, whether as a result of new information, future events or otherwise.
7
Executive Officers
Our executive officers and their respective ages and positions as of February 21, 2018, are set forth below.
Name | Age | Position | ||
John J. Engel | 56 | Chairman, President and Chief Executive Officer | ||
Diane E. Lazzaris | 51 | Senior Vice President and General Counsel | ||
Robert Minicozzi | 56 | Vice President and Chief Information Officer | ||
David S. Schulz | 52 | Senior Vice President and Chief Financial Officer | ||
Kimberly G. Windrow | 60 | Senior Vice President and Chief Human Resources Officer | ||
Set forth below is biographical information for our executive officers listed above.
John J. Engel was elected as Chairman of the Board at the 2011 Annual Meeting and has served as President and Chief Executive Officer since 2009. Previously, Mr. Engel served as our Senior Vice President and Chief Operating Officer from 2004 to 2009. Before joining WESCO in 2004, Mr. Engel served as Senior Vice President and General Manager of Gateway, Inc., Executive Vice President and Senior Vice President of Perkin Elmer, Inc., Vice President and General Manager of Allied Signal, Inc., and various engineering, manufacturing and general management positions at General Electric Company.
Diane E. Lazzaris has served as our Senior Vice President and General Counsel since January 2014, and from 2010 to December 2013 she served as our Vice President, Legal Affairs. From 2008 to 2010, Ms. Lazzaris served as Senior Vice President - Legal, General Counsel and Corporate Secretary of Dick’s Sporting Goods, Inc. From 1994 to 2008, she held various corporate counsel positions at Alcoa Inc., including Group Counsel to a group of global businesses.
Robert Minicozzi has served as our Vice President and Chief Information Officer since January 2016. From April 2012 to December 2015, Mr. Minicozzi served as Vice President and Global Divisional Chief Information Officer of Arrow Electronics, Inc. and previously held various information systems leadership positions with Arrow Electronics, Inc.
David S. Schulz has served as our Senior Vice President and Chief Financial Officer since October 2016. From April 2016 to October 2016, he served as Senior Vice President and Chief Operating Officer of Armstrong Flooring, Inc. From November 2013 to March 2016, he served as Senior Vice President and Chief Financial Officer of Armstrong World Industries, Inc., and as Vice President, Finance of the Armstrong Building Products division from 2011 to November 2013. Prior to joining Armstrong World Industries in 2011, he held various financial leadership roles with Procter & Gamble and The J.M. Smucker Company. Mr. Schulz began his career as an officer in the United States Marine Corps.
Kimberly G. Windrow has served as our Senior Vice President and Chief Human Resources Officer since January 2014, and from August 2010 to December 2013 she served as our Vice President, Human Resources. From 2004 until 2010, Ms. Windrow served as Senior Vice President of Human Resources for The McGraw Hill Companies in the education segment. From 2001 until 2004, she served as Senior Vice President of Human Resources for The MONY Group, and from 1988 until 2000, she served in various Human Resource positions at Willis, Inc.
8
Item 1A. Risk Factors.
The following factors, among others, could cause our actual results to differ materially from the forward-looking statements we make. All forward-looking statements attributable to us or persons working on our behalf are expressly qualified by the following factors. This information should be read in conjunction with Item 7, Management’s Discussion and Analysis of Financial Condition and Results of Operations, Item 7A, Quantitative and Qualitative Disclosures about Market Risks and the consolidated financial statements and related notes included in this Form 10-K.
Operational Risk Factors
Adverse conditions in the global economy and disruptions of financial markets could negatively impact our results of operations, cash flows or financial position.
Our results of operations are affected by the level of business activity of our customers, which in turn is affected by global economic conditions and market factors impacting the industries and markets that they serve. Certain global economies and markets continue to experience significant uncertainty and volatility, particularly commodity-driven end markets such as oil and gas and metals and mining. Adverse economic conditions or lack of liquidity in these markets, particularly in North America, may adversely affect our revenues and operating results. Economic and financial market conditions may also affect the availability of financing for projects and for our customers' capital or other expenditures, which can result in project delays or cancellations and thus affect demand for our products. There can be no assurance that any governmental responses to economic conditions or disruptions in the financial markets ultimately will stabilize the markets or increase our customers' liquidity or the availability of credit to our customers. Should one or more of our larger customers declare bankruptcy, it could adversely affect the collectability of our accounts receivable, along with bad debt reserves and net income. In addition, our ability to access the capital markets may be restricted at a time when we would like, or need, to do so. The economic, political and financial environment also may affect our business and financial condition in ways that we currently cannot predict, and there can be no assurance that economic, political and market conditions will not adversely affect our results of operations, cash flows or financial position in the future.
Certain events or conditions, including a failure or breach of our information security systems, could lead to interruptions in our operations, which may materially adversely affect our business operations, financial condition, and results of operations.
We operate a number of facilities and we coordinate company activities, including information technology systems and administrative services and the like, through our headquarters operations. Our operations depend on our ability to maintain existing systems and implement new technology, which includes allocating sufficient resources to periodically upgrade our information technology systems, and to protect our equipment and the information stored in our databases against both manmade and natural disasters, as well as power losses, computer and telecommunications failures, technological breakdowns, unauthorized intrusions, cyber-attacks, and other events. Conversions to new information technology systems may result in cost overruns, delays or business interruptions. If our information technology systems are disrupted, become obsolete or do not adequately support our strategic, operational or compliance needs, it could result in a competitive disadvantage and adversely affect our business operations and financial condition, including our ability to process orders, receive and ship products, maintain inventories, collect accounts receivable and pay expenses, therefore impacting our results of operations.
Because we rely heavily on information technology both in serving our customers and in our enterprise infrastructure in order to achieve our objectives, we may be vulnerable to damage or intrusion from a variety of cyber-attacks, including computer viruses, worms or other malicious software programs that access our systems. Despite the precautions we take to mitigate the risks of such events, an attack on our enterprise information technology system could result in theft or disclosure of our proprietary or confidential information or a breach of confidential customer, supplier or employee information. Such events could have an adverse impact on revenue and harm our reputation. Additionally, such an event could cause us to incur legal liabilities and costs, which could be significant, in order to address and remediate the effects of an attack and related security concerns.
We also depend on accessible office facilities, distribution centers and information technology data centers for our operations to function properly. An interruption of operations at any of our distribution centers could have a material adverse effect on the operations of branches served by the affected distribution center. Such disaster related risks and effects are not predictable with certainty and, although they typically can be mitigated, they cannot be eliminated. We seek to mitigate our exposures to disaster events in a number of ways. For example, where feasible, we design the configuration of our facilities to reduce the consequences of disasters. We also maintain insurance for our facilities against casualties, and we evaluate our risks and develop contingency plans for dealing with them. Although we have reviewed and analyzed a broad range of risks applicable to our business, the ones that actually affect us may not be those that we have concluded are most likely to occur. Furthermore, although our reviews have led to more systematic contingency planning, our plans are in varying stages of development and execution, such that they may not be adequate at the time of occurrence for the magnitude of any particular disaster event that we may encounter.
9
An increase in competition could decrease sales, profit margins, and earnings.
We operate in a highly competitive industry and compete directly with global, national, regional and local providers of like products and services. Some of our existing competitors have, and new market entrants may have, greater resources than us. Competition is generally based on product line breadth, product availability, service capabilities and price. Other sources of competition are buying groups formed by smaller distributors to increase purchasing power and provide some cooperative marketing capability, as well as e-commerce companies. There may be new market entrants with non-traditional business and customer service models, resulting in increased competition and changing industry dynamics.
Existing or future competitors may seek to gain or retain market share by reducing prices, and we may be required to lower our prices or may lose business, which could adversely affect our financial results. Also, to the extent that we do not meet changing customer preferences or demands, or to the extent that one or more of our competitors becomes more successful with private label products, on-line offerings or otherwise, our ability to attract and retain customers could be materially adversely affected. Existing or future competitors also may seek to compete with us for acquisitions, which could have the effect of increasing the price and reducing the number of suitable acquisitions. These factors, in addition to competitive pressures resulting from the fragmented nature of our industry, could affect our sales, profit margins and earnings.
Expansion into new business activities, industries, product lines or geographic areas could subject the company to increased costs and risks and may not achieve the intended results.
We have invested significantly in expanding our e-commerce capabilities and online customer experience. If our efforts to expand our capabilities in this area are not successful, we may not realize the return on our investments as anticipated, or our operating results could be adversely affected by slower than expected sales growth or additional costs. Furthermore, engaging in or significantly expanding business activities in product sourcing, sales and services could subject the company to unexpected costs and risks. Such activities could subject us to increased operating costs, product liability, regulatory requirements and reputational risks. Our expansion into new and existing markets, including manufacturing related or regulated businesses, may present competitive distribution and regulatory challenges that differ from current ones. We may be less familiar with the target customers and may face different or additional risks, as well as increased or unexpected costs, compared to existing operations. Growth into new markets may also bring us into direct competition with companies with whom we have little or no past experience as competitors. To the extent we are reliant upon expansion into new geographic, industry and product markets for growth and do not meet the new challenges posed by such expansion, our future sales growth could be negatively impacted, our operating costs could increase, and our business operations and financial results could be negatively affected.
Loss of key suppliers, product cost fluctuations, lack of product availability, or inefficient supply chain operations could decrease sales, profit margins, and earnings.
Most of our agreements with suppliers are terminable by either party on 60 days' notice or less. Our 10 largest suppliers in 2017 accounted for approximately 33% of our purchases for the period. Our largest supplier in 2017 was Eaton Corporation, accounting for approximately 11% of our purchases. The loss of, or a substantial decrease in the availability of, products from any of these suppliers, a supplier's change in sales strategy to rely less on distribution channels, the loss of key preferred supplier agreements, or disruptions in a key supplier's operations could have a material adverse effect on our business. Supply interruptions could arise from shortages of raw materials, effects of economic, political or financial market conditions on a supplier's operations, labor disputes or weather conditions affecting products or shipments, transportation disruptions, information system disruptions or other reasons beyond our control.
In addition, certain of our products, such as wire and conduit, are commodity price based products and may be subject to significant price fluctuations which are beyond our control. While increases in the cost of energy or products could have adverse effects, decreases in those costs, particularly if severe, could also adversely impact us by creating deflation in selling prices, which could cause our gross profit margin to deteriorate. Fluctuations in energy or raw materials costs can also adversely affect our customers. Declines in oil and gas prices can negatively impact our customers operating in those industries and, consequently, our sales to those customers. Furthermore, we cannot be certain that particular products or product lines will be available to us, or available in quantities sufficient to meet customer demand. Such limited product access could cause us to be at a competitive disadvantage. The profitability of our business is also dependent upon the efficiency of our supply chain. An inefficient or ineffective supply chain strategy or operations could increase operational costs, decrease sales, profit margins and earnings, which could adversely affect our business.
We must attract, retain and motivate key employees, and the failure to do so may adversely affect our business.
Our success depends on hiring, retaining and motivating key employees, including executive, managerial, sales, technical, marketing and support personnel. We may have difficulty locating and hiring qualified personnel. In addition, we may have difficulty retaining such personnel once hired, and key people may leave and compete against us. The loss of key personnel or
10
our failure to attract and retain other qualified and experienced personnel could disrupt or adversely affect our business, its sales and operating results. In addition, our operating results could be adversely affected by increased costs due to increased competition for employees, higher employee turnover, which may also result in loss of significant customer business, or increased employee benefit costs.
Acquisitions that we may undertake would involve a number of inherent risks, any of which could cause us not to realize the benefits anticipated to result.
We have expanded our operations through organic growth and selected acquisitions of businesses and assets, and may seek to do so in the future. Acquisitions involve various inherent risks, including: problems that could arise from the integration of the acquired business; uncertainties in assessing the value, strengths, weaknesses, contingent and other liabilities and potential profitability of acquisition candidates; the potential loss of key employees of an acquired business; the ability to achieve identified operating and financial synergies anticipated to result from an acquisition or other transaction; unanticipated changes in business, industry or general economic conditions that affect the assumptions underlying the acquisition or other transaction rationale; and expansion into new countries or geographic markets where we may be less familiar with operating requirements, target customers and regulatory compliance. Any one or more of these factors could increase our costs or cause us not to realize the benefits anticipated to result from the acquisition of a business or assets.
While there are risks associated with acquisitions generally, including integration risks, there are additional risks more specifically associated with owning and operating businesses internationally, including those arising from import and export controls, foreign currency exchange rate changes, material developments in political, regulatory or economic conditions impacting those operations and various environmental and climatic conditions in particular areas of the world.
Financial Risk Factors
Changes in tax laws or challenges to the Company's tax positions by taxing authorities could adversely impact the Company's results of operations and financial condition.
We are subject to taxes in jurisdictions in which we do business, including but not limited to taxes imposed on our income, receipts, stockholders' equity, property, sales, purchases and payroll. As a result, the tax expense we incur can be adversely affected by changes in tax law. We frequently cannot anticipate these changes in tax law, which can cause unexpected volatility in our results of operations. While not limited to the United States (U.S.) and Canada, changes in the tax law at the federal and state/provincial levels in the United States and Canada can have a materially adverse effect on our results of operations.
Additionally, the tax laws to which the Company is subject are inherently complex and ambiguous. Therefore, we must interpret the applicable laws and make subjective judgments about the expected outcome upon challenge by the applicable taxing authorities. As a result, the impact on our results from operations of the application of enacted tax laws to our facts and circumstances is frequently uncertain. If a tax authority successfully challenges our interpretation and application of the tax law to our facts and circumstances, there can be no assurance that we can accurately predict the outcome and the taxes ultimately owed upon effective settlement, which may differ from the tax expense recognized in our consolidated statements of income and comprehensive income (loss) and accrued in our consolidated balance sheets. Additionally, if we cannot meet liquidity requirements in the United States, we may have to repatriate funds from overseas, which would result in additional income taxes being incurred on the amount repatriated.
Uncertainties in the interpretation and application of the Tax Cuts and Jobs Act of 2017 could materially affect our tax obligations and effective tax rate.
The Tax Cuts and Jobs Act of 2017 ("TCJA") was enacted on December 22, 2017, and it significantly affected U.S. tax law by, among other things, changing how the U.S. imposes income tax on multinational corporations. The TCJA requires complex computations not previously provided in U.S. tax law, and the application of accounting guidance for such items is currently uncertain in some respects. Further, compliance with the TCJA and the accounting for such provisions require accumulation of information not previously required or regularly produced. The U.S. Department of Treasury has broad authority to issue regulations and interpretative guidance that may significantly impact how the law is applied and thus impact our results of operations in the period issued.
Also on December 22, 2017, the Securities and Exchange Commission ("SEC") issued guidance to address the accounting implications of the TCJA in which a registrant does not have the necessary information available, prepared or analyzed (including computations) in reasonable detail to complete the accounting for certain income tax effects of the TCJA. We have recorded provisional estimates in our financial statements with respect to certain income tax effects of the TCJA for which the accounting is incomplete, but a reasonable estimate was able to be determined. We will continue to perform additional analysis on the application of the TCJA, taking into account any additional regulatory guidance that is issued by the applicable taxing authorities, which may result in adjustments to our previously reported provisional estimates. In accordance with the SEC's guidance, we
11
will recognize any adjustments to our previously reported provisional estimates in the relevant future periods, which could materially affect our tax obligations and our effective tax rate.
Fluctuations in foreign currency have an effect on our results from operations.
The results of our foreign operations are reported in the local currency and then translated into U.S. dollars at the applicable exchange rates for inclusion in our consolidated financial statements. The exchange rates between some of these currencies and the U.S. dollar have fluctuated significantly in recent years, and may continue to do so in the future. We may incur losses related to foreign currency fluctuations, and foreign exchange controls may prevent us from repatriating cash in countries outside the U.S. In addition, because our financial statements are stated in U.S. dollars, such fluctuations may also affect the comparability of our results between financial periods.
Our outstanding indebtedness requires debt service commitments that could adversely affect our ability to fulfill our obligations and could limit our growth and impose restrictions on our business.
As of December 31, 2017, excluding debt discount and debt issuance costs, we had $1.36 billion of consolidated indebtedness. We and our subsidiaries may undertake additional borrowings in the future, subject to certain limitations contained in the debt instruments governing our indebtedness. Over the next three years, we will be required to repay or refinance approximately $512.8 million of our currently outstanding indebtedness.
Our debt service obligations impact our ability to operate and grow our business. Our payments of principal and interest on our indebtedness reduce the amount of funds available to us to invest in operations, future business opportunities, acquisitions, and other potentially beneficial activities. Our debt service obligations also increase our vulnerability to adverse economic, financial market and industry conditions. Our ability to service and refinance our indebtedness, make scheduled payments on our operating leases and fund capital expenditures, acquisitions or other business opportunities, will depend in large part on both our future performance and the availability of additional financing in the future. There can be no assurance that our business will continue to generate sufficient cash flows from operations in the future to service our debt, make necessary capital expenditures, or meet other cash needs. If unable to do so, we may be required to refinance all or a portion of our existing debt, sell assets, or obtain additional financing.
Our debt agreements contain restrictions that may limit our ability to operate our business.
Our credit facilities require us to maintain specific earnings to fixed expense ratios and to meet minimum net worth requirements in certain circumstances. In addition, our credit facilities and our other debt agreements contain, and any of our future debt agreements may contain, additional covenant restrictions that limit our ability to operate our business, or are dependent upon our future financial performance.
As a result of these covenants, our ability to respond to changes in business and economic conditions and to obtain additional financing, if needed, may be significantly restricted, and we may be prevented from engaging in transactions that might otherwise be beneficial to us. See the liquidity section in "Item 7. Management's Discussion and Analysis" for further details.
There is a risk that the market value of our common stock may decline.
Stock markets have experienced significant price and trading volume fluctuations, and the market prices of companies in our industry have been volatile. For some issuers, the markets have exerted downward pressure on stock prices and credit capacity. It is impossible to predict whether the price of our common stock will rise or fall. Trading prices of our common stock will be influenced by our operating results and prospects and by economic, political, financial, and other factors.
Regulatory and Legal Risk Factor
We are subject to costs and risks associated with global laws and regulations affecting our business, as well as litigation for product liability or other matters affecting our business.
The global legal and regulatory environment is complex and exposes us to compliance costs and risks, as well as litigation and other legal proceedings, which could materially affect our operations and financial results. These laws and regulations may change, sometimes significantly, as a result of political or economic events, and some changes are anticipated to occur in the coming year. They include tax laws and regulations, import and export laws and regulations, labor and employment laws and regulations, product safety, occupational safety and health laws and regulations, securities and exchange laws and regulations, data privacy laws and regulations (and other laws applicable to publicly-traded companies such as the Foreign Corrupt Practices Act), and environmental laws and regulations. Furthermore, as a government contractor selling to federal, state and local government entities, we are also subject to a wide variety of additional laws and regulations. Proposed laws and regulations in these and other areas could affect the cost of our business operations.
12
From time to time we are involved in legal proceedings, audits or investigations which may relate to, for example, product liability, labor and employment (including wage and hour), tax, escheat, import and export compliance, government contracts, worker health and safety, and general commercial and securities matters. While we believe the outcome of any pending matter is unlikely to have a material adverse effect on our financial condition or liquidity, additional legal proceedings may arise in the future and the outcome of these as well as other contingencies could require us to take actions, which could adversely affect our operations or could require us to pay substantial amounts of money.
Item 1B. Unresolved Staff Comments.
None.
Item 2. Properties.
We have approximately 500 branches, of which approximately 340 are located in the United States, approximately 130 are located in Canada, seven are located in Mexico and the remainder are in other countries located in Asia, Europe and South America. Approximately 15% of our branches are owned facilities, and the remainder are leased.
The following table summarizes our distribution centers:
Square Feet | Leased/Owned | |||
Location | ||||
Little Rock, AR | 100,000 | Leased | ||
Byhalia, MS (1) | 148,000 | Owned | ||
Sparks, NV | 199,000 | Leased | ||
Warrendale, PA (1) | 194,000 | Owned | ||
Dallas, TX | 112,000 | Leased | ||
Madison, WI | 136,000 | Leased | ||
Edmonton, AB | 101,000 | Leased | ||
Burnaby, BC | 65,000 | Leased | ||
Mississauga, ON | 246,000 | Leased | ||
Montreal, QC | 126,000 | Leased | ||
(1) Property pledged as collateral under our Term Loan Facility.
We also lease our 97,000 square-foot headquarters in Pittsburgh, Pennsylvania. We do not regard the real property associated with any single branch location as material to our operations. We believe our facilities are in good operating condition and are adequate for their respective uses.
Item 3. Legal Proceedings.
From time to time, a number of lawsuits and claims have been or may be asserted against us relating to the conduct of our business, including routine litigation relating to commercial and employment matters. The outcome of any litigation cannot be predicted with certainty, and some lawsuits may be determined adversely to us. However, management does not believe that the ultimate outcome of any such pending matters is likely to have a material adverse effect on our financial condition or liquidity, although the resolution in any fiscal period of one or more of these matters may have a material adverse effect on our results of operations for that period.
Information relating to legal proceedings is included in Note 13, "Commitments and Contingencies," of the Notes to Consolidated Financial Statements and is incorporated herein by reference.
Item 4. Mine Safety Disclosures.
Not applicable.
13
PART II
Item 5. Market for Registrant’s Common Equity, Related Stockholder Matters and Issuer Purchases of Equity Securities.
Market, Stockholder and Dividend Information. Our common stock is listed on the New York Stock Exchange under the symbol “WCC.” As of February 20, 2018, there were 47,056,716 shares of common stock outstanding held by approximately 17 holders of record. We have not paid dividends on the common stock and do not currently plan to pay dividends. We do, however, evaluate the possibility from time to time. It is currently expected that earnings will be reinvested to support growth initiatives, acquisitions, debt reduction, and share repurchases. In addition, our Revolving Credit Facility, Term Loan Facility, 2021 Notes and 2024 Notes limit our ability to pay dividends and repurchase our common stock. See Part II, Item 7, “Management’s Discussion and Analysis of Financial Condition and Results of Operations — Liquidity and Capital Resources.”
The following table sets forth the high and low sales prices per share of our common stock, as reported on the New York Stock Exchange, for the periods indicated.
Sales Prices | |||||||
Quarter | High | Low | |||||
2016 | |||||||
First | $ | 55.92 | $ | 34.00 | |||
Second | 62.66 | 50.64 | |||||
Third | 63.90 | 49.67 | |||||
Fourth | 73.40 | 51.45 | |||||
2017 | |||||||
First | $ | 76.15 | $ | 64.25 | |||
Second | 70.95 | 53.60 | |||||
Third | 60.50 | 48.95 | |||||
Fourth | 69.35 | 57.25 | |||||
Issuer Purchases of Equity Securities. On December 17, 2014, WESCO announced that its Board of Directors approved, on December 11, 2014, the repurchase of up to $300 million of the Company's common stock through December 31, 2017. Under this repurchase authorization, WESCO repurchased 4,247,113 shares of the Company's common stock for $250.0 million.
On December 13, 2017, WESCO announced that its Board of Directors approved, on December 7, 2017, the repurchase of up to $300 million of the Company's common stock through December 31, 2020. As of December 31, 2017, no shares have been repurchased under this repurchase authorization.
14
Company Performance. The following stock price performance graph illustrates the cumulative total return on an investment in WESCO International, a 2017 Performance Peer Group, and the Russell 2000 Index. The graph covers the period from December 31, 2012 to December 31, 2017, and assumes that the value for each investment was $100 on December 31, 2012, and that all dividends were reinvested.
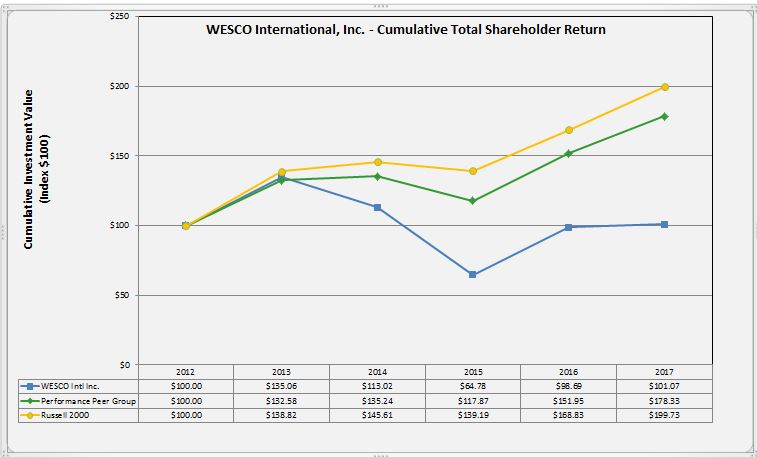
2017 Performance Peer Group (1): | ||
Anixter International, Inc. | Essendant, Inc. | MSC Industrial Direct Co., Inc. |
Applied Industrial Technologies, Inc. | Fastenal Company | Rexel SA |
Arrow Electronics, Inc. | Genuine Parts Company | Rockwell Automation, Inc. |
Avnet, Inc. | HD Supply Holdings, Inc. | Tech Data Corporation |
Barnes Group | Hubbell, Inc. | W.W. Grainger, Inc. |
Eaton Corporation Plc | MRC Global, Inc. | |
1 | Airgas, Inc. and Ingram Micro, Inc. were removed from the performance peer group in 2017 due to acquisition. |
15
Item 6. Selected Financial Data.
Selected financial data and significant events related to the Company’s financial results for the last five fiscal years are listed below. The financial data should be read in conjunction with the Consolidated Financial Statements and Notes thereto included in Item 8, and with Management’s Discussion and Analysis of Financial Condition and Results of Operations, included in Item 7.
Year Ended December 31, | 2017 | 2016 | 2015 | 2014 | 2013 | ||||||||||||||
(In millions, except per share data) | |||||||||||||||||||
Income Statement Data: | |||||||||||||||||||
Net sales | $ | 7,679.0 | $ | 7,336.0 | $ | 7,518.5 | $ | 7,889.6 | $ | 7,513.3 | |||||||||
Cost of goods sold (excluding depreciation and amortization) | 6,194.4 | 5,887.8 | 6,024.8 | 6,278.6 | 5,967.9 | ||||||||||||||
Selling, general and administrative expenses | 1,099.6 | 1,049.3 | 1,055.0 | 1,076.8 | 996.8 | ||||||||||||||
Depreciation and amortization | 64.0 | 66.9 | 65.0 | 68.0 | 67.6 | ||||||||||||||
Income from operations | 321.0 | 332.0 | 373.7 | 466.2 | 481.0 | ||||||||||||||
Interest expense, net | 68.5 | 76.6 | 69.8 | 82.1 | 85.6 | ||||||||||||||
Loss on debt extinguishment(1) | — | 123.9 | — | — | 13.2 | ||||||||||||||
Other loss(2) | — | — | — | — | 2.3 | ||||||||||||||
Income before income taxes | 252.5 | 131.5 | 303.9 | 384.1 | 379.9 | ||||||||||||||
Provision for income taxes | 89.3 | 30.4 | 95.5 | 108.7 | 103.4 | ||||||||||||||
Net income | 163.2 | 101.1 | 208.4 | 275.4 | 276.5 | ||||||||||||||
Net loss (income) attributable to noncontrolling interests(3) | 0.3 | 0.5 | 2.3 | 0.5 | (0.1 | ) | |||||||||||||
Net income attributable to WESCO International | $ | 163.5 | $ | 101.6 | $ | 210.7 | $ | 275.9 | $ | 276.4 | |||||||||
Earnings per common share attributable to WESCO International | |||||||||||||||||||
Basic | $ | 3.42 | $ | 2.30 | $ | 4.85 | $ | 6.21 | $ | 6.26 | |||||||||
Diluted | $ | 3.38 | $ | 2.10 | $ | 4.18 | $ | 5.18 | $ | 5.25 | |||||||||
Weighted-average common shares outstanding | |||||||||||||||||||
Basic | 47.8 | 44.1 | 43.4 | 44.4 | 44.1 | ||||||||||||||
Diluted | 48.4 | 48.3 | 50.4 | 53.3 | 52.7 | ||||||||||||||
Other Financial Data: | |||||||||||||||||||
Capital expenditures | $ | 21.5 | $ | 18.0 | $ | 21.7 | $ | 20.5 | $ | 27.8 | |||||||||
Net cash provided by operating activities | 149.1 | 300.2 | 283.1 | 251.2 | 315.1 | ||||||||||||||
Net cash used in investing activities | (5.3 | ) | (70.5 | ) | (170.2 | ) | (144.2 | ) | (18.2 | ) | |||||||||
Net cash used in financing activities | (141.2 | ) | (276.3 | ) | (67.8 | ) | (95.5 | ) | (257.5 | ) | |||||||||
Balance Sheet Data: | |||||||||||||||||||
Total assets(4) | $ | 4,735.5 | $ | 4,431.8 | $ | 4,569.7 | $ | 4,754.4 | $ | 4,648.9 | |||||||||
Total debt (including current and short-term debt)(5) | 1,348.6 | 1,385.3 | 1,483.4 | 1,415.6 | 1,487.7 | ||||||||||||||
Stockholders’ equity(4) | 2,116.1 | 1,963.6 | 1,773.9 | 1,928.2 | 1,764.8 | ||||||||||||||
(1) Represents the loss recognized in 2016 related to the redemption of the then outstanding 6.0% Convertible Senior Debentures due 2029 ("2029 Debentures") and the loss recognized in 2013 related to the $500 million prepayment made to the U.S. sub-facility of the Term Loan Facility.
(2) Represents the loss on the sale of a foreign operation in 2013.
(3) Represents the portion of net loss (income) attributable to consolidated entities that are not owned by the Company.
(4) The Consolidated Balance Sheet at December 31, 2016 was revised from the previously issued financial statements. The revision impacted the presentation of total assets and stockholders' equity. See Note 2 of the Notes to Consolidated Financial Statements.
(5) Includes the discount related to the 6.0% Convertible Senior Debentures due 2029 and Term Loan Facility. For 2017, 2016 and 2015, also includes debt issuance costs. See Note 7 of the Notes to Consolidated Financial Statements.
16
Item 7. Management’s Discussion and Analysis of Financial Condition and Results of Operations.
The following discussion should be read in conjunction with the audited consolidated financial statements and notes thereto included in Item 8 of this Annual Report on Form 10-K.
Company Overview
Our 2017 financial results reflect a return to growth, driven by improved business momentum in our end markets and geographies. Sales increased $343.0 million, or 4.7%, over the prior year. Foreign exchange rates and acquisitions positively impacted net sales by 0.4% and 0.2%, respectively, and were partially offset by a 0.4% impact from the number of work days, resulting in organic sales growth of 4.5%. Cost of goods sold as a percentage of net sales was 80.7% and 80.3% in 2017 and 2016, respectively. Operating income was $320.9 million for 2017, compared to $332.1 million for 2016. Operating income decreased due to lower gross margin and the restoration of incentive and discretionary compensation. Net income attributable to WESCO International of $163.5 million increased by 60.9% compared to 2016 net income of $101.6 million, which included a $123.9 million loss on debt redemption. Earnings per diluted share attributable to WESCO International was $3.38 in 2017, based on 48.4 million diluted shares, compared with earnings per diluted share of $2.10 in 2016, based on 48.3 million diluted shares. Excluding the impact of the TCJA of $0.55, adjusted earnings per diluted share for 2017 was $3.93.
Our end markets consist of industrial firms, electrical and data communications contractors, utilities, and commercial organizations, institutions and government entities. Our transaction types to these markets can be categorized as stock, direct ship and special order. Stock orders are filled directly from existing inventory and represent approximately 52% of total sales. Approximately 38% of our total sales are direct ship sales. Direct ship sales are typically custom-built products, large orders or products that are too bulky to be easily handled and, as a result, are shipped directly to the customer from the supplier. Special orders are for products that are not ordinarily stocked in inventory and are ordered based on a customer’s specific request. Special orders represent the remaining 10% of total sales.
We have historically financed our working capital requirements, capital expenditures, acquisitions, share repurchases and new branch openings through internally-generated cash flow, debt issuances, borrowings under our Revolving Credit Facility and funding through our Receivables Facility.
Cash Flow
We generated $149.1 million in operating cash flow during 2017. Cash provided by operating activities included net income of $163.1 million, adjustments to net income totaling $28.5 million, which were offset by changes in assets and liabilities of $42.5 million. Investing activities included capital expenditures of $21.5 million. Financing activities consisted of borrowings and repayments of $834.4 million and $826.4 million, respectively, related to our Revolving Credit Facility, borrowings and repayments of both $670.2 million, related to our Receivables Facility, repayments of $60.0 million applied to our Term Loan Facility as well as borrowings and repayments on our various international lines of credit of $175.8 million and $164.0 million, respectively. Financing activities also included the repurchase of $106.8 million of the Company's common stock, of which $100 million was pursuant to the share repurchase plan announced on December 17, 2014.
Free cash flow for the years ended December 31, 2017 and 2016 was $127.6 million and $282.2 million, respectively.
The following table sets forth the components of free cash flow:
Twelve Months Ended December 31, | |||||||
2017 | 2016 | ||||||
Free Cash Flow: | |||||||
(In millions) | |||||||
Cash flow provided by operations | $ | 149.1 | $ | 300.2 | |||
Less: Capital expenditures | (21.5 | ) | (18.0 | ) | |||
Free cash flow | $ | 127.6 | $ | 282.2 | |||
Note: The table above reconciles cash flow provided by operations to free cash flow. Free cash flow is a non-GAAP financial measure of liquidity. Capital expenditures are deducted from operating cash flow to determine free cash flow. Free cash flow is available to fund investing and financing activities.
17
Financing Availability
As of December 31, 2017, we had $562.9 million in total available borrowing capacity under our Revolving Credit Facility, which was comprised of $365.3 million of availability under the U.S. sub-facility and $197.6 million of availability under the Canadian sub-facility. Available borrowing capacity under our Receivables Facility was $170.0 million. The Receivables Facility and Revolving Credit Facility both mature in September 2020.
Critical Accounting Policies and Estimates
Our discussion and analysis of our financial condition and results of operations are based upon our consolidated financial statements, which have been prepared in accordance with accounting principles generally accepted in the United States of America (GAAP). The preparation of these financial statements requires us to make estimates and judgments that affect the reported amounts of assets, liabilities, revenues and expenses and related disclosure of contingent assets and liabilities. On an ongoing basis, we evaluate our estimates, including those related to supplier programs, bad debts, inventories, insurance costs, goodwill, income taxes, contingencies and litigation. We base our estimates on historical experience and on various other assumptions that are believed to be reasonable under the circumstances, the results of which form the basis for making judgments about the carrying values of assets and liabilities that are not readily apparent from other sources. Actual results may differ from these estimates. If actual market conditions are less favorable than those projected by management, additional adjustments to reserve items may be required. We believe the following critical accounting policies affect our judgments and estimates used in the preparation of our consolidated financial statements.
Revenue Recognition
Revenues are recognized for product sales when title, ownership and risk of loss pass to the customer or for services when the service is rendered. In the case of stock sales and special orders, a sale occurs at the time of shipment from our distribution point, as the terms of our sales are typically FOB shipping point. In cases where we process customer orders that ship directly from suppliers, revenue is recognized once product is shipped and title has passed. In all cases, revenue is recognized once the sales price to our customer is fixed or is determinable and we have reasonable assurance as to the collectability.
We provide integrated supply services to certain customers, which include some or all of the following: determine inventory stocking levels; establish inventory reorder points; launch purchase orders; receive material; pack away material; and, pick material for order fulfillment. We recognize revenue for these services in the period rendered based upon a previously negotiated fee arrangement. We also sell inventory to these customers and recognize revenue at the time title and risk of loss transfers to the customer.
Selling, General and Administrative Expenses
We include warehousing, purchasing, branch operations, information services, and marketing and selling expenses in this category, as well as other types of general and administrative costs.
Allowance for Doubtful Accounts
We maintain allowances for doubtful accounts for estimated losses resulting from the inability of our customers to make required payments. We have a systematic procedure using estimates based on historical data and reasonable assumptions of collectability made at the local branch level and on a consolidated corporate basis to calculate the allowance for doubtful accounts.
Excess and Obsolete Inventory
We write down our inventories to lower of cost and net realizable value based on internal factors derived from historical analysis of actual losses. On a retrospective basis, we identify items in excess of 36 months supply relative to demand or movement. We then analyze the ultimate disposition of identified excess inventories as they are sold, returned to supplier, or scrapped. This historical item-by-item analysis allows us to develop an estimate of the likelihood that an item identified as being in excess supply ultimately becomes obsolete. We apply the estimate to inventories currently in excess of 36 months supply, and reduce the carrying value of inventories by the derived amount. We revisit and test our assumptions on a periodic basis. Historically, we have not had material changes to our assumptions, nor do we anticipate any material changes in the future.
18
Supplier Volume Rebates
We receive rebates from certain suppliers based on contractual arrangements with them. Since there is a lag between actual purchases and the rebates received from suppliers, we estimate and accrue the approximate amount of rebates available at a specific date. We record the amounts as other accounts receivable in the Consolidated Balance Sheets. The corresponding rebate income is derived from the level of actual purchases made by us and is recorded as a reduction of cost of goods sold. Supplier volume rebate rates have historically ranged between approximately 0.9% and 1.4% of sales depending on market conditions. In 2017, the rebate rate was 1.3%.
Goodwill and Indefinite-Lived Intangible Assets
Goodwill and indefinite-lived intangible assets are tested for impairment annually during the fourth quarter using information available at the end of September, or more frequently if triggering events occur, indicating that their carrying value may not be recoverable. We test for goodwill impairment on a reporting unit level and the evaluation involves comparing the fair value of each reporting unit with its carrying value. The fair values of the reporting units are determined using a combination of a discounted cash flow analysis and market multiples. Assumptions used for these fair value techniques are based on a combination of historical results, current forecasts, market data and recent economic events. We evaluate the recoverability of indefinite-lived intangible assets using the relief-from-royalty method based on projected financial information. At December 31, 2017 and 2016, respectively, goodwill and indefinite-lived trademarks totaled $1.87 billion and $1.83 billion.
We performed our annual impairment testing of goodwill and indefinite-lived intangible assets during the fourth quarter. A possible indicator of goodwill impairment is the relationship of a company’s market capitalization to its book value. As of December 31, 2017, our market capitalization exceeded our book value and the fair values of our reporting units exceeded their carrying values. Accordingly, there were no impairment losses identified as a result of our annual test.
The determination of fair value involves significant management judgment and we apply our best judgment when assessing the reasonableness of financial projections. Fair values are sensitive to changes in underlying assumptions and factors. As a result, there can be no assurance that the estimates and assumptions made for purposes of the annual goodwill and indefinite-lived intangible impairment tests will prove to be an accurate prediction of future results.
Intangible Assets
We account for certain economic benefits purchased as a result of our acquisitions, including customer relations, distribution agreements, technology and trademarks, as intangible assets. Most trademarks have an indefinite life. We amortize all other intangible assets over a useful life determined by the expected cash flows produced by such intangibles and their respective tax benefits. Useful lives vary between 2 and 20 years, depending on the specific intangible asset.
Insurance Programs
We use commercial insurance for auto, workers’ compensation, casualty and health claims, and information technology as a risk sharing strategy to reduce our exposure to catastrophic losses. Our strategy involves large deductible policies where we must pay all costs up to the deductible amount. We estimate our reserve based on historical incident rates and costs.
Income Taxes
We account for income taxes under the asset and liability method, which requires the recognition of deferred income taxes for events that have future tax consequences. Under this method, deferred income taxes are recognized (using enacted tax laws and rates) based on the future income tax effects of differences in the carrying amounts of assets and liabilities for financial reporting and tax purposes. The effect of a tax rate change on deferred tax assets and liabilities is recognized in income in the period of change.
We recognize deferred tax assets at amounts that are expected to be realized. To make such determination, management evaluates all positive and negative evidence, including but not limited to, prior, current and future taxable income, tax planning strategies and future reversals of existing temporary differences. A valuation allowance is recognized if it is “more-likely-than-not” that some or all of a deferred tax asset will not be realized. We regularly assess the realizability of deferred tax assets.
We account for uncertainty in income taxes using a "more-likely-than-not" recognition threshold. Due to the subjectivity inherent in the evaluation of uncertain tax positions, the tax benefit ultimately recognized may materially differ from the estimate. We recognize interest and penalties related to uncertain tax benefits as part of interest expense and income tax expense, respectively.
The TCJA imposes a one-time tax on the deemed repatriation of undistributed foreign earnings. Notwithstanding the effects of applying such provisions of the TCJA, we continue to assert that the earnings of our foreign subsidiaries are indefinitely reinvested. However, as a result of the TCJA, the Company is reevaluating its intent and ability to repatriate foreign cash based upon the available liquidity and cash flow needs of its foreign subsidiaries and will disclose in future filings any change in its intention to repatriate undistributed foreign earnings and any resulting income tax impacts. Until the Company completes this
19
reevaluation, it is not practicable to determine the amount of any unrecognized deferred income taxes on these undistributed foreign earnings.
The provisions of the TCJA also introduce U.S. taxation on certain global intangible low-taxed income ("GILTI"). We have elected to account for any GILTI tax that arises in future periods as a component of income tax expense.
Provisional amounts are recorded for certain income tax effects of the TCJA for which the accounting is incomplete, but a reasonable estimate can be determined. Provisional amounts, or adjustments to provisional amounts, identified during the period ending on or before one year from the TCJA's enactment date are recognized as an adjustment to income tax expense or benefit from continuing operations in the period the amounts are determined.
Stock-Based Compensation
Our stock-based employee compensation plans are comprised of stock-settled stock appreciation rights, restricted stock units, and performance-based awards. Compensation cost for all stock-based awards is measured at fair value on the date of grant, and compensation cost is recognized, net of forfeitures, over the service period for awards expected to vest. The fair value of stock-settled appreciation rights and performance-based awards with market conditions is determined using the Black-Scholes and Monte Carlo simulation models, respectively. The fair value of restricted stock units with service conditions and performance-based awards with performance conditions is determined by the grant-date closing price of our common stock. Expected volatilities are based on historical volatility of our common stock. We estimate the expected life of stock-settled stock appreciation rights using historical data pertaining to option exercises and employee terminations. The risk-free rate is based on the U.S. Treasury yields in effect at the time of grant. The forfeiture assumption is based on our historical employee behavior, which we review on an annual basis. No dividends are assumed for stock-based awards. For stock appreciation rights that are exercised and for restricted stock units and performance-based award that vest, shares are issued out of our outstanding common stock.
Results of Operations
The following table sets forth the percentage relationship to net sales of certain items in our Consolidated Statements of Income and Comprehensive Income (Loss) for the periods presented.
Year Ended December 31, | 2017 | 2016 | 2015 | |||||
Net sales | 100.0 | % | 100.0 | % | 100.0 | % | ||
Cost of goods sold | 80.7 | 80.3 | 80.1 | |||||
Selling, general and administrative expenses | 14.3 | 14.3 | 14.0 | |||||
Depreciation and amortization | 0.8 | 0.9 | 0.9 | |||||
Income from operations | 4.2 | 4.5 | 5.0 | |||||
Interest expense | 0.9 | 1.0 | 0.9 | |||||
Loss on debt redemption | — | 1.7 | — | |||||
Income before income taxes | 3.3 | 1.8 | 4.1 | |||||
Provision for income taxes | 1.2 | 0.4 | 1.3 | |||||
Net income attributable to WESCO International | 2.1 | % | 1.4 | % | 2.8 | % | ||
2017 Compared to 2016
Net Sales. Net sales in 2017 increased 4.7% to $7.68 billion, compared with $7.34 billion in 2016. Foreign exchange rates and acquisitions positively impacted net sales by 0.4% and 0.2%, respectively, and were partially offset by a 0.4% impact from the number of workdays, resulting in organic sales growth of 4.5%.
The following table sets forth organic sales growth:
Twelve Months Ended | |||||
December 31, | |||||
Organic Sales Growth: | 2017 | 2016 | |||
Change in net sales | 4.7 | % | (2.4 | )% | |
Less: Impact from acquisitions | 0.2 | % | 3.1 | % | |
Less: Impact from foreign exchange rates | 0.4 | % | (1.0 | )% | |
Less: Impact from number of workdays | (0.4 | )% | 0.4 | % | |
Organic sales growth | 4.5 | % | (4.9 | )% | |
20
Note: Organic sales growth is a non-GAAP financial measure of sales performance. Organic sales growth is calculated by deducting the percentage impact from acquisitions in the first year of ownership, foreign exchange rates and number of workdays from the overall percentage change in consolidated net sales.
Cost of Goods Sold. Cost of goods sold increased 5.2% in 2017 to $6.19 billion, compared with $5.89 billion in 2016. Cost of goods sold as a percentage of net sales was 80.7% and 80.3% in 2017 and 2016, respectively. The increase in cost of goods sold as a percentage of net sales was primarily due to geographic mix and competition.
Selling, General and Administrative ("SG&A") Expenses. SG&A expenses include costs associated with personnel, shipping and handling, travel, advertising, facilities, utilities and bad debts. SG&A expenses increased by $50.5 million, or 4.8%, to $1.10 billion in 2017. As a percentage of net sales, SG&A expenses were consistent at 14.3% in 2017 and 2016. SG&A expenses increased primarily as a result of higher variable compensation expense.
SG&A payroll expenses for 2017 of $774.4 million increased by $39.7 million compared to 2016. The increase in SG&A payroll expenses was primarily due to an increase in commissions, incentive compensation, healthcare benefits, and temporary labor costs.
The remaining SG&A expenses for 2017 of $325.3 million increased by $10.8 million compared to 2016. The increase in the remaining SG&A expenses was primarily due to an increase in operating costs required to support higher sales volumes.
Depreciation and Amortization. Depreciation and amortization decreased $2.8 million to $64.0 million in 2017, compared with $66.9 million in 2016.
Income from Operations. Income from operations decreased by $11.2 million to $320.9 million in 2017, compared to $332.1 million in 2016. Income from operations as a percentage of net sales was 4.2% and 4.5% in 2017 and 2016, respectively. Income from operations as a percentage of net sales decreased primarily as a result of lower gross margin.
Net Interest Expense. Interest expense totaled $68.5 million in 2017, compared with $76.6 million in 2016, a decrease of 10.6%. The decrease was primarily due to a reduction in higher-priced debt. Non-cash interest expense, which includes the amortization of debt discounts and debt issuance costs, and interest related to uncertain tax positions, was $4.1 million and $7.8 million for 2017 and 2016, respectively.
The following table sets forth the components of interest expense:
Twelve Months Ended | |||||||
December 31, | |||||||
2017 | 2016 | ||||||
(In millions) | |||||||
Amortization of debt discounts | $ | 0.3 | $ | 3.1 | |||
Amortization of debt issuance costs | 3.7 | 3.6 | |||||
Interest related to uncertain tax positions, net | 0.1 | 1.2 | |||||
Non-cash interest expense | 4.1 | 7.9 | |||||
Change in accrued interest | 0.6 | (5.6 | ) | ||||
Cash interest expense | 63.8 | 74.3 | |||||
Total interest expense | $ | 68.5 | $ | 76.6 | |||
Income Taxes. Our effective tax rate was 35.4% in 2017 compared to 23.1% in 2016. Our effective tax rate was impacted by the relative amounts of income earned in the U.S. and foreign jurisdictions, primarily Canada, the tax rates in these jurisdictions, and changes in foreign currency exchange rates. Additionally, as a result of the enactment of the TCJA, we recorded provisional discrete tax expense of $26.4 million, which increased the annual effective tax rate by 10.5%. Without the impact of the TCJA, our 2017 effective tax rate would have been 24.9%.
We are still analyzing the prospective impact of the TCJA on our effective tax rate. However, we expect our prospective effective tax rate to be primarily impacted by the reduction in the U.S. federal statutory income tax rate from 35% to 21% and the current year taxation of GILTI, which is likely to be partially offset by the deduction for foreign-derived intangible income. We currently do not expect a material impact from the TCJA's expansion on the limitation of deductions for excessive employee compensation. Additionally, we do not expect the TCJA to limit our ability to deduct interest expense for U.S. federal income tax purposes. However, the interest expense limitations of the TCJA could have an impact on our state effective income tax rate. Management is still evaluating the impact of the TCJA on the indefinite reinvestment of our foreign subsidiares' earnings and profits and our intercompany financing strategies.
21
Net Income. Net income increased by $62.0 million, or 61.3%, to $163.1 million in 2017, compared to $101.1 million in 2016. The increase in net income was primarily due to the loss on debt redemption recognized in 2016 as a result of the early redemption of the 2029 Debentures and an increase in net sales, partially offset by higher cost of sales, SG&A and income tax expenses. Adjusted net income for the year ended December 31, 2017 and December 31, 2016 was $189.6 million and $183.8 million, respectively.
Net Income Attributable to WESCO International. Net income and earnings per diluted share attributable to WESCO International were $163.5 million and $3.38 per share, respectively, in 2017, compared with $101.6 million and $2.10 per share, respectively, in 2016. Adjusted net income and adjusted earnings per diluted share attributable to WESCO International were $189.9 million and $3.93 per share, and $184.3 million and $3.80 per share, for the years ended December 31, 2017 and December 31, 2016, respectively.
Net Loss attributable to Noncontrolling Interest. Net loss attributable to noncontrolling interest in 2017 and 2016 was $0.3 million and $0.5 million, respectively.
The following table sets forth the reconciliation of adjusted net income, adjusted income taxes, and adjusted earnings per diluted share:
Twelve Months Ended | |||||||
December 31, | |||||||
Adjusted Income Before Income Taxes: | 2017 | 2016 | |||||
Income before income taxes | $ | 252.5 | $ | 131.5 | |||
Loss on debt redemption | — | 123.9 | |||||
Adjusted income before income taxes | $ | 252.5 | $ | 255.4 | |||
Adjusted Tax Provision: | |||||||
Provision for income taxes | $ | 89.3 | $ | 30.4 | |||
Income tax expense for TCJA(1) | (26.4 | ) | — | ||||
Income tax benefit from loss on debt redemption(2) | — | 41.2 | |||||
Adjusted provision for income taxes | $ | 62.9 | $ | 71.6 | |||
Adjusted Net Income Attributable to WESCO International: | |||||||
Adjusted income before income taxes | $ | 252.5 | $ | 255.4 | |||
Adjusted provision for income taxes | 62.9 | 71.6 | |||||
Adjusted net income | 189.6 | 183.8 | |||||
Net loss attributable to noncontrolling interests | (0.3 | ) | (0.5 | ) | |||
Adjusted net income attributable to WESCO International, Inc. | $ | 189.9 | $ | 184.3 | |||
Adjusted Earnings per Diluted Share: | Twelve Months Ended December 31, | ||||||
2017 | 2016 | ||||||
Earnings per diluted common share | $ | 3.38 | $ | 2.10 | |||
Impact of TCJA(1) | 0.55 | — | |||||
Loss on debt redemption(3) | — | 2.54 | |||||
Tax effect of loss on debt redemption(3) | — | (0.84 | ) | ||||
Adjusted earnings per diluted common share | $ | 3.93 | $ | 3.80 | |||
(1) | The application of the TCJA resulted in a provisional discrete income tax expense of $26.4 million, which is comprised of $82.8 million of expense associated with the deemed repatriation of undistributed earnings of foreign subsidiares partially offset by a $56.4 million benefit from the remeasurement of U.S. deferred income tax balances. |
(2) | Represents the third quarter of 2016 income tax benefit related to the loss on debt redemption. |
(3) | The loss on debt redemption and related income tax benefit are based on the third quarter of 2016 diluted shares of 48.7 million. |
22
Note: Adjusted net income attributable to WESCO International, Inc. for the year ended December 31, 2017, does not include provisional discrete income tax expense of $26.4 million associated with the application of the TCJA. For 2016, adjusted net income attributable to WESCO International, Inc. is defined as income before income taxes plus the 2016 third quarter loss on debt redemption, less the provision for income taxes excluding the third quarter benefit of such loss.
For the year ended December 31, 2017, adjusted earnings per diluted share is computed by dividing adjusted net income by the weighted-average common shares outstanding and common share equivalents. For the year ended 2016, adjusted earnings per diluted share is computed by adding the loss per diluted share on debt redemption and deducting the related income tax benefit per diluted share recognized in the third quarter of 2016 divided by the weighted-average common shares outstanding and common share equivalents.
The Company believes that these non-GAAP financial measures provide an overall understanding of the Company's current financial performance and a consistent measure for assessing the current and historical financial results.
2016 Compared to 2015
Net Sales. Net sales in 2016 decreased 2.4% to $7.34 billion, compared with $7.52 billion in 2015. Acquisitions and number of workdays positively impacted net sales by 3.1% and 0.4%, respectively, and were partially offset by a 1.0% decrease in foreign exchange rates, resulting in a 4.9% decrease in organic sales growth.
The following table sets forth organic sales growth:
Twelve Months Ended | |||||
December 31, | |||||
Organic Sales Growth: | 2016 | 2015 | |||
Change in net sales | (2.4 | )% | (4.7 | )% | |
Less: Impact from acquisitions | 3.1 | % | 2.0 | % | |
Less: Impact from foreign exchange rates | (1.0 | )% | (3.4 | )% | |
Less: Impact from number of workdays | 0.4 | % | — | % | |
Organic sales growth | (4.9 | )% | (3.3 | )% | |
Note: Organic sales growth is a non-GAAP financial measure of sales performance. Organic sales growth is calculated by deducting the percentage impact from acquisitions in the first year of ownership, foreign exchange rates and number of workdays from the overall percentage change in consolidated net sales.
Cost of Goods Sold. Cost of goods sold decreased 2.3% in 2016 to $5.89 billion, compared with $6.02 billion in 2015. Cost of goods sold as a percentage of net sales was 80.3% and 80.1% in 2016 and 2015, respectively.
SG&A Expenses. SG&A expenses include costs associated with personnel, shipping and handling, travel, advertising, facilities, utilities and bad debts. SG&A expenses decreased by $5.7 million, or 0.5%, to $1.05 billion in 2016. SG&A expenses decreased as the cost impact of recent acquisitions was offset by savings from headcount reductions, branch closures and consolidations, and ongoing discretionary spending cost controls. As a percentage of net sales, SG&A expenses increased to 14.3% in 2016, compared to 14.0% in 2015, reflecting lower sales volume.
SG&A payroll expenses for 2016 of $734.8 million decreased by $1.1 million compared to 2015. The decrease in SG&A payroll expenses was primarily due to a decrease in commissions, incentives and benefits.
The remaining SG&A expenses for 2016 of $314.5 million decreased by $4.6 million compared to 2015.
Depreciation and Amortization. Depreciation and amortization increased $1.9 million to $66.9 million in 2016, compared with $65.0 million in 2015.
Income from Operations. Income from operations decreased by $41.7 million to $332.0 million in 2016, compared to $373.7 million in 2015. Income from operations as a percentage of net sales was 4.5% and 5.0% in 2016 and 2015, respectively. Income from operations as a percentage of net sales decreased as the benefits resulting from cost management were offset by lower sales and gross margin.
Net Interest Expense. Interest expense totaled $76.6 million in 2016, compared with $69.8 million in 2015, an increase of 9.7%. Non-cash interest expense, which includes the amortization of debt discounts and debt issuance costs, and interest related to uncertain tax positions, was $7.9 million and $3.5 million for 2016 and 2015, respectively. In the fourth quarter of 2015, the resolution of transfer pricing matters associated with previously filed tax positions resulted in non-cash interest income of $9.4 million.
23
The following table sets forth the components of interest expense:
Twelve Months Ended | |||||||
December 31, | |||||||
2016 | 2015 | ||||||
(In millions) | |||||||
Amortization of debt discounts | $ | 3.1 | $ | 6.1 | |||
Amortization of debt issuance costs | 3.6 | 6.1 | |||||
Interest related to uncertain tax positions, net | 1.2 | (8.7 | ) | ||||
Non-cash interest expense | 7.9 | 3.5 | |||||
Change in accrued interest | (5.6 | ) | — | ||||
Cash interest expense | 74.3 | 66.3 | |||||
Total interest expense | $ | 76.6 | $ | 69.8 | |||
Loss on Debt Redemption. Loss on debt redemption of $123.9 million was the result of a non-cash charge from the early redemption of the 2029 Debentures in the third quarter of 2016.
Income Taxes. Our effective tax rate was 23.1% in 2016 compared to 31.4% in 2015. Our effective tax rate is affected by recurring items, such as the relative amounts of income earned in the United States and foreign jurisdictions, primarily Canada, the tax rates in these jurisdictions and changes in foreign currency exchange rates. The loss on debt redemption reduced income before income taxes, which decreased the effective tax rate for 2016. In 2015, the resolution of the transfer pricing matter described above resulted in incremental income tax expense, which increased the effective tax rate.
Net Income. Net income decreased by $107.3 million, or 51.5%, to $101.1 million in 2016, compared to $208.4 million in 2015. Adjusted net income for the year ended December 31, 2016 was $183.8 million.
Net Loss Attributable to Noncontrolling Interests. Net loss attributable to noncontrolling interests was $0.5 million in 2016, compared to $2.3 million in 2015. The losses in 2016 and 2015 were primarily due to foreign exchange losses on cash balances.
Net Income Attributable to WESCO International. Net income and diluted earnings per share attributable to WESCO International were $101.6 million and $2.10 per share, respectively, in 2016, compared with $210.7 million and $4.18 per share, respectively, in 2015. Adjusted net income and diluted earnings per share attributable to WESCO International were $184.3 million and $3.80 per share, respectively, for the year ended December 31, 2016.
24
Liquidity and Capital Resources
Total assets were $4.74 billion and $4.43 billion at December 31, 2017 and 2016, respectively. Total liabilities at December 31, 2017 and 2016 were $2.62 billion and $2.47 billion, respectively. Stockholders’ equity increased by 7.8% to $2.12 billion at December 31, 2017, compared with $1.96 billion at December 31, 2016, primarily as a result of net income of $163.5 million and foreign currency translation adjustments of $85.8 million, which were partially offset by the repurchase of company stock of $100.0 million, pursuant to the share repurchase plan announced on December 31, 2014.
The following table sets forth our outstanding indebtedness:
As of December 31, | |||||||
2017 | 2016 | ||||||
(In millions) | |||||||
International lines of credit | $ | 34.1 | $ | 20.9 | |||
Term Loan Facility, less debt discount of $0.5 and $0.8 in 2017 and 2016, respectively | 84.2 | 144.0 | |||||
Accounts Receivable Securitization Facility | 380.0 | 380.0 | |||||
Revolving Credit Facility | 12.0 | 4.0 | |||||
5.375% Senior Notes due 2021 | 500.0 | 500.0 | |||||
5.375% Senior Notes due 2024 | 350.0 | 350.0 | |||||
Capital leases | 2.0 | 2.9 | |||||
Total debt | 1,362.3 | 1,401.8 | |||||
Less unamortized debt issuance costs | (13.7 | ) | (16.5 | ) | |||
Less short-term debt and current portion of long-term debt | (35.3 | ) | (22.1 | ) | |||
Total long-term debt | $ | 1,313.3 | $ | 1,363.2 | |||
The required annual principal repayments for all indebtedness for the next five years and thereafter, as of December 31, 2017, is set forth in the following table:
(In millions) | |||
2018 | $ | 35.3 | |
2019 | 85.3 | ||
2020 | 392.2 | ||
2021 | 500.0 | ||
2022 | — | ||
Thereafter | 350.0 | ||
Total payments on debt | 1,362.8 | ||
Debt discount | (0.5 | ) | |
Total debt | $ | 1,362.3 | |
Our liquidity needs generally arise from fluctuations in our working capital requirements, capital expenditures, acquisitions and debt service obligations. As of December 31, 2017, we had $562.9 million in available borrowing capacity under our Revolving Credit Facility and $170.0 million in available borrowing capacity under our Receivables Facility, which combined with available cash of $60.9 million, provided liquidity of $793.8 million. Cash included in our determination of liquidity represents cash in deposit and interest bearing investment accounts. We believe cash provided by operations and financing activities will be adequate to cover our current operational and business needs.
We monitor the depository institutions that hold our cash and cash equivalents on a regular basis, and we believe that we have placed our deposits with creditworthy financial institutions. We also communicate on a regular basis with our lenders regarding our financial and working capital performance, liquidity position and financial leverage. Our financial leverage ratio was 3.5 as of December 31, 2017 and 2016. In addition, we are in compliance with all covenants and restrictions contained in our debt agreements as of December 31, 2017.
25
The following table sets forth the Company's financial leverage ratio as of December 31, 2017 and 2016:
Twelve months ended December 31, | 2017 | 2016 | |||||
(In millions, except ratios) | |||||||
Net income | $ | 163.1 | $ | 101.1 | |||
Provision for income taxes | 89.3 | 30.4 | |||||
Loss on debt redemption | — | 123.9 | |||||
Interest expense, net | 68.5 | 76.6 | |||||
Depreciation and amortization | 64.0 | 66.9 | |||||
Adjusted EBITDA | $ | 384.9 | $ | 398.9 | |||
December 31, 2017 | December 31, 2016 | ||||||
Short-term borrowings and current debt | $ | 35.3 | $ | 22.1 | |||
Long-term debt | 1,313.3 | 1,363.1 | |||||
Debt discount and debt issuance costs(1) | 14.2 | 17.3 | |||||
Total debt | $ | 1,362.8 | $ | 1,402.5 | |||
Financial leverage ratio based on total debt | 3.5 | 3.5 | |||||
(1) Long-term debt is presented in the Consolidated Balance Sheets net of debt discount and debt issuance costs.
Note: Financial leverage is a non-GAAP financial measure of debt usage. Financial leverage ratio is calculated by dividing total debt, including debt discount and debt issuance costs, by adjusted EBITDA. Adjusted EBITDA is defined as the trailing twelve months earnings before interest, taxes, depreciation and amortization, plus loss on debt redemption for 2016.
At December 31, 2017, we had cash and cash equivalents totaling $118.0 million, of which $78.5 million was held by foreign subsidiaries. The cash held by our foreign subsidiaries could be subject to additional income taxes if repatriated. We continue to believe that we are able to maintain a sufficient level of liquidity for our domestic operations and commitments without repatriation of the cash held by these foreign subsidiaries. However, as a result of the tax on the deemed repatriation of our undistributed foreign earnings and profits under the TCJA, we are reevaluating our intent and ability to repatriate foreign cash and will disclose in future filings any change in our intention and the resulting income tax impacts.
Over the next several quarters, we plan to closely manage working capital, and it is expected that excess cash will be directed primarily toward growth initiatives, acquisitions, debt reduction, and share repurchases. We remain focused on maintaining ample liquidity and credit availability. We anticipate capital expenditures in 2018 to be higher compared to 2017 as we continue to invest in our business. We believe our balance sheet and ability to generate ample cash flow provides us with a durable business model and should allow us to fund expansion needs and growth initiatives.
We finance our operating and investing needs as follows:
International Lines of Credit
Certain foreign subsidiaries of WESCO have entered into uncommitted lines of credit, which serve as overdraft facilities, to support local operations. The maximum borrowing limit varies by facility and ranges between $0.3 million and $21.0 million. The applicable interest rate for borrowings under these lines of credit varies by country and is governed by the applicable loan agreement. The international lines of credit are renewable on an annual basis and certain facilities are fully and unconditionally guaranteed by WESCO Distribution. Accordingly, borrowings under these lines directly reduce availability under the Revolving Credit Facility. The average interest rate for these facilities was 5.42% and 7.36% at December 31, 2017 and 2016, respectively.
Term Loan Facility
On December 12, 2012, WESCO Distribution, as U.S. borrower, WDCC Enterprises Inc. ("WDCC" and together with WESCO Distribution, the “Borrowers”), as Canadian borrower, and WESCO International entered into a Term Loan Agreement (the “Term Loan Agreement”) among WESCO Distribution, WDCC, the Company, the lenders party thereto and Credit Suisse AG Cayman Islands Branch, as administrative agent and as collateral agent.
The Term Loan Agreement provided a seven-year term loan facility (the “Term Loan Facility”), which consisted of two separate sub-facilities: (i) a Canadian sub-facility in an aggregate principal amount of CAD150 million, issued at a 2.0% discount, and (ii)
26
a U.S. sub-facility in an aggregate principal amount of $700 million, issued at a 1.0% discount. The proceeds of the Term Loan Facility were used to finance the acquisition of EECOL, and to pay fees and expenses incurred in connection with the acquisition and certain other transactions. Subject to the terms of the Term Loan Agreement, the Borrowers may request incremental term loans from time to time in an aggregate principal amount not to exceed at any time $300 million, with an equivalent principal amount in U.S. dollars being calculated for any incremental term loan denominated in Canadian dollars.
On November 19, 2013, the Borrowers and WESCO International entered into an amendment (the “Term Loan Amendment”) to the Term Loan Agreement. The Term Loan Amendment, among other things, reduced the applicable margin on U.S. term loans by 0.50% and the LIBOR floor applicable to the U.S. sub-facility from 1.00% to 0.75%. The modified pricing terms were effective December 13, 2013.
On November 26, 2013, WESCO Distribution sold $500 million aggregate principal amount of 5.375% Senior Notes due 2021 (the “2021 Notes”), and used the net proceeds plus excess cash to prepay $500 million under the Company's U.S. sub-facility of the Term Loan Facility (see discussion below under “5.375% Senior Notes due 2021” for additional information). The prepayment satisfied all remaining quarterly repayment obligations under the U.S. sub-facility. As of December 31, 2017, the amount outstanding under the U.S. sub-facility was $84.8 million. The Canadian sub-facility was fully repaid in 2015 using cash provided by Canadian operations.
Borrowings under the Term Loan Facility bear interest at base rates plus applicable margins. At December 31, 2017, the interest rate on borrowings under the U.S. sub-facility was 4.7%. To the extent not previously paid, the outstanding U.S. sub-facility will become due and payable on December 12, 2019, with any unpaid incremental term loans becoming due and payable on the respective maturity dates applicable to those incremental term loans. At any time or from time to time, the Borrowers may prepay borrowings under the Term Loan Facility in whole or in part without premium or penalty. The Borrowers' obligations under the Term Loan Facility are secured by substantially all of the assets of the Borrowers, the Company and certain of the Company's other subsidiaries; provided that, with respect to borrowings under the U.S. sub-facility, the collateral does not include assets of certain foreign subsidiaries or more than 65% of the issued and outstanding equity interests in certain foreign subsidiaries.
The Term Loan Facility contains customary affirmative and negative covenants for credit facilities of this type. The Term Loan Facility also provides for customary events of default.
Accounts Receivable Securitization Facility
On November 8, 2017, WESCO Distribution amended its accounts receivable securitization facility (the "Receivables Facility") pursuant to the terms and conditions of a Fifth Amendment to Fourth Amended and Restated Receivables Purchase Agreement, by and among WESCO Receivables Corp. (“WESCO Receivables”), WESCO Distribution, the various purchasers from time to time party thereto and PNC Bank, National Association, as Administrator (the "Amendment"). The Amendment extended the term of the Receivables Facility to September 24, 2020 and added and amended certain other defined terms. Substantially all other terms and conditions of the Receivables Facility remain unchanged.
The Receivables Facility has a purchase limit of $550 million with the opportunity to exercise an accordion feature that permits increases in the purchase limit of up to $100 million. The interest rate spread and commitment fee of the Receivables Facility is 0.95% and 0.45%, respectively.
Under the Receivables Facility, WESCO sells, on a continuous basis, an undivided interest in all domestic accounts receivable to WESCO Receivables, a wholly owned special purpose entity (the “SPE”). The SPE sells, without recourse, a senior undivided interest in the receivables to financial institutions for cash while maintaining a subordinated undivided interest in the receivables, in the form of overcollateralization. WESCO has agreed to continue servicing the sold receivables for the third-party conduits and financial institutions at market rates; accordingly, no servicing asset or liability has been recorded.
As of December 31, 2017 and 2016, accounts receivable eligible for securitization totaled $751.2 million and $657.5 million, respectively. The Consolidated Balance Sheets as of December 31, 2017 and 2016 include $380.0 million, for both periods ended, account receivable balances legally sold to third parties, as well as borrowings for equal amounts. At December 31, 2017, the interest rate for this facility was approximately 1.9%.
Revolving Credit Facility
On September 24, 2015, WESCO International, WESCO Distribution and certain other subsidiaries of the Company entered into a $600 million revolving credit facility (the “Revolving Credit Facility”), which contains a letter of credit sub-facility of up to $125 million, pursuant to the terms and conditions of a Second Amended and Restated Credit Agreement (the "Credit Agreement"). The Revolving Credit Facility contains an accordion feature allowing WESCO Distribution to request increases to the borrowing commitments of up to $200 million in the aggregate, subject to customary conditions.
The Revolving Credit Facility matures in September 2020 and consists of two separate sub-facilities: (i) a Canadian sub-facility with a borrowing limit of up to $400 million, which is collateralized by substantially all assets of WESCO Canada and the other
27
Canadian Borrowers, other than, among other things, real property, in each case, subject to customary exceptions and limitations, and (ii) a U.S sub-facility with a borrowing limit of up to $600 million less the amount of outstanding borrowings under the Canadian sub-facility. The U.S. sub-facility is collateralized by substantially all assets of WESCO Distribution and its subsidiaries which are party to the Credit Agreement, other than, among other things, real property and accounts receivable sold or intended to be sold pursuant to the Receivables Purchase Agreement. The applicable interest rate for borrowings under the Revolving Credit Facility includes interest rate spreads based on available borrowing capacity that range between 1.25% and 1.75% for LIBOR-based borrowings and 0.25% and 0.75% for prime rate-based borrowings. At December 31, 2017, the interest rate for this facility was approximately 3.0%.
The Credit Agreement requires ongoing compliance with certain customary affirmative and negative covenants. The Credit Agreement also contains customary events of default.
During 2017, WESCO borrowed $834.4 million under the Revolving Credit Facility and made repayments in the aggregate amount of $826.4 million. During 2016, aggregate borrowings and repayments were $1,025.8 million and $1,096.8 million, respectively. WESCO had $562.9 million available under the Revolving Credit facility at December 31, 2017, after giving effect to $18.0 million of outstanding letters of credit, $19.5 million of surety bonds, and $7.1 million of other reserves, as compared to $509.7 million available under the Revolving Credit facility at December 31, 2016, after giving effect to $20.1 million of outstanding letters of credit, $16.2 million of surety bonds, and $6.4 million of other reserves.
5.375% Senior Notes due 2021
In November 2013, WESCO Distribution issued $500 million aggregate principal amount of 2021 Notes through a private offering exempt from the registration requirements of the Securities Act of 1933, as amended (the “Securities Act”). The 2021 Notes were issued at 100% of par and are governed by an indenture (the “2021 Indenture”) entered into on November 26, 2013 between WESCO International and U.S. Bank National Association, as trustee. The 2021 Notes are unsecured senior obligations of WESCO Distribution and are guaranteed on a senior unsecured basis by WESCO International. The 2021 Notes bear interest at a stated rate of 5.375%, payable semi-annually in arrears on June 15 and December 15 of each year. In addition, we incurred costs related to the issuance of the 2021 Notes totaling $8.4 million, which are recorded as a reduction to the carrying value of the debt and are being amortized over the life of the notes. The 2021 Notes mature on December 15, 2021. The net proceeds of the 2021 Notes were used to prepay a portion of the U.S. sub-facility of the term loans due 2019.
Under the terms of a registration rights agreement dated as of November 26, 2013 among WESCO Distribution, WESCO International and Merrill Lynch, Pierce, Fenner & Smith Incorporated, as the representative of the initial purchasers of the 2021 Notes, WESCO Distribution and WESCO International agreed to register under the Securities Act notes having terms identical in all material respects to the 2021 Notes (the “2021 Exchange Notes”) and to make an offer to exchange the 2021 Exchange Notes for the 2021 Notes. WESCO Distribution launched the exchange offer on June 12, 2014 and the exchange offer expired on July 17, 2014.
At any time WESCO Distribution may redeem all or a part of the 2021 Notes. Between December 15, 2017 and December 14, 2018, WESCO Distribution may redeem all or a part of the 2021 Notes at a redemption price equal to 102.688% of the principal amount. Between December 15, 2018 and December 14, 2019, WESCO Distribution may redeem all or a part of the 2021 Notes at a redemption price equal to 101.344% of the principal amount. On and after December 15, 2019, WESCO Distribution may redeem all or a part of the 2021 Notes at a redemption price equal to 100% of the principal amount.
The 2021 Indenture contains customary covenants and customary events of default. In addition, upon a change of control, the holders of 2021 Notes have the right to require WESCO Distribution to repurchase all or any part of the 2021 Notes at a redemption price equal to 101% of the principal amount, plus accrued and unpaid interest.
5.375% Senior Notes due 2024
In June 2016, WESCO Distribution issued $350 million aggregate principal amount of 5.375% Senior Notes due 2024 (the "2024 Notes") through a private offering exempt from the registration requirements of the Securities Act. The 2024 Notes were issued at 100% of par and are governed by an indenture (the “2024 Indenture”) entered into on June 15, 2016 among WESCO Distribution, as issuer, WESCO International, as parent guarantor, and U.S. Bank National Association, as trustee. The 2024 Notes are unsecured senior obligations of WESCO Distribution and are guaranteed on a senior unsecured basis by WESCO International. The 2024 Notes bear interest at a rate of 5.375% per annum, payable semi-annually in arrears on June 15 and December 15 of each year, commencing on December 15, 2016. We incurred costs totaling $6.0 million to issue the 2024 Notes, which are recorded as a reduction to the carrying value of the debt and are being amortized over the life of the note. The notes mature on June 15, 2024. The Company used the net proceeds to redeem its 2029 Debentures on September 15, 2016.
Under the terms of a registration rights agreement dated as of June 15, 2016 among WESCO Distribution, as the issuer, WESCO International, as parent guarantor, and Goldman, Sachs & Co., as representative of the initial purchasers of the 2024 Notes, WESCO Distribution and WESCO International agreed to register under the Securities Act notes having terms identical in all material
28
respects to the 2024 Notes (the “2024 Exchange Notes”) and to make an offer to exchange the 2024 Exchange Notes for the 2024 Notes. WESCO Distribution launched the exchange offer on December 28, 2016 and the exchange offer expired on January 31, 2017.
At any time on or after June 15, 2019, WESCO Distribution may redeem all or a part of the 2024 Notes. Between June 15, 2019 and June 14, 2020, WESCO Distribution may redeem all or a part of the 2024 Notes at a redemption price equal to 104.031% of the principal amount. Between June 15, 2020 and June 14, 2021, WESCO Distribution may redeem all or a part of the 2024 Notes at a redemption price equal to 102.688% of the principal amount. Between June 15, 2021 and June 14, 2022, WESCO Distribution may redeem all or a part of the 2024 Notes at a redemption price equal to 101.344% of the principal amount. On and after June 15, 2022, WESCO Distribution may redeem all or a part of the 2024 Notes at a redemption price equal to 100% of the principal amount.
The 2024 Indenture contains customary covenants and events of default. Upon a change of control, the holders of the 2024 Notes have the right to require WESCO Distribution to repurchase all or any part of the 2024 Notes at a redemption price equal to 101% of the principal amount thereof, plus accrued and unpaid interest.
6.0% Convertible Senior Debentures due 2029
On August 27, 2009, WESCO International completed an exchange offer pursuant to which it issued $345 million in aggregate principal amount of the 2029 Debentures. On September 15, 2016, the Company redeemed the 2029 Debentures. Holders of the 2029 Debentures received cash totaling $344.8 million, which was equal to the principal amount of the then-outstanding debentures, in addition to accrued and unpaid interest. Holders who surrendered the 2029 Debentures for conversion received 18 shares of WESCO stock for each $1,000 principal amount of 2029 Debentures converted. In total, 6,267,688 shares were issued on the redemption date. The redemption resulted in a non-cash loss of $123.9 million, which included the write off of unamortized debt issuance costs.
WESCO separately accounted for the liability and equity components of its 2029 Debentures in a manner that reflected its non-convertible debt borrowing rate. WESCO utilized an interest rate of 13.875% to reflect the non-convertible debt borrowing rate of its offering upon issuance, which was determined based on discussions with its financial institutions and a review of relevant market data, and resulted in a $181.2 million discount to the 2029 Debenture balance and a net increase in additional capital of $106.5 million. In addition, the financing costs incurred to issue the 2029 Debentures were allocated between the instrument's debt and equity components. WESCO amortized the debt discount and financing costs over the life of the instrument. For the years ended December 31, 2016 and 2015, non-cash interest expense for the amortization of the debt discount and debt issuance costs was $3.1 million and $4.2 million, respectively.
Covenant Compliance
We were in compliance with all relevant covenants contained in our debt agreements as of December 31, 2017.
Cash Flow
An analysis of cash flows for 2017 and 2016 follows:
Operating Activities. Cash provided by operating activities for 2017 totaled $149.1 million, compared with $300.3 million of cash generated in 2016. Cash provided by operating activities included net income of $163.1 million and adjustments to net income totaling $28.5 million. Sources of cash in 2017 were generated from an increase in accounts payable of $102.9 million, as a result of the increase in sales, an increase in noncurrent liabilities of $64.8 million, due to an accrued tax liability related to the taxation of undistributed earnings of foreign subsidiares under the TCJA, an increase in accrued payroll and benefit costs of $24.7 million related to incentive compensation and a decrease in prepaid expenses and other current assets of $11.3 million, as a result of changes in other income taxes. Primary uses of cash in 2017 included a $119.0 million and a $113.0 million increase in inventory and trade receivables, respectively, as a result of an increase in customer backlog as well as an increase in sales, and a $14.2 million increase in other accounts receivable, primarily related to the increase in supplier volume rebate accruals.
Cash provided by operating activities for 2016 totaled $300.2 million, compared with $283.1 million of cash generated in 2015. Cash provided by operating activities included net income of $101.1 million and adjustments to net income totaling $159.3 million, which included a loss on the redemption of our convertible debt of $123.9 million. Sources of cash in 2016 were generated from a decrease in trade receivables of $56.8 million, an increase in other current and noncurrent liabilities of $15.7 million, and a decrease in prepaid expenses and other noncurrent assets of $13.2 million. Primary uses of cash in 2016 included a $40.6 million decrease in accounts payable, a $1.9 million decrease in accrued payroll and benefit costs, and decreases in other accounts receivable and inventories of $1.6 million. In 2015, primary sources of cash were net income of $208.4 million and adjustments to net income totaling $121.2 million. Other sources of cash in 2015 were generated from decreases in other accounts receivable of $57.2 million, trade receivables of $40.1 million and inventories of $2.4 million. Primary uses of cash in 2015 included a $66.8 million decrease
29
in other current and noncurrent liabilities, a $55.9 million decrease in accounts payable, a $15.0 million decrease in accrued payroll and benefit costs, and an $8.5 million increase in prepaid expenses and other noncurrent assets.
Investing Activities. Net cash used in investing activities in 2017 was $5.3 million, compared with $70.5 million of net cash used in 2016, which included a payment of $50.9 million primarily related to the acquisition of Atlanta Electrical Distributors, LLC. Capital expenditures were $21.5 million and $18.0 million in 2017 and 2016, respectively. Proceeds from the sale of assets were $6.8 million and $8.4 million in 2017 and 2016, respectively. Other investing activities in 2017 included $9.4 million of cash inflows from the maturity of a foreign investment.
Net cash used in investing activities in 2016 was $70.5 million, compared with $170.2 million of net cash used in 2015. Capital expenditures were $18.0 million and $21.7 million in 2016 and 2015, respectively. Proceeds from the sale of assets were $8.4 million and $3.0 million in 2016 and 2015, respectively. During 2016, the Company had $50.9 million of acquisition payments, primarily related to Atlanta Electrical Distributors, LLC, compared to $151.6 million in 2015, primarily to acquire Hill Country Electric Supply, LP and Needham Electric Supply Corporation. Other investing activities in 2016 were $10.0 million.
Financing Activities. Net cash used in financing activities in 2017 was $141.2 million, compared with $276.3 million in 2016. During 2017, financing activities consisted of borrowings and repayments of $834.4 million and $826.4 million, respectively, related to our Revolving Credit Facility, borrowings and repayments of $670.2 million, related to our Receivables Facility, repayments of $60.0 million related to our Term Loan Facility, as well as borrowings and repayments of $175.8 million and $164.0 million, respectively, related to our international lines of credit. Financing activities in 2017 also included the repurchase of $106.8 million of the Company's common stock, of which $100.0 million was pursuant to the share repurchase plan announced on December 17, 2014.
Net cash used in financing activities in 2016 was $276.3 million, compared with $67.8 million in 2015. During 2016, financing activities consisted of borrowings and repayments of $1.03 billion and $1.10 billion, respectively, related to our Revolving Credit Facility, borrowings and repayments of $706.9 million and $851.9 million, respectively, related to our Receivables Facility, proceeds from the issuance of the 2024 Notes of $350.0 million, a payment of $344.8 million to redeem the 2029 Debentures and repayments of $30.0 million applied to our Term Loan Facility. Financing activities in 2016 also included borrowings and repayments on our various international lines of credit of $111.5 million and $131.5 million, respectively.
Contractual Cash Obligations and Other Commercial Commitments
The following summarizes our contractual obligations, including interest, at December 31, 2017 and the effect such obligations are expected to have on liquidity and cash flow in future periods.
2018 | 2019 to 2020 | 2021 to 2022 | 2023 - After | Total | |||||||||||||||
(In millions) | |||||||||||||||||||
Contractual cash obligations (including interest): | |||||||||||||||||||
Debt, excluding debt discount and debt issuance costs | $ | 35.3 | $ | 477.5 | $ | 500.0 | $ | 350.0 | $ | 1,362.8 | |||||||||
Interest on indebtedness(1) | 58.8 | 108.3 | 63.4 | 28.3 | 258.8 | ||||||||||||||
Non-cancelable operating leases | 65.5 | 99.4 | 57.4 | 49.2 | 271.5 | ||||||||||||||
Taxes due on deemed repatriation of foreign earnings(2) | 4.2 | 12.2 | 9.7 | 38.9 | 65.0 | ||||||||||||||
Total contractual cash obligations | $ | 163.8 | $ | 697.4 | $ | 630.5 | $ | 466.4 | $ | 1,958.1 | |||||||||
(1) | Interest on the variable rate debt was calculated using the rates and balances outstanding at December 31, 2017. |
(2) Included in the table above is a provisional estimate of the U.S. federal and state income taxes due under the deemed repatriation provisions of the TCJA, net of available foreign tax credits, that will be paid over 8 years. Absent guidance from the states on whether or not they will conform to the TCJA's repatriation provisions, management has assumed that the provisional state tax liability will be payable when the relevant 2017 and 2018 tax returns are filed.
Purchase orders for inventory requirements and service contracts are not included in the table above. Generally, our purchase orders and contracts contain clauses allowing for cancellation. We do not have significant agreements to purchase material or goods that would specify minimum order quantities. Also, we do not consider liabilities for uncertain tax benefits to be contractual obligations requiring disclosure due to the uncertainty surrounding the ultimate settlement and timing of these liabilities. As such, we have not included liabilities for uncertain tax benefits of $4.8 million in the table above.
30
Inflation
The rate of inflation, as measured by changes in the producer price index, affects different commodities, the cost of products purchased and ultimately the pricing of our different products and product classes to our customers. Our pricing related to inflation did not have a measurable impact on our sales revenue for the year. Historically, price changes from suppliers have been consistent with inflation and have not had a material impact on the results of our operations.
Seasonality
Sales during the first quarter are affected by a reduced level of activity. Sales during the second, third and fourth quarters are generally 6 - 8% higher than the first quarter. Sales typically increase beginning in March, with slight fluctuations per month through October. During periods of economic expansion or contraction, our sales by quarter have varied significantly from this pattern.
Impact of Recently Issued Accounting Standards
See Note 2 of the Notes to Consolidated Financial Statements for information regarding the effect of new accounting pronouncements.
Item 7A. Quantitative and Qualitative Disclosures about Market Risks.
Foreign Currency Risks
Approximately 25% of our sales in 2017 were made by our foreign subsidiaries located in North America, South America, Europe, Africa, and Asia and are denominated in foreign currencies. We may establish additional foreign subsidiaries in the future. Accordingly, we may derive a larger portion of our sales from international operations, and a portion of these sales may be denominated in foreign currencies. As a result, our future operating results could become subject to fluctuations in foreign exchange rates relative to the U.S. dollar. Furthermore, to the extent that we engage in international sales denominated in U.S. dollars, an increase in the value of the U.S. dollar relative to foreign currencies could make our products less competitive in international markets. We have monitored and will continue to monitor our exposure to currency fluctuations.
Interest Rate Risk
Fixed Rate Borrowings: Approximately 63% of our debt portfolio is comprised of fixed rate debt. At various times, we have refinanced our debt to mitigate the impact of interest rate fluctuations. As the 2021 Notes and 2024 Notes were issued at fixed rates, interest expense would not be impacted by interest rate fluctuations, although market value would be. For the 2021 Notes and 2024 Notes, fair value approximated carrying value (see Note 7 to the Consolidated Financial Statements).
Floating Rate Borrowings: The Company's variable rate borrowings at December 31, 2017 were comprised of the amounts outstanding under the Term Loan Facility, Receivables Facility, Revolving Credit Facility, and the international lines of credit. The fair value of these debt instruments at December 31, 2017 approximated carrying value. We entered into the Term Loan Facility on December 12, 2012 and the proceeds were primarily used to finance the acquisition of EECOL. Borrowings under the U.S. sub-facility of the Term Loan Facility bear interest at 0.75% or, if greater, the applicable LIBOR (London Interbank Offered Rate) or base rates plus applicable margins and therefore are subject to fluctuations in interest rates. We borrow under our Revolving Credit Facility and Receivables Facility for general corporate purposes, including working capital requirements and capital expenditures. Borrowings under our Revolving Credit Facility bear interest at the applicable LIBOR / CDOR (Canadian Dealer Offered Rate) or base rates plus applicable margins, whereas borrowings under the Receivables Facility bear interest at the 30 day LIBOR plus applicable margins. A 100 basis point increase or decrease in interest rates would not have a significant impact on future earnings under our current capital structure.
Defined Benefit Pension Plan: The interest rate used to discount future estimated cash flows is determined using the Canadian Institute of Actuaries ("CIA") methodology, which references yield curve information provided by Fiera Capital. The discount rate used to determine the projected benefit obligations for the Canadian pensions was 3.5% at December 31, 2017. An increase in the discount rate of one percent would decrease the projected benefit obligations by $22.0 million, and a decrease in the discount rate of one percent would increase the projected benefit obligations by $29.7 million. The impact of a change in the discount rate of one percent would be either a charge of $2.0 million or a credit of $1.4 million to earnings in the following year.
31
Item 8. Financial Statements and Supplementary Data.
The information required by this item is set forth in our Consolidated Financial Statements contained in this Annual Report on Form 10-K. Specific financial statements can be found at the pages listed below:
PAGE | |
32
Report of Independent Registered Public Accounting Firm
To the Board of Directors and Stockholders of WESCO International, Inc.
Opinions on the Financial Statements and Internal Control over Financial Reporting
We have audited the accompanying consolidated balance sheets of WESCO International, Inc. and its subsidiaries as of December 31, 2017 and 2016, and the related consolidated statements of income and comprehensive income (loss), of stockholders’ equity and of cash flows for each of the three years in the period ended December 31, 2017, including the related notes and schedule of valuation and qualifying accounts for each of the three years in the period ended December 31, 2017 listed in the index appearing under Item 15(a)(2) (collectively referred to as the “consolidated financial statements”). We also have audited the Company's internal control over financial reporting as of December 31, 2017, based on criteria established in Internal Control - Integrated Framework (2013) issued by the Committee of Sponsoring Organizations of the Treadway Commission (COSO).
In our opinion, the consolidated financial statements referred to above present fairly, in all material respects, the financial position of the Company as of December 31, 2017 and 2016, and the results of its operations and its cash flows for each of the three years in the period ended December 31, 2017 in conformity with accounting principles generally accepted in the United States of America. Also in our opinion, the Company maintained, in all material respects, effective internal control over financial reporting as of December 31, 2017, based on criteria established in Internal Control - Integrated Framework (2013) issued by the COSO.
Basis for Opinions
The Company's management is responsible for these consolidated financial statements, for maintaining effective internal control over financial reporting, and for its assessment of the effectiveness of internal control over financial reporting, included in Management’s Report on Internal Control over Financial Reporting appearing under Item 9A. Our responsibility is to express opinions on the Company’s consolidated financial statements and on the Company's internal control over financial reporting based on our audits. We are a public accounting firm registered with the Public Company Accounting Oversight Board (United States) ("PCAOB") and are required to be independent with respect to the Company in accordance with the U.S. federal securities laws and the applicable rules and regulations of the Securities and Exchange Commission and the PCAOB.
We conducted our audits in accordance with the standards of the PCAOB. Those standards require that we plan and perform the audits to obtain reasonable assurance about whether the consolidated financial statements are free of material misstatement, whether due to error or fraud, and whether effective internal control over financial reporting was maintained in all material respects.
Our audits of the consolidated financial statements included performing procedures to assess the risks of material misstatement of the consolidated financial statements, whether due to error or fraud, and performing procedures that respond to those risks. Such procedures included examining, on a test basis, evidence regarding the amounts and disclosures in the consolidated financial statements. Our audits also included evaluating the accounting principles used and significant estimates made by management, as well as evaluating the overall presentation of the consolidated financial statements. Our audit of internal control over financial reporting included obtaining an understanding of internal control over financial reporting, assessing the risk that a material weakness exists, and testing and evaluating the design and operating effectiveness of internal control based on the assessed risk. Our audits also included performing such other procedures as we considered necessary in the circumstances. We believe that our audits provide a reasonable basis for our opinions.
Definition and Limitations of Internal Control over Financial Reporting
A company’s internal control over financial reporting is a process designed to provide reasonable assurance regarding the reliability of financial reporting and the preparation of financial statements for external purposes in accordance with generally accepted accounting principles. A company’s internal control over financial reporting includes those policies and procedures that (i) pertain to the maintenance of records that, in reasonable detail, accurately and fairly reflect the transactions and dispositions of the assets of the company; (ii) provide reasonable assurance that transactions are recorded as necessary to permit preparation of financial statements in accordance with generally accepted accounting principles, and that receipts and expenditures of the company are being made only in accordance with authorizations of management and directors of the company; and (iii) provide reasonable assurance regarding prevention or timely detection of unauthorized acquisition, use, or disposition of the company’s assets that could have a material effect on the financial statements.
33
Because of its inherent limitations, internal control over financial reporting may not prevent or detect misstatements. Also, projections of any evaluation of effectiveness to future periods are subject to the risk that controls may become inadequate because of changes in conditions, or that the degree of compliance with the policies or procedures may deteriorate.
/s/ PricewaterhouseCoopers LLP
Pittsburgh, Pennsylvania
February 21, 2018
We have served as the Company’s auditor since 1994.
34
CONSOLIDATED BALANCE SHEETS | |||||||
As of December 31, | |||||||
2017 | 2016 | ||||||
(In thousands, except share data) | |||||||
Assets | |||||||
Current assets: | |||||||
Cash and cash equivalents | $ | 117,953 | $ | 110,131 | |||
Trade accounts receivable, net of allowance for doubtful accounts of $21,313 and $22,007 | |||||||
in 2017 and 2016, respectively | 1,170,080 | 1,034,402 | |||||
Other accounts receivable | 101,229 | 85,019 | |||||
Inventories | 956,148 | 821,441 | |||||
Income taxes receivable (Note 2) | 23,250 | 5,725 | |||||
Prepaid expenses and other current assets (Note 2) | 40,189 | 46,360 | |||||
Total current assets | 2,408,849 | 2,103,078 | |||||
Property, buildings and equipment, net (Note 6) | 156,445 | 157,607 | |||||
Intangible assets, net (Note 3) | 367,104 | 393,362 | |||||
Goodwill (Notes 2 and 3) | 1,771,877 | 1,730,950 | |||||
Deferred income taxes (Note 9) | 24,203 | 15,803 | |||||
Other assets | 6,990 | 31,041 | |||||
Total assets | $ | 4,735,468 | $ | 4,431,841 | |||
Liabilities and Stockholders’ Equity | |||||||
Current liabilities: | |||||||
Accounts payable | $ | 799,520 | $ | 684,721 | |||
Accrued payroll and benefit costs (Note 11) | 72,686 | 49,250 | |||||
Short-term debt (Note 7) | 34,075 | 20,920 | |||||
Current portion of long-term debt (Note 7) | 1,224 | 1,218 | |||||
Bank overdrafts | 37,644 | 29,384 | |||||
Income taxes payable (Note 2) | 9,712 | 9,881 | |||||
Other current liabilities | 86,108 | 78,425 | |||||
Total current liabilities | 1,040,969 | 873,799 | |||||
Long-term debt, net of debt discount and debt issuance costs of $14,224 and $17,278 | |||||||
in 2017 and 2016, respectively (Note 7) | 1,313,261 | 1,363,135 | |||||
Deferred income taxes (Notes 2 and 9) | 136,858 | 168,245 | |||||
Other noncurrent liabilities | 128,237 | 63,031 | |||||
Total liabilities | $ | 2,619,325 | $ | 2,468,210 | |||
Commitments and contingencies (Note 13) | |||||||
Stockholders’ Equity: | |||||||
Preferred stock, $.01 par value; 20,000,000 shares authorized, no shares issued or outstanding (Note 8) | — | — | |||||
Common stock, $.01 par value; 210,000,000 shares authorized, 59,045,762 and 58,817,781 shares issued and 47,009,540 and 48,611,497 shares outstanding in 2017 and 2016, respectively (Note 8) | 591 | 588 | |||||
Class B nonvoting convertible common stock, $.01 par value; 20,000,000 shares authorized, 4,339,431 issued and no shares outstanding in 2017 and 2016, respectively | 43 | 43 | |||||
Additional capital | 999,156 | 986,020 | |||||
Retained earnings (Note 2) | 2,079,697 | 1,914,757 | |||||
Treasury stock, at cost; 16,375,653 and 14,545,715 shares in 2017 and 2016, respectively | (647,158 | ) | (542,537 | ) | |||
Accumulated other comprehensive loss (Note 2) | (312,590 | ) | (391,971 | ) | |||
Total WESCO International, Inc. stockholders' equity | 2,119,739 | 1,966,900 | |||||
Noncontrolling interests | (3,596 | ) | (3,269 | ) | |||
Total stockholders’ equity | 2,116,143 | 1,963,631 | |||||
Total liabilities and stockholders’ equity | $ | 4,735,468 | $ | 4,431,841 | |||
35
CONSOLIDATED STATEMENTS OF INCOME AND COMPREHENSIVE INCOME (LOSS) | |||||||||||
Year Ended December 31, | |||||||||||
2017 | 2016 | 2015 | |||||||||
(In thousands, except per share data) | |||||||||||
Net sales | $ | 7,679,021 | $ | 7,336,017 | $ | 7,518,487 | |||||
Cost of goods sold (excluding depreciation and amortization) | 6,194,366 | 5,887,814 | 6,024,826 | ||||||||
Selling, general and administrative expenses | 1,099,748 | 1,049,286 | 1,054,951 | ||||||||
Depreciation and amortization | 64,017 | 66,858 | 64,968 | ||||||||
Income from operations | 320,890 | 332,059 | 373,742 | ||||||||
Interest expense, net | 68,450 | 76,575 | 69,832 | ||||||||
Loss on debt redemption (Note 7) | — | 123,933 | — | ||||||||
Income before income taxes | 252,440 | 131,551 | 303,910 | ||||||||
Provision for income taxes (Note 9) | 89,307 | 30,431 | 95,537 | ||||||||
Net income | 163,133 | 101,120 | 208,373 | ||||||||
Less: Net loss attributable to noncontrolling interests | (327 | ) | (468 | ) | (2,314 | ) | |||||
Net income attributable to WESCO International, Inc. | $ | 163,460 | $ | 101,588 | $ | 210,687 | |||||
Other comprehensive income (loss): | |||||||||||
Foreign currency translation adjustments | 85,762 | 38,275 | (225,795 | ) | |||||||
Post retirement benefit plan adjustments, net of tax (Note 11) | (6,381 | ) | (2,485 | ) | 4,532 | ||||||
Comprehensive income (loss) attributable to WESCO International, Inc. | $ | 242,841 | $ | 137,378 | $ | (10,576 | ) | ||||
Earnings per share attributable to WESCO International, Inc. (Note 10) | |||||||||||
Basic | $ | 3.42 | $ | 2.30 | $ | 4.85 | |||||
Diluted | $ | 3.38 | $ | 2.10 | $ | 4.18 | |||||
The accompanying notes are an integral part of the consolidated financial statements.
36
CONSOLIDATED STATEMENTS OF STOCKHOLDERS’ EQUITY | |||||||||||||||||||||||||||||||||||||
Accumulated Other | |||||||||||||||||||||||||||||||||||||
Class B | Retained | Comprehensive | |||||||||||||||||||||||||||||||||||
Common Stock | Common Stock | Additional | Earnings | Treasury Stock | Noncontrolling | Income | |||||||||||||||||||||||||||||||
(In thousands) | Amount | Shares | Amount | Shares | Capital | (Deficit) | Amount | Shares | Interests | (Loss) | |||||||||||||||||||||||||||
Balance, December 31, 2014 | $ | 584 | 58,400,736 | $ | 43 | 4,339,431 | $ | 1,102,369 | $ | 1,602,139 | $ | (616,366 | ) | (18,250,178 | ) | $ | (487 | ) | $ | (206,498 | ) | ||||||||||||||||
Exercise of stock-based awards, including tax benefit of $1,403 | 2 | 230,206 | 1,344 | (3,300 | ) | (44,267 | ) | ||||||||||||||||||||||||||||||
Stock-based compensation expense | 12,899 | ||||||||||||||||||||||||||||||||||||
Conversion of 2029 Debentures, net of tax | — | 427 | (2 | ) | |||||||||||||||||||||||||||||||||
Repurchase of common stock | 3,013 | (153,013 | ) | (2,468,576 | ) | ||||||||||||||||||||||||||||||||
Tax withholding related to vesting of restricted stock units and retirement of common stock | — | (33,989 | ) | (2,202 | ) | (145 | ) | ||||||||||||||||||||||||||||||
Noncontrolling interests | (2,314 | ) | |||||||||||||||||||||||||||||||||||
Net income attributable to WESCO | 210,687 | ||||||||||||||||||||||||||||||||||||
Translation adjustments | (225,795 | ) | |||||||||||||||||||||||||||||||||||
Benefit plan adjustments, net of tax effect of $1,661 | 4,532 | ||||||||||||||||||||||||||||||||||||
Balance, December 31, 2015 | $ | 586 | 58,597,380 | $ | 43 | 4,339,431 | $ | 1,117,421 | $ | 1,812,681 | $ | (772,679 | ) | (20,763,021 | ) | $ | (2,801 | ) | $ | (427,761 | ) | ||||||||||||||||
Exercise of stock-based awards, including tax benefit of $67 | 2 | 230,464 | (2,876 | ) | (3,224 | ) | (44,191 | ) | |||||||||||||||||||||||||||||
Stock-based compensation expense | 12,493 | ||||||||||||||||||||||||||||||||||||
Conversion of 2029 Debentures, net of tax | — | 7,295 | (139,765 | ) | 233,366 | 6,261,497 | |||||||||||||||||||||||||||||||
Tax withholding related to vesting of restricted stock units and retirement of common stock | — | (17,358 | ) | (1,253 | ) | 488 | |||||||||||||||||||||||||||||||
Noncontrolling interests | (468 | ) | |||||||||||||||||||||||||||||||||||
Net income attributable to WESCO | 101,588 | ||||||||||||||||||||||||||||||||||||
Translation adjustments | 38,275 | ||||||||||||||||||||||||||||||||||||
Benefit plan adjustments, net of tax effect of $302 | (2,485 | ) | |||||||||||||||||||||||||||||||||||
Balance, December 31, 2016 | $ | 588 | 58,817,781 | $ | 43 | 4,339,431 | $ | 986,020 | $ | 1,914,757 | $ | (542,537 | ) | (14,545,715 | ) | $ | (3,269 | ) | $ | (391,971 | ) | ||||||||||||||||
Exercise of stock-based awards | 3 | 243,361 | (407 | ) | (4,583 | ) | (51,501 | ) | |||||||||||||||||||||||||||||
Stock-based compensation expense | 14,809 | ||||||||||||||||||||||||||||||||||||
Repurchase of common stock | 38 | (100,038 | ) | (1,778,537 | ) | ||||||||||||||||||||||||||||||||
Tax withholding related to vesting of restricted stock units and retirement of common stock | — | (15,380 | ) | (1,304 | ) | 1,480 | |||||||||||||||||||||||||||||||
Noncontrolling interests | (327 | ) | |||||||||||||||||||||||||||||||||||
Net income attributable to WESCO | 163,460 | ||||||||||||||||||||||||||||||||||||
Translation adjustments | 85,762 | ||||||||||||||||||||||||||||||||||||
Benefit plan adjustments, net of tax effect of $2,361 | (6,381 | ) | |||||||||||||||||||||||||||||||||||
Balance, December 31, 2017 | $ | 591 | 59,045,762 | $ | 43 | 4,339,431 | $ | 999,156 | $ | 2,079,697 | $ | (647,158 | ) | (16,375,753 | ) | $ | (3,596 | ) | $ | (312,590 | ) | ||||||||||||||||
The accompanying notes are an integral part of the consolidated financial statements.
37
CONSOLIDATED STATEMENTS OF CASH FLOWS
The accompanying notes are an integral part of the consolidated financial statements.
Year Ended December 31, | |||||||||||
2017 | 2016 | 2015 | |||||||||
(In thousands) | |||||||||||
Operating Activities: | |||||||||||
Net income | $ | 163,133 | $ | 101,120 | $ | 208,373 | |||||
Adjustments to reconcile net income to net cash provided by operating activities: | |||||||||||
Depreciation and amortization | 64,017 | 66,858 | 64,968 | ||||||||
Stock-based compensation expense | 14,809 | 12,493 | 12,899 | ||||||||
Amortization of debt discount and debt issuance costs | 3,984 | 6,684 | 12,195 | ||||||||
Loss on debt redemption (Note 7) | — | 123,933 | — | ||||||||
Gain on sale of property, buildings and equipment | (4,038 | ) | (4,702 | ) | (45 | ) | |||||
Other operating activities | 79 | (836 | ) | (11,627 | ) | ||||||
Deferred income taxes | (50,396 | ) | (45,174 | ) | 42,850 | ||||||
Changes in assets and liabilities: | |||||||||||
Trade receivables, net | (112,977 | ) | 56,767 | 40,102 | |||||||
Other accounts receivable | (14,163 | ) | (1,628 | ) | 57,242 | ||||||
Inventories | (119,002 | ) | (1,612 | ) | 2,410 | ||||||
Prepaid expenses and other assets | 11,334 | 13,207 | (8,517 | ) | |||||||
Accounts payable | 102,870 | (40,607 | ) | (55,914 | ) | ||||||
Accrued payroll and benefit costs | 24,679 | (1,922 | ) | (15,015 | ) | ||||||
Other current and noncurrent liabilities | 64,793 | 15,654 | (66,872 | ) | |||||||
Net cash provided by operating activities | 149,122 | 300,235 | 283,049 | ||||||||
Investing Activities: | |||||||||||
Capital expenditures | (21,507 | ) | (17,957 | ) | (21,658 | ) | |||||
Acquisition payments, net of cash acquired | — | (50,890 | ) | (151,595 | ) | ||||||
Proceeds from sale of assets | 6,766 | 8,361 | 3,023 | ||||||||
Other investing activities | 9,446 | (10,000 | ) | — | |||||||
Net cash used in investing activities | (5,295 | ) | (70,486 | ) | (170,230 | ) | |||||
Financing Activities: | |||||||||||
Proceeds from issuance of short-term debt | 175,819 | 111,458 | 102,033 | ||||||||
Repayments of short-term debt | (164,030 | ) | (131,501 | ) | (101,353 | ) | |||||
Proceeds from issuance of long-term debt | 1,504,636 | 2,082,738 | 1,528,578 | ||||||||
Repayments of long-term debt | (1,556,636 | ) | (2,323,568 | ) | (1,435,820 | ) | |||||
Debt issuance costs | (915 | ) | (6,002 | ) | (3,359 | ) | |||||
Repurchase of common stock (Note 10) | (106,792 | ) | (4,818 | ) | (155,805 | ) | |||||
Other financing activities | 6,722 | (4,570 | ) | (2,089 | ) | ||||||
Net cash used in financing activities | (141,196 | ) | (276,263 | ) | (67,815 | ) | |||||
Effect of exchange rate changes on cash and cash equivalents | 5,191 | (3,634 | ) | (13,044 | ) | ||||||
Net change in cash and cash equivalents | 7,822 | (50,148 | ) | 31,960 | |||||||
Cash and cash equivalents at the beginning of period | 110,131 | 160,279 | 128,319 | ||||||||
Cash and cash equivalents at the end of period | $ | 117,953 | $ | 110,131 | $ | 160,279 | |||||
Supplemental disclosures: | |||||||||||
Cash paid for interest | $ | 63,795 | $ | 74,391 | $ | 66,342 | |||||
Cash paid for taxes | 65,117 | 76,293 | 74,213 | ||||||||
Non-cash investing and financing activities: | |||||||||||
Property, buildings and equipment acquired through capital leases | 552 | 1,143 | 288 | ||||||||
38
WESCO INTERNATIONAL, INC. AND SUBSIDIARIES
NOTES TO CONSOLIDATED FINANCIAL STATEMENTS
1. ORGANIZATION
WESCO International, Inc. ("WESCO International") and its subsidiaries (collectively, “WESCO” or the "Company"), headquartered in Pittsburgh, Pennsylvania, is a full-line distributor of electrical, industrial and communications maintenance, repair and operating ("MRO") and original equipment manufacturer ("OEM") products, construction materials, and advanced supply chain management and logistics services used primarily in the industrial, construction, utility and commercial, institutional and government markets. WESCO serves approximately 70,000 active customers globally, through approximately 500 branches and 10 distribution centers located primarily in the United States, Canada and Mexico, with operations in 15 additional countries.
2. ACCOUNTING POLICIES
Basis of Consolidation
The consolidated financial statements include the accounts of WESCO International and all of its subsidiaries. All significant intercompany accounts and transactions have been eliminated in consolidation.
Revision of Prior Period Financial Statements
In the third quarter of 2017, management determined that the Company's income taxes receivable and payable and other tax account balances were overstated as of December 31, 2016 by a cumulative net amount of $46.4 million, which related to multiple prior periods. The Company also identified a $10.2 million understatement related to deferred income taxes and goodwill. In accordance with Staff Accounting Bulletin (“SAB”) No. 99, Materiality, and SAB No. 108, Considering the Effects of Prior Year Misstatements when Quantifying Misstatements in Current Year Financial Statements, management concluded that these misstatements are not material to the Company's previously issued annual and interim financial statements. Correcting the effected financial statement line items in the year ended December 31, 2017 would have materially misstated the consolidated financial statements presented herein. Accordingly, the Consolidated Balance Sheet at December 31, 2016 and the Consolidated Statements of Stockholders' Equity for the years ended December 31, 2016 and 2015 have been revised in this Annual Report on Form 10-K. There was an immaterial effect on the Consolidated Statements of Income and Comprehensive Income (Loss) for the years ended December 31, 2016 and 2015, and no effect on the Consolidated Statements of Cash Flows for such periods.
The following table presents the effects on the financial statement line items that were revised:
December 31, 2016 | |||||||||||
As Reported | Adjustment | As Revised | |||||||||
(In thousands) | |||||||||||
Income taxes receivable | $ | 72,881 | $ | (67,156 | ) | $ | 5,725 | ||||
Prepaid expenses and other current assets | 48,583 | (2,223 | ) | 46,360 | |||||||
Total current assets | 2,172,457 | (69,379 | ) | 2,103,078 | |||||||
Goodwill | 1,720,714 | 10,236 | 1,730,950 | ||||||||
Total assets | 4,490,984 | (59,143 | ) | 4,431,841 | |||||||
Income taxes payable | 32,879 | (22,998 | ) | 9,881 | |||||||
Total current liabilities | 896,797 | (22,998 | ) | 873,799 | |||||||
Deferred income taxes | 158,009 | 10,236 | 168,245 | ||||||||
Total liabilities | 2,480,972 | (12,762 | ) | 2,468,210 | |||||||
Retained earnings (1) | 1,956,532 | (41,775 | ) | 1,914,757 | |||||||
Accumulated other comprehensive loss (1) | (387,365 | ) | (4,606 | ) | (391,971 | ) | |||||
Total WESCO International, Inc. stockholders' equity | 2,013,281 | (46,381 | ) | 1,966,900 | |||||||
Total stockholders' equity | 2,010,012 | (46,381 | ) | 1,963,631 | |||||||
Total liabilities and stockholders' equity | 4,490,984 | (59,143 | ) | 4,431,841 | |||||||
(1) | These financial statement line items have been revised as of December 31, 2015 and 2014 in the Consolidated Statements of Stockholders' Equity for the years ended December 31, 2017, 2016 and 2015. |
39
WESCO INTERNATIONAL, INC. AND SUBSIDIARIES
NOTES TO CONSOLIDATED FINANCIAL STATEMENTS—(CONTINUED)
Use of Estimates
The preparation of financial statements in conformity with generally accepted accounting principles in the United States of America requires management to make estimates and assumptions that affect the amounts reported in the consolidated financial statements and accompanying notes. Although these estimates are based on management’s best knowledge of current events and actions WESCO may undertake in the future, actual results may ultimately differ from the estimates.
Revenue Recognition
Revenues are recognized for product sales when title, ownership and risk of loss pass to the customer or for services when the service is rendered. In the case of stock sales and special orders, a sale occurs at the time of shipment from WESCO's distribution point, as the terms of WESCO’s sales are typically FOB shipping point. In cases where WESCO processes customer orders that ship directly from suppliers, revenue is recognized once the product is shipped and title has passed. In all cases, revenue is recognized once the sales price to the customer is fixed or is determinable and WESCO has reasonable assurance as to the collectability.
WESCO provides integrated supply services to certain customers, which include some or all of the following: determine inventory stocking levels; establish inventory reorder points; launch purchase orders; receive material; pack away material; and, pick material for order fulfillment. WESCO recognizes revenue for these services in the period rendered based upon a previously negotiated fee arrangement. WESCO also sells inventory to these customers and recognizes revenue at the time title and risk of loss transfers to the customer. The amount of revenue recognized for integrated supply services totaled $26.2 million, $27.1 million, and $35.1 million in 2017, 2016 and 2015, respectively.
Selling, General and Administrative Expenses
WESCO includes warehousing, purchasing, branch operations, information services, and marketing and selling expenses in this category, as well as other types of general and administrative costs.
Supplier Volume Rebates
WESCO receives volume rebates from certain suppliers based on contractual arrangements with such suppliers. Volume rebates are included within other accounts receivable in the Consolidated Balance Sheets, and represent the estimated amounts due to WESCO under the rebate provisions of the various supplier contracts. The corresponding rebate income is derived from the level of actual purchases made by WESCO and is recorded as a reduction to cost of goods sold. Receivables under the supplier rebate program were $72.7 million at December 31, 2017 and $64.2 million at December 31, 2016. Supplier volume rebate rates have historically ranged between approximately 0.9% and 1.4% of sales depending on market conditions. In 2017, the rebate rate was 1.3%.
Shipping and Handling Costs and Fees
WESCO records the costs and fees associated with transporting its products to customers as a component of selling, general and administrative expenses. These costs totaled $61.8 million, $57.9 million and $59.4 million in 2017, 2016 and 2015, respectively.
Cash Equivalents
Cash equivalents are defined as highly liquid investments with original maturities of 90 days or less when purchased.
Asset Securitization
WESCO maintains control of the receivables transferred pursuant to its accounts receivable securitization program (the “Receivables Facility”); therefore, the transfers do not qualify for “sale” treatment. As a result, the transferred receivables remain on the balance sheet, and WESCO recognizes the related secured borrowing. The expenses associated with the Receivables Facility are reported as interest expense in the Consolidated Statements of Income and Comprehensive Income (Loss).
Allowance for Doubtful Accounts
WESCO maintains allowances for doubtful accounts for estimated losses resulting from the inability of its customers to make required payments. WESCO has a systematic procedure using estimates based on historical data and reasonable assumptions of collectability made at the local branch level and on a consolidated corporate basis to calculate the allowance for doubtful accounts. If the financial condition of WESCO’s customers were to deteriorate, resulting in an impairment of their ability to make payments, additional allowances may be required. The allowance for doubtful accounts was $21.3 million at December 31, 2017 and $22.0 million at December 31, 2016. The total amount recorded as selling, general and administrative expense related to bad debts was $8.5 million, $5.9 million and $6.1 million for 2017, 2016 and 2015, respectively.
40
WESCO INTERNATIONAL, INC. AND SUBSIDIARIES
NOTES TO CONSOLIDATED FINANCIAL STATEMENTS—(CONTINUED)
Inventories
Inventories primarily consist of merchandise purchased for resale and are stated at the lower of cost and net realizable value. Cost is determined principally under the average cost method. WESCO makes provisions for obsolete or slow-moving inventories as necessary to reflect reductions in value. WESCO writes down its inventories to net realizable value based on internal factors derived from historical analysis of actual losses. On a retrospective basis, WESCO identifies items in excess of 36 months supply relative to demand or movement. WESCO then analyzes the ultimate disposition of identified excess inventories as they are sold, returned to supplier, or scrapped. This historical item-by-item analysis allows WESCO to develop an estimate of the likelihood that an item identified as being in excess supply ultimately becomes obsolete. WESCO applies the estimate to inventories currently in excess of 36 months supply, and reduces the carrying value of its inventories by the derived amount. Reserves for excess and obsolete inventories were $28.6 million and $27.3 million at December 31, 2017 and 2016, respectively. The total expense related to excess and obsolete inventories, included in cost of goods sold, was $8.8 million, $7.3 million and $8.6 million for 2017, 2016 and 2015, respectively. WESCO absorbs into the cost of inventories certain overhead expenses such as purchasing, receiving and storage and at December 31, 2017 and 2016, $70.7 million and $65.3 million, respectively, of these costs were included in ending inventories.
Property, Buildings and Equipment
Property, buildings and equipment are recorded at cost. Depreciation expense is determined using the straight-line method over the estimated useful lives of the assets. Leasehold improvements are amortized over either their respective lease terms or their estimated lives, whichever is shorter. Estimated useful lives range from five to forty years for buildings and leasehold improvements and three to ten years for furniture, fixtures and equipment.
Capitalized computer software costs are amortized using the straight-line method over the estimated useful life, typically three to five years, and are reported at the lower of unamortized cost or net realizable value.
Expenditures for new facilities and improvements that extend the useful life of an asset are capitalized. Ordinary repairs and maintenance are expensed as incurred. When property is retired or otherwise disposed of, the cost and the related accumulated depreciation are removed from the accounts and any resulting gains or losses are recorded and reported as selling, general and administrative expenses.
Of WESCO’s $156.4 million net book value of property, buildings and equipment as of December 31, 2017, $97.6 million consists of land, buildings and leasehold improvements and are geographically dispersed among WESCO’s 500 branches and 10 distribution centers, mitigating the risk of impairment. WESCO assesses its long-lived assets for impairment whenever events or changes in circumstances indicate that the carrying amount of any such assets may not be fully recoverable. Changes in circumstances include technological advances, changes in the business model, capital structure, economic conditions or operating performance. The evaluation is based upon, among other things, utilization, serviceability and assumptions about the estimated future undiscounted cash flows that these assets are expected to generate. When the sum of the undiscounted cash flows is less than the carrying value of the asset or asset group, an impairment loss is recognized to the extent that carrying value exceeds fair value. Management applies its best judgment when performing these evaluations.
Goodwill and Indefinite-Lived Intangible Assets
Goodwill and indefinite-lived intangible assets are tested for impairment annually during the fourth quarter using information available at the end of September, or more frequently if triggering events occur, indicating that their carrying value may not be recoverable. WESCO tests for goodwill impairment on a reporting unit level and the evaluation involves comparing the fair value of each reporting unit to its carrying value. The fair values of the reporting units are determined using a combination of a discounted cash flow analysis and market multiples. Assumptions used for these fair value techniques are based on a combination of historical results, current forecasts, market data and recent economic events. WESCO evaluates the recoverability of indefinite-lived intangible assets using the relief-from-royalty method based on projected financial information. At December 31, 2017 and 2016, respectively, goodwill and indefinite-lived trademarks totaled $1.87 billion and $1.83 billion.
We performed our annual impairment testing of goodwill and indefinite-lived intangible assets during the fourth quarter. A possible indicator of goodwill impairment is the relationship of a company’s market capitalization to its book value. As of December 31, 2017, our market capitalization exceeded our book value and the fair values of our reporting units exceeded their carrying values. Accordingly, there were no impairment losses identified as a result of our annual test.
The determination of fair value involves significant management judgment and management applies its best judgment when assessing the reasonableness of financial projections. Fair values are sensitive to changes in underlying assumptions and factors. As a result, there can be no assurance that the estimates and assumptions made for purposes of the annual goodwill and indefinite-lived intangible impairment tests will prove to be an accurate prediction of future results.
41
WESCO INTERNATIONAL, INC. AND SUBSIDIARIES
NOTES TO CONSOLIDATED FINANCIAL STATEMENTS—(CONTINUED)
Definite Lived Intangible Assets
Intangible assets are amortized over 2 to 20 years. A portion of intangible assets related to certain customer relationships are amortized using an accelerated method whereas all other intangible assets subject to amortization use a straight-line method that reflects the pattern in which the economic benefits of the respective assets are consumed or otherwise used. Intangible assets are tested for impairment if events or circumstances occur indicating that the respective asset might be impaired.
Insurance Programs
WESCO uses commercial insurance for auto, workers’ compensation, casualty and health claims, and information technology as a risk-reduction strategy to minimize catastrophic losses. The Company’s strategy involves large deductible policies where WESCO must pay all costs up to the deductible amount. WESCO estimates the reserve for these programs based on historical incident rates and costs. The assumptions included in developing this accrual include the period of time between the incurrence and payment of a claim. The total liability related to the insurance programs was $13.9 million and $9.5 million at December 31, 2017 and 2016, respectively.
Income Taxes
WESCO accounts for income taxes under the asset and liability method, which requires the recognition of deferred income taxes for events that have future tax consequences. Under this method, deferred income taxes are recognized (using enacted tax laws and rates) based on the future income tax effects of differences in the carrying amounts of assets and liabilities for financial reporting and tax purposes. The effect of a tax rate change on deferred tax assets and liabilities is recognized in income in the period of change.
WESCO recognizes deferred tax assets at amounts that are expected to be realized. To make such determination, management evaluates all positive and negative evidence, including but not limited to, prior, current and future taxable income, tax planning strategies and future reversals of existing temporary differences. A valuation allowance is recognized if it is “more-likely-than-not” that some or all of a deferred tax asset will not be realized. WESCO regularly assesses the realizability of deferred tax assets.
WESCO accounts for uncertainty in income taxes using a "more-likely-than-not" recognition threshold. Due to the subjectivity inherent in the evaluation of uncertain tax positions, the tax benefit ultimately recognized may materially differ from the estimate. WESCO recognizes interest and penalties related to uncertain tax benefits as part of interest expense and income tax expense, respectively.
The Tax Cuts and Jobs Act of 2017 (the “TCJA”) imposes a one-time tax on the deemed repatriation of undistributed foreign earnings. Notwithstanding the effects of applying such provisions of the TCJA, WESCO continues to assert that the earnings of its foreign subsidiaries are indefinitely reinvested. However, as a result of the TCJA, the Company is reevaluating its intent and ability to repatriate foreign cash based upon the available liquidity and cash flow needs of its foreign subsidiaries and will disclose in future filings any change in its intention to repatriate undistributed foreign earnings and any resulting income tax impacts. Until the Company completes this reevaluation, it is not practicable to determine the amount of any unrecognized deferred income taxes on these undistributed foreign earnings.
The provisions of the TCJA also introduce U.S. taxation on certain global intangible low-taxed income ("GILTI"). WESCO has elected to account for any GILTI tax that arises in future periods as a component of income tax expense.
Provisional amounts are recorded for certain income tax effects of the TCJA for which the accounting is incomplete, but a reasonable estimate can be determined. Provisional amounts, or adjustments to provisional amounts, identified during the period ending on or before one year from the TCJA's enactment date are recognized as an adjustment to income tax expense or benefit from continuing operations in the period the amounts are determined.
Debt Issuance Costs
WESCO capitalizes costs associated with the issuance of debt and such costs are amortized over the term of the respective debt instrument on a straight-line basis. Debt issuance costs are presented in the Consolidated Balance Sheets as a direct reduction from the carrying amount of the related debt liability. Upon prepayment of debt, the Company accelerates the recognition of an appropriate amount of the costs as refinancing or extinguishment of debt. During the year ended December 31, 2017, the Company capitalized debt issuance costs of $0.9 million. As of December 31, 2017 and 2016, unamortized debt issuance costs of $13.7 million and $16.5 million were recorded in the Consolidated Balance Sheets, respectively.
42
WESCO INTERNATIONAL, INC. AND SUBSIDIARIES
NOTES TO CONSOLIDATED FINANCIAL STATEMENTS—(CONTINUED)
Convertible Debentures
WESCO separately accounted for the liability and equity components of the 6.0% Convertible Senior Debentures due 2029 (the "2029 Debentures") in a manner that reflected its non-convertible debt borrowing rate. WESCO estimated its non-convertible debt borrowing rate through a combination of discussions with its financial institutions and review of relevant market data. The discounts to the convertible debt balances were amortized to interest expense, using the effective interest method, over the implicit life of the debentures.
Foreign Currency
The local currency is the functional currency for the majority of WESCO’s operations outside the United States. Assets and liabilities of these operations are translated to U.S. dollars at the exchange rate in effect at the end of each period. Income statement accounts are translated at an exchange rate that approximates the average for the period. Translation adjustments arising from the use of differing exchange rates from period to period are included as a component of other comprehensive income (loss) within stockholders’ equity. Gains and losses from foreign currency transactions are included in net income for the period.
Defined Benefit Pension Plan
Liabilities and expenses for pension benefits are determined using actuarial methodologies and incorporate significant assumptions, including the interest rate used to discount the future estimated cash flows, the expected long-term rate of return on plan assets, and several assumptions relating to the employee workforce (salary increases, retirement age, and mortality).
The interest rate used to discount future estimated cash flows is determined using the Canadian Institute of Actuaries ("CIA") methodology, which references yield curve information provided by Fiera Capital and matches expected benefit payments. The expected long-term rate of return on plan assets is applied to the fair market-related value of plan assets. The discount rate used to determine the projected benefit obligations for the Canadian pensions was 3.5% at December 31, 2017.
Stock-Based Compensation
WESCO's stock-based employee compensation plans are comprised of stock-settled stock appreciation rights, restricted stock units, and performance-based awards. Compensation cost for all stock-based awards is measured at fair value on the date of grant, and compensation cost is recognized, net of forfeitures, over the service period for awards expected to vest. The fair value of stock-settled appreciation rights and performance-based awards with market conditions is determined using the Black-Scholes and Monte Carlo simulation models, respectively. The fair value of restricted stock units with service conditions and performance-based awards with performance conditions is determined by the grant-date closing price of WESCO's common stock. Expected volatilities are based on historical volatility of WESCO's common stock. WESCO estimates the expected life of stock-settled stock appreciation rights using historical data pertaining to option exercises and employee terminations. The risk-free rate is based on the U.S. Treasury yields in effect at the time of grant. The forfeiture assumption is based on WESCO's historical employee behavior, which is reviewed on an annual basis. No dividends are assumed for stock-based awards. For stock appreciation rights that are exercised and for restricted stock units and performance-based award that vest, shares are issued out of WESCO's outstanding common stock.
Treasury Stock
Common stock purchased for treasury is recorded at cost. At the date of subsequent reissue, the treasury stock account is reduced by the cost of such stock, with cost determined on a weighted-average basis.
Fair Value of Financial Instruments
The Company measures the fair value of financial assets and liabilities in accordance with Financial Accounting Standards Board (FASB) Accounting Standards Codification (ASC) 820, "Fair Value Measurements and Disclosures." ASC 820 establishes a fair value hierarchy that prioritizes the inputs to valuation techniques used to measure fair value and requires an entity to maximize the use of observable inputs and minimize the use of unobservable inputs. The hierarchy gives the highest priority to unadjusted quoted prices in active markets for identical assets or liabilities (Level 1 measurements) and the lowest priority to measurements involving significant unobservable inputs (Level 3 measurements). The three levels of the fair value hierarchy are as follows:
• | Level 1 inputs are quoted prices (unadjusted) in active markets for identical assets or liabilities that are accessible at the measurement date. |
• | Level 2 inputs include inputs other than Level 1 that are observable, either directly or indirectly, such as quoted prices in active markets for similar assets and liabilities, quoted prices for identical or similar assets or liabilities in markets that are not active, or other inputs that are observable or can be corroborated by observable market data for substantially the full term of assets or liabilities. |
43
WESCO INTERNATIONAL, INC. AND SUBSIDIARIES
NOTES TO CONSOLIDATED FINANCIAL STATEMENTS—(CONTINUED)
• | Level 3 inputs are unobservable inputs in which little or no market data exists, therefore requiring an entity to develop its own assumptions. |
The Company’s financial instruments consist of cash and cash equivalents, accounts receivable, accounts payable, bank overdrafts, other accrued liabilities, and outstanding indebtedness. The reported carrying amounts of WESCO’s debt instruments totaled $1.36 billion and $1.40 billion at December 31, 2017 and 2016, respectively, and approximated their fair values which totaled $1.39 billion and $1.42 billion, respectively. The Company uses a market approach to fair value all of its debt instruments, utilizing quoted prices in active markets, interest rates and other relevant information generated by market transactions involving similar instruments. Therefore, all of the Company's debt instruments are classified as Level 2 within the valuation hierarchy. For all of the Company's remaining financial instruments, carrying values are considered to approximate fair value.
Environmental Expenditures
WESCO has facilities and operations that distribute certain products that must comply with environmental regulations and laws. Expenditures for current operations are expensed or capitalized, as appropriate. Expenditures relating to existing conditions caused by past operations, and that do not contribute to future revenue, are expensed. Liabilities are recorded when remedial efforts are probable and the costs can be reasonably estimated.
Recently Adopted Accounting Pronouncements
In March 2016, the Financial Accounting Standards Board (FASB) issued Accounting Standards Update (ASU) 2016-09, Compensation—Stock Compensation (Topic 718): Improvements to Employee Share-Based Payment Accounting, which simplifies several aspects of accounting for share-based payment transactions, including the income tax consequences, classification of awards as either equity or liabilities, and classification on the statement of cash flows. The amendments in this ASU affect all entities that issue share-based payment awards to their employees. The Company adopted this ASU in the first quarter of 2017. The amendment related to the recognition of excess tax benefits and deficiencies was applied prospectively and lowered the Company's effective tax rate by approximately 1% for the year ended December 31, 2017. The amendment related to the presentation of excess tax benefits on the statement of cash flows was also applied prospectively, and did not have a material impact on WESCO's cash flows. The other amendments, which were adopted by the Company according to the respective transition requirements, had no impact on the consolidated financial statements and notes thereto.
In October 2016, the FASB issued ASU 2016-16, Income Taxes (Topic 740): Intra-Entity Transfers of Assets Other Than Inventory. The purpose of ASU 2016-16 is to simplify the income tax accounting of an intra-entity transfer of an asset other than inventory and to record its effect when the transfer occurs. The Company early adopted this ASU on a modified retrospective basis in the first quarter of 2017. The adoption of this ASU did not have a material impact on WESCO's financial position and it had no impact on its results of operations or cash flows.
Recently Issued Accounting Pronouncements
In August 2015, the FASB issued ASU 2015-14, Revenue from Contracts with Customers: Deferral of Effective Date. The Company previously reported that in May 2014, the FASB issued ASU 2014-09, Revenue from Contracts with Customers, which provides a framework for addressing revenue recognition issues and replaces almost all existing revenue recognition guidance in current U.S. generally accepted accounting principles. The core principle of ASU 2014-09 is for companies to recognize revenue for the transfer of goods or services to customers in amounts that reflect the consideration to which the company expects to be entitled in exchange for those goods or services. ASU 2014-09 will also result in enhanced disclosures about revenue, provide guidance for transactions that were not previously addressed comprehensively, and improve guidance for multiple-element arrangements. The amendments in ASU 2015-14 defer the effective date of the new revenue recognition guidance to annual reporting periods beginning after December 15, 2017, including interim periods within that reporting period. During 2016, the FASB issued four ASUs that address implementation issues and correct or improve certain aspects of the new revenue recognition guidance, including ASU 2016-08, Principal versus Agent Considerations (Reporting Revenue Gross versus Net), ASU 2016-10, Identifying Performance Obligations and Licensing, ASU 2016-12, Narrow-Scope Improvements and Practical Expedients and ASU 2016-20, Technical Corrections and Improvements to Topic 606, Revenue from Contracts with Customers. These ASUs do not change the core principles in the revenue recognition standard outlined above. The Company developed a multiphase plan and established a cross-functional team to evaluate and implement the new standard. Management completed the diagnostic and testing phase of the project, which involved reviewing various customer contracts and comparing current accounting to the requirements of the new standard. Currently management is evaluating the new disclosure requirements and identifying and implementing appropriate changes to the Company's business processes and controls to support recognition and disclosure under the new standard. The new standard will be adopted in the first quarter of 2018 using the modified retrospective method. Except for new disclosures requirements, the adoption of this pronouncement is not expected to have a material impact on WESCO's consolidated financial statements.
44
WESCO INTERNATIONAL, INC. AND SUBSIDIARIES
NOTES TO CONSOLIDATED FINANCIAL STATEMENTS—(CONTINUED)
In February 2016, the FASB issued ASU 2016-02, Leases, a comprehensive new standard that amends various aspects of existing accounting guidance for leases, including the recognition of a right-of-use asset and a lease liability in the balance sheet and disclosing key information about leasing arrangements. This guidance is effective for fiscal years beginning after December 15, 2018, including interim periods within those fiscal years. Early adoption is permitted. The new leasing standard requires modified retrospective transition, which requires application of the new guidance at the beginning of the earliest comparative period presented in the year of adoption. Management is currently evaluating the impact of this standard and right-of-use assets and lease liabilities will be recorded in the Consolidated Balance Sheets upon adoption. An estimate of the impact of this standard is not currently determinable.
In June 2016, the FASB issued ASU 2016-13, Financial Instruments—Credit Losses (Topic 326): Measurement of Credit Losses on Financial Instruments, which introduces new guidance for the accounting for credit losses on certain financial instruments. The amendments in ASU 2016-13 are effective for fiscal years beginning after December 15, 2019, including interim periods within those fiscal years and early adoption is permitted. The Company does not expect the adoption of this accounting standard to have a material impact on its consolidated financial statements and notes thereto.
In August 2016, the FASB issued ASU 2016-15, Statement of Cash Flows (Topic 230): Classification of Certain Cash Receipts and Cash Payments (a consensus of the Emerging Issues Task Force). This ASU provides guidance on eight specific cash flow issues where there is diversity in practice. The amendments in this ASU are effective for fiscal years beginning after December 15, 2017, and interim periods within those fiscal years. Early adoption is permitted, including adoption in an interim period. Except for potential reclassifications within the statement of cash flows, the Company does not expect the adoption of this accounting standard to have a material impact on its consolidated financial statements and notes thereto.
In January 2017, the FASB issued ASU 2017-04, Intangibles—Goodwill and Other (Topic 350): Simplifying the Test for Goodwill Impairment, which eliminates Step 2 from the goodwill impairment test. Under the amendments in this update, an entity should perform its annual, or interim, goodwill impairment test by comparing the fair value of a reporting unit with its carrying amount. An entity should recognize an impairment charge for the amount by which the carrying amount exceeds the reporting unit’s fair value; however, the loss recognized should not exceed the total amount of goodwill allocated to that reporting unit. An entity should apply the amendments in this ASU on a prospective basis. This guidance is effective for fiscal years beginning after December 15, 2019, including interim periods within those fiscal years. The Company does not expect the adoption of this accounting standard to have a material impact on its consolidated financial statements and notes thereto.
In March 2017, the FASB issued ASU 2017-07, Compensation—Retirement Benefits (Topic 715): Improving the Presentation of Net Periodic Pension Cost and Net Periodic Postretirement Benefit Cost. Presently, net benefit cost is reported as an employee cost within operating income (or capitalized into assets when appropriate). This amendment requires the bifurcation of net benefit cost. The service component will be presented with other employee compensation costs in operating income (or capitalized in assets). The other components will be reported separately outside of operations, and will not be eligible for capitalization. This guidance is effective for fiscal years beginning after December 15, 2017, including interim periods within those fiscal years. Early adoption is permitted. The Company does not expect the adoption of this accounting standard to have a material impact on its consolidated financial statements and notes thereto.
In May 2017, the FASB issued ASU 2017-09, Compensation—Stock Compensation (Topic 718): Scope of Modification Accounting, which clarifies when to account for a change to the terms or conditions of a share-based payment award as a modification. Under the new guidance, modification accounting is required only if the fair value, the vesting conditions, or the classification of the award (as equity or liability) changes as a result of the change in terms or conditions. The guidance is effective prospectively for all companies for annual periods beginning on or after December 15, 2017. Early adoption is permitted. The Company does not expect the adoption of this accounting standard to have a material impact on its consolidated financial statements and notes thereto.
Other pronouncements issued by the FASB or other authoritative accounting standards groups with future effective dates are either not applicable or are not expected to be significant to WESCO’s financial position, results of operations or cash flows.
45
WESCO INTERNATIONAL, INC. AND SUBSIDIARIES
NOTES TO CONSOLIDATED FINANCIAL STATEMENTS—(CONTINUED)
3. GOODWILL AND INTANGIBLE ASSETS
Goodwill
The following table sets forth the changes in the carrying value of goodwill:
Year Ended December 31, | |||||||
2017 | 2016 | ||||||
(In thousands) | |||||||
Beginning balance January 1 | $ | 1,730,950 | $ | 1,681,662 | |||
Foreign currency exchange rate changes | 40,927 | 21,434 | |||||
Adjustments to goodwill for acquisitions (1) | — | 17,618 | |||||
Prior period revision (Note 2) | — | 10,236 | |||||
Ending balance December 31 | $ | 1,771,877 | $ | 1,730,950 | |||
(1) | For the year ended December 31, 2016, adjustments relate to goodwill resulting from the preliminary allocation of the purchase price for Atlanta Electrical Distributors, LLC to the respective assets acquired and liabilities assumed, partially offset by an adjustment to goodwill related to deferred income taxes. |
Intangible Assets
The components of intangible assets are as follows:
December 31, 2017 | December 31, 2016 | ||||||||||||||||||||||||
Life | Gross Carrying Amount (1) | Accumulated Amortization (1) | Net Carrying Amount | Gross Carrying Amount (1) | Accumulated Amortization (1) | Net Carrying Amount | |||||||||||||||||||
(In thousands) | |||||||||||||||||||||||||
Intangible assets: | |||||||||||||||||||||||||
Trademarks | Indefinite | $ | 100,249 | $ | — | $ | 100,249 | $ | 96,962 | $ | — | $ | 96,962 | ||||||||||||
Trademarks | 4-15 | 25,118 | (5,516 | ) | 19,602 | 25,098 | (3,426 | ) | 21,672 | ||||||||||||||||
Non-compete agreements | 2-7 | 196 | (102 | ) | 94 | 196 | (63 | ) | 133 | ||||||||||||||||
Customer relationships | 2-20 | 377,270 | (161,711 | ) | 215,559 | 362,637 | (126,835 | ) | 235,802 | ||||||||||||||||
Distribution agreements | 10-19 | 39,515 | (22,200 | ) | 17,315 | 38,972 | (19,295 | ) | 19,677 | ||||||||||||||||
Patents | 10 | 48,310 | (34,025 | ) | 14,285 | 48,310 | (29,194 | ) | 19,116 | ||||||||||||||||
$ | 590,658 | $ | (223,554 | ) | $ | 367,104 | $ | 572,175 | $ | (178,813 | ) | $ | 393,362 | ||||||||||||
(1) | Excludes the original cost and accumulated amortization of fully-amortized intangible assets. |
Amortization expense related to intangible assets totaled $37.8 million, $39.1 million and $36.9 million for the years ended December 31, 2017, 2016 and 2015, respectively.
The following table sets forth the estimated amortization expense for intangible assets for the next five years:
For the year ending December 31, | (In thousands) | ||
2018 | $ | 37,848 | |
2019 | 36,549 | ||
2020 | 34,621 | ||
2021 | 26,930 | ||
2022 | 24,350 | ||
46
WESCO INTERNATIONAL, INC. AND SUBSIDIARIES
NOTES TO CONSOLIDATED FINANCIAL STATEMENTS—(CONTINUED)
4. CONCENTRATIONS OF CREDIT RISK AND SIGNIFICANT SUPPLIERS
WESCO distributes its products and services and extends credit to a large number of customers in the industrial, construction, utility, and commercial, institutional and government markets. Based upon WESCO’s broad customer base, the Company has concluded that it has no material credit risk as a result of customer concentration. WESCO's largest supplier is Eaton Corporation, accounting for approximately 11% of its purchases in 2017, 2016 and 2015. Therefore, WESCO could potentially incur risk due to supplier concentration.
5. ACQUISITIONS
The following table sets forth the consideration paid for acquisitions:
Year Ended December 31, | |||||||||||
2017 | 2016 | 2015 | |||||||||
(In thousands) | |||||||||||
Fair value of assets acquired | $ | — | $ | 76,980 | $ | 192,099 | |||||
Fair value of liabilities assumed | — | 25,058 | 39,836 | ||||||||
Cash paid for acquisitions | $ | — | $ | 51,922 | $ | 152,263 | |||||
Supplemental cash flow disclosure related to acquisitions: | |||||||||||
Cash paid for acquisitions | $ | — | $ | 51,922 | $ | 152,263 | |||||
Less: cash acquired | — | (1,032 | ) | (668 | ) | ||||||
Cash paid for acquisitions, net of cash acquired | $ | — | $ | 50,890 | $ | 151,595 | |||||
Atlanta Electrical Distributors, LLC
On March 14, 2016, WESCO Distribution, Inc. ("WESCO Distribution") completed the acquisition of Atlanta Electrical Distributors, LLC, an Atlanta-based electrical distributor focused on the construction and MRO markets from five locations in Georgia with approximately $85 million in annual sales. WESCO Distribution funded the purchase price paid at closing with borrowings under its revolving credit facility. The purchase price was allocated to the respective assets and liabilities based upon their estimated fair values as of the acquisition date. In addition to the cash paid at closing, the purchase price included a contingent payment that may be earned upon the achievement of certain financial performance targets over three consecutive one year periods. The fair value of the contingent consideration was determined using a probability-weighted outcome analysis and Level 3 inputs such as internal forecasts. This amount was initially accrued at the maximum potential payout under the terms of the purchase agreement and was reduced in 2017 to reflect a payout that is aligned with current financial performance. The fair value of intangibles was estimated by management and the allocation resulted in intangible assets of $21.8 million and goodwill of $30.0 million. The intangible assets include customer relationships of $15.8 million amortized over 13 and 14 years, a trademark of $6.0 million amortized over 13 years, and non-compete agreements of less than $0.1 million amortized over 5 years. No residual value was estimated for the intangible assets being amortized. The majority of goodwill is deductible for tax purposes.
Hill Country Electric Supply, LP and Needham Electric Supply Corporation
On May 1, 2015, WESCO Distribution completed the acquisition of Hill Country Electric Supply, LP ("Hill Country"), an electrical distributor focused on the commercial construction market from nine locations in Central and South Texas with approximately $140 million in annual sales. WESCO Distribution funded the purchase price paid at closing with borrowings under its prior revolving credit facility. The purchase price was allocated to the respective assets and liabilities based upon their estimated fair values as of the acquisition date. The fair value of intangibles was estimated by management and the allocation resulted in intangible assets of $21.1 million and goodwill of $16.2 million. The majority of goodwill is deductible for tax purposes.
On October 30, 2015, WESCO Distribution completed the acquisition of Needham Electric Supply Corporation ("Needham"), an electrical distributor focused on the commercial construction and lighting national account markets from 24 locations in Massachusetts, New Hampshire and Vermont with approximately $115 million in annual sales. WESCO Distribution funded the purchase price paid at closing with cash and borrowings under its revolving credit facility. The purchase price was allocated to the respective assets and liabilities based upon their estimated fair values as of the acquisition date. The fair value of intangibles was estimated by management and the allocation resulted in intangible assets of $31.0 million and goodwill of $35.7 million. The majority of goodwill is deductible for tax purposes.
47
WESCO INTERNATIONAL, INC. AND SUBSIDIARIES
NOTES TO CONSOLIDATED FINANCIAL STATEMENTS—(CONTINUED)
For the acquisitions of Hill Country and Needham that were made in 2015, the intangible assets include customer relationships of $37.6 million amortized over 11 to 14 years, trademarks of $14.3 million amortized over 12 and 13 years, and other intangibles of $0.2 million. No residual value is estimated for the intangible assets being amortized.
6. PROPERTY, BUILDINGS AND EQUIPMENT
The following table sets forth the components of property, buildings and equipment:
As of December 31, | |||||||
2017 | 2016 | ||||||
(In thousands) | |||||||
Buildings and leasehold improvements | $ | 117,894 | $ | 117,461 | |||
Furniture, fixtures and equipment | 183,801 | 178,183 | |||||
Software costs | 103,842 | 93,040 | |||||
405,537 | 388,684 | ||||||
Accumulated depreciation and amortization | (278,455 | ) | (259,126 | ) | |||
127,082 | 129,558 | ||||||
Land | 25,814 | 24,653 | |||||
Construction in progress | 3,549 | 3,396 | |||||
$ | 156,445 | $ | 157,607 | ||||
Depreciation expense was $16.3 million, $17.1 million and $17.8 million, and capitalized software amortization was $9.9 million, $10.6 million and $10.3 million, in 2017, 2016 and 2015, respectively. The unamortized software cost was $22.4 million and $21.6 million as of December 31, 2017 and 2016, respectively. Furniture, fixtures and equipment include capitalized leases of $10.6 million and $12.0 million and related accumulated amortization of $9.0 million and $8.9 million as of December 31, 2017 and 2016, respectively.
7. DEBT
The following table sets forth WESCO’s outstanding indebtedness:
As of December 31, | |||||||
2017 | 2016 | ||||||
(In thousands) | |||||||
International lines of credit | $ | 34,075 | $ | 20,920 | |||
Term Loan Facility, less debt discount of $513 and $770 in 2017 and 2016, respectively | 84,237 | 143,980 | |||||
Accounts Receivable Securitization Facility | 380,000 | 380,000 | |||||
Revolving Credit Facility | 12,000 | 4,000 | |||||
5.375% Senior Notes due 2021 | 500,000 | 500,000 | |||||
5.375% Senior Notes due 2024 | 350,000 | 350,000 | |||||
Capital leases | 1,959 | 2,881 | |||||
Total debt | 1,362,271 | 1,401,781 | |||||
Less unamortized debt issuance costs | (13,711 | ) | (16,508 | ) | |||
Less short-term debt and current portion of long-term debt | (35,299 | ) | (22,138 | ) | |||
Total long-term debt | $ | 1,313,261 | $ | 1,363,135 | |||
International Lines of Credit
Certain foreign subsidiaries of WESCO have entered into uncommitted lines of credit, which serve as overdraft facilities, to support local operations. The maximum borrowing limit varies by facility and ranges between $0.3 million and $21.0 million. The applicable interest rate for borrowings under these lines of credit varies by country and is governed by the applicable loan agreement. The international lines of credit are renewable on an annual basis and certain facilities are fully and unconditionally guaranteed
48
WESCO INTERNATIONAL, INC. AND SUBSIDIARIES
NOTES TO CONSOLIDATED FINANCIAL STATEMENTS—(CONTINUED)
by WESCO Distribution. Accordingly, borrowings under these lines directly reduce availability under the Revolving Credit Facility. The average interest rate for these facilities was 5.42% and 7.36% at December 31, 2017 and 2016, respectively.
Term Loan Facility
On December 12, 2012, WESCO Distribution, as U.S. borrower, WDCC Enterprises Inc. ("WDCC" and together with WESCO Distribution, the “Borrowers”), as Canadian borrower, and WESCO International entered into a Term Loan Agreement (the “Term Loan Agreement”) among WESCO Distribution, WDCC, the Company, the lenders party thereto and Credit Suisse AG Cayman Islands Branch, as administrative agent and as collateral agent.
The Term Loan Agreement provided a seven-year term loan facility (the “Term Loan Facility”), which consisted of two separate sub-facilities: (i) a Canadian sub-facility in an aggregate principal amount of CAD150 million, issued at a 2.0% discount, and (ii) a U.S. sub-facility in an aggregate principal amount of $700 million, issued at a 1.0% discount. The proceeds of the Term Loan Facility were used to finance the acquisition of EECOL, and to pay fees and expenses incurred in connection with the acquisition and certain other transactions. Subject to the terms of the Term Loan Agreement, the Borrowers may request incremental term loans from time to time in an aggregate principal amount not to exceed at any time $300 million, with an equivalent principal amount in U.S. dollars being calculated for any incremental term loan denominated in Canadian dollars.
On November 19, 2013, the Borrowers and WESCO International entered into an amendment (the “Term Loan Amendment”) to the Term Loan Agreement. The Term Loan Amendment, among other things, reduced the applicable margin on U.S. term loans by 0.50% and the LIBOR floor applicable to the U.S. sub-facility from 1.00% to 0.75%. The modified pricing terms were effective December 13, 2013.
On November 26, 2013, WESCO Distribution sold $500 million aggregate principal amount of 5.375% Senior Notes due 2021 (the “2021 Notes”), and used the net proceeds plus excess cash to prepay $500 million under the Company's U.S. sub-facility of the Term Loan Facility (see discussion below under “5.375% Senior Notes due 2021” for additional information). The prepayment satisfied all remaining quarterly repayment obligations under the U.S. sub-facility. As of December 31, 2017, the amount outstanding under the U.S. sub-facility was $84.8 million. The Canadian sub-facility was fully repaid in 2015 using cash provided by Canadian operations.
Borrowings under the Term Loan Facility bear interest at base rates plus applicable margins. At December 31, 2017, the interest rate on borrowings under the U.S. sub-facility was 4.7%. To the extent not previously paid, the outstanding U.S. sub-facility will become due and payable on December 12, 2019, with any unpaid incremental term loans becoming due and payable on the respective maturity dates applicable to those incremental term loans. At any time or from time to time, the Borrowers may prepay borrowings under the Term Loan Facility in whole or in part without premium or penalty. The Borrowers' obligations under the Term Loan Facility are secured by substantially all of the assets of the Borrowers, the Company and certain of the Company's other subsidiaries; provided that, with respect to borrowings under the U.S. sub-facility, the collateral does not include assets of certain foreign subsidiaries or more than 65% of the issued and outstanding equity interests in certain foreign subsidiaries.
The Term Loan Facility contains customary affirmative and negative covenants for credit facilities of this type. The Term Loan Facility also provides for customary events of default.
Accounts Receivable Securitization Facility
On November 8, 2017, WESCO Distribution amended its Receivables Facility pursuant to the terms and conditions of a Fifth Amendment to Fourth Amended and Restated Receivables Purchase Agreement, by and among WESCO Receivables Corp. (“WESCO Receivables”), WESCO Distribution, the various purchasers from time to time party thereto and PNC Bank, National Association, as Administrator (the "Amendment"). The Amendment extended the term of the Receivables Facility to September 24, 2020 and added and amended certain other defined terms. Substantially all other terms and conditions of the Receivables Facility were unchanged.
The Receivables Facility has a purchase limit of $550 million with the opportunity to exercise an accordion feature that permits increases in the purchase limit of up to $100 million. The interest rate spread and commitment fee of the Receivables Facility is 0.95% and 0.45%, respectively.
Under the Receivables Facility, WESCO sells, on a continuous basis, an undivided interest in all domestic accounts receivable to WESCO Receivables, a wholly owned special purpose entity (the “SPE”). The SPE sells, without recourse, a senior undivided interest in the receivables to financial institutions for cash while maintaining a subordinated undivided interest in the receivables, in the form of overcollateralization. WESCO has agreed to continue servicing the sold receivables for the third-party conduits and financial institutions at market rates; accordingly, no servicing asset or liability has been recorded.
As of December 31, 2017 and 2016, accounts receivable eligible for securitization totaled $751.2 million and $657.5 million, respectively. The Consolidated Balance Sheets as of December 31, 2017 and 2016 include $380.0 million of account receivable
49
WESCO INTERNATIONAL, INC. AND SUBSIDIARIES
NOTES TO CONSOLIDATED FINANCIAL STATEMENTS—(CONTINUED)
balances legally sold to third parties in both years, as well as borrowings for equal amounts. At December 31, 2017, the interest rate for this facility was approximately 1.9%.
Revolving Credit Facility
On September 24, 2015, WESCO International, WESCO Distribution and certain other subsidiaries of the Company entered into a $600 million revolving credit facility (the “Revolving Credit Facility”), which contains a letter of credit sub-facility of up to $125 million, pursuant to the terms and conditions of a Second Amended and Restated Credit Agreement (the "Credit Agreement"). The Revolving Credit Facility contains an accordion feature allowing WESCO Distribution to request increases to the borrowing commitments of up to $200 million in the aggregate, subject to customary conditions.
The Revolving Credit Facility matures in September 2020 and consists of two separate sub-facilities: (i) a Canadian sub-facility with a borrowing limit of up to $400 million, which is collateralized by substantially all assets of WESCO Canada and the other Canadian Borrowers, other than, among other things, real property, in each case, subject to customary exceptions and limitations, and (ii) a U.S sub-facility with a borrowing limit of up to $600 million less the amount of outstanding borrowings under the Canadian sub-facility. The U.S. sub-facility is collateralized by substantially all assets of WESCO Distribution and its domestic subsidiaries which are party to the Credit Agreement, other than, among other things, real property and accounts receivable sold or intended to be sold pursuant to the Receivables Purchase Agreement. The applicable interest rate for borrowings under the Revolving Credit Facility includes interest rate spreads based on available borrowing capacity that range between 1.25% and 1.75% for LIBOR-based borrowings and 0.25% and 0.75% for prime rate-based borrowings. At December 31, 2017, the interest rate for this facility was approximately 3.0%.
The Credit Agreement requires ongoing compliance with certain customary affirmative and negative covenants. The Credit Agreement also contains customary events of default.
During 2017, WESCO borrowed $834.4 million under the Revolving Credit Facility and made repayments in the aggregate amount of $826.4 million. During 2016, aggregate borrowings and repayments were $1,025.8 million and $1,096.8 million, respectively. WESCO had $562.9 million available under the Revolving Credit facility at December 31, 2017, after giving effect to $18.0 million of outstanding letters of credit, $19.5 million of surety bonds, and $7.1 million of other reserves, as compared to $509.7 million available under the Revolving Credit facility at December 31, 2016, after giving effect to $20.1 million of outstanding letters of credit, $16.2 million of surety bonds, and $6.4 million of other reserves.
5.375% Senior Notes due 2021
In November 2013, WESCO Distribution issued $500 million aggregate principal amount of 2021 Notes through a private offering exempt from the registration requirements of the Securities Act of 1933, as amended (the “Securities Act”). The 2021 Notes were issued at 100% of par and are governed by an indenture (the “2021 Indenture”) entered into on November 26, 2013 between WESCO International and U.S. Bank National Association, as trustee. The 2021 Notes are unsecured senior obligations of WESCO Distribution and are guaranteed on a senior unsecured basis by WESCO International. The 2021 Notes bear interest at a stated rate of 5.375%, payable semi-annually in arrears on June 15 and December 15 of each year. In addition, WESCO incurred costs related to the issuance of the 2021 Notes totaling $8.4 million, which are recorded as a reduction to the carrying value of the debt and are being amortized over the life of the notes. The 2021 Notes mature on December 15, 2021. The net proceeds of the 2021 Notes were used to prepay a portion of the U.S. sub-facility of the term loans due 2019.
Under the terms of a registration rights agreement dated as of November 26, 2013 among WESCO Distribution, WESCO International and Merrill Lynch, Pierce, Fenner & Smith Incorporated, as the representative of the initial purchasers of the 2021 Notes, WESCO Distribution and WESCO International agreed to register under the Securities Act notes having terms identical in all material respects to the 2021 Notes (the “2021 Exchange Notes”) and to make an offer to exchange the 2021 Exchange Notes for the 2021 Notes. WESCO Distribution launched the exchange offer on June 12, 2014 and the exchange offer expired on July 17, 2014.
At any time WESCO Distribution may redeem all or a part of the 2021 Notes. Between December 15, 2017 and December 14, 2018, WESCO Distribution may redeem all or a part of the 2021 Notes at a redemption price equal to 102.688% of the principal amount. Between December 15, 2018 and December 14, 2019, WESCO Distribution may redeem all or a part of the 2021 Notes at a redemption price equal to 101.344% of the principal amount. On and after December 15, 2019, WESCO Distribution may redeem all or a part of the 2021 Notes at a redemption price equal to 100% of the principal amount.
The 2021 Indenture contains customary covenants and customary events of default. In addition, upon a change of control, the holders of 2021 Notes have the right to require WESCO Distribution to repurchase all or any part of the 2021 Notes at a redemption price equal to 101% of the principal amount, plus accrued and unpaid interest.
50
WESCO INTERNATIONAL, INC. AND SUBSIDIARIES
NOTES TO CONSOLIDATED FINANCIAL STATEMENTS—(CONTINUED)
5.375% Senior Notes due 2024
In June 2016, WESCO Distribution issued $350 million aggregate principal amount of 5.375% Senior Notes due 2024 (the "2024 Notes") through a private offering exempt from the registration requirements of the Securities Act. The 2024 Notes were issued at 100% of par and are governed by an indenture (the “2024 Indenture”) entered into on June 15, 2016 among WESCO Distribution, as issuer, WESCO International, as parent guarantor, and U.S. Bank National Association, as trustee. The 2024 Notes are unsecured senior obligations of WESCO Distribution and are guaranteed on a senior unsecured basis by WESCO International. The 2024 Notes bear interest at a rate of 5.375% per annum, payable semi-annually in arrears on June 15 and December 15 of each year, commencing on December 15, 2016. WESCO incurred costs totaling $6.0 million to issue the 2024 Notes, which are recorded as a reduction to the carrying value of the debt and are being amortized over the life of the note. The notes mature on June 15, 2024. The Company used the net proceeds to redeem its 2029 Debentures on September 15, 2016.
Under the terms of a registration rights agreement dated as of June 15, 2016 among WESCO Distribution, as the issuer, WESCO International, as parent guarantor, and Goldman, Sachs & Co., as representative of the initial purchasers of the 2024 Notes, WESCO Distribution and WESCO International agreed to register under the Securities Act notes having terms identical in all material respects to the 2024 Notes (the “2024 Exchange Notes”) and to make an offer to exchange the 2024 Exchange Notes for the 2024 Notes. WESCO Distribution launched the exchange offer on December 28, 2016 and the exchange offer expired on January 31, 2017.
At any time on or after June 15, 2019, WESCO Distribution may redeem all or a part of the 2024 Notes. Between June 15, 2019 and June 14, 2020, WESCO Distribution may redeem all or a part of the 2024 Notes at a redemption price equal to 104.031% of the principal amount. Between June 15, 2020 and June 14, 2021, WESCO Distribution may redeem all or a part of the 2024 Notes at a redemption price equal to 102.688% of the principal amount. Between June 15, 2021 and June 14, 2022, WESCO Distribution may redeem all or a part of the 2024 Notes at a redemption price equal to 101.344% of the principal amount. On and after June 15, 2022, WESCO Distribution may redeem all or a part of the 2024 Notes at a redemption price equal to 100% of the principal amount.
The 2024 Indenture contains customary covenants and events of default. Upon a change of control, the holders of the 2024 Notes have the right to require WESCO Distribution to repurchase all or any part of the 2024 Notes at a redemption price equal to 101% of the principal amount thereof, plus accrued and unpaid interest.
6.0% Convertible Senior Debentures due 2029
On August 27, 2009, WESCO International completed an exchange offer pursuant to which it issued $345 million in aggregate principal amount of the 2029 Debentures. On September 15, 2016, the Company redeemed the 2029 Debentures. Holders of the 2029 Debentures received cash totaling $344.8 million, which was equal to the principal amount of the then-outstanding debentures, in addition to accrued and unpaid interest. Holders who surrendered the 2029 Debentures for conversion received 18 shares of WESCO stock for each $1,000 principal amount of 2029 Debentures converted. In total, 6,267,688 shares were issued on the redemption date. The redemption resulted in a non-cash loss of $123.9 million, which included the write off of unamortized debt issuance costs.
WESCO separately accounted for the liability and equity components of its 2029 Debentures in a manner that reflected its non-convertible debt borrowing rate. WESCO utilized an interest rate of 13.875% to reflect the non-convertible debt borrowing rate of its offering upon issuance, which was determined based on discussions with its financial institutions and a review of relevant market data, and resulted in a $181.2 million discount to the 2029 Debenture balance and a net increase in additional capital of $106.5 million. In addition, the financing costs incurred to issue the 2029 Debentures were allocated between the instrument's debt and equity components. WESCO amortized the debt discount and financing costs over the life of the instrument. For the years ended December 31, 2016 and 2015, non-cash interest expense for the amortization of the debt discount and debt issuance costs was $3.1 million and $4.2 million, respectively.
Covenant Compliance
WESCO was in compliance with all relevant covenants contained in its debt agreements as of December 31, 2017.
51
WESCO INTERNATIONAL, INC. AND SUBSIDIARIES
NOTES TO CONSOLIDATED FINANCIAL STATEMENTS—(CONTINUED)
The following table sets forth the aggregate principal repayment requirements for all indebtedness for the next five years and thereafter, as of December 31, 2017:
(In thousands) | |||
2018 | $ | 35,299 | |
2019 | 85,246 | ||
2020 | 392,239 | ||
2021 | 500,000 | ||
2022 | — | ||
Thereafter | 350,000 | ||
Total payments on debt | 1,362,784 | ||
Debt discount | (513 | ) | |
Total debt | $ | 1,362,271 | |
WESCO’s credit agreements contain various restrictive covenants that, among other things, impose limitations on: (i) dividend payments or certain other restricted payments or investments; (ii) the incurrence of additional indebtedness and guarantees; (iii) creation of liens; (iv) mergers, consolidation or sales of substantially all of WESCO’s assets; (v) certain transactions among affiliates; (vi) payments by certain subsidiaries to WESCO, and (vii) capital expenditures. In addition, the Revolving Credit Facility and the Receivables Facility require WESCO to meet certain fixed charge coverage tests depending on availability or liquidity, respectively.
8. CAPITAL STOCK
Preferred Stock
There are 20 million shares of preferred stock authorized at a par value of $0.01 per share; there are no shares issued or outstanding. The Board of Directors has the authority, without further action by the stockholders, to issue all authorized preferred shares in one or more series and to fix the number of shares, designations, voting powers, preferences, optional and other special rights and the restrictions or qualifications thereof. The rights, preferences, privileges and powers of each series of preferred stock may differ with respect to dividend rates, liquidation values, voting rights, conversion rights, redemption provisions and other matters.
Common Stock
There are 210 million shares of common stock and 20 million shares of Class B common stock authorized at a par value of $0.01 per share. The Class B common stock is identical to the common stock, except for voting and conversion rights. The holders of Class B common stock have no voting rights. With certain exceptions, Class B common stock may be converted, at the option of the holder, into the same number of shares of common stock.
The terms of the Revolving Credit Facility and the Term Loan Facility provide certain limits on declaring or paying dividends, and repurchasing common stock. In addition, the indentures governing the 2021 Notes and 2024 Notes place limits on the Company's ability to pay dividends and repurchase common stock. At December 31, 2017 and 2016, no dividends had been declared and, therefore, no retained earnings were reserved for dividend payments.
9. INCOME TAXES
The Tax Cuts and Jobs Act of 2017 (the "TCJA”), enacted on December 22, 2017, provides a broad range of tax reform, including changes to the U.S. corporate tax rate, business-related exclusions, deductions and credits, as well as international tax provisions. Most notably, the TCJA permanently reduces the U.S. corporate income tax rate from 35% to 21%, effective January 1, 2018, and imposes a one-time tax on the deemed repatriation of undistributed foreign earnings (the "transition tax"). The TCJA also introduces anti-base erosion provisions, including the global intangible low-taxed income ("GILTI") tax.
As a result of the reduction in the U.S. corporate income tax rate, the Company remeasured its U.S. deferred income tax balances as of December 31, 2017 and recorded a provisional deferred income tax benefit of $56.4 million for the year ended December 31, 2017. The Company also recognized provisional current income tax expense for the transition tax under the TCJA of $82.8 million for the year ended December 31, 2017. After the utilization of foreign tax credit carryforwards of $17.8 million, a provisional liability of $65.0 million was accrued for the transition tax as of December 31, 2017 and is payable over a period of eight years.
52
WESCO INTERNATIONAL, INC. AND SUBSIDIARIES
NOTES TO CONSOLIDATED FINANCIAL STATEMENTS—(CONTINUED)
As of December 31, 2017, the Company had not completed its accounting for certain income tax effects of the TCJA and the provisional amounts described above could change materially in future periods. Although the Company made reasonable estimates to determine the effect of the TCJA on its deferred income taxes, the Company must gather and analyze additional information to complete the related accounting. Similarly, the Company's accounting for the income tax effects of the transition tax is incomplete primarily due to the complexity of computing foreign earnings and measuring the portion of such earnings held in cash and cash equivalents, which is subject to a higher tax rate. Further regulatory guidance is expected to be issued regarding the implementation and interpretation of the TCJA provisions, which could affect the Company's analyses and ultimate conclusions. As described in Note 2, future adjustments (if any) will be recognized as discrete income tax expense or benefit in the period the adjustments are determined. The accounting for the income tax effects of the TCJA will be completed within the measurement period defined in Note 2.
The following table sets forth the components of income before income taxes by jurisdiction:
Year Ended December 31, | |||||||||||
2017 | 2016 | 2015 | |||||||||
(In thousands) | |||||||||||
United States | $ | 180,957 | $ | 80,881 | $ | 288,881 | |||||
Foreign | 71,483 | 50,670 | 15,029 | ||||||||
Income before income taxes | $ | 252,440 | $ | 131,551 | $ | 303,910 | |||||
The following table sets forth the components of the provision (benefit) for income taxes:
Year Ended December 31, | |||||||||||
2017 | 2016 | 2015 | |||||||||
(In thousands) | |||||||||||
Current income taxes: | |||||||||||
Federal (1) | $ | 122,170 | $ | 65,614 | $ | 45,812 | |||||
State | 2,259 | 6,489 | 4,565 | ||||||||
Foreign | 15,274 | 3,502 | 2,309 | ||||||||
Total current income taxes | 139,703 | 75,605 | 52,686 | ||||||||
Deferred income taxes: | |||||||||||
Federal | (48,060 | ) | (42,835 | ) | 29,593 | ||||||
State | 4,508 | (2,938 | ) | 3,767 | |||||||
Foreign | (6,844 | ) | 599 | 9,491 | |||||||
Total deferred income taxes | (50,396 | ) | (45,174 | ) | 42,851 | ||||||
Provision for income taxes | $ | 89,307 | $ | 30,431 | $ | 95,537 | |||||
(1) | Income tax (expense) benefit related to stock-based awards and other equity instruments recorded directly to additional paid in capital totaled $(0.1) million and $1.6 million in 2016 and 2015, respectively. Due to the adoption of ASU 2016-09, as described in Note 2, there was no income tax (expense) benefit recorded to additional paid in capital for stock-based awards in 2017. |
53
WESCO INTERNATIONAL, INC. AND SUBSIDIARIES
NOTES TO CONSOLIDATED FINANCIAL STATEMENTS—(CONTINUED)
The following table sets forth the reconciliation between the federal statutory income tax rate and the effective tax rate:
Year Ended December 31, | ||||||||
2017 | 2016 | 2015 | ||||||
Federal statutory rate | 35.0 | % | 35.0 | % | 35.0 | % | ||
State income taxes, net of federal income tax benefit | 1.4 | 1.0 | 2.2 | |||||
Deemed repatriation of undistributed foreign earnings | 32.8 | — | — | |||||
Deferred income tax remeasurement | (22.4 | ) | — | — | ||||
Tax effect of intercompany financing | (10.5 | ) | (19.9 | ) | (8.8 | ) | ||
Foreign tax rate differences | (1.3 | ) | (0.4 | ) | (1.1 | ) | ||
Valuation allowance against deferred tax assets | 0.4 | 1.1 | — | |||||
Nondeductible expenses | (0.1 | ) | 1.6 | 1.2 | ||||
Adjustment related to uncertain tax positions | — | 3.7 | 2.7 | |||||
Other | 0.1 | 1.0 | 0.2 | |||||
Effective tax rate | 35.4 | % | 23.1 | % | 31.4 | % | ||
As of December 31, 2017, WESCO’s foreign subsidiaries had undistributed earnings of approximately $884.0 million, of which $807.2 million was attributable to the Company's Canadian operations. As described above, WESCO recognized provisional income tax expense of $82.8 million for the year ended December 31, 2017 resulting from the transition tax. Notwithstanding the effects of applying such provisions of the TCJA, WESCO continues to assert that the earnings of its foreign subsidiaries are indefinitely reinvested to fund growth in the foreign markets. However, as a result of the TCJA, the Company is reevaluating its intent and ability to repatriate foreign cash based upon the available liquidity and cash flow needs of its foreign subsidiaries and will disclose in future filings any change in its intention to repatriate undistributed foreign earnings and any resulting income tax impacts. Until the Company completes this reevaluation, it is not practicable to determine the amount of any unrecognized deferred income taxes on these undistributed foreign earnings.
The following table sets forth deferred tax assets and liabilities:
As of December 31, | |||||||||||||||
2017 | 2016 | ||||||||||||||
(In thousands) | |||||||||||||||
Assets | Liabilities | Assets | Liabilities | ||||||||||||
Accounts receivable | $ | 3,496 | $ | — | $ | 3,484 | $ | — | |||||||
Inventories | — | 3,181 | — | 4,001 | |||||||||||
Depreciation of property, buildings and equipment | — | 13,283 | — | 11,487 | |||||||||||
Amortization of intangible assets (1) | — | 159,107 | — | 237,015 | |||||||||||
Employee benefits | 14,835 | — | 18,577 | — | |||||||||||
Stock-based compensation (2) | 16,341 | — | 23,844 | — | |||||||||||
Advance payments | 8,456 | — | 22,056 | — | |||||||||||
Foreign tax credits | — | — | 15,698 | — | |||||||||||
Tax loss carryforwards | 19,128 | — | 18,440 | — | |||||||||||
Other | 11,850 | 8,672 | 7,175 | 7,783 | |||||||||||
Deferred income taxes before valuation allowance | 74,106 | 184,243 | 109,274 | 260,286 | |||||||||||
Valuation allowance | (2,518 | ) | — | (1,430 | ) | — | |||||||||
Total deferred income taxes (1) | $ | 71,588 | $ | 184,243 | $ | 107,844 | $ | 260,286 | |||||||
(1) | As described in Note 2, the Consolidated Balance Sheet at December 31, 2016 was revised to correct certain financial statement line items, including deferred income taxes. |
(2) | The Company does not expect the realizability of the deferred tax asset related to stock-based compensation to be materially impacted by the TCJA's expansion on the limitation of deductions for excessive employee compensation. |
54
WESCO INTERNATIONAL, INC. AND SUBSIDIARIES
NOTES TO CONSOLIDATED FINANCIAL STATEMENTS—(CONTINUED)
As of December 31, 2017 and 2016, WESCO had deferred tax assets of $10.4 million and $10.0 million, respectively, related to Canadian net operating loss carryforwards. The Canadian net operating loss carryforwards expire beginning in 2029 through 2037. Additionally, WESCO had deferred tax assets of $7.0 million and $6.2 million as of December 31, 2017 and 2016, respectively, related to non-Canadian foreign net operating loss carryforwards. These net operating loss carryforwards expire beginning in 2019, while some may be carried forward indefinitely. As of December 31, 2017 and 2016, WESCO had deferred tax assets of $3.1 million and $3.2 million, respectively, related to state net operating loss carryforwards. These carryforwards expire beginning in 2022 through 2036. The Company has determined, based upon an evaluation of all available evidence, that it "more-likely-than-not" will utilize all of its net operating loss carryforwards before expiration other than those incurred in a non-Canadian foreign location. Accordingly, the Company recorded a full valuation allowance against the total deferred tax asset related to these non-Canadian foreign net operating loss carryforwards of $2.5 million at December 31, 2017.
As of December 31, 2016, WESCO had deferred tax assets of $15.7 million related to foreign tax credit (“FTC”) carryforwards. As described above, the Company fully utilized these FTC carryforwards against the liability recorded for the transition tax imposed by the TCJA.
The Company is under examination by tax authorities in the U.S. and Canada and remains subject to examination until the applicable statutes of limitation expire. The statutes of limitation for the material jurisdictions in which the Company files income tax returns remain open as follows:
United States — Federal | 2004 and forward | |
United States — Material States | 2013 and forward | |
Canada | 2004 and forward | |
The statutes of limitation with respect to the Company’s 2004 to 2007 U.S. federal income tax returns are open by waiver only in connection with the implementation of the Mutual Agreement Procedure (“MAP”) concluded in the fourth quarter of 2015 between the Competent Authorities of the Internal Revenue Service (the "IRS") and the Canada Revenue Agency (the “CRA”) and the request for MAP assistance filed with the IRS and CRA in 2017 with respect to certain other 2004 to 2007 transfer pricing matters. The statutes of limitation with respect to the Company’s 2008 to 2011 U.S. federal income tax returns are open by waiver only in connection with the implementation of the Advance Pricing Agreement (“APA”) concluded in the fourth quarter of 2015 between the IRS and CRA and certain other transfer pricing matters pending with the CRA. The statutes of limitation with respect to the Company’s 2012 and 2013 U.S. federal income tax returns are open by waiver only in connection with the IRS examination of the 2012 and 2013 years and the APA.
The following table sets forth the reconciliation of gross unrecognized tax benefits:
As of December 31, | |||||||||||
2017 | 2016 | 2015 | |||||||||
(In thousands) | |||||||||||
Beginning balance January 1 | $ | 6,181 | $ | 5,436 | $ | 20,033 | |||||
Additions based on tax positions related to the current year | — | — | 46 | ||||||||
Additions for tax positions of prior years | — | 3,298 | 402 | ||||||||
Reductions for tax positions of prior years | (155 | ) | (21 | ) | (378 | ) | |||||
Settlements | (1,025 | ) | (1,921 | ) | (9,638 | ) | |||||
Lapse in statute of limitations | (755 | ) | (728 | ) | (1,497 | ) | |||||
Foreign currency exchange rate changes | 102 | 117 | (3,532 | ) | |||||||
Ending balance December 31 | $ | 4,348 | $ | 6,181 | $ | 5,436 | |||||
The total amount of unrecognized tax benefits were $4.3 million, $6.2 million, and $5.4 million as of December 31, 2017, 2016 and 2015, respectively. The amount of unrecognized tax benefits that would affect the effective tax rate if recognized in the consolidated financial statements was $1.7 million, $7.5 million, and $6.2 million, respectively.
It is reasonably possible that the amount of unrecognized tax benefits will decrease by approximately $3.0 million within the next twelve months due to the settlement of uncertain tax positions related to IRS audits or the expiration of statutes of limitation. Of this amount, approximately $0.3 million could impact the effective tax rate.
The Company classifies interest related to unrecognized tax benefits as interest income or expense. Interest expense on unrecognized tax benefits was $0.1 million and $1.2 million for 2017 and 2016, respectively. In 2015, interest income of $8.7 million was recognized as a result of the conclusion of the MAP and APA proceedings for the 2004 to 2014 tax years. As of
55
WESCO INTERNATIONAL, INC. AND SUBSIDIARIES
NOTES TO CONSOLIDATED FINANCIAL STATEMENTS—(CONTINUED)
December 31, 2017 and 2016, WESCO had an accrued liability of $1.8 million and $2.2 million, respectively, for interest expense related to unrecognized tax benefits. The Company classifies penalties related to unrecognized tax benefits as part of income tax expense. Penalties recorded in income tax expense were immaterial in 2017, 2016, and 2015.
10. EARNINGS PER SHARE
Basic earnings per share is computed by dividing net income attributable to WESCO International by the weighted-average number of common shares outstanding during the periods. Diluted earnings per share is computed by dividing net income attributable to WESCO International by the weighted-average common shares and common share equivalents outstanding during the periods. The dilutive effect of common share equivalents is considered in the diluted earnings per share computation using the treasury stock method, which includes consideration of equity awards and contingently convertible debt.
The following tables set forth the details of basic and diluted earnings per share:
Year Ended December 31, | |||||||||||
2017 | 2016 | 2015 | |||||||||
(In thousands, except per share data) | |||||||||||
Net income attributable to WESCO International | $ | 163,460 | $ | 101,588 | $ | 210,687 | |||||
Weighted-average common shares outstanding used in computing basic earnings per share | 47,849 | 44,116 | 43,433 | ||||||||
Common shares issuable upon exercise of dilutive equity awards | 512 | 543 | 626 | ||||||||
Common shares issuable from contingently convertible debentures (see below for basis of calculation) | — | 3,674 | 6,314 | ||||||||
Weighted-average common shares outstanding and common share equivalents used in computing diluted earnings per share | 48,361 | 48,333 | 50,373 | ||||||||
Earnings per share attributable to WESCO International | |||||||||||
Basic | $ | 3.42 | $ | 2.30 | $ | 4.85 | |||||
Diluted | $ | 3.38 | $ | 2.10 | $ | 4.18 | |||||
The computation of diluted earnings per share attributable to WESCO International excluded equity awards of approximately 1.3 million for the year ended December 31, 2017 and approximately 1.2 million for the years ended December 31, 2016 and 2015. These shares were excluded because their effect would have been antidilutive.
Because of WESCO’s previous obligation to settle the par value of the 2029 Debentures in cash upon conversion, WESCO was required to include shares underlying the 2029 Debentures in its diluted weighted-average shares outstanding when the average stock price per share for the period exceeded the conversion price of the debentures. Only the number of shares that would have been issuable under the treasury stock method of accounting for share dilution were included, which was based upon the amount by which the average stock price exceeded the conversion price. The conversion price of the 2029 Debentures was $28.87 and the maximum amount of share dilution was limited to 11,951,932 shares. Since the 2029 Debentures were redeemed on September 15, 2016, there was no dilution from contingently convertible debentures for the year ended December 31, 2017. For the years ended December 31, 2016 and 2015, the effect of the 2029 Debentures on diluted earnings per share attributable to WESCO International was a decrease of $0.17 and $0.60, respectively.
In December 2014, the Company's Board of Directors authorized the repurchase of up to $300 million of the Company's common stock through December 31, 2017. As of December 31, 2016, WESCO had repurchased 2,468,576 shares of the Company's common stock for $150.0 million under this repurchase authorization. During the year ended December 31, 2017, the Company entered into accelerated stock repurchase agreements (the "ASR Transactions") with a certain financial institution to repurchase additional shares of its common stock. In exchange for up-front cash payments totaling $100.0 million, the Company received 1,778,537 shares. The total number of shares ultimately delivered under the ASR Transactions was determined by the average of the volume-weighted-average prices of the Company's common stock for each exchange business day during the respective settlement valuation periods. WESCO funded the repurchases with borrowings under its accounts receivable securitization and revolving credit facilities. For purposes of computing earnings per share, share repurchases have been reflected as a reduction to common shares outstanding on the respective delivery dates.
56
WESCO INTERNATIONAL, INC. AND SUBSIDIARIES
NOTES TO CONSOLIDATED FINANCIAL STATEMENTS—(CONTINUED)
11. EMPLOYEE BENEFIT PLANS
Defined Contribution Plans
A majority of WESCO’s employees are covered by defined contribution retirement savings plans for their services rendered subsequent to WESCO’s formation. WESCO also offers a deferred compensation plan for select individuals. For U.S. participants, WESCO matches contributions made by employees at an amount equal to 50% of participants' total monthly contributions up to a maximum of 6% of eligible compensation. For Canadian participants, WESCO makes contributions in amounts ranging from 3% to 5% of participants' eligible compensation based on years of continuous service. WESCO may also make, subject to the Board of Directors' approval, a discretionary contribution to the defined contribution retirement savings plan covering U.S. participants if certain predetermined profit levels are attained. A discretionary employer contribution charge of $10.0 million was incurred in 2017. In 2016 and 2015, there were no charges for discretionary employer contributions. For the years ended December 31, 2017, 2016 and 2015, WESCO incurred charges of $31.3 million, $18.5 million, and $18.1 million, respectively, for all such plans. Contributions are made in cash to employee retirement savings plan accounts. The deferred compensation plan is an unfunded plan. As of December 31, 2017 and 2016, the Company's obligation under the deferred compensation plan was $24.3 million and $21.7 million, respectively. Employees have the option to transfer balances allocated to their accounts in the defined contribution retirement savings plan and the deferred compensation plan into any of the available investment options.
Defined Benefit Plans
The Company sponsors a contributory defined benefit plan (the "Plan") covering substantially all Canadian employees of EECOL. The Plan provides retirement benefits based on earnings and credited service, and participants contribute 2% of their earnings to the Plan. Participants become 100% vested after two years of continuous service or, if earlier, at the participant's normal retirement age.
The Company also sponsors a Supplemental Executive Retirement Plan (the "SERP"), which provides additional pension benefits to certain executives of EECOL based on earnings, and credited service. Effective January 1, 2013, the SERP was closed to new participants and existing participants became 100% vested. SERP participants continue to contribute 4% of their earnings to the Plan.
57
WESCO INTERNATIONAL, INC. AND SUBSIDIARIES
NOTES TO CONSOLIDATED FINANCIAL STATEMENTS—(CONTINUED)
The following tables present the changes in benefit obligations, plan assets and funded status for the pension plans and the components of net periodic pension cost.
Year Ended December 31, | |||||||
(In thousands) | 2017 | 2016 | |||||
Accumulated Benefit Obligation (ABO) at December 31 | $ | 92,375 | $ | 75,666 | |||
Change in Projected Benefit Obligation (PBO) | |||||||
PBO at beginning of year | $ | 96,160 | $ | 87,186 | |||
Service cost | 4,328 | 3,845 | |||||
Interest cost | 3,912 | 3,856 | |||||
Participant contributions | 735 | 709 | |||||
Actuarial loss, including assumption changes | 10,906 | 2,172 | |||||
Benefits paid | (3,005 | ) | (4,404 | ) | |||
Foreign currency exchange rate changes | 7,283 | 2,796 | |||||
PBO at end of year | $ | 120,319 | $ | 96,160 | |||
Change in Plan Assets | |||||||
Fair value of plan assets at beginning of year | $ | 84,753 | $ | 79,185 | |||
Actual return on plan assets | 7,875 | 4,115 | |||||
Participant contributions | 735 | 709 | |||||
Employer contributions | 368 | 1,956 | |||||
Benefits paid | (3,005 | ) | (4,404 | ) | |||
Foreign currency exchange rate changes | 6,456 | 3,192 | |||||
Fair value of plan assets at end of year | $ | 97,182 | $ | 84,753 | |||
Funded Status | $ | (23,137 | ) | $ | (11,407 | ) | |
Amounts Recognized in the Consolidated Balance Sheets | |||||||
Current liabilities | $ | (395 | ) | $ | (364 | ) | |
Noncurrent liabilities | (22,742 | ) | (11,043 | ) | |||
Net amount recognized | $ | (23,137 | ) | $ | (11,407 | ) | |
Amounts Recognized in Accumulated Other Comprehensive Income (Loss) | |||||||
Net actuarial loss (gain) | $ | 2,508 | $ | (6,234 | ) | ||
Total amount recognized, before tax effect | $ | 2,508 | $ | (6,234 | ) | ||
58
WESCO INTERNATIONAL, INC. AND SUBSIDIARIES
NOTES TO CONSOLIDATED FINANCIAL STATEMENTS—(CONTINUED)
Year Ended December 31, | |||||||||||
2017 | 2016 | 2015 | |||||||||
(In thousands) | |||||||||||
Components of Net Periodic Pension Cost | |||||||||||
Service cost | $ | 4,328 | $ | 3,845 | $ | 4,537 | |||||
Interest cost | 3,912 | 3,856 | 4,012 | ||||||||
Expected return on plan assets | (5,562 | ) | (5,328 | ) | (5,260 | ) | |||||
Recognized actuarial gain | (149 | ) | (31 | ) | (15 | ) | |||||
Net periodic pension cost | $ | 2,529 | $ | 2,342 | $ | 3,274 | |||||
Other Changes in Plan Assets and PBO Recognized in Accumulated Other Comprehensive Income (Loss) | |||||||||||
Net actuarial loss (gain) | $ | 8,593 | $ | 2,756 | $ | (6,208 | ) | ||||
Amortization of unrecognized net actuarial gain | 149 | 31 | 15 | ||||||||
Total amount recognized, before tax effect | 8,742 | 2,787 | (6,193 | ) | |||||||
Tax effect | (2,361 | ) | (302 | ) | 1,661 | ||||||
Total amount recognized, after tax effect | $ | 6,381 | $ | 2,485 | $ | (4,532 | ) | ||||
Total recognized in net periodic pension cost and accumulated other comprehensive income (loss) | $ | 8,910 | $ | 4,827 | $ | (1,258 | ) | ||||
The following weighted-average actuarial assumptions were used to determine benefit obligations at December 31:
2017 | 2016 | ||||||||||
Pension Plan | SERP | Pension Plan | SERP | ||||||||
Discount rate | 3.5 | % | 3.5 | % | 3.9 | % | 3.9 | % | |||
Rate of compensation increase | 3.8 | % | 3.8 | % | 3.8 | % | 3.8 | % | |||
The following weighted-average actuarial assumptions were used to determine net periodic pension costs at January 1:
Year Ended December 31, | |||||||||||||||||
2017 | 2016 | 2015 | |||||||||||||||
Pension Plan | SERP | Pension Plan | SERP | Pension Plan | SERP | ||||||||||||
Discount rate | 3.9 | % | 3.9 | % | 4.2 | % | 4.2 | % | 4.1 | % | 4.1 | % | |||||
Expected long-term return on assets | 6.4 | % | n/a | 6.4 | % | n/a | 6.4 | % | n/a | ||||||||
Rate of compensation increase | 3.8 | % | 3.8 | % | 4.0 | % | 4.0 | % | 4.0 | % | 4.0 | % | |||||
The following benefit payments, which reflect expected future service, are expected to be paid:
Years ending December 31 | (In thousands) | ||
2018 | $ | 3,092 | |
2019 | 3,131 | ||
2020 | 3,215 | ||
2021 | 3,382 | ||
2022 | 3,488 | ||
2023 to 2027 | 21,776 | ||
The Company expects to contribute approximately $0.4 million to the SERP in 2018.
59
WESCO INTERNATIONAL, INC. AND SUBSIDIARIES
NOTES TO CONSOLIDATED FINANCIAL STATEMENTS—(CONTINUED)
The Plan's weighted asset allocations by asset category are as follows:
December 31 | |||||
2017 | 2016 | ||||
Asset Category | |||||
Pooled Funds: | |||||
Canadian equities | 11.5 | % | 11.7 | % | |
U.S. equities | 4.6 | % | 4.6 | % | |
Non-North American equities | 20.8 | % | 21.6 | % | |
Fixed income investments | 41.4 | % | 43.4 | % | |
Other | 21.7 | % | 18.7 | % | |
Total | 100.0 | % | 100.0 | % | |
The Plan's long-term overall objective is to maintain benefits at their current level without affecting the cost of maintaining the Plan, assuming that the demographic make-up of the group of members remains the same.
The primary investment objective, in support of the overall objective, is to earn the highest rate of return possible for the Plan, while keeping risk at acceptable levels. The long-term return objective of the Plan is to achieve a minimum annualized rate of return in excess of the actuarial requirements. This translates into a required return of 3.0% above inflation, net of investment management fees. The return objective is consistent with the overall investment risk level that the Plan assumes in order to meet the pension obligations of the Plan. To achieve this long term investment objective, the Plan has adopted an asset mix that has a combination of primarily equity and fixed income investments. Risk is controlled by investing in a well-diversified portfolio of asset classes. A benchmark portfolio is established based on the expected returns for each asset class available. The investment of the Plan's assets in accordance with the benchmark portfolio should enable the Plan to not only attain, but also exceed the minimum overall objective.
The following table presents the target asset mix based on market value for each investment category within which the investment managers must invest the Plan's assets. The asset mix is reviewed and rebalanced to target on an annual basis.
Asset Category | Target % | |
Canadian equities | 12.5 | % |
Non-Canadian equities | 27.5 | % |
Total equities | 40 | % |
Fixed income investments | 45 | % |
Other investments | 15 | % |
The Plan's assets are measured at fair value, which is defined as the price that would be received to sell an asset or paid to transfer a liability in an orderly transaction between market participants at the measurement date. Financial assets and liabilities are classified in the fair value hierarchy based on the lowest level of any input that is significant to the measurement of fair value. Investments for which fair value is measured using the net asset value (NAV) per share practical expedient are not classified in the fair value hierarchy. The following describes the valuation methodologies used to measure the fair value of the Plan's assets.
Pooled Equity Investments. These investments consist of the Plan's share of segregated funds that primarily invest in equity securities. The funds are valued at the net asset value of shares held in the underlying funds.
Pooled Fixed Income Investments. These investments consist of the Plan's share of a segregated fund that primarily invests in Canadian issued bonds and debentures and is valued at the net asset value of shares held in the underlying funds.
Other Investments. These investments consist of cash and cash equivalents, a money market fund and diversified growth funds. The diversified growth funds invest in a broad range of asset classes, including equities, bonds, infrastructure, property, commodities and absolute return strategies. These investments are valued at the net asset value of shares held in the underlying funds.
The fair value methods described above may not be indicative of net realizable value or reflective of future fair values. Additionally, while the Company believes the valuation methods are appropriate and consistent with other market participants,
60
WESCO INTERNATIONAL, INC. AND SUBSIDIARIES
NOTES TO CONSOLIDATED FINANCIAL STATEMENTS—(CONTINUED)
the use of different methodologies or assumptions to determine the fair value of certain financial instruments could result in a different fair value measurement at the reporting date.
The following tables set forth the fair value of the Plan's assets by asset category:
December 31, 2017 | |||||||||||||||||||
(In thousands) | Level 1 | Level 2 | Level 3 | NAV (1) | Total | ||||||||||||||
Pooled Funds: | |||||||||||||||||||
Canadian equities | $ | — | $ | — | $ | — | $ | 11,211 | $ | 11,211 | |||||||||
U.S. equities | — | — | — | 4,436 | 4,436 | ||||||||||||||
Non-North American equities | — | — | — | 20,207 | 20,207 | ||||||||||||||
Fixed income investments | — | — | — | 40,193 | 40,193 | ||||||||||||||
Other | 3,996 | — | — | 17,139 | 21,135 | ||||||||||||||
Total investments | $ | 3,996 | $ | — | $ | — | $ | 93,186 | $ | 97,182 | |||||||||
December 31, 2016 | |||||||||||||||||||
(In thousands) | Level 1 | Level 2 | Level 3 | NAV (1) | Total | ||||||||||||||
Pooled Funds: | |||||||||||||||||||
Canadian equities | $ | — | $ | — | $ | — | $ | 9,916 | $ | 9,916 | |||||||||
U.S. equities | — | — | — | 3,881 | 3,881 | ||||||||||||||
Non-North American equities | — | — | — | 18,296 | 18,296 | ||||||||||||||
Fixed income investments | — | — | — | 36,677 | 36,677 | ||||||||||||||
Other | 235 | — | — | 15,748 | 15,983 | ||||||||||||||
Total investments | $ | 235 | $ | — | $ | — | $ | 84,518 | $ | 84,753 | |||||||||
(1) | As described above, investments measured at fair value using the NAV per share practical expedient have not been classified in the fair value hierarchy. The amounts presented in the tables are intended to reconcile the fair value hierarchy to the total fair value of plan assets. |
12. STOCK-BASED COMPENSATION
WESCO sponsors four stock-based compensation plans. The 1999 Long-Term Incentive Plan, as amended and restated (“LTIP”), was designed to be the successor plan to all prior plans. Any shares remaining reserved for future issuance under the prior plans are available for issuance under the LTIP. The LTIP and predecessor plans are administered by the Compensation Committee of the Board of Directors.
On May 31, 2017, the Company renewed and restated the LTIP, increasing the maximum number of shares of common stock that may be issued under the plan by 1.7 million shares to 3.4 million. Under the LTIP, the total number of shares of common stock authorized to be issued will be reduced by 1 share of common stock for every 1 share that is subject to a stock appreciation right granted, and 1.83 shares of common stock for every 1 share that is subject to an award other than a stock appreciation right granted on or after May 31, 2017. As of December 31, 2017, 3.6 million shares of common stock were reserved under the LTIP for future equity award grants.
Except for the performance-based award, awards granted vest and become exercisable once criteria based on time is achieved. Performance-based awards vest based on market or performance conditions. All awards vest immediately in the event of a change in control. Each award terminates on the tenth anniversary of its grant date unless terminated sooner under certain conditions.
WESCO recognized $14.8 million, $12.5 million and $12.9 million of non-cash stock-based compensation expense, which is included in selling, general and administrative expenses, for the years ended December 31, 2017, 2016 and 2015, respectively. As of December 31, 2017, there was $18.7 million of total unrecognized compensation expense related to non-vested stock-based compensation arrangements for all awards previously made of which approximately $11.3 million is expected to be recognized in 2018, $6.6 million in 2019 and $0.8 million in 2020.
The total intrinsic value of awards exercised during the years ended December 31, 2017, 2016, and 2015 was $17.2 million, $13.0 million, and $15.8 million, respectively. The gross deferred tax benefit associated with the exercise of stock-based awards totaled $6.4 million, $4.9 million, and $5.7 million in 2017, 2016, and 2015, respectively.
61
WESCO INTERNATIONAL, INC. AND SUBSIDIARIES
NOTES TO CONSOLIDATED FINANCIAL STATEMENTS—(CONTINUED)
The following table sets forth a summary of stock-settled stock appreciation rights and related information for the years indicated:
2017 | 2016 | 2015 | ||||||||||||||||||||||||
Awards | Weighted-Average Exercise Price | Weighted-Average Remaining Contractual Life | Aggregate Intrinsic Value (In thousands) | Awards | Weighted-Average Exercise Price | Awards | Weighted-Average Exercise Price | |||||||||||||||||||
Beginning of year | 2,439,487 | $ | 52.62 | 2,567,021 | $ | 54.47 | 2,480,745 | $ | 50.91 | |||||||||||||||||
Granted | 455,807 | 71.21 | 709,999 | 42.63 | 394,182 | 69.54 | ||||||||||||||||||||
Exercised | (495,181 | ) | 42.19 | (526,818 | ) | 41.54 | (232,542 | ) | 35.80 | |||||||||||||||||
Canceled | (161,506 | ) | 66.06 | (310,715 | ) | 63.71 | (75,364 | ) | 73.59 | |||||||||||||||||
End of year | 2,238,607 | 57.75 | 6.2 | $ | 28,791 | 2,439,487 | 52.62 | 2,567,021 | 54.47 | |||||||||||||||||
Exercisable at end of year | 1,331,580 | $ | 56.96 | 4.6 | $ | 18,801 | 1,549,350 | $ | 53.35 | 2,034,263 | $ | 49.36 | ||||||||||||||
WESCO granted the following stock-settled stock appreciation rights at the following weighted-average assumptions:
2017 | 2016 | 2015 | |||
Stock-settled stock appreciation rights granted | 455,807 | 709,999 | 394,182 | ||
Risk free interest rate | 1.9% | 1.2% | 1.6% | ||
Expected life (in years) | 5 | 5 | 5 | ||
Expected volatility | 29% | 32% | 32% | ||
The weighted-average fair value per stock-settled stock appreciation right granted was $20.52, $12.88 and $21.68 for the years ended December 31, 2017, 2016 and 2015, respectively.
The following table sets forth a summary of time-based restricted stock units and related information for the years ended December 31, 2017, 2016 and 2015:
2017 | 2016 | 2015 | ||||||||||||||||||
Awards | Weighted-Average Fair Value | Awards | Weighted-Average Fair Value | Awards | Weighted-Average Fair Value | |||||||||||||||
Unvested at beginning of year | 257,096 | $ | 57.47 | 175,411 | $ | 74.52 | 185,457 | $ | 73.87 | |||||||||||
Granted | 100,993 | 71.33 | 162,256 | 44.45 | 81,022 | 69.05 | ||||||||||||||
Vested | (44,720 | ) | 84.57 | (60,015 | ) | 72.41 | (76,387 | ) | 66.89 | |||||||||||
Forfeited | (23,315 | ) | 57.52 | (20,556 | ) | 59.15 | (14,681 | ) | 75.73 | |||||||||||
Unvested at end of year | 290,054 | $ | 58.11 | 257,096 | $ | 57.47 | 175,411 | $ | 74.52 | |||||||||||
The weighted-average fair value per restricted stock unit granted was $71.33, $44.45 and $69.05 for the years ended December 31, 2017, 2016 and 2015, respectively.
62
WESCO INTERNATIONAL, INC. AND SUBSIDIARIES
NOTES TO CONSOLIDATED FINANCIAL STATEMENTS—(CONTINUED)
The following table sets forth a summary of performance-based awards for the year ended December 31, 2017:
2017 | 2016 | 2015 | ||||||||||||||||||
Awards | Weighted-Average Fair Value | Awards | Weighted-Average Fair Value | Awards | Weighted-Average Fair Value | |||||||||||||||
Unvested at beginning of year | 149,320 | $ | 60.36 | 114,520 | $ | 76.48 | 130,004 | $ | 80.21 | |||||||||||
Granted | 39,978 | 76.63 | 91,768 | 47.00 | 59,661 | 67.81 | ||||||||||||||
Vested | — | — | — | — | (38,869 | ) | 72.25 | |||||||||||||
Forfeited | (40,790 | ) | 76.77 | (56,968 | ) | 71.25 | (36,276 | ) | 80.14 | |||||||||||
Unvested at end of year | 148,508 | $ | 60.23 | 149,320 | $ | 60.36 | 114,520 | $ | 76.48 | |||||||||||
The weighted-average fair value per performance-based award granted was $76.63, $47.00 and $67.81 for the years ended December 31, 2017, 2016 and 2015, respectively.
The fair value of the performance shares based on total stockholder return granted during the year ended December 31, 2017, 2016 and 2015 were estimated using the following weighted-average assumptions:
Year ended December 31, | |||||||||||
2017 | 2016 | 2015 | |||||||||
Grant date share price | $ | 71.65 | $ | 42.44 | $ | 69.54 | |||||
WESCO expected volatility | 29 | % | 26 | % | 27 | % | |||||
Peer group median volatility | 24 | % | 24 | % | 23 | % | |||||
Risk-free interest rate | 1.5 | % | 0.9 | % | 1.1 | % | |||||
Correlation | 114 | % | 122 | % | 96 | % | |||||
The unvested performance-based awards in the table above include 74,254 shares in which vesting of the ultimate number of shares is dependent upon WESCO's total stockholder return in relation to the total stockholder return of a select group of peer companies over a three-year period. The fair value of these awards is determined using a Monte Carlo simulation model. These awards are accounted for as awards with market conditions; compensation cost is recognized over the service period, regardless of whether the market conditions are achieved and the awards ultimately vest.
Vesting of the remaining 74,254 shares of performance-based awards in the table above is dependent upon the three-year average growth rate of WESCO's net income. The fair value of these awards is based upon the grant-date closing price of WESCO's common stock. These awards are accounted for as awards with performance conditions; compensation cost is recognized over the performance period based upon WESCO's determination of whether it is probable that the performance targets will be achieved.
13. COMMITMENTS AND CONTINGENCIES
Future minimum rental payments required under operating leases, primarily for real property that have noncancelable lease terms in excess of one year as of December 31, 2017, are as follows:
Years ending December 31 | (In thousands) | ||
2018 | $ | 65,510 | |
2019 | 55,378 | ||
2020 | 44,036 | ||
2021 | 33,498 | ||
2022 | 23,904 | ||
Thereafter | 49,150 | ||
Rental expense for the years ended December 31, 2017, 2016 and 2015 was $82.0 million, $76.7 million and $70.7 million, respectively.
63
WESCO INTERNATIONAL, INC. AND SUBSIDIARIES
NOTES TO CONSOLIDATED FINANCIAL STATEMENTS—(CONTINUED)
From time to time, a number of lawsuits and claims have been or may be asserted against us relating to the conduct of its business, including routine litigation relating to commercial and employment matters. The outcome of any litigation cannot be predicted with certainty, and some lawsuits may be determined adversely to WESCO. However, management does not believe that the ultimate outcome of any such pending matters is likely to have a material adverse effect on WESCO's financial condition or liquidity, although the resolution in any fiscal period of one or more of these matters may have a material adverse effect on WESCO's results of operations for that period.
WESCO is subject to the laws and regulations of states and other jurisdictions concerning the identification, reporting and escheatment (the transfer of property to the state) of unclaimed or abandoned funds, and is subject to audit and examination for compliance with these requirements. The State of Delaware conducted an audit concerning the identification, reporting and escheatment of unclaimed or abandoned property, and in December 2017, WESCO reached agreement in principle with the State of Delaware to resolve the audit. The settlement amount was not material to the Company’s financial condition or results of operations.
In October 2014, WESCO was notified that the New York County District Attorney’s Office was conducting an investigation involving minority and disadvantaged business contracting practices in the construction industry in New York City and that various contractors, minority and disadvantaged business firms, and their material suppliers, including the Company, were part of this investigation. The Company cooperated with the government investigation and, in November 2017, reached an agreement in principle for a civil settlement to resolve the Company’s involvement in the investigation. The settlement amount was not material to the Company’s financial condition or results of operations.
14. SEGMENTS AND RELATED INFORMATION
WESCO provides distribution of product and services through its four operating segments, which have been aggregated as one reportable segment. WESCO has approximately 230,000 unique product stock keeping units and markets more than 1,000,000 products for customers. There were no material amounts of sales or transfers among geographic areas and no material amounts of export sales.
WESCO attributes revenues from external customers to individual countries on the basis of the point of sale. The following table sets forth information about WESCO by geographic area:
Net Sales Year Ended December 31, | Long-Lived Assets December 31, | |||||||||||||||||||||||||||||||
2017 | 2016 | 2015 | 2017 | 2016 | 2015 | |||||||||||||||||||||||||||
(In thousands) | ||||||||||||||||||||||||||||||||
United States | $ | 5,775,988 | 75 | % | $ | 5,635,803 | 77 | % | $ | 5,665,962 | 75 | % | $ | 95,851 | $ | 123,465 | $ | 157,570 | ||||||||||||||
Canada | 1,521,378 | 20 | % | 1,394,657 | 19 | % | 1,533,705 | 21 | % | 56,591 | 60,372 | 63,088 | ||||||||||||||||||||
Mexico | 77,280 | 1 | % | 62,430 | 1 | % | 70,048 | 1 | % | 262 | 227 | 332 | ||||||||||||||||||||
Subtotal North American Operations | 7,374,646 | 7,092,890 | 7,269,715 | 152,704 | 184,064 | 220,990 | ||||||||||||||||||||||||||
Other International | 304,375 | 4 | % | 243,127 | 3 | % | 248,772 | 3 | % | 3,741 | 4,583 | 5,369 | ||||||||||||||||||||
Total | $ | 7,679,021 | $ | 7,336,017 | $ | 7,518,487 | $ | 156,445 | $ | 188,647 | $ | 226,359 | ||||||||||||||||||||
The following table sets forth sales information about WESCO’s sales by product category:
Year Ended December 31, | 2017 | 2016 | 2015 | ||
(percentages based on total sales) | |||||
General Supplies | 40% | 40% | 40% | ||
Wire, Cable and Conduit | 15% | 14% | 15% | ||
Communications and Security | 15% | 15% | 15% | ||
Electrical Distribution and Controls | 10% | 11% | 11% | ||
Lighting and Sustainability | 12% | 12% | 10% | ||
Automation, Controls and Motors | 8% | 8% | 9% | ||
64
WESCO INTERNATIONAL, INC. AND SUBSIDIARIES
NOTES TO CONSOLIDATED FINANCIAL STATEMENTS—(CONTINUED)
15. CONDENSED CONSOLIDATING FINANCIAL INFORMATION
WESCO Distribution has outstanding $500 million in aggregate principal amount of 2021 Notes and $350 million in aggregate principal amount of 2024 Notes. The 2021 Notes and 2024 Notes are unsecured senior obligations of WESCO Distribution and are fully and unconditionally guaranteed on a senior unsecured basis by WESCO International.
Condensed consolidating financial information for WESCO International, WESCO Distribution and the non-guarantor subsidiaries is presented in the following tables.
Condensed Consolidating Balance Sheet | |||||||||||||||||||
December 31, 2017 | |||||||||||||||||||
(In thousands) | |||||||||||||||||||
WESCO International, Inc. | WESCO Distribution, Inc. | Non-Guarantor Subsidiaries | Consolidating and Eliminating Entries | Consolidated | |||||||||||||||
Cash and cash equivalents | $ | — | $ | 50,602 | $ | 67,351 | $ | — | $ | 117,953 | |||||||||
Trade accounts receivable, net | — | — | 1,170,080 | — | 1,170,080 | ||||||||||||||
Inventories | — | 430,092 | 526,056 | — | 956,148 | ||||||||||||||
Prepaid expenses and other current assets | 4,730 | 42,547 | 152,531 | (35,140 | ) | 164,668 | |||||||||||||
Total current assets | 4,730 | 523,241 | 1,916,018 | (35,140 | ) | 2,408,849 | |||||||||||||
Intercompany receivables, net | — | — | 2,189,136 | (2,189,136 | ) | — | |||||||||||||
Property, buildings and equipment, net | — | 50,198 | 106,247 | — | 156,445 | ||||||||||||||
Intangible assets, net | — | 2,770 | 364,334 | — | 367,104 | ||||||||||||||
Goodwill | — | 257,623 | 1,514,254 | — | 1,771,877 | ||||||||||||||
Investments in affiliates | 3,058,613 | 5,023,826 | — | (8,082,439 | ) | — | |||||||||||||
Other assets | — | 2,778 | 28,415 | — | 31,193 | ||||||||||||||
Total assets | $ | 3,063,343 | $ | 5,860,436 | $ | 6,118,404 | $ | (10,306,715 | ) | $ | 4,735,468 | ||||||||
Accounts payable | $ | — | $ | 417,690 | $ | 381,830 | $ | — | $ | 799,520 | |||||||||
Short-term debt | — | — | 34,075 | — | 34,075 | ||||||||||||||
Other current liabilities | — | 80,039 | 162,475 | (35,140 | ) | 207,374 | |||||||||||||
Total current liabilities | — | 497,729 | 578,380 | (35,140 | ) | 1,040,969 | |||||||||||||
Intercompany payables, net | 939,784 | 1,249,352 | — | (2,189,136 | ) | — | |||||||||||||
Long-term debt | — | 934,033 | 379,228 | — | 1,313,261 | ||||||||||||||
Other noncurrent liabilities | 3,820 | 120,709 | 140,566 | — | 265,095 | ||||||||||||||
Total WESCO International stockholders’ equity | 2,119,739 | 3,058,613 | 5,023,826 | (8,082,439 | ) | 2,119,739 | |||||||||||||
Noncontrolling interests | — | — | (3,596 | ) | — | (3,596 | ) | ||||||||||||
Total liabilities and stockholders’ equity | $ | 3,063,343 | $ | 5,860,436 | $ | 6,118,404 | $ | (10,306,715 | ) | $ | 4,735,468 | ||||||||
65
WESCO INTERNATIONAL, INC. AND SUBSIDIARIES
NOTES TO CONSOLIDATED FINANCIAL STATEMENTS—(CONTINUED)
Condensed Consolidating Balance Sheet | |||||||||||||||||||
December 31, 2016 | |||||||||||||||||||
(In thousands) | |||||||||||||||||||
WESCO International, Inc. | WESCO Distribution, Inc. | Non-Guarantor Subsidiaries | Consolidating and Eliminating Entries | Consolidated | |||||||||||||||
Cash and cash equivalents | $ | — | $ | 41,552 | $ | 68,579 | $ | — | $ | 110,131 | |||||||||
Trade accounts receivable, net | — | — | 1,034,402 | — | 1,034,402 | ||||||||||||||
Inventories | — | 364,562 | 456,879 | — | 821,441 | ||||||||||||||
Prepaid expenses and other current assets | 13,647 | 34,833 | 211,637 | (123,013 | ) | 137,104 | |||||||||||||
Total current assets | 13,647 | 440,947 | 1,771,497 | (123,013 | ) | 2,103,078 | |||||||||||||
Intercompany receivables, net | — | — | 2,060,336 | (2,060,336 | ) | — | |||||||||||||
Property, buildings and equipment, net | — | 51,824 | 105,783 | — | 157,607 | ||||||||||||||
Intangible assets, net | — | 3,417 | 389,945 | — | 393,362 | ||||||||||||||
Goodwill | — | 257,623 | 1,473,327 | — | 1,730,950 | ||||||||||||||
Investments in affiliates | 3,538,476 | 4,028,502 | — | (7,566,978 | ) | — | |||||||||||||
Other assets | — | 23,846 | 22,998 | — | 46,844 | ||||||||||||||
Total assets | $ | 3,552,123 | $ | 4,806,159 | $ | 5,823,886 | $ | (9,750,327 | ) | $ | 4,431,841 | ||||||||
Accounts payable | $ | — | $ | 381,795 | $ | 302,926 | $ | — | $ | 684,721 | |||||||||
Short-term debt | — | — | 20,920 | — | 20,920 | ||||||||||||||
Other current liabilities | — | 120,299 | 170,872 | (123,013 | ) | 168,158 | |||||||||||||
Total current liabilities | — | 502,094 | 494,718 | (123,013 | ) | 873,799 | |||||||||||||
Intercompany payables, net | 1,572,486 | 487,850 | — | (2,060,336 | ) | — | |||||||||||||
Long-term debt | — | 983,449 | 379,686 | — | 1,363,135 | ||||||||||||||
Other noncurrent liabilities | 12,737 | 55,898 | 162,641 | — | 231,276 | ||||||||||||||
Total WESCO International stockholders’ equity | 1,966,900 | 2,776,868 | 4,790,110 | (7,566,978 | ) | 1,966,900 | |||||||||||||
Noncontrolling interests | — | — | (3,269 | ) | — | (3,269 | ) | ||||||||||||
Total liabilities and stockholders’ equity | $ | 3,552,123 | $ | 4,806,159 | $ | 5,823,886 | $ | (9,750,327 | ) | $ | 4,431,841 | ||||||||
66
WESCO INTERNATIONAL, INC. AND SUBSIDIARIES
NOTES TO CONSOLIDATED FINANCIAL STATEMENTS—(CONTINUED)
Condensed Consolidating Statement of Income and Comprehensive Income | |||||||||||||||||||
Year ended December 31, 2017 | |||||||||||||||||||
(In thousands) | |||||||||||||||||||
WESCO International, Inc. | WESCO Distribution, Inc. | Non-Guarantor Subsidiaries | Consolidating and Eliminating Entries | Consolidated | |||||||||||||||
Net sales | $ | — | $ | 3,370,088 | $ | 4,441,655 | $ | (132,722 | ) | $ | 7,679,021 | ||||||||
Cost of goods sold (excluding depreciation and | — | 2,714,511 | 3,612,577 | (132,722 | ) | 6,194,366 | |||||||||||||
amortization) | |||||||||||||||||||
Selling, general and administrative expenses | — | 555,503 | 544,245 | — | 1,099,748 | ||||||||||||||
Depreciation and amortization | — | 18,442 | 45,575 | — | 64,017 | ||||||||||||||
Results of affiliates’ operations | 160,587 | 168,782 | — | (329,369 | ) | — | |||||||||||||
Interest expense (income), net | — | 94,313 | (25,863 | ) | — | 68,450 | |||||||||||||
Provision for income taxes | (2,546 | ) | (4,486 | ) | 96,339 | — | 89,307 | ||||||||||||
Net income | 163,133 | 160,587 | 168,782 | (329,369 | ) | 163,133 | |||||||||||||
Less: Net loss attributable to noncontrolling interests | — | — | (327 | ) | — | (327 | ) | ||||||||||||
Net income attributable to WESCO International | $ | 163,133 | $ | 160,587 | $ | 169,109 | $ | (329,369 | ) | $ | 163,460 | ||||||||
Other comprehensive income (loss): | |||||||||||||||||||
Foreign currency translation adjustments | 85,762 | 85,762 | 85,762 | (171,524 | ) | 85,762 | |||||||||||||
Post retirement benefit plan adjustments | (6,381 | ) | (6,381 | ) | (6,381 | ) | 12,762 | (6,381 | ) | ||||||||||
Comprehensive income attributable to WESCO International | $ | 242,514 | $ | 239,968 | $ | 248,490 | $ | (488,131 | ) | $ | 242,841 | ||||||||
Condensed Consolidating Statement of Income and Comprehensive Income | |||||||||||||||||||
Year ended December 31, 2016 | |||||||||||||||||||
(In thousands) | |||||||||||||||||||
WESCO International, Inc. | WESCO Distribution, Inc. | Non-Guarantor Subsidiaries | Consolidating and Eliminating Entries | Consolidated | |||||||||||||||
Net sales | $ | — | $ | 3,306,265 | $ | 4,134,508 | $ | (104,756 | ) | $ | 7,336,017 | ||||||||
Cost of goods sold (excluding depreciation and | — | 2,651,409 | 3,341,161 | (104,756 | ) | 5,887,814 | |||||||||||||
amortization) | |||||||||||||||||||
Selling, general and administrative expenses | 61 | 477,437 | 571,788 | — | 1,049,286 | ||||||||||||||
Depreciation and amortization | — | 20,226 | 46,632 | — | 66,858 | ||||||||||||||
Results of affiliates’ operations | 240,571 | 155,814 | — | (396,385 | ) | — | |||||||||||||
Interest expense (income), net | 17,555 | 87,824 | (28,804 | ) | — | 76,575 | |||||||||||||
Loss on debt redemption | 123,933 | — | — | — | 123,933 | ||||||||||||||
Provision for income taxes | (2,098 | ) | 8,263 | 24,266 | — | 30,431 | |||||||||||||
Net income | 101,120 | 216,920 | 179,465 | (396,385 | ) | 101,120 | |||||||||||||
Less: Net loss attributable to noncontrolling interests | — | — | (468 | ) | — | (468 | ) | ||||||||||||
Net income attributable to WESCO International | $ | 101,120 | $ | 216,920 | $ | 179,933 | $ | (396,385 | ) | $ | 101,588 | ||||||||
Other comprehensive income (loss): | |||||||||||||||||||
Foreign currency translation adjustments | 38,275 | 38,275 | 38,275 | (76,550 | ) | 38,275 | |||||||||||||
Post retirement benefit plan adjustments | (2,485 | ) | (2,485 | ) | (2,485 | ) | 4,970 | (2,485 | ) | ||||||||||
Comprehensive income attributable to WESCO International | $ | 136,910 | $ | 252,710 | $ | 215,723 | $ | (467,965 | ) | $ | 137,378 | ||||||||
67
WESCO INTERNATIONAL, INC. AND SUBSIDIARIES
NOTES TO CONSOLIDATED FINANCIAL STATEMENTS—(CONTINUED)
Condensed Consolidating Statement of Income and Comprehensive Income (Loss) | |||||||||||||||||||
Year ended December 31, 2015 | |||||||||||||||||||
(In thousands) | |||||||||||||||||||
WESCO International, Inc. | WESCO Distribution, Inc. | Non-Guarantor Subsidiaries | Consolidating and Eliminating Entries | Consolidated | |||||||||||||||
Net sales | $ | — | $ | 3,456,883 | $ | 4,177,383 | $ | (115,779 | ) | $ | 7,518,487 | ||||||||
Cost of goods sold (excluding depreciation and | — | 2,784,413 | 3,356,192 | (115,779 | ) | 6,024,826 | |||||||||||||
amortization) | |||||||||||||||||||
Selling, general and administrative expenses | 26 | 611,549 | 443,376 | — | 1,054,951 | ||||||||||||||
Depreciation and amortization | — | 19,703 | 45,265 | — | 64,968 | ||||||||||||||
Results of affiliates’ operations | 225,370 | 219,619 | — | (444,989 | ) | — | |||||||||||||
Interest expense (income), net | 24,910 | 63,261 | (18,339 | ) | — | 69,832 | |||||||||||||
Provision for income taxes | (7,939 | ) | (6,929 | ) | 110,405 | — | 95,537 | ||||||||||||
Net income | $ | 208,373 | $ | 204,505 | $ | 240,484 | $ | (444,989 | ) | $ | 208,373 | ||||||||
Less: Net loss attributable to noncontrolling interests | — | — | (2,314 | ) | — | (2,314 | ) | ||||||||||||
Net income attributable to WESCO International | $ | 208,373 | $ | 204,505 | $ | 242,798 | $ | (444,989 | ) | $ | 210,687 | ||||||||
Other comprehensive income (loss): | |||||||||||||||||||
Foreign currency translation adjustments | (225,795 | ) | (225,795 | ) | (225,795 | ) | 451,590 | (225,795 | ) | ||||||||||
Post retirement benefit plan adjustments | 4,532 | 4,532 | 4,532 | (9,064 | ) | 4,532 | |||||||||||||
Comprehensive (loss) income attributable to WESCO International | $ | (12,890 | ) | $ | (16,758 | ) | $ | 21,535 | $ | (2,463 | ) | $ | (10,576 | ) | |||||
68
WESCO INTERNATIONAL, INC. AND SUBSIDIARIES
NOTES TO CONSOLIDATED FINANCIAL STATEMENTS—(CONTINUED)
Condensed Consolidating Statement of Cash Flows | |||||||||||||||||||
Year ended December 31, 2017 | |||||||||||||||||||
(In thousands) | |||||||||||||||||||
WESCO International, Inc. | WESCO Distribution, Inc. | Non-Guarantor Subsidiaries | Consolidating and Eliminating Entries | Consolidated | |||||||||||||||
Net cash (used in) provided by operating activities | $ | (36,575 | ) | $ | 101,826 | $ | 83,871 | $ | — | $ | 149,122 | ||||||||
Investing activities: | |||||||||||||||||||
Capital expenditures | — | (13,215 | ) | (8,292 | ) | — | (21,507 | ) | |||||||||||
Proceeds from sale of assets | — | — | 6,766 | — | 6,766 | ||||||||||||||
Dividends received from subsidiaries | — | 307,784 | — | (307,784 | ) | — | |||||||||||||
Advances to subsidiaries and other | — | (383,686 | ) | 26,912 | 366,220 | 9,446 | |||||||||||||
Net cash (used in) provided by investing activities | — | (89,117 | ) | 25,386 | 58,436 | (5,295 | ) | ||||||||||||
Financing activities: | |||||||||||||||||||
Proceeds from issuance of debt | 143,367 | 775,926 | 1,144,848 | (383,686 | ) | 1,680,455 | |||||||||||||
Repayments of debt | — | (785,392 | ) | (952,740 | ) | 17,466 | (1,720,666 | ) | |||||||||||
Equity activities | (106,792 | ) | — | — | — | (106,792 | ) | ||||||||||||
Dividends paid by subsidiaries | — | — | (307,784 | ) | 307,784 | — | |||||||||||||
Other | — | 5,807 | — | — | 5,807 | ||||||||||||||
Net cash provided by (used in) financing activities | 36,575 | (3,659 | ) | (115,676 | ) | (58,436 | ) | (141,196 | ) | ||||||||||
Effect of exchange rate changes on cash and cash equivalents | — | — | 5,191 | — | 5,191 | ||||||||||||||
Net change in cash and cash equivalents | — | 9,050 | (1,228 | ) | — | 7,822 | |||||||||||||
Cash and cash equivalents at the beginning of period | — | 41,552 | 68,579 | — | 110,131 | ||||||||||||||
Cash and cash equivalents at the end of period | $ | — | $ | 50,602 | $ | 67,351 | $ | — | $ | 117,953 | |||||||||
69
WESCO INTERNATIONAL, INC. AND SUBSIDIARIES
NOTES TO CONSOLIDATED FINANCIAL STATEMENTS—(CONTINUED)
Condensed Consolidating Statement of Cash Flows | |||||||||||||||||||
Year ended December 31, 2016 | |||||||||||||||||||
(In thousands) | |||||||||||||||||||
WESCO International, Inc. | WESCO Distribution, Inc. | Non-Guarantor Subsidiaries | Consolidating and Eliminating Entries | Consolidated | |||||||||||||||
Net cash provided by (used in) operating activities | $ | 95,388 | $ | (243,476 | ) | $ | 448,323 | $ | — | $ | 300,235 | ||||||||
Investing activities: | |||||||||||||||||||
Capital expenditures | — | (12,482 | ) | (5,475 | ) | — | (17,957 | ) | |||||||||||
Acquisition payments, net of cash acquired | — | (50,890 | ) | — | — | (50,890 | ) | ||||||||||||
Proceeds from sale of assets | — | — | 8,361 | — | 8,361 | ||||||||||||||
Dividends received from subsidiaries | — | 82,912 | — | (82,912 | ) | — | |||||||||||||
Advances to subsidiaries and other | — | (297,259 | ) | (337,344 | ) | 624,603 | (10,000 | ) | |||||||||||
Net cash used in investing activities | — | (277,719 | ) | (334,458 | ) | 541,691 | (70,486 | ) | |||||||||||
Financing activities: | |||||||||||||||||||
Proceeds from issuance of debt | 252,246 | 1,566,864 | 672,345 | (297,259 | ) | 2,194,196 | |||||||||||||
Repayments of debt | (344,804 | ) | (1,030,520 | ) | (752,401 | ) | (327,344 | ) | (2,455,069 | ) | |||||||||
Equity activities | (2,830 | ) | — | — | — | (2,830 | ) | ||||||||||||
Dividends paid by subsidiaries | — | — | (82,912 | ) | 82,912 | — | |||||||||||||
Other | — | (12,560 | ) | — | — | (12,560 | ) | ||||||||||||
Net cash (used in) provided by financing activities | (95,388 | ) | 523,784 | (162,968 | ) | (541,691 | ) | (276,263 | ) | ||||||||||
Effect of exchange rate changes on cash and cash equivalents | — | — | (3,634 | ) | — | (3,634 | ) | ||||||||||||
Net change in cash and cash equivalents | — | 2,589 | (52,737 | ) | — | (50,148 | ) | ||||||||||||
Cash and cash equivalents at the beginning of period | — | 38,963 | 121,316 | — | 160,279 | ||||||||||||||
Cash and cash equivalents at the end of period | $ | — | $ | 41,552 | $ | 68,579 | $ | — | $ | 110,131 | |||||||||
70
WESCO INTERNATIONAL, INC. AND SUBSIDIARIES
NOTES TO CONSOLIDATED FINANCIAL STATEMENTS—(CONTINUED)
Condensed Consolidating Statement of Cash Flows | |||||||||||||||||||
Year ended December 31, 2015 | |||||||||||||||||||
(In thousands) | |||||||||||||||||||
WESCO International, Inc. | WESCO Distribution, Inc. | Non-Guarantor Subsidiaries | Consolidating and Eliminating Entries | Consolidated | |||||||||||||||
Net cash provided by operating activities | $ | 3,531 | $ | 214,037 | $ | 65,481 | $ | — | $ | 283,049 | |||||||||
Investing activities: | |||||||||||||||||||
Capital expenditures | — | (15,266 | ) | (6,392 | ) | — | (21,658 | ) | |||||||||||
Acquisition payments, net of cash acquired | — | (151,595 | ) | — | — | (151,595 | ) | ||||||||||||
Proceeds from sale of assets | — | — | 3,023 | — | 3,023 | ||||||||||||||
Dividends received from subsidiaries | — | 114,101 | — | (114,101 | ) | — | |||||||||||||
Advances to subsidiaries and other | — | (197,345 | ) | 17,461 | 179,884 | — | |||||||||||||
Net cash (used in) provided by investing activities | — | (250,105 | ) | 14,092 | 65,783 | (170,230 | ) | ||||||||||||
Financing activities: | |||||||||||||||||||
Proceeds from issuance of debt | 150,705 | 1,224,596 | 452,655 | (197,345 | ) | 1,630,611 | |||||||||||||
Repayments of debt | — | (1,175,056 | ) | (379,578 | ) | 17,461 | (1,537,173 | ) | |||||||||||
Equity activities | (154,236 | ) | — | — | — | (154,236 | ) | ||||||||||||
Dividends paid by subsidiaries | — | — | (114,101 | ) | 114,101 | — | |||||||||||||
Other | — | (7,017 | ) | — | — | (7,017 | ) | ||||||||||||
Net cash provided by (used in) financing activities | (3,531 | ) | 42,523 | (41,024 | ) | (65,783 | ) | (67,815 | ) | ||||||||||
Effect of exchange rate changes on cash and cash equivalents | — | — | (13,044 | ) | — | (13,044 | ) | ||||||||||||
Net change in cash and cash equivalents | — | 6,455 | 25,505 | — | 31,960 | ||||||||||||||
Cash and cash equivalents at the beginning of period | — | 32,508 | 95,811 | — | 128,319 | ||||||||||||||
Cash and cash equivalents at the end of period | $ | — | $ | 38,963 | $ | 121,316 | $ | — | $ | 160,279 | |||||||||
Revisions
As described in Note 2, the Consolidated Balance Sheet at December 31, 2016 has been revised to correct certain financial statement line items.
71
WESCO INTERNATIONAL, INC. AND SUBSIDIARIES
NOTES TO CONSOLIDATED FINANCIAL STATEMENTS—(CONTINUED)
16. SELECTED QUARTERLY FINANCIAL DATA (unaudited)
The following table sets forth selected quarterly financial data for the years ended December 31, 2017 and 2016:
First Quarter | Second Quarter | Third Quarter | Fourth Quarter | ||||||||||||
2017 | |||||||||||||||
Net Sales | $ | 1,772,591 | $ | 1,909,624 | $ | 2,000,159 | $ | 1,996,647 | |||||||
Cost of goods sold (excluding depreciation and amortization) | 1,422,573 | 1,543,510 | 1,614,814 | 1,613,469 | |||||||||||
Income from operations | 67,089 | 83,105 | 89,250 | 81,446 | |||||||||||
Income before income taxes | 50,368 | 66,289 | 71,939 | 63,844 | |||||||||||
Net income (1) | 37,800 | 49,535 | 53,576 | 22,222 | |||||||||||
Net income attributable to WESCO International (1) | 37,729 | 49,510 | 53,675 | 22,546 | |||||||||||
Basic earnings per share attributable to WESCO International (1) (2) | 0.77 | 1.03 | 1.13 | 0.48 | |||||||||||
Diluted earnings per share attributable to WESCO International (1) (3) | 0.76 | 1.02 | 1.12 | 0.47 | |||||||||||
2016 | |||||||||||||||
Net Sales | $ | 1,775,961 | $ | 1,911,582 | $ | 1,855,212 | $ | 1,793,262 | |||||||
Cost of goods sold (excluding depreciation and amortization) | 1,420,793 | 1,532,113 | 1,490,173 | 1,444,735 | |||||||||||
Income from operations | 69,508 | 87,987 | 92,555 | 82,009 | |||||||||||
Income (loss) before income taxes | 50,679 | 68,535 | (52,170 | ) | 64,507 | ||||||||||
Net income (loss) | 34,534 | 49,852 | (31,021 | ) | 47,755 | ||||||||||
Net income (loss) attributable to WESCO International | 36,053 | 49,798 | (31,611 | ) | 47,348 | ||||||||||
Basic earnings (loss) per share attributable to WESCO International (2) (4) | 0.85 | 1.18 | (0.73 | ) | 0.97 | ||||||||||
Diluted earnings (loss) per share attributable to WESCO International (3) (4) | 0.77 | 1.02 | (0.73 | ) | 0.96 | ||||||||||
(1) | As described in Note 9, net income and net income attributable to WESCO International include provisional discrete income tax expense of $26.4 million resulting from the application of the TCJA, which affected basic and diluted earnings per share attributable to WESCO International in the fourth quarter of 2017. |
(2) | Earnings per share (EPS) in each quarter is computed using the weighted-average number of shares outstanding during that quarter while EPS for the full year is computed by using the weighted-average number of shares outstanding during the year. Thus, the sum of the four quarters’ EPS may not equal the full-year EPS. |
(3) | Diluted EPS in each quarter is computed using the weighted-average number of shares outstanding and common share equivalents during that quarter while Diluted EPS for the full year is computed by using the weighted-average number of shares outstanding and common share equivalents during the year. Thus, the sum of the four quarters’ Diluted EPS may not equal the full-year Diluted EPS. |
(4) | On September 15, 2016, the Company completed the redemption of its 2029 Debentures. The redemption resulted in a non-cash charge of $123.9 million and consequently a net loss attributable to WESCO International for the three months ended September 30, 2016. Accordingly, dilutive shares were not included in the calculation of diluted loss per share for the three months ended September 30, 2016 because their effect was antidilutive. As described in Note 9, net income and net income attributable to WESCO International include provisional discrete income tax expense of $26.4 million resulting from the application of the TCJA, which affected basic and diluted earnings per share attributable to WESCO International in the fourth quarter of 2017. |
72
Item 9. Changes in and Disagreements with Accountants on Accounting and Financial Disclosure.
None.
Item 9A. Controls and Procedures.
Conclusion Regarding the Effectiveness of Disclosure Controls and Procedures
Under the supervision and with the participation of our management, including our principal executive officer and principal financial officer, we conducted an evaluation of our disclosure controls and procedures (as defined in Exchange Act Rules 13a-15(e) and 15d-15(e)) and internal control over financial reporting (as defined in Exchange Act Rules 13a-15(f) and 15d-15(f)). Based on this evaluation, our principal executive officer and our principal financial officer concluded that our disclosure controls and procedures and internal control over financial reporting were effective as of the end of the period covered by this report.
Management’s Report on Internal Control Over Financial Reporting
Our management is responsible for establishing and maintaining adequate internal control over financial reporting as such term is defined in Exchange Act Rules 13a-15(f) and 15d-15(f). Because of its inherent limitations, internal control over financial reporting may not prevent or detect misstatements. Also, projections of any evaluation of effectiveness to future periods are subject to the risk that controls may become inadequate because of changes in conditions, or that the degree of compliance with the policies or procedures may deteriorate. Under the supervision and with the participation of our management, including our principal executive officer and principal financial officer, we conducted an evaluation of the effectiveness of our internal control over financial reporting based on the updated framework in Internal Control — Integrated Framework (2013) (2013 Framework) issued by the Committee of Sponsoring Organizations of the Treadway Commission on May 14, 2013. Based on our evaluation under the 2013 Framework, our management concluded that our internal control over financial reporting was effective as of December 31, 2017.
The effectiveness of the Company’s internal control over financial reporting as of December 31, 2017 has been audited by PricewaterhouseCoopers LLP, an independent registered public accounting firm, as stated in their report, which is included herein.
Changes in Internal Control Over Financial Reporting
During the last fiscal quarter of 2017, there were no changes in the Company’s internal control over financial reporting identified in connection with management’s evaluation of the effectiveness of the Company’s internal control over financial reporting that have materially affected, or are reasonably likely to materially affect, the Company’s internal control over financial reporting.
Item 9B. Other Information.
None.
73
PART III
Item 10. Directors, Executive Officers and Corporate Governance.
The information set forth under the captions “Board of Directors” and “Executive Officers” in our definitive Proxy Statement for our 2018 Annual Meeting of Stockholders is incorporated herein by reference.
Codes of Business Ethics and Conduct
We have adopted a Code of Business Ethics and Conduct (“Code of Conduct”) that applies to our Directors, officers and employees that is available on our website at www.wesco.com by selecting the “Investors” tab followed by the “Corporate Governance” heading. Any amendment or waiver of the Code of Conduct for our officers or Directors will be disclosed promptly at that location on our website.
We also have adopted a Senior Financial Executive Code of Principles for Senior Executives (“Senior Financial Executive Code”) that applies to our principal executive officer, principal financial officer, principal accounting officer or controller, or persons performing these functions. The Senior Financial Executive Code is also available at that same location on our website. We intend to timely disclose any amendment or waiver of the Senior Financial Executive Code on our website and will retain such information on our website as required by applicable SEC rules.
A copy of the Code of Conduct and/or Senior Financial Executive Code may also be obtained upon request by any stockholder, without charge, by writing to us at WESCO International, Inc., 225 West Station Square Drive, Suite 700, Pittsburgh, Pennsylvania 15219, Attention: Corporate Secretary.
The information required by Item 10 that relates to our Directors and executive officers, including the Audit Committee and its financial expert, required by this item, is incorporated by reference from the information appearing under the captions “Corporate Governance,” “Board and Committee Meetings” and “Security Ownership” in our definitive Proxy Statement for our 2018 Annual Meeting of Stockholders that is to be filed with the SEC pursuant to the Exchange Act within 120 days of the end of our fiscal year on December 31, 2017.
Item 11. Executive Compensation.
The information set forth under the captions “Compensation Discussion and Analysis” and “Director Compensation” in our definitive Proxy Statement for our 2018 Annual Meeting of Stockholders is incorporated herein by reference.
Item 12. Security Ownership of Certain Beneficial Owners and Management and Related Stockholder Matters.
The information set forth under the caption “Security Ownership” in our definitive Proxy Statement for our 2018 Annual Meeting of Stockholders is incorporated herein by reference.
The following table provides information as of December 31, 2017 with respect to the shares of our common stock that may be issued under our existing equity compensation plans:
Plan Category | Number of securities to be issued upon exercise of outstanding options, warrants and rights | Weighted-average exercise price of outstanding options, warrants and rights | Number of securities remaining available for future issuance under equity compensation plans | ||||||
Equity compensation plans approved by security holders | 2,677,169 | $ | 48.29 | 3,595,989 | |||||
Equity compensation plans not approved by security holders | — | — | — | ||||||
Total | 2,677,169 | $ | 48.29 | 3,595,989 | |||||
Item 13. Certain Relationships and Related Transactions, and Director Independence.
The information set forth under the captions “Transactions with Related Persons” and “Corporate Governance” in our definitive Proxy Statement for our 2018 Annual Meeting of Stockholders is incorporated herein by reference.
Item 14. Principal Accountant Fees and Services.
The information set forth under the caption “Independent Registered Public Accounting Firm Fees and Services” in our definitive Proxy Statement for our 2018 Annual Meeting of Stockholders is incorporated herein by reference.
74
PART IV
Item 15. Exhibits and Financial Statement Schedule.
The financial statements, financial statement schedule and exhibits listed below are filed as part of this annual report:
(a) | (1) Financial Statements |
The list of financial statements required by this item is set forth in Item 8, “Financial Statements and Supplementary Data,” and is incorporated herein by reference.
(2) Financial Statement Schedule
Schedule II — Valuation and Qualifying Accounts
(b) | Exhibits |
Exhibit No. | Description of Exhibit | Prior Filing or Sequential Page Number | ||
3.1 | Incorporated by reference to Exhibit 3.1 to WESCO’s Registration Statement on Form S-4 (No. 333-70404) | |||
3.2 | Incorporated by reference to Exhibit 3.1 to WESCO’s Current Report on Form 8-K, dated May 29, 2014 | |||
3.3 | Incorporated by reference to Exhibit 3.2 to WESCO’s Current Report on Form 8-K, dated May 29, 2014 | |||
4.1 | Incorporated by reference to Exhibit 4.1 to WESCO’s Current Report on Form 8-K, dated November 27, 2013 | |||
4.2 | Incorporated by reference to Exhibit A-2 to Exhibit 4.1 to WESCO’s Current Report on Form 8-K, dated November 27, 2013 | |||
4.3 | Incorporated by reference to Exhibit 4.1 to WESCO’s Current Report on Form 8-K, dated June 15, 2016 | |||
4.4 | Incorporated by reference to Exhibit A-2 to Exhibit 4.1 to WESCO’s Current Report on Form 8-K, dated June 15, 2016 | |||
10.1 | Incorporated by reference to Exhibit 10.5 to WESCO's Annual Report on Form 10-K for the year ended December 31, 2011 | |||
75
Exhibit No. | Description of Exhibit | Prior Filing or Sequential Page Number | ||
10.2 | Incorporated by reference to Exhibit 10.7 to WESCO's Annual Report on Form 10-K for the year ended December 31, 2011 | |||
10.3 | Incorporated by reference to Exhibit 10.3 to WESCO’s Quarterly Report on Form 10-Q for the quarter ended June 30, 2010 | |||
10.4 | Incorporated by reference to Exhibit 10.2 to WESCO’s Quarterly Report on Form 10-Q for the quarter ended September 30, 2009 | |||
10.5 | Incorporated by reference to Exhibit 10.28 to WESCO’s Annual Report on Form 10-K for the year ended December 31, 2009 | |||
10.6 | Incorporated by reference to Exhibit 10.1 to WESCO’s Quarterly Report on Form 10-Q for the quarter ended September 30, 2010 | |||
10.7 | Incorporated by reference to Exhibit 10.1 to WESCO's Current Report on Form 8-K, dated December 17, 2012 | |||
10.8 | Incorporated by reference to Appendix A to the Proxy Statement filed on Schedule 14A on April 16, 2013 | |||
10.9 | Incorporated by reference to Exhibit 10.31 to WESCO's Annual Report on Form 10-K for the year ended December 31, 2013 | |||
10.10 | Incorporated by reference to Exhibit 10.33 to WESCO's Annual Report on Form 10-K for the year ended December 31, 2014 | |||
76
Exhibit No. | Description of Exhibit | Prior Filing or Sequential Page Number | |||
10.11 | Incorporated by reference to Exhibit 10.1 to WESCO’s Current Report on Form 8-K, dated September 24, 2015 | ||||
10.12 | Incorporated by reference to Exhibit 10.2 to WESCO’s Current Report on Form 8-K, dated September 24, 2015 | ||||
10.13 | Incorporated by reference to Exhibit 10.1 to WESCO’s Quarterly Report on Form 10-Q, for the quarter ended March 31, 2016 | ||||
10.14 | Incorporated by reference to Exhibit 10.23 to WESCO's Annual Report on Form 10-K for the year ended December 31, 2015 | ||||
10.15 | Incorporated by reference to Exhibit 10.24 to WESCO's Annual Report on Form 10-K for the year ended December 31, 2015 | ||||
10.16 | Incorporated by reference to Exhibit 10.1 to WESCO’s Quarterly Report on Form 10-Q, for the quarter ended June 30, 2016 | ||||
10.17 | Incorporated by reference to Exhibit 10.2 to WESCO’s Quarterly Report on Form 10-Q, for the quarter ended June 30, 2016 | ||||
10.18 | Incorporated by reference to Exhibit 10.3 to WESCO’s Quarterly Report on Form 10-Q, for the quarter ended June 30, 2016 | ||||
10.19 | Incorporated by reference to Exhibit 10.4 to WESCO’s Quarterly Report on Form 10-Q, for the quarter ended June 30, 2016 | ||||
10.20 | Incorporated by reference to Exhibit 10.28 to WESCO's annual report on Form 10-K, for the year ended December 31, 2016 | ||||
10.21 | Incorporated by reference to Exhibit 10.1 to WESCO's Current Report on Form 8-K, dated November 8, 2017 | ||||
10.22 | Filed herewith | ||||
77
Exhibit No. | Description of Exhibit | Prior Filing or Sequential Page Number | ||
10.23 | Filed herewith | |||
10.24 | Filed herewith | |||
10.25 | Filed herewith | |||
10.26 | Filed herewith | |||
10.27 | Incorporated by reference to Appendix A to the Proxy Statement filed on Schedule 14A on April 17, 2017 | |||
10.28 | Filed herewith | |||
21.1 | Filed herewith | |||
23.1 | Filed herewith | |||
31.1 | Filed herewith | |||
31.2 | Filed herewith | |||
32.1 | Filed herewith | |||
32.2 | Filed herewith | |||
101 | Interactive Data File | Filed herewith | ||
The registrant hereby agrees to furnish supplementally to the Commission, upon request, a copy of any omitted schedule to any of the agreements contained herein.
Copies of exhibits may be retrieved electronically at the Securities and Exchange Commission’s home page at www.sec.gov. Exhibits will also be furnished without charge by writing to David S. Schulz, Senior Vice President and Chief Financial Officer, 225 West Station Square Drive, Suite 700, Pittsburgh, Pennsylvania 15219. Requests may also be directed to (412) 454-2200.
78
Schedule II—Valuation and Qualifying Accounts
Balance at Beginning | Charged to | Charged to Other | Balance at | |||||||||||||
of Period | Expense | Accounts(1) | Deductions(2) | End of Period | ||||||||||||
Allowance for doubtful accounts | (In thousands) | |||||||||||||||
Year ended December 31, 2017 | $ | 22,007 | 8,466 | — | (9,160 | ) | $ | 21,313 | ||||||||
Year ended December 31, 2016 | 22,587 | 5,888 | 21 | (6,489 | ) | 22,007 | ||||||||||
Year ended December 31, 2015 | 21,084 | 6,099 | 1,305 | (5,901 | ) | 22,587 | ||||||||||
_________________________
(1) | Represents allowance for doubtful accounts in connection with certain acquisitions and divestitures. |
(2) | Includes a reduction in the allowance for doubtful accounts due to write-off of accounts receivable. |
79
Item 16. Form 10-K Summary.
Not applicable.
80
SIGNATURES
Pursuant to the requirements of Section 13 or 15(d) of the Securities Exchange Act of 1934, the Registrant has duly caused this report to be signed on its behalf by the undersigned, thereunto duly authorized.
WESCO INTERNATIONAL, INC. | |||
By: | /s/ JOHN J. ENGEL | ||
Name: | John J. Engel | ||
Title: | Chairman, President and Chief Executive Officer | ||
Date: | February 21, 2018 | ||
WESCO INTERNATIONAL, INC. | |||
By: | /s/ DAVID S. SCHULZ | ||
Name: | David S. Schulz | ||
Title: | Senior Vice President and Chief Financial Officer | ||
Date: | February 21, 2018 | ||
81
Pursuant to the requirements of the Securities Exchange Act of 1934, this report has been signed below by the following persons on behalf of the registrant and in the capacities and on the dates indicated.
Signature | Title | Date | ||
/s/ JOHN J. ENGEL | Chairman, President and Chief Executive Officer | February 21, 2018 | ||
John J. Engel | (Principal Executive Officer) | |||
/s/ DAVID S. SCHULZ | Senior Vice President and Chief Financial Officer | February 21, 2018 | ||
David S. Schulz | (Principal Financial and Accounting Officer) | |||
/s/ SANDRA BEACH LIN | Director | February 21, 2018 | ||
Sandra Beach Lin | ||||
/s/ MATTHEW J. ESPE | Director | February 21, 2018 | ||
Matthew J. Espe | ||||
/s/ BOBBY J. GRIFFIN | Director | February 21, 2018 | ||
Bobby J. Griffin | ||||
/s/ JOHN K. MORGAN | Director | February 21, 2018 | ||
John K. Morgan | ||||
/s/ STEVEN A. RAYMUND | Director | February 21, 2018 | ||
Steven A. Raymund | ||||
/s/ JAMES L. SINGLETON | Director | February 21, 2018 | ||
James L. Singleton | ||||
/s/ LYNN M. UTTER | Director | February 21, 2018 | ||
Lynn M. Utter | ||||
82