Attached files
| file | filename |
|---|---|
| 8-K - FORM 8-K - TAYLOR CAPITAL GROUP INC | d336591d8k.htm |
Exhibit 99.1
|
|
Taylor Capital Group, Inc.
First Quarter 2012
Financial Results
Thursday, April 19, 2012
10:00 a.m. Central Time, 11:00 a.m. Eastern Time
Conference Call Toll-Free Dial-In Number: 866-450-8367
Participant Access Code: 7607716
|
|
FIRST QUARTER 2012 FINANCIAL RESULTS
Forward-Looking Statement
This presentation includes forward-looking statements that reflect our current expectations and projections about our future results, performance, prospects and opportunities. We have tried to identify these forward-looking statements by using words including “may,” “might”, “contemplate”, “plan”, “prudent”, “potential”, “should”, “will,” “expect,” “anticipate,” “believe,” “intend,” “could” and “estimate” and similar expressions. These forward-looking statements are based on information currently available to us and are subject to a number of risks, uncertainties and other factors that could cause our actual results, performance, prospects or opportunities in 2012 and beyond to differ materially from those expressed in, or implied by, these forward-looking statements. These risks, uncertainties and other factors include, without limitation: Our business may be adversely affected by the highly regulated environment in which we operate. Competition from financial institutions and other financial services providers may adversely affect our growth and profitability. Our business is subject to the conditions of the local economy in which we operate and continued weakness in the local economy and the real estate markets may adversely affect us. Our business is subject to domestic and to a lesser extent, international economic conditions and other factors, many of which are beyond our control and could adversely affect our business. The preparation of our consolidated financial statements requires us to make estimates and judgments, which are subject to an inherent degree of uncertainty and which may differ from actual results. Our allowance for loan losses may prove to be insufficient to absorb losses in our loan portfolio. Our mortgage loan repurchase reserve for losses could be insufficient. We are subject to interest rate risk, including interest rate fluctuations that could reduce our profitability. Certain hedging strategies that we use to manage investment in mortgage servicing rights may be ineffective to offset any adverse changes in the fair value of these assets due to changes in interest rates and market liquidity. Our residential mortgage lending profitability could be significantly reduced if we are not able to originate and resell a high volume of mortgage loans. We have counterparty risk and therefore we may be adversely affected by the soundness of other financial institutions. We are subject to certain operational risks, including, but not limited to, data processing system failures and errors and customer or employee fraud. The Company’s controls and procedures may fail or be circumvented. The Company is dependent upon outside third parties for processing and handling of Company records and data. System failure or breaches of our network security, including with respect to our internet banking activities, could subject us to increased operating costs as well as litigation and other liabilities. We are subject to lending concentration risks. We may not be able to access sufficient and cost-effective sources of liquidity. We are subject to liquidity risk, including unanticipated deposit volatility. The recent repeal of federal prohibitions on payment of interest on business demand deposits could increase the Company’s interest expense. Changes in our credit ratings could increase our financing costs or make it more difficult for us to obtain funding or capital on commercially acceptable terms. The Company is a bank holding company and its sources of funds are limited. Our business strategy is dependent on our continued ability to attract, develop and retain highly qualified and experienced personnel in senior management and customer relationship positions. Our reputation could be damaged by negative publicity. New lines of business or new products and services may subject us to certain additional risks. We may experience difficulties in managing our future growth. The Company and its subsidiaries are subject to changes in federal and state tax laws and changes in interpretation of existing laws. Our participation in the TARP Capital Purchase Program may place significant restrictions on our operations. Regulatory requirements, growth plans or operating results may require us to raise additional capital, which may not be available on favorable terms or at all. We have not paid a dividend on our common stock since the second quarter of 2008. In addition, regulatory restrictions and liquidity constraints at the holding company level could impair our ability to make distributions on our outstanding securities.
For further information about these and other risks, uncertainties and factors, please review the disclosure included in the section captioned “Risk Factors” in our December 31, 2011 Annual Report on Form 10-K filed with the SEC on March 9, 2012. You should not place undue reliance on any forward-looking statements. We undertake no obligation to publicly update or revise any forward-looking statements or risk factors, whether as a result of new information, future events, changed circumstances or any other reason after the date of this press release.
2
|
|
FIRST QUARTER 2012 FINANCIAL RESULTS
Agenda
• First Quarter 2012 Highlights:
Mark Hoppe, President and Chief Executive Officer
• First Quarter 2012 Results of Operations:
Randy Conte, Chief Financial Officer and Chief Operational Officer
• Summary
• Questions & Answers
| 3 |
|
|
|
FIRST QUARTER 2012
Highlights
|
|
FIRST QUARTER 2012 HIGHLIGHTS
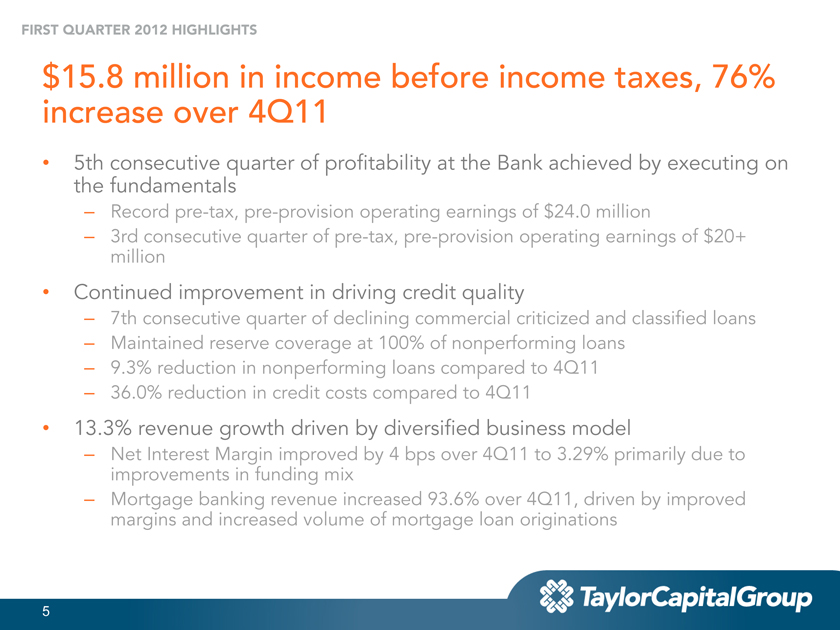
$15.8 million in income before income taxes, 76% increase over 4Q11
• 5th consecutive quarter of profitability at the Bank achieved by executing on the fundamentals
– Record pre-tax, pre-provision operating earnings of $24.0 million
– 3rd consecutive quarter of pre-tax, pre-provision operating earnings of $20+ million
• Continued improvement in driving credit quality
– 7th consecutive quarter of declining commercial criticized and classified loans
– Maintaining reserve coverage at 100% of nonperforming loans
– 9.3% reduction in nonperforming loans compared to 4Q11
– 36.0% reduction in credit costs compared to 4Q11
• 13.3% revenue growth driven by diversified business model
– Net Interest Margin improved by 4 bps over 4Q11 to 3.29% primarily due to improvements in funding mix
– Mortgage banking revenue increased 93.6% over 4Q11, driven by improved margins and increased volume of mortgage loan originations
5
|
|
FIRST QUARTER 2012 HIGHLIGHTS
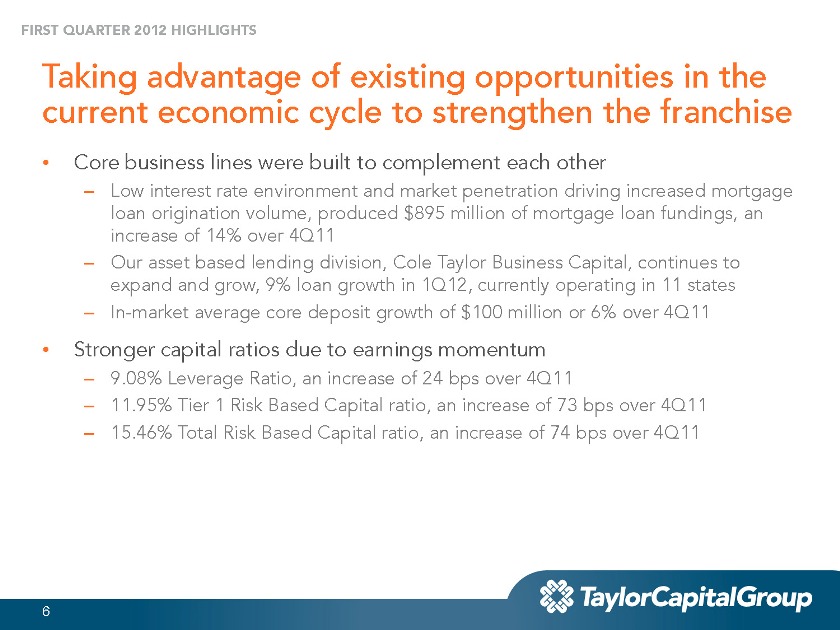
Taking advantage of existing opportunities in the current economic cycle to strengthen the franchise
• Core business lines were built to complement each other
– Low interest rate environment and market penetration driving increased mortgage loan origination volume, produced $895 million of mortgage loan fundings, an increase of 14% over 4Q11
– Our asset based lending division, Cole Taylor Business Capital, continues to expand and grow, 9% loan growth in 1Q12, currently operating in 11 states
– In-market average core deposit growth of $100 million or 6% over 4Q11
• Stronger capital ratios due to earnings momentum
– 9.08% Leverage Ratio, an increase of 24 bps over 4Q11
– 11.95% Tier 1 Risk Based Capital ratio, an increase of 73 bps over 4Q11
– 15.46% Total Risk Based Capital ratio, an increase of 74 bps over 4Q11
| 6 |
|
|
|
FIRST QUARTER 2012
Results of Operations
|
|
RESULTS OF OPERATIONS
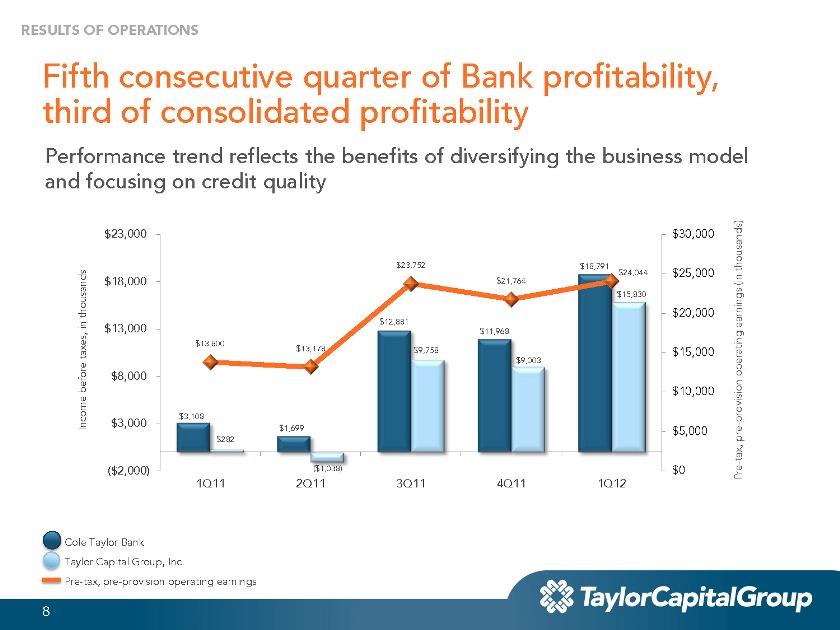
Fifth consecutive quarter of Bank profitability, third of consolidated profitability
Performance trend reflects the benefits of diversifying the business model and focusing on credit quality
$23,000 $30,000
$23,752 $18,791
$24,044 $25,000 thousands) $18,000 $21,764 (in
$15,830
thousands $20,000 in $12,881 earnings $13,000
$11,968 $13,800 taxes, $13,178 $9,758 $15,000
$9,003 operating before $8,000 $10,000 $3,108 provision Income $3,000 $1,699 -$282 $5,000 pre tax, -
($2,000) ($1,038) $0 Pre 1Q11 2Q11 3Q11 4Q11 1Q12
Cole Taylor Bank Taylor Capital Group, Inc.
Pre- tax, pre -provision operating earnings
| 8 |
|
|
|
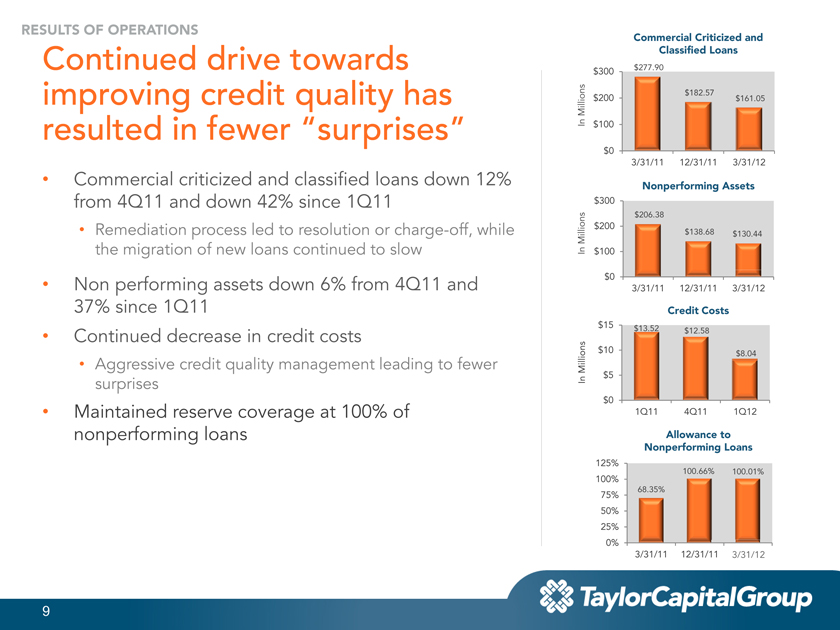
RESULTS OF OPERATIONS
Commercial Criticized and
Continued drive towards Classified Loans
$300 $277.90 $182.57
improving credit quality has Millions $200 $161.05 resulted in fewer “surprises” In $100
$0
3/31/11 12/31/11 3/31/12
• Commercial criticized and classified loans down 12% Nonperforming Assets from 4Q11 and down 42% since 1Q11 $300
$206.38 $200
• Remediation process led to resolution or charge-off, Millions $138.68 $130.44 while the migration of new loans continued to slow In $100
• Non performing assets down 6% from 4Q11 and $0
3/31/11 12/31/11 3/31/12
37% since 1Q11 Credit Costs
$15 $13.52
$12.58
• Continued decrease in credit costs
$10 $8.04
• Aggressive credit quality management leading to fewer Millions surprises In $5
$0
• Maintained reserve coverage at 100% of 1Q11 4Q11 1Q12 nonperforming loans Allowance to
Nonperforming Loans
125% 100.66%
100.01% 100%
68.35% 75% 50% 25% 0%
3/31/11 12/31/11 3/31/12
9
|
|
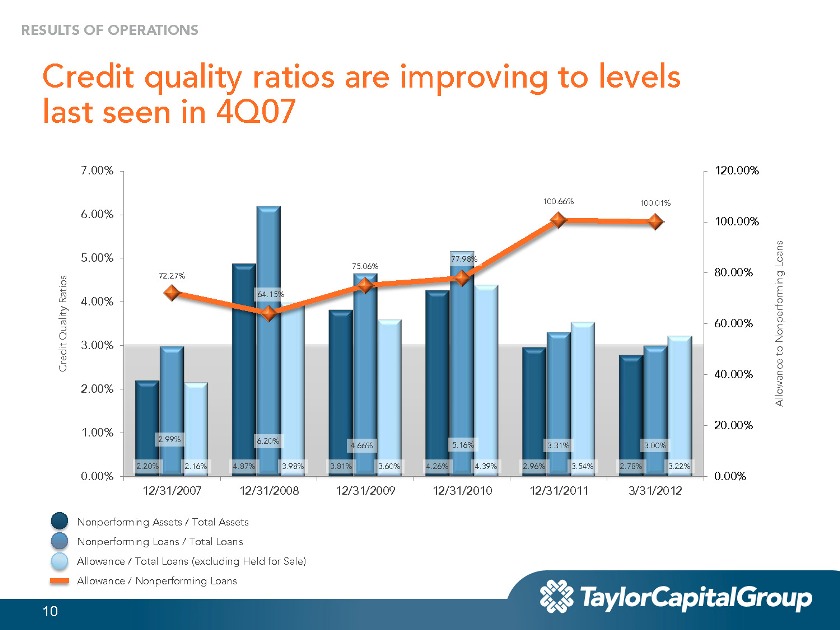
RESULTS OF OPERATIONS
Credit quality ratios are improving to levels last seen in 4Q07
7.00% 120.00%
100.66% 100.01%
6.00%
100.00%
5.00% 75.06% 77.98% Loans 72.27% 80.00% Ratios 64.15%
4.00%
Quality 60.00%
3.00% Nonperforming Creditto
40.00%
2.00% Allowance
20.00%
1.00%
2.99% 6.20%
4.66% 5.16% 3.31% 3.00%
0.00% 2.20% 2.16% 4.87% 3.98% 3.81% 3.60% 4.26% 4.39% 2.96% 3.54% 2.78% 3.22% 0.00%
12/31/2007 12/31/2008 12/31/2009 12/31/2010 12/31/2011 3/31/2012
Nonperforming Assets / Total Assets Nonperforming Loans / Total Loans
Allowance / Total Loans (excluding Held for Sale) Allowance / Nonperforming Loans
10
|
|
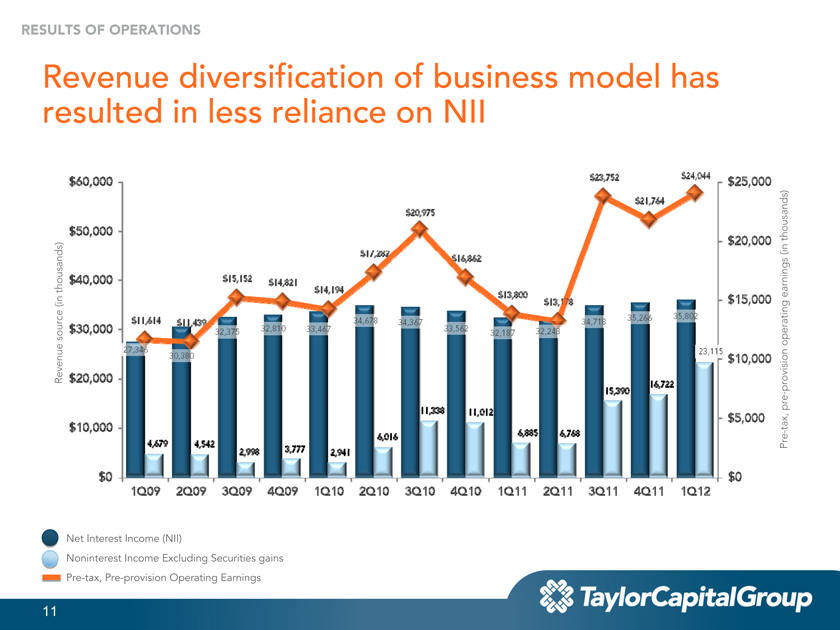
RESULTS OF OPERATIONS
Revenue diversification of business model has resulted in less reliance on NII
$60,000 $23,752 $24,044 $25,000 $21,764 $20,975
$50,000 thousands) $20,000 (in
$17,282 $16,862
$40,000 $15,152 thousands) $14,821 $14,194 $13,800 earnings (in $13,178 $15,000
35,266 35,802 $11,614 $11,439 32,810 34,678 34,367 33,562 34,718 $30,000 32,375 33,467 32,243 source 32,187
operating
27,346
23,115
30,380 $10,000 Revenue $20,000
16,722 provision
15,390 pre -11,338 11,012 $5,000 tax,
$10,000 -
6,885 6,768 6,016
4,679 4,542 Pre 2,998 3,777 2,941
$0 $0 1Q09 2Q09 3Q09 4Q09 1Q10 2Q10 3Q10 4Q10 1Q11 2Q11 3Q11 4Q11 1Q12
Net Interest Income (NII)
Noninterest Income Excluding Securities gains Pre-tax, Pre-provision Operating Earnings
11
|
|
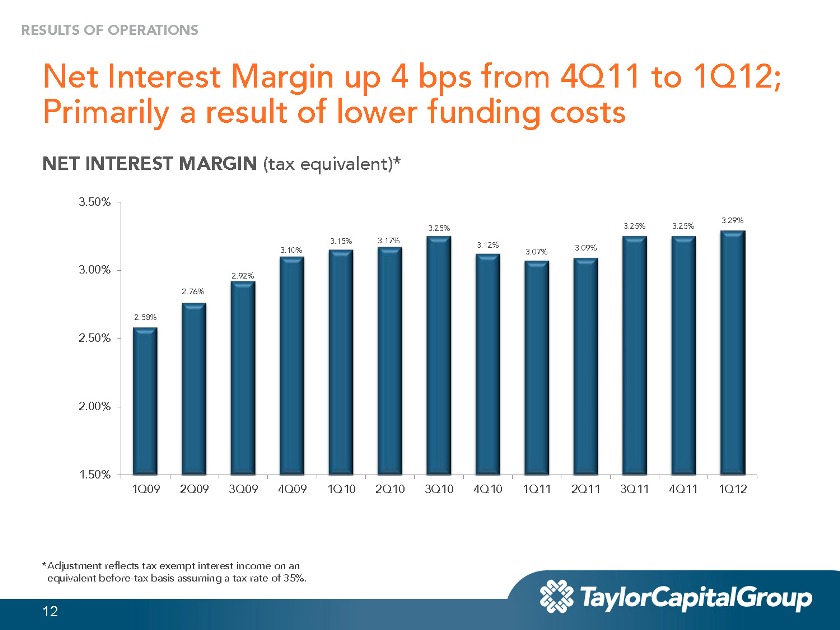
RESULTS OF OPERATIONS
Net Interest Margin up 4 bps from 4Q11 to 1Q12; Primarily a result of lower funding costs
NET INTEREST MARGIN (tax equivalent)*
3.50%
3.29%
3.25% 3.25% 3.25%
3.15% 3.17%
3.12% 3.09%
3.10% 3.07%
3.00%
2.92%
2.76%
2.58%
2.50%
2.00%
1.50%
1Q09 2Q09 3Q09 4Q09 1Q10 2Q10 3Q10 4Q10 1Q11 2Q11 3Q11 4Q11 1Q12
*Adjustment reflects tax exempt interest income on an equivalent before-tax basis assuming a tax rate of 35%.
12
|
|
RESULTS OF OPERATIONS
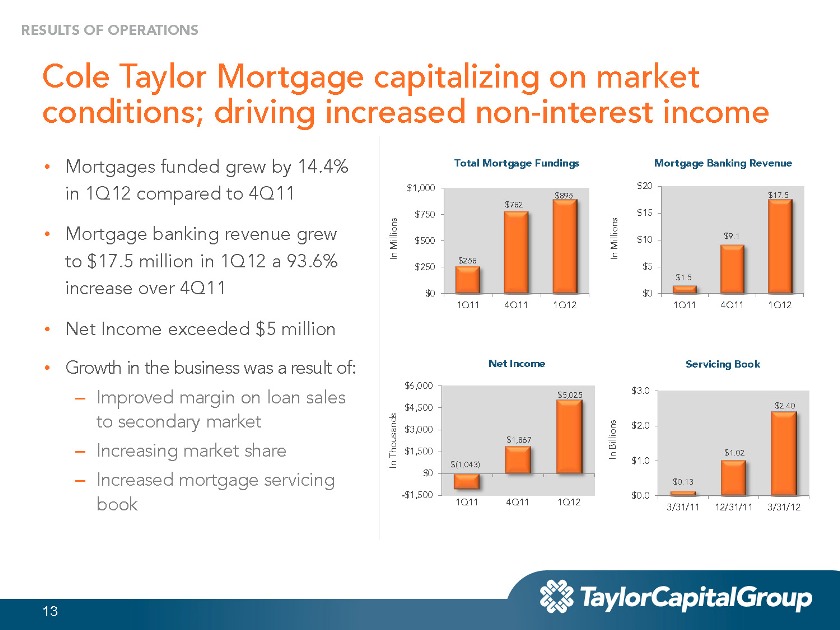
Cole Taylor Mortgage capitalizing on market conditions; driving increased non-interest income
• Mortgages funded grew by 14.4% in 1Q12 compared to 4Q11
• Mortgage banking revenue grew to $17.5 million in 1Q12 a 93.6% increase over 4Q11
• Net Income exceeded $5 million
• Growth in the business was a result of:
– Improved margin on loan sales to secondary market
– Increasing market share
– Increased mortgage servicing book
Total Mortgage Fundings Mortgage Banking Revenue
$1,000 $20 $895 $17.5 $782 $15 $750 Millions $500 Millions $10 $9.1 In In $258 $250 $5
$1.5 $0 $0
1Q11 4Q11 1Q12 1Q11 4Q11 1Q12
Net Income Servicing Book $6,000 $3.0 $5,025
$4,500 $2.40 $2.0 $3,000 $1,867 Billions Thousands $1,500 In $1.02 $1.0
In $0 $(1,043)
$0.13
-$1,500 $0.0 1Q11 4Q11 1Q12
3/31/11 12/31/11 3/31/12
|
|
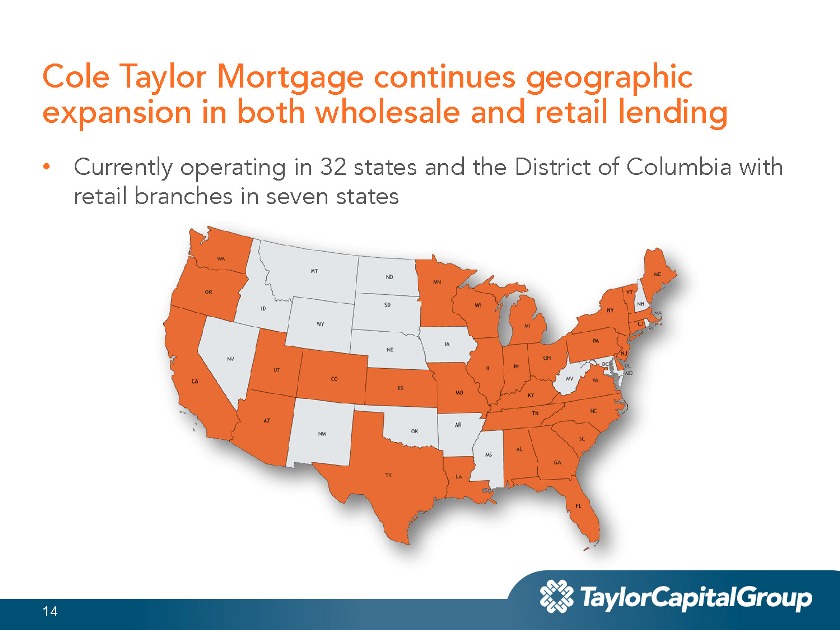
Cole Taylor Mortgage continues geographic expansion in both wholesale and retail lending
• Currently operating in 32 states and the District of Columbia with retail branches in seven states
14
|
|
RESULTS OF OPERATIONS
C&I remains backbone of our business; however, our diversification strategy is working as intended
• Disciplined approach to the slow economic recovery and competitive market resulting in commercial loan balances declining in 1Q12
• Growing lower cost relationship deposits
• Cole Taylor Business Capital expansion resulting in national loan growth
15
|
|
RESULTS OF OPERATIONS
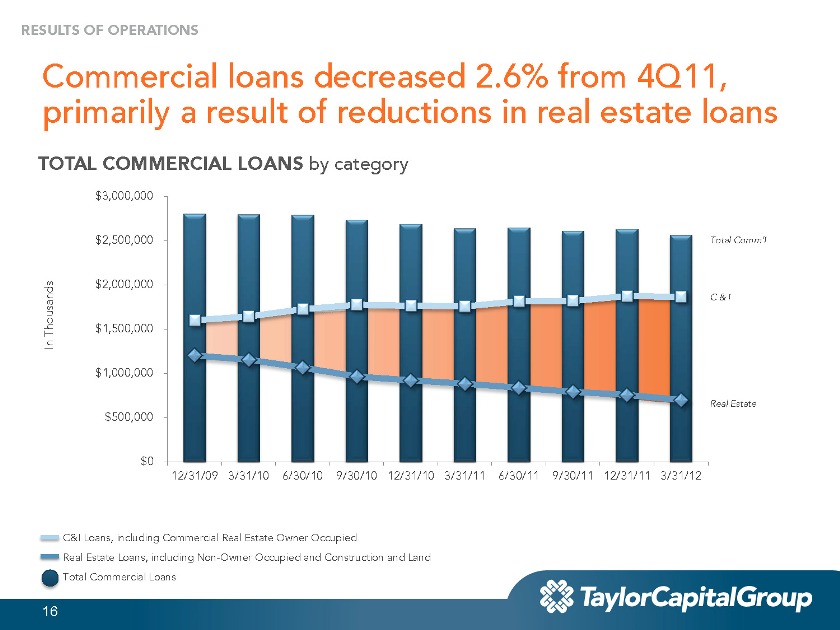
Commercial loans decreased 2.6% from 4Q11, primarily a result of reductions in real estate loans
TOTAL COMMERCIAL LOANS by category
$3,000,000
$2,500,000 Total Comm’l
$2,000,000
C & I
Thousands $1,500,000 In
$1,000,000
Real Estate $500,000
$0
12/31/09 3/31/10 6/30/10 9/30/10 12/31/10 3/31/11 6/30/11 9/30/11 12/31/11 3/31/12
C&I Loans, including Commercial Real Estate Owner Occupied
Real Estate Loans, including Non-Owner Occupied and Construction and Land Total Commercial Loans
16
|
|
RESULTS OF OPERATIONS
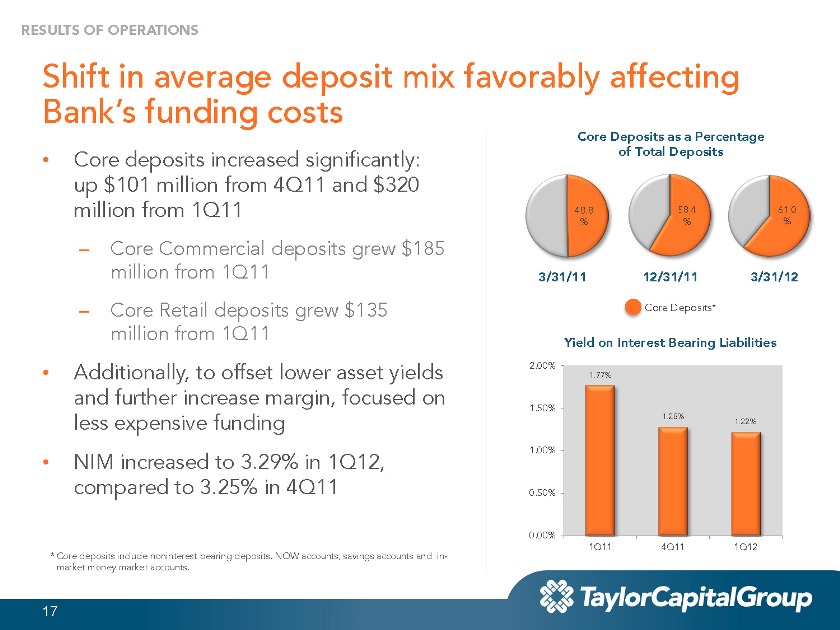
Shift in average deposit mix favorably affecting Bank’s funding costs
•Core deposits increased significantly: up $101 million from 4Q11 and $320 million from 1Q11
– Core Commercial deposits grew $185 million from 1Q11
– Core Retail deposits grew $135 million from 1Q11
• Additionally, to offset lower asset yields and further increase margin, focused on less expensive funding
• NIM increased to 3.29% in 1Q12, compared to 3.25% in 4Q11
* Core deposits include noninterest bearing deposits, NOW accounts, savings accounts and in-market money market accounts.
Core Deposits as a Percentage of Total Deposits
48.8 58.4 61.0
% % %
3/31/11 12/31/11 3/31/12
Core Deposits*
Yield on Interest Bearing Liabilities
2.00%
1.77%
1.50%
1.28%
1.22%
1.00%
0.50%
0.00%
1Q11 4Q11 1Q12
17
|
|
RESULTS OF OPERATIONS
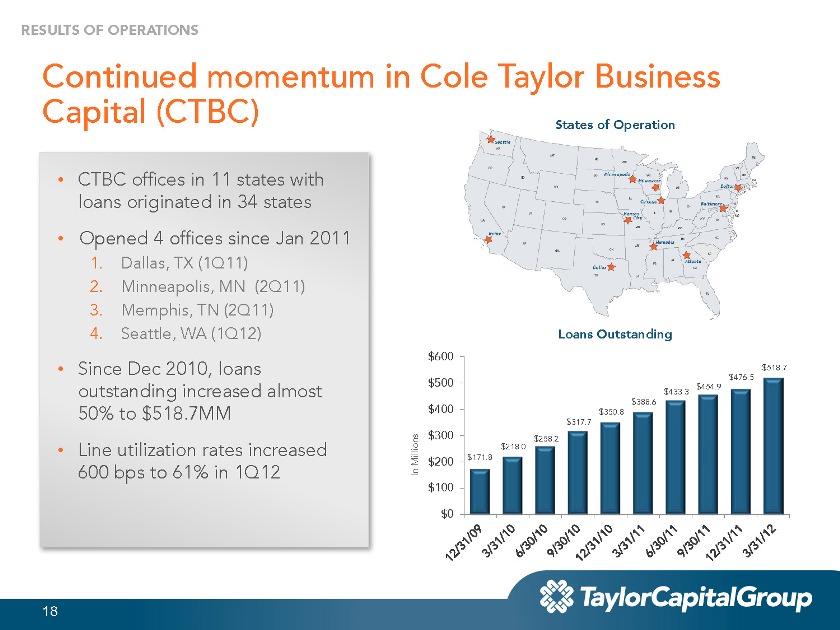
Continued momentum in Cole Taylor Business Capital (CTBC)
States of Operation
• CTBC offices in 11 states with loans originated in 34 states
• Opened 4 offices since Jan 2011
1. Dallas, TX (1Q11)
2. Minneapolis, MN (2Q11)
3. Memphis, TN (2Q11)
4. Seattle, WA (1Q12)
• Since Dec 2010, loans outstanding increased almost 50% to $518.7MM
• Line utilization rates increased 600 bps to 61% in 1Q12
Loans Outstanding $600
$518.7
$500 $476.5
$454.9
$433.3
$388.6
$400 $350.8
$317.7
$300 $258.2
$218.0 Millions $200 $171.8
In $100
$0
18
|
|
RESULTS OF OPERATIONS
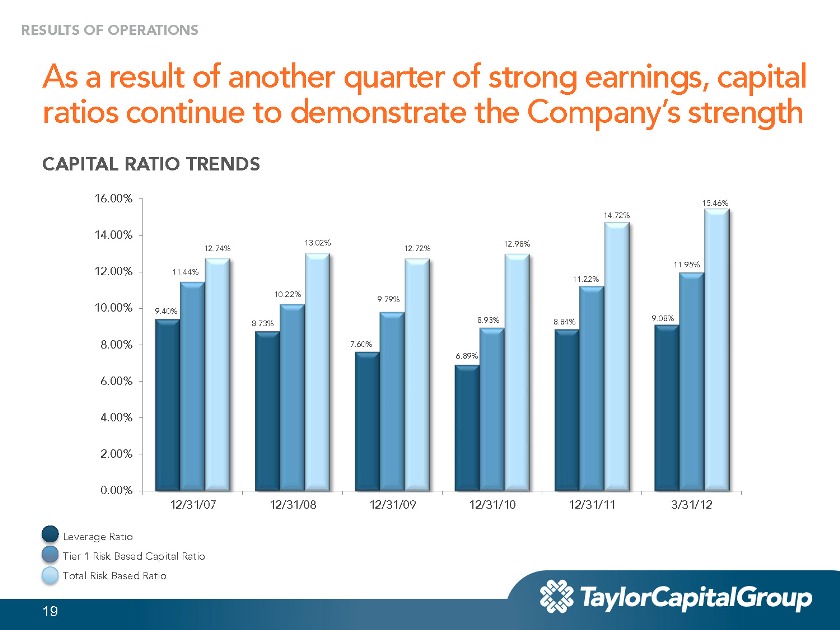
As a result of another quarter of strong earnings, capital ratios continue to demonstrate the Company’s strength
CAPITAL RATIO TRENDS
16.00% 15.46%
14.72%
14.00%
13.02% 12.98% 12.74% 12.72%
11.44% 11.95%
12.00%
11.22% 10.22%
9.79%
10.00% 9.40%
8.93% 8.84% 9.08%
8.73%
8.00% 7.60%
6.89%
6.00%
4.00%
2.00%
0.00%
12/31/07 12/31/08 12/31/09 12/31/10 12/31/11 3/31/12
Leverage Ratio
Tier 1 Risk Based Capital Ratio Total Risk Based Ratio
19
|
|
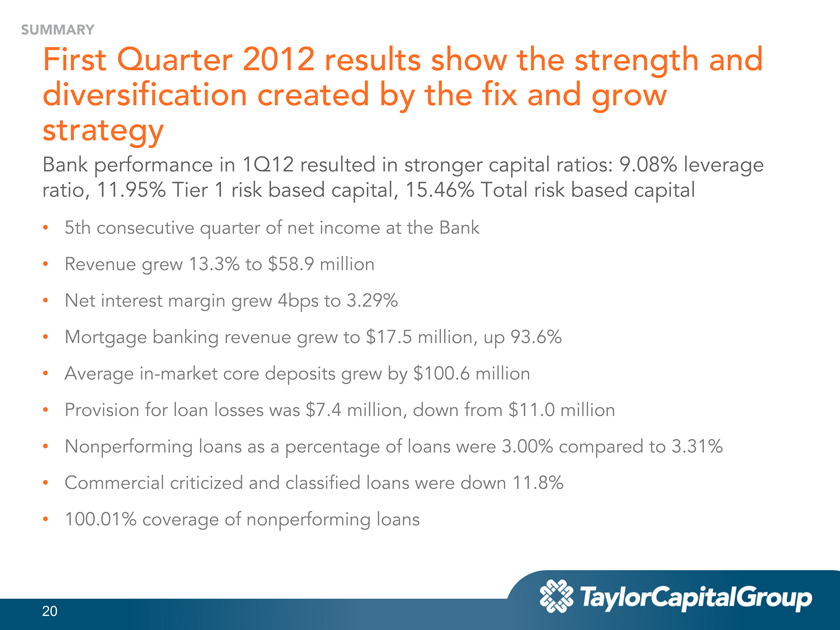
SUMMARY
First Quarter 2012 results show the strength and diversification created by the fix and grow strategy
Bank performance in 1Q12 resulted in stronger capital ratios: 9.08% leverage ratio, 11.95% Tier 1 risk based capital, 15.46% Total risk based capital
• 5th consecutive quarter of net income at the Bank
• Revenue grew 13.3% to $58.9 million
• Net interest margin grew 4bps to 3.29%
• Mortgage banking revenue grew to $17.5 million, up 93.6%
• Average in-market core deposits grew by $100.6 millon,
• Provision for loan losses was $7.4MM, down from $11.0 million
• Nonperforming loans as a percentage of loans were 3.00% compared to 3.31%
• Commercial criticized and classified loans were down 11.8%
• 100.01% coverage of nonperforming loans
20
|
|
SUMMARY
Non-GAAP Measure of
Pre-tax, Pre-provision Operating Earnings
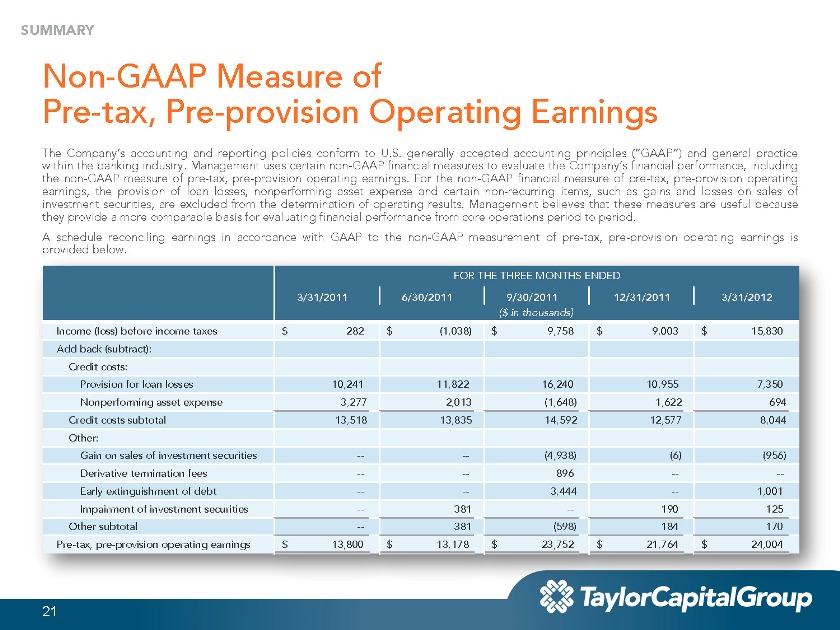
The Company’s accounting and reporting policies conform to U.S. generally accepted accounting principles (“GAAP”) and general practice within the banking industry. Management uses certain non-GAAP financial measures to evaluate the Company’s financial performance, including the non-GAAP measure of pre-tax, pre-provision operating earnings. For the non-GAAP financial measure of pre-tax, pre-provision operating earnings, the provision of loan losses, nonperforming asset expense and certain non-recurring items, such as gains and losses on sales of investment securities, are excluded from the determination of operating results. Management believes that these measures are useful because they provide a more comparable basis for evaluating financial performance from core operations period to period.
A schedule reconciling earnings in accordance with GAAP to the non-GAAP measurement of pre-tax, pre-provision operating earnings is provided below.
FOR THE THREE MONTHS ENDED
3/31/2011 6/30/2011 9/30/2011 12/31/2011 3/31/2012
($ in thousands)
Income (loss) before income taxes $ 282 $ (1,038) $ 9,758 $ 9,003 $ 15,830 Add back (subtract): Credit costs: Provision for loan losses 10,241 11,822 16,240 10,955 7,350 Nonperforming asset expense 3,277 2,013 (1,648) 1,622 694 Credit costs subtotal 13,518 13,835 14,592 12,577 8,044 Other: Gain on sales of investment securities -- -- (4,938) (6) (956) Derivative termination fees -- -- 896 -- --Early extinguishment of debt -- -- 3,444 -- 1,001 Impairment of investment securities -- 381 -- 190 125 Other subtotal -- 381 (598) 184 170 Pre-tax, pre-provision operating earnings $ 13,800 $ 13,178 $ 23,752 $ 21,764 $ 24,004
21
|
|
SUMMARY
Non-GAAP Measure of Revenue
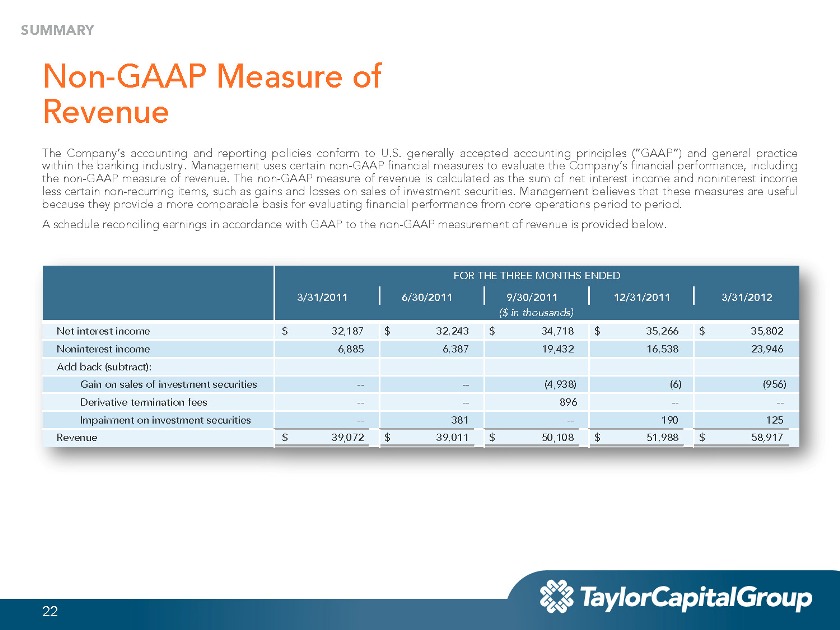
The Company’s accounting and reporting policies conform to U.S. generally accepted accounting principles (“GAAP”) and general practice within the banking industry. Management uses certain non-GAAP financial measures to evaluate the Company’s financial performance, including the non-GAAP measure of revenue. The non-GAAP measure of revenue is calculated as the sum of net interest income and noninterest income less certain non-recurring items, such as gains and losses on sales of investment securities. Management believes that these measures are useful because they provide a more comparable basis for evaluating financial performance from core operations period to period.
A schedule reconciling earnings in accordance with GAAP to the non-GAAP measurement of revenue is provided below.
FOR THE THREE MONTHS ENDED
3/31/2011 6/30/2011 9/30/2011 12/31/2011 3/31/2012
($ in thousands)
Net interest income $ 32,187 $ 32,243 $ 34,718 $ 35,266 $ 35,802 Noninterest income 6,885 6,387 19,432 16,538 23,946 Add back (subtract): Gain on sales of investment securities -- -- (4,938) (6) (956) Derivative termination fees -- -- 896 -- --Impairment on investment securities -- 381 -- 190 125 Revenue $ 39,072 $ 39,011 $ 50,108 $ 51,988 $ 58,917
22
|
|

EARNINGS PER SHARE
|
|
EARNINGS PER SHARE
Two approaches used to calculate EPS for TAYC
• U.S. GAAP
– Used in our published and audited financial results
– Strict accounting-based view of both NIAC and shares outstanding
– Includes dilutive effect of options / warrants (for “fully-diluted”)
• Taylor Capital Group internal reporting
– Based on “normalized operating income”
– Includes common stock equivalents in share count
24
|
|
EARNINGS PER SHARE
“Earnings” in EPS
• U.S. GAAP
– Net income applicable to common stockholders (NIAC)
– Reduced by dividend payments and discounts on TARP preferred stock
– Includes one-time gains / losses and realized securities gains / losses / impairments
– Requires an allocation of NIAC to what are considered common share classes (e.g. unvested Restricted Stock Units)
• Taylor Capital Group internal reporting
– Reduced by dividend payments on TARP preferred stock (same as GAAP)
– Excludes one-time gains / losses and securities realized gains / losses / impairments
25
|
|
EARNINGS PER SHARE
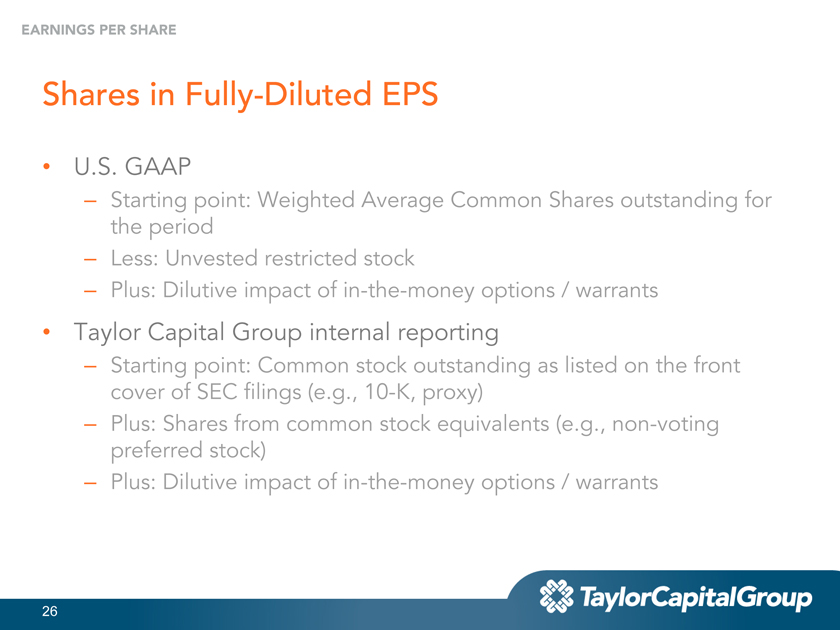
Shares in Fully-Diluted EPS
• U.S. GAAP
– Starting point: Weighted Average Common Shares outstanding for the period
– Less: Unvested restricted stock
– Plus: Dilutive impact of in-the-money options / warrants
• Taylor Capital Group internal reporting
– Starting point: Common stock outstanding as listed on the front cover of SEC filings (e.g., 10-K, proxy)
– Plus: Shares from common stock equivalents (e.g., non-voting preferred stock)
– Plus: Dilutive impact of in-the-money options / warrants
26
|
|
EARNINGS PER SHARE
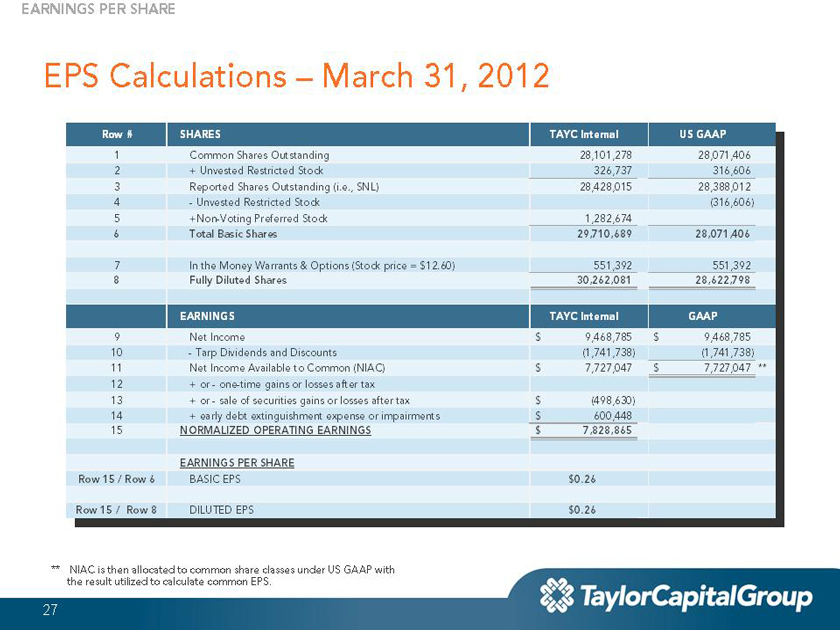
EPS Calculations – March 31, 2012
** NIAC is then allocated to common share classes under US GAAP with the result utilized to calculate common EPS.
Row # SHARES TAYC Internal US GAAP
1 Common Shares Outstanding 28,101,278 28,071,406
2 + Unvested Restricted Stock 326,737 316,606
3 Reported Shares Outstanding (i.e., SNL) 28,428,015 28,388,012
4 - Unvested Restricted Stock (316,606)
5 +Non-Voting Preferred Stock 1,282,674
6 Total Basic Shares 29,710,689 28,071,406
7 In the Money Warrants & Options (Stock price = $12.60) 551,392 551,392
8 Fully Diluted Shares 30,262,081 28,622,798
EARNINGS TAYC Internal GAAP
9 Net Income $ 9,468,785 $ 9,468,785
10 - Tarp Dividends and Discounts (1,741,738) (1,741,738)
11 Net Income Available to Common (NIAC) $ 7,727,047 $ 7,727,047 **
12 + or - one-time gains or losses after tax
13 + or - sale of securities gains or losses after tax $ (498,630)
14 + early debt extinguishment expense or impairments $ 600,448
15 NORMALIZED OPERATING EARNINGS $ 7,828,865
EARNINGS PER SHARE
Row 15 / Row 6 BASIC EPS $0.26
Row 15 / Row 8 DILUTED EPS $0.26
27