Attached files
Table of Contents
UNITED STATES
SECURITIES AND EXCHANGE COMMISSION
Washington, D.C. 20549
FORM 10-K
ANNUAL REPORT PURSUANT TO SECTION 13 OR 15(d)
OF THE SECURITIES EXCHANGE ACT OF 1934
For the fiscal year ended December 31, 2010
Commission file number 0-50034
TAYLOR CAPITAL GROUP, INC.
(Exact name of registrant as specified in its charter)
| Delaware | 36-4108550 | |
| (State or other jurisdiction of incorporation or organization) |
(I.R.S. Employer Identification Number) |
9550 West Higgins Road
Rosemont, Illinois 60018
(Address, including zip code, of principal executive offices)
(847) 653-7978
(Registrant’s telephone number, including area code)
Securities registered pursuant to Section 12(b) of the Act:
| Common Stock, par value $0.01 per share | The NASDAQ Stock Market, LLC | |
| (Title of Class) | (Name of Exchange Which Registered) |
Securities registered pursuant to Section 12(g) of the Act: None
Indicate by check mark if the registrant is a well-known seasoned issuer, as defined in Rule 405 of the Securities Act. Yes ¨ No x
Indicate by check mark if the registrant is not required to file reports pursuant to Section 13 or Section 15(d) of the Exchange Act. Yes ¨ No x
Indicate by check mark whether the registrant (1) has filed all reports required to be filed by Section 13 or 15(d) of the Securities Exchange Act of 1934 during the preceding 12 months (or for such shorter period that the registrant was required to file such reports), and (2) has been subject to such filing requirements for the past 90 days. Yes x No ¨
Indicate by check mark whether the registrant has submitted electronically and posted on its corporate web site, if any, every Interactive Data File required to be submitted and posted pursuant to Rule 405 of Regulation S-T (§ 232.405 of this chapter) during the preceding 12 months (or for such shorter period that the registrant was required to submit and post such files). Yes ¨ No ¨
Indicate by check mark if disclosure of delinquent filers pursuant to Item 405 of Regulation S-K (§ 229.405 of this chapter) is not contained herein, and will not be contained, to the best of registrant’s knowledge, in definitive proxy or information statements incorporated by reference in Part III of this Form 10-K or any amendment to this Form 10-K. ¨
Indicate by check mark whether the registrant is a large accelerated filer, an accelerated filer, a non-accelerated filer, or a smaller reporting company. See definition of “accelerated filer,” “large accelerated filer” and “smaller reporting company” in Rule 12b-2 of the Exchange Act.
| Large accelerated filer ¨ | Accelerated filer | ¨ | Non-accelerated filer | ¨ | Smaller reporting company | x |
Indicate by check mark whether the registrant is a shell company (as defined in Exchange Act Rule 12b-2). Yes ¨ No x
The aggregate market value of the voting and non-voting common equity held by non-affiliates of the registrant, based on the closing sales price on The Nasdaq Global Select Market on June 30, 2010, the last business day of the registrant’s most recently completed second fiscal quarter was approximately $126,814,148.
At March 15, 2011, there were 17,904,809 shares of the registrant’s common stock outstanding.
DOCUMENTS INCORPORATED BY REFERENCE
Portions of the registrant’s Notice of Annual Meeting and Proxy Statement for the registrant’s Annual Meeting of Stockholders to be held on or around May 12, 2011 are incorporated by reference into Part III hereof.
Table of Contents
TAYLOR CAPITAL GROUP, INC.
| Page No. | ||||||
| Part I. |
||||||
| Item 1. |
1 | |||||
| Item 1A. |
12 | |||||
| Item 2. |
19 | |||||
| Item 3. |
20 | |||||
| Item 4. |
20 | |||||
| Part II. |
||||||
| Item 5. |
21 | |||||
| Item 6. |
23 | |||||
| Item 7. |
Management’s Discussion and Analysis of Financial Condition and Results of Operations |
25 | ||||
| Item 7A. |
77 | |||||
| Item 8. |
78 | |||||
| Item 9. |
Changes in and Disagreements With Accountants on Accounting and Financial Disclosure |
135 | ||||
| Item 9A. |
135 | |||||
| Item 9B. |
136 | |||||
| Part III. |
||||||
| Item 10. |
137 | |||||
| Item 11. |
137 | |||||
| Item 12. |
Security Ownership of Certain Beneficial Owners and Management and Related Stockholder Matters |
137 | ||||
| Item 13. |
Certain Relationships and Related Transactions, and Director Independence |
137 | ||||
| Item 14. |
137 | |||||
| Part IV. |
||||||
| Item 15. |
138 | |||||
Table of Contents
TAYLOR CAPITAL GROUP, INC.
PART I
Our Business
Taylor Capital Group, Inc. (the “Company”, “we”, “us”, or “our”) is a bank holding company headquartered in Rosemont, Illinois, a suburb of Chicago, and we derive substantially all of our revenue from our wholly-owned subsidiary, Cole Taylor Bank (the “Bank”). The Bank was founded in 1929 and has served the Chicago area for over 80 years. We were formed in 1996 and acquired Cole Taylor Bank in 1997. We provide a range of products and services primarily to closely-held commercial customers and their owner operators in the Chicago area. We also provide asset-based lending and residential mortgage origination services through offices both in Chicago and other geographic markets. At December 31, 2010, we had assets of approximately $4.5 billion, deposits of approximately $3.0 billion and stockholders’ equity of $208.8 million.
Our primary businesses are commercial banking, asset based lending, mortgage origination services and retail banking. Our target commercial lending customers are businesses in industries such as manufacturing, wholesale and retail distribution, transportation, construction contracting and professional services. Our clients are generally closely-held, middle-market companies with annual revenues between $5 million and $250 million. Our commercial lending activities primarily consist of providing loans for working capital; business expansion or acquisition; owner-occupied commercial real estate financing; revolving lines of credit; and stand-by and commercial letters of credit. We also offer to our commercial clients treasury cash management services, including repurchase agreements, internet balance reporting, remote deposit capture, positive pay, automated clearing house products, imaged lock-box processing, controlled disbursement and account reconciliation. Our commercial and industrial lending group operates primarily in the Chicago area. Through offices across the United States, we also offer asset-based financing through Cole Taylor Business Capital including revolving lines of credit supported by receivables and inventory and term loans supported by equipment and real estate.
In addition, we originate and sell mortgage loans through Cole Taylor Mortgage. This unit is qualified to do business in 20 states, three of which were added in January 2011. Loan production is sourced through retail offices across the United States and from the Bank’s branches, we refer to as banking centers, located in the Chicago area, as well as through relationships with mortgage brokers nationally. This line of business, launched in early 2010, is a source of noninterest fee income while providing earnings and geographic diversification.
In addition to our lending activities, we offer deposit products, such as checking, savings and money market accounts, as well as time deposits through nine banking centers located in the Chicago area. We also cross-sell products and services to the owners and executives of our business customers to help them meet their personal financial goals, including personal credit. In addition to commercial clients, we provide deposit and credit services to our community-based customers, typically individuals and small, local businesses located near one of our nine banking centers. We use third-party providers to offer investment management and brokerage services.
Our commercial and retail credit and deposit products are delivered by a single operations area located in Rosemont, Illinois. Our mortgage unit is based in Hamburg, Michigan. We do not have separate and discrete operating segments.
Our Strategy
Our strategy to increase stockholder value is a two-pronged approach, which we generally refer to as our “fix and grow” strategy, which focuses on remediating the asset quality issues brought on by the downturn of the Chicago area real estate market, while simultaneously growing and diversifying our earnings. This strategy has been in place since early 2008 when we first embarked on the repositioning of the Bank as a commercial and
1
Table of Contents
industrial lender to closely-held businesses in the Chicago area. At that time, we began shifting away from industries and sectors that we no longer considered economically desirable and reducing areas of significant risk concentration, such as in real estate lending.
Growth Strategy
Our Commercial and Industrial banking business was bolstered and expanded in early 2008 with the addition of new leadership and more than 50 experienced commercial bankers. The foundation of this business is built on the belief that closely-held business owners value a long-term relationship with a quality banker who provides innovative advice, creative ideas and an understanding of the challenges and opportunities these owners face. For this reason, we believe our relationship managers are the most important “product” that we offer as well as our customers’ access to our senior management. Since the repositioning began in 2008, the Commercial and Industrial banking team has established over 400 new client relationships and generated approximately $1.5 billion of new loan fundings. Today, approximately 55% of the loan portfolio is made up of commercial and industrial loans, including owner-occupied real estate, spread across many industry sectors.
To complement and extend our growth strategy, in 2009 we added new, experienced leadership, as well as sales and lending capability in asset-based lending, formed Cole Taylor Business Capital, and thus expanded our product set and geographic reach. Since inception, this unit has added over 70 new clients and has generated loan fundings of over $350 million and commitments of approximately $715 million. The addition of this business provides us with some geographic diversity given its nationwide reach from eight offices spread across the U.S. We expect this business will continue to grow, adding additional offices to boost coverage and increase production.
In January 2010, we established Cole Taylor Mortgage by hiring experienced leadership with extensive mortgage banking knowledge and relationships. The addition of a mortgage lending operation added further geographic diversity and a significant source of fee income, both important strategic considerations. In 2010, Cole Taylor Mortgage funded more than $800 million in mortgage loans, generating more than $14 million in new fee income, and had positive operating profit (revenue less noninterest expense). It is expected that this unit’s origination volumes will increase as operations grow. We anticipate further growth in loan production to result from the opening of additional retail offices, as well as through our growing network of relationships with mortgage brokers and by adding new products.
Asset Quality Improvement Strategy
With the downturn of the Chicago area real estate market that began in late 2008, and because of the years prior when the Bank was more heavily concentrated in real estate construction and land development lending, we augmented our growth strategy with a focus on asset quality remediation. Since 2008, we added significant workout capabilities to support that effort, retained additional experienced asset quality remediation consultants and we overhauled our loan operations.
As necessitated by the deterioration in the residential real estate construction and land loan portfolio as a result of the rapid market downturn in the Chicago area, a significant focus of the asset quality remediation strategy has been in reducing our residential construction and land portfolio. At the beginning of 2008, this portfolio was approximately $500 million and at year end 2010 was approximately $100 million, an 80% reduction. This reduction was largely accomplished through charge-offs and foreclosures. As this exposure has decreased over time and as other parts of the Chicago commercial real estate market have also weakened, we had directed our expanded workout resources to include other areas of the Bank’s loan portfolio that have shown the most propensity for losses, including commercial construction and land loans, loans to banks and bank holding companies and other categories of commercial real estate loans.
Throughout 2009 and 2010, we improved our core operating results by increasing the level of net interest income and noninterest income while attempting to hold the level of noninterest expense relatively flat. We also improved our loan pricing, including the use of interest rate floors in new loan originations. Although we kept the
2
Table of Contents
size of our investment portfolio relatively flat, we did capture gains and reduced our refinancing risk by selling some securities in 2010. On the liability side, we continued to strengthen our liquidity position by obtaining more funding from core customers which allowed us to reduce our reliance on more expensive brokered deposits.
To support our strategy, in 2011 we improved our product and processing capabilities by upgrading our core processing system, which will allow us to expand our product offerings, improve customer service and further complement the other improvements in infrastructure that we have made in the past three years.
Competition
We encounter intense competition for all of our products and services, including substantial competition in attracting and retaining deposits and in obtaining loan customers in the Chicago area. We also encounter intense competition in the pricing of our products and services: including interest rates paid on deposits, interest rates charged on loans, as well as credit terms and underwriting criteria, residential mortgage origination fees charged and other professional services. Our principal competitors are numerous and include other commercial banks, both locally and nationally, savings and loan associations, mutual funds, money market funds, finance companies, credit unions, mortgage companies, the United States Government, private issuers of debt obligations and suppliers of other investment alternatives, such as securities firms. We may also face a competitive disadvantage as a result of our smaller size, limited banking center network and narrower product offerings. Many of our competitors are significantly larger than us and have access to greater financial and other resources. In addition, many of our non-bank competitors are not subject to all of the same federal regulations that govern bank holding companies and federally insured banks or the state regulations governing state chartered banks. As a result, our non-bank competitors may have advantages over us in providing some services.
Employees
Together with the Bank, we had 591 full-time employees as of December 31, 2010. None of our employees is subject to a collective bargaining agreement. We consider our relationship with our employees to be good.
Supervision and Regulation
The following is a summary of the material elements of the regulatory framework that applies to us and our banking subsidiary. It does not describe all of the statutes, regulations and regulatory policies that apply or restate all of the requirements, and the descriptions of, and references to, the statutes, regulations and agreements below are qualified in their entirety to applicable summaries and do not purport to be complete.
The regulatory scheme described below, if altered by legislation, regulation, or by interpretation and practice of regulatory authorities, could have the effect of increasing our cost of doing business, limiting permissible activities, increasing competition or causing other difficulties for us, any of which could adversely affect our business, results of operations, growth prospects, lending activities and our ability to pay dividends or service debt. Legislative, regulatory and policy changes with respect to the banking industry generally, or with respect to the Bank in particular, cannot be predicted with certainty.
Financial institution regulation and supervision are intended for the protection of depositors, the Federal Deposit Insurance Corporation’s (“FDIC”) Deposit Insurance Fund and the banking system as a whole, and not necessarily for the protection of a bank or the bank holding company’s stockholders or creditors. As such, the banking regulators have extensive discretion in connection with their supervisory and enforcement powers over the Company, as a regulated bank holding company, and over the Bank, as a regulated subsidiary depository institution
General Discussion
Financial institutions are highly regulated both at the federal and state levels. Numerous statutes and regulations affect the business of the Company.
3
Table of Contents
As a registered bank holding company under the Bank Holding Company Act (“BHC Act”), we are regulated and supervised by the Board of Governors of the Federal Reserve System (“Federal Reserve”) and the Illinois Department of Financial and Professional Regulation (“IDFPR”). In addition, pursuant to the Dodd-Frank Act, the FDIC has backup enforcement authority over a depository institution holding company, such as the Company, if the conduct or threatened conduct of such holding company poses a risk to the Deposit Insurance Fund (“DIF”), although such authority may not be used if such holding company is generally in sound condition and does not pose a foreseeable and material risk to the DIF. The Bank, an Illinois state-chartered bank that is a member of the Federal Reserve System, is regulated by both the IDFPR and the Federal Reserve. The Bank is required to file periodic reports with both agencies and is subject to periodic examination by both the IDFPR and Federal Reserve. The Bank also accepts deposits which are insured by the FDIC and thus is also subject to supervision by the FDIC.
Capital Requirements
We are subject to various regulatory capital requirements administered by the federal and state banking agencies noted above. Failure to meet regulatory capital requirements could result in certain mandatory and possible additional discretionary actions by regulators that, if undertaken, could have a direct material effect on our financial statements. Under capital adequacy guidelines and the regulatory framework for prompt corrective action (described below), we must meet specific capital guidelines that involve quantitative measures of our assets, liabilities and certain off-balance sheet items as calculated under regulatory accounting policies. Our capital amounts and classification are also subject to judgments by the regulators regarding qualitative components, risk weightings, and other factors. For further detail on our capital raise as well as capital and capital ratios see Notes to Consolidated Financial Statements, Note 16—Regulatory Disclosures.
Under the risk-based capital requirements for bank holding companies, the minimum requirement for the ratio of Total Capital to risk-weighted assets (including certain off-balance sheet activities, such as standby letters of credit) is 8%. At least half of the Total Capital (as defined below) is to be composed of common stockholders’ equity, retained earnings, qualifying perpetual preferred stock (in a limited amount in the case of cumulative preferred stock), minority interests in the equity accounts of consolidated subsidiaries and qualifying trust preferred securities, less goodwill and certain intangibles (“Tier 1 Capital”). The remainder of Total Capital may consist of qualifying subordinated debt and redeemable preferred stock, qualifying cumulative perpetual preferred stock and allowance for loan losses (“Tier 2 Capital”), and together with Tier 1 Capital, (“Total Capital”). At December 31, 2010, our Tier 1 Capital ratio was 8.93% and Total Capital ratio was 12.98%.
The Federal Reserve has established minimum leverage ratio guidelines for bank holding companies. These requirements provide for a minimum leverage ratio of Tier 1 Capital to adjusted average quarterly assets (“leverage ratio”) equal to 3% for bank holding companies that meet specified criteria, including having the highest regulatory rating. All other bank holding companies will generally be required to maintain a leverage ratio of at least 4%. Our leverage ratio at December 31, 2010, was 6.89%. The guidelines also provide that bank holding companies experiencing internal growth or making acquisitions will be expected to maintain strong capital positions substantially above the minimum supervisory levels without significant reliance on intangible assets. Furthermore, the guidelines indicate that the Federal Reserve will continue to consider a “tangible tier 1 leverage ratio” (deducting all intangibles) in evaluating proposals for expansion or to engage in new activity. The Federal Reserve has not advised us of any higher specific minimum leverage ratio or tier 1 leverage ratio applicable to us.
4
Table of Contents
Emergency Economic Stabilization Act of 2008
On October 3, 2008, President Bush signed into law the Emergency Economic Stabilization Act of 2008 (“EESA”), giving the United States Department of the Treasury (“UST”) authority to take certain actions to restore liquidity and stability to the U.S. banking markets. Based upon its authority in the EESA, a number of programs were announced, including the following:
Capital Purchase Program (“CPP”). Pursuant to this program, the UST, on behalf of the U.S. government, purchased preferred stock, along with warrants to purchase common stock, from certain financial institutions, including bank holding companies, savings and loan holding companies and banks or savings associations not controlled by a holding company. The investment required a dividend rate of 5% per year, until the fifth anniversary of the UST’s investment and a dividend of 9% thereafter. During the time the UST holds securities issued pursuant to this program, participating financial institutions are required to comply with (i) certain provisions regarding executive compensation paid to senior executives and certain other employees, and (ii) corporate governance disclosure and certification requirements. Participation in this program also imposes certain restrictions upon an institution’s dividends to common stockholders and stock repurchase activities. As described further herein, we elected to participate in the CPP and on November 21, 2008, received $105 million pursuant to the program.
Pursuant to the terms of the CPP, while any senior preferred stock is outstanding, dividends are permissible on our common stock, provided that all accrued and unpaid dividends for all past dividend periods on the senior preferred stock are fully paid. Prior to November 21, 2012, unless the senior preferred stock has been redeemed or the UST has transferred all of the senior preferred stock to third parties, we need the consent of the UST before paying any dividends on our common stock.
Temporary Liquidity Guarantee Program. This program contained both (i) a debt guarantee component (“Debt Guarantee Program”), whereby the FDIC guaranteed certain senior unsecured debt issued by eligible financial institutions; and (ii) a transaction account guarantee component (“TAG Program”), whereby the FDIC insured 100% of noninterest-bearing deposit transaction accounts held at eligible financial institutions, such as payment processing accounts, payroll accounts and working capital accounts. This program is no longer in effect, however, as the Dodd-Frank Act requires all insured financial institutions, such as the Bank, to provide noninterest-bearing deposit transaction accounts with full deposit insurance without limit through December 31, 2012. Such accounts include only traditional, noninterest demand deposit (or checking) accounts that allow for an unlimited number of transfers and withdrawals at any time, whether held by a business, individual or other type of depositor. Although not encompassed within the Dodd-Frank Act, interest on Lawyers Trust Accounts was subsequently included by Congress in late 2010 and will also receive full deposit insurance until December 31, 2012. Negotiated Order of Withdrawal (NOW) accounts are not provided with this coverage. Insured financial institutions are not permitted to opt out of this insurance program and the FDIC will not charge a separate assessment for this coverage. This coverage is separate from, and in addition to, coverage a depositor has with respect to other accounts at an insured depository institution.
FDIC Liquidation Authority under the Dodd-Frank Act
The FDIC issued in January 2011, an interim final rule on depositor preference which clarifies how the agency will treat certain creditors’ claims under the FDIC’s new liquidation authority. Pursuant to the Dodd-Frank Act, the agency may be appointed as receiver for a financial company if the failure of such company and its liquidation under the Bankruptcy Code or other insolvency proceeding would pose significant risks to U.S. financial stability. Pursuant to the interim final rule, the FDIC will allow additional payments to a creditor in rare circumstances after the agency’s board of directors has determined that such payments meet certain statutory standards. The payments would be subject to recoupment, however, if the ultimate recoveries are insufficient to repay any temporary government-provided liquidity support. The interim final rule also (i) provides the FDIC with authority to continue a company’s operations by paying for services provided by employees and others; (ii) clarifies how damages will be calculated for creditors’ contingent claims; and (iii) describes the application of proceeds from the liquidation of subsidiaries.
5
Table of Contents
Banking Acquisitions
As a bank holding company, we are required to obtain prior Federal Reserve approval before acquiring more than 5% of the voting shares, or substantially all of the assets, of a financial institution holding company, bank or savings association. In determining whether to approve a proposed bank acquisition, federal bank regulators will consider, among other factors, the effect of the acquisition on competition, the public benefits expected to be received from the acquisition, the projected capital ratios and levels on a post-acquisition basis, and the acquiring institution’s safety and soundness and record of addressing the credit needs of the communities it serves, including the needs of low and moderate income neighborhoods, consistent with the safe and sound operation of the bank, under the Community Reinvestment Act (“CRA”).
Dividend Payments
We are a legal entity separate and distinct from our banking and other subsidiaries. A substantial portion of our revenue comes from dividends paid to us by the Bank. The Federal Reserve has the authority to prohibit bank holding companies from paying dividends if it deems such payment to be an unsafe or unsound practice. With respect to this authority, the Federal Reserve has indicated generally that it may be an unsafe or unsound practice for a bank holding company to pay dividends unless the company’s net income is sufficient to fund the dividends and the company’s expected rate of earnings retention is consistent with its capital needs, asset quality and overall financial condition.
Both we and our banking subsidiary are subject to various general regulatory policies and requirements relating to the payment of dividends, including requirements to maintain adequate capital above regulatory minimums. The appropriate federal regulatory authority is authorized to determine under certain circumstances relating to the financial condition of a bank or bank holding company, that the payment of dividends would be an unsafe or unsound practice and to prohibit payment thereof. The appropriate federal regulatory authorities have indicated that paying dividends that deplete a bank’s capital base to an inadequate level would be an unsafe and unsound banking practice and that banking organizations should generally pay dividends only out of current operating earnings.
Since 2008, the Bank has not paid cash dividends to us, and no further dividends may be paid by the Bank to us, or by us to our stockholders, without prior notice to our regulators.
Bank Holding Company Act Requirements
We are a registered bank holding company under the BHC Act and Illinois law. As such, we are subject to regulation, supervision and examination by the Federal Reserve and the IDFPR. In connection with applicable requirements, bank holding companies file periodic reports and other information with the Federal Reserve. In addition to supervision and regulation, the BHC Act also governs the activities that are permissible to bank holding companies and their affiliates and permits the Federal Reserve, in certain circumstances, to issue cease and desist orders and other enforcement actions against bank holding companies and their non-banking affiliates to correct and curtail unsafe or unsound banking practices. Under the Dodd-Frank Act and longstanding Federal Reserve policy, bank holding companies are required to act as a source of financial strength to each of their subsidiaries pursuant to which such holding company may be required to commit financial resources to support such subsidiaries in circumstances when, absent such requirements, they might not otherwise do so.
The BHC Act further regulates holding company activities, including requirements and limitations relating to capital, transactions with officers, directors and affiliates, securities issuances, dividend payments, inter-affiliate liabilities, extensions of credit, and expansion through mergers and acquisitions.
The Gramm-Leach-Bliley Act of 1999 significantly amended the BHC Act. The amendments, among other things, allow certain qualifying bank holding companies that elect treatment as “financial holding companies” to engage in activities that are financial in nature and that explicitly include the underwriting and sale of insurance.
6
Table of Contents
The Company has not elected to be treated as a financial holding company. Bank holding companies that have not elected such treatment generally must limit their activities to banking activities and activities that are closely related to banking.
Guidance on Sound Incentive Compensation Policies
In July 2010, the federal banking agencies issued guidance which applies to all banking organizations supervised by the agencies (thereby including both the Company and its subsidiary bank). Pursuant to the guidance, to be consistent with safety and soundness principles a banking organization’s incentive compensation arrangements should: (i) provide employees with incentives that appropriately balance risk and reward; (ii) be compatible with effective controls and risk management; and (iii) be supported by strong corporate governance including active and effective oversight by the banking organization’s board of directors. Monitoring methods and processes used by a banking organization should be commensurate with the size and complexity of the organization and its use of incentive compensation.
Changes to Mortgage Loan Originator Compensation
Regulations concerning the compensation of mortgage loan originators were recently amended. Effective April 1, 2011, mortgage loan originators may not receive compensation based on a mortgage transaction’s terms or conditions except the amount of credit extended. Mortgage loan originators may receive compensation from a consumer or from a lender, but not both. In addition, employees of mortgage loan originators cannot receive compensation based on commission. Instead, employee compensation must be based upon a salary or salary plus bonus structure.
These rules contain requirements designed to prohibit mortgage loan originators from “steering” consumers to loans that provide mortgage loan originators with greater compensation and other requirements concerning record-keeping.
These rules could delay Cole Taylor Mortgage’s geographic expansion in the first half of 2011 and perhaps through 2011 as we evaluate and implement the changes required by these rules.
Enforcement Powers of Our Bank Regulators; Prompt Corrective Action
Our regulatory authorities have broad authority to enforce the regulatory requirements to which we are subject. This enforcement authority includes, among other things, the power to compel higher reserves, the ability to assess civil money penalties, the ability to issue cease-and-desist, removal orders, and the ability to initiate injunctive actions. In general, these enforcement actions may be initiated for violations of laws and regulations or for unsafe or unsound banking practices. Other actions or inactions by the Company or the Bank may provide the basis for enforcement action, including misleading or untimely reports. Under the Federal Deposit Insurance Act (“FDIA”), all commonly controlled FDIC insured depository institutions may be held liable for any loss incurred by the FDIC resulting from a failure of, or any assistance given by the FDIC to, any commonly controlled institutions.
Federal banking regulators are also authorized and, under certain circumstances, required to take certain actions against institutions that fail to meet their capital requirements. Under the regulations, an institution is deemed to be (i) “well capitalized” if it has total risk-based capital of 10.0% or more, has a Tier 1 risk-based capital ratio of 6.0% or more, has a Tier 1 leverage capital ratio of 5.0% or more and is not subject to any order or final capital directive to meet and maintain a specific capital level for any capital measure; (ii) “adequately capitalized” if it has a total risk-based capital ratio of 8.0% or more, a Tier 1 risk-based capital ratio of 4.0% or more and a Tier 1 leverage capital ratio of 4.0% or more (3.0% under certain circumstances) and does not meet the definition of well capitalized; (iii) “undercapitalized” if it has a total risk-based capital ratio that is less than 8.0%, a tier 1 risk-based capital ratio that is less than 4.0% or a Tier 1 leverage capital ratio that is less than 4.0%
7
Table of Contents
(3.0% under certain circumstances); (iv) “significantly undercapitalized” if it has a total risk-based capital ratio that is less than 6.0%, a Tier 1 risk-based capital ratio that is less than 3.0% or a Tier 1 leverage capital ratio that is less than 3.0%; and (v) “critically undercapitalized” if it has a ratio of tangible equity to total assets that is equal to or less than 2.0%.
In certain situations, a federal banking agency may reclassify a well capitalized institution as adequately capitalized and may require an adequately capitalized or undercapitalized institution to comply with supervisory actions as if the institution were in the next lower category.
Under the prompt corrective action regulations, well capitalized institutions may generally operate without supervisory restriction. With respect to “adequately capitalized” institutions, such banks cannot normally pay dividends or make any capital contributions that would leave it undercapitalized; they cannot pay a management fee to a controlling person if, after paying the fee, it would be undercapitalized; and they cannot accept, renew or roll over any brokered deposit unless the bank has applied for and been granted a waiver by the FDIC. Once an adequately capitalized institution receives such a waiver, it may not pay an effective yield on any such deposit that exceeds by more than 75 basis points the local market rate or the national rate (which is determined and published by the FDIC and defined to be the “simple average of rates paid by all insured depository institutions and branches for which data are available”). As such, a less-than-well-capitalized institution that has received a waiver from the FDIC to accept, renew and rollover brokered deposits generally may not pay an interest rate on such brokered deposits in excess of the national rate plus 75 basis points.
The federal banking agencies are required to take action to restrict the activities of an “undercapitalized,” “significantly undercapitalized,” or “critically undercapitalized” insured depository institution. Any such bank must submit a capital restoration plan that is guaranteed by the parent holding company. Until such plan is approved, it may not increase its assets, acquire another institution, establish a branch or engage in any new activities, and generally may not make capital distributions.
Any institution that fails to comply with its capital plan or is “significantly undercapitalized” (i.e., Tier 1 risk-based or core capital ratios of less than 3% or a risk-based capital ratio of less than 6%) must be made subject to one or more of additional specified actions and operating restrictions mandated by the Federal Deposit Insurance Corporation Improvement Act of 1991. These actions and restrictions include requiring the issuance of additional voting securities, limitations on asset growth; mandated asset reduction; changes in senior management; divestiture, merger or acquisition of the association; restrictions on executive compensation; and any other action the appropriate federal banking agency deems appropriate. An institution that becomes “critically undercapitalized” is subject to further mandatory restrictions on its activities in addition to those applicable to significantly undercapitalized associations. In addition, the appropriate banking regulator must appoint a receiver (or conservator with the FDIC’s concurrence) for an institution, with certain limited exceptions, within 90 days after it becomes critically undercapitalized. Any undercapitalized institution is also subject to other possible enforcement actions, including the appointment of a receiver or conservator. The appropriate regulator is also generally authorized to reclassify an institution into a lower capital category and impose restrictions applicable to such category if the institution is engaged in unsafe or unsound practices or is in an unsafe or unsound condition.
Institutions must file a capital restoration plan with their regulators within 45 days of the date it receives a notice that it is “undercapitalized,” “significantly undercapitalized,” or “critically undercapitalized.” Compliance with a capital restoration plan must be guaranteed by a parent holding company. In addition, the IDFPR and Federal Reserve are permitted to take any one of a number of discretionary supervisory actions, including but not limited to the issuance of a capital directive and the replacement of senior executive officers and directors.
Finally, bank regulatory agencies have the ability to seek to impose higher than normal capital requirements known as individual minimum capital requirement (“IMCR”) for institutions with a high-risk profile.
8
Table of Contents
The Bank is considered to be “well-capitalized” under the prompt corrective regulations. The imposition of any of the measures described above for institutions that are less than “well capitalized” could have a substantial and material adverse effect on us and on our profitability and operations. Our Common stockholders do not have preemptive rights and, therefore, if we are directed by the IDFPR or the Federal Reserve to raise capital through the sale of additional shares of capital stock, such issuance may result in dilution in our stockholders’ percentage of ownership of the Company.
Standards for Safety and Soundness
The federal banking agencies have adopted the Interagency Guidelines for Establishing Standards for Safety and Soundness. The guidelines establish certain safety and soundness standards for all depository institutions. The operational and managerial standards in the guidelines relate to the following: (i) internal controls and information systems; (ii) internal audit systems; (iii) loan documentation; (iv) credit underwriting; (v) interest rate exposure; (vi) asset growth; (vii) compensation, fees and benefits; (viii) asset quality; and (ix) earnings. Rather than providing specific rules, the guidelines set forth basic compliance considerations and guidance with respect to a depository institution. Failure to meet the standards in the guidelines, however, could result in a request by the Bank’s regulators to provide a written compliance plan to demonstrate its efforts to come into compliance with such guidelines. Failure to provide a plan or to implement a provided plan requires the appropriate federal banking agency to issue an order to the institution requiring compliance.
Interstate Branching
Pursuant to the Riegle-Neal Interstate Banking and Branching Efficiency Act of 1994 (“Riegle-Neal Act”), an adequately capitalized and managed bank holding company may acquire banks in states other than its home state without regard to the permissibility of such acquisitions under state law, but remain subject to state requirements that a bank has been organized and operating for a period of time. Subject to certain other restrictions, the Riegle-Neal Act also authorizes banks to merge across state lines to create interstate branches. The Riegle-Neal Amendments Act of 1997 and the Regulatory Relief Act of 2006 provides further guidance on the application of host state laws to any branch located outside the host state.
Deposit Insurance Premiums
The Bank is a member of the DIF and pays an insurance premium to the fund based upon its assessable deposits on a quarterly basis. Deposits are insured up to applicable limits by the FDIC and such insurance is backed by the full faith and credit of the United States Government.
Under the Dodd-Frank Act, a permanent increase in deposit insurance was authorized to $250,000 (insurance coverage had previously been temporarily raised to that level until December 31, 2013). Generally, the coverage limit is per depositor, per insured depository institution.
The Dodd-Frank Act also set a new minimum DIF reserve ratio at 1.35% of estimated insured deposits. The FDIC is required to attain this ratio by September 30, 2020. In addition, the Dodd-Frank Act will have a significant impact on the calculation of deposit insurance assessment premiums going forward. Specifically, the Dodd-Frank Act generally requires the FDIC to define the deposit insurance assessment base for an insured depository institution as an amount equal to the institution’s average consolidated total assets during the assessment period minus average tangible equity. The FDIC has issued a proposed rulemaking notice that implements this change to the assessment calculation but has said that the new assessment rate schedule should result in the collection of assessment revenue that is approximately revenue neutral even though the new assessment based under the Dodd-Frank Act is larger than the current assessment base. Proposed assessment rates range from 2.5 basis points to 45 basis points.
The proposed FDIC rule also provides the FDIC’s board with the flexibility to adopt actual rates that are higher or lower than the total base assessment rates adopted without notice and comment if certain restrictions are met.
9
Table of Contents
The amount of the assessment is a function of the institution’s risk category, of which there are four, and assessment base. An institution’s risk category is determined according to its supervisory rating and capital level. The assessment rate for risk categories are calculated according to a formula, which relies on supervisory ratings and either certain financial ratios or long-term debt ratings. An insured bank’s assessment base is determined by the balance of its insured deposits. Because the system is risk-based, it allows banks to pay lower assessments to the FDIC as their capital level and supervisory ratings improve. By the same token, if these indicators deteriorate, the institution will have to pay higher assessments to the FDIC. Currently, deposit insurance premiums for FDIC-insured institutions range from 7 to 77.5 basis points per $100 of assessable deposits based upon assessment rates that are calculated based upon an institution’s levels of unsecured debt, secured liabilities and brokered deposits.
Under the FDIA, the FDIC Board has the authority to set the annual assessment rate range for the various risk categories within certain regulatory limits and to impose special assessments upon insured depository institutions when deemed necessary by the FDIC’s Board. The FDIC imposed an emergency special assessment on June 30, 2009, which was collected on September 30, 2009. In addition, in September 2009, the FDIC extended the Restoration Plan period to eight years. On November 12, 2009, the FDIC adopted a final rule requiring prepayment of 13 quarters of FDIC premiums.
FICO Assessments
DIF insured institutions pay a Financing Corporation (“FICO”) assessment in order to fund the interest on bonds issued in the 1980s in connection with the failures in the thrift industry. For the fourth quarter of 2010, the FICO assessment is equal to 1.04 basis points for each $100 in domestic deposits. These assessments will continue until the bonds mature in 2019.
The FDIC is authorized to conduct examinations of and require reporting by FDIC insured institutions. It is also authorized to terminate a depository bank’s deposit insurance upon a finding by the FDIC that the bank’s financial condition is unsafe or unsound or that the institution has engaged in unsafe or unsound practices or has violated any applicable rule, regulation, order or condition enacted or imposed by the bank’s regulatory agency.
Supervisory Assessments
All Illinois banks are required to pay supervisory assessments to the IDFPR to fund its operations. The amount of the assessment is calculated on the basis of the Bank’s total assets. During the year ended December 31, 2010, the Bank paid supervisory assessments to the IDFPR totaling $496,500.
Interagency Appraisal and Evaluation Guidelines
In December 2010, the federal banking agencies issued the Interagency Appraisal and Evaluation Guidelines. This guidance, which updated guidance originally issued in 1994, sets forth the minimum regulatory standards for appraisals. It incorporates previous regulatory issuances affecting appraisals, addresses advances in information technology used in collateral evaluation, and clarifies standards for use of analytical methods and technological tools in developing evaluations. This guidance also requires institutions to utilize strong internal controls to ensure reliable appraisals and evaluations and to monitor and periodically update valuations of collateral for existing real estate loans and transactions.
S.A.F.E. Act Registration Requirements
In connection with implementation of the Secure and Fair Enforcement for Mortgage Licensing Act of 2008, the federal banking agencies announced final rules in July 2010 to implement the provisions of the Act requiring employees of agency-related institutions to register with the Nationwide Mortgage Licensing System and Registry, a database created by the states to support the licensing of mortgage loan originators. Residential mortgage loan originators must register prior to originating residential mortgage loans.
10
Table of Contents
Community Reinvestment Act Requirements
The Bank is subject to periodic CRA review by our primary federal regulators. The CRA does not establish specific lending requirements or programs for financial institutions and does not limit the ability of such institutions to develop products and services believed best-suited for a particular community. Note that an institution’s CRA assessment can be used by its regulators in their evaluation of certain applications, including a merger or the establishment of a branch office. An unsatisfactory rating may be used as the basis for denial of such application.
The Bank underwent a CRA examination in January, 2010, for which it received an “outstanding” rating.
Transactions with Affiliates
The Bank must comply with Sections 23A and 23B of the Federal Reserve Act containing certain restrictions on its transactions with affiliates. In general terms, these provisions require that transactions between a banking institution or its subsidiaries and such institution’s affiliates be on terms as favorable to the institution as transactions with non-affiliates. In addition, these provisions contain certain restrictions on loans to affiliates, restricting such loans to a percentage of the institution’s capital. A covered “affiliate,” for purposes of these provisions, would include us and any other company that is under our common control.
The Dodd-Frank Act also included specific changes to the law related to the definition of “covered transaction” in Sections 23A and 23B and limitations on asset purchases from insiders. With respect to the definition of “covered transaction,” the Dodd-Frank Act now defines that term to include the acceptance of debt obligations issued by an affiliate as collateral for a bank’s loan or extension of credit to another person or company. In addition, a “derivative transaction” with an affiliate is now deemed to be a “covered transaction” to the extent that such a transaction causes a bank or its subsidiary to have a credit exposure to the affiliate. A separate provision of the Dodd-Frank Act states that an insured depository institution may not “purchase an asset from, or sell an asset to” a bank insider (or their related interests) unless (i) the transaction is conducted on market terms between the parties, and (ii) if the proposed transaction represents more than 10 percent of the capital stock and surplus of the insured institution, it has been approved in advance by a majority of the institution’s noninterested directors.
Additionally, certain transactions with our directors, officers or controlling persons are also subject to conflicts of interest regulations. Among other things, these regulations require that loans to such persons and their related interests be made on terms substantially the same as for loans to unaffiliated individuals and must not create an abnormal risk of repayment or other unfavorable features for the financial institution. See Notes to Consolidated Financial Statements, Note 4—Loans.
Government Monetary Policies and Economic Controls
Our earnings and growth, as well as the earnings and growth of the banking industry, are affected by the credit policies of monetary authorities, including the Federal Reserve. An important function of the Federal Reserve is to regulate the national supply of bank credit in order to combat recession and curb inflationary pressures. Among the instruments of monetary policy used by the Federal Reserve to implement these objectives are open market operations in U.S. government securities, changes in reserve requirements against member bank deposits, and changes in the Federal Reserve discount rate. These means are used in varying combinations to influence overall growth of bank loans, investments, and deposits, and may also affect interest rates charged on loans or paid for deposits. The monetary policies of the Federal Reserve authorities have had a significant effect on the operating results of commercial banks in the past and are expected to continue to have such an effect in the future.
In view of changing conditions in the national economy and in money markets, as well as the effect of credit policies by monetary and fiscal authorities, including the Federal Reserve, no prediction can be made as to
11
Table of Contents
possible future changes in interest rates, deposit levels, and loan demand, or their effect on our business and earnings or on the financial condition of our various customers.
Other Regulatory Authorities
In addition to regulation, supervision and examination by federal banking agencies, we and certain of our subsidiaries and affiliates are subject to other federal and state laws and regulations, and to supervision and examination by other regulatory and self governing authorities, including the SEC, the Financial Institution Regulatory Authority (FINRA), the NASDAQ Global Select Market and others.
Available Information
Our website is www.taylorcapitalgroup.com. We make available on our website under the caption “Stock Information,” free of charge, our annual reports on Form 10-K, quarterly reports on Form 10-Q, current reports on Form 8-K, and amendments to those reports as soon as reasonably practicable after we electronically file or furnish such materials to the Securities and Exchange Commission (“SEC”). Materials that we file or furnish to the SEC may also be read and copied at the SEC’s Public Reference Room at 100 F Street, N.E., Washington, D.C. 20549. Information on the operation of the Public Reference Room may be obtained by calling the SEC at 1-800-SEC-0330. Also, the SEC maintains a website at www.sec.gov that contains reports, proxy and information statements, and other information that we file electronically with the SEC.
You should read carefully and consider the following risks and uncertainties because they could materially and adversely affect our business, financial condition, results of operations and prospects.
Our business may be adversely affected by the highly regulated environment in which we operate.
We are subject to extensive federal and state regulation and supervision, which is primarily for the protection of depositors and customers rather than for the benefit of stockholders. As a bank holding company, we are subject to regulation and supervision primarily by the Federal Reserve. The Bank, as an Illinois-chartered member bank, is subject to regulation and supervision by the IDFPR and by the Federal Reserve. We undergo periodic examinations by our regulators, who have extensive discretion and power to prevent or remedy unsafe or unsound practices or violations of law by banks and bank holding companies. Our failure to comply with state and federal regulations can lead to, among other things, termination or suspension of our licenses, rights of rescission for borrowers, class action lawsuits and administrative enforcement actions. We cannot assure you that we will be able to fully satisfy the requirements imposed by the regulatory authorities that supervise us.
Further, we are significantly impacted by the policies of the Federal Reserve, whose monetary policies directly and indirectly influence the rate of interest earned on loans and paid on borrowings and interest-bearing deposits and can also affect the value of financial instruments we hold and the ability of borrowers to repay their loans, which could have a material adverse effect on our financial condition and results of operation.
We have not paid a dividend on our common stock since the second quarter of 2008. In addition, regulatory restrictions and liquidity constraints at the holding company level could impair our ability to make distributions on our outstanding securities.
Historically, our primary source of funds at the holding company level has been dividends received from the Bank. Currently, both we and the Bank have agreed to give notice to the Federal Reserve and the IDFPR prior to declaring a dividend on our common stock. In order to preserve capital, our Board of Directors suspended the payment of dividends on our common stock beginning in the second quarter of 2008. Current and future liquidity constraints at the holding company level could continue to impair our ability to declare and pay dividends or
12
Table of Contents
interest on our outstanding securities in the future. We also have agreed, consistent with our past practice, to continue to provide our regulators notice before we pay dividends and interest at the holding company.
The UST may also impose additional limitations on our ability to use funds we received from our participation in the Troubled Asset Relief Program (“TARP”) CPP, including the payment of dividends or interest on our outstanding securities. For example, we are currently prohibited from declaring or paying any dividends on our common stock without the UST’s consent until the earlier of November 21, 2012 or the date on which the UST no longer holds any shares of our Fixed Rate Cumulative Perpetual Preferred Stock, Series B, (“Series B Preferred”). If we are unable to pay dividends or interest on our outstanding securities in the future, the market value of such securities may be materially adversely affected.
Our regulators could require us to maintain additional regulatory capital.
At December 31, 2010, both we and our Bank were categorized as “well capitalized” under the regulatory capital framework. Our regulators have the ability to require us to maintain higher capital levels. If our regulators require the Bank to hold additional capital above the well capitalized level, we would either have to make an additional capital contribution to the Bank, have the Bank raise regulatory capital or reduce our asset levels. The inability to attract new capital investments or our ability to attract the capital on terms acceptable to us, could have a material adverse impact on our operations and financial position, including our ability to use net operating loss carry-forwards to reduce future income tax payments if we increase our capital levels and an ownership change is deemed to have occurred for income tax purposes.
Our allowance for loan losses may prove to be insufficient to absorb losses in our loan portfolio.
We maintain an allowance for loan losses to provide for loans in our portfolio that may not be repaid in their entirety. We believe that our allowance for loan losses is maintained at a level adequate to absorb probable losses inherent in our loan portfolio as of the corresponding balance sheet date. However, our allowance for loan losses may not be sufficient to cover actual loan losses, and future provisions for loan losses could materially adversely affect our operating results.
In evaluating the adequacy of our allowance for loan losses, we consider numerous quantitative factors, including our historical charge-off experience, growth of our loan portfolio, changes in the composition of our loan portfolio and the volume of delinquent and criticized loans. In addition, we use information about specific borrower situations, including their financial position and estimated collateral values under various liquidation scenarios, to estimate the risk and amount of loss for those borrowers. Finally, we also consider many qualitative factors, including general and economic business conditions, duration of the current business cycle, the impact of competition on our underwriting terms, current general market collateral valuations, trends apparent in any of the factors we take into account and other matters, which are by nature more subjective and fluid.
Our commercial loans and commercial real estate loans generally involve higher credit risk than residential real estate loans. Because payments on loans secured by commercial real estate or equipment are often dependent upon the successful operation and management of our customers’ businesses, repayment of such loans may be influenced to a great extent by the ability of our customers to execute on their business strategies and may be adversely impacted by adverse economic conditions in the markets we serve. If our customers are unable to successfully operate their businesses, our actual losses on our commercial loans may exceed our current estimates. Continued negative economic conditions also impacts our bank, bank holding company and lending institution clients with which we have commercial relationships, adversely impacting their ability to repay their loan obligations as agreed.
Our estimates of the risk of loss and amount of loss on any loan are exacerbated by the significant uncertainties surrounding not only our borrowers’ probability of default, but also the fair value of the underlying collateral. The current illiquidity in the real estate market has increased the uncertainty with respect to real estate
13
Table of Contents
values. Because of this degree of uncertainty and the sensitivity of any valuation to the underlying assumptions as to the method of collateral liquidation and the holding period until sale, our actual losses may significantly vary from our current estimates.
In addition, federal and state regulators periodically review the adequacy of our allowance for loan losses. Such regulators may require us to make additional provisions to the allowance, recognize additional loan charge-offs based upon their judgments about information available to them at the time of their examinations, or require us to reduce the level of nonperforming assets. Any such additional provisions for loan losses or charge-offs required by these regulatory agencies could have a material adverse effect on our financial condition and results of operations or result in decreased standing with our regulators, which may result in additional capital requirements.
We are subject to lending concentration risks.
We have focused on repositioning our portfolio to reduce our exposure to industries and sectors that we no longer consider economically desirable. As a business bank, our loan portfolio is comprised primarily of commercial loans to businesses. As of December 31, 2010, approximately 95% of our loan portfolio consisted of commercial loans of which approximately 40% are commercial real estate loans. Our commercial loans are typically larger in amount than loans to individual consumers and, therefore, have the potential for higher losses on an individual loan basis. Credit quality issues on larger commercial loans, if they were to occur, could cause greater volatility in reported credit quality performance measures, such as total impaired or nonperforming loans, and the amount of charge-offs and recoveries between periods. The deterioration of any one or a few of these loans may cause a significant increase in uncollectible loans, which would have a material adverse impact on our results of operations and financial condition.
New residential home sales continue to be at depressed levels, increasing financial stress on our real estate developer customers. Further deterioration in the credit quality of our Chicago real estate construction loans would have a material adverse effect on our financial condition and results of operations.
Our financial condition, results of operations and reputation would be materially adversely impacted if we are unable to respond effectively to unanticipated deposit volatility.
As a part of our liquidity management, we must ensure we can respond effectively to potential volatility in our customers’ deposit balances. Since 2008, we improved our liquidity position by increasing the amount of funding from our core customers in order to reduce reliance on brokered funding. We have customers that maintain significant deposit balances, the immediate withdrawal of which could have a material adverse affect on our daily liquidity management. In addition, the number of branches we maintain is small relative to our asset size, which could impact our ability to acquire deposits. We could encounter difficulty meeting a significant deposit outflow, in which case our capital position, reputation or profitability could be negatively affected. We primarily use advances from the Federal Home Loan Bank (“FHLB”) and Federal Reserve Bank (“FRB”), broker/dealer repurchase agreements and federal funds purchased to meet our immediate liquidity needs. If we fail to effectively manage the risk of deposit volatility, our business, financial condition and reputation could be materially adversely affected.
We must maintain our funding to support our operations and future growth and maintain appropriate levels of liquidity.
We must maintain access to sufficient funds to respond to the needs of our depositors and borrowers. As part of our liquidity management, we use a number of funding sources in addition to what is provided by in-market deposits and repayments and maturities of loans and investments. Although we have increased our funding from our core customers to reduce our reliance on wholesale funding, we continue to use brokered money market accounts and certificates of deposits, out-of-local-market certificates of deposit, broker/dealer repurchase agreements, federal funds purchased and FHLB and FRB advances as a source of liquidity.
14
Table of Contents
Under FDIC regulations, only “well-capitalized institutions” may issue brokered CDs without prior regulatory approval. The Bank is currently categorized as “well-capitalized” and, therefore, may continue to utilize this funding source. Brokered CD distributors may use other criteria in determining which banks to allow to issue brokered CDs through their distribution network. If our access to the brokered CD market were reduced in any material respect, it could lead to an inability to replace brokered deposits at maturity, which would result in higher costs to, or reduced asset levels at, the Bank.
Our holding company’s liquidity position is affected by the amount of cash and other liquid assets on hand, payment of interest and dividends on debt and equity instruments issued by the holding company, capital we inject into the Bank, redemption of debt issued by the holding company, proceeds we raise through the issuance of debt and equity instruments through the holding company, and dividends received from the Bank (if permitted). Our future liquidity position may be materially adversely affected if, in the future, one or a combination of the following events occur: the Bank reports net losses or its earnings are weak relative to our holding company’s cash flow needs; we deem it advisable or are required by our regulators to use cash at the holding company to support loan growth of the Bank or address other capital needs of the Bank through downstream capital injections; or we have difficulty raising cash at the holding company level through the issuance of debt or equity instruments or accessing additional sources of credit.
Given the losses recorded in 2009 and 2010 by the Bank and the resulting limitations imposed by our regulators on the ability of the Bank to pay dividends to our holding company, we are dependent upon our current cash position and cash proceeds generated by capital raises to meet our liquidity needs at the holding company level. If we foresee that the holding company will lack liquidity, we may, to the extent possible, seek to manage this risk by reducing the amount of capital we inject into the Bank. This may further reduce the capital position of the Bank and cause our growth to slow and may be subject to objection by our regulators.
Our participation in the TARP CPP may place significant restrictions on our operations.
Under the TARP CPP, our ability to declare or pay dividends on any of our shares is limited. Specifically, we are not permitted to pay dividends on our common stock without the UST’s approval until November 21, 2012, unless all of the outstanding shares of our Series B Preferred has been redeemed or transferred by the UST to unaffiliated third parties. In addition, our ability to repurchase our shares of our common stock and other securities is restricted. The consent of the UST generally is required for us to make any stock repurchases (other than in connection with the administration of any employee benefit plan in the ordinary course of business and consistent with past practice) until November 21, 2012, unless all of the outstanding shares of our Series B Preferred have been redeemed or transferred by the UST to unaffiliated third parties. Further, we may not repurchase shares of our common stock or shares of our 8.0% Non-Cumulative Convertible Perpetual Preferred Stock, Series C (“Series C Preferred”), Nonvoting Convertible Preferred Stock, Series D (“Series D Preferred”) and 8.0% Nonvoting, Non-Cumulative Convertible Perpetual Preferred Stock, Series E (“Series E Preferred”) if we are in arrears on the payment of Series B Preferred dividends.
Due to our participation in the TARP CPP, we are also subject to the UST’s current standards for executive compensation and corporate governance for the period during which the UST holds our Series B Preferred, as most recently set forth in the Interim Final Rule on TARP Standards for Compensation and Corporate Governance on June 10, 2009. The compensation standards apply to the five most highly compensated senior executive officers, including our Chief Executive Officer and our Chief Financial Officer, and the next 20 most highly compensated of our senior executive officers. The standards include (i) ensuring that incentive compensation plans and arrangements for senior executive officers do not encourage unnecessary and excessive risks that threaten our value or that encourage manipulation of reported earnings; (ii) a required clawback of any bonus or incentive compensation paid (or under a legally binding obligation to be paid) to a senior executive officer based on materially inaccurate financial statements, earnings, revenues, gains or other criteria; (iii) a prohibition on making “golden parachute payments” to senior executive officers and our next five most highly compensated employees; (iv) an agreement not to claim a deduction, for federal income tax purposes, for
15
Table of Contents
compensation paid to any of the senior executive officers in excess of $500,000 per year; (v) prohibitions on accruing and paying bonuses, retention awards and other incentive compensation to our five most highly paid employees other than restricted stock grants that do not fully vest during the TARP period, have a minimum 2-year vesting period and have a value of no more than one-third of the affected employee’s total annual compensation; (vi) retroactive review of bonuses, retention awards and other compensation paid to senior executive officers and our next 20 most highly compensated employees previously provided by TARP recipients if found by the UST to be inconsistent with the purposes of TARP or otherwise contrary to public interest; (vii) required establishment and posting of a company-wide policy regarding “excessive or luxury expenditures;” (viii) prohibitions on tax “gross ups” relating to severance, perquisites or other forms of compensation to the senior executive officers and our next 20 most highly compensated employees; (ix) disclosure of perquisites in excess of $25,000 that are paid to employees who are subject to bonus limitations; and (x) inclusion in a participant’s proxy statement for any annual stockholder meeting of a nonbinding “Say on Pay” stockholder vote on the compensation of executives. The restrictions on bonuses and incentive compensation in particular may result in us issuing additional shares of our common stock to compensate our executive officers that likely would result in dilution to our common stockholders, which would have an adverse impact on the market value of our common stock.
Fluctuations in interest rates could reduce our profitability.
We are subject to interest rate risk. We realize income primarily from the difference between interest earned on loans and investments and the interest incurred on deposits and borrowings. We expect that we will periodically experience imbalances in the interest rate sensitivities of our assets and liabilities and the relationships of various interest rates to each other. Over any period of time, our interest-earning assets may be more sensitive to changes in market interest rates than our interest-bearing liabilities, or vice versa. In addition, the individual market interest rates underlying our loan and deposit products (e.g., LIBOR and prime) may not change to the same degree over a given time period. If market interest rates should move contrary to our position, our earnings may be negatively affected. In addition, our loan volume and quality and deposit volume and mix can be affected by market interest rates. Changes in levels of market interest rates could materially adversely affect our net interest spread, asset quality, origination volume and overall profitability.
As part of our asset and liability management process, we perform sensitivity analysis to determine our exposure to changes in interest rate and develop strategies to mitigate this exposure. We attempt to mitigate our interest rate risk by managing the volume and mix of our earning assets and funding liabilities and using derivative financial instruments to hedge interest rate risk associated with specific hedged items. In a changing interest rate environment, we may not be able to manage this risk effectively. If we are unable to manage interest rate risk effectively or our hedge transactions are not effective in mitigating the intended risk, our business, financial condition and results of operations could be materially adversely affected.
Changes in our credit ratings could increase our financing costs or make it more difficult for us to obtain funding or capital on commercially acceptable terms.
We are rated by several different rating agencies, including Fitch, IDC, LACE and Bankrate.com. Adverse operating results and other factors may reduce our ratings with these agencies, which could subject us to negative publicity, adversely impact our ability to acquire or retain deposits and increase our cost of borrowing or limit our asset growth. Also, our credit ratings are an important factor to the institutions that provide our sources of liquidity, and reductions in our credit ratings could adversely affect our liquidity, increase our borrowing costs, limit our access to the capital markets or trigger unfavorable contractual obligations.
We may be adversely affected by the soundness of other financial institutions.
Financial services institutions are interrelated as a result of trading, clearing, counterparty, credit or other relationships. We regularly engage in transactions with counterparties in the financial services industry, including commercial banks, brokers and dealers, investment banks, and other institutional clients. These transactions may
16
Table of Contents
expose us to certain default risks. In certain circumstances, the collateral that we hold may be insufficient to cover such risks, resulting in losses that could have a material adverse affect on our business, financial condition and results of operations.
We are subject to certain operational risks, including, but not limited to, data processing system failures and errors and customer or employee fraud.
There have been a number of highly publicized cases involving fraud or other misconduct by employees of financial services firms in recent years. Misconduct by our employees could include hiding unauthorized activities from us, improper or unauthorized activities on behalf of our customers or improper use of confidential information. Employee fraud, errors and employee and customer misconduct could subject us to financial losses or regulatory sanctions and seriously harm our reputation. It is not always possible to prevent employee errors and misconduct, and the precautions we take to prevent and detect this activity may not be effective in all cases. Employee errors could also subject us to civil claims for negligence.
We maintain a system of internal controls and procedures designed to reduce the risk of loss from employee or customer fraud or misconduct and employee errors as well as insurance coverage to mitigate against operational risks, including data processing system failures and errors and customer or employee fraud. Should our internal controls fail to prevent or detect an occurrence, or if an occurrence is not insured or exceeds applicable insurance limits, it could have a material adverse effect on our business, financial condition or results of operations.
Our business is subject to the conditions of the local economy in which we operate and continued weakness in the local economy and the real estate markets may adversely affect our business.
Our success is dependent to a significant extent upon economic conditions in the Chicago area, where most of our loans are originated. The ongoing crisis caused by the current economic weakness in the Chicago area real estate market, unemployment, changes in housing market values, changes in securities markets or by inflation or other factors could continue to impact our customers and their ability to repay loans, the value of collateral securing our loans, and the stability of our deposits.
Our operating results have been negatively impacted by the continued historically high level of nonperforming loans in our commercial loan portfolio. Continued weakness in the Chicago area economy has had and may continue to have a material adverse affect on our business, financial condition and operating results, including higher provisions for loan losses and net loan charge-offs, lower net interest income caused by an increase in nonaccrual loans, and higher legal and collection costs. In addition, we may be required to continue to devote substantial additional attention and resources to nonperforming asset management rather than focusing on business growth activities. Continued adverse conditions in the local economy could also reduce demand for new loans and impair our ability to attract and retain deposits.
Our business is subject to domestic and international economic conditions and other factors, many of which are beyond our control and could adversely affect our business.
Our business is affected by domestic and international factors that are beyond our control, including economic, political and market conditions, broad trends in industry and finance, legislative and regulatory changes (including those as a result of the new Dodd-Frank Act), competition, changes in government monetary and fiscal policies, and consolidation within our customer base and within our industry. Because of uncertainty in the market, certain lenders and institutional investors have reduced and, in some cases, ceased to provide funding to borrowers, including to other financial institutions because of concern about the stability of the financial markets and the strength of counterparties. Any resulting lack of available credit or any lack of confidence in the banking and financial sector, decreased consumer confidence, increased volatility in the financial markets and reduced business activity could materially and adversely affect our business, financial condition and results of operations.
17
Table of Contents
Competition from financial institutions and other financial services providers may adversely affect our growth and profitability.
We operate in a highly competitive industry and experience intense competition from other financial institutions in our market. We compete with these institutions in making loans, attracting deposits and recruiting and retaining talented people. We have observed that the competition in our market for making commercial loans has resulted in more competitive pricing and credit structure, as well as intense competition for qualified commercial lending officers. We also may face a competitive disadvantage as a result of our smaller size, limited branch network, narrower product offerings and lack of geographic diversification. Although our competitive strategy is to provide a distinctly superior customer and employee experience, we can give no assurance that this strategy will be successful. Our growth and profitability depend on our continued ability to compete effectively within our market area.
Our business strategy is dependent on our continued ability to attract, develop and retain highly qualified and experienced personnel in senior management and customer relationship positions.
We believe our future success is dependent, in part, on our ability to attract and retain highly qualified and experienced personnel in key senior management and other positions. Our competitive strategy is to provide each of our commercial customers with a highly qualified relationship manager that will serve as the customer’s key point of contact with us. Achieving the status of a “trusted advisor” for our customers also requires that we minimize relationship manager turnover and provide stability to the customer relationship. Competition for experienced personnel is intense, and we may not be able to successfully retain and attract such personnel.
Our recent operating losses have reduced our cash-based incentive awards. In addition, our participation in the TARP CPP program places limits on executive compensation. While we have not recently experienced significant employee turnover, the inability to retain and attract key personnel could negatively impact our operations.
New lines of business or new products and services may subject us to certain additional risks.
From time to time, we will consider and may enter into new lines of business or offer new products or services. These activities can involve a number of uncertainties, risks and expenses, including the investment of significant time and resources, and we can give no assurance that our projected price and profitability targets will be attainable or that our efforts will be successful. These initiatives could also require us to enter geographical markets that are new to us. In addition, new lines of business and new products and services could significantly impact the effectiveness of our system of internal controls, and present requirements for legal compliance with which we were previously unfamiliar. Failure to successfully manage these risks could have a material adverse affect on our business, results of operations and financial condition.
We may experience difficulties in managing our growth.
Our future success depends on our achieving growth in commercial banking relationships that result in increased commercial loans outstanding at yields that are profitable to us. Achieving our growth targets requires us to attract customers who currently bank at other financial institutions in our market, thereby increasing our share of the market. Our strategy is to provide a local, high-touch relationship servicing experience that we believe is attractive to customers in our marketplace. In addition, we actively pursue high quality relationship managers to extend our reach in the market place. Although we believe that we have the necessary resources in place to successfully manage our future growth, our growth strategy exposes us to certain risks and expenses, and we cannot assure you that we will be able to expand our market presence or that any such expansion will not adversely affect our results of operations.
18
Table of Contents
Our strategy for future growth also may place a significant strain on our management, personnel, systems and resources. Maintaining credit quality while growing our loan portfolio is critical to achieving and sustaining profitable growth. We may not be able to manage our growth effectively. If we fail to do so, our business would be materially harmed.
In furtherance of our growth strategy, we may also seek to acquire other financial institutions or parts of those institutions in the future, and we may engage in banking center expansion. In connection with future acquisitions, we may issue equity securities which could cause ownership and economic dilution to our current stockholders. Moreover, we cannot assure you that our regulators will permit us to implement an acquisition strategy. Furthermore, there is no assurance that, following any future mergers or acquisitions, our integration efforts will be successful or that, after giving effect to the acquisition, we will achieve a level of profitability that will justify the investment that we made in any such acquisition.
We are subject to security risks relating to our internet banking activities that could damage our reputation and our business.
Security breaches in our internet banking activities could expose us to possible liability and damage our reputation. Any compromise of our security also could deter customers from using our internet banking services that involve the transmission of confidential information. We rely on standard internet security systems to provide the security and authentication necessary to effect secure transmission of data. These precautions may not protect our systems from compromises or breaches of our security measures that could result in damage to our reputation and our business.
Our reputation could be damaged by negative publicity.
Reputational risk, or the risk to our business, earnings and capital from negative publicity, is inherent in our business. Negative publicity can result from actual or alleged conduct in a number of areas, including legal and regulatory compliance, lending practices, corporate governance, litigation, inadequate protection of customer data, ethical behavior of our employees, and from actions taken by regulators, ratings agencies and others as a result of that conduct. Damage to our reputation could impact our ability to attract new or maintain existing loan and deposit customers, employees, and business relationships.
Our principal offices are located at our Corporate Center at 9550 West Higgins Road, Rosemont, Illinois. We lease approximately 112,000 square feet for our Corporate Center under an operating lease that expires on August 31, 2014, with two five-year renewal options which could extend the lease to 2024. We also have an approximately 4,000 square foot banking center on the first floor of our Corporate Center.
We also maintain approximately 36,000 square feet of general office space for our administrative offices in downtown Chicago at 225 West Washington under an operating lease with a 15-year term and two five-year renewal options which could extend the lease to 2032.
We currently have nine banking centers located in the Chicago area. Of the nine banking center locations, we own five of the buildings from which the banking centers are operated, including our Ashland, Skokie, Yorktown, Old Orchard, and Milwaukee locations. We lease the land under the buildings at Yorktown, Old Orchard and Milwaukee. We lease the buildings for our Wheeling (term to February 2015), Burbank (term to June 2014), Rosemont (term to August 2014), and South Clark (term to June 2018) banking facilities.
19
Table of Contents
The following is a list of our administrative and customer banking locations:
| Facility |
Address |
Square Feet |
||||
| Corporate Center |
9550 West Higgins Road, Rosemont, Illinois | 112,212 | ||||
| West Washington |
225 West Washington, Chicago, Illinois | 35,931 | ||||
| Milwaukee |
1965 North Milwaukee, Chicago, Illinois | 27,394 | ||||
| Burbank |
5501 West 79th Street, Burbank, Illinois | 14,807 | ||||
| Skokie |
4400 West Oakton, Skokie, Illinois | 15,800 | ||||
| Old Orchard |
Golf Road and Skokie Boulevard, Skokie, Illinois | 10,000 | ||||
| Wheeling |
350 East Dundee Road, Wheeling, Illinois | 8,274 | ||||
| Ashland |
1542 W. 47th Street, Chicago, Illinois | 6,000 | ||||
| Yorktown |
Three Yorktown Center, Lombard, Illinois | 5,966 | ||||
| South Clark |
20 South Clark, Chicago, Illinois | 2,700 | ||||
We have expanded our asset-based lending services and opened offices in geographical areas outside the Chicago area. Currently, we maintain offices in Kansas City, Missouri; Brookfield, Wisconsin; Baltimore, Maryland; Irvine, California; Stamford, Connecticut; New York, New York and Atlanta, Georgia. Each of these offices operates under short-term operating leases.
The principal administrative offices of our new residential mortgage loan originations line of business are located in two facilities located across the street from each other in Hamburg, Michigan. The first is an 8,000 square foot facility which has a lease expiring in November 2014, but can be terminated at any time with four month notice. The second is an 8,000 square foot facility which has a lease expiring in July 2014, but can be terminated in July 2012 with four months notice. The mortgage division also has smaller retail offices located in Ann Arbor and Northville, Michigan; Louisville and Lexington, Kentucky; Lancaster and Maple Glen, Pennsylvania; Champaign, Illinois and Long Island, New York. These spaces are subleased by Cole Taylor Bank and cancellable with 30 days notice.
We are a party to litigation from time to time arising in the normal course of business. As of the date of this annual report, management knows of no threatened or pending legal action against us that is likely to have a material adverse effect on our business, financial condition or results of operations.
20
Table of Contents
TAYLOR CAPITAL GROUP, INC.
PART II
Item 5. Market for Registrant’s Common Equity, Related Stockholder Matters and Issuer Purchases of Equity Securities.
Our common stock trades on the Nasdaq Global Select Market under the symbol “TAYC”. The high and low sales price per share of our common stock for the periods indicated is set forth below:
| High | Low | |||||||
| 2010 |
||||||||
| Quarter Ended March 31 |
$ | 13.23 | $ | 7.82 | ||||
| Quarter Ended June 30 |
18.05 | 11.00 | ||||||
| Quarter Ended September 30 |
13.50 | 9.36 | ||||||
| Quarter Ended December 31 |
13.38 | 11.19 | ||||||
| 2009 |
||||||||
| Quarter Ended March 31 |
$ | 8.69 | $ | 2.82 | ||||
| Quarter Ended June 30 |
7.65 | 2.64 | ||||||
| Quarter Ended September 30 |
7.48 | 6.24 | ||||||
| Quarter Ended December 31 |
11.50 | 5.19 | ||||||
As of March 15, 2011, the closing price per share of our common stock as reported on the Nasdaq was $10.09.
As of March 15, 2011, there were 174 stockholders of record of the common stock, based upon securities position listings furnished to us by our transfer agent. We believe the number of beneficial owners is greater than the number of record holders because a large portion of our common stock is held of record through brokerage firms in “street name”.
There have been no dividends declared on our common stock for any quarter in 2010 and 2009. Holders of our common stock are entitled to receive any cash dividends that may be declared by our Board of Directors. In connection with our participation in TARP CPP and the issuance of our Series B Preferred, we need the consent of the UST before we can pay any dividends on our common stock. Subject to such restrictions, the declaration and payment of future dividends to holders of our common stock will be at the discretion of our Board of Directors and will depend upon our earnings and financial condition, the capital requirements of the Company and our subsidiaries, regulatory conditions and considerations and other factors as our Board of Directors may deem relevant. We also have agreed, consistent with our past practice, to continue to provide our regulators notice before we pay dividends and interest at the holding company.
As a bank holding company, we are ultimately dependent upon the Bank to provide funding for our operating expenses, debt service and dividends. Various banking laws applicable to the Bank limit the payment of dividends, management fees and other distributions by the Bank to us, and may, therefore, limit our ability to pay dividends on our common stock. Because of recent operating losses, our Bank does not have the ability to pay us dividends without regulatory approval, and we do not expect that our Bank will be able to pay dividends to us in the near-term. We will also be prohibited from paying dividends on our common stock if we fail to make distributions or required payments on the trust preferred securities and our outstanding preferred stock. See “Management’s Discussion and Analysis of Financial Condition and Results of Operation–Liquidity” for additional details of restrictions on our ability to pay dividends and the ability of the Bank to pay dividends to us.
21
Table of Contents
Stock Performance Graph
The graph below compares our cumulative stockholder return on our common stock from December 31, 2005 through December 31, 2010, with the composite index for all U.S. companies included in the Nasdaq Stock Market and the SNL Nasdaq Stock Market Bank Index. The source for the information below is SNL Financial LC, Charlottesville, VA.
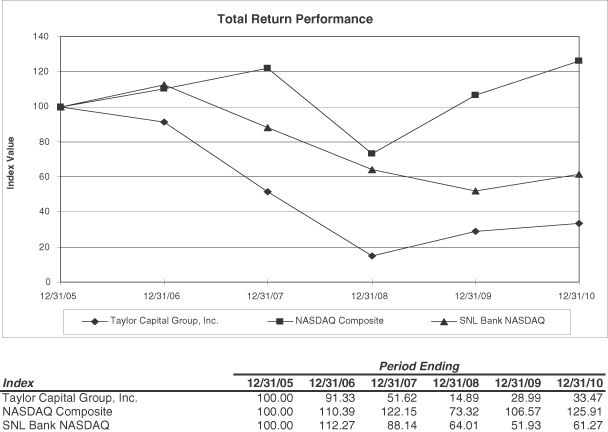
This graph is not deemed to be “soliciting material” or to be “filed” with the SEC or subject to the SEC’s proxy rules or to the liabilities of Section 18 of the Exchange Act, and the graph shall not be deemed to be incorporated by reference into any prior or subsequent filing by us under the Securities Act or the Exchange Act.
22
Table of Contents
Item 6. Selected Financial Data
The selected consolidated financial data presented below under the caption “Taylor Capital Group, Inc.” as of and for the five years ended December 31, 2010 is derived from our historical financial statements. The selected financial information presented below under the caption of “Cole Taylor Bank” is derived from unaudited financial statements of the Bank or from the audited consolidated financial statements of Taylor Capital Group, Inc. You should read this information in conjunction with “Management’s Discussion and Analysis of Financial Condition and Results of Operations” and our consolidated financial statements and the related notes included elsewhere in this annual report. Results from past periods are not necessarily indicative of results that may be expected for any future period.
| Year Ended December 31, | ||||||||||||||||||||
| 2010 | 2009 | 2008 | 2007 | 2006 | ||||||||||||||||
| (dollars in thousands, except per share data) | ||||||||||||||||||||
| TAYLOR CAPITAL GROUP, INC. (consolidated): |
||||||||||||||||||||
| Statements of Operations Data: |
||||||||||||||||||||
| Net interest income |
$ | 136,074 | $ | 122,911 | $ | 92,351 | $ | 104,705 | $ | 111,192 | ||||||||||
| Provision for loan losses |
143,127 | 89,611 | 144,158 | 31,900 | 6,000 | |||||||||||||||
| Net interest income (loss) after provision for loan losses |
(7,053 | ) | 33,300 | (51,807 | ) | 72,805 | 105,192 | |||||||||||||
| Noninterest income: |
||||||||||||||||||||
| Service charges |
11,282 | 11,306 | 9,136 | 7,709 | 7,738 | |||||||||||||||
| Trust and investment management fees |
768 | 1,697 | 3,578 | 3,864 | 4,155 | |||||||||||||||
| Mortgage origination revenue |
14,261 | — | — | — | — | |||||||||||||||
| Gain (loss) on investment securities |
41,376 | 17,595 | (2,399 | ) | — | — | ||||||||||||||
| Other noninterest income |
4,996 | 2,993 | 2,122 | 5,138 | 4,372 | |||||||||||||||
| Total noninterest income |
72,683 | 33,591 | 12,437 | 16,711 | 16,265 | |||||||||||||||
| Noninterest expense: |
||||||||||||||||||||
| Salaries and employee benefits |
54,073 | 42,914 | 47,855 | 37,771 | 40,652 | |||||||||||||||
| Goodwill impairment |
— | — | — | 23,237 | — | |||||||||||||||
| Other noninterest expense |
64,163 | 54,693 | 45,515 | 33,517 | 32,607 | |||||||||||||||
| Total noninterest expense |
118,236 | 97,607 | 93,370 | 94,525 | 73,259 | |||||||||||||||
| Income (loss) before income taxes |
(52,606 | ) | (30,716 | ) | (132,740 | ) | (5,009 | ) | 48,198 | |||||||||||
| Income tax expense (benefit) |
1,217 | 834 | (8,212 | ) | 4,561 | 2,035 | ||||||||||||||
| Net income (loss) |
(53,823 | ) | (31,550 | ) | (124,528 | ) | (9,570 | ) | 46,163 | |||||||||||
| Preferred dividends and discounts |
(25,455 | ) | (11,483 | ) | (18,830 | ) | — | — | ||||||||||||
| Net income (loss) applicable to common stockholders |
$ | (79,278 | ) | $ | (43,033 | ) | $ | (143,358 | ) | $ | (9,570 | ) | $ | 46,163 | ||||||
| Common Share Data: |
||||||||||||||||||||
| Basic earnings (loss) per share |
$ | (5.27 | ) | $ | (4.10 | ) | $ | (13.72 | ) | $ | (0.89 | ) | $ | 4.17 | ||||||
| Diluted earnings (loss) per share |
(5.27 | ) | (4.10 | ) | (13.72 | ) | (0.89 | ) | 4.12 | |||||||||||
| Cash dividends per common share |
— | — | 0.10 | 0.40 | 0.28 | |||||||||||||||
| Book value per common share |
3.97 | 9.02 | 13.47 | 24.10 | 24.36 | |||||||||||||||
| Dividend payout ratio |
NM | N.M. | N.M. | N.M. | 6.75 | % | ||||||||||||||
| Weighted average shares – basic earnings per share |
15,049,868 | 10,492,911 | 10,450,177 | 10,782,316 | 10,940,162 | |||||||||||||||
| Weighted average shares – diluted earnings per share |
15,049,868 | 10,492,911 | 10,450,177 | 10,782,316 | 11,118,818 | |||||||||||||||
| Shares outstanding – end of year |
17,877,708 | 11,076,707 | 11,115,936 | 10,551,994 | 11,131,059 | |||||||||||||||
23
Table of Contents
| Year Ended December 31, | ||||||||||||||||||||
| 2010 | 2009 | 2008 | 2007 | 2006 | ||||||||||||||||
| (dollars in thousands, except per share data) | ||||||||||||||||||||
| TAYLOR CAPITAL GROUP, INC. (consolidated): |
||||||||||||||||||||
| Balance Sheet Data (at end of year): |
||||||||||||||||||||
| Total assets |
$ | 4,483,854 | $ | 4,403,502 | $ | 4,388,889 | $ | 3,556,463 | $ | 3,379,667 | ||||||||||
| Investment securities |
1,254,477 | 1,271,271 | 1,094,594 | 892,371 | 669,085 | |||||||||||||||
| Total loans |
3,094,358 | 3,035,328 | 3,233,261 | 2,533,333 | 2,500,685 | |||||||||||||||
| Allowance for loan losses |
124,568 | 106,185 | 128,548 | 54,681 | 37,516 | |||||||||||||||
| Goodwill |
— | — | — | — | 23,237 | |||||||||||||||
| Total deposits |
3,026,906 | 2,976,800 | 3,131,046 | 2,580,192 | 2,639,927 | |||||||||||||||
| Other borrowings |
511,008 | 337,669 | 275,560 | 389,054 | 262,319 | |||||||||||||||
| Notes payable and other advances |
505,000 | 627,000 | 462,000 | 205,000 | 80,000 | |||||||||||||||
| Junior subordinated debentures |
86,607 | 86,607 | 86,607 | 86,607 | 86,607 | |||||||||||||||
| Subordinated notes, net |
88,835 | 55,695 | 55,303 | — | — | |||||||||||||||
| Preferred stock |
137,893 | 158,844 | 157,314 | — | — | |||||||||||||||
| Common stockholders’ equity |
70,908 | 99,962 | 149,773 | 254,256 | 271,192 | |||||||||||||||
| Total stockholders’ equity |
208,801 | 258,806 | 307,087 | 254,256 | 271,192 | |||||||||||||||
| Earnings Performance Data: |
||||||||||||||||||||
| Return (loss) on average assets |
(1.20 | )% | (0.70 | )% | (3.27 | )% | (0.28 | )% | 1.40 | % | ||||||||||
| Return (loss) on average stockholders’ equity |
(19.54 | ) | (10.74 | ) | (51.01 | ) | (3.47 | ) | 19.55 | |||||||||||
| Net interest margin (non tax-equivalent) (1) |
3.12 | 2.77 | 2.46 | 3.22 | 3.49 | |||||||||||||||
| Noninterest income to revenues |
25.85 | 13.24 | 5.73 | 6.86 | 6.86 | |||||||||||||||
| Efficiency ratio (2) |
70.64 | 70.27 | 87.11 | 77.85 | 57.48 | |||||||||||||||
| Loans to deposits |
102.23 | 101.97 | 103.26 | 98.18 | 94.72 | |||||||||||||||
| Average interest-earning assets to average interest-bearing liabilities |
122.59 | 125.32 | 120.66 | 122.78 | 122.42 | |||||||||||||||
| Ratio of earnings to fixed charges: (3) |
||||||||||||||||||||
| Including interest on deposits |
0.25 | x | 0.59 | x | (0.16 | )x | 0.96 | x | 1.43 | x | ||||||||||
| Excluding interest on deposits |
(0.47 | )x | (0.00 | )x | (3.63 | )x | 0.82 | x | 2.92 | x | ||||||||||
| Asset Quality Ratios: |
||||||||||||||||||||
| Allowance for loan losses to total loans (excluding loans held for sale) |
4.39 | % | 3.60 | % | 3.98 | % | 2.16 | % | 1.50 | % | ||||||||||
| Allowance for loan losses to nonperforming loans (4) |
77.98 | 75.06 | 64.15 | 72.27 | 113.15 | |||||||||||||||
| Net loan charge-offs to average total loans |
4.11 | 3.53 | 2.52 | 0.59 | 0.25 | |||||||||||||||
| Nonperforming assets to total loans plus repossessed property (5) |
6.12 | 5.48 | 6.58 | 3.09 | 1.34 | |||||||||||||||
| Capital Ratios: |
||||||||||||||||||||
| Total stockholders’ equity to assets – end of year |
4.66 | % | 5.88 | % | 7.00 | % | 7.15 | % | 8.02 | % | ||||||||||
| Average stockholders’ equity to average assets |
6.13 | 6.55 | 6.41 | 8.21 | 7.18 | |||||||||||||||
| Leverage ratio |
6.89 | 7.60 | 8.73 | 9.40 | 10.17 | |||||||||||||||
| Tier 1 Capital ratio |
8.93 | 9.79 | 10.22 | 11.44 | 12.10 | |||||||||||||||
| Total Capital ratio |
12.98 | 12.72 | 13.02 | 12.74 | 13.35 | |||||||||||||||
| COLE TAYLOR BANK: |
||||||||||||||||||||
| Net income (loss) |
$ | (44,721 | ) | $ | (23,977 | ) | $ | (117,196 | ) | $ | (2,971 | ) | $ | 40,247 | ||||||
| Return (loss) on average assets |
(.10 | )% | (0.54 | )% | (3.08 | )% | (0.09 | )% | 1.22 | % | ||||||||||
| Stockholder’s equity to assets – end of year |
6.53 | 6.95 | 7.36 | 8.82 | 9.38 | |||||||||||||||
| Leverage ratio |
7.05 | 6.77 | 7.11 | 8.74 | 9.04 | |||||||||||||||
| Tier 1 Capital ratio |
9.13 | 8.73 | 8.32 | 10.62 | 10.76 | |||||||||||||||
| Total Capital ratio |
12.04 | 11.64 | 11.12 | 11.88 | 12.01 | |||||||||||||||
| N.M. | Not Meaningful |
| (1) | Net interest margin is determined by dividing net interest income, as reported, by average interest-earning assets. |
| (2) | The efficiency ratio is determined by dividing noninterest expense by an amount equal to net interest income plus noninterest income, adjusted for gains or losses on investment securities. |
| (3) | For purposes of calculating the ratio of earnings to fixed charges, earnings consist of earnings (loss) before income taxes plus interest and rent expense. Fixed charges consist of interest expense, rent expense and preferred stock dividend requirements. |
| (4) | Nonperforming loans consist of nonaccrual loans and loans contractually past due 90 days or more but still accruing interest. |
| (5) | Nonperforming assets consist of nonperforming loans and other real estate owned and other repossessed assets. |
24
Table of Contents
Item 7. Management’s Discussion and Analysis of Financial Condition and Results of Operations
Introduction
We are a bank holding company headquartered in Rosemont, Illinois, a suburb of Chicago, and we derive substantially all of our revenue from our wholly-owned subsidiary, Cole Taylor Bank. We provide a range of products and services primarily to closely-held commercial businesses and their owner operators in the Chicago area. We also provide asset-based lending and residential mortgage origination services through offices both in Chicago and in other geographic markets. At December 31, 2010, we had assets of approximately $4.5 billion, deposits of approximately $3.0 billion and stockholders equity of $208.8 million.
The following discussion and analysis presents our consolidated financial condition at December 31, 2010 and December 31, 2009 and the results of operations for the years ended December 31, 2010, December 31, 2009, and December 31, 2008. This discussion should be read together with the “Selected Consolidated Financial Data,” our audited consolidated financial statements and the notes thereto and other financial data contained elsewhere in this annual report. In addition to the historical information provided below, we have made certain estimates and forward-looking statements that involve risks and uncertainties. Our actual results could differ significantly from those anticipated in these estimates and forward-looking statements as a result of certain factors, including those discussed in the section captioned “Risk Factors” and elsewhere in this Annual Report on Form 10-K.
Application of Critical Accounting Policies
Our accounting and reporting policies conform to accounting principles generally accepted in the United States of America and general reporting practices within the financial services industry. For additional details, see “Notes to Consolidated Financial Statements—Summary of Significant Accounting and Reporting Policies” from our audited financial statements contained elsewhere in this Annual Report.
The preparation of financial statements in conformity with these accounting principles requires management to make estimates, assumptions and judgments that affect the amounts reported in the consolidated financial statements and accompanying notes. These estimates, assumptions and judgments are based on information available to us as of the date of the consolidated financial statements and, accordingly, as this information changes, actual results could differ from the estimates, assumptions and judgments reflected in the financial statements. The estimates, assumptions and judgments made by us are based upon historical experience or other factors that we believe to be reasonable under the circumstances. Certain accounting policies inherently have greater reliance on the use of estimates, assumptions and judgments, and as such, have a greater possibility of producing results that could be materially different than originally reported. We consider our policies for the allowance for loan losses, the realizability of deferred tax assets, derivatives used in hedging and the valuation of financial instruments such as investment securities and derivatives to be critical accounting policies.
The following accounting policies materially affect our reported earnings and financial condition and require significant estimates, assumptions and judgments.
Allowance for Loan Losses
We have established an allowance for loan losses to provide for loans in our portfolio that may not be repaid in their entirety. The allowance is based on our regular, quarterly assessments of the probable estimated losses inherent in our loan portfolio. Our methodology for measuring the appropriate level of the allowance relies on several key elements, which include a general allowance computed by applying loss factors to categories of loans outstanding in the portfolio and specific allowances for identified problem loans and portfolio categories. We maintain our allowance for loan losses at a level that we consider sufficient to absorb probable losses inherent in our portfolio as of the balance sheet date. In evaluating the adequacy of our allowance for loan losses, we consider numerous quantitative factors, including historical charge-off experience, changes in the size of our loan
25
Table of Contents
portfolio, changes in the composition of our loan portfolio and the volume of delinquent and criticized loans. In addition, we use information about specific borrower situations, including their financial position, work-out plans and estimated collateral values under various liquidation scenarios to estimate the risk and amount of loss on loans to those borrowers. Finally, we also consider many qualitative factors, including general and economic business conditions, duration of the current business cycle, the impact of competition on our underwriting terms, current general market collateral valuations, trends apparent in any of the factors we take into account and other matters, which are by nature more subjective and fluid. Our estimates of risk of loss and amount of loss on any loan are complicated by the uncertainties surrounding not only our borrowers’ probability of default, but also the fair value of the underlying collateral. The current illiquidity in the Chicago area real estate market has increased the uncertainty with respect to real estate values. Because of the degree of uncertainty and the sensitivity of valuations to the underlying assumptions regarding holding period until sale and the collateral liquidation method, our actual losses may materially vary from our current estimates.
Our loan portfolio is comprised primarily of commercial loans to businesses. These loans are inherently larger in amount than loans to individual consumers and, therefore, have the potential for higher losses for each loan. These larger loans can cause greater volatility in our reported credit quality performance measures, such as total impaired or nonperforming loans. Our current credit risk rating and loss estimate for any one loan may have a material impact on our reported impaired loans and related loss estimates. Because our loan portfolio contains a significant number of commercial loans with relatively large balances, the deterioration of any one or a few of these loans can cause an increase in uncollectible loans and, therefore, our allowance for loan losses. We review our estimates on a quarterly basis and, as we identify changes in estimates, our allowance for loan losses is adjusted through the recording of a provision for loan losses.
Income Taxes
We maintained net deferred tax assets for deductible temporary differences between book and taxable income, the largest of which relates to the allowance for loan losses. For income tax return purposes, only net charge-offs are deductible, not the provision for loan losses. Under GAAP, a deferred tax asset valuation allowance is required to be recognized if it is “more likely than not” that the deferred tax asset will not be realized. The determination of the realizability of the deferred tax assets is highly subjective and dependent upon judgment concerning management’s evaluation of both positive and negative evidence, the forecasts of future taxable income, applicable tax planning strategies, and assessments of current and future economic and business conditions. We consider both positive and negative evidence regarding the ultimate realizability of our deferred tax assets. Examples of positive evidence may include the existence, if any, of taxes paid in available carry-back years and the likelihood that taxable income will be generated in future periods. Examples of negative evidence may include a cumulative loss in the current year and prior two years and negative general business and economic trends. We currently maintain a valuation allowance against substantially all of our net deferred tax assets because it is more likely than not that all of these deferred tax assets will not be realized. This determination was based, largely, on the negative evidence of a cumulative loss in the most recent three year period caused primarily by the loan loss provisions made during those periods. In addition, general uncertainty surrounding future economic and business conditions has increased the likelihood of fluctuations in our future earnings.
Derivative Financial Instruments
We use derivative financial instruments (“derivatives”), including interest rate exchange and corridor agreements, as well as interest rate lock and forward loan sale commitments to either accommodate individual customer needs or to assist in our interest rate risk management. All derivatives are measured and reported at fair value on our Consolidated Balance Sheets as either an asset or a liability. For derivatives that are designated and qualify as a fair value hedge, the gain or loss on the derivative, as well as the offsetting loss or gain on the hedged item attributable to the effective portion of the hedged risk, are recognized in current earnings during the period of the change in the fair values. For derivatives that are designated and qualify as a cash flow hedge, the
26
Table of Contents
effective portion of the gain or loss on the derivative is reported as a component of other comprehensive income and reclassified into earnings in the same period or periods during which the hedged transaction affects earnings. For all hedging relationships, derivative gains and losses that are not effective in hedging the changes in fair value or expected cash flows of the hedged item are recognized immediately in current earnings during the period of the change in fair value. Similarly, the changes in the fair value of derivatives that do not qualify for hedge accounting or are not designated as an accounting hedge are also reported currently in earnings.
At the inception of a formally designated hedge and quarterly thereafter, an assessment is made to determine whether changes in the fair values or cash flows of the derivatives have been highly effective in offsetting the changes in the fair values or cash flows of the hedged item and whether they are expected to be highly effective in the future. If it is determined that derivatives are not highly effective as a hedge, hedge accounting is discontinued for the period. Once hedge accounting is terminated, all changes in fair value of the derivatives flow through the consolidated statements of operations in other noninterest income, which results in greater volatility in our earnings.
The estimates of fair values of certain of our derivative instruments, such as interest rate swaps and corridors, are calculated using independent valuation models to estimate market-based valuations. The valuations are determined using widely accepted valuation techniques, including discounted cash flow analysis of the expected cash flow of each derivative. This analysis reflects the contractual terms of the derivative and uses observable market-based inputs, including interest rate curves and implied volatilities. In addition, the fair value estimate also incorporates a credit valuation adjustment to reflect the risk of nonperformance by both us and our counterparties in the fair value measurement. The resulting fair values produced by these proprietary valuation models are in part theoretical and, therefore, can vary between derivative dealers and are not necessarily reflective of the actual price at which the derivative contract could be traded. Small changes in assumptions can result in significant changes in valuation. The risks inherent in the determination of the fair value of a derivative may result in volatility in our earnings.
Valuation of Investment Securities
The fair value of our investment securities portfolio is determined in accordance with GAAP, which requires that we classify financial assets and liabilities measured at fair value into a three-level fair value hierarchy. The determination of fair value is highly subjective and requires management to rely on estimates, assumptions, and judgments that can affect amounts reported in our financial statements. We obtain the fair value of investment securities from an independent pricing service. We review the pricing methodology for each significant class of assets used by this third party pricing service to assess the compliance with accounting standards for fair value measurement and classification in the fair value measurement hierarchy. The fair value measurements consider observable data that may include dealer quotes, market spreads, cash flows, the U.S. Treasury yield curve, live trading levels, trade execution data, market consensus prepayment speeds, credit information, including credit spreads and current rating from credit rating agencies, and the bond’s terms and conditions, among other things. While we use an independent pricing service to obtain the fair values of our investment portfolio, we do employ certain control procedures to determine the reasonableness of the valuations. We validate the overall reasonableness of the fair values by comparing information obtained from our independent pricing service to other third party valuation sources for selected assets and review the valuations and any differences in valuations with members of management who have the relevant technical expertise to assess the results. However, we do not alter the fair values provided by our independent pricing service.
Each quarter we review our investment securities portfolio to determine whether unrealized losses are temporary or other than temporary, based on an evaluation of the creditworthiness of the issuers/guarantors, as well as the underlying collateral, if applicable. Our analysis includes an evaluation of the type of security, the length of time and extent to which the fair value has been less than the security’s carrying value, the characteristics of the underlying collateral, the degree of credit support provided by subordinate tranches within the total issuance, independent credit ratings, changes in credit ratings and a cash flow analysis, considering
27
Table of Contents
default rates, loss severities based upon the location of the collateral, and estimated prepayments. Those securities with unrealized losses for more than 12 months and for more than 10% of their carrying value are subjected to further analysis to determine if we expect to receive all the contractual cash flows. We use other independent pricing sources to obtain fair value estimates and perform discounted cash flow analysis for selected securities. When the discounted cash flow analysis obtained from those independent pricing sources indicates that we expect all future principal and interest payments will be received in accordance with their original contractual terms, we do not intend to sell the security, and we more-likely-than-not will not be required to sell the security before recovery, the unrealized loss is deemed temporary. If such analysis shows that we do not expect to be able to recover our entire investment, then an other-than-temporary impairment charge will be recorded in current earnings for the amount of the credit loss component. The amount of impairment that related to factors other than the credit loss is recognized in other comprehensive income. Our assessments of creditworthiness and the resultant expected cash flows are complicated by the uncertainties surrounding not only the specific security and its underlying collateral but also the severity of the current overall economic downturn. Our cash flow estimates for mortgage related securities are based on estimates of mortgage default rates, severity of loss, and prepayments, which are difficult to predict. Changes in assumptions can result in material changes in expected cash flows. Therefore, unrealized losses that we have determined to be temporary may at a later date be determined to be other-than-temporary and have a material impact on our statement of operations.
Outlook
Since 2008, we have pursued a two pronged strategy of asset quality remediation and earnings growth and diversification, which we call our “fix and grow” strategy. The “fix” component refers to our continuing efforts to improve asset quality issues largely caused by the downturn in the Chicago area economy, and the resulting impact on real estate prices and liquidity. The “grow” component of our strategy seeks to increase and diversify our pre-tax, pre-provision earnings by repositioning our commercial banking business to provide middle-market lending across a wide array of industries. In addition, “grow” also encompasses our two new businesses lines—Cole Taylor Business Capital, our asset-based lending arm, and Cole Taylor Mortgage, our mortgage origination business.
We plan to continue pursuing our “fix and grow” strategy in 2011. Regarding our “fix” strategy, we expect to continue to remediate asset quality and to reduce lending concentrations in areas of higher risk. Improvement in asset quality will in part depend on a sustained improvement in the economy and in particular the Chicago area real estate market and may continue for some time.
We also expect to maintain focus on the growth component of our strategy emphasizing our commercial banking and mortgage origination businesses. Cole Taylor Business Capital and Cole Taylor Mortgage are relatively new businesses and we believe that each have meaningful potential for continued growth. Cole Taylor Mortgage’s geographic expansion and growth, however, will be limited until the Dodd-Frank mandates surrounding mortgage origination sales incentives are fully understood and implemented. See “Supervision and Regulation—Changes to Mortgage Loan Originator Compensation” for additional details. We will also look for additional opportunities for strategic, measured expansion provided it increases stockholder value, especially in the areas of deposit franchise enhancement.
Results of Operations
We reported a net loss applicable to common stockholders of $79.3 million, or ($5.27) per diluted common share outstanding for the year ended December 31, 2010, compared to a net loss applicable to common stockholders of $43.0 million, or ($4.10) per diluted common share, for the year ended December 31, 2009. The higher net loss applicable to common stockholders in 2010 was due to a $53.5 million increase in the provision for loan losses, an implied non-cash dividend of $15.8 million representing an inducement to the holders of our 8% non-cumulative convertible perpetual Series A Preferred to convert their Series A Preferred shares into common stock, higher noninterest expense of $20.6 million, which was offset by higher net interest income of $13.2 million and higher noninterest income of $39.1 million.
28
Table of Contents
2010 Highlights
| • | Pre-tax, pre-provision earnings from core operations (defined as loss before income taxes plus provision for loan losses plus nonperforming asset expense less gains on the sales of investment securities) were $68.9 million, up 30.0% from $53.0 million for the full year 2009. |
| • | Revenue (defined as net interest income plus noninterest income less gains on the sales of investment securities) was $167.4 million, up 20.5% from $138.9 million in 2009. |
| • | Net interest income increased 10.7% from $122.9 million for the year ended December 31, 2009 to $136.1 million for the year ended December 31, 2010. |
| • | Nonperforming loans were $159.7 million and 5.16% of total loans at December 31, 2010, compared to $141.5 million and 4.66% of total loans at December 31, 2009. |
| • | The allowance for loan losses was $124.6 million and 77.98% of nonperforming loans at December 31, 2010, compared to $106.2 million and 75.06% at December 31, 2009. |
| • | At December 31, 2010, commercial criticized and classified loans totaled $303.9 million down 25.2% from $406.3 million at December 31, 2009. |
| • | In May 2010, we completed a $75 million private offering. This provided additional liquidity for us to continue to act as a source of strength for the Bank, to better align our capital position to our peers and to support our future growth plans. |
In 2010, we also completed an exchange offer in which we issued an aggregate of 7.2 million shares of our common stock in exchange for all of the outstanding shares of our Series A Preferred. The Series A Preferred had an aggregate liquidation preference of $60 million and a non-cumulative preferred dividend that accrued at 8% per annum. By its terms, the Series A Preferred was convertible into 6.0 million shares of common stock. As an inducement to convert, holders of our Series A Preferred were offered, in the aggregate, an additional 1.2 million shares of common stock.
In the first quarter of 2011, we announced the sale of $25 million of a new series of preferred stock in a private placement to existing investors. Subject to stockholder approval, which we expect to receive at a special meeting on March 29, 2011, these shares of preferred stock will convert automatically into 2.5 million shares of common stock, or in the case of certain investors, non-voting common stock equivalents. We intend to use the proceeds to provide additional capital to the Bank. As we continue to grow our business as well as manage our loan portfolio, we may require additional capital, either from earnings retention or external sources. We continue to review and evaluate our capital plan in conjunction with our business strategy as well as the heightened focus on capital requirements by regulatory authorities and the investment community. The timing, amount and form of any such capital raise will depend on a number of factors, including the amount of earnings generated by the Bank, the opportunities for future growth, further loan losses, regulatory requirements and the state of the capital markets.
2009 Highlights
We reported a net loss applicable to common stockholders of $43.0 million, or ($4.10) per diluted common share outstanding for the year ended December 31, 2009, compared to a net loss applicable to common stockholders of $143.4 million, or ($13.72) per diluted common share, during 2008. The lower net loss applicable to common stockholders in 2009 was due to a $54.5 million decrease in the provision for loan losses and increases in net interest income of $30.6 million and noninterest income of $21.2 million. These decreases to the net loss in 2009 were partly offset by a $9.0 million increase in income tax expense and a $4.2 million increase in noninterest expense. In addition, preferred stock dividends and discounts decreased to $11.5 million during 2009 from $18.8 million during 2008. The decrease was primarily due to a $16.7 million charge in 2008 for an implied non-cash dividend to the holders of our 8% non-cumulative convertible perpetual Series A preferred stock to
29
Table of Contents
reflect the beneficial conversion feature upon issuance of this preferred stock. This decrease was partly offset by higher dividends and discounts as 2009 had the full year’s impact of the preferred stock issued in September and November 2008.
Noninterest income, without considering the gains and losses from the investment securities portfolio, also increased in 2009 as compared to 2008, as an increase in service charge revenue and other income were partly offset by lower trust and investment management fees and losses from our mortgage banking activities. Total noninterest expense increased by $4.2 million, or 4.5%, during 2009 as compared to 2008. This increase included $7.7 million of higher assessments from the FDIC and an increase of $7.0 million in expenses related to our nonperforming assets. Without the increases in deposit insurance premiums and nonperforming asset expense, our overall noninterest expense would have declined by over $10 million.
Net Interest Income
Net interest income is the difference between total interest income and fees generated by interest-earning assets and total interest expense incurred on interest-bearing liabilities. Net interest income is our principal source of earnings. The amount of net interest income is affected by changes in the volume and mix of interest-earning assets and interest-bearing liabilities, and the level of rates earned or incurred on those assets and liabilities.
Year Ended December 31, 2010 as Compared to Year Ended December 31, 2009
Net interest income increased by $13.2 million, or 10.7%, to $136.1 million in 2010, compared to $122.9 million in 2009, that was driven largely by a 33 basis point increase in net interest margin.
Net interest margin increased to 3.17% in 2010, compared to 2.84% in 2009, as our funding costs continued to decrease by more than the yield on our interest-earning assets. The low interest rate environment enabled our portfolio of term deposits to continue to reprice to the current market rates coupled with increasing noninterest-bearing deposit balances from customers, and taking advantage of low cost short-term funding opportunities drove funding costs lower.
In contrast, the interest-earning asset yield declined to 4.83% in 2010 from 5.03% in 2009. The yield earned on loans increased slightly to 5.07% during 2010 from 5.04% in 2009. However, this was more than offset by a drop in the yield on our investment securities portfolio, which decreased to 4.28% in 2010 from 5.01% in 2009.
Our average interest-earning assets during 2010 were $4.37 billion, a decrease of $66.2 million, or 1.5%, as compared to the $4.43 billion of average interest-earning assets during 2009. The decrease was driven by lower loan balances largely offset by higher investment portfolio balances. Average loan balances fell due to the continued downward pressure from the current economic environment.
Average interest–bearing deposit balances decreased to $2.39 billion in 2010, compared to $2.52 billion during 2009. The decrease was offset by increases in average noninterest-bearing deposit balances, which increased $18.3 million to $602.8 million during 2010, as compared to $584.5 million in 2009, and by short-term borrowings, which increased $163.1 million from $366.8 million during 2009 to $529.9 million during 2010.
With an adjustment for tax-exempt income, our consolidated net interest income for 2010 was $138.6 million, compared to $126.0 million for 2009. This non-GAAP presentation is discussed below. See “Tax-Equivalent Adjustments to Yields and Margins”.
30
Table of Contents
Year Ended December 31, 2009 as Compared to Year Ended December 31, 2008
Net interest income increased to $122.9 million in 2009, compared to $92.4 million in 2008, up $30.6 million, or 33.1%. With an adjustment for tax-exempt income, our consolidated net interest income for 2009 was $126.0 million, compared to $95.6 million for 2008. This non-GAAP presentation is discussed below. See “Tax-Equivalent Adjustments to Yields and Margins”. During 2009, net interest income benefited from both a $683.0 million increase in average interest-earning assets and a 29 basis point increase in the net interest margin.
Our net interest margin increased to 2.84% in 2009 as compared to 2.55% in 2008. The net interest margin increased in 2009 as our funding costs decreased by more than the yield on our interest-earning assets. Market interest rates declined during 2008 and remained at historically low levels throughout 2009. Since approximately 71% of the loan portfolio is tied to floating or variable indexes, the declining market rates had an immediate impact on our earning asset yields in 2008, which continued in 2009 as higher rate assets were repaid and replaced at lower current market rates. Because of our portfolio of term deposits, our cost of funds can lag changes in market interest rates. Our net interest margin increased in 2009, as the low interest rate environment enabled our portfolio of term deposits to continue to reprice to the current market rates. In addition, our cost of funds decreased in 2009 as we improved our funding mix by reducing reliance on more costly out-of-market funding, increased noninterest-bearing deposit balances from customers, and took advantage of low cost short-term funding opportunities from the FHLB and the FRB’s Term Auction Facility.
During 2009, the interest-earning asset yield declined to 5.03% from 5.54% during 2008, a decrease of 51 basis points. The yield earned on loans decreased to 5.04% during 2009 from 5.69% in 2008, while the yield on our investment securities portfolio decreased to 5.01% in 2009 from 5.32% in 2008. We took additional steps during 2009 to increase net interest income and maintain our earning asset yields by improving loan pricing, including the use of interest rate floors, and increasing the size and duration of our investment portfolio to take advantage of higher yields. Over the same time period, the cost of funds decreased 86 basis points, from 3.61% during 2008 to 2.75% during 2009. The cost of our deposits decreased 76 basis points to 2.75% during 2009 from 3.51% during 2008. In addition, overall borrowing costs benefited from our increased use of attractively priced short-term borrowings.
Our average interest-earning assets during 2009 were $4.43 billion, an increase of $683.0 million, or 18.2%, as compared to the $3.75 billion of average interest-earning assets during 2008. Both an increase in average loans and investment balances produced the overall increase in interest earning assets. The growth strategy implemented in 2008 caused the $380.7 million, or 13.6%, increase in average loan balances between the two annual periods. Average loan balances were $3.17 billion during 2009, compared to $2.79 billion during 2008. We also increased the size of the investment portfolio in an effort to increase average earning assets and enhance net interest margin. Average investment balances increased to $1.26 billion during 2009 from $895.4 million during 2008, an increase of $364.7 million or 40.7%.
The increase in average earning assets was largely funded with short-term borrowings and an increase in noninterest-bearing deposits. Average interest-bearing deposit balances remained relatively unchanged at $2.52 billion during 2009, compared to $2.51 billion during 2008. Our average noninterest-bearing deposit balances increased $175.2 million, or 42.8%, to $584.5 million during 2009, as compared to $409.3 million in 2008. In addition, average notes payable and other advances increased $327.1 million and other borrowings increased by $53.4 million during 2009, as compared to 2008.
Tax-Equivalent Adjustments to Yields and Margins
As part of our evaluation of net interest income, we review our consolidated average balances, our yield on average interest-earning assets, and the costs of average interest-bearing liabilities. Such yields and costs are derived by dividing income or expense by the average balance of assets or liabilities. Because management reviews net interest income on a taxable equivalent basis, the analysis contains certain non-GAAP financial
31
Table of Contents
measures. In these non-GAAP financial measures, interest income and net interest income are adjusted to reflect tax-exempt interest income on an equivalent before-tax basis assuming a tax rate of 35%. This assumed rate may differ from our actual effective income tax rate. In addition, we adjusted the interest-earning asset yield, net interest margin, and the net interest rate spread to a fully taxable equivalent basis. We believe that these measures and ratios present a more meaningful measure of the performance of interest-earning assets because they provide a better basis for comparison of net interest income regardless of the mix of taxable and tax-exempt instruments.
The following table reconciles the tax-equivalent net interest income to net interest income as reported in our Consolidated Statements of Operations. In addition, the interest-earning asset yield, net interest margin and net interest spread are shown with and without the tax equivalent adjustment.
| For the Year Ended December 31, | ||||||||||||
| 2010 | 2009 | 2008 | ||||||||||
| (dollars in thousands) | ||||||||||||
| Net interest income as reported |
$ | 136,074 | $ | 122,911 | $ | 92,351 | ||||||
| Tax equivalent adjustment-investments |
2,393 | 2,944 | 3,140 | |||||||||
| Tax equivalent adjustment-loans |
100 | 115 | 126 | |||||||||
| Tax equivalent net interest income |
$ | 138,567 | $ | 125,970 | $ | 95,617 | ||||||
| Yield on interest-earning assets without tax adjustment |
4.77 | % | 4.96 | % | 5.45 | % | ||||||
| Yield on interest-earning assets – tax equivalent |
4.83 | % | 5.03 | % | 5.54 | % | ||||||
| Net interest margin without tax adjustment |
3.12 | % | 2.77 | % | 2.46 | % | ||||||
| Net interest margin – tax equivalent |
3.17 | % | 2.84 | % | 2.55 | % | ||||||
| Net interest spread – without tax adjustment |
2.74 | % | 2.21 | % | 1.84 | % | ||||||
| Net interest spread – tax equivalent |
2.80 | % | 2.28 | % | 1.93 | % | ||||||
32
Table of Contents
The following table presents, for the periods indicated, certain information relating to our consolidated average balances and reflects our yield on average interest-earning assets and costs of average interest-bearing liabilities. The table contains certain non-GAAP financial measures to adjust tax-exempt interest income on an equivalent before-tax basis assuming a tax rate of 35%.
| Year Ended December 31, | ||||||||||||||||||||||||||||||||||||
| 2010 | 2009 | 2008 | ||||||||||||||||||||||||||||||||||
| AVERAGE BALANCE |
INTEREST | YIELD/ RATE (%) |
AVERAGE BALANCE |
INTEREST | YIELD/ RATE (%) |
AVERAGE BALANCE |
INTEREST | YIELD/ RATE (%) |
||||||||||||||||||||||||||||
| (dollars in thousands) | ||||||||||||||||||||||||||||||||||||
| INTEREST-EARNING ASSETS: |
||||||||||||||||||||||||||||||||||||
| Investment securities (1): |
||||||||||||||||||||||||||||||||||||
| Taxable |
$ | 1,222,785 | $ | 50,162 | 4.10 | % | $ | 1,127,899 | $ | 54,694 | 4.85 | % | $ | 754,811 | $ | 38,633 | 5.12 | % | ||||||||||||||||||
| Tax-exempt (tax equivalent) (2) |
108,353 | 6,837 | 6.31 | 132,184 | 8,412 | 6.36 | 140,550 | 8,970 | 6.38 | |||||||||||||||||||||||||||
| Total investment securities |
1,331,138 | 56,999 | 4.28 | 1,260,083 | 63,106 | 5.01 | 895,361 | 47,603 | 5.32 | |||||||||||||||||||||||||||
| Cash Equivalents |
939 | 11 | 1.16 | 1,688 | 20 | 1.17 | 64,025 | 1,421 | 2.18 | |||||||||||||||||||||||||||
| Loans (2) (3): |
||||||||||||||||||||||||||||||||||||
| Commercial and commercial real estate |
2,775,085 | 141,778 | 5.04 | 2,982,534 | 150,021 | 4.96 | 2,627,905 | 147,727 | 5.53 | |||||||||||||||||||||||||||
| Residential real estate mortgages |
166,818 | 7,304 | 4.38 | 87,483 | 4,485 | 5.13 | 56,660 | 3,150 | 5.56 | |||||||||||||||||||||||||||
| Home equity and consumer |
92,995 | 3,912 | 4.21 | 101,356 | 4,266 | 4.21 | 106,158 | 5,770 | 5.44 | |||||||||||||||||||||||||||
| Fees on loans |
1,005 | 1,191 | 2,043 | |||||||||||||||||||||||||||||||||
| Net loans (tax equivalent) (2) |
3,034,898 | 153,999 | 5.07 | 3,171,373 | 159,963 | 5.04 | 2,790,723 | 158,690 | 5.69 | |||||||||||||||||||||||||||
| Total interest earning assets (2) |
4,366,975 | 211,009 | 4.83 | 4,433,144 | 223,089 | 5.03 | 3,750,109 | 207,714 | 5.54 | |||||||||||||||||||||||||||
| NON-EARNING ASSETS: |
||||||||||||||||||||||||||||||||||||
| Allowance for loan losses |
(108,347 | ) | (131,131 | ) | (88,046 | ) | ||||||||||||||||||||||||||||||
| Cash and due from banks |
81,774 | 65,674 | 57,269 | |||||||||||||||||||||||||||||||||
| Accrued interest and other assets |
153,011 | 116,888 | 91,655 | |||||||||||||||||||||||||||||||||
| TOTAL ASSETS |
$ | 4,493,413 | $ | 4,484,575 | $ | 3,810,987 | ||||||||||||||||||||||||||||||
| INTEREST-BEARING LIABILITIES: |
||||||||||||||||||||||||||||||||||||
| Interest-bearing deposits: |
||||||||||||||||||||||||||||||||||||
| Interest-bearing demand deposits |
$ | 812,253 | $ | 8,344 | 1.03 | $ | 661,403 | $ | 7,610 | 1.15 | $ | 748,001 | $ | 13,114 | 1.75 | |||||||||||||||||||||
| Savings deposits |
40,616 | 32 | 0.08 | 41,848 | 35 | 0.08 | 45,247 | 58 | 0.13 | |||||||||||||||||||||||||||
| Time deposits |
1,533,939 | 35,910 | 2.34 | 1,816,169 | 61,519 | 3.39 | 1,718,572 | 75,107 | 4.37 | |||||||||||||||||||||||||||
| Total interest-bearing deposits |
2,386,808 | 44,286 | 1.86 | 2,519,420 | 69,164 | 2.75 | 2,511,820 | 88,279 | 3.51 | |||||||||||||||||||||||||||
| Other borrowings |
529,900 | 8,648 | 1.61 | 366,844 | 8,844 | 2.38 | 313,430 | 9,648 | 3.03 | |||||||||||||||||||||||||||
| Notes payable and other advances |
484,789 | 5,289 | 1.08 | 509,049 | 6,557 | 1.27 | 181,986 | 5,511 | 2.98 | |||||||||||||||||||||||||||
| Junior subordinated debentures |
86,607 | 5,804 | 6.70 | 86,607 | 6,066 | 7.00 | 86,607 | 7,013 | 8.10 | |||||||||||||||||||||||||||
| Subordinated notes |
74,154 | 8,415 | 11.35 | 55,499 | 6,488 | 11.69 | 14,192 | 1,646 | 11.60 | |||||||||||||||||||||||||||
| Total interest-bearing liabilities |
3,562,258 | 72,442 | 2.03 | 3,537,419 | 97,119 | 2.75 | 3,108,035 | 112,097 | 3.61 | |||||||||||||||||||||||||||
| NONINTEREST-BEARING LIABILITIES: |
||||||||||||||||||||||||||||||||||||
| Noninterest-bearing deposits |
602,757 | 584,512 | 409,322 | |||||||||||||||||||||||||||||||||
| Accrued interest, taxes and other liabilities |
52,904 | 68,801 | 49,483 | |||||||||||||||||||||||||||||||||
| Total noninterest-bearing liabilities |
655,661 | 653,313 | 458,805 | |||||||||||||||||||||||||||||||||
| STOCKHOLDERS’ EQUITY |
275,494 | 293,843 | 244,147 | |||||||||||||||||||||||||||||||||
| TOTAL LIABILITIES AND STOCKHOLDERS’ EQUITY |
$ | 4,493,413 | $ | 4,484,575 | $ | 3,810,987 | ||||||||||||||||||||||||||||||
| Net interest income (tax equivalent) (2) |
$ | 138,567 | $ | 125,970 | $ | 95,617 | ||||||||||||||||||||||||||||||
| Net interest spread (2) (4) |
2.80 | % | 2.28 | % | 1.93 | % | ||||||||||||||||||||||||||||||
| Net interest margin (2) (5) |
3.17 | % | 2.84 | % | 2.55 | % | ||||||||||||||||||||||||||||||
| (1) | Investment securities average balances are based on amortized cost. |
| (2) | Calculations are computed on a taxable-equivalent basis using a tax rate of 35%. |
| (3) | Nonaccrual loans are included in the above stated average balances. |
| (4) | Net interest spread represents the difference between the average yield on interest-earning assets and the average cost of interest-bearing liabilities. |
| (5) | Net interest margin is determined by dividing taxable equivalent net interest income by average interest-earning assets. |
33
Table of Contents
The following table presents, for the periods indicated, a summary of the changes in interest earned and interest expense incurred resulting from changes in volume and rates for the major components of interest-earning assets and interest-bearing liabilities on a tax-equivalent basis assuming a tax rate of 35%. The change due to both rate and volume has been allocated in proportion to the dollar amount of the change in each. The impact of changes in the mix of interest-earning assets and interest-bearing liabilities is reflected in net interest income.
| 2010 over
2009 INCREASE/(DECREASE) |
2009 over
2008 INCREASE/(DECREASE) |
|||||||||||||||||||||||||||
| Volume | Rate | Net | Volume | Rate | Day (1) | Net | ||||||||||||||||||||||
| INTEREST EARNED ON: |
||||||||||||||||||||||||||||
| Investment securities: |
||||||||||||||||||||||||||||
| Taxable |
$ | 4,364 | $ | (8,896 | ) | $ | (4,532 | ) | $ | 18,196 | $ | (2,135 | ) | $ | — | $ | 16,061 | |||||||||||
| Tax-exempt |
(1,509 | ) | (66 | ) | (1,575 | ) | (530 | ) | (28 | ) | — | (558 | ) | |||||||||||||||
| Cash equivalents |
(9 | ) | — | (9 | ) | (947 | ) | (450 | ) | (4 | ) | (1,401 | ) | |||||||||||||||
| Loans |
(6,911 | ) | 947 | (5,964 | ) | 20,673 | (18,966 | ) | (434 | ) | 1,273 | |||||||||||||||||
| Total interest-earning assets |
(4,065 | ) | (8,015 | ) | (12,080 | ) | 37,392 | (21,579 | ) | (438 | ) | 15,375 | ||||||||||||||||
| INTEREST PAID ON: |
||||||||||||||||||||||||||||
| Interest-bearing demand deposits |
1,593 | (859 | ) | 734 | (1,380 | ) | (4,088 | ) | (36 | ) | (5,504 | ) | ||||||||||||||||
| Savings deposits |
(3 | ) | — | (3 | ) | (4 | ) | (19 | ) | — | (23 | ) | ||||||||||||||||
| Time deposits |
(8,556 | ) | (17,053 | ) | (25,609 | ) | 4,102 | (17,485 | ) | (205 | ) | (13,588 | ) | |||||||||||||||
| Other borrowings |
3,156 | (3,352 | ) | (196 | ) | 1,460 | (2,238 | ) | (26 | ) | (804 | ) | ||||||||||||||||
| Notes payable and other advances |
(306 | ) | (962 | ) | (1,268 | ) | 5,522 | (4,461 | ) | (15 | ) | 1,046 | ||||||||||||||||
| Junior subordinated debentures |
— | (262 | ) | (262 | ) | — | (928 | ) | (19 | ) | (947 | ) | ||||||||||||||||
| Subordinated debt |
2,121 | (194 | ) | 1,927 | 4,833 | 13 | (4 | ) | 4,842 | |||||||||||||||||||
| Total interest-bearing liabilities |
(1,995 | ) | (22,682 | ) | (24,677 | ) | 14,533 | (29,206 | ) | (305 | ) | (14,978 | ) | |||||||||||||||
| Net interest income, tax-equivalent |
$ | (2,070 | ) | $ | 14,667 | $ | 12,597 | $ | 22,859 | $ | 7,627 | $ | (133 | ) | $ | 30,353 | ||||||||||||
| (1) | The year ended December 31, 2008 had 366 days compared to 365 days for the years ended December 31, 2010 and 2009. |
Provision for Loan Losses
We determine a provision for loan losses that we consider sufficient to maintain an allowance to absorb probable losses inherent in our portfolio as of the balance sheet date. For additional information concerning this determination, see “Application of Critical Accounting Policies—Allowance for Loan Losses,” “Nonperforming Assets”, “Impaired Loans” and “Allowance for Loan Losses.”
Our provision for loan losses totaled $143.1 million during 2010, an increase of $53.5 million, or 59.7%, as compared to the $89.6 million provision for loan losses recorded in 2009. The provision for loan losses in 2010 reflects the continued weakness in the Chicago area real estate market, deterioration in our bank and bank holding company loans, the rise in nonperforming and impaired loans, and the increase in the severity of the estimated losses associated with these loans.
Nonperforming loans and impaired loans remain at elevated levels, increasing slightly in 2010. Nonperforming loans totaled $159.7 million at December 31, 2010, compared to $141.5 million at year-end 2009, an increase of $18.2 million, or 12.9%. As we address our problem assets, the level of gross charge-offs has increased to $128.9 million during 2010 as compared to $116.2 million in 2009. However, because the provision for loan losses exceeded net charge-offs in 2010, the total allowance for loan losses increased from $106.2 million at December 31, 2009 to $124.6 million at December 31, 2010. See “Nonperforming Assets” and “Allowance for Loan Losses” for further discussion of the credit quality of our loan portfolio and our allowance for loan losses.
34
Table of Contents
The provision for loan losses of $89.6 million during 2009 was $54.5 million lower than the $144.2 million provision for loan losses during 2008. The provision in 2008 reflected the rapid rise in nonperforming and impaired loans and the increase in the severity of the estimated loss associated with these loans. Lower nonperforming loans, impaired loans, and net charge-offs caused us to decrease our allowance for loan losses in 2009.
Noninterest Income
The following table presents the composition of our noninterest income for the periods indicated:
| Year Ended December 31, | ||||||||||||
| 2010 | 2009 | 2008 | ||||||||||
| (in thousands) | ||||||||||||
| Service charges |
$ | 11,282 | $ | 11,306 | $ | 9,136 | ||||||
| Trust and investment management fees |
768 | 1,697 | 3,578 | |||||||||
| Mortgage origination revenue |
14,261 | — | — | |||||||||
| Losses relating to bulk purchased mortgage loans |
(2,418 | ) | (1,961 | ) | — | |||||||
| Gain (loss) on sales of investment securities |
41,376 | 17,595 | (2,399 | ) | ||||||||
| Other derivative income |
1,963 | 1,399 | 1,936 | |||||||||
| Letter of credit and other loan fees |
4,041 | 2,186 | 376 | |||||||||
| Change in market value of employee deferred compensation plan |
161 | 478 | (1,354 | ) | ||||||||
| Other noninterest income |
1,249 | 891 | 1,164 | |||||||||
| Total noninterest income |
$ | 72,683 | $ | 33,591 | $ | 12,437 | ||||||
Year Ended December 31, 2010 as Compared to Year Ended December 31, 2009
Total noninterest income during 2010 totaled $72.7 million, up from $33.6 million during 2009, an increase of $39.1 million or 116.4%. Increases in the gains on the sale of investment securities in 2010 of $23.8 million, mortgage origination revenue of $14.3 million from Cole Taylor Mortgage and letters of credit fees of $1.9 million drove the increase.
In 2010, we recorded gains on the sale of available-for-sale investment securities of $41.4 million from the sale of approximately $965 million of investment securities, mostly mortgage-related securities. We realized gains when we sold mortgage-backed securities that had been experiencing higher than anticipated prepayments and to take advantage of the low level of interest rates and tightening spreads in the market later in the year. See “Investment Securities” below for a further discussion
We principally derive service charges from deposit accounts. Service charges stayed flat in 2010 at $11.3 million. Service charge income is affected by a number of factors, such as the volume of deposit accounts and service transactions, the price established for each deposit service, the earnings credit rate and the collected balances customers maintain in their commercial checking accounts.
Other derivative income totaled $2.0 million in 2010, compared to $1.4 million in 2009. The increase was almost entirely due to an increase in the number and the size of fees collected on customer related swaps. See “Derivative Financial Instruments” following for further discussion of our derivative instruments.
Standby letters of credit and other loan fees totaled $4.0 million in 2010, compared to $2.2 million in 2009. The increase in fees during 2010 was primarily due to our expanded asset based lending operations.
35
Table of Contents
Year Ended December 31, 2009 as Compared to Year Ended December 31, 2008
Noninterest income during 2009 totaled $33.6 million, up from $12.4 million during 2008. The gain on the sale of investment securities in 2009 of $17.6 million and a $2.4 million loss due to other-than-temporary impairment of an investment security in 2008 accounted for most of this increase. Higher service charges and letter of credit and other fees, partly offset by a decrease in trust and investment management fees and losses from mortgage banking activities, also contributed to this increase.
Service charges increased $2.2 million, or 23.8%, in 2009 to $11.3 million as compared to $9.1 million in 2008. The increase in service charge revenue in 2009 was largely due to increased customer accounts and activity that resulted from the commercial banking growth initiative that we began in 2008. In addition, a decrease in the earnings credit rate given to customers on their collected account balances also contributed to the higher service charge revenue.
Trust and investment management fees declined to $1.7 million during 2009 from $3.6 million during 2008, a decrease of $1.9 million or 52.6%. Trust fees totaled $968,000 during 2009, compared to $2.4 million during 2008. Trust fees were earned in connection with our offering of corporate trust services, primarily our paying agent and escrow services. Trust fees declined during 2009 because of a reduced volume of business and a decrease in the spread income we earned on invested trust funds. During the first quarter of 2010, we entered into an agreement to sell our trust business to a third party. This transaction closed during 2010.
Investment management fees in 2009 declined to $729,000 from $1.2 million during 2008 due to fewer assets being under management. During the second quarter of 2009, the third-party investment management firm that had been providing sub-advisory services to the Bank’s clients became the primary investment advisor and assumed all portfolio management responsibilities for our wealth management customers.
The $2.0 million loss during 2009 related to bulk purchased mortgage loans was primarily due to economic hedges associated with our residential mortgage loans held for sale. In order to mitigate interest rate risk associated with these loans held for sale, we entered into forward loan sale commitments. The loss resulted from a realized settlement loss on matured forward loan sale commitments and an unrealized gain of $540,000 on the unsettled outstanding forward loan sales as of December 31, 2009. In addition, during the fourth quarter we sold approximately $10.5 million of mortgage loans held for sale and recorded a small gain.
During 2009, we recorded gains on the sale of available-for-sale investment securities of $17.6 million from the sale of approximately $500 million of investment securities, mostly mortgage-related securities. We realized gains when we sold mortgage-backed securities that had been experiencing higher than anticipated prepayments and to take advantage of the low level of interest rates and tightening spreads in the market later in the year. The $2.4 million loss recorded in 2008 was an other-than-temporary impairment of one private label mortgage-backed security. See “Investment Securities” below for a further discussion.
Other derivative income totaled $1.4 million during 2009, compared to $1.9 million during 2008. The income in 2009 was primarily attributable to recording the initial fair value from the offering of derivative instruments to our customers. Other derivative income in 2008 was comprised of $712,000 from customer derivatives and $1.2 million from changes in the fair value of derivatives that are not designated as accounting hedges. See “Derivative Financial Instruments” following for further discussion of our derivative instruments.
Standby letters of credit and other loan fees totaled $2.2 million during 2009, compared to $376,000 during 2008. The increase in fees during 2009 was primarily due to our expanded asset based lending operations.
Our employees’ deferred compensation plan allows the participants to direct the investments of their deferred compensation in selected mutual funds. The investment in these mutual funds are assets of the Company and carried at fair value, while an equal and offsetting liability is recorded to reflect the obligation of the
36
Table of Contents
Company to the plan participants. The change in the fair value of assets in our employees’ deferred compensation plan is reported in noninterest income and the offsetting change in our liability to deferred compensation plan participants is included in salary expense and, therefore, has no net impact on the Company’s operating results. During 2009, the fair value of these assets increased by $478,000 compared to a decline in the fair value of $1.4 million in 2008.
Other noninterest income includes fees from automated teller machines, safe deposit box rentals, fees from insurance and financial planning services, and gains or losses from investments in limited partnerships. Total other noninterest income was $891,000 during 2009 as compared to $1.2 million in 2008.
Noninterest Expense
The following table presents the composition of our noninterest expense for the periods indicated:
| Year Ended December 31, | ||||||||||||
| 2010 | 2009 | 2008 | ||||||||||
| (dollars in thousands) | ||||||||||||
| Salaries and employee benefits: |
||||||||||||
| Salaries, employment taxes and medical insurance |
$ | 44,796 | $ | 38,440 | $ | 36,406 | ||||||
| Sign-on bonuses and severance |
375 | 386 | 6,088 | |||||||||
| Incentives, commissions and retirement benefits |
8,902 | 4,088 | 5,361 | |||||||||
| Total salaries and employee benefits |
54,073 | 42,914 | 47,855 | |||||||||
| Occupancy of premises |
8,328 | 8,146 | 7,812 | |||||||||
| Furniture and equipment |
2,284 | 2,230 | 3,094 | |||||||||
| Nonperforming asset expense |
19,790 | 11,726 | 4,711 | |||||||||
| FDIC assessment |
8,238 | 10,380 | 2,687 | |||||||||
| Legal fees, net |
4,922 | 5,961 | 5,016 | |||||||||
| Early extinguishment of debt |
378 | 527 | 2,500 | |||||||||
| Other professional services |
1,761 | 1,518 | 2,311 | |||||||||
| Computer processing |
2,171 | 1,858 | 1,995 | |||||||||
| Other noninterest expense |
16,291 | 12,347 | 15,389 | |||||||||
| Total noninterest expense |
$ | 118,236 | $ | 97,607 | $ | 93,370 | ||||||
| Efficiency Ratio (1) |
70.64 | % | 70.27 | % | 87.11 | % | ||||||
| (1) | The efficiency ratio is determined by dividing noninterest expense by an amount equal to net interest income plus noninterest income, excluding gains or losses on investment securities. |
Year Ended December 31, 2010 as Compared to Year Ended December 31, 2009
Total noninterest expense was $118.2 million during 2010, an increase of $20.6 million, or 21.1%, as compared to noninterest expense of $97.6 million during 2009. The increase in expense was primarily due to higher salaries and employee benefits expense of $11.2 million and nonperforming asset expense of $8.1 million. These increases were partly offset by lower FDIC assessments of $2.1 million.
Total salaries and employee benefits expense in 2010 was $54.1 million, compared to $42.9 million during 2009, an increase of $11.2 million, or 26.0%. The increase in expense in 2010 was largely due to the higher base salaries and sales incentives at Cole Taylor Mortgage as that business added 150 new employees during 2010. The total number of employees at the Company was 607 at December 31, 2010, compared to 443 at December 31, 2009.
37
Table of Contents
Nonperforming asset expense increased to $19.8 million during 2010 as compared to $11.7 million during 2009. The increase was primarily associated with additional write-downs on other real estate owned during 2010. The amount of nonperforming asset expense is impacted by the complexity and number of nonperforming loans and other real estate owned and could continue to be significant in future periods.
Our FDIC insurance premium decreased in 2010 from 2009, primarily due to the nonrecurring FDIC special assessment in the second quarter of 2009 of $2.1 million.
Other noninterest expense was $20.2 million for the year ended December 31, 2010, compared to $15.7 for the year ended December 31, 2009. Other noninterest expense includes costs for certain consulting fees, advertising and public relations, business meals and travel, board of directors fees, operational losses and other operating expenses such as telephone, postage, office supplies and printing.
Our efficiency ratio was 70.64% in 2010, compared to 70.27% in 2009. The impact of higher nonperforming asset expense was mostly offset by higher net interest and noninterest income.
Year Ended December 31, 2009 as Compared to Year Ended December 31, 2008
Total noninterest expense was $97.6 million during 2009, an increase of $4.2 million, or 4.5%, as compared to noninterest expense of $93.4 million during 2008. The increase in expense was primarily due to higher FDIC assessments of $7.7 million and higher nonperforming asset expense of $7.0 million. These increases were partly offset by lower salaries and employee benefits expense of $4.9 million, a $2.0 million decrease in losses on early extinguishment of debt, and general decreases in other categories of expense.
Total salaries and employee benefits expense in 2009 was $42.9 million, compared to $47.9 million during 2008, a reduction of $4.9 million, or 10.3%. The decline in 2009 was largely due to higher sign-on bonuses and severance we incurred in 2008 as part of the implementation of our growth strategy. In addition, lower incentives, commissions, and retirement benefits during 2009, partly offset by an increase in base salaries, also contributed to the decrease in expense. During 2009, we put in place certain expense control measures to reduce salaries and benefits costs, which included reducing staffing levels, eliminating annual cash-based incentive awards and suspending the annual merit increase.
Salaries, employment taxes, and medical insurance expenses increased $2.0 million, or 5.6%, to $38.4 million during 2009, compared to $36.4 million for 2008. Most of the increase in salaries was associated with an increase in the liability to our deferred compensation plan participants caused by an increase in the fair value of assets held in the plan. During 2009, the market value of these assets increased by $478,000, compared to a decline in the market value of $1.4 million in 2008. The change in the market value of assets in our employees’ deferred compensation plan is reported in noninterest income, and the offsetting change in our liability to these participants is reported in salary expense and has no net impact on the Company’s operating results. The remainder of the increase was due to higher base salaries associated with our growth strategy and the additional hiring that took place in 2008. These increases were partly offset by a decrease in employment taxes and medical insurance. As part of our expense control measures, we reduced the number of full time equivalent employees by eliminating certain positions in the first quarter of 2009. The number of full-time employees was 434 at December 31, 2009, compared to 451 at December 31, 2008.
Sign-on bonuses and severance expense was $386,000 in 2009 and consisted primarily of severance costs. Sign-on bonuses and severance expense was $6.1 million in 2008, and consisted of severance expense of $4.1 million and sign-on bonuses of $2.0 million. The higher expense in 2008 was associated with severance related to changes in senior management and certain of our supporting staff and signing bonuses to attract new employees.
Incentives, commissions, and retirement benefits also decreased during 2009 to $4.1 million, as compared to $5.4 million during 2008. The decrease was largely due to expenses in 2008 for guaranteed bonuses, primarily as a result of our recruiting activities. In addition, lower sales incentives also contributed to the decrease in expense in 2009.
38
Table of Contents
Occupancy of premises expense increased to $8.1 million during 2009, compared to $7.8 million during 2008, an increase of $334,000 or 4.3%. Most of the increase was due to the opening of leased asset-based lending offices in other states.
Furniture and equipment expense decreased to $2.2 million during 2009, as compared to $3.1 million in 2008, a decrease of $864,000, or 27.9%. Most of the decrease was associated with lower depreciation expense at our corporate offices in Rosemont, Illinois as the furniture and equipment purchased when the facility opened in late 2003, became fully depreciated in 2008.
Nonperforming asset expense increased to $11.7 million during 2009 as compared to $4.7 million during 2008. The increase was primarily associated with $5.8 million of additional write-downs recorded in the fourth quarter of 2009 on certain nonaccrual commercial loans held for sale. Additional write-downs and higher losses on the disposition of other real estate owned during 2009 also contributed to the increase in expense. The amount of nonperforming asset expense is impacted by the complexity and number of nonperforming loans and other real estate owned and could continue to be significant in future periods.
FDIC assessments increased in 2009, compared to 2008, because the FDIC imposed an industry-wide special assessment and a general increase in premiums for all financial institutions. In addition, our election to participate in the FDIC’s Transaction Account Guarantee Program also increased our expense. FDIC assessments were $10.4 million for 2009, compared to $2.7 million for 2008, an increase of $7.7 million. FDIC assessments in 2009 included an industry-wide special assessment to help recapitalize the FDIC’s Deposit Insurance Fund, which amounted to $2.1 million. The remainder of the increase was primarily due to higher insurance assessments that went into effect for all financial institutions. In addition, in an effort to increase the balance of its DIF, during the fourth quarter of 2009, the FDIC required all banks to prepay the estimated amount of the next three years’ premium payments. At December 31, 2009, the Bank’s prepaid FDIC premiums totaled $29.1 million and were included in other assets on our Consolidated Balance Sheets.
Legal fees were $6.0 million in 2009, as compared to $5.0 million in 2008, an increase of $945,000, or 18.8%. Legal fees are reported net of reimbursements received from customers. The increase was primarily due to legal fees incurred in our efforts to deal with the greater amount of nonperforming assets.
During 2009, we incurred $527,000 of expense for the early redemption of approximately $29.0 million of above market rate brokered certificates of deposits, compared to $2.5 million of expense for the early redemption of approximately $190 million of above market rate brokered certificates of deposits in 2008. The unamortized issuance costs and other discounts on these deposits were written off at the time of redemption. As of December 31, 2009, we did not have additional brokered CDs that we can call at our option.
Other professional fees totaled $1.5 million in 2009, as compared to $2.3 million in 2008, a decrease of $793,000, or 34.3%. Most of the decrease was associated with lower third-party asset management fees paid to the sub-advisor for our investment management clients. During 2009, we expanded the relationship with this third party to become the primary investment advisor going forward. As part of this arrangement, we were no longer obligated to pay the sub-advisor fee.
Other noninterest expense was $12.3 million in 2009, compared to $15.4 million in 2008. Other noninterest expense principally includes costs for certain consulting and professional fees, advertising and public relations, business meals and travel, board of directors’ fees, operational losses and other operating expenses such as telephone, postage, office supplies, and printing. During 2009, as part of our cost control measures, we reduced costs in many areas of other expenses, such as advertising, business meals and travel, consulting and other professional fees, and directors’ fees.
Our efficiency ratio was 70.27% in 2009, compared to 87.11% in 2008. The improvement in our efficiency ratio in 2009 was primarily the result of the increase in net interest income and noninterest income, excluding the gains and losses from investment securities.
39
Table of Contents
Income Taxes
During 2010, despite a pre-tax loss of $52.6 million, we recorded total income tax expense of $1.2 million. A current income tax benefit that would normally result from a pre-tax loss was offset by additional deferred tax expense due to an increase in the required valuation allowance. The tax expense recorded in 2010 was largely due to the release of the residual tax effects of changes in the beginning of the year valuation allowance previously allocated to other comprehensive income. These residual tax effects resulted from changes in the deferred tax liability associated with deferred gains on terminated cash flow hedges recorded in other comprehensive income. We expect additional income tax expense of $500,000 during 2011 as a result of the release of the residual tax effects.
Since the third quarter of 2008, we have maintained a valuation allowance on our deferred tax assets because we concluded that, based upon the weight of all available evidence, it was “more likely than not” that not all of the deferred tax assets would be realized. The valuation allowance increased $30.6 million during 2010 to $92.7 million at December 31, 2010, compared to $62.1 million at December 31, 2009. The increase in the required valuation allowance was largely due to the increase in our net deferred tax assets and changes in the beginning of the year valuation allowance solely attributable to identifiable events recorded in other comprehensive income, primarily changes in unrealized gains and losses on available-for-sale investment securities, the tax effects of which were allocated to other comprehensive income. At December 31, 2010, the net deferred tax asset, after considering the $92.7 million valuation allowance, was $11.6 million, which was supported by available tax planning strategies. We evaluate the valuation allowance each quarter taking into account our inventory of deferred tax assets and liabilities, including those recorded on items included in equity as other comprehensive income, which are recorded net of tax.
During 2009, we reported income tax expense of $834,000 for the year on a pre-tax loss of $30.7 million. Because of the valuation allowance on our deferred tax asset, we were not able to record an income tax benefit related to the pre-tax loss incurred. A current income tax benefit that would normally result from a pre-tax loss was offset by additional deferred tax expense due to an increase in the required valuation allowance. The tax expense recorded in 2009 was largely due to the release of the residual tax effects of changes in the beginning of the year valuation allowance previously allocated to other comprehensive income. These residual tax effects resulted from changes in the deferred tax liability associated with deferred gains on terminated cash flow hedges recorded in other comprehensive income. At December 31, 2009, the net deferred tax asset, after considering the $62.1 million valuation allowance, was $4.6 million, which was supported by available tax planning strategies.
During 2008, we reported an income tax benefit of $8.2 million for the year on a pre-tax loss of $132.7 million. We recorded an income tax benefit in 2008 because of our ability to carry back the 2008 pre-tax loss to recover taxes paid in prior years. This benefit was partly offset by the recording of an after-tax, non-cash charge of $46.4 million to establish a valuation allowance against our deferred tax asset. After considering the valuation allowance, at December 31, 2008, we had a net deferred tax asset of $6.9 million which was supported by available carry backs of operating losses to taxes paid in previous years and available tax planning strategies.
Impact of Inflation and Changing Prices
The consolidated financial statements and notes thereto presented herein have been prepared in accordance with generally accepted accounting principles, which require the measurement of our financial position and operating results in terms of historical amounts without considering the changes in the relative purchasing power of money over time due to inflation. The impact of inflation is reflected in the cost of our operations. Unlike industrial companies, nearly all of our assets and liabilities are monetary in nature. As a result, interest rates have a greater impact on our performance than do the effects of the general levels of inflation. Interest rates do not necessarily move in the same direction or, to the same extent, as the price of goods and services.
40
Table of Contents
Financial Condition
Total assets increased by $80.4 million, or 1.8%, to $4.48 billion at December 31, 2010, compared to $4.40 billion at December 31, 2009. During 2010, total loan balances increased $59.0 million, or 1.9%, to $3.09 billion at December 31, 2010, compared to $3.04 billion at year-end 2009. Offsetting this increase was a decrease in investment securities, which totaled $1.25 billion at December 31, 2010, compared to $1.27 billion as of December 31, 2009. In addition, other real estate and repossessed assets increased by $5.3 million, or 20.0%, to $31.5 million at December 31, 2010, compared to $26.2 million at December 31, 2009.
Total liabilities increased from $4.14 billion as of December 31, 2009 to $4.28 billion as of December 31, 2010. Other borrowings increased $173.3 million, or 51.3%, to $511.0 million at December 31, 2010, compared to $337.7 at December 31, 2009. Total deposits increased $50.1 million, or 1.7%, to $3.03 billion at December 31, 2010, from $2.98 billion at December 31, 2009. However, notes payable and other advances decreased $122.0 million, or 19.5%, in 2010 to $505.0 million at December 31, 2010, compared to $627.0 million at December 31, 2009. Our total stockholders’ equity decreased $50.0 million during 2010 to $208.8 million at December 31, 2010, from $258.8 million at December 31, 2009, primarily due to the net loss incurred during 2010 and partially offset by additional capital raised in 2010.
Interest-bearing Cash Equivalents
Interest-bearing cash equivalents consist of interest-bearing deposits with banks or other financial institutions, federal funds sold and securities purchased under agreements to resell with original maturities of less than 30 days. All federal funds are sold overnight with daily settlement required.
Investment Securities
Our investment portfolio is designed to provide a source of income with minimal risk of loss, a source of liquidity and interest rate risk management opportunities. In managing our investment portfolio within the composition of the entire balance sheet, we balance our earnings, credit, interest rate risk, and liquidity considerations, with a goal of maximizing longer-term overall profitability.
The following table presents the composition of our investment portfolio by major category as of the dates indicated
| AVAILABLE-FOR-SALE | HELD-TO-MATURITY | TOTAL | ||||||||||||||||||||||
| Amortized cost |
Estimated fair value |
Amortized cost |
Estimated fair value |
Amortized cost |
Estimated fair value |
|||||||||||||||||||
| (in thousands) | ||||||||||||||||||||||||
| December 31, 2010: |
||||||||||||||||||||||||
| U.S. government sponsored agency securities |
$ | 22,994 | $ | 22,019 | $ | — | $ | — | $ | 22,994 | $ | 22,019 | ||||||||||||
| Mortgage-backed securities: |
||||||||||||||||||||||||
| Residential |
863,353 | 842,386 | 100,990 | 101,751 | 964,343 | 944,137 | ||||||||||||||||||
| Commercial |
145,529 | 149,722 | — | — | 145,529 | 149,722 | ||||||||||||||||||
| Collateralized mortgage obligations |
66,022 | 61,902 | — | — | 66,022 | 61,902 | ||||||||||||||||||
| State and municipal obligations |
76,873 | 77,458 | — | — | 76,873 | 77,458 | ||||||||||||||||||
| Total |
$ | 1,174,771 | $ | 1,153,487 | $ | 100,990 | $ | 101,751 | $ | 1,275,761 | $ | 1,255,238 | ||||||||||||
41
Table of Contents
| AVAILABLE-FOR-SALE | HELD-TO-MATURITY | TOTAL | ||||||||||||||||||||||
| Amortized cost |
Estimated fair value |
Amortized cost |
Estimated fair value |
Amortized cost |
Estimated fair value |
|||||||||||||||||||
| (in thousands) | ||||||||||||||||||||||||
| December 31, 2009: |
||||||||||||||||||||||||
| U.S. government sponsored agency securities |
$ | 44,956 | $ | 45,094 | $ | — | $ | — | $ | 44,956 | $ | 45,094 | ||||||||||||
| Mortgage-backed securities: |
||||||||||||||||||||||||
| Residential |
803,516 | 810,032 | — | — | 803,516 | 810,032 | ||||||||||||||||||
| Commercial |
159,688 | 161,393 | — | — | 159,688 | 161,393 | ||||||||||||||||||
| Collateralized mortgage obligations |
127,641 | 130,098 | — | — | 127,641 | 130,098 | ||||||||||||||||||
| State and municipal obligations |
120,716 | 122,307 | — | — | 120,716 | 122,307 | ||||||||||||||||||
| Other debt securities |
2,220 | 2,347 | — | — | 2,220 | 2,347 | ||||||||||||||||||
| Total |
$ | 1,258,737 | $ | 1,271,271 | $ | — | $ | — | $ | 1,258,737 | $ | 1,271,271 | ||||||||||||
| December 31, 2008: |
||||||||||||||||||||||||
| U.S. government sponsored agency securities |
$ | 64,993 | $ | 66,985 | $ | — | $ | — | $ | 64,993 | $ | 66,985 | ||||||||||||
| Residential mortgage-backed securities |
704,684 | 722,933 | — | — | 704,684 | 722,933 | ||||||||||||||||||
| Collateralized mortgage obligations |
152,198 | 151,703 | — | — | 152,198 | 151,703 | ||||||||||||||||||
| State and municipal obligations |
137,958 | 138,175 | — | — | 137,958 | 138,175 | ||||||||||||||||||
| Other debt securities |
14,563 | 14,773 | 25 | 25 | 14,588 | 14,798 | ||||||||||||||||||
| Total |
$ | 1,074,396 | $ | 1,094,569 | $ | 25 | $ | 25 | $ | 1,074,421 | $ | 1,094,594 | ||||||||||||
Investment securities do not include investments in FHLB and FRB stock of $40.0 million, $31.2 million, and $29.6 million, at December 31, 2010, 2009, and 2008, respectively. These investments are stated at cost.
Our total investment portfolio decreased $16.0 million, or 1.3%, to $1.25 billion at December 31, 2010 as compared to $1.27 billion at December 31, 2009, a decrease of $16.8 million, or 1.3%. During 2010, we decreased the size of our investment portfolio to capture gains on mortgage-backed securities that had higher refinancing risk. During the year, we received $929.4 million of proceeds from the sale of primarily mortgage-backed securities and collateralized mortgage obligations issued by Ginnie Mae, Fannie Mae and Freddie Mac and recorded gains of $41.4 million. We realized gains when we sold mortgage-backed securities that had been experiencing higher than anticipated prepayments and to take advantage of the low level of interest rates and tightening spreads in the market later in the year to reposition our portfolio. Offsetting these sales were purchases of $1.11 billion of mortgage-backed securities and collateralized mortgage obligations. The overall weighted-average life of our investment portfolio at December 31, 2010 was approximately 8.3 years, compared to approximately 6.9 years at December 31, 2009.
Mortgage-related securities include residential and commercial mortgage-backed securities and collateralized mortgage obligations, and comprised 92.1% of our investment portfolio at December 31, 2010, compared to 86.6% at December 31, 2009. As of December 31, 2010, over 99% of mortgage-related securities that we held were securities issued by government and government-sponsored enterprises, such as Ginnie Mae, Fannie Mae, and Freddie Mac. We do not hold subprime loans in our mortgage-related investment securities portfolio. While the fair value of these securities has been impacted by market illiquidity, we do not modify the fair value determined by an independent pricing service, but take additional steps to review for other-than-temporary impairment.
42
Table of Contents
The following table shows the composition of our mortgage-related securities as of December 31, 2010 by type of issuer.
| Amortized Cost | Fair Value | |||||||||||||||||||||||
| Pass Thru Securities |
CMOs | Total | Pass Thru Securities |
CMOs | Total | |||||||||||||||||||
| Ginnie Mae, Fannie Mae, |
$ | 1,101,594 | $ | 66,022 | $ | 1,167,616 | $ | 1,087,318 | $ | 61,902 | $ | 1,149,220 | ||||||||||||
| Private issuers |
8,278 | — | 8,278 | 6,541 | — | 6,541 | ||||||||||||||||||
| Total |
$ | 1,109,872 | $ | 66,022 | $ | 1,175,894 | $ | 1,093,859 | $ | 61,902 | $ | 1,155,761 | ||||||||||||
At December 31, 2010, we had a net unrealized loss on the available-for-sale securities of $21.3 million, or 1.8% of amortized cost, compared to a net unrealized gain on the available for sale securities of $12.5 million, or 1.0% of amortized cost, at December 31, 2009. At December 31, 2010, we held 94 investment securities with a carrying value of $873.3 million that were in a gross unrealized loss position of $29.8 million. We analyzed each of these securities to determine if other-than-temporary impairment has occurred. Our analysis included an evaluation of the type of security; the length of time and extent to which the fair value has been less than the security’s carrying value; the characteristics of the underlying collateral; the degree of credit support provided by subordinate tranches within the total issuance; independent credit ratings; changes in credit ratings; and a cash flow analysis, considering default rates, loss severities based on the location of the collateral and estimated prepayments. Those securities with unrealized losses for more than 12 months and for more than 10% of their carrying value are subjected to further analysis to determine if we expect to receive all the contractual cash flows. We obtained fair value estimates from additional independent sources and performed cash flow analysis to determine if other-than-temporary impairment has occurred. Of the 94 securities with gross unrealized losses at December 31, 2010, only three securities have been in a loss position for 12 months or more, including one security for which we recognized other-than-temporary impairment during the fourth quarter of 2008. Our analysis at December 31, 2010, indicated that these three securities did not have other-than-temporary impairment or did not have any additional other-than-temporary impairment. For additional details, see “Notes to Consolidated Financial Statements–Investment Securities” from our audited financial statements contained elsewhere in this annual report.
The other-than-temporary impairment charge that the Company recorded in 2008 was adjusted effective April 1, 2009 when the Company adopted amended accounting guidance on investments in debt and equity securities which modified the requirements for recognizing other-than-temporary impairment and changed the model used to determine the amount of impairment. Under the revised guidance, declines in fair value of investment securities below their amortized costs basis that are deemed to be other-than-temporary are reflected in earnings as a realized loss to the extent the impairment is related to credit loss. The amount of impairment related to other factors is recognized in other comprehensive income. We recorded the cumulative effect of initial application as an adjustment to the opening balance of retained earnings with a corresponding adjustment to other comprehensive income for one private label mortgage-related security for which an other-than-temporary impairment was recognized in the fourth quarter of 2008 through earnings. The amount of the anticipated credit loss on this investment security was $488,000 upon adoption and no additional credit loss has been recorded since the adoption.
At December 31, 2010, we held no securities of any single issuer that exceeds 10% of stockholders’ equity, other than U.S. government agencies. Although we hold securities issued by municipalities within the State of Illinois that, in the aggregate, exceed 10% of stockholders’ equity, none of the holdings from any individual municipal issuer exceed this threshold.
43
Table of Contents
As a member, we are required to hold stock in the FHLBC and the FRB, which as of December 31, 2010 and 2009 consisted of the following:
| December 31, 2010 |
December 31, 2009 |
|||||||
| (in thousands) | ||||||||
| Federal Home Loan Bank of Chicago (FHLBC) |
$ | 29,500 | $ | 22,250 | ||||
| Federal Reserve Bank (“FRB”) |
10,532 | 8,960 | ||||||
| $ | 40,032 | $ | 31,210 | |||||
The amount of FHLBC stock required to be held is based on the Bank’s asset size and the amount of borrowings from the FHLBC. After increasing our investment in FHLBC stock earlier in 2009, we sold $5.0 million of stock at par during the fourth quarter of 2009 in response to a decrease in borrowings from the FHLBC. Based on our assessment at December 31, 2010 of the ultimate recoverability of our FHLBC stock, we believe no impairment has occurred. For additional details of these investments, see the “Notes to Consolidated Financial Statements—Investment Securities” from our audited financial statements contained elsewhere in this annual report. We did not hold any FHLBC debt securities in our investment portfolio as of December 31, 2010.
The amount of FRB stock required to be held is based on the Bank’s common stock and surplus. The Bank’s surplus increased during 2010 primarily due to the conversion of our Series A Preferred to common stock, which caused the Bank to increase its holdings of FRB stock by $1.6 million.
Investment securities with an approximate book value of $892 million and $674 million at December 31, 2010 and 2009, respectively, were pledged to collateralize certain deposits, securities sold under agreements to repurchase, FHLB advances, and for other purposes as required or permitted by law.
Investment Portfolio – Maturity and Yields
The following table summarizes the contractual maturity of investment securities and their weighted-average yields:
| AS OF DECEMBER 31, 2010 | ||||||||||||||||||||||||||||||||||||||||
| WITHIN ONE YEAR |
AFTER ONE BUT WITHIN FIVE YEARS |
AFTER FIVE BUT WITHIN TEN YEARS |
AFTER TEN YEARS |
TOTAL | ||||||||||||||||||||||||||||||||||||
| AMOUNT | YIELD | AMOUNT | YIELD | AMOUNT | YIELD | AMOUNT | YIELD | AMOUNT | YIELD | |||||||||||||||||||||||||||||||
| (dollars in thousands) | ||||||||||||||||||||||||||||||||||||||||
| Available-for-sale securities (1): |
||||||||||||||||||||||||||||||||||||||||
| U.S. government sponsored agency securities |
$ | — | — | % | $ | 12,468 | 2.66 | % | $ | 9,551 | 3.00 | % | $ | — | — | % | $ | 22,019 | 2.81 | % | ||||||||||||||||||||
| Mortgage-backed securities (2): |
||||||||||||||||||||||||||||||||||||||||
| Residential |
116,819 | 3.51 | 481,761 | 3.47 | 191,433 | 3.67 | 52,373 | 4.14 | 842,386 | 3.46 | ||||||||||||||||||||||||||||||
| Commercial |
2,778 | 4.67 | 12,501 | 4.67 | 91,583 | 4.63 | 42,860 | 4.79 | 149,722 | 4.68 | ||||||||||||||||||||||||||||||
| Collateralized mortgage obligations (2) |
9,168 | 2.75 | 24,888 | 2.85 | 27,846 | 2.97 | — | — | 61,902 | 2.89 | ||||||||||||||||||||||||||||||
| States and municipal obligations (3) |
826 | 7.03 | 1,832 | 7.22 | 27,840 | 6.25 | 46,960 | 6.18 | 77,458 | 6.24 | ||||||||||||||||||||||||||||||
| Total available-for-sale |
$ | 129,591 | 3.51 | % | $ | 533,450 | 3.47 | % | $ | 348,253 | 4.05 | % | $ | 142,193 | 5.01 | % | $ | 1,153,487 | 3.76 | % | ||||||||||||||||||||
| Held-to-maturity securities: |
||||||||||||||||||||||||||||||||||||||||
| Mortgage-backed securities: |
||||||||||||||||||||||||||||||||||||||||
| Residential |
13,117 | 4.53 | 53,322 | 4.48 | 29,368 | 4.54 | 5,183 | 4.52 | 100,990 | 4.51 | ||||||||||||||||||||||||||||||
| Total held-to-maturity |
$ | 13,117 | 4.53 | % | $ | 53,322 | 4.48 | % | $ | 29,368 | 4.54 | % | $ | 5,183 | 4.52 | % | $ | 100,990 | 4.51 | % | ||||||||||||||||||||
| (1) | Based on estimated fair value. |
| (2) | Maturities of mortgage-backed securities and collateralized mortgage obligations (“CMOs”) are based on anticipated lives of the underlying mortgages, not contractual maturities. CMO maturities are based on cash flow (or payment) windows derived from broker market consensus. |
| (3) | Rates on obligations of states and political subdivisions have been adjusted to tax equivalent yields using a 35% income tax rate. |
44
Table of Contents
Loan Portfolio
Our primary source of income is interest on loans. The following table presents the composition of our loan portfolio by type of loan as of the dates indicated:
| As of December 31, | ||||||||||||||||||||
| 2010 | 2009 | 2008 | 2007 | 2006 | ||||||||||||||||
| (in thousands) | ||||||||||||||||||||
| Loans Held for Portfolio: |
||||||||||||||||||||
| Commercial and industrial |
$ | 1,351,862 | $ | 1,264,369 | $ | 1,485,673 | $ | 850,196 | $ | 770,863 | ||||||||||
| Commercial real estate secured |
1,120,361 | 1,171,777 | 1,058,930 | 839,629 | 791,962 | |||||||||||||||
| Residential construction and land |
104,036 | 221,859 | 349,998 | 492,780 | 605,133 | |||||||||||||||
| Commercial construction and land |
106,423 | 142,584 | 181,454 | 178,898 | 139,184 | |||||||||||||||
| Total commercial loans |
2,682,682 | 2,800,589 | 3,076,055 | 2,361,503 | 2,307,142 | |||||||||||||||
| Residential real estate – mortgages |
71,103 | 57,887 | 53,859 | 60,195 | 62,453 | |||||||||||||||
| Home equity loans and lines of credit |
73,316 | 86,227 | 92,085 | 99,696 | 116,516 | |||||||||||||||
| Consumer loans |
6,384 | 8,221 | 9,163 | 10,551 | 13,237 | |||||||||||||||
| Other loans |
1,854 | 557 | 2,115 | 1,421 | 1,396 | |||||||||||||||
| Gross loans |
2,835,339 | 2,953,481 | 3,233,277 | 2,533,366 | 2,500,744 | |||||||||||||||
| Less: Unearned discount |
(1 | ) | (6 | ) | (16 | ) | (33 | ) | (59 | ) | ||||||||||
| Total loans |
2,835,338 | 2,953,475 | 3,233,261 | 2,533,333 | 2,500,685 | |||||||||||||||
| Less: Allowance for loan losses |
(124,568 | ) | (106,185 | ) | (128,548 | ) | (54,681 | ) | (37,516 | ) | ||||||||||
| Loans, net |
$ | 2,710,770 | $ | 2,847,290 | $ | 3,104,713 | $ | 2,478,652 | $ | 2,463,169 | ||||||||||
| Loans Held for Sale |
$ | 259,020 | $ | 81,853 | $ | — | $ | — | $ | — | ||||||||||
Loans Held for Portfolio
Our portfolio loans at December 31, 2010 of $2.84 billion represented a decrease of $118.1 million, or 4.0%, as compared to portfolio loans at December 31, 2009 of $2.95 billion and a decrease of $397.9 million, or 12.3%, from $3.23 billion at December 31, 2008. Approximately 95% of our loan portfolio was comprised of commercial loans, which include commercial and industrial, commercial real estate secured, and real estate-construction loans. Total commercial loans decreased to $2.68 billion at year-end, compared to $2.80 billion at December 31, 2009 and $3.08 billion at December 31, 2008. Although we originated new loans during 2010, including the funding of approximately $390.9 million of new commercial loans, this growth was more than offset as we repositioned our portfolio to reduce our exposure in industries and sectors that we no longer consider desirable. In addition, loan charge-offs and low line usage by our customers combined to produce lower commercial loan balances in 2010.
Commercial and industrial (“C&I”) loans are loans to businesses or for business purposes that are either unsecured or secured by collateral other than commercial real estate. Total C&I loans increased $87.5 million, or 6.9%, to $1.35 billion at December 31, 2010, compared to $1.26 billion at December 31, 2009. These loans are generally made to operating companies in a variety of businesses, but do not include commercial real estate investment loans. We continue to develop new customer relationships and originate C&I loans as part of our strategy. This realignment resulted in a net increase in our C&I loans during 2010.
45
Table of Contents
Loans secured by commercial real estate consist of commercial owner-occupied properties, as well as investment properties. At December 31, 2010, December 31, 2009 and December 31, 2008, the composition of our commercial real estate secured portfolio by type of collateral was as follows:
| December 31, 2010 | December 31, 2009 | December 31, 2008 | ||||||||||||||||||||||
| Balance | Percentage of Total Commercial Real Estate Loans |
Balance | Percentage of Total Commercial Real Estate Loans |
Balance | Percentage of Total Commercial Real Estate Loans |
|||||||||||||||||||
| (dollars in thousands) | ||||||||||||||||||||||||
| Commercial non-owner occupied: |
||||||||||||||||||||||||
| Retail strip centers or malls |
$ | 198,527 | 18 | % | $ | 211,817 | 18 | % | $ | 206,637 | 20 | % | ||||||||||||
| Office/mix use property |
126,624 | 11 | 149,951 | 13 | 145,978 | 13 | ||||||||||||||||||
| Commercial properties |
153,482 | 14 | 144,745 | 12 | 130,227 | 12 | ||||||||||||||||||
| Specialized – other |
123,102 | 11 | 121,530 | 10 | 92,193 | 9 | ||||||||||||||||||
| Other commercial properties |
49,857 | 4 | 64,602 | 6 | 61,478 | 6 | ||||||||||||||||||
| Subtotal commercial non-owner occupied |
651,592 | 58 | 692,645 | 59 | 636,513 | 60 | ||||||||||||||||||
| Commercial owner occupied |
349,028 | 31 | 334,744 | 29 | 270,346 | 26 | ||||||||||||||||||
| Multi-family properties |
119,741 | 11 | 144,388 | 12 | 152,071 | 14 | ||||||||||||||||||
| Total commercial real estate secured |
$ | 1,120,361 | 100 | % | $ | 1,171,777 | 100 | % | $ | 1,058,930 | 100 | % | ||||||||||||
Total commercial real estate loans were $1.12 billion at December 31, 2010 as compared to $1.17 billion at December 31, 2009, a decrease of $51.4 million, or 4.4%. During 2010, loans secured by commercial owner occupied properties increased by $14.3 million, while loans on commercial non-owner occupied properties decreased by $41.1 million and multi-family property related loans decreased $24.6 million.
Total commercial real estate loans were $1.17 billion at December 31, 2009 as compared to $1.06 billion at December 31, 2008, an increase of $112.8 million, or 10.7%. During 2009, loans secured by commercial owner occupied properties increased by $64.4 million, while loans on commercial non-owner occupied properties increased by $56.1 million. Most of the increase in non-owner occupied was in the specialized-other category, which includes loans on properties such as nursing homes, gas stations and convenience stores, churches, and hotels/motels.
Real estate construction and land loans consist primarily of loans to professional real estate developers for the construction of single-family homes, town-homes, and condominium conversions. Our residential real estate construction and loan portfolio decreased $117.8 million, or 53.1%, during 2010 to $104.0 million at December 31, 2010, as compared to $221.9 million at December 31, 2009 and $350.0 million at December 31, 2008. Because of the continued slow down in the residential real estate markets and reduced real estate valuations, we have been actively reducing our exposure to this portion of the loan portfolio.
46
Table of Contents
At the dates indicated, the composition of our residential real estate construction and land portfolio by type of collateral was as follows:
| December 31, 2010 | December 31, 2009 | December 31, 2008 | ||||||||||||||||||||||
| Balance | Percentage of Total Residential Construction Loans |
Balance | Percentage of Total Residential Construction Loans |
Balance | Percentage of Total Residential Construction Loans |
|||||||||||||||||||
| (dollars in thousands) | ||||||||||||||||||||||||
| Residential construction: |
||||||||||||||||||||||||
| Single family attached and detached housing |
$ | 13,585 | 13 | % | $ | 55,849 | 25 | % | $ | 105,526 | 30 | % | ||||||||||||
| Condo (new & conversions) |
39,994 | 38 | 54,424 | 25 | 95,705 | 27 | ||||||||||||||||||
| Multi-family |
18,159 | 18 | 51,191 | 23 | 57,495 | 17 | ||||||||||||||||||
| Completed for sale |
8,947 | 9 | 11,968 | 5 | 16,830 | 5 | ||||||||||||||||||
| Total residential construction |
80,685 | 78 | 173,432 | 78 | 275,556 | 79 | ||||||||||||||||||
| Residential land: |
||||||||||||||||||||||||
| Land – unimproved & farmland |
14,049 | 14 | 37,317 | 17 | 52,321 | 15 | ||||||||||||||||||
| Land – improved & entitled |
1,871 | 1 | 2,271 | 1 | 3,921 | 1 | ||||||||||||||||||
| Land – under development |
7,431 | 7 | 8,839 | 4 | 18,200 | 5 | ||||||||||||||||||
| Total land |
23,351 | 22 | 48,427 | 22 | 74,442 | 21 | ||||||||||||||||||
| Total residential construction and land |
$ | 104,036 | 100 | % | $ | 221,859 | 100 | % | $ | 349,998 | 100 | % | ||||||||||||
We continue to reduce our commercial construction and land portfolio, which declined $36.2 million, or 25.4%, to $106.4 million at December 31, 2010, as compared to $142.6 million at December 31, 2009, and $181.5 million at December 31, 2008.
Our portfolio of residential real estate mortgages totaled $71.1 million at December 31, 2010, as compared to $57.9 million at December 31, 2009 and $53.9 million at December 31, 2008. While these are not loans that we actively marketed in 2010, we do continue to offer these products to our current customers and are not part of Cole Taylor Mortgage.
Our portfolio of home equity loans and lines of credit also continues to decline as a result of our decision to discontinue the origination of third-party sourced home equity products in 2002. At December 31, 2010, this portfolio totaled $73.3 million, compared to $86.2 million at December 31, 2009 and $92.1 million at December 31, 2008. This portfolio as a percentage of total loans decreased to 2.6% at year-end 2010.
47
Table of Contents
The following table shows our maturity distribution of loans as of the dates indicated:
| As of December 31, 2010(1) | ||||||||||||||||||||||||
| ONE YEAR OR LESS |
OVER 1 YEAR THROUGH 5 YEARS |
OVER 5 YEARS | ||||||||||||||||||||||
| FIXED RATE | FLOATING OR ADJUSTABLE RATE |
FIXED RATE |
FLOATING OR ADJUSTABLE RATE |
TOTAL | ||||||||||||||||||||
| (in thousands) | ||||||||||||||||||||||||
| Commercial and commercial real estate |
$ | 919,840 | $ | 531,384 | $ | 986,123 | $ | 13,280 | $ | 21,596 | $ | 2,472,223 | ||||||||||||
| Residential construction and land |
101,605 | 199 | 2,232 | — | — | 104,036 | ||||||||||||||||||
| Commercial construction and land |
66,838 | 11,315 | 28,270 | — | — | 106,423 | ||||||||||||||||||
| Residential real estate – mortgages |
9,586 | 7,373 | 4,775 | 26,365 | 23,004 | 71,103 | ||||||||||||||||||
| Home equity loans and lines of credit |
10,249 | 4,172 | 40,556 | 156 | 18,183 | 73,316 | ||||||||||||||||||
| Consumer |
718 | 1,626 | — | 3,743 | 296 | 6,383 | ||||||||||||||||||
| Other loans |
1,854 | — | — | — | — | 1,854 | ||||||||||||||||||
| Total loans (excluding loans held for sale) |
$ | 1,110,690 | $ | 556,069 | $ | 1,061,956 | $ | 43,544 | $ | 63,079 | $ | 2,835,338 | ||||||||||||
| (1) | Maturities are based upon contractual dates. Demand loans are included in the one year or less category and totaled $1.1 million as of December 31, 2010. |
Loans Held for Sale
At December 31, 2010, we held $259.0 million of residential mortgage loans classified as held for sale as compared to $81.9 million of commercial and residential mortgage loans classified as held for sale at December 31, 2009.
Loans held for sale at December 31, 2010 are entirely derived from Cole Taylor Mortgage. This business sources mortgages through both retail offices and brokers throughout the United States, as well as through the Chicago based banking centers. Currently, we sell the all the loans originated by this unit to institutional investors rather than hold the loans for portfolio.
In 2009, in an effort to reduce the level of nonperforming loans, we decided to sell certain of our commercial nonaccrual loans. In connection with this decision, during the third quarter of 2009, we completed the sale of a group of loans. We also transferred certain other nonaccrual commercial loans into the held for sale category as we actively marketed these loans for sale. Upon transfer into the held for sale category, we recorded a charge-off to reduce the loans to their estimated net fair value.
We also had residential mortgage loans classified as held for sale at December 31, 2009, which we intended to sell to third party institutional investors. During the third quarter of 2009, we purchased a participation interest in 20 pools of residential single family mortgages totaling approximately $100 million. These loans were to have been pooled into pass-through certificates to be issued by a mortgage originator and guaranteed by the Government National Mortgage Association, otherwise known as Ginnie Mae, and sold to third party investors. The mortgage originator completed the securitization of a portion of these loans in early August and we received payment for the sale of these loans. However, the mortgage loan originator was not able to securitize the remaining single family loans because Ginnie Mae removed the originator from its list of eligible issuers, so we
48
Table of Contents
took possession of the underlying collateral. During 2010, we sold approximately $40.9 million of these loans for a loss of $2.8 million, compared to sales of approximately $10.5 million of these loans in the fourth quarter of 2009 at a small gain. Any remaining loans were transferred to the loan portfolio by the end of 2010.
Nonperforming Assets
Our lending officers and their managers are responsible for the ongoing review of present and projected future performance of the loans within their assigned portfolio and for risk rating such loans in accordance with the Bank’s risk rating system. In addition, a loan review function independently risk rates loans to monitor and confirm the reasonableness of the lending officer’s risk rating conclusion. Delinquency reports are reviewed monthly by the lending officers, their managers and credit administration. The responsible lending officer reports to a loan committee about the current status of loans past due or current but graded below a designated level. The committee evaluates whether the loan is appropriately risk rated and determines if the loan should be placed on nonaccrual, the need for a specific allowance for loan loss, or, if appropriate, a partial or full charge-off. Most loans rated substandard or below are transferred to a separate loan work-out department, staffed by collection professionals. We have increased the size of our loan work-out department to effectively handle the increased volume of nonperforming assets. When the loan is transferred to work-out, an independent legal review of the loan documents is performed and current appraisals are obtained for loans secured by real estate.
The following table sets forth the amounts of nonperforming loans and nonperforming assets as of the dates indicated:
| As of December 31, | ||||||||||||||||||||
| 2010 | 2009 | 2008 | 2007 | 2006 | ||||||||||||||||
| (dollars in thousands) | ||||||||||||||||||||
| Loans contractually past due 90 days or more but still accruing interest |
$ | 55 | $ | 59 | $ | 153 | $ | 4,253 | $ | 10,046 | ||||||||||
| Nonaccrual loans |
159,685 | 141,403 | 200,227 | 71,412 | 23,111 | |||||||||||||||
| Total nonperforming loans |
159,740 | 141,462 | 200,380 | 75,665 | 33,157 | |||||||||||||||
| Other real estate owned and repossessed assets |
31,490 | 26,231 | 13,179 | 2,606 | 412 | |||||||||||||||
| Total nonperforming assets |
$ | 191,230 | $ | 167,693 | $ | 213,559 | $ | 78,271 | $ | 33,569 | ||||||||||
| Restructured loans not included in nonperforming assets |
$ | 29,786 | $ | 1,196 | $ | — | $ | — | $ | — | ||||||||||
| Nonperforming loans to total loans |
5.16 | % | 4.66 | % | 6.20 | % | 2.99 | % | 1.33 | % | ||||||||||
| Nonperforming assets to total loans plus other real estate owned and repossessed assets |
6.12 | % | 5.48 | % | 6.58 | % | 3.09 | % | 1.34 | % | ||||||||||
| Nonperforming assets to total assets |
4.26 | % | 3.81 | % | 4.87 | % | 2.20 | % | 0.99 | % | ||||||||||
The following table presents loans past due 30 to 89 days and still accruing interest as of the dates indicated:
| As of December 31, | ||||||||||||||||||||
| 2010 | 2009 | 2008 | 2007 | 2006 | ||||||||||||||||
| (dollars in thousands) | ||||||||||||||||||||
| Loans contractually past due 30 through 89 days and still accruing interest |
$ | 11,948 | $ | 13,206 | $ | 25,272 | $ | 63,553 | $ | 59,199 | ||||||||||
| 30 – 89 days past due to total loans |
0.39 | % | 0.44 | % | 0.78 | % | 2.51 | % | 2.37 | % | ||||||||||
Nonperforming Loans
Nonperforming loans include nonaccrual loans and interest-accruing loans contractually past due 90 days or more. We evaluate all loans on which principal or interest is contractually past due 90 days or more to determine if they are adequately secured and in the process of collection. If sufficient doubt exists as to the full collection of
49
Table of Contents
principal and interest on a loan, we place it on nonaccrual and we discontinue recognizing interest income. After a loan is placed on nonaccrual status, any current period interest previously accrued but not yet collected is reversed against current income. Interest is included in income subsequent to the date the loan is placed on nonaccrual status only as interest is received and so long as management is satisfied that there is a high probability that principal will be collected in full. The loan is returned to accrual status only when the borrower has made required payments for a minimum length of time and demonstrates the ability to make future payments of principal and interest as scheduled.
The following table presents the composition of nonaccrual loans as of the dates indicated:
| As of December 31, | ||||||||||||
| Loan Category |
2010 | 2009 | 2008 | |||||||||
| Commercial and industrial |
$ | 71,438 | $ | 26,687 | $ | 42,263 | ||||||
| Commercial real estate secured |
42,221 | 36,420 | 23,068 | |||||||||
| Residential construction and land |
20,660 | 62,795 | 114,160 | |||||||||
| Commercial construction and land |
12,734 | 4,245 | 14,934 | |||||||||
| Total commercial loans |
147,053 | 130,147 | 194,425 | |||||||||
| Consumer loans |
12,632 | 11,256 | 5,802 | |||||||||
| Total nonaccrual loans |
$ | 159,685 | $ | 141,403 | $ | 200,227 | ||||||
After decreasing in 2009, nonaccrual loans increased during 2010 to $159.7 million at December 31, 2010 as compared to $141.4 million at December 31, 2009, an increase of $18.3 million, or 12.9%. Nonaccrual loans at December 31, 2008 were $200.2 million. The increase in total nonaccrual loans during 2010 was due primarily to the deterioration of loans to banks and bank holding companies largely offset by loan charge-offs. The decrease in total nonaccrual loans during 2009 was largely due to $116.2 million of gross loan charge-offs during the year, transfers into other real estate owned of $29.1 million and repayments and other resolutions of certain assets partially offset by new nonaccrual loans.
Commercial and industrial is our largest category of nonaccrual loans and comprises approximately 45% of all nonaccrual loans at December 31, 2010. Nonaccrual commercial and industrial loans were $71.4 million at December 31, 2010, as compared to $26.7 million at December 31, 2009 and $42.3 million at December 31, 2008. This increase was primarily due to the deterioration of loans to bank and bank holding companies.
Commercial real estate secured loans were our second largest category of nonaccrual loans. This category increased to $42.2 million at December 31, 2010, from $36.4 million at December 31 2009 and $23.1 million at December 31, 2008. New nonaccrual loans, partly offset by charge-offs, resulted in the increase in this category.
Residential construction and land loans had previously been our largest category of nonaccrual loans, but were only 12.9% of all nonaccrual loans at December 31, 2010. Residential construction and land nonaccrual loans decreased to $20.7 million at December 31, 2010 as compared to $62.8 million at December 31, 2009 and $114.2 million at December 31, 2008. The decrease in these nonperforming loans during 2010 was due to loan sales, net charge-offs and transfers to other real estate owned.
The level of nonaccrual loans in our consumer portfolio increased to $12.6 million at December 31, 2010 from $11.3 million at December 31, 2009 and $5.8 million at December 31, 2008. Approximately 95% of the consumer nonaccrual loans are from our portfolio of home equity loans and lines of credit.
50
Table of Contents
Other Real Estate Owned and Repossessed Assets
Other real estate owned and repossessed assets increased from $26.2 million at December 31, 2009 to $31.5 million at December 31, 2010. The following table provides a rollforward, for the periods indicated, of other real estate owned and repossessed assets:
| For the Period Ended December 31, | ||||||||||||
| 2010 | 2009 | 2008 | ||||||||||
| Balance at beginning of period |
$ | 26,231 | $ | 13,179 | $ | 2,606 | ||||||
| Transfers from loans |
34,725 | 29,076 | 14,478 | |||||||||
| Additional investment in foreclosed properties |
— | 342 | 1,625 | |||||||||
| Dispositions |
(15,957 | ) | (14,310 | ) | (4,673 | ) | ||||||
| Additional impairment |
(13,509 | ) | (2,056 | ) | (857 | ) | ||||||
| Balance at end of period |
$ | 31,490 | $ | 26,231 | $ | 13,179 | ||||||
During 2010, we transferred $34.7 million from loans into other real estate and repossessed assets. Of the amount transferred, $18.6 million was from our residential construction and land portfolio, $10.7 million was from our commercial real estate secured portfolio, $3.9 million was from our commercial construction and land portfolio. We received proceeds of $16.8 million on assets that had a carrying value of $16.0 million, resulting in a net loss of $800,000, which was included as additional nonperforming asset expense in noninterest expense. We also wrote down the carrying value of certain other real estate owned and repossessed assets by $13.5 million during 2010 to reflect a decrease in the estimated fair value of those assets. During 2009, we transferred $29.1 million from loans into other real estate and repossessed assets. We received net proceeds of $13.6 million on the sale of other real estate owned that had a carrying value of $14.3 million. This resulted in a net loss of $758,000, which was included as additional nonperforming asset expense in noninterest expense. We also wrote down the carrying value of certain other real estate owned and repossessed assets by $2.1 million during 2009 to reflect a decrease in the estimated fair value of those assets. The level of other real estate owned and repossessed assets increased during 2010, and we expect that these assets may continue to increase in the future as we work through the elevated level of nonperforming assets.
Impaired Loans
After decreasing in 2009, the level of impaired loans also increased during 2010. At December 31, 2010, impaired loans totaled $181.1 million, compared to $141.7 million at December 31, 2009, an increase of $39.4 million, or 27.8%. Total impaired loans were $206.7 million at December 31, 2008.
51
Table of Contents
The balance of impaired loans and the related allowance for loan losses for impaired loans are as follows:
| Dec. 31, 2010 |
Dec. 31, 2009 |
Dec. 31, 2008 |
||||||||||
| (in thousands) | ||||||||||||
| Impaired loans: |
||||||||||||
| Commercial and industrial |
$ | 78,804 | $ | 31,447 | $ | 54,543 | ||||||
| Commercial real estate secured |
63,831 | 36,420 | 23,068 | |||||||||
| Residential construction and land |
24,190 | 68,389 | 114,160 | |||||||||
| Commercial construction and land |
12,734 | 4,245 | 14,934 | |||||||||
| Consumer-oriented |
1,522 | 1,196 | — | |||||||||
| Total impaired loans |
$ | 181,081 | $ | 141,697 | $ | 206,705 | ||||||
| Recorded balance of impaired loans: |
||||||||||||
| With related allowance for loan losses |
$ | 136,404 | $ | 95,936 | $ | 120,973 | ||||||
| With no related allowance for loan losses |
44,677 | 45,761 | 85,732 | |||||||||
| Total impaired loans |
$ | 181,081 | $ | 141,697 | $ | 206,705 | ||||||
| Allowance for losses on impaired loans: |
||||||||||||
| Commercial and industrial |
$ | 35,258 | $ | 10,085 | $ | 13,431 | ||||||
| Commercial real estate secured |
10,940 | 4,485 | 2,750 | |||||||||
| Residential construction and land |
5,189 | 19,070 | 23,849 | |||||||||
| Commercial construction and land |
8,470 | — | 1,421 | |||||||||
| Consumer-oriented |
— | — | — | |||||||||
| Total allowance for losses on impaired loans |
$ | 59,857 | $ | 33,640 | $ | 41,451 | ||||||
Impaired loans increased in 2010, primarily the result of new impaired loans from the bank and bank holding company portfolio, which were partially offset by net charge-offs, transfers into other real estate owned and the payment or resolution of certain assets during the period. The allowance for loan losses related to impaired loans also increased during 2010 and totaled $59.9 million at December 31, 2010, as compared to $33.6 million at December 31, 2009 and $41.5 million at December 31, 2008. The decrease in the allowance for losses on impaired loans in 2009 was primarily due to an increase in the estimated impairment on these loans, partially offset by net charge-offs during the period.
Once we determine that a loan is impaired, we perform an individual analysis to establish the amount of the related allowance for loan losses, if any, based upon the present value of expected future cash flows discounted at the loan’s effective interest rate, except that collateral-dependent loans may be measured for impairment based upon the fair value of the collateral, less cost to sell. Generally, since the majority of our impaired loans are collateral-dependent real estate loans, the fair value is determined by a current appraisal. The individual impairment analysis also considers available and reliable borrower guarantees and any cross-collateralization agreements. Certain other loans are collateralized by business assets, such as equipment, inventory, and accounts receivable. The fair value of these loans is based upon estimates of realizability and collectability of the underlying collateral. While impaired loans exhibit weaknesses that may inhibit repayment in compliance with the original note terms, the impairment analysis may not result in a related allowance for loan losses for each individual loan. At December 31, 2010, we determined that $136.4 million of our loans were impaired and had related allowances for loan losses of $59.9 million. We also held $44.7 million of impaired loans, for which the individual analysis did not result in a measure of impairment, so no related allowance for loan losses was provided.
Impaired loans include all nonaccrual loans, accruing loans judged to have higher risk of noncompliance with the present contractual repayment schedule for both interest and principal, as well as troubled-debt restructurings. Unless modified in a troubled-debt restructuring, certain homogenous loans, such as residential
52
Table of Contents
mortgage and consumer loans, are collectively evaluated for impairment and are, therefore, excluded from impaired loans. As of December 31, 2010, we had five commercial loans, totaling $32.5 million which were considered to have a higher risk of noncompliance with the existing loan terms. Even though these loans were still accruing interest, we reported the loans as impaired loans. In addition, during 2010, we completed the modification of certain consumer-orientated loans, primarily home equity loans, with a remaining total principal balance of $1.5 million, which were considered troubled-debt restructurings. These loans are reported as impaired loans and evaluated for impairment.
At December 31, 2010, we held $29.8 million of loans classified as performing restructured loans which included commercial loans of $28.3 million and consumer loans of $1.5 million. At December 31, 2010, we did not have additional commitments to lend on loans considered troubled-debt restructurings.
The balance of nonaccrual loans and impaired loans as of December 31, 2010 is presented below:
| Nonaccrual Loans |
Impaired Loans |
|||||||
| (dollars in thousands) | ||||||||
| Commercial nonaccrual loans |
$ | 147,053 | $ | 147,053 | ||||
| Commercial loans on accrual but impaired |
n/a | 32,506 | ||||||
| Consumer-oriented loans |
12,632 | 1,522 | ||||||
| $ | 159,685 | $ | 181,081 | |||||
| n/a – not applicable |
||||||||
Potential Problem Loans
As part of our standard credit administration process, we risk rate our commercial loan portfolio. As part of this process, loans that are rated with a higher level of risk are monitored more closely. We internally identify certain loans in our loan risk ratings that we have placed on heightened monitoring because of certain weaknesses that may inhibit the borrower’s ability to perform under the contractual terms of the loan agreement but have not reached the status of nonaccrual loans. As of December 31, 2010, these potential problem loans totaled $46.8 million of which $32.4 million were in our secured by commercial real estate portfolio, $9.3 million were in our commercial and industrial portfolio, and the remaining $5.1 million were loans in the construction and land portfolio. In comparison, potential problem loans at December 31, 2009 totaled $75.6 million. The largest categories of potential problem loans at December 31, 2009 were construction and land loans of $30.7 million and C&I loans of $30.0 million. The remaining $14.9 million were loans in our commercial real estate secured category. We do not necessarily expect to realize losses on potential problem loans, but we recognize potential problem loans can carry a higher probability of default and require additional attention by management.
Allowance for Loan Losses
We have established an allowance for loan losses to provide for loans in our portfolio that may not be repaid in their entirety. The allowance is based on our regular, quarterly assessments of the probable estimated losses inherent in the loan portfolio. Our methodology for measuring the appropriate level of the allowance relies on several key elements, which include the formula described below and specific allowances for identified problem loans and portfolio categories.
We calculate the formula portion of the allowance by applying loss factors to categories of loans outstanding in the portfolio. The loans are categorized by loan type as commercial and industrial; commercial real estate secured; residential real estate construction; commercial real estate construction loans; residential real estate mortgage; and consumer loans. Those categories are further segregated by risk classification (for commercial loans) and by delinquency status (for consumer loans). Each commercial, commercial real estate and real estate construction loan has a risk grade based on formal defined criteria. For consumer loans, we further
53
Table of Contents
categorize the loans into consumer loan product types; such as home equity loans and loans secured by manufactured homes. Segregation of the loans into more discrete pools facilitates greater precision in matching historic and expected loan losses with the source of the loss. We adjust these pools from time to time, based on the changing composition of the loan portfolio, grouping loans with similar attributes and risk characteristics. We calculate actual historic loss rates based upon current and prior years charge-off experience for each separate loan grouping identified. The historical loss rates are then weighted based on our evaluation of the duration of the economic cycle to arrive at a current expected loss rate. The 2010 allowance reflects loss experience from the last three years while the 2009 allowance reflects loss experience from the preceding two year period. The current expected loss rates are adjusted, if deemed appropriate, for other relevant factors affecting the loan groupings, including changes in lending practices, trends in past due loans and industry, geographical, collateral and size concentrations. Finally, the resulting loss factors are multiplied against the current period loans outstanding to derive an estimated loss.
Specific allowances are established in cases where management has identified conditions or circumstances related to a loan that indicate a loss will probably be incurred, but where the degree of certainty and loss quantification has not reached the charge-off level. The amount in the allowance for loan losses for impaired loans is determined based on the present value of either expected future cash flows discounted at the loan’s effective interest rate or the fair value of the collateral, net of cost to sell. In recent periods, our estimate of the amount of loss on a loan secured by real estate has increased in complexity as a result of the current illiquidity in the real estate market. The degree of uncertainty and the sensitivity of real estate valuations to the underlying assumptions regarding holding period until sale and the collateral liquidation method can have a material impact on our loss estimates on loans. If the estimated recoverable amount of the impaired loan is less than the recorded investment in the loan, a specific allowance is established.
Management believes that the allowance for loan losses is adequate to absorb probable losses on existing loans that may become uncollectible. However, there can be no assurance that our allowance will prove sufficient to cover actual loan losses in the future. In addition, various regulatory agencies, as an integral part of their examination process, periodically review the adequacy of our allowance for loan losses. Such agencies may require us to make additional provisions to the allowance based upon their judgments about information available to them at the time of their examinations.
54
Table of Contents
The following table shows an analysis of our allowance for loan losses and other related data for the periods indicated:
| Year Ended December 31, | ||||||||||||||||||||
| 2010 | 2009 | 2008 | 2007 | 2006 | ||||||||||||||||
| (dollars in thousands) | ||||||||||||||||||||
| Average total loans |
$ | 3,034,898 | $ | 3,171,373 | $ | 2,790,723 | $ | 2,507,395 | $ | 2,430,590 | ||||||||||
| Total loans at end of year |
$ | 3,094,358 | $ | 3,035,328 | $ | 3,233,261 | $ | 2,533,333 | $ | 2,500,685 | ||||||||||
| Allowance for loan losses: |
||||||||||||||||||||
| Allowance at beginning of year |
$ | 106,185 | $ | 128,548 | $ | 54,681 | $ | 37,516 | $ | 37,481 | ||||||||||
| Charge-offs: |
||||||||||||||||||||
| Commercial and commercial real estate |
(63,619 | ) | (50,945 | ) | (16,176 | ) | (5,261 | ) | (5,341 | ) | ||||||||||
| Real estate – construction |
(60,638 | ) | (63,103 | ) | (54,778 | ) | (8,926 | ) | (1,059 | ) | ||||||||||
| Residential real estate – mortgages |
(1,276 | ) | (356 | ) | — | (180 | ) | (7 | ) | |||||||||||
| Consumer (1) |
(3,362 | ) | (1,756 | ) | (1,517 | ) | (1,425 | ) | (824 | ) | ||||||||||
| Subtotal |
(128,895 | ) | (116,160 | ) | (72,471 | ) | (15,792 | ) | (7,231 | ) | ||||||||||
| Recoveries: |
||||||||||||||||||||
| Commercial and commercial real estate |
2,067 | 1,868 | 1,523 | 702 | 904 | |||||||||||||||
| Real estate – construction |
1,116 | 2,070 | 220 | 54 | 1 | |||||||||||||||
| Residential real estate – mortgages |
316 | 2 | 2 | — | 2 | |||||||||||||||
| Consumer (1) |
652 | 246 | 435 | 301 | 359 | |||||||||||||||
| Subtotal |
4,151 | 4,186 | 2,180 | 1,057 | 1,266 | |||||||||||||||
| Total net charge-offs |
(124,744 | ) | (111,974 | ) | (70,291 | ) | (14,735 | ) | (5,965 | ) | ||||||||||
| Provision for loan losses |
143,127 | 89,611 | 144,158 | 31,900 | 6,000 | |||||||||||||||
| Allowance at end of year |
$ | 124,568 | $ | 106,185 | $ | 128,548 | $ | 54,681 | $ | 37,516 | ||||||||||
| Annual net charge-offs to average total loans |
4.11 | % | 3.53 | % | 2.52 | % | 0.59 | % | 0.25 | % | ||||||||||
| Allowance to total loans (excluding loans held for sale) at end of year |
4.39 | % | 3.60 | % | 3.98 | % | 2.16 | % | 1.50 | % | ||||||||||
| Allowance to nonperforming loans |
77.98 | % | 75.06 | % | 64.15 | % | 72.27 | % | 113.15 | % | ||||||||||
| (1) | Consumer loan charge-offs and recoveries include charge-offs and recoveries relating to indirect and direct auto loans, home equity loans and lines of credit, overdrafts and all other types of consumer loans. |
Our allowance for loan losses was $124.6 million at December 31, 2010, or 4.39% of end-of-year loans (excluding loans held for sale) and 77.98% of nonperforming loans. In comparison, the allowance for loan losses was $106.2 million at December 31, 2009, or 3.60% of total loans (excluding loans held for sale) and 75.06% of nonperforming loans. At December 31, 2008, the allowance for loan losses was $128.5 million, or 3.98% of total loans and 64.15% of nonperforming loans.
Total nonperforming loans increased from $141.5 million at December 31, 2009, to $159.7 million at December 31, 2010, while the level of impaired loans increased to $181.1 million at December 31, 2010, from $141.7 million at December 31, 2009, primarily due to the deterioration of loans to banks and bank holding companies. This deterioration, and our continued efforts to resolve our nonperforming assets and impaired loans, resulted in an increased provision for loan losses, higher charge-offs in 2010, and an overall increase in the allowance for loan losses.
55
Table of Contents
We charge-off loans when the loss is highly probable and clearly identified. During 2010, net charge-offs were $124.7 million, or 4.11% of average loans. In comparison, during 2009 net charge-offs were $112.0 million, or 3.53% of average loans, and $70.3 million, or 2.52% of average loans, during 2008. In both 2010 and 2009, most of our loan charge-offs were from our real estate-construction portfolio, primarily residential construction and land loans.
The unallocated portion of the allowance for loan losses is based on our evaluation of conditions that are not directly measured in the determination of the formula or specific allowances. During 2008, we increased the unallocated portion of allowance for loan losses in response to the increase in problem loans and because of the economic downturn, which increased the uncertainty inherent in our computation of the allowance for loan losses, including the expected loss rates applied to our portfolio. In increasing the unallocated portion of the allowance for loan losses in 2008, we considered the uncertainty surrounding current real estate and collateral valuations, the duration of the economic downturn and its impact on business conditions, forecasts of national and local economic conditions, concern about exposure in portions of the loan portfolio that were no longer considered economically desirable, and other factors. During 2010 and 2009, we reduced the unallocated portion of the allowance for loan losses as the formula portion of our allowance increased as a result of the our historical loss experience rates including the historically high level of net charge-offs during the past three years. In addition to the higher loss experience and the reduced level of nonperforming and impaired loans, our considerations in the determination of the unallocated portion of the allowance for loan losses included, but were not limited to, the current national and local economic climate, forecasts of economic recovery, proactive reductions to certain exposures in our loan portfolio, and our current lending policies, underwriting standards and loan review system.
As a commercial bank, our loan portfolio is comprised primarily of commercial loans to businesses. These loans are inherently larger in amount than loans to individual consumers and, therefore, have higher potential for losses on an individual loan basis. The individually larger commercial loans can cause greater volatility in reported credit quality performance measures, such as total impaired or nonperforming loans. Our current credit risk rating and loss estimate with respect to a single sizable loan can have a material impact on our reported impaired loans and related loss exposure estimates and, therefore, our allowance for loan losses. We review our estimates on a quarterly basis and, as we identify changes in estimates, the allowance for loan losses is adjusted through the recording of a provision for loan losses.
56
Table of Contents
The table below presents the allocation of the allowance for loan losses among the various loan categories and sets forth the percentage of loans in each category to gross loans. The allocation of the allowance for loan losses as shown in the table should neither be interpreted as an indication of future charge-offs, nor as an indication that charge-offs in future periods will necessarily occur in these amounts or in the indicated proportions. While we allocated the allowance to loan losses to loan categories for analytical purposes, the total allowance for loan losses is available to absorb losses from any category of loans.
| As of December 31, | ||||||||||||||||||||||||||||||||||||||||
| 2010 | 2009 | 2008 | 2007 | 2006 | ||||||||||||||||||||||||||||||||||||
| AMOUNT | LOAN CATEGORY TO GROSS LOANS |
AMOUNT | LOAN CATEGORY TO GROSS LOANS |
AMOUNT | LOAN CATEGORY TO GROSS LOANS |
AMOUNT | LOAN CATEGORY TO GROSS LOANS |
AMOUNT | LOAN CATEGORY TO GROSS LOANS |
|||||||||||||||||||||||||||||||
| (dollars in thousands) | ||||||||||||||||||||||||||||||||||||||||
| Allocated: |
||||||||||||||||||||||||||||||||||||||||
| Commercial and commercial real estate |
$ | 92,920 | 80.0 | % | $ | 55,925 | 80.3 | % | $ | 56,005 | 78.7 | % | $ | 26,743 | 66.7 | % | $ | 20,752 | 62.5 | % | ||||||||||||||||||||
| Real estate – construction |
26,668 | 6.8 | 43,459 | 12.5 | 48,041 | 16.4 | 17,254 | 26.5 | 9,884 | 29.8 | ||||||||||||||||||||||||||||||
| Residential real estate – mortgages |
1,193 | 10.6 | 603 | 2.3 | 546 | 1.7 | 464 | 2.4 | 413 | 2.5 | ||||||||||||||||||||||||||||||
| Consumer and other |
3,787 | 2.6 | 4,164 | 4.9 | 2,752 | 3.2 | 2,101 | 4.4 | 1,875 | 5.2 | ||||||||||||||||||||||||||||||
| Unallocated |
— | — | 2,034 | — | 21,204 | — | 8,119 | — | 4,592 | — | ||||||||||||||||||||||||||||||
| Total allowance for loan losses |
$ | 124,568 | 100.0 | % | $ | 106,185 | 100.0 | % | $ | 128,548 | 100.0 | % | $ | 54,681 | 100.0 | % | $ | 37,516 | 100.0 | % | ||||||||||||||||||||
Deposits
Our deposits consist of noninterest and interest-bearing demand deposits, savings deposits, certificates of deposit (“CDs”), and certain public funds. Our customer repurchase agreements are reported in other borrowings. In addition to funding from customers, we also use brokered CDs and money market accounts and other out-of-local-market CDs to support our asset base.
The following table sets forth, for the periods indicated, the distribution of our average deposit account balances and average cost of funds on each category of deposits:
| Year Ended December 31, | ||||||||||||||||||||||||||||||||||||
| 2010 | 2009 | 2008 | ||||||||||||||||||||||||||||||||||
| AVERAGE BALANCE |
PERCENT OF DEPOSITS |
RATE | AVERAGE BALANCE |
PERCENT OF DEPOSITS |
RATE | AVERAGE BALANCE |
PERCENT OF DEPOSITS |
RATE | ||||||||||||||||||||||||||||
| (dollars in thousands) | ||||||||||||||||||||||||||||||||||||
| Noninterest-bearing demand deposits |
$ | 602,757 | 20.1 | — | % | $ | 584,512 | 18.8 | % | — | % | $ | 409,322 | 14.0 | % | — | % | |||||||||||||||||||
| NOW accounts |
270,716 | 9.1 | 1.27 | 226,039 | 7.3 | 1.59 | 127,018 | 4.4 | 1.39 | |||||||||||||||||||||||||||
| Money market accounts |
541,537 | 18.1 | 0.91 | 435,364 | 14.0 | 0.92 | 620,983 | 21.3 | 1.83 | |||||||||||||||||||||||||||
| Savings deposits |
40,616 | 1.4 | 0.08 | 41,848 | 1.3 | 0.08 | 45,247 | 1.5 | 0.13 | |||||||||||||||||||||||||||
| Time deposits: |
||||||||||||||||||||||||||||||||||||
| Certificates of deposit |
761,143 | 25.4 | 2.31 | 824,594 | 26.6 | 3.41 | 715,422 | 24.5 | 4.21 | |||||||||||||||||||||||||||
| Out-of-local-market certificates of deposit |
95,366 | 3.2 | 1.77 | 105,821 | 3.4 | 3.41 | 155,841 | 5.3 | 4.50 | |||||||||||||||||||||||||||
| Brokered certificates of deposit |
468,250 | 15.7 | 3.10 | 706,076 | 22.8 | 3.78 | 770,548 | 26.4 | 4.57 | |||||||||||||||||||||||||||
| CDARS time deposits |
147,114 | 4.9 | 1.14 | 105,750 | 3.4 | 1.56 | 1,063 | * | 2.05 | |||||||||||||||||||||||||||
| Public funds |
62,066 | 2.1 | 0.74 | 73,928 | 2.4 | 1.93 | 75,698 | 2.6 | 3.50 | |||||||||||||||||||||||||||
| Total time deposits |
1,533,939 | 51.3 | 2.34 | 1,816,169 | 58.6 | 3.39 | 1,718,572 | 58.8 | 4.37 | |||||||||||||||||||||||||||
| Total deposits |
$ | 2,989,565 | 100.0 | $ | 3,103,932 | 100.0 | % | $ | 2,921,142 | 100.0 | % | |||||||||||||||||||||||||
| * | less than 1%. |
57
Table of Contents
During 2010, average deposit balances decreased $114.4 million, or 3.7%, to $3.0 billion from $3.10 billion during 2009. During 2009, average deposit balances increased $182.8 million, or 6.3%, to $3.10 billion from $2.92 billion during 2008. During 2009 and 2010, we continued to focus on increasing deposits from our core customers in order to reduce our reliance on the more costly brokered funding.
Average noninterest-bearing deposit balances during 2010 increased $18.2 million, or 3.1%, to $602.8 million, compared to $584.5 million during 2009. The increase in noninterest-bearing deposits was largely due to our in-market deposit initiative. Noninterest-bearing deposit balances increased as a result of the FDIC’s increase in the maximum deposit insurance amount and the Bank’s participation in a FDIC program to insure the entire amount of noninterest-bearing deposits and certain other transaction accounts. Total average time deposits decreased $282.2 million, or 15.5%, to $1.53 billion during 2010 compared to $1.82 billion during 2009. During 2010, average CDs from our local customers decreased by $63.5 million, as compared to 2009. We participated in the Certificate of Deposit Account Registry Service (“CDARS”) network in all of 2010, and average CDARS time deposits increased by $41.4 million. During 2010, we further reduced our reliance on brokered and out-of-local-market CDs, which decreased by $237.8 million and $10.5 million, respectively, as compared to 2009. In addition, between the two periods, NOW accounts increased by $44.7 million largely due to one customer, while money market accounts increased by $106.2 million from our efforts to increase our customer balances.
Average deposit balances increased $182.8 million, or 6.3%, to $3.10 billion in 2009, from $2.92 billion during 2008. Total average time deposits increased $97.6 million, or 5.7%, while average money market account balances declined $185.6 million, or 29.9%. Brokered and out-of-local-market CDs decreased, with the average balance of these two categories decreasing by $114.5 million, or 12.4%. The majority of the increase in time deposits was due to our participation in the CDARs network at the end of 2008 and average CDARs time deposits increased by $104.7 million during 2009. Promotions of CDs in our local market increased customer CDs $109.2 million, or 15.3%, to $824.6 million. The decline in average money market account balances was attributable to both the loss of a large customer as well as the transfer of another large depositor’s balances from a money market to a NOW account.
The following table sets forth the period-end balances of total deposits at December 31, 2010, December 31, 2009 and December 31, 2008, as well as categorizes our deposits as “in-market” and “out-of-market” deposits.
| At December 31, | ||||||||||||
| 2010 | 2009 | 2008 | ||||||||||
| (in thousands) | ||||||||||||
| In-market deposits: |
||||||||||||
| Noninterest-bearing deposits |
$ | 633,300 | $ | 659,146 | $ | 470,990 | ||||||
| NOW accounts |
248,662 | 307,025 | 218,451 | |||||||||
| Savings accounts |
37,992 | 41,479 | 42,275 | |||||||||
| Money market accounts |
583,365 | 438,080 | 320,691 | |||||||||
| Customer certificates of deposit |
715,030 | 775,663 | 870,183 | |||||||||
| CDARS time deposits |
182,879 | 116,256 | 5,670 | |||||||||
| Public time deposits |
70,697 | 68,763 | 84,831 | |||||||||
| Total in-market deposits |
2,471,925 | 2,406,412 | 2,013,091 | |||||||||
| Out-of-market deposits: |
||||||||||||
| Brokered money market deposits |
5,832 | 7,338 | 73,352 | |||||||||
| Out-of-local-market certificates of deposit |
99,313 | 79,015 | 136,470 | |||||||||
| Brokered certificates of deposit |
449,836 | 484,035 | 908,133 | |||||||||
| Total out-of-market deposits |
554,981 | 570,388 | 1,117,955 | |||||||||
| Total deposits |
$ | 3,026,906 | $ | 2,976,800 | $ | 3,131,046 | ||||||
58
Table of Contents
Total period-end deposit balances increased $50.1 million, or 1.7%, to $3.02 billion at December 31, 2010, compared to $2.98 billion at December 31, 2009. While average deposits balances decreased in 2010 from 2009, period-end balances were higher at December 31, 2010 than at December 31, 2009.
Our total in-market deposits were $2.47 billion at December 31, 2010 as compared to $2.41 billion at December 31, 2009. Of these in-market deposits, money market accounts increased by $145.3 million, or 33.2%. We also continued to issue CDARS time deposits and total CDARS deposits increased by $66.6 million to $182.9 million at December 31, 2010. During the same period, customer certificates of deposit balances decreased $60.6 million, or 7.8% and NOW account decreased $58.4 million, or 19.0%.
Total period-end deposit balances at December 31, 2009 decreased $154.2 million, or 4.9%, to $2.98 billion, from $3.13 billion at December 31, 2008. Between December 31, 2009 and December 31, 2008, in-market deposits increased by $393.3 million, or 19.5%, while out-of-market deposits decreased by $547.6 million, or 49.0%. Out-of-market deposits decreased primarily as a result of a $424.1 million decrease in brokered CDs. Total in-market deposits were $2.41 billion at December 31, 2009, compared to $2.01 billion at December 31, 2008. Most of this increase was associated with a $188.2 million increase in noninterest-bearing deposits and a $117.4 million increase in money market accounts, offset by a $94.5 million decrease in customer certificates of deposit.
Time deposits in denominations of $100,000 or more, including public funds deposits, totaled $645.4 million at December 31, 2010. The following table sets forth the amounts and maturities of time deposits of $100,000 or more at December 31, 2010:
| December 31, 2010 | ||||
| (in thousands) | ||||
| 3 months or less |
$ | 263,343 | ||
| Between 3 months and 6 months |
97,060 | |||
| Between 6 months and 12 months |
160,119 | |||
| Over 12 months |
124,871 | |||
| Total |
$ | 645,393 | ||
During 2010, the Bank continued to participate in the FDIC’s Temporary Liquidity Guarantee Program. The program consists of two parts: the TAG Program and the Debt Guarantee Program, both of which the Bank elected to participate in. We did not issue any debt under the Debt Guarantee Program. Under the TAG Program, all noninterest-bearing transaction accounts were fully guaranteed by the FDIC through December 31, 2010. During 2010, the FDIC assessed us a 20 basis point annual surcharge applied to noninterest-bearing transaction and certain low-interest bearing transaction deposit amounts over $250,000 as part of its normal quarterly assessment process for participation in the TAG Program. This compares to an annual surcharge assessment increase of 10 basis points in 2009 for participation in TAG Program.
In addition to CDs from our local market customers, we used other sources of time deposits to help fund our liquidity and funding needs. In October 2008, we entered the CDARS network. This network allows us to accommodate depositors with large cash balances to seek full deposit insurance protection, by placing these funds in CDs issued by other banks in the network. Through a matching system, we receive funds back for CDs that we issue for other banks in the network, thus allowing us to retain the full amount of the original deposit. At December 31, 2010, we had $182.9 million of deposits in the CDARS program, as compared to $116.3 million at December 31, 2009.
We also utilize out-of-market CDs to fund the portion of our interest-earning asset growth that is not funded with in-market deposits and other borrowings. We offer CDs to out-of-local-market customers by providing rates to a private third-party electronic system that provides certificate of deposit rates from institutions across the
59
Table of Contents
country to its subscribers. These CDs are generally issued at amounts that allow the purchasers to obtain full FDIC deposit insurance protection. The balance of CDs obtained through this channel was $99.3 million at December 31, 2010, as compared to $79.0 million at December 31, 2009, and $136.5 million at December 31, 2008.
We also issue brokered CDs to support our asset growth, but we continued to reduce our reliance on this source of funding in 2010. The balance of our brokered CDs was $449.8 million at December 31, 2010, $484.0 million at December 31, 2009, and $908.1 million at December 31, 2008. Total brokered money market balances also decreased in 2010 to $5.8 million at December 31, 2010 compared to $7.3 million at December 31, 2009 and $73.4 million at December 31, 2008. At December 31, 2010 and 2009, the scheduled maturities of brokered CDs were as follows:
| Maturity |
2010 | 2009 | ||||||
| (in thousands) | ||||||||
| Within one year |
$ | 201,884 | $ | 266,980 | ||||
| After one year but within two years |
145,963 | 119,979 | ||||||
| After two years but within three years |
42,029 | 67,385 | ||||||
| After three years |
59,837 | 31,122 | ||||||
| Subtotal |
449,713 | 485,466 | ||||||
| Unamortized fair value adjustment |
1,750 | — | ||||||
| Unamortized broker placement fees and other discounts |
(1,627 | ) | (1,431 | ) | ||||
| Total |
$ | 449,836 | $ | 484,035 | ||||
Brokered CDs are carried net of the related broker placement fees and other discounts and are amortized to the maturity date of the related brokered CDs and included in deposit interest expense. In 2009, a portion of our brokered CDs had options that allowed us to call the brokered CDs at par prior to their scheduled maturity date. During 2009, we called $52.5 million of brokered CDs and recognized $527,000 of early extinguishment of debt expense for the amount of unamortized broker placement fees and fair value adjustments. There were no brokered CDs called by us in the year ended December 31, 2010.
Other Borrowings
Our other borrowings totaled $511.0 million at December 31, 2010 as compared to $337.7 million at December 31, 2009. Other borrowings include securities sold under agreements to repurchase (“repos”), federal funds purchased and U.S. Treasury tax and loan note option accounts. The increase in total other borrowings was largely a result of increases of $130.1 million in repurchase agreements and $43.2 million in federal funds purchased.
Repos include overnight and term agreements. The overnight repos are collateralized financing transactions and are primarily executed with local Bank customers. Overnight repos totaled $39.2 million at December 31, 2010 and $45.5 million at December 31, 2009. Our term repos totaled $336.3 million at December 31, 2010 and $200.0 million at December 31, 2009.
During 2010, we paid $40.0 million of repo agreements early and incurred $368,000 of expense recorded as early extinguishment of debt within noninterest expense. There are $120.0 million of repo agreements that remain callable at the counterparty’s option and are scheduled to mature in 2012. In addition, the repurchase agreements allow the counterparty to terminate the agreement prior to the call date if the Bank were to lose its well-capitalized status. The remaining $216.3 million repurchase agreements are non-callable with $181.3 million due to mature in 2011 and $35.0 million due to mature in 2012.
At December 31, 2010 and December 31, 2009, subject to available collateral, the Bank had available pre-approved total repurchase agreement lines of $930 million and $890 million, respectively. Of the
60
Table of Contents
pre-approved repurchase agreement lines, we have collateral available to borrow $511.7 million at December 31, 2010 and $693.6 million at December 31, 2009. Remaining available collateral totaled $175.7 million at December 31, 2010, compared with $493.6 million at December 31, 2009.
At December 31, 2010, our federal funds purchased totaled $132.6 million, an increase of $43.2 million as compared to $89.4 million purchased at December 31, 2009. These borrowings were unsecured and provided on an overnight basis. Of the federal funds purchased balance at December 31, 2010, $58.1 million was through our correspondent banking customers who may sell federal funds to the Bank in order to manage their own excess liquidity. The remaining $64.5 million of federal funds purchased at December 31, 2010 was through the Bank’s pre-approved lines with other banks. At December 31, 2010 and December 31, 2009, the Bank had pre-approved total overnight federal funds borrowing lines through other banks of $119 million and $130 million, respectively.
Under the U.S. Treasury tax and loan note option, the Bank is authorized to accept U.S. Treasury Department deposits of excess funds along with deposits of customer taxes. These borrowings are collateralized by investment securities. Borrowings from this source were $2.9 million at December 31, 2010 as compared to $2.8 million at December 31, 2009.
The following table shows categories of other borrowings having average balances during the period greater than 30% of stockholders’ equity at year-end. During the current reporting period, repos and federal funds purchased were the two categories meeting this standard.
| Year Ended December 31, | ||||||||||||
| 2010 | 2009 | 2008 | ||||||||||
| (dollars in thousands) | ||||||||||||
| Securities sold under repurchase agreements: |
||||||||||||
| Balance at year end |
$ | 375,585 | $ | 245,453 | $ | 221,017 | ||||||
| Weighted average interest rate at year end |
1.63 | % | 3.33 | % | 3.69 | % | ||||||
| Maximum amount outstanding (1) |
$ | 457,802 | $ | 261,707 | $ | 313,896 | ||||||
| Average amount outstanding during the year |
$ | 387,693 | $ | 237,360 | $ | 281,567 | ||||||
| Daily average interest rate during the year |
2.09 | % | 3.47 | % | 3.24 | % | ||||||
| Federal funds purchased: |
||||||||||||
| Balance at year end |
$ | 132,561 | $ | 89,384 | $ | 54,482 | ||||||
| Weighted average interest rate at year end |
0.51 | % | 0.36 | % | 0.36 | % | ||||||
| Maximum amount outstanding (1) |
$ | 207,200 | $ | 164,663 | $ | 75,517 | ||||||
| Average amount outstanding during the year |
$ | 140,446 | $ | 128,144 | $ | 31,131 | ||||||
| Daily average interest rate during the year |
0.38 | % | 0.38 | % | 1.58 | % | ||||||
| (1) | Based on amount outstanding at month end during each year. |
For additional details on the other borrowings, see “Notes to Consolidated Financial Statements–Other Borrowings” from our audited financial statements contained elsewhere in this annual report.
Notes Payable and Other Advances
Our FHLB advances consist of borrowings from the FHLBC. At December 31, 2010, total FHLB advances were $505.0 million, compared to $155.0 million at December 31, 2009. As of December 31, 2010, these advances were collateralized by $521.6 million of investment securities and a blanket lien on $175.5 million of qualified first-mortgage residential, home equity and commercial real estate loans. Based on the value of collateral pledged, we had additional borrowing capacity of $113.1 million at December 31, 2010. During 2010, we increased our borrowing from the FHLBC due to our ability to borrow at a more favorable interest rate than other sources. As of December 31, 2010, $110.0 million of the FHLB advances are callable and $427.5 million are overnight advances or scheduled to mature within the next 12 months.
61
Table of Contents
At December 31, 2009, we had $12 million outstanding on our $15 million revolving credit facility, which matured on March 31, 2010. We repaid all amounts outstanding under this revolving credit facility in March 2010 and we did not renew it upon maturity.
At December 31, 2010, we had no outstanding borrowings at the FRB. At December 31, 2009, we had outstanding borrowings under the FRB’s Term Auction Facility of $460.0 million. We had pledged $85.3 million of securities and $790.8 million of commercial loans as collateral for these borrowings and had additional maximum borrowing capacity of $39.9 million. This temporary program was phased out in early 2010.
For additional details of the FRB and FHLB advances, see “Notes to Consolidated Financial Statements, Note 10—Notes Payable and Other Advances” from our audited financial statements contained elsewhere in this annual report.
Junior Subordinated Debentures
At December 31, 2010 and December 31, 2009, we had $86.6 million of junior subordinated debentures outstanding, $45.4 million issued to TAYC Capital Trust I and $41.2 million issued to TAYC Capital Trust II. Each of the trusts is a wholly-owned statutory trust formed for the purpose of issuing trust preferred securities. Each of the trusts used proceeds from the sale of its trust preferred securities, along with proceeds it received from the purchase of its common equity securities, to invest in the junior subordinated debentures issued by us. We report a liability for the total balance of the junior subordinated debentures issued to the trusts. The equity investments in the trusts of $2.6 million is recorded in other assets on our Consolidated Balance Sheets at both December 31, 2010 and 2009. Interest expense on the junior subordinated debentures is reported in interest expense.
For TAYC Capital Trust I, interest on both the trust preferred securities and junior subordinated debentures are payable quarterly at a rate of 9.75% per year. The interest rate on both the trust preferred securities and the junior subordinated debentures related to TAYC Capital Trust II equals the three-month LIBOR plus 2.68% and re-prices quarterly. The interest rates were 2.98% and 2.93% at December 31, 2010 and December 31, 2009, respectively. Each of these trust preferred securities are currently callable, at our option. Unamortized issuance costs would be recognized as an expense if the debentures were called. Total unamortized issuance costs related to both trusts were $2.6 million on December 31, 2010.
Our obligations with respect to each of the trust preferred securities and the related debentures, in the aggregate, constitute a full, irrevocable and unconditional guarantee on a subordinated basis by us of the obligations of each of the trusts under the respective trust preferred securities.
Subordinated Notes
In October 2010, we issued $3.6 million of 8% subordinated notes, which will mature on May 28, 2020, and are pre-payable at our option on or after May 28, 2012. In addition, a warrant to purchase 25 shares of our common stock at an exercise price of $12.28 per share was issued for every $1,000 in principal amount of the subordinated notes. The warrants represent an aggregate of 89,050 shares of common stock and will expire on May 28, 2015. The proceeds received from this transaction were allocated to the subordinated notes and the warrants based on their relative fair values. The fair value allocated to the warrants, totaling $420,000 at the issuance date in October 2010, net of issuance costs, was credited to surplus in stockholders’ equity on our Consolidated Balance Sheets. At December 31, 2010, the subordinated notes were reported at $3.6 million, which was net of $455,000 of unamortized discount and issuance costs. The discount is being amortized as an additional interest expense of the subordinated notes over the remaining contractual life of the notes.
In May 2010, we issued $33.9 million of ten year, 8% subordinated notes, pre-payable at our option after two years. In addition, a warrant to purchase 25 shares of our common stock at an exercise price of $12.28 per
62
Table of Contents
share was issued for every $1,000 in principal amount of the subordinated notes. The warrants represent an aggregate of 848,450 shares of common stock and will expire on May 28, 2015, the fifth anniversary of issuance. The proceeds received from this transaction were allocated to the subordinated notes and the warrants based on their relative fair values. The fair value allocated to the warrants, totaling $4.4 million at the issuance date in May 2010, net of issuance costs, was credited to surplus in stockholders’ equity on our Consolidated Balance Sheets. At December 31, 2010, the subordinated notes were reported at $29.6 million, which was net of $4.3 million of unamortized discount. The discount is being amortized as an additional interest expense of the subordinated notes over the remaining contractual life of the notes.
In September 2008, the Bank issued $60.0 million of eight year, 10% subordinated notes, pre-payable at the Bank’s option after three years. In addition, a warrant to purchase 15 shares of our common stock at an exercise price of $10.00 per share was issued for every $1,000 in principal amount of the subordinated notes. The warrants represent an aggregate of 900,000 shares of common stock and will expire on September 29, 2013, the fifth anniversary of issuance. The proceeds received from this transaction were allocated to the subordinated notes and the warrants based upon their relative fair values. At December 31, 2010, the subordinated notes reported on the Consolidated Balance Sheets totaled $56.1 million, which was net of $3.9 million of unamortized discount. In comparison, at December 31, 2009, the subordinated notes were reported at $55.7 million, which was net of $4.3 million of the unamortized discount. The discount consists primarily of the fair value allocated to the warrants and was reported as an addition to surplus in the equity portion of the Consolidated Balance Sheets. The discount is being amortized as an additional interest expense of the subordinated notes over the remaining contractual life of the notes.
Preferred Stock
In May 2010, we completed an exchange offering in which all of our outstanding Series A Preferred were converted into 7.2 million shares of common stock that included 1.2 million shares as an inducement for Series A Preferred holders to convert into common shares. The $15.8 million value attributed to the additional shares was considered a non-cash implied dividend to holders of the Series A Preferred and resulted in no net impact to total stockholders’ equity. This non-cash dividend was a deduction in arriving at net loss applicable to common stockholders on the Consolidated Statement of Operations and was considered in the determination of basic and diluted loss per common share. After the payment of the regular quarterly dividend of $1.2 million on April 15, 2010, we did not declare or pay any further dividends on the Series A Preferred. This compares to the period ended December 31, 2009, when we declared and paid dividends on the Series A Preferred in the amount of $4.8 million.
We sold shares of Series B Preferred to the UST under the TARP CPP in November 2008 for gross proceeds of $104.8 million. Holders of the Series B Preferred are entitled to receive dividends at an annual rate of 5% for the first five years and 9% thereafter. Dividends on the Series B Preferred are cumulative. In connection with the Series B Preferred, we also issued a ten-year warrant for the UST to purchase 1,462,647 shares of our common stock at an exercise price of $10.75 per share. At December 31, 2010, the recorded balance of the preferred stock totaled $100.4 million, which is equal to the liquidation amount, net of $5.1 million of unamortized discount plus accumulated but undeclared dividends. In comparison, the amount reported at December 31, 2009 was $98.8 million, was net of $6.6 million of unamortized discount and accumulated but undeclared dividends. The discount consists primarily of the fair value allocated to the warrants and was reported as an addition to surplus in the equity portion of the Consolidated Balance Sheets. The discount is being accreted as a non-cash dividend on the Series B Preferred, and the discount accretion was $1.5 million and $1.4 million during 2010 and 2009, respectively. The discount accretion increased the net loss applicable to common stockholders and the net loss per common share during 2010 and 2009. Accumulated but undeclared dividends totaled $670,000 at both December 31, 2010 and December 31, 2009. During 2010 and 2009, we declared and paid dividends in the amount of $5.2 million on the Series B Preferred.
63
Table of Contents
Before the third anniversary of the UST’s purchase of the Series B Preferred, unless the Series B Preferred has been redeemed or the Treasury has transferred all of the Series B Preferred to third parties, the Treasury will have to consent to us paying any dividend on our Common Stock or repurchasing our Common Stock or other equity or capital securities except in connection with benefit plans consistent with past practice and certain other circumstances specified in the Series B Preferred purchase agreement.
On May 28, 2010, we issued a total of 1,276,480 shares of Series C Preferred with a purchase price and liquidation preference of $25.00 per share. The Series C Preferred pays non-cumulative dividends at an annual rate of 8% of the liquidation preference of $25.00 per share, and each share can be converted into 2.03583 shares of common stock at a conversion price of $12.28 per common share. Holders of the Series C Preferred have the option of converting their shares at any time, into an aggregate of 2,598,696 shares. The Series C Preferred is convertible at our option any time after the earlier of May 28, 2015 or the first date on which the volume-weighted average per share price of our common stock equals or has exceeded 130% of the then applicable conversion price of the Series C Preferred for at least 20 trading days within any period of 30 consecutive trading days occurring after May 28, 2013.
The Series C Preferred holders are entitled to vote on all matters voted on by the holders of the common stock on an as-converted basis. We are restricted from declaring and paying dividends on the common stock if the full quarterly dividends on the Series C Preferred have not been paid or declared.
In the event of any voluntary or involuntary liquidation, dissolution or winding up of the affairs of the Company, each holder of the Series C Preferred will be entitled, before any distributions or payments of our assets may be made to or set aside for common stock or other stock junior to the rights of the Series C Preferred and subject to the rights of our creditors, to receive a liquidation distribution in the amount equal to $25.00 per share, plus any accrued but unpaid dividends. A merger, consolidation, or sale of all or substantially all of our assets is not considered a liquidation.
At December 31, 2010, the recorded balance of the Series C Preferred was $31.9 million, which is equal to the liquidation value. During 2010, we declared and paid dividends on Series C Preferred in the amount of $1.6 million.
On October 21, 2010, we issued a total of 405,330 shares of Series D Preferred, in exchange for 405,330 shares of common stock held by investors. The Series D Preferred participates in dividends with our common stock. Each share of Series D Preferred converts into one share of common stock immediately on any “Widely Dispersed Offering” or “Conversion Event” as defined in the Certificate of Designation.
The holders of Series D Preferred are entitled to notice of all stockholder meetings at which all holders of common stock shall be entitled to vote, but the Series D Preferred holders shall not be entitled to vote on any matter presented to our stockholders.
In the event of any reorganization, reclassification, consolidation, merger or sale, each holder of the Series D Preferred shall be treated the same as each holder of common stock. In the event that holders of common stock have the option to elect the form of consideration to be received, holders of Series D Preferred shall have the same election privileges. In all cases, if any of the securities otherwise receivable are “voting securities” for bank regulatory purposes, each Series D Preferred holder shall have the right to elect to receive “non-voting securities” in lieu of voting securities.
On October 21, 2010, we issued a total of 223,520 shares of Series E Preferred, with a purchase price and liquidation preference of $25.00 per share. The Series E Preferred pays non-cumulative dividends at an annual rate of 8% of the liquidation preference of $25.00 per share. Each share of Series E Preferred converts into one share of Series C Preferred immediately on any “Widely Dispersed Offering” or “Conversion Event” as defined in the Certificate of Designation. Each share of the Series E Preferred is convertible into one share of Series D
64
Table of Contents
Preferred at any time at the holder’s option. If the Series C Preferred are converted into shares of common stock, we have the right to convert any Series E Preferred into Series D Preferred, subject to anti-dilution adjustments, in the same proportion
The holders of Series E Preferred are entitled to notice of all stockholder meetings at which all holders of common stock shall be entitled to vote, but the Series E Preferred holders shall not be entitled to vote on any matter presented to our stockholders.
In the event of any reorganization, reclassification, consolidation, merger or sale, each holder of the Series E Preferred shall be treated the same as each holder of Series C Preferred. In the event that holders of Series C Preferred have the option to elect the form of consideration to be received, holders of Series E Preferred shall have the same election privileges. In all cases, if any of the securities otherwise receivable are “voting securities” for bank regulatory purposes, each Series E Preferred holder shall have the right to elect to receive “non-voting securities” in lieu of voting securities.
At December 31, 2010, the recorded balance of the Series E Preferred was $5.6 million, which is equal to the liquidation value. During 2010, we declared dividends on Series E Preferred in the amount of $103,000.
For additional details on our preferred stock, see “Notes to Consolidated Financial Statements—Footnote 15—Stockholders’ Equity” from our audited financial statements contained elsewhere in this annual report.
Common Stock
In September 2008, we increased our authorized common stock to 45 million shares from the prior authorization of 18 million shares to accommodate the issuance of convertible preferred stock and warrants to purchase common stock. Our Series A Preferred was converted into an aggregate of 7.2 million shares of common stock in May 2010. In addition, warrants for the purchase of 3.8 million shares of common stock currently are exercisable by the holders. As of December 31, 2010, no warrants had been exercised.
For additional details on our warrants to purchase common stock, see “Notes to Consolidated Financial Statements–Stockholders’ Equity” from our audited financial statements contained elsewhere in this annual report.
We did not declare or pay any common stock dividends in 2010 or 2009. Currently, the Series B Preferred requires the consent of the UST to pay any dividend on our common stock. In addition, under the terms of the junior subordinated debentures issued in connection with our trust preferred securities any deferral of the payment of interest or dividends results in a defined restriction in the payment of common dividends.
Regulatory Capital
We monitor compliance with bank regulatory capital requirements, focusing primarily on the risk-based capital guidelines. Under the risk-based capital method of capital measurement, the ratio computed is dependent on the amount and composition of assets recorded on the balance sheet and the amount and composition of off-balance sheet items, in addition to the level of capital. Generally, Tier 1 Capital includes common stockholders’ equity, noncumulative perpetual preferred stock and trust preferred securities (up to certain limits). Bank regulators, however, also specifically approved the Series B Preferred for inclusion in Tier 1 capital in spite of its cumulative dividend feature. Total Capital represents Tier 1 Capital plus a portion of the allowance for loan loss (up to certain limits), subordinated debt and the portion of the trust preferred securities not includable in Tier 1 Capital.
At each December 31, 2010, December 31, 2009, and December 31, 2008, the Company was considered “well-capitalized” under capital guidelines set by the Federal Reserve for bank holding companies. The Company’s Total Capital ratio increased in 2010, largely due to increases in regulatory capital caused by our
65
Table of Contents
subordinated debt issuance in 2010 which more than outweighed the increase in risk weighted assets. The ratios of Tier 1 Capital to risk weighted assets and Tier 1 Capital to average assets declined compared to the ratio of Total Capital as Tier 1 capital was lower during 2010 as well as higher average assets and risk weighted assets. All of the Company’s regulatory ratios at December 31, 2009 declined as compared to those at December 31, 2008, largely due to a decline in regulatory capital caused by our net loss applicable to common stockholders.
At each of December 31, 2010, December 31, 2009, and December 31, 2008, the Bank was considered “well capitalized” under regulatory capital guidelines. All of the Bank’s ratios increased during 2010 as the Bank’s net loss was offset by the $60.0 million capital contribution.
While we, as well as our Bank, continue to be considered well-capitalized under the regulatory capital guidelines, our regulators could require us to maintain capital in excess of these required levels.
The Company and the Bank’s capital ratios were as follows for the dates indicated:
| ACTUAL | FOR CAPITAL ADEQUACY PURPOSES |
TO BE WELL CAPITALIZED UNDER PROMPT CORRECTIVE ACTION PROVISIONS |
||||||||||||||||||||||
| AMOUNT | RATIO | AMOUNT | RATIO | AMOUNT | RATIO | |||||||||||||||||||
| (dollars in thousands) | ||||||||||||||||||||||||
| As of December 31, 2010: |
||||||||||||||||||||||||
| Total Capital (to Risk Weighted Assets) |
||||||||||||||||||||||||
| Taylor Capital Group, Inc. |
$448,389 | 12.98 | % | >$276,381 | >8.00 | % | >$345,476 | >10.00 | % | |||||||||||||||
| Cole Taylor Bank |
414,423 | 12.04 | >275,401 | >8.00 | >344,252 | >10.00 | ||||||||||||||||||
| Tier 1 Capital (to Risk Weighted Assets) |
||||||||||||||||||||||||
| Taylor Capital Group, Inc. |
$308,397 | 8.93 | % | >$138,190 | >4.00 | % | >$207,286 | >6.00 | % | |||||||||||||||
| Cole Taylor Bank |
314,182 | 9.13 | >137,701 | >4.00 | >206,551 | >6.00 | ||||||||||||||||||
| Leverage (to average assets) |
||||||||||||||||||||||||
| Taylor Capital Group, Inc. |
$308,397 | 6.89 | % | >$178,971 | >4.00 | % | >$223,714 | >5.00 | % | |||||||||||||||
| Cole Taylor Bank |
314,182 | 7.05 | >178,270 | >4.00 | >222,838 | >5.00 | ||||||||||||||||||
| As of December 31, 2009: |
||||||||||||||||||||||||
| Total Capital (to Risk Weighted Assets) |
||||||||||||||||||||||||
| Taylor Capital Group, Inc. |
$433,197 | 12.72 | % | >$272,411 | >8.00 | % | >$340,514 | >10.00 | % | |||||||||||||||
| Cole Taylor Bank |
395,869 | 11.64 | >272,030 | >8.00 | >340,038 | >10.00 | ||||||||||||||||||
| Tier 1 Capital (to Risk Weighted Assets) |
||||||||||||||||||||||||
| Taylor Capital Group, Inc. |
$333,479 | 9.79 | % | >$136,205 | >4.00 | % | >$204,308 | >6.00 | % | |||||||||||||||
| Cole Taylor Bank |
296,839 | 8.73 | >136,015 | >4.00 | >204,023 | >6.00 | ||||||||||||||||||
| Leverage (to average assets) |
||||||||||||||||||||||||
| Taylor Capital Group, Inc. |
$333,479 | 7.60 | % | >$175,605 | >4.00 | % | >$219,506 | >5.00 | % | |||||||||||||||
| Cole Taylor Bank |
296,839 | 6.77 | >175,318 | >4.00 | >219,147 | >5.00 | ||||||||||||||||||
| As of December 31, 2008: |
||||||||||||||||||||||||
| Total Capital (to Risk Weighted Assets) |
||||||||||||||||||||||||
| Taylor Capital Group, Inc. |
$474,287 | 13.02 | % | >$291,497 | >8.00 | % | >$364,371 | >10.00 | % | |||||||||||||||
| Cole Taylor Bank |
404,480 | 11.12 | >290,864 | >8.00 | >363,580 | >10.00 | ||||||||||||||||||
| Tier 1 Capital (to Risk Weighted Assets) |
||||||||||||||||||||||||
| Taylor Capital Group, Inc. |
$372,377 | 10.22 | % | >$145,748 | >4.00 | % | >$218,622 | >6.00 | % | |||||||||||||||
| Cole Taylor Bank |
302,668 | 8.32 | >145,432 | >4.00 | >218,148 | >6.00 | ||||||||||||||||||
| Leverage (to average assets) |
||||||||||||||||||||||||
| Taylor Capital Group, Inc. |
$372,377 | 8.73 | % | >$170,682 | >4.00 | % | >$213,352 | >5.00 | % | |||||||||||||||
| Cole Taylor Bank |
302,668 | 7.11 | >170,285 | >4.00 | 212,857 | >5.00 | ||||||||||||||||||
66
Table of Contents
Liquidity
In addition to the normal influx of liquidity from in-market deposits and repayments and maturities of loans and investments, the Bank uses brokered deposits, borrowings from the FHLB and FRB, broker/dealer repurchase agreements and federal funds purchased to meet its liquidity needs. During 2010, we worked to improve our liquidity position by increasing funding from core customers which allowed us to reduce our reliance on brokered deposits. We also used available collateral to take advantage of attractively priced short-term funding provided by the FHLB and the FRB.
We manage the risks associated with this reliance on wholesale funding sources by maintaining adequate alternate sources of funding and excess collateral available for immediate use. At December 31, 2010, subject to available collateral, we had total pre-approved overnight federal funds borrowing lines and repurchase agreement lines of $119 million, and $930 million respectively. In addition, the Bank is able to borrow from the FRB under the Borrower-in-Custody Program and the Term Auction Facility. At December 31, 2010, the Bank maintained $813.1 million of commercial loans as collateral at the FRB with a lendable value of approximately $504.9 million. The Bank also has pledged $521.6 million of investment securities and $175.5 million of qualified first-mortgage residential, home equity and commercial real estate loans at the FHLB and had a total borrowing capacity of $618.1 million at December 31, 2010. The Bank has further increased its ability to purchase federal funds by cultivating relationships with a growing group of correspondent banking customers who may sell Federal Funds to the Bank in order to manage their excess liquidity.
Our total assets increased to $4.48 billion at December 31, 2010 and $4.40 billion at December 31, 2009. During 2010, our loan portfolio increased by a net of $48.8 million, or 1.7%, while our investment securities portfolio decreased by $16.8 million, or 1.3%. During 2010, the mix of our funding liabilities also changed. Total deposits increased by $50.1 million, or 1.7%, and other borrowings increased by $173.3 million, or 51.3%. We partly offset these increases by decreasing notes payable by $122.0 million, or 19.5%.
Interest received, net of interest paid, was the principal source of our operating cash inflows in each of the above periods. Management of investing and financing activities and market conditions determine the level and the stability of our net interest cash flows. During 2010, cash used in operating activities was $140.7 million, compared to cash used in operating activities of $29.8 million in 2009 and cash provided of $42.6 million in 2008. Cash used for loans originated for sale net of proceeds of $196.7 million caused the change in 2010 as compared to 2009. Cash used for mortgage loans purchased and held for sale of $76.8 million caused the change in 2009 as compared to 2008.
Net inflows from investing activities totaled $9.9 million during 2010, compared to net outflows of $35.0 million during 2009. Our net inflow during 2010 was largely due to the proceeds of $965.6 million from sales of available-for-sale investment securities and $248.0 million of proceeds from principal payments and maturities of available-for-sale investment securities. This increase was partly offset by purchases of $1.15 billion of available-for-sale securities. In comparison, the outflow from investing activities in 2009 was due to a $975.3 million purchase of investment securities. This increase in 2009 was partly offset by proceeds from repayments and sales of investment securities of $809.9 million and a net decrease in loans of $119.6 million. Net outflows from investing activities totaled $991.3 million during 2008, primarily due to a $782.6 million increase in net loans and $352.8 million of purchases of investment securities. These outflows in 2008 were partly offset by repayments of investment securities of $165.8 million.
During 2010, we had net inflows from financing activities of $163.7 million, compared to $60.2 million during 2009. During 2010, we increased other borrowings by $173.3 million, increased deposits by $48.6 million, had net proceeds from the issuance of subordinated notes of $36.2 million and net proceeds from the issuance of preferred stock of $36.3 million. These inflows were partly offset by $132.0 million repayments of notes payable and other advances. During 2009, net inflows from financing activities included additional borrowings from the FHLB of $165.0 million and other borrowings of $62.1 million. These inflows were partly
67
Table of Contents
offset by a $156.3 million decrease in deposits. During 2008, net inflows from financing activities included a $557.1 million increase in deposits, additional borrowings from the FHLB of $245.0 million and proceeds from the issuance of preferred stock and subordinated notes of $219.8 million. These inflows were partly offset by a $113.5 million decrease in other borrowings.
Holding Company Liquidity
Historically, the primary source of funds has been dividends received from the Bank. Because of the net losses incurred by the Bank in recent years, the Bank did not declare or pay any dividends to the Company in 2010 or 2009. The Bank is subject to dividend restrictions set forth by regulatory authorities, under which the Bank may not, without prior approval of regulatory authorities, declare dividends in excess of the sum of the current year’s earnings plus the retained earnings from the prior two years. As of December 31, 2010, the Bank could not declare or pay dividends to us, without the approval of regulatory authorities.
At December 31, 2010, Company had cash of $23.1 million for general corporate purposes and to support future growth. The primary source of cash at the holding company was from the 2010 issuance of Series C Preferred and Series E Preferred stock. In 2010, we received net proceeds, after issuance costs, of $30.3 million from the issuance of our Series C Preferred and $5.5 million from the issuance of our Series E Preferred and associated warrants. During 2010, cash outflows at the Company included a $60.0 million capital contributions to the Bank, $8.6 million of cash dividend payments on preferred stock issuances and general operating expenses.
In the first quarter of 2011, we announced the sale of $25 million of a new series of preferred stock in a private placement to existing investors. The Company intends to use the proceeds to provide additional capital to the Bank. As we continue to grow our business, as well as manage our loan portfolio, we may require additional capital, either from earnings retention or external sources. We continue to review and evaluate our capital plan in conjunction with our business strategy as well as the heightened focus on capital requirements by regulatory authorities and the investment community. The timing, amount and form of any such capital raise will depend on a number of factors, including the amount of earnings generated by the Bank, the opportunities for future growth, further loan losses, regulatory requirements and the state of the capital markets.
Off-Balance Sheet Arrangements
Off-balance sheet arrangements include commitments to extend credit and financial guarantees. Commitments to extend credit and financial guarantees are used to meet the financial needs of our customers. We had commitments to extend credit of $905.5 million and $864.8 million at December 31, 2010 and December 31, 2009, respectively. Commitments to extend credit are agreements to lend to a customer as long as there is no violation of any condition established in the contract. Commitments generally have fixed expiration dates or other termination clauses and may require payment of a fee. Many customers do not utilize the total approved commitment amounts, and, therefore, the total commitment amounts do not usually represent future cash requirements.
We had $67.9 million and $83.6 million of financial and performance standby letters of credit at December 31, 2010 and December 31, 2009, respectively. Financial standby letters of credit are conditional commitments issued by us to guarantee the payment of a specified financial obligation of a customer to a third party. Performance standby letters of credit are conditional commitments issued by us to make a payment to a specified third party in the event a customer fails to perform under a non-financial contractual obligation. The terms of these financial guarantees range from less than one to five years. The credit risk involved in issuing these letters of credit is essentially the same as that involved in extending loan facilities to customers. We expect most of these letters of credit to expire undrawn, and we expect no significant loss from our obligation under financial guarantees to the extent not already recognized as a liability on the Company’s Consolidated Balance Sheets. At December 31, 2010, we established a liability for $5.4 million for commitments under standby letters of credit for which we believed funding and loss were probable.
68
Table of Contents
The following table shows as of December 31, 2010 the loan commitments and financial guarantees by maturity date.
| December 31, 2010 | ||||||||||||||||||||
| Within One Year |
One to Three Years |
Four to Five Years |
After Five Years |
Total | ||||||||||||||||
| (in thousands) | ||||||||||||||||||||
| Commitments to extend credit: |
||||||||||||||||||||
| Commercial |
$ | 380,174 | $ | 385,434 | $ | 79,651 | $ | 1,684 | $ | 846,943 | ||||||||||
| Consumer |
5,423 | 23,323 | 13,590 | 16,206 | 58,542 | |||||||||||||||
| Financial guarantees: |
||||||||||||||||||||
| Financial standby letters of credit |
33,808 | 17,068 | 2,902 | — | 53,778 | |||||||||||||||
| Performance standby letters of credit |
7,966 | 2,161 | 1,511 | 2,497 | 14,135 | |||||||||||||||
The following table shows, as of December 31, 2010, our contractual obligations and commitments to make future payments under contracts, debt and lease agreements and maturing time deposits.
| December 31, 2010 | ||||||||||||||||||||
| Within One Year |
One to Three Years |
Four to Five Years |
After Five Years |
Total | ||||||||||||||||
| (in thousands) | ||||||||||||||||||||
| Other borrowings (1) |
$ | 356,008 | $ | 155,000 | $ | — | $ | — | $ | 511,008 | ||||||||||
| Notes payable and other advances (1) |
452,500 | 52,500 | — | — | 505,000 | |||||||||||||||
| Junior subordinated debentures (1) |
— | — | — | 86,607 | 86.607 | |||||||||||||||
| Time deposits (1) |
1,015,436 | 424,439 | 58,320 | 19,560 | 1,517,755 | |||||||||||||||
| Subordinated debt (1) |
— | — | — | 88,835 | 88,835 | |||||||||||||||
| Operating leases |
4,215 | 8,564 | 4,814 | 13,366 | 30,959 | |||||||||||||||
| Total |
$ | 1,828,159 | $ | 640,503 | $ | 63,134 | $ | 208,368 | $ | 2,740,164 | ||||||||||
| (1) | Principal only, does not include interest. |
Derivative Financial Instruments
We use derivative financial instruments to accommodate customer needs and to assist in our own interest rate risk management. From time to time, we use interest rate exchange agreements, or swaps, and interest rate floors and collars to manage the interest rate risk associated with our commercial loan portfolio and our portfolio of fixed rate brokered CDs.
69
Table of Contents
The following table describes the derivative instruments outstanding at both December 31, 2010 and 2009 (dollars in thousands):
| As of December 31, 2010 | ||||||||||||||||||||
| Notional Amount |
Strike Rates | Maturity | Balance Sheet/Income Statement Location |
Fair Value |
||||||||||||||||
| Fair value hedging derivative instruments: |
||||||||||||||||||||
| Brokered CD interest rate swaps – pay variable/receive fixed |
$ | 57,862 |
|
Receive 2.74% Pay 0.371% |
|
4.5 yrs |
|
Other assets/ Noninterest income |
|
$ | 1,714 | |||||||||
| Cash flow hedging derivative instruments: |
||||||||||||||||||||
| Interest rate corridors |
300,000 | 0.29%-1.29% | 1.6 yrs | Other assets/OCI | 1,127 | |||||||||||||||
| Total hedging derivative instruments |
357,862 | |||||||||||||||||||
| Non-hedging derivative instruments: |
|
|||||||||||||||||||
| Customer interest rate swap – pay fixed/receive variable |
232,342 |
|
Pay 3.67% Receive 0.44% |
|
|
Wtd avg. 2.6 years |
|
|
Other liabilities/ Noninterest income |
|
(11,630 | ) | ||||||||
| Customer interest rate swap – receive fixed/pay variable |
232,342 |
|
Receive 3.67% Pay 0.44% |
|
|
Wtd avg. 2.6 years |
|
|
Other assets/ Noninterest income |
|
11,404 | |||||||||
| Interest rate lock commitments |
129,015 | NA | 0.1 yrs |
|
Other assets/ Noninterest income |
|
438 | |||||||||||||
| Forward loan sale contracts |
168,758 | NA | 0.1 yrs |
|
Other assets/ Noninterest income |
|
3,611 | |||||||||||||
| Total non-hedging derivative instruments |
762,457 | |||||||||||||||||||
| Total derivative instruments |
$ | 1,120,319 | ||||||||||||||||||
| As of December 31, 2009 | ||||||||||||||||||||
| Notional Amount |
Strike Rates | Maturity | Balance Sheet/Income Statement Location |
Fair Value |
||||||||||||||||
| (dollars in thousands) | ||||||||||||||||||||
| Non-hedging derivative instruments: |
||||||||||||||||||||
| Customer Interest Rate Swap – pay fixed/receive variable |
$ | 188,781 |
|
Pay 4.21% Receive 0.44% |
|
|
Wtd avg. 3.2 years |
|
|
Other liabilities/ Noninterest income |
|
$ | (10,216 | ) | ||||||
| Customer Interest Rate Swap – receive fixed/pay variable |
188,781 |
|
Receive 4.21% Pay 0.44% |
|
|
Wtd avg. 3.2 years |
|
|
Other assets/ Noninterest income |
|
10,090 | |||||||||
| Forward loan sale contracts |
61,090 | |
Wtd. avg interest rate 5.0% |
|
Jan. 2010 | |
Other assets/ Noninterest income |
|
540 | |||||||||||
| Total |
$ | 438,652 | ||||||||||||||||||
We have derivative instruments with a notional amount of $57.9 million at December 31, 2010, which were designated as fair value hedges against the interest rate risk inherent in certain of its brokered certificates of deposits (“brokered CDs”.) Total ineffectiveness on the interest rate swaps was $36,000 for the year ended December 31, 2010 and was recorded in noninterest income.
We also entered into $300.0 million of notional amount interest rate corridors during the year ended Decembers 31, 2010, which were designated as cash flow hedges against certain borrowings. Total ineffectiveness on the interest rate corridors was $4,000 for the year ended December 31, 2010 and was recorded in noninterest income.
70
Table of Contents
In order to accommodate individual customer borrowing needs, we entered into interest rate swap agreements with customers. At the same time, in order to offset the exposure and manage interest rate risk, we entered into an interest rate swap with a different counterparty with offsetting terms. These derivative instruments are not designated as accounting hedges and changes in fair value of these instruments, as well as any net cash settlements, are recognized in noninterest income as other derivative income or expense. As of December 31, 2010 and 2009, we had notional amounts of $232.3 million and $188.8 million, respectively, of interest rate swaps with customers in which we agreed to receive a fixed interest rate and pay a variable interest rate. In addition, as of December 31, 2010 and December 31, 2009, we had offsetting interest rate swaps with other counterparties with a notional amount of $232.3 million and $188.8 million, respectively, in which we agreed to receive a variable interest rate and pay a fixed interest rate.
The Company enters into interest rate lock and forward loan sale commitments as a normal part of Cole Taylor Mortgage’s business. These non-hedging derivatives are recorded at their fair value on the Consolidated Balance Sheets in other assets with changes in fair value recorded in income currently in noninterest income.
In January 2009, we terminated a $100.0 million notional amount interest rate swap that was not designated as an accounting hedge. We discontinued hedge accounting in December 2008, when we determined the hedge would no longer be effective. The unrealized gain of $6.4 million upon de-designation, which had accumulated in other comprehensive income (net of tax), was being amortized to loan interest income over what would have been the life of the hedge. From the date of de-designation to December 31, 2008, the change in fair value, along with net settlements attributed to this period, was recorded in other derivative income in noninterest income and totaled $394,000. This derivative was terminated in January 2009 and we received a cash payment $6.6 million, which represented the fair value of the swap at the date of termination.
At December 31, 2010 and December 31, 2009, we had $761,000 and $2.7 million, respectively, in accumulated other comprehensive income related to terminated cash flow hedges. The amount in accumulated other comprehensive income represents the net unamortized portion of the deferred gain that had accumulated in other comprehensive income when the hedging relationship was terminated. During 2010 and 2009, $3.2 million and $6.4 million of deferred gains, respectively, from previously terminated cash flow hedges were reclassified into net interest income as additional loan interest income. We expect that $1.3 million of these deferred gains will be amortized into loan interest income during 2011.
For additional details concerning the accounting treatment for our derivative instruments, please see “Application of Critical Accounting Policies-Derivative Financial Instruments” from our Management’s Discussion and Analysis contained elsewhere in this annual report.
Quantitative and Qualitative Disclosure about Market Risks
Interest rate risk is the most significant market risk affecting us. Other types of market risk, such as foreign currency risk and commodity price risk, do not arise in the normal course of our business activities. Interest rate risk can be defined as the exposure to a movement in interest rates that could have an adverse effect on our net interest income or the market value of our financial instruments. The ongoing monitoring and management of this risk is an important component of our asset and liability management process, which is governed by policies established by the Board of Directors and carried out by the Bank’s Asset/Liability Management Committee, (“ALCO”). ALCO’s objectives are to manage, to the degree prudently possible, our exposure to interest rate risk over both the one year planning cycle and the longer term strategic horizon and, at the same time, to provide a stable and steadily increasing flow of net interest income. Interest rate risk management activities include establishing guidelines for tenor and repricing characteristics of new business flow, the maturity ladder of wholesale funding and investment security purchase and sale strategies, as well as the use of derivative financial instruments.
71
Table of Contents
We have used various interest rate contracts, including swaps and interest rate floors and collars, to manage interest rate and market risk. These contracts can be designated as hedges of specific existing assets and liabilities. Our asset and liability management and investment policies do not allow the use of derivative financial instruments for trading purposes.
Our primary measurement of interest rate risk is earnings at risk, which is determined through computerized simulation modeling. The primary simulation model assumes a static balance sheet, a parallel interest rate rising or declining ramp and uses the balances, rates, maturities and repricing characteristics of all of our existing assets and liabilities, including derivative financial instruments. These models are built with the sole objective of measuring the volatility of the embedded interest rate risk as of the balance sheet date and, as such, do not provide for growth or any changes in balance sheet composition. Projected net interest income is computed by the model assuming market rates remaining unchanged and compares those results to other interest rate scenarios with changes in the magnitude, timing, and relationship between various interest rates. The impact of embedded options in the balance sheet such as callable agencies and mortgage-backed securities, real estate mortgage loans, and callable borrowings are also considered. Changes in net interest income in the rising and declining rate scenarios are then measured against the net interest income in the rates unchanged scenario. ALCO utilizes the results of the model to quantify the estimated exposure of net interest income to sustained interest rate changes.
Net interest income for year one in a 200 basis points rising rate scenario was calculated to increase by $2.7 million, or 1.9%, as compared to the net interest income in the rates unchanged scenario at December 31, 2010. At December 31, 2009, the projected variance in the rising rate scenario was a decrease of $1.0 million, or 0.7% lower than the rates unchanged scenario. No simulation for net interest income at risk in a falling rate scenario was calculated because of the low level of market interest rates at both December 31, 2010 and 2009.
Computation of prospective effects of hypothetical interest rate changes are based on numerous assumptions, including, among other factors, no change in the balance sheet size or composition, relative levels of market interest rates, product pricing, reinvestment strategies and customer behavior influencing loan and security prepayments and deposit decay and should not be relied upon as indicative of actual results. Further, the computations do not contemplate any actions we may take in response to changes in market interest rates. We cannot assure you that our actual net interest income would increase or decrease by the amounts computed by the simulations.
The following table indicates the estimated impact on net interest income in year one under various parallel ramp interest rate scenarios at December 31, 2010 and December 31, 2009:
| Change in Future Net Interest Income | ||||||||||||||||
| At December 31, 2010 | At December 31, 2009 | |||||||||||||||
| Change in interest rates |
Dollar Change |
Percentage Change |
Dollar Change |
Percentage Change |
||||||||||||
| (dollars in thousands) | ||||||||||||||||
| +200 basis points over one year |
$ | 2,655 | 1.9 | % | $ | (1,026 | ) | (0.7 | )% | |||||||
| - 200 basis points over one year |
n/a | n/a | n/a | n/a | ||||||||||||
n/a – Not applicable
72
Table of Contents
The following table sets forth the amounts of our interest-earning assets and interest-bearing liabilities outstanding at December 31, 2010, on a consolidated basis, that we anticipate, based upon certain assumptions, to reprice or mature in each of the future time periods shown. The projected repricing of assets and liabilities anticipates prepayments and scheduled rate adjustments, as well as contractual maturities under an interest rate unchanged scenario within the selected time intervals. While we believe such assumptions are reasonable, there can be no assurance that assumed repricing rates would approximate our actual future experience.
| Volumes Subject to Repricing Within | ||||||||||||||||||||||||||||
| 0-30 Days | 31-180 Days |
181-365 Days |
1-3 Years |
4-5 Years |
Over 5 Years |
Total | ||||||||||||||||||||||
| (dollars in thousands) | ||||||||||||||||||||||||||||
| Interest-earning assets: |
||||||||||||||||||||||||||||
| Short-term investments and federal funds sold |
$ | 1,056 | $ | — | $ | — | $ | — | $ | — | $ | — | $ | 1,056 | ||||||||||||||
| Investment securities and FHLB/FRB stock |
10,916 | 57,515 | 75,059 | 322,165 | 267,795 | 561,059 | 1,294,509 | |||||||||||||||||||||
| Loans |
2,106,233 | 121,545 | 113,903 | 447,699 | 132,114 | 172,864 | 3,094,358 | |||||||||||||||||||||
| Total interest-earning assets |
2,118,205 | 179,060 | 188,962 | 769,864 | 399,909 | 733,923 | 4,389,923 | |||||||||||||||||||||
| Interest-bearing liabilities: |
||||||||||||||||||||||||||||
| Interest-bearing checking, savings and money market accounts |
316,866 | 257,177 | 34,362 | 137,450 | 129,996 | — | 875,851 | |||||||||||||||||||||
| Certificates of deposit |
118,799 | 489,273 | 407,363 | 424,439 | 58,321 | 19,560 | 1,517,755 | |||||||||||||||||||||
| Other borrowings |
315,501 | 40,507 | — | 155,000 | — | — | 511,008 | |||||||||||||||||||||
| Notes payable/other advances |
375,000 | 60,000 | 17,500 | 52,500 | — | — | 505,000 | |||||||||||||||||||||
| Junior subordinated debentures |
— | 41,238 | — | — | — | 45,369 | 86,607 | |||||||||||||||||||||
| Subordinated notes, net |
— | — | — | — | — | 88,835 | 88,835 | |||||||||||||||||||||
| Total interest-bearing liabilities |
1,126,166 | 888,195 | 459,225 | 769,389 | 188,317 | 153,764 | 3,585,056 | |||||||||||||||||||||
| Period gap |
$ | 992,039 | $ | (709,135 | ) | $ | (270,263 | ) | $ | 475 | $ | 211,592 | $ | 580,159 | $ | 804,867 | ||||||||||||
| Cumulative gap |
$ | 992,039 | $ | 282,904 | $ | 12,641 | $ | 13,116 | $ | 224,708 | $ | 804,867 | ||||||||||||||||
| Period gap to total assets |
22.12 | % | (15.82 | )% | (6.03 | )% | 0.01 | % | 4.72 | % | 12.94 | % | ||||||||||||||||
| Cumulative gap to total assets |
22.12 | % | 6.30 | % | 0.27 | % | 0.28 | % | 5.00 | % | 17.94 | % | ||||||||||||||||
| Cumulative interest-earning assets to cumulative interest-bearing liabilities |
188.09 | % | 114.04 | % | 100.51 | % | 100.40 | % | 106.55 | % | 122.45 | % | ||||||||||||||||
Certain shortcomings are inherent in the method of analysis presented in the table. For example, although certain assets and liabilities may have similar maturities or periods of repricing, they may react in different degrees to changes in market interest rates. In addition, certain assets, such as adjustable-rate loans, have features that restrict changes in interest rates, both on a short-term basis and over the life of the asset. More importantly, changes in interest rates, prepayments and early withdrawal levels may deviate from those assumed in the calculations in the table. As a result of these shortcomings, we focus more on earnings at risk simulation modeling than on a gap analysis. Management considers earnings at risk simulation modeling to be more informative in forecasting future income at risk.
Finally, we also monitor interest rate risk from an economic perspective with an economic value of equity analysis. This measure is used to evaluate long-term interest rate risk.
Litigation
We are from time to time a party to litigation arising in the normal course of business. Management knows of no such threatened or pending legal actions against us that are likely to have a material adverse impact on our business, financial condition, liquidity or operating results.
73
Table of Contents
New Accounting Pronouncements
In January 2011, the Financial Accounting Standards Board (“FASB”) issued Accounting Standards Update (“ASU”) No. 2011-01, “Deferral of the Effective Date of Disclosures about Troubled-Debt Restructurings in Update No. 2010-20.” Update No. 2011-01 provides for the deferral of troubled-debt restructuring disclosures included in Update No. 2010-20 that were effective for periods ending on or after December 15, 2010. These disclosures will be deferred until the issuance of the current outstanding proposal that determines what constitutes a troubled-debt restructuring. This accounting standard is effective immediately and is not expected to have a material effect on our consolidated financial statements.
In July 2010, the FASB issued ASU No. 2010-20, “Disclosures about the Credit Quality of Financing Receivables and the Allowance for Credit Losses,” which provides additional guidance relating to loan loss allowance disclosures. This accounting standard will be effective for interim and annual reporting periods ending on or after December 15, 2010. This disclosure did not have a material effect on our consolidated financial statements.
In March 2010, the FASB issued ASU No. 2010-11, “Derivatives and Hedging (Topic 815) Scope Exception Related to Embedded Credit Derivatives,” which provides guidance on whether embedded credit-derivative features in financial instruments issued by structures such as collateralized debt obligations (CDO’s) and synthetic CDO’s are subject to bifurcation and separate accounting. This guidance is effective for fiscal quarters beginning after June 15, 2010. The adoption of this guidance did not have a material effect on our consolidated financial statements.
In January 2010, the FASB issued ASU No. 2010-06, “Fair Value Measurements and Disclosures (Topic 820): Improving Disclosures about Fair Values,” which provides additional guidance relating to fair value measurement disclosures. Specifically, companies will be required to separately disclose significant transfers into and out of Level 1 and Level 2 measurements in the fair value hierarchy and the reasons for those transfers. For Level 3 fair value measurements, the new guidance requires presentation of separate information about purchases, sales, issuances and settlements. Additionally, the FASB also clarified existing fair value measurement disclosure requirements relating to the level of disaggregation, inputs, and valuation techniques. Certain provisions of this accounting update related to detailed Level 3 disclosures will be effective at the beginning of 2011. The remainder of the provision was effective on January 1, 2010 and the adoption of these provisions did not have a material effect on our consolidated financial statements.
In December 2009, the FASB issued ASU No. 2009-16, “Transfers and Servicing (Topic 860)—Accounting for Transfers of Financial Assets.” ASU 2009-16 amends derecognition accounting and disclosure guidance, eliminates the exemption from consolidation for qualifying special-purpose entities (“QSPEs”) and also requires a transferor to evaluate all existing QSPEs to determine whether they must be consolidated. This accounting standard will be effective as of the beginning of the first annual reporting period beginning after November 15, 2009. We have adopted the accounting standard at the beginning of 2010 and the adoption did not have a material effect on our consolidated financial statements.
In June 2009, FASB issued ASU No 2009-17, “Consolidations (Topic 810)—Improvements to Financial Reporting for Enterprises involved with Variable Interest Entities,” which amends the consolidation guidance applicable to variable interest entities. The amendments to the consolidation guidance affect all entities, as well as QSPEs that are currently excluded from previous consolidation guidance. This accounting standard became effective as of the beginning of the first annual reporting period beginning after November 15, 2009. We have adopted the accounting standard at the beginning of 2010 and the adoption did not have a material effect on our consolidated financial statements.
74
Table of Contents
Quarterly Financial Information
The following table sets forth unaudited financial data regarding our operations for each of the four quarters of 2010 and 2009. This information, in the opinion of management, includes all adjustments necessary to present fairly our results of operations for such periods, consisting only of normal recurring adjustments for the periods indicated. The operating results for any quarter are not necessarily indicative of results for any future period.
| 2010 Quarter Ended | 2009 Quarter Ended | |||||||||||||||||||||||||||||||
| Dec. 31 | Sept. 30 | June 30 | Mar. 31 | Dec. 31 | Sept. 30 | June 30 | Mar. 31 | |||||||||||||||||||||||||
| (in thousands, except per share data) | ||||||||||||||||||||||||||||||||
| Interest income |
$ | 49,967 | $ | 51,980 | $ | 53,682 | $ | 52,887 | $ | 53,965 | $ | 56,033 | $ | 55,715 | $ | 54,317 | ||||||||||||||||
| Interest expense |
16,405 | 17,613 | 19,004 | 19,420 | 21,155 | 23,658 | 25,335 | 26,971 | ||||||||||||||||||||||||
| Net interest income |
33,562 | 34,367 | 34,678 | 33,467 | 32,810 | 32,375 | 30,380 | 27,346 | ||||||||||||||||||||||||
| Provision for loan losses |
59,923 | 18,128 | 43,946 | 21,130 | 19,002 | 15,539 | 39,507 | 15,563 | ||||||||||||||||||||||||
| Noninterest income |
18,009 | 44,142 | 6,158 | 4,374 | 12,735 | 3,376 | 12,137 | 5,343 | ||||||||||||||||||||||||
| Noninterest expense |
36,971 | 26,646 | 27,467 | 27,152 | 30,219 | 22,516 | 23,707 | 21,165 | ||||||||||||||||||||||||
| Income (loss) before income taxes |
(45,323 | ) | 33,735 | (30,577 | ) | (10,441 | ) | (3,676 | ) | (2,304 | ) | (20,697 | ) | (4,039 | ) | |||||||||||||||||
| Income taxes (benefit) |
284 | 321 | 306 | 306 | (647 | ) | 144 | 2,558 | (1,221 | ) | ||||||||||||||||||||||
| Net Income (loss) |
(45,607 | ) | 33,414 | (30,883 | ) | (10,747 | ) | (3,029 | ) | (2,448 | ) | (23,255 | ) | (2,818 | ) | |||||||||||||||||
| Preferred dividends and discounts |
(2,448 | ) | (2,671 | ) | (17,449 | ) | (2,887 | ) | (2,880 | ) | (2,873 | ) | (2,868 | ) | (2,862 | ) | ||||||||||||||||
| Net income (loss) applicable to common stockholders |
$ | (48,055 | ) | $ | 30,743 | $ | (48,332 | ) | $ | (13,634 | ) | $ | (5,909 | ) | $ | (5,321 | ) | $ | (26,123 | ) | $ | (5,680 | ) | |||||||||
| Income (loss) per common share: |
||||||||||||||||||||||||||||||||
| Basic |
$ | (2.76 | ) | $ | 1.68 | $ | (3.35 | ) | $ | (1.30 | ) | $ | (0.56 | ) | $ | (0.51 | ) | $ | (2.49 | ) | $ | (0.54 | ) | |||||||||
| Diluted |
(2.76 | ) | 1.57 | (3.35 | ) | (1.30 | ) | (0.56 | ) | (0.51 | ) | (2.49 | ) | (0.54 | ) | |||||||||||||||||
CAUTIONARY NOTE REGARDING FORWARD-LOOKING STATEMENTS
This press release includes forward-looking statements that reflect our current expectations and projections about our future results, performance, prospects and opportunities. We have tried to identify these forward-looking statements by using words including “may,” “might”, “contemplate”, “plan”, “prudent”, “potential”, “should”, “will,” “expect,” “anticipate,” “believe,” “intend,” “could” and “estimate” and similar expressions. These forward-looking statements are based on information currently available to us and are subject to a number of risks, uncertainties and other factors that could cause our actual results, performance, prospects or opportunities in 2011 and beyond to differ materially from those expressed in, or implied by, these forward-looking statements.
These risks, uncertainties and other factors include, without limitation:
| • | the impact of the regulatory environment on our operations, including regulatory restrictions and liquidity constraints at the holding company level that could impair our ability to pay dividends or interest on our outstanding securities; |
| • | the risk that our regulators could require us to maintain regulatory capital in excess of the levels needed to be considered well capitalized; |
| • | the risk that our allowance for loan losses may prove insufficient to absorb probable losses in our loan portfolio; |
75
Table of Contents
| • | adverse economic conditions and continued disruption in the credit and lending markets impacting our business and the businesses of our customers, as well as other banks and lending institutions with which we have commercial relationships; |
| • | the uncertainties in estimating the fair value of underlying loan collateral, including the fair value of developed real estate and undeveloped land in light of declining demand for such assets and continuing illiquidity in the Chicago real estate market; |
| • | lending concentration risks, including the risks associated with the high volume of loans secured by commercial real estate in our portfolio; |
| • | possible volatility in loan charge-offs and recoveries between periods; |
| • | the continued decline in residential real estate sales volume and the likely potential for continuing illiquidity in the real estate market, including within the Chicago area; |
| • | the effect on operations of our customers’ changing use of our deposit products and the possibility that our wholesale funding sources may prove insufficient to support our operations and future growth; |
| • | significant restrictions on our operations as a result of our participation in the TARP CPP; |
| • | the effect on our profitability if interest rates fluctuate, as well as the effect of changes in general economic conditions, continued volatility in the capital market, our debt credit ratings, deposit flows, and loan demand; |
| • | the effectiveness of our hedging transactions and their impact on our future results of operations; |
| • | the potential impact of certain operational risks, including, but not limited to, data processing system failures and errors and customer or employee fraud; |
| • | the conditions of the local economy in which we operate and continued weakness in the local economy; |
| • | the impact of changes in legislation, including the Dodd-Frank Act, or regulatory and accounting principles, policies and guidelines affecting our business, including those relating to capital requirements; |
| • | the impact on our growth and profitability from competition from other financial institutions and other financial service providers; |
| • | the risks associated with attracting and retaining experienced and qualified personnel, including our senior management and other key personnel in our core business lines; |
| • | the risks associated with the new products and services, including the expansion into new geographic markets; |
| • | the risks associated with implementing our business strategy and managing our growth effectively, including our ability to preserve and access sufficient capital to execute on our strategy; |
| • | the ability to use net operating loss carry-forwards to reduce future tax payments if an ownership change of the Company is deemed to have occurred for tax purposes; |
| • | security risks relating to our internet banking activities that could damage our reputation and our business; and |
| • | other economic, competitive, governmental, regulatory and technological factors impacting our operations. |
For further information about these and other risks, uncertainties and factors, please review the disclosure included in the section of this Annual Report on Form 10-K captioned “Risk Factors.”
76
Table of Contents
You should not place undue reliance on any forward-looking statements. Except as otherwise required by federal securities laws, we undertake no obligation to publicly update or revise any forward-looking statements or risk factors, whether as a result of new information, future events, changed circumstances or any other reason.
Item 7A. Quantitative and Qualitative Disclosures about Market Risk
The information contained in the section captioned “Management’s Discussion and Analysis of Financial Condition and Results of Operations—Quantitative and Qualitative Disclosure about Market Risks” is incorporated herein by reference.
77
Table of Contents
Item 8. Financial Statements and Supplementary Data
INDEX TO FINANCIAL STATEMENTS
78
Table of Contents
REPORT OF INDEPENDENT REGISTERED PUBLIC ACCOUNTING FIRM
To the Stockholders and Board of Directors of Taylor Capital Group, Inc.:
We have audited the accompanying consolidated balance sheets of Taylor Capital Group, Inc. and subsidiaries (the Company) as of December 31, 2010 and 2009, and the related consolidated statements of operations, changes in stockholders’ equity, and cash flows for each of the years in the three-year period ended December 31, 2010. These consolidated financial statements are the responsibility of the Company’s management. Our responsibility is to express an opinion on these consolidated financial statements based on our audits.
We conducted our audits in accordance with the standards of the Public Company Accounting Oversight Board (United States). Those standards require that we plan and perform the audit to obtain reasonable assurance about whether the financial statements are free of material misstatement. An audit includes examining, on a test basis, evidence supporting the amounts and disclosures in the financial statements. An audit also includes assessing the accounting principles used and significant estimates made by management, as well as evaluating the overall financial statement presentation. We believe that our audits provide a reasonable basis for our opinion.
In our opinion, the consolidated financial statements referred to above present fairly, in all material respects, the financial position of Taylor Capital Group, Inc. and subsidiaries as of December 31, 2010 and 2009, and the results of their operations and their cash flows for each of the years in the three-year period ended December 31, 2010, in conformity with U.S. generally accepted accounting principles.
We also have audited, in accordance with the standards of the Public Company Accounting Oversight Board (United States), the Company’s internal control over financial reporting as of December 31, 2010, based on criteria established in Internal Control—Integrated Framework issued by the Committee of Sponsoring Organizations of the Treadway Commission, and our report dated March 22, 2011 expressed an unqualified opinion on the effectiveness of the Company’s internal control over financial reporting.

Chicago, Illinois
March 22, 2011
79
Table of Contents
TAYLOR CAPITAL GROUP, INC.
(in thousands, except share and per share data)
| December 31, | ||||||||
| 2010 | 2009 | |||||||
| ASSETS | ||||||||
| Cash and cash equivalents: |
||||||||
| Cash and due from banks |
$ | 80,273 | $ | 48,420 | ||||
| Short-term investments |
1,056 | 49 | ||||||
| Total cash and cash equivalents |
81,329 | 48,469 | ||||||
| Investment securities: |
||||||||
| Available-for-sale, at fair value |
1,153,487 | 1,271,271 | ||||||
| Held-to-maturity, at amortized cost (fair value of $101,751 at December 31, 2010) |
100,990 | — | ||||||
| Loans, held for sale, at lower of cost or fair value |
259,020 | 81,853 | ||||||
| Loans, net of allowance for loan losses of $124,568 and $106,185 at December 31, 2010 and 2009, respectively |
2,710,770 | 2,847,290 | ||||||
| Premises, leasehold improvements and equipment, net |
15,890 | 15,515 | ||||||
| Investments in Federal Home Loan Bank and Federal Reserve Bank stock, at cost |
40,032 | 31,210 | ||||||
| Other real estate and repossessed assets, net |
31,490 | 26,231 | ||||||
| Other assets |
90,846 | 81,663 | ||||||
| Total assets |
$ | 4,483,854 | $ | 4,403,502 | ||||
| LIABILITIES AND STOCKHOLDERS’ EQUITY | ||||||||
| Deposits: |
||||||||
| Noninterest-bearing |
$ | 633,300 | $ | 659,146 | ||||
| Interest-bearing |
2,393,606 | 2,317,654 | ||||||
| Total deposits |
3,026,906 | 2,976,800 | ||||||
| Other borrowings |
511,008 | 337,669 | ||||||
| Accrued interest, taxes and other liabilities |
56,697 | 60,925 | ||||||
| Notes payable and other advances |
505,000 | 627,000 | ||||||
| Junior subordinated debentures |
86,607 | 86,607 | ||||||
| Subordinated notes, net |
88,835 | 55,695 | ||||||
| Total liabilities |
4,275,053 | 4,144,696 | ||||||
| Stockholders’ equity: |
||||||||
| Preferred stock, $0.01 par value, 10,000,000 shares authorized: |
||||||||
| Series A, 8% non-cumulative convertible perpetual, no shares issued and outstanding at December 31, 2010, 2,400,000 shares issued and outstanding at December 31, 2009, $25.00 liquidation value |
— | 60,000 | ||||||
| Series B, 5% fixed rate cumulative perpetual, 104,823 shares issued and outstanding at December 31, 2010 and December 31, 2009, $1,000 liquidation value |
100,389 | 98,844 | ||||||
| Series C, 8% non-cumulative, convertible perpetual, 1,500,000 shares authorized, 1,276,480 issued and outstanding at December 31, 2010, $25.00 liquidation value, no shares issued and outstanding at December 31, 2009 |
31,912 | — | ||||||
| Series D, nonvoting, convertible; 860,378 shares authorized; 405,330 shares issued and outstanding at December 31, 2010, no shares issued and outstanding at December 31, 2009 |
4 | — | ||||||
| Series E, 8% nonvoting, non-cumulative, convertible perpetual, 223,520 shares authorized, 223,520 shares issued and outstanding at December 31, 2010, no shares issued and outstanding at December 31, 2009 |
5,588 | — | ||||||
| Common stock, $0.01 par value; 45,000,000 shares authorized; 19,235,706 and 12,029,375 shares issued at December 31, 2010 and 2009, respectively; 17,877,708 and 11,076,707 shares outstanding at December 31, 2010 and 2009, respectively |
192 | 120 | ||||||
| Surplus |
312,693 | 226,398 | ||||||
| Accumulated deficit |
(189,895 | ) | (110,617 | ) | ||||
| Accumulated other comprehensive income, net |
(22,497 | ) | 8,697 | |||||
| Treasury stock, at cost, 1,357,998 shares at December 31, 2010 and 952,668 shares at December 31, 2009 |
(29,585 | ) | (24,636 | ) | ||||
| Total stockholders’ equity |
208,801 | 258,806 | ||||||
| Total liabilities and stockholders’ equity |
$ | 4,483,854 | $ | 4,403,502 | ||||
See accompanying notes to consolidated financial statements
80
Table of Contents
TAYLOR CAPITAL GROUP, INC.
CONSOLIDATED STATEMENTS OF OPERATIONS
(in thousands, except per share data)
| For the Years Ended December 31, | ||||||||||||
| 2010 | 2009 | 2008 | ||||||||||
| Interest income: |
||||||||||||
| Interest and fees on loans |
$ | 153,899 | $ | 159,848 | $ | 158,564 | ||||||
| Interest and dividends on investment securities: |
||||||||||||
| Taxable |
50,162 | 54,694 | 38,633 | |||||||||
| Tax-exempt |
4,444 | 5,468 | 5,830 | |||||||||
| Interest on cash equivalents |
11 | 20 | 1,421 | |||||||||
| Total interest income |
208,516 | 220,030 | 204,448 | |||||||||
| Interest expense: |
||||||||||||
| Deposits |
44,286 | 69,164 | 88,279 | |||||||||
| Other borrowings |
8,648 | 8,844 | 9,648 | |||||||||
| Notes payable and other advances |
5,289 | 6,557 | 5,511 | |||||||||
| Junior subordinated debentures |
5,804 | 6,066 | 7,013 | |||||||||
| Subordinated notes |
8,415 | 6,488 | 1,646 | |||||||||
| Total interest expense |
72,442 | 97,119 | 112,097 | |||||||||
| Net interest income |
136,074 | 122,911 | 92,351 | |||||||||
| Provision for loan losses |
143,127 | 89,611 | 144,158 | |||||||||
| Net interest income (loss) after provision for loan losses |
(7,053 | ) | 33,300 | (51,807 | ) | |||||||
| Noninterest income: |
||||||||||||
| Service charges |
11,282 | 11,306 | 9,136 | |||||||||
| Trust and investment management fees |
768 | 1,697 | 3,578 | |||||||||
| Mortgage origination revenue |
14,261 | — | — | |||||||||
| Loss on disposition of bulk purchased mortgage loans |
(2,418 | ) | (1,961 | ) | — | |||||||
| Gain (loss) on sales of investment securities |
41,376 | 17,595 | (2,399 | ) | ||||||||
| Other derivative income |
1,963 | 1,399 | 1,936 | |||||||||
| Other noninterest income |
5,451 | 3,555 | 186 | |||||||||
| Total noninterest income |
72,683 | 33,591 | 12,437 | |||||||||
| Noninterest expense: |
||||||||||||
| Salaries and employee benefits |
54,073 | 42,914 | 47,855 | |||||||||
| Occupancy of premises |
8,328 | 8,146 | 7,812 | |||||||||
| Furniture and equipment |
2,284 | 2,230 | 3,094 | |||||||||
| Nonperforming asset expense |
19,790 | 11,726 | 4,711 | |||||||||
| FDIC assessment |
8,238 | 10,380 | 2,687 | |||||||||
| Legal fees, net |
4,922 | 5,961 | 5,016 | |||||||||
| Early extinguishment of debt |
378 | 527 | 2,500 | |||||||||
| Other noninterest expense |
20,223 | 15,723 | 19,695 | |||||||||
| Total noninterest expense |
118,236 | 97,607 | 93,370 | |||||||||
| Loss before income taxes |
(52,606 | ) | (30,716 | ) | (132,740 | ) | ||||||
| Income tax expense (benefit) |
1,217 | 834 | (8,212 | ) | ||||||||
| Net loss |
(53,823 | ) | (31,550 | ) | (124,528 | ) | ||||||
| Preferred dividends and discounts |
(9,699 | ) | (11,483 | ) | (2,150 | ) | ||||||
| Implied non-cash preferred dividend |
(15,756 | ) | — | (16,680 | ) | |||||||
| Net loss applicable to common stockholders |
$ | (79,278 | ) | $ | (43,033 | ) | $ | (143,358 | ) | |||
| Basic loss per common share |
$ | (5.27 | ) | $ | (4.10 | ) | $ | (13.72 | ) | |||
| Diluted loss per common share |
(5.27 | ) | (4.10 | ) | (13.72 | ) | ||||||
See accompanying notes to consolidated financial statements
81
Table of Contents
TAYLOR CAPITAL GROUP, INC.
CONSOLIDATED STATEMENTS OF CHANGES IN STOCKHOLDERS’ EQUITY
(in thousands, except per share data)
| Preferred Stock, Series A |
Preferred Stock, Series B |
Preferred Stock, Series C |
Preferred Stock, Series D |
Preferred Stock, Series E |
Common Stock |
Surplus | Retained Earnings (Accumulated (Deficit) |
Accumulated Other Comprehensive Income (Loss) |
Treasury Stock |
Total | ||||||||||||||||||||||||||||||||||
| Balance at December 31, 2007 |
$ | — | $ | — | $ | — | $ | — | $ | — | $ | 115 | $ | 197,214 | $ | 75,145 | $ | 6,418 | $ | (24,636 | ) | $ | 254,256 | |||||||||||||||||||||
| Issuance of preferred stock, Series A, net of issuance costs |
60,000 | — | — | — | — | — | (3,642 | ) | — | — | — | 56,358 | ||||||||||||||||||||||||||||||||
| Discount from preferred stock beneficial conversion feature |
(16,680 | ) | — | — | — | — | — | 16,680 | — | — | — | — | ||||||||||||||||||||||||||||||||
| Implied non-cash preferred dividend for beneficial conversion feature |
16,680 | — | — | — | — | — | — | (16,680 | ) | — | — | — | ||||||||||||||||||||||||||||||||
| Issuance of preferred stock, Series B, net of discount/issuance costs |
— | 96,577 | — | — | — | — | — | — | — | — | 96,577 | |||||||||||||||||||||||||||||||||
| Issuance of warrants to purchase common stock, net of issuance costs |
— | — | — | — | — | — | 12,835 | — | — | — | 12,835 | |||||||||||||||||||||||||||||||||
| Issuance of restricted stock grants |
— | — | — | — | — | 6 | (6 | ) | — | — | — | — | ||||||||||||||||||||||||||||||||
| Exercise of stock options |
— | — | — | — | — | — | 30 | — | — | — | 30 | |||||||||||||||||||||||||||||||||
| Amortization of stock based compensation awards |
— | — | — | — | — | — | 2,222 | — | — | — | 2,222 | |||||||||||||||||||||||||||||||||
| Tax benefit on stock options and stock awards |
— | — | — | — | — | — | (461 | ) | — | — | — | (461 | ) | |||||||||||||||||||||||||||||||
| Comprehensive income (loss): |
— | |||||||||||||||||||||||||||||||||||||||||||
| Net loss |
— | — | — | — | — | — | — | (124,528 | ) | — | — | (124,528 | ) | |||||||||||||||||||||||||||||||
| Change in unrealized gains and losses on available-for-sale investment securities, net of reclassification adjustment and of income taxes |
— | — | — | — | — | — | — | — | 10,142 | — | 10,142 | |||||||||||||||||||||||||||||||||
| Change in unrealized gains and losses from cash flow hedging instruments, net of income taxes |
— | — | — | — | — | — | — | — | 3,868 | — | 3,868 | |||||||||||||||||||||||||||||||||
| Changes in deferred gains and losses from termination of cash flow hedging instruments, net of income taxes |
— | — | — | — | — | — | — | — | (1,718 | ) | — | (1,718 | ) | |||||||||||||||||||||||||||||||
| Total comprehensive loss |
— | (112,236 | ) | |||||||||||||||||||||||||||||||||||||||||
| Common stock dividends—$0.10 per share |
— | — | — | — | — | — | — | (1,081 | ) | — | — | (1,081 | ) | |||||||||||||||||||||||||||||||
| Preferred stock dividends declared, Series A—$0.5889 per share |
— | — | — | — | — | — | — | (1,413 | ) | — | — | (1,413 | ) | |||||||||||||||||||||||||||||||
| Preferred stock dividends accumulated, Series B |
— | 737 | — | — | — | — | — | (737 | ) | — | — | — | ||||||||||||||||||||||||||||||||
| Balance at December 31, 2008 |
$ | 60,000 | $ | 97,314 | $ | — | $ | — | $ | — | $ | 121 | $ | 224,872 | $ | (69,294 | ) | $ | 18,710 | $ | (24,636 | ) | $ | 307,087 | ||||||||||||||||||||
| Adoption of FSP FAS 115-2 and 124-2, effective April 1, 2009 |
— | — | — | — | — | — | — | 1,710 | (1,033 | ) | — | 677 | ||||||||||||||||||||||||||||||||
| Preferred stock issuance cost, Series B |
— | — | — | — | — | — | (27 | ) | — | — | — | (27 | ) | |||||||||||||||||||||||||||||||
| Amortization of stock based compensation awards |
— | — | — | — | — | (1 | ) | 2,094 | — | — | — | 2,093 | ||||||||||||||||||||||||||||||||
| Tax benefit on stock options and stock awards |
— | — | — | — | — | — | (541 | ) | — | — | — | (541 | ) | |||||||||||||||||||||||||||||||
| Comprehensive loss: |
— | |||||||||||||||||||||||||||||||||||||||||||
| Net loss |
— | — | — | — | — | — | — | (31,550 | ) | — | — | (31,550 | ) | |||||||||||||||||||||||||||||||
| Change in unrealized gains on available-for-sale investment securities, net of reclassification adjustment and of income taxes |
— | — | — | — | — | — | — | — | (5,115 | ) | — | (5,115 | ) | |||||||||||||||||||||||||||||||
| Changes in deferred gain from termination of cash flow hedging instruments, net of income taxes |
— | — | — | — | — | — | — | — | (3,865 | ) | — | (3,865 | ) | |||||||||||||||||||||||||||||||
| Total comprehensive loss |
— | (40,530 | ) | |||||||||||||||||||||||||||||||||||||||||
| Preferred stock dividends declared, Series A—$2.00 per share |
— | — | — | — | — | — | — | (4,800 | ) | — | — | (4,800 | ) | |||||||||||||||||||||||||||||||
| Preferred stock dividends accumulated, Series B |
— | 1,530 | — | — | — | — | — | (6,683 | ) | — | — | (5,153 | ) | |||||||||||||||||||||||||||||||
| Balance at December 31, 2009 |
$ | 60,000 | $ | 98,844 | $ | — | $ | — | $ | — | $ | 120 | $ | 226,398 | $ | (110,617 | ) | $ | 8,697 | $ | (24,636 | ) | $ | 258,806 | ||||||||||||||||||||
See accompanying notes to consolidated financial statements
82
Table of Contents
TAYLOR CAPITAL GROUP, INC.
CONSOLIDATED STATEMENTS OF CHANGES IN STOCKHOLDERS’ EQUITY (continued)
(in thousands, except per share data)
| Preferred Stock, Series A |
Preferred Stock, Series B |
Preferred Stock, Series C |
Preferred Stock, Series D |
Preferred Stock, Series E |
Common Stock |
Surplus | Retained Earnings (Accumulated (Deficit) |
Accumulated Other Comprehensive Income (Loss) |
Treasury Stock |
Total | ||||||||||||||||||||||||||||||||||
| Balance at December 31, 2009 |
$ | 60,000 | $ | 98,844 | $ | — | $ | — | $ | — | $ | 120 | $ | 226,398 | $ | (110,617 | ) | $ | 8,697 | $ | (24,636 | ) | $ | 258,806 | ||||||||||||||||||||
| Conversion of Series A Preferred to common stock |
(60,000 | ) | — | — | — | — | 60 | 59,919 | — | — | — | (21 | ) | |||||||||||||||||||||||||||||||
| Implied non-cash preferred dividend |
— | — | — | — | — | 12 | 15,744 | (15,756 | ) | — | — | — | ||||||||||||||||||||||||||||||||
| Issuance of Series C Preferred, net of issuance costs |
— | — | 31,912 | — | — | — | (964 | ) | — | — | — | 30,948 | ||||||||||||||||||||||||||||||||
| Issuance of Series D Preferred, net of issuance costs |
— | — | — | 4 | — | — | 4,945 | — | — | (4,949 | ) | — | ||||||||||||||||||||||||||||||||
| Issuance of Series E Preferred, net of issuance costs |
— | — | — | — | 5,588 | — | (291 | ) | — | — | — | 5,297 | ||||||||||||||||||||||||||||||||
| Issuance of warrants to purchase common stock, net of issuance costs |
— | — | — | — | — | — | 4,787 | — | — | — | 4,787 | |||||||||||||||||||||||||||||||||
| Issuance of restricted stock grants, net of forfeitures |
— | — | — | — | — | — | — | — | — | — | — | |||||||||||||||||||||||||||||||||
| Exercise of stock options |
— | — | — | — | — | — | 5 | — | — | — | 5 | |||||||||||||||||||||||||||||||||
| Amortization of stock based compensation awards |
— | — | — | — | — | — | 2,150 | — | — | — | 2,150 | |||||||||||||||||||||||||||||||||
| Comprehensive loss: |
||||||||||||||||||||||||||||||||||||||||||||
| Net loss |
— | — | — | — | — | — | — | (53,823 | ) | — | — | (53,823 | ) | |||||||||||||||||||||||||||||||
| Change in unrealized gains on available-for-sale investment securities, net of reclassification adjustment and of income taxes |
— | — | — | — | — | — | — | — | (26,946 | ) | — | (26,946 | ) | |||||||||||||||||||||||||||||||
| Changes in deferred gains and losses recorded in other comprehensive income, net of income taxes |
— | — | — | — | — | — | — | — | (4,248 | ) | — | (4,248 | ) | |||||||||||||||||||||||||||||||
| Total comprehensive loss |
— | $ | (85,017 | ) | ||||||||||||||||||||||||||||||||||||||||
| Preferred stock dividends declared, Series A– $0.50 per share |
— | — | — | — | — | — | — | (1,200 | ) | — | — | (1,200 | ) | |||||||||||||||||||||||||||||||
| Preferred stock dividends and discounts accumulated, Series B |
— | 1,545 | — | — | — | — | — | (6,786 | ) | — | — | (5,241 | ) | |||||||||||||||||||||||||||||||
| Preferred stock dividends declared, Series C– $1.26 per share |
— | — | — | — | — | — | — | (1,610 | ) | — | — | (1,610 | ) | |||||||||||||||||||||||||||||||
| Preferred stock dividends declared, Series E – $0.46 per share |
— | — | — | — | — | — | — | (103 | ) | — | — | (103 | ) | |||||||||||||||||||||||||||||||
| Balance at December 31, 2010 |
$ | — | $ | 100,389 | $ | 31,912 | $ | 4 | $ | 5,588 | $ | 192 | $ | 312,693 | $ | (189,895 | ) | $ | (22,497 | ) | $ | (29,585 | ) | $ | 208,801 | |||||||||||||||||||
See accompanying notes to consolidated financial statements
83
Table of Contents
TAYLOR CAPITAL GROUP, INC.
CONSOLIDATED STATEMENTS OF CASH FLOWS
(in thousands)
| For the Years Ended December 31, | ||||||||||||
| 2010 | 2009 | 2008 | ||||||||||
| Cash flows from operating activities: |
||||||||||||
| Net loss |
$ | (53,823 | ) | $ | (31,550 | ) | $ | (124,528 | ) | |||
| Adjustments to reconcile net loss to net cash provided by (used in) operating activities: |
||||||||||||
| Other derivative income |
(1,963 | ) | (1,399 | ) | (1,936 | ) | ||||||
| (Gain) loss on sales of investment securities |
(41,376 | ) | (17,595 | ) | 2,399 | |||||||
| Amortization of premiums and discounts, net |
3,417 | 403 | (831 | ) | ||||||||
| Deferred loan fee amortization |
(5,983 | ) | (5,253 | ) | (2,200 | ) | ||||||
| Provision for loan losses |
143,127 | 89,611 | 144,158 | |||||||||
| Loans purchased |
— | (76,829 | ) | — | ||||||||
| Loans originated for sale |
(821,350 | ) | — | — | ||||||||
| Proceeds from loan sales |
624,584 | 13,568 | — | |||||||||
| Depreciation and amortization |
2,309 | 2,344 | 3,090 | |||||||||
| Deferred income tax expense |
— | 4,997 | 8,222 | |||||||||
| Losses on other real estate |
12,643 | 2,814 | 754 | |||||||||
| Tax expense on stock options exercised or stock awards |
— | (541 | ) | (461 | ) | |||||||
| Excess tax benefit on stock options exercised and stock awards |
5 | 410 | 190 | |||||||||
| Cash received on termination of derivative instruments |
— | 6,630 | 3,934 | |||||||||
| Other, net |
(5,969 | ) | 4,774 | 57 | ||||||||
| Changes in other assets and liabilities: |
||||||||||||
| Accrued interest receivable |
946 | 1,006 | 581 | |||||||||
| Other assets |
6,466 | (14,769 | ) | (8,619 | ) | |||||||
| Accrued interest payable, taxes and other liabilities |
(3,769 | ) | (8,425 | ) | 17,803 | |||||||
| Net cash (used in) provided by operating activities |
(140,736 | ) | (29,804 | ) | 42,613 | |||||||
| Cash flows from investing activities: |
||||||||||||
| Purchases of available-for-sale securities |
(1,147,907 | ) | (975,304 | ) | (352,772 | ) | ||||||
| Purchases of held-to-maturity securities |
(50,224 | ) | — | — | ||||||||
| Proceeds from principal payments and maturities of available-for-sale securities |
247,975 | 312,451 | 165,784 | |||||||||
| Proceeds from principal payments and maturities of held-to-maturity securities |
4,929 | 25 | — | |||||||||
| Proceeds from sales of available-for-sale securities |
965,605 | 497,415 | — | |||||||||
| Net (increase) decrease in loans |
(15,750 | ) | 119,566 | (782,601 | ) | |||||||
| Net additions to premises, leasehold improvements and equipment |
(2,684 | ) | (735 | ) | (4,105 | ) | ||||||
| Purchases of FHLB and FRB stock |
(8,822 | ) | (6,580 | ) | (14,320 | ) | ||||||
| Proceeds from sales of FHLB and FRB stock |
— | 5,000 | — | |||||||||
| Additions to other real estate owned and repossessed assets |
— | (342 | ) | (1,625 | ) | |||||||
| Net proceeds from sales of other real estate and repossessed assets |
16,822 | 13,552 | 4,776 | |||||||||
| Net cash paid on sale of branch |
— | — | (6,444 | ) | ||||||||
| Net cash (used in) provided by investing activities |
$ | 9,944 | $ | (34,952 | ) | $ | (991,307 | ) | ||||
See accompanying notes to consolidated financial statements
84
Table of Contents
TAYLOR CAPITAL GROUP, INC.
CONSOLIDATED STATEMENTS OF CASH FLOWS—(Continued)
(in thousands)
| For the Years Ended December 31, | ||||||||||||
| 2010 | 2009 | 2008 | ||||||||||
| Cash flows from financing activities: |
||||||||||||
| Net increase (decrease) in deposits |
$ | 48,552 | $ | (156,293 | ) | $ | 557,118 | |||||
| Net increase (decrease) in short-term borrowings and advances |
121,339 | 207,109 | 101,506 | |||||||||
| Proceeds from long-term borrowings and advances |
45,000 | 20,000 | 97,000 | |||||||||
| Repayments of long-term borrowings and advances |
(115,000 | ) | — | (55,000 | ) | |||||||
| Net proceeds from issuance of subordinated notes |
36,150 | — | 58,749 | |||||||||
| Net proceeds from preferred stock issuance, net of costs |
36,245 | (27 | ) | 161,068 | ||||||||
| Common stock issuance costs |
(21 | ) | — | — | ||||||||
| Proceeds from exercise of employee stock options |
5 | — | 30 | |||||||||
| Excess tax benefit on stock options exercised and stock awards |
(5 | ) | (410 | ) | (190 | ) | ||||||
| Dividends paid |
(8,613 | ) | (10,166 | ) | (2,136 | ) | ||||||
| Net cash provided by financing activities |
163,652 | 60,213 | 918,145 | |||||||||
| Net increase (decrease) in cash and cash equivalents |
32,860 | (4,543 | ) | (30,549 | ) | |||||||
| Cash and cash equivalents, beginning of year |
48,469 | 53,012 | 83,561 | |||||||||
| Cash and cash equivalents, end of year |
$ | 81,329 | $ | 48,469 | $ | 53,012 | ||||||
| Supplemental disclosure of cash flow information: |
||||||||||||
| Cash paid (received) during the year for: |
||||||||||||
| Interest |
$ | 74,716 | $ | 104,687 | $ | 106,208 | ||||||
| Income taxes |
(4,855 | ) | (16,269 | ) | (3,793 | ) | ||||||
| Supplemental disclosures of noncash investing and financing activities: |
||||||||||||
| Transfer of available-for-sale investment securities to held-to-maturity investment securities |
$ | 55,633 | $ | — | $ | — | ||||||
| Change in fair value of available-for-sale investment securities, net of income taxes |
(26,946 | ) | (5,115 | ) | 10,142 | |||||||
| Transfer of portfolio loans to held for sale loans |
39,053 | 28,739 | — | |||||||||
| Transfer of held for sale loans to portfolio loans |
52,967 | 1,158 | — | |||||||||
| Loans transferred to other real estate and repossessed assets |
34,725 | 29,076 | 14,478 | |||||||||
| Exchange of common stock for Series D Preferred |
4,949 | — | — | |||||||||
See accompanying notes to consolidated financial statements
85
Table of Contents
NOTES TO CONSOLIDATED FINANCIAL STATEMENTS
1. Summary of Significant Accounting and Reporting Policies
The accounting and reporting policies of Taylor Capital Group, Inc. (the “Company”) conform to accounting principles generally accepted in the United States of America and general reporting practices within the financial services industry. The preparation of financial statements in conformity with accounting principles generally accepted in the United States of America requires management to make estimates and assumptions that affect the reported amounts of assets and liabilities and disclosure of contingent assets and liabilities at the date of the consolidated financial statements and the reported amounts of revenues and expenses during the reporting period. Actual results could differ from these estimates. Significant items subject to such estimates and assumptions include the allowance for loan losses, the valuation of deferred tax assets and the valuation of financial instruments such as investment securities and derivatives. The current economic environment has increased the degree of uncertainty inherent in those estimates and assumptions.
The following is a summary of the more significant accounting and reporting policies:
Basis of Presentation and Consolidation:
The consolidated financial statements include the accounts of the Company and its wholly-owned subsidiary, Cole Taylor Bank (the “Bank”). The Bank is a $4.5 billion asset commercial bank with banking offices located in the Chicago area. The Bank provides a full range of commercial banking services, primarily to small and midsize business, and consumer banking products and services. All significant intercompany balances and transactions between consolidated companies have been eliminated. In accordance with applicable accounting standards, the Company does not consolidate statutory trusts (TAYC Capital Trust I and TAYC Capital Trust II ) created for the sole purpose of issuing trust preferred securities.
The Company’s products and services consist of commercial banking credit and deposit products delivered by a single operations area. The Company does not have separate and discrete operating segments.
Cash and Cash Equivalents:
Cash and cash equivalents include cash on hand, amounts due from banks, interest-bearing deposits with banks or other financial institutions, federal funds sold, and securities purchased under agreements to resell with original maturities of less than 90 days. All federal funds are sold overnight with daily settlement required.
Investment Securities:
Securities that may be sold as part of the Company’s asset/liability management strategies or because of liquidity needs, changes in interest rates and resulting prepayment risk, or for other similar factors, are classified as available-for-sale and carried at fair value. Unrealized holding gains and losses on such securities are reported, net of tax, in accumulated other comprehensive income in stockholders’ equity. Securities that the Company has the ability and positive intent to hold to maturity are classified as held-to-maturity and carried at amortized cost. Premiums and discounts on investment securities are amortized over the estimated life of the security, using an effective interest method. In determining the estimated life of mortgage-related securities, certain judgments are required as to the time and amount of future principal repayments, and these judgments are made based upon the actual performance of the underlying security and the general market consensus regarding changes in mortgage interest rates and underlying prepayment estimates.
A decline in fair value of any available-for-sale or held-to-maturity security below cost that is deemed other-than-temporary results in a reduction in carrying amount and a new cost basis for the security. In determining if
86
Table of Contents
an impairment is other-than-temporary, the Company considers whether it expects to receive all future principal and interest payments in accordance with the original terms, whether it intends to sell the security, or whether it more-likely-than not will be required to sell the security before recovery. If the Company intends to sell the security or more likely than not will be required to sell the security before recovery of its amortized cost basis, an other-than-temporary impairment charge will be recognized in earnings for the difference between the amortized cost basis and the fair value of the security. If the Company does not expect to sell the security or it is not more likely than not that it will be required to sell the security before recovery, the other-than-temporary impairment write-down is separated into the amount of the credit loss, which is recognized in earnings, and the amount related to all other factors, which is recognized in other comprehensive income. Prior to the adoption of a new accounting standard on April 1, 2009 that amended accounting guidance for the measurement and recognition of other-than-temporary impairment, a decline in fair value of any available-for-sale or held-to-maturity security below cost that was deemed other-than-temporary resulted in a charge to earnings to reduce the carrying amount of the security to its fair value. In determining if an impairment was other-than-temporary, the Company considered whether it had the ability and intent to hold the investment until market price recovery, the reasons for impairment, the severity and duration of the impairment, and forecasted performance of the security.
Realized gains and losses on the sales of all securities are reported in income and computed using the specific identification method. Securities classified as trading are carried at fair value with unrealized gains or losses included in noninterest income. Dividends and interest income are recognized when earned.
Loans Held for Sale:
Loans held for sale as of December 31, 2010, consisted solely of residential loans. The Company intends to sell these loans and has elected to account for these loans at fair value. Loans held for sale as of December 31, 2009 consisted of bulk purchased loans and certain nonaccrual commercial loans, which the Company had intent to sell, were carried at the lower of cost or estimated fair value.
Loans:
Loans are stated at the principal amount outstanding, net of unearned discount. Unearned discount on consumer loans is recognized as income over the terms of the loans using the sum-of-the-months-digits method, which approximates an effective interest method. Interest income on other loans is generally recognized using the level-yield method. Loan origination and commitment fees and certain direct loan origination costs are deferred and the net amount is amortized over the life of the loan as an adjustment of the related loans’ yields.
Allowance for Loan Losses:
An allowance for loan losses has been established to provide for those loans that may not be repaid in their entirety. The allowance is increased by provisions for loan losses charged to expense and decreased by charge-offs, net of recoveries. Loans are charged off when the loss is highly probable and clearly identified. Although a loan is charged off, collection efforts may continue and future recoveries may occur. Management maintains the allowance at a level considered adequate to absorb probable losses inherent in the portfolio as of the balance sheet date.
In evaluating the adequacy of the allowance for loan losses, consideration is given to numerous quantitative and qualitative factors, including historical charge-off experience, growth and changes in the composition of the loan portfolio, the volume of delinquent and criticized loans, information about specific borrower situations, including their financial position, work out plans, and estimated collateral values, general economic and business conditions, duration of the business cycle, impact of competition on the Company’s underwriting terms, general market collateral values, and other factors and estimates which are subject to change over time. Estimating the risk of loss and amount of loss on any loan is necessarily subjective and ultimate losses may vary from current estimates. These estimates are reviewed quarterly and, as changes in estimates are identified by management, the
87
Table of Contents
amounts are reflected in income through the provision for loan losses in the appropriate period. Generally, when there is no realistic prospect of recovery and all collateral is either realized or transferred to the Company the loan and related allowance are charged off.
A portion of the total allowance for loan losses is related to impaired loans. Certain homogenous loans, including residential mortgage and consumer loans, are collectively evaluated for impairment and, therefore, excluded from impaired loans unless modified in a troubled debt restructuring. A loan is considered impaired if, based on current information and events, it is probable that the Company will be unable to collect the scheduled payments of principal or interest when due according to the contractual terms of the loan agreement. Impaired loans include all nonaccrual loans as well as certain accruing loans judged to have higher risk of noncompliance with the present contractual repayment schedule for both interest and principal. Once a loan has been determined to be impaired, it is measured to establish the amount of the impairment, if any, based on the present value of expected future cash flows discounted at the loan’s effective interest rate, except that collateral-dependent loans may be measured for impairment based on the fair value of the collateral, less cost to sell. If the value of the impaired loan is less than the recorded investment in the loan, a valuation allowance is established. While impaired loans exhibit weaknesses that may inhibit repayment in compliance with the original note terms, the measurement of impairment may not always result in an allowance for loan loss for every impaired loan.
Income Recognition on Nonaccrual Loans:
Loans are placed on a nonaccrual basis for recognition of interest income when sufficient doubt exists as to the full collection of principal and interest. Generally, a loan whose principal and interest is contractually past due 90 days is placed on nonaccrual, unless the loan is adequately secured and in the process of collection. The nonrecognition of interest income on an accrual basis does not constitute forgiveness of the interest. After a loan is placed on nonaccrual status, any current period interest previously accrued but not yet collected is reversed against current income. Interest is included in income subsequent to the date the loan is placed on nonaccrual status only as interest is received and so long as management is satisfied that there is a high probability that principal will be collected in full. The loan is returned to accrual status only when the borrower has demonstrated the ability to make future payments of principal and interest as scheduled.
Premises, Leasehold Improvements and Equipment:
Premises, leasehold improvements and equipment are reported at cost less accumulated depreciation and amortization. Depreciation and amortization is charged to operating expense using the straight-line method for financial reporting purposes over a three to twenty-five year period, based upon the estimated useful lives of the assets. Leasehold improvements are amortized over the shorter of the lease term or the estimated useful life of the improvement.
Premises offered or contracted for sale are reported at the lower of cost or fair value, less cost to sell, and depreciation on such assets is ceased. A charge to expense for the abandonment of a leased facility is recorded in the period that the Company ceases to occupy the space. The charge is determined based upon the remaining lease rentals, reduced by estimated sublease rentals that could reasonably be obtained from the property. Leasehold improvements associated with abandoned facilities are charged to expense in the period in which the Company ceases to occupy the space.
Other Real Estate and Repossessed Assets:
Other real estate and repossessed assets primarily includes properties acquired through foreclosure or deed in lieu of foreclosure. At foreclosure or obtaining possession of the asset, other real estate or repossessed assets are recorded at the lower of the amount of the loan balance or the fair value, less estimated cost to sell, through a charge to the allowance for loan losses, if necessary. Generally, the fair value of the real estate at foreclosure is
88
Table of Contents
determined through the use of a current appraisal and the fair value of other repossessed assets is based upon the estimated net proceeds from the sale or disposition of the underlying collateral. Subsequent write-downs required by changes in estimated fair value or disposal expenses are recorded through a valuation allowance and a provision for losses charged to noninterest expense. Carrying costs of these properties, net of related income, and gains or losses on the sale from their disposition are also included in current operations as other noninterest expense.
Income Taxes:
Deferred tax assets and liabilities are reflected at currently enacted income tax rates applicable to the period in which the deferred tax assets or liabilities are expected to be realized or settled. As changes in tax laws or rates are enacted, deferred tax assets and liabilities are adjusted through the income tax provision in the period in which the law is enacted. Deferred tax assets are reduced by a valuation allowance, when in the opinion of management, it is more likely than not that some portion or all of the deferred tax asset will not be realized. In determining the realizability of the deferred tax assets, management evaluates both positive and negative evidence, including the existence of any cumulative losses in the current year and prior two years, the amount of taxes paid in available carry-back years, the forecasts of future income, applicable tax planning strategies, and assessments of current and future economic and business conditions.
At times, the Company applies different tax treatment for selected transactions for tax return purposes than for financial reporting purposes. The accrual for income taxes includes reserves for those differences in tax positions. The Company initially recognizes the financial statement effects (i.e. benefit) of an uncertain tax position when it is more likely than not, based on the technical merits, that the position will be sustained upon examination. Subsequently, the tax benefits of uncertain tax positions are derecognized if the Company determines the more likely than not threshold is no longer met. Reserves for uncertain tax position are reversed or utilized once the statute of limitations has expired or the tax matter is effectively settled. The Company includes any interest and penalties associated with uncertain tax positions as income tax expense on the Consolidated Statements of Operations.
Earnings Per Share:
Basic earnings per share is computed as net income applicable to common stockholders divided by the weighted-average number of common shares outstanding that are eligible to participate in the net earnings or loss for the period. Net income applicable to common stockholders represents net income or loss for the period less dividends declared or accumulated on preferred stock, including any discount accretion. Diluted earnings per share considers the dilutive effect of common stock equivalents, including stock options, warrants to purchase shares of common stock, and preferred stock that can be converted into shares of common stock. The dilutive impact of stock options and warrants are computed using the treasury stock method. The dilutive impact of convertible preferred stock is computed using the if-converted method which assumes the convertible security is converted at the beginning of the period (or issuance if later), resulting in an increase to the number of common shares outstanding but a decrease to the amount of preferred dividends that would have been included in the determination of net income applicable to common stockholders. The computation of diluted earnings per share does not assume conversion or exercise of common stock equivalents that would have an antidilutive effect on earnings per share. A reconciliation of the net income applicable to common stockholders and weighted average shares used in the basic and diluted earnings per share computation is included in Note 23—“Earnings Per Share.”
Employee Benefit Plans:
Stock-based Compensation: The Company has an incentive compensation plan that allows the issuance of nonqualified stock options and restricted stock awards to employees and directors. The Company recognizes compensation for all share-based payment awards made to employees or directors over the award’s requisite
89
Table of Contents
service period using a straight-line method. Since stock-based compensation expense recognized is based on awards ultimately expected to vest, the expense has been reduced by estimated forfeitures. Forfeitures are estimated at the time of grant and revised, if necessary, in subsequent periods, if actual forfeitures differ from those estimates.
Nonqualified Deferred Compensation Plan: The Company maintains a nonqualified deferred compensation program for certain key employees which allows participants to defer a portion of their base salaries, commissions, or incentive compensation. The amount of compensation deferred by a participant, along with any Company discretionary contributions to the plan, are held in a rabbi trust for the participant. The Company’s discretionary contributions are recorded as additional compensation expense when contributed. While the Company maintains ownership of the assets, the participants are allowed to direct the investment of the assets in several equity and fixed income mutual funds. These assets are recorded at their fair value in other assets on the Consolidated Balance Sheets. A liability is established, in accrued interest, taxes and other liabilities on the Consolidated Balance Sheets, for the fair value of the obligation to the participants. Any increase or decrease in the fair value of plan assets is recorded in other noninterest income on the Consolidated Statements of Operations. Any increase or decrease in the fair value of the deferred compensation obligation to participants is recorded as additional compensation expense or a reduction of compensation expense on the Consolidated Statements of Operations.
Derivative Financial Instruments and Hedging Activities:
The Company uses derivative financial instruments (derivatives), including interest rate exchange agreements and interest rate corridors, as well as interest rate lock and forward loan sale commitments to either accommodate individual customer borrowing needs or to assist in its own interest rate risk management. The Company’s asset and liability management and investment policies do not allow the use of derivatives for trading purposes. All derivatives are measured and reported at fair value on the Consolidated Balance Sheet as either an asset or a liability. For derivatives that are designated and qualify as a fair value hedge, the gain or loss on the derivative, as well as the offsetting loss or gain on the hedged item attributable to the hedged risk, are recognized in current earnings during the period of the change in the fair values. For derivatives that are designated and qualify as a cash flow hedge, the effective portion of the gain or loss on the derivative is reported as a component of other comprehensive income and reclassified into earnings in the same period or periods during which the hedged transaction affects earnings. For all hedging relationships, derivative gains and losses that are not effective in hedging the changes in fair value or expected cash flows of the hedged item are recognized immediately in current earnings during the period of the change in fair value of the derivative.
Similarly, the changes in the fair value of derivatives that do not qualify for hedge accounting or are not designated as an accounting hedge are also reported currently in earnings, in noninterest income.
The net cash settlements on derivatives that qualify for hedge accounting are recorded in interest income or interest expense, based on the item being hedged. The net cash settlements on derivatives that do not qualify for hedge accounting or are not designated as an accounting hedge are reported in noninterest income.
At the inception of the hedge and quarterly thereafter, a formal assessment is performed to determine whether changes in the fair values or cash flows of the derivatives have been highly effective in offsetting the changes in the fair values or cash flows of the hedged item and whether they are expected to be highly effective in the future. The Company discontinues hedge accounting prospectively when it is determined that the derivative is or will no longer be effective in offsetting changes in the fair value or cash flows of the hedged item, the derivative expires, is sold, or terminated, or management determines that designation of the derivative as a hedging instrument is no longer appropriate.
When hedge accounting is discontinued, the future gains and losses arising from any change in fair value are recorded as noninterest income. When a fair value hedge is discontinued, the hedged asset or liability is no longer
90
Table of Contents
adjusted for changes in fair value and the existing basis adjustment is amortized or accreted over the remaining life of the asset or liability. When a cash flow hedge is discontinued but the hedged cash flows or forecasted transaction is still expected to occur, gains or losses that were accumulated in other comprehensive income are amortized or accreted into earnings over the same periods in which the hedged transactions would have affected earnings.
The estimates of fair values of the Company’s derivatives are calculated using independent valuation models to estimate market-based valuations. The valuations are determined using widely accepted valuation techniques, including discounted cash flow analysis of the expected cash flow of each derivative. This analysis reflects the contractual terms of the derivative and uses observable market-based inputs, including interest rate curves and implied volatilities. In addition, the fair value estimate also incorporates a credit valuation adjustment to reflect the risk of nonperformance by both the Company and the counterparties in the fair value measurement. The resulting fair values produced by these proprietary valuation models are in part theoretical and, therefore, can vary between derivative dealers and are not necessarily reflective of the actual price at which the derivative contract could be traded. Small changes in assumptions can result in significant changes in valuation. The risks inherent in the determination of the fair value of a derivative may result in income statement volatility.
Debt Issuance Costs and Discounts:
In connection with the issuance of the Company’s junior subordinated debentures and the Bank’s subordinated notes, issuance costs were incurred, including underwriting fees, legal and professional fees, and other costs. These costs are included in other assets on the Company’s Consolidated Balance Sheets and are being amortized over the contractual life of the debt as additional interest expense using an effective interest method. In addition, the Bank’s subordinated notes were issued with detachable warrants to purchase shares of the Company’s common stock. The proceeds from the issuance of the subordinated notes were allocated to the notes and warrants based upon their relative fair values. The allocation to the warrants created a discount on the subordinated notes. This discount is being accreted as additional interest expense on the subordinated notes over the remaining contractual life of the notes using an effective interest method.
Financial Instruments:
In the ordinary course of business, the Company enters into off-balance sheet financial instruments consisting of commitments to extend credit, unused lines of credit, letters of credit, and standby letters of credit. Such financial instruments are recorded in the financial statements when they are funded, except that the fair value of standby letters of credit are recorded as a liability on the Consolidated Balance Sheets and amortized over the commitment period. In addition, the Company will establish a reserve for unfunded commitments, in accrued interest, taxes and other liabilities on the Consolidated Balance Sheets, if it is probable that a liability has been incurred by the Company under a standby letter of credit or a loan commitment that has not yet been funded.
Comprehensive Income:
Comprehensive income or loss includes net income or loss, changes in unrealized holding gains and losses on available-for-sale securities, changes in unrealized gains and losses associated with cash flow hedging instruments, and the amortization of deferred gains and losses associated with terminated cash flow hedges. The statement of comprehensive income is included within the Consolidated Statements of Changes in Stockholders’ Equity. See Note 22—“Other Comprehensive Income” for further details.
New Accounting Standards:
In January 2011, the Financial Accounting Standards Board (“FASB”) issued Accounting Standards Update (“ASU”) No. 2011-01, “Deferral of the Effective Date of Disclosures about Troubled Debt Restructurings in
91
Table of Contents
Update No. 2010-20.” Update No. 2011-01 provides for the deferral of troubled debt restructuring disclosures included in Update No. 2010-20 that were effective for periods ending on or after December 15, 2010. These disclosures will be deferred until the issuance of the current outstanding proposal that determines what constitutes a troubled debt restructuring. This accounting standard is effective immediately and will not have a material effect on our consolidated financial statements.
In July 2010, the FASB issued ASU No. 2010-20, “Disclosures about the Credit Quality of Financing Receivables and the Allowance for Credit Losses,” which provides additional guidance relating to loan loss allowance disclosures. This accounting standard is effective for interim and annual reporting periods ending on or after December 15, 2010. This disclosure did not have a material effect on our consolidated financial statements.
In March 2010, the FASB issued ASU No. 2010-11, “Derivatives and Hedging (Topic 815) Scope Exception Related to Embedded Credit Derivatives,” which provides guidance on whether embedded credit-derivative features in financial instruments issued by structures such as collateralized debt obligations (CDO’s) and synthetic CDO’s are subject to bifurcation and separate accounting. This guidance is effective for fiscal quarters beginning after June 15, 2010. The adoption of this guidance did not have a material effect on our consolidated financial statements.
In January 2010, the FASB issued ASU No. 2010-06, “Fair Value Measurements and Disclosures (Topic 820): Improving Disclosures about Fair Values,” which provides additional guidance relating to fair value measurement disclosures. Specifically, companies are required to separately disclose significant transfers into and out of Level 1 and Level 2 measurements in the fair value hierarchy and the reasons for those transfers. For Level 3 fair value measurements, the new guidance requires presentation of separate information about purchases, sales, issuances and settlements. Additionally, the FASB also clarified existing fair value measurement disclosure requirements relating to the level of disaggregation, inputs, and valuation techniques. Certain provisions of this accounting update related to detailed Level 3 disclosures will be effective at the beginning of 2011. The remainder of the provision was effective on January 1, 2010 and the adoption of these provisions did not have a material effect on our consolidated financial statements.
In December 2009, the FASB issued ASU No. 2009-16, “Transfers and Servicing (Topic 860)—Accounting for Transfers of Financial Assets.” ASU 2009-16 amends derecognition accounting and disclosure guidance, eliminates the exemption from consolidation for qualifying special-purpose entities (“QSPEs”) and also requires a transferor to evaluate all existing QSPEs to determine whether they must be consolidated. This accounting standard will be effective as of the beginning of the first annual reporting period beginning after November 15, 2009. We have adopted the accounting standard at the beginning of 2010 and the adoption did not have a material effect on our consolidated financial statements.
In June 2009, FASB issued ASU No 2009-17, “Consolidations (Topic 810)—Improvements to Financial Reporting for Enterprises involved with Variable Interest Entities,” which amends the consolidation guidance applicable to variable interest entities. The amendments to the consolidation guidance affect all entities, as well as QSPEs that are currently excluded from previous consolidation guidance. This accounting standard became effective as of the beginning of the first annual reporting period beginning after November 15, 2009. We have adopted the accounting standard at the beginning of 2010 and the adoption did not have a material effect on our consolidated financial statements.
Reclassifications:
Amounts in the prior years’ consolidated financial statements are reclassified whenever necessary to conform to the current year’s presentation.
92
Table of Contents
2. Cash and Due from Banks
The Bank is required to maintain a balance with the Federal Reserve Bank to cover reserve requirements. The average balance required to be maintained was $12.2 million for the year ended December 31, 2010 and $9.0 million for the year ended December 31, 2009.
3. Investment Securities
The amortized cost, gross unrealized gains, gross unrealized losses, and estimated fair value of investment securities at December 31, 2010 and 2009 are as follows:
| December 31, 2010 | ||||||||||||||||
| Amortized Cost |
Gross Unrealized Gains |
Gross Unrealized Losses |
Estimated Fair Value |
|||||||||||||
| (in thousands) | ||||||||||||||||
| Available-for-sale: |
||||||||||||||||
| U.S. government sponsored agency securities |
$ | 22,994 | $ | — | $ | (975 | ) | $ | 22,019 | |||||||
| Residential mortgage-backed securities |
863,353 | 2,100 | (23,067 | ) | 842,386 | |||||||||||
| Commercial mortgage-backed securities |
145,529 | 4,459 | (266 | ) | 149,722 | |||||||||||
| Collateralized mortgage obligations |
66,022 | 33 | (4,153 | ) | 61,902 | |||||||||||
| State and municipal obligations |
76,873 | 961 | (376 | ) | 77,458 | |||||||||||
| Total available-for-sale |
1,174,771 | 7,553 | (28,837 | ) | 1,153,487 | |||||||||||
| Held-to-maturity: |
||||||||||||||||
| Residential mortgage-backed securities |
100,990 | 1,760 | (999 | ) | 101,751 | |||||||||||
| Total held-to-maturity |
100,990 | 1,760 | (999 | ) | 101,751 | |||||||||||
| Total |
$ | 1,275,761 | $ | 9,313 | $ | (29,836 | ) | $ | 1,255,238 | |||||||
| December 31, 2009 | ||||||||||||||||
| Amortized Cost |
Gross Unrealized Gains |
Gross Unrealized Losses |
Estimated Fair Value |
|||||||||||||
| (in thousands) | ||||||||||||||||
| Available-for-sale: |
||||||||||||||||
| U.S. government sponsored agency securities |
$ | 44,956 | $ | 202 | $ | (64 | ) | $ | 45,094 | |||||||
| Residential mortgage-backed securities |
803,516 | 15,591 | (9,075 | ) | 810,032 | |||||||||||
| Commercial mortgage-backed securities |
159,688 | 2,249 | (544 | ) | 161,393 | |||||||||||
| Collateralized mortgage obligations |
127,641 | 4,071 | (1,614 | ) | 130,098 | |||||||||||
| State and municipal obligations |
120,716 | 1,787 | (196 | ) | 122,307 | |||||||||||
| Other debt securities |
2,220 | 127 | — | 2,347 | ||||||||||||
| Total available-for-sale |
$ | 1,258,737 | $ | 24,027 | $ | (11,493 | ) | $ | 1,271,271 | |||||||
As of December 31, 2010, the Company had $1.16 billion (estimated fair value) of mortgage related investment securities which consisted of residential and commercial mortgage-backed securities and collateralized mortgage obligations. Residential mortgage-backed securities and collateralized mortgage obligations include securities collateralized by 1-4 family residential mortgage loans, while commercial mortgage-backed securities include securities collateralized by mortgage loans on multifamily properties. Of the total mortgage related investment securities, $1.15 billion (estimated fair value), or 99.4%, were issued by government sponsored enterprises, such as Ginnie Mae, Fannie Mae, and Freddie Mac, and the remaining $6.5 million were private-label mortgage related securities. Other debt securities in 2009 included asset backed securities collateralized by student loans.
93
Table of Contents
Investment securities with an approximate book value of $969 million and $674 million at December 31, 2010 and 2009, respectively, were pledged to collateralize certain deposits, securities sold under agreements to repurchase, Federal Home Loan Bank (“FHLB”) advances, and for other purposes as required or permitted by law.
During 2010, the Company realized gross gains of $41.4 million and gross losses of $14,000 on the sale of available-for-sale investment securities. This compares to gross realized gains of $17.6 million and gross realized losses of $10,000 on the sales of available-for-sale investment securities during 2009. The Company did not have any gross realized gains or losses on the sale of investment securities during 2008.
The following table summarizes, for investment securities with unrealized losses as of December 31, 2010 and 2009, the amount of the unrealized loss and the related fair value. The securities have been further segregated by those that have been in a continuous unrealized loss position for less than twelve months and those that have been in a continuous unrealized loss position for twelve or more months.
| December 31, 2010 | ||||||||||||||||||||||||
| Length of Continuous Unrealized Loss Position | ||||||||||||||||||||||||
| Less than 12 months | 12 months or longer | Total | ||||||||||||||||||||||
| Fair Value | Unrealized Losses |
Fair Value | Unrealized Losses |
Fair Value | Unrealized Losses |
|||||||||||||||||||
| (in thousands) | ||||||||||||||||||||||||
| Available-for-sale: |
||||||||||||||||||||||||
| U.S. government sponsored agency securities |
$ | 22,019 | $ | (975 | ) | $ | — | $ | — | $ | 22,019 | $ | (975 | ) | ||||||||||
| Residential mortgage-backed securities |
723,341 | (21,330 | ) | 6,541 | (1,737 | ) | 729,882 | (23,067 | ) | |||||||||||||||
| Commercial mortgage-backed securities |
10,542 | (266 | ) | — | — | 10,542 | (266 | ) | ||||||||||||||||
| Collateralized mortgage obligations |
53,459 | (4,153 | ) | — | — | 53,459 | (4,153 | ) | ||||||||||||||||
| State and municipal obligations |
18,845 | (376 | ) | — | — | 18,845 | (376 | ) | ||||||||||||||||
| Temporarily impaired securities – Available-for-sale |
$ | 828,206 | $ | (27,100 | ) | $ | 6,541 | $ | (1,737 | ) | $ | 834,747 | $ | (28,837 | ) | |||||||||
| Held-to-maturity: |
||||||||||||||||||||||||
| Residential mortgage-backed securities |
38,591 | (999 | ) | — | — | 38,591 | (999 | ) | ||||||||||||||||
| Temporarily impaired securities – Held-to-maturity |
$ | 38,591 | $ | (999 | ) | $ | — | $ | — | $ | 38,591 | $ | (999 | ) | ||||||||||
94
Table of Contents
| December 31, 2009 | ||||||||||||||||||||||||
| Length of Continuous Unrealized Loss Position | ||||||||||||||||||||||||
| Less than 12 months | 12 months or longer | Total | ||||||||||||||||||||||
| Fair Value | Unrealized Losses |
Fair Value | Unrealized Losses |
Fair Value | Unrealized Losses |
|||||||||||||||||||
| (in thousands) | ||||||||||||||||||||||||
| Available-for-sale: |
||||||||||||||||||||||||
| U.S. government sponsored agency securities |
$ | 14,906 | $ | (64 | ) | $ | — | $ | — | $ | 14,906 | $ | (64 | ) | ||||||||||
| Residential mortgage-backed securities |
278,252 | (5,365 | ) | 6,602 | (3,710 | ) | 284,854 | (9,075 | ) | |||||||||||||||
| Commercial mortgage-backed securities |
62,802 | (544 | ) | — | — | 62,802 | (544 | ) | ||||||||||||||||
| Collateralized mortgage obligations |
26,131 | (166 | ) | 8,475 | (1,448 | ) | 34,606 | (1,614 | ) | |||||||||||||||
| State and municipal obligations |
14,521 | (117 | ) | 930 | (79 | ) | 15,451 | (196 | ) | |||||||||||||||
| Temporarily impaired securities – Available-for-sale |
$ | 396,612 | $ | (6,256 | ) | $ | 16,007 | $ | (5,237 | ) | $ | 412,619 | $ | (11,493 | ) | |||||||||
At December 31, 2010, the Company had three securities in its investment portfolio that have been in an unrealized loss position for twelve or more months and had a total unrealized loss of $1.7 million. The three securities were from the Company’s portfolio of private-label residential mortgage-backed securities.
Of the three private-label residential mortgage related securities, one was in an unrealized loss position of less than 5% of amortized cost. As part of its normal process, the Company reviewed the security, considering the severity and duration of the loss and current credit ratings, and believes that the decline in fair value was not credit related but related to changes in interest rates and current illiquidity in the market for these types of securities. The other two private-label residential mortgage related securities had a total unrealized loss of $1.6 million, and were subject to further review for other-than-temporary impairment.
For any securities that have been in an unrealized loss position that was greater than 10% and for more than 12 months, additional testing is performed to evaluate other-than-temporary impairment. For the two private-label residential mortgage-backed securities, the Company obtained fair value estimates from an independent source and performed a cash flow analysis, considering default rates, loss severities based upon the location of the collateral and estimated prepayments. Each of the private-label mortgage related securities had credit enhancements in the form of different investment tranches which impact how cash flows are distributed. The higher level tranches will receive cash flows first and as a result, the lower level tranches will absorb the losses, if any, from collateral shortfalls. The Company purchased the private-label securities that were either of the highest or one of the highest investment grades, as rated by nationally recognized credit rating agencies. The cash flow analysis takes into account the Company’s tranche and the current level of support provided by the lower tranches. The Company believes that market illiquidity has impacted the values of these private-label securities because of the lack of active trading. Neither of these securities contain subprime mortgage loans, but do include Alt-A loans, adjustable rate mortgages with initial interest only periods, and loans that are secured by collateral in geographic areas adversely impacted by the housing downturn. If this analysis shows that the Company does not expect to recover its entire investment, an other-than-temporary impairment charge would be recorded for the amount of the credit loss. During the fourth quarter of 2008, the Company had recognized an other-than-temporary impairment loss on one of these two securities. The independent cash flow analysis performed at December 31, 2010 indicated that there was no additional credit loss on this security. For the other private-label security reviewed, the independent cash flow analysis showed that the Company expects to recover its entire investment and, therefore, the decline in fair value was not due to credit, but was most likely caused by illiquidity in the market, and no other-than-temporary impairment charge was recorded.
95
Table of Contents
The other-than-temporary impairment charge that the Company recorded in 2008 was adjusted effective April 1, 2009, when the Company adopted a new accounting standard, subsequently codified into ASC “Investments-Debt and Equity Securities (Topic 320),” which amended existing accounting guidance on investments in debt and equity securities by modifying the requirements for recognizing other-than-temporary impairment and changes the model used to determine the amount of impairment. Under this guidance, declines in fair value of investment securities below their amortized cost basis that are deemed to be other-than-temporary are reflected in earnings as a realized loss to the extent the impairment is related to credit loss. The amount of impairment related to other factors is recognized in other comprehensive income. Upon adoption, the Company recorded the cumulative effect of initial application as an adjustment to the opening balance of retained earnings with a corresponding adjustment to accumulated other comprehensive income for one private label mortgage-related security for which other-then temporary impairment was recognized in 2008 through earnings. The amount of the anticipated credit loss on this investment security was $488,000 upon adoption and no additional credit loss has been recorded as of December 31, 2010. The effect of the adoption as of April 1, 2009 is presented in the table below.
| Before Adoption |
Adjustments | After Adoption |
||||||||||
| (in thousands) | ||||||||||||
| Investment securities available-for-sale, at amortized cost |
$ | 1,292,180 | $ | 1,710 | $ | 1,293,890 | ||||||
| Unrealized gains (losses) on securities |
29,400 | (1,710 | ) | 27,690 | ||||||||
| Investment securities available-for-sale, at fair value |
1,321,580 | — | 1,321,580 | |||||||||
| Other assets |
74,475 | 677 | 75,152 | |||||||||
| Total assets |
4,596,701 | 677 | 4,597,378 | |||||||||
| Accumulated deficit |
(74,974 | ) | 1,710 | (73,264 | ) | |||||||
| Accumulated other comprehensive income, net |
27,888 | (1,033 | ) | 26,855 | ||||||||
| Total stockholders’ equity |
311,425 | 677 | 312,102 | |||||||||
The following table shows the contractual maturities of debt securities, categorized by amortized cost and estimated fair value, at December 31, 2010.
| Amortized Cost |
Estimated Fair Value |
|||||||
| (in thousands) | ||||||||
| Available-for-sale: |
||||||||
| Due in one year or less |
$ | 820 | $ | 821 | ||||
| Due after one year through five years |
1,818 | 1,827 | ||||||
| Due after five years through ten years |
40,154 | 40,182 | ||||||
| Due after ten years |
57,075 | 56,647 | ||||||
| Residential mortgage-backed securities |
863,353 | 842,386 | ||||||
| Commercial mortgage-backed securities |
145,529 | 149,722 | ||||||
| Collateralized mortgage obligations |
66,022 | 61,902 | ||||||
| Total available-for-sale |
1,174,771 | 1,153,487 | ||||||
| Held-to-maturity: |
||||||||
| Residential mortgage-backed securities |
100,990 | 101,751 | ||||||
| Total held-to-maturity |
100,990 | 101,571 | ||||||
| Total investment |
$ | 1,275,761 | $ | 1,255,238 | ||||
Investment securities do not include the Bank’s investment in Federal Home Loan Bank of Chicago (“FHLBC”) and Federal Reserve Bank (“FRB”) stock of $40.0 million and $31.2 million at December 31, 2010 and 2009, respectively. These investments are required for membership and are carried at cost.
96
Table of Contents
The Bank must maintain a specified level of investment in FHLBC stock based upon the amount of outstanding FHLB borrowings. At December 31, 2010, the Company had a $29.5 million investment in FHLBC stock, compared to $22.3 million at December 31, 2009. Since 2007, the FHLBC has been under a cease and desist order with its regulators that requires prior regulatory approval to declare dividends and to redeem member capital stock other than excess capital stock under limited circumstances. The stock of the FHLBC is viewed as a long-term asset and its value is based upon the ultimate recoverability of the par value. In determining the recoverability of this investment, the Company considers factors such as the severity and duration of declines in the market value of its net assets relative to its capital, its recent operating performance, its commitment to make required payments and the structure of the FHLB system which enables the regulator of the FHLBs to reallocate debt among the FHLB entities, the impact of legislative and regulatory changes on the FHLBC and its operations, and its ability to continue to provide liquidity and funding to its members.
As of December 31, 2010, after evaluating these factors and considering that transactions in FHLBC stock continued to be made at par value during 2010 and the FHLBC paid a nominal dividend in February 2011, the Company believes that it will ultimately recover the par value of the FHLBC stock.
4. Loans
Loans segregated by class at December 31, 2010 and 2009 are as follows:
| 2010 | 2009 | |||||||
| (in thousands) | ||||||||
| Portfolio Loans: |
||||||||
| Commercial and industrial |
$ | 1,351,862 | $ | 1,264,369 | ||||
| Commercial real estate secured |
1,120,361 | 1,171,777 | ||||||
| Residential construction and land |
104,036 | 221,859 | ||||||
| Commercial construction and land |
106,423 | 142,584 | ||||||
| Consumer |
152,657 | 152,892 | ||||||
| Gross loans |
2,835,339 | 2,953,481 | ||||||
| Less: Unearned discount |
(1 | ) | (6 | ) | ||||
| Total loans |
2,835,338 | 2,953,475 | ||||||
| Less: Allowance for loan losses |
(124,568 | ) | (106,185 | ) | ||||
| Loans, net |
$ | 2,710,770 | $ | 2,847,290 | ||||
| Loans Held for Sale |
$ | 259,020 | $ | 81,853 | ||||
The total amount of loans transferred to third parties as loan participations at December 31, 2010 was $293.1 million, all of which has been derecognized as a sale under the applicable accounting guidance in effect at the time of the transfer. The Company continues to have involvement with these loans through relationship management and its servicing responsibilities.
At December 31, 2010, loans held for sale included $259.0 million of residential mortgage loans originated by Cole Taylor Mortgage, the Company’s residential mortgage origination unit. The Company has elected to account for these loans under the fair value option in accordance with ASC 825—Financial Instruments. The unpaid principal balance associated with these loans was $256.0 million at December 31, 2010. An unrealized gain on these loans of $3.0 million was included in mortgage origination revenues in noninterest income on the Consolidated Statements of Operations at December 31, 2010. None of these loans are 90 days or more past due or on a nonaccrual status. Interest income on these loans is included in net interest income and is not considered part of the change in fair value.
Nonperforming loans include nonaccrual loans and interest-accruing loans contractually past due 90 days or more. Loans are placed on a nonaccrual basis for recognition of interest income when sufficient doubt exists as to
97
Table of Contents
the full collection of principal and interest. Generally, loans are to be placed on nonaccrual when principal and interest is contractually past due 90 days, unless the loan is adequately secured and in the process of collection.
The following table presents the aging of loans by class as of December 31, 2010:
| 30-59 Days Past Due |
60-89 Days Past Due |
Greater Than 90 Days Past Due |
Total Past Due |
Loans Not Past Due |
Total | |||||||||||||||||||
| Commercial and industrial |
$ | 782 | $ | 278 | $ | 71,438 | $ | 72,498 | $ | 1,279,364 | $ | 1,351,862 | ||||||||||||
| Commercial real estate secured |
4,242 | 1,010 | 42,221 | 47,473 | 1,072,888 | 1,120,361 | ||||||||||||||||||
| Residential construction and land |
— | — | 20,660 | 20,660 | 83,376 | 104,036 | ||||||||||||||||||
| Commercial construction and land |
— | — | 12,734 | 12,734 | 93,689 | 106,423 | ||||||||||||||||||
| Consumer |
3,476 | 2,160 | 12,687 | 18,323 | 393,353 | 411,676 | ||||||||||||||||||
| Total loans |
$ | 8,500 | $ | 3,448 | $ | 159,740 | $ | 171,688 | $ | 2,922,670 | $ | 3,094,358 | ||||||||||||
The Company categorizes loans into risk categories based on relevant information about the ability of borrowers to service their debt such as: current financial information, historical payment experience, credit documentation, public information and current economic trends, among other factors. The Company uses the following definitions for risk ratings:
Pass. Loans in this category range from loans that are virtually risk free to those with borderline risk where the borrower has unstable operating history containing losses or adverse trends have weakened its financial condition that have not currently impacted repayment ability but may in the future if not corrected.
Special Mention. Loans in this category have potential weaknesses which currently weaken the asset or inadequately protect the Bank’s credit position and if not immediately corrected will diminish repayment
Substandard. Loans in this category have deteriorating financial condition and exhibit a number of well-defined weaknesses which currently inhibits normal repayment through normal operations. These loans require constant monitoring and supervision by Bank management.
Nonaccrual. Loans in this category exhibit the same weaknesses as Potential Problem however, the situation is more pronounced and are no longer accruing interest.
| Commercial and Industrial |
CRE Secured | Residential Construction and Land |
Commercial Construction and Land |
Consumer | Total | |||||||||||||||||||
| Pass |
$ | 1,241,720 | $ | 988,072 | $ | 76,897 | $ | 72,070 | $ | 399,044 | $ | 2,777,803 | ||||||||||||
| Special Mention |
18,461 | 40,235 | 2,948 | 20,107 | — | 81,751 | ||||||||||||||||||
| Substandard |
20,243 | 49,833 | 3,531 | 1,512 | — | 75,119 | ||||||||||||||||||
| Nonaccrual |
71,438 | 42,221 | 20,660 | 12,734 | 12,632 | 159,685 | ||||||||||||||||||
| Total Loans |
$ | 1,351,862 | $ | 1,120,361 | $ | 104,036 | $ | 106,423 | $ | 411,676 | $ | 3,094,358 | ||||||||||||
98
Table of Contents
The following table sets forth the amounts of nonperforming loans at December 31, 2010 2009, and 2008 and the related interest on nonaccrual loans for the years then ended:
| 2010 | 2009 | 2008 | ||||||||||
| (in thousands) | ||||||||||||
| Recorded balance of loans contractually past due 90 days or more but still accruing interest, at end of year |
$ | 55 | $ | 59 | $ | 153 | ||||||
| Recorded balance of nonaccrual loans, at end of year |
159,685 | 141,403 | 200,227 | |||||||||
| Total nonperforming loans |
$ | 159,740 | $ | 141,462 | $ | 200,380 | ||||||
| Performing restructured loans |
$ | 29,786 | $ | 1,196 | $ | — | ||||||
| Interest on nonaccrual loans recognized in income |
4,992 | 2,984 | 8,086 | |||||||||
| Interest on nonaccrual loans which would have been recognized under the original terms of the loans |
15,194 | 16,850 | 19,285 | |||||||||
Impaired loans include all nonaccrual loans as well as certain accruing loans judged to have higher risk of noncompliance with the present contractual repayment schedule for both interest and principal. Once a loan has been determined to be impaired, it is measured to establish the amount of the impairment based on the present value of expected future cash flows discounted at the loan’s effective interest rate, except that collateral-dependent loans may be measured for impairment based on the fair value of the collateral, less estimated cost to sell. If the measure of the impaired loan is less than the recorded investment in the loan, a valuation allowance is established. While impaired loans exhibit weaknesses that may inhibit repayment in compliance with the original note terms, the measurement of impairment may not always result in an allowance for loan loss for every impaired loan. The Company had $5.4 million of letters of credit outstanding related to nonaccrual and impaired loans as of December 31, 2010. At December 31, 2010, the Company had $29.8 million of loans classified as performing restructured loans which included commercial loans of $28.3 million and consumer loans of $1.5 million. As of December 31, 2010, there are no additional commitments to lend on loans that have been restructured in a troubled debt restructuring.
Information about the Company’s impaired loans at or for the years ended December 31, 2010, 2009, and 2008 is as follows:
| 2010 | 2009 | 2008 | ||||||||||
| (in thousands) | ||||||||||||
| Recorded balance of impaired loans, at end of year: |
||||||||||||
| With related allowance for loan loss |
$ | 136,404 | $ | 95,936 | $ | 120,973 | ||||||
| With no related allowance for loan loss |
44,677 | 45,761 | 85,732 | |||||||||
| Total recorded balance of impaired loans |
$ | 181,081 | $ | 141,697 | $ | 206,705 | ||||||
| Allowance for loan losses related to impaired loans, at end of year |
$ | 59,857 | $ | 33,640 | $ | 41,451 | ||||||
| Average balance of impaired loans for the year |
151,370 | 180,166 | 161,654 | |||||||||
| Interest income recognized on impaired loans for the year |
1,881 | 600 | 1,758 | |||||||||
99
Table of Contents
The following table presents loans individually evaluated for impairment by class of loans as of December 31, 2010:
| Unpaid Principal Balance |
Recorded Balance |
Allowance for Loan Losses Allocated |
YTD Average Balance |
|||||||||||||
| (in thousands) | ||||||||||||||||
| With no related allowance recorded: |
||||||||||||||||
| Commercial and industrial |
$ | 28,807 | $ | 12,841 | $ | — | $ | 10,128 | ||||||||
| Commercial real estate secured |
37,914 | 22,848 | — | 10,026 | ||||||||||||
| Residential construction and land |
36,913 | 7,466 | — | 16,371 | ||||||||||||
| Commercial construction and land |
— | — | — | 2,475 | ||||||||||||
| Consumer |
1,522 | 1,522 | — | 1,304 | ||||||||||||
| With an allowance recorded: |
||||||||||||||||
| Commercial and industrial |
70,725 | 65,963 | 35,258 | 28,298 | ||||||||||||
| Commercial real estate secured |
48,897 | 40,983 | 10,940 | 45,602 | ||||||||||||
| Residential construction and land |
16,768 | 16,724 | 5,189 | 27,988 | ||||||||||||
| Commercial construction and land |
13,950 | 12,734 | 8,470 | 9,178 | ||||||||||||
| Consumer |
— | — | — | — | ||||||||||||
| Total impaired loans |
$ | 255,496 | $ | 181,081 | $ | 59,857 | $ | 151,370 | ||||||||
The Company provides several types of loans to its customers, including residential, construction, commercial, and consumer loans. Lending activities are conducted with customers in a wide variety of industries as well as with individuals with a wide variety of credit requirements. The Company does not have a concentration of loans in any specific industry. Credit risks tend to be geographically concentrated in that the majority of the Company’s customer base lies within the Chicago area. Furthermore, 52% of the Company’s loan portfolio involves loans that are to some degree secured by real estate properties located primarily within the Chicago area as of December 31, 2010, compared to 57% as of December 31, 2009.
Activity in the allowance for loan losses for the years ended December 31, 2010, 2009, and 2008 consisted of the following:
| 2010 | 2009 | 2008 | ||||||||||
| (in thousands) | ||||||||||||
| Allowance for loan losses: |
||||||||||||
| Allowance at beginning of year |
$ | 106,185 | $ | 128,548 | $ | 54,681 | ||||||
| Provision for loan losses |
143,127 | 89,611 | 144,158 | |||||||||
| Loans charged-off |
(128,895 | ) | (116,160 | ) | (72,471 | ) | ||||||
| Recoveries of loans previously charged-off |
4,151 | 4,186 | 2,180 | |||||||||
| Net charge-offs |
(124,744 | ) | (111,974 | ) | (70,291 | ) | ||||||
| Allowance at end of year |
$ | 124,568 | $ | 106,185 | $ | 128,548 | ||||||
100
Table of Contents
The following table presents the balance in the allowance for loan losses and the recorded investment in loans by class and based on impairment method as of December 31, 2010:
| Commercial & Industrial |
Commercial Real Estate Secured |
Residential Construction & Land |
Commercial Construction & Land |
Consumer | Total | |||||||||||||||||||
| ALLOWANCE FOR CREDIT LOSSES: |
||||||||||||||||||||||||
| Beginning balance |
$ | 37,995 | $ | 21,190 | $ | 40,193 | $ | 2,040 | $ | 4,767 | $ | 106,185 | ||||||||||||
| Provision |
46,489 | 48,798 | 33,343 | 10,615 | 3,882 | 143,127 | ||||||||||||||||||
| Charge-offs |
(24,765 | ) | (38,854 | ) | (59,355 | ) | (1,284 | ) | (4,637 | ) | (128,895 | ) | ||||||||||||
| Recoveries |
1,780 | 287 | 1,065 | 51 | 968 | 4,151 | ||||||||||||||||||
| Ending balance |
61,499 | 31,421 | 15,246 | 11,422 | 4,980 | 124,568 | ||||||||||||||||||
| Ending balance individually evaluated for impairment |
34,806 | 10,669 | 4,855 | 8,437 | — | 58,767 | ||||||||||||||||||
| Ending balance collectively evaluated for impairment |
26,693 | 20,752 | 10,391 | 2,985 | 4,980 | 65,801 | ||||||||||||||||||
| Ending balance loans acquired with deteriorated credit quality |
— | — | — | — | — | — | ||||||||||||||||||
| LOANS: |
||||||||||||||||||||||||
| Ending balance individually evaluated for impairment |
78,804 | 63,831 | 24,190 | 12,734 | — | 179,559 | ||||||||||||||||||
| Ending balance collectively evaluated for impairment |
— | — | — | — | 1,522 | 1,522 | ||||||||||||||||||
| Ending balance |
$ | 78,804 | $ | 63,831 | $ | 24,190 | $ | 12,734 | $ | 1,522 | $ | 181,081 | ||||||||||||
101
Table of Contents
As of December 31, 2010 and 2009, the Company had extended loans to directors and executive officers of the Bank, the Company and their related interests as detailed in the table below:
| 2010 | 2009 | |||||||
| (in thousands) | ||||||||
| Beginning balance |
$ | 20,062 | $ | 63,809 | ||||
| New loans and advances |
36,961 | 2,788 | ||||||
| Payments |
(3,279 | ) | (5,304 | ) | ||||
| Adjustment for changes in officers |
(97 | ) | (41,231 | ) | ||||
| Loans, net |
$ | 53,647 | $ | 20,062 | ||||
In the opinion of management, these loans were made in the normal course of business and on substantially the same terms for comparable transactions with other borrowers and do not involve more than a normal risk of collectability.
5. Premises, Leasehold Improvements and Equipment
Premises, leasehold improvements and equipment at December 31, 2010 and 2009 are summarized as follows:
| 2010 | 2009 | |||||||
| (in thousands) | ||||||||
| Land and improvements |
$ | 1,115 | $ | 1,094 | ||||
| Buildings and improvements |
9,447 | 8,276 | ||||||
| Leasehold improvements |
7,349 | 7,206 | ||||||
| Furniture, fixtures and equipment |
22,307 | 20,958 | ||||||
| Total cost |
40,218 | 37,534 | ||||||
| Less accumulated depreciation and amortization |
(24,328 | ) | (22,019 | ) | ||||
| Net book value |
$ | 15,890 | $ | 15,515 | ||||
6. Other Real Estate and Repossessed Assets
A rollforward of other real estate and repossessed assets, for the periods indicated is as follows:
| For the Period Ended December 31, | ||||||||||||
| 2010 | 2009 | 2008 | ||||||||||
| (in thousands) | ||||||||||||
| Balance at beginning of period |
$ | 26,231 | $ | 13,179 | $ | 2,606 | ||||||
| Transfers from loans |
34,725 | 29,076 | 14,478 | |||||||||
| Additional investment in foreclosed properties |
— | 342 | 1,625 | |||||||||
| Dispositions |
(15,957 | ) | (14,310 | ) | (4,673 | ) | ||||||
| Additional impairment |
(13,509 | ) | (2,056 | ) | (857 | ) | ||||||
| Balance at end of period |
$ | 31,490 | $ | 26,231 | $ | 13,179 | ||||||
The Company maintained a valuation allowance for losses on other real estate and repossessed assets of $12.5 million, $2.8 million and $711,000 at December 31, 2010, 2009 and 2008, respectively.
102
Table of Contents
7. Interest-Bearing Deposits
Interest-bearing deposits at December 31, 2010 and 2009 are summarized as follows:
| 2010 | 2009 | |||||||
| (in thousands) | ||||||||
| NOW accounts |
$ | 248,662 | $ | 307,025 | ||||
| Savings accounts |
37,992 | 41,479 | ||||||
| Money market deposits |
589,197 | 445,418 | ||||||
| Time deposits: |
||||||||
| Certificates of deposit |
715,030 | 775,663 | ||||||
| Out-of-local-market certificates of deposit |
99,313 | 79,015 | ||||||
| CDARS time deposits |
182,879 | 116,256 | ||||||
| Brokered certificates of deposit |
449,836 | 484,035 | ||||||
| Public time deposits |
70,697 | 68,763 | ||||||
| Total time deposits |
1,517,755 | 1,523,732 | ||||||
| Total |
$ | 2,393,606 | $ | 2,317,654 | ||||
At December 31, 2010, time deposits in the amount of $100,000 or more totaled $645.4 million compared to $539.1 million at December 31, 2009. Interest expense on time deposits with balances of $100,000 or more was $7.3 million for the year ended December 31, 2010, $10.6 million for the year ended December 31, 2009, and $13.2 million for the year ended December 31, 2008.
The Bank participates in the Certificate of Deposit Account Registry Service network (“CDARS”), which allows the Bank to accommodate depositors with large cash balances who are seeking the full deposit insurance protection by placing these funds in CDs issued by other banks in the network. Through a matching system, the Bank will receive funds back for CDs that it issues for other banks in the network, thus allowing the Bank to retain the full amount of the original deposit.
Brokered CDs are carried net of mark to market adjustments when they are the hedged item in a fair value hedging relationship and of the related broker placement fees of $1.6 million and $1.4 million at December 31, 2010 and 2009, respectively, which are amortized to the maturity date of the related brokered CDs. The amortization is included in deposit interest expense. As of December 31, 2010, the Company did not have any brokered CDs that could be called before maturity. In 2009, certain brokered CDs had an option that allowed the Company to call the CD before its stated maturity. The Company exercised this option when the prevailing interest rate on the CD was substantially higher than current market interest rates. When a brokered CD is called, any unamortized broker placement fee and fair value adjustments are written off and included in noninterest expense on the Consolidated Statements of Operations. During 2010, the Company did not incur any expense associated with brokered CDs that were called before their stated maturity as there were no brokered CDs that had an option to call the CD before its stated maturity. In comparison, during 2009, the Company incurred $527,000 of expense associated with $29.0 million of brokered CDs that were called before their stated maturity.
At December 31, 2010, the scheduled maturities of total time deposits are as follows:
| Year |
Amount | |||
| (in thousands) | ||||
| 2011 |
$ | 1,015,436 | ||
| 2012 |
328,936 | |||
| 2013 |
95,503 | |||
| 2014 |
15,260 | |||
| 2015 |
43,060 | |||
| Thereafter |
19,560 | |||
| Total |
$ | 1,517,755 | ||
103
Table of Contents
8. Other Borrowings
Other borrowings at December 31, 2010 and 2009 are summarized as follows:
| 2010 | 2009 | |||||||||||||||
| Amount Borrowed |
Weighted Average Rate |
Amount Borrowed |
Weighted Average Rate |
|||||||||||||
| (dollars in thousands) | ||||||||||||||||
| Securities sold under agreements to repurchase: |
||||||||||||||||
| Overnight |
$ | 39,249 | 0.14 | % | $ | 45,453 | 0.16 | % | ||||||||
| Term |
336,336 | 1.80 | 200,000 | 4.05 | ||||||||||||
| Federal funds purchased |
132,561 | 0.51 | 89,384 | 0.35 | ||||||||||||
| U.S. Treasury tax and loan note option |
2,862 | 0.00 | 2,832 | 0.00 | ||||||||||||
| Total |
$ | 511,008 | 1.33 | % | $ | 337,669 | 2.52 | % | ||||||||
As of December 31, 2010 and 2009, the term repurchase agreements consisted of the following:
| 2010 | 2009 | |||||||
| (in thousands) | ||||||||
| Term Repurchase Agreements: |
||||||||
| Repurchase agreement – rate 4.08%, matured September 13, 2010, |
$ | — | $ | 40,000 | ||||
| Repurchase agreement – rate 4.02%, due October 11, 2010, called on July 16, 2010 |
— | 40,000 | ||||||
| Repurchase agreement – rate 0.39%, matured January 3, 2011, non-callable |
52,471 | — | ||||||
| Repurchase agreement – rate 0.41%, matured January 3, 2011, non-callable |
48,575 | — | ||||||
| Repurchase agreement – rate 0.35%, matured January 5, 2011, non-callable |
50,290 | — | ||||||
| Structured repurchase agreement – rate 0.60%, due June 1, 2011, non-callable |
30,000 | — | ||||||
| Structured repurchase agreement – rate 1.29%, due January 26, 2012, non-callable |
10,000 | — | ||||||
| Structured repurchase agreement – rate 1.24%, due March 2, 2012, non-callable |
25,000 | — | ||||||
| Structured repurchase agreement – rate 3.20%, due December 13, 2012, callable after March 13, 2008 |
20,000 | 20,000 | ||||||
| Structured repurchase agreement – rate 4.41%, due August 31, 2012, callable after August 31, 2009 |
40,000 | 40,000 | ||||||
| Structured repurchase agreement – rate 4.31%, due September 27, 2012, callable after September 27, 2009 |
40,000 | 40,000 | ||||||
| Structured repurchase agreement – rate 3.70%, due December 13, 2012, callable after December 13, 2009 |
20,000 | 20,000 | ||||||
| Total term repurchase agreements |
$ | 336,336 | $ | 200,000 | ||||
Under the terms of the securities sold under agreements to repurchase, if the market value of the pledged securities declines below the repurchase liability, the Bank may be required to provide additional collateral to the counterparty. For overnight repurchase agreements, the Bank maintains control of the pledged securities. However, for the term repurchase agreements, the pledged securities are held by the counterparty. During 2010, the Company incurred $378,000 of loss on early extinguishment of debt recorded in noninterest expense to prepay a repurchase agreement. A second repurchase agreement was paid at maturity. At December 31, 2010, $120.0 million of term repurchase agreements were eligible to be called.
104
Table of Contents
Information concerning securities sold under agreements to repurchase, including both the overnight and term agreements, for the years ended December 31, 2010, 2009 and 2008 is summarized as follows:
| 2010 | 2009 | 2008 | ||||||||||
| (dollars in thousands) | ||||||||||||
| Daily average balance during the year |
$ | 387,693 | $ | 237,360 | $ | 281,567 | ||||||
| Daily average rate during the year |
2.09 | % | 3.47 | % | 3.24 | % | ||||||
| Maximum amount outstanding at any month end |
$ | 443,766 | $ | 261,707 | $ | 313,896 | ||||||
| Weighted average interest rate at year end |
1.63 | % | 3.33 | % | 3.69 | % | ||||||
Under the treasury tax and loan note option, the Bank is authorized to accept U.S. Treasury Department deposits of excess funds along with the deposits of customer taxes. These liabilities bear interest at a rate of 0.25% below the average federal funds rate (0.00% at December 31, 2010) and are collateralized by a pledge of various investment securities.
At December 31, 2010, subject to available collateral, the Bank had total pre-approved overnight federal funds borrowings and repurchase agreement lines of $119 million and $930 million, respectively. At December 31, 2009, subject to available collateral, the Bank had total pre-approved overnight federal funds borrowings and repurchase agreement lines of $130 million and $830 million, respectively.
9. Income Taxes
The components of the income tax expense (benefit) for the years ended December 31, 2010, 2009 and 2008 are as follows:
| 2010 | 2009 | 2008 | ||||||||||
| (in thousands) | ||||||||||||
| Current tax expense (benefit): |
||||||||||||
| Federal |
$ | 989 | $ | (4,547 | ) | $ | (16,143 | ) | ||||
| State |
228 | 384 | (291 | ) | ||||||||
| Total |
1,217 | (4,163 | ) | (16,434 | ) | |||||||
| Deferred tax expense (benefit): |
||||||||||||
| Federal |
(18,384 | ) | (5,904 | ) | (28,752 | ) | ||||||
| State |
(3,680 | ) | (1,861 | ) | (9,423 | ) | ||||||
| Change in valuation allowance |
22,064 | 12,762 | 46,397 | |||||||||
| Total |
— | 4,997 | 8,222 | |||||||||
| Applicable income tax expense (benefit) |
$ | 1,217 | $ | 834 | $ | (8,212 | ) | |||||
105
Table of Contents
Income tax expense (benefit) is different from the amounts computed by applying the federal statutory rate of 35% for the years ended December 31, 2010, 2009, and 2008 to loss before income taxes because of the following:
| 2010 | 2009 | 2008 | ||||||||||
| (in thousands) | ||||||||||||
| Federal income tax benefit at statutory rate |
$ | (18,412 | ) | $ | (10,751 | ) | $ | (46,459 | ) | |||
| Increase (decrease) in taxes resulting from: |
||||||||||||
| Increase in valuation allowance |
22,064 | 12,762 | 46,397 | |||||||||
| State tax benefit before valuation allowance |
(2,379 | ) | (960 | ) | (6,398 | ) | ||||||
| Tax-exempt interest income, net of disallowed interest deduction |
(1,549 | ) | (1,764 | ) | (1,804 | ) | ||||||
| Residual tax effect of change in beginning of year valuation allowance previously allocated to other comprehensive income |
1,255 | 2,539 | — | |||||||||
| Adjustment to prior year alternative minimum tax liability |
— | (1,034 | ) | — | ||||||||
| Other, net |
238 | 42 | 52 | |||||||||
| Total |
$ | 1,217 | $ | 834 | $ | (8,212 | ) | |||||
The Company was not able to record an income tax benefit during 2010 related to the pre-tax loss because any current income tax benefit that would normally result from a pre-tax loss is offset by additional deferred tax expense due to an increase in the required valuation allowance as further discussed below. During 2010, the Company recorded income tax expense of $1.2 million. The expense in 2010 included the release of the residual tax effects of changes in the beginning of the year valuation allowance previously allocated to other comprehensive income. These residual tax effects resulted from changes in the deferred tax liability associated with deferred gains on terminated cash flow hedges recorded in other comprehensive income. The Company expects additional expense of $500,000 during 2011 associated with the release of these residual tax effects.
At December 31, 2010, the Company maintained a valuation allowance against its net deferred tax asset of $92.7 million, compared to $62.1 million at December 31, 2009. Under generally accepted accounting principles, a valuation allowance is required to be recognized if it is “more likely than not” that a deferred tax asset will not be realized. The determination of the realizability of the deferred tax assets is highly subjective and dependent upon judgment concerning management’s evaluation of both positive and negative evidence, the forecasts of future income, applicable tax planning strategies, and assessments of current and future economic and business conditions. Positive evidence includes the existence of taxes paid in available carry-back years as well as the probability that taxable income will be generated in future periods, while negative evidence includes the cumulative losses in the current year and prior two years, no recoverable taxes available from the carry-back years, and general business and economic trends. The increase in the required valuation allowance was largely due to an increase in the Company’s net deferred tax assets, increased by changes in the beginning of the year valuation allowance solely attributable to identifiable events recorded in other comprehensive income, primarily changes in unrealized gains on the available-for-sale investment portfolio, the tax effects of which were therefore allocated to other comprehensive income. Management is required to re-evaluate the deferred tax asset and the related valuation allowance quarterly.
The net recorded deferred tax asset, after valuation allowance, at December 31, 2010 was $11.6 million. The remaining deferred tax asset was supported by available tax planning strategies. The deferred tax asset is also net of deferred tax liabilities associated with net unrealized losses on available for sale investment securities and hedging activities recorded in other comprehensive income.
106
Table of Contents
The tax effects of temporary differences that give rise to significant portions of the deferred tax assets and deferred tax liabilities at December 31, 2010 and 2009 are presented below:
| 2010 | 2009 | |||||||
| (in thousands) | ||||||||
| Deferred Tax Assets: |
||||||||
| Loans, principally due to allowance for loan losses |
$ | 51,788 | $ | 43,740 | ||||
| Federal net operating loss and tax credit carry forwards |
19,247 | 9,883 | ||||||
| Other real estate owned and repossessed assets |
10,444 | 6,432 | ||||||
| Deferred income, principally net loan origination fees |
5,136 | 4,940 | ||||||
| State taxes net operating loss carry forwards, net |
4,582 | 3,552 | ||||||
| Employee benefits |
3,914 | 3,425 | ||||||
| Deferred rent |
1,188 | 1,456 | ||||||
| Premises, leasehold improvements and equipment, principally due to differences in depreciation |
1,184 | 912 | ||||||
| Interest expense |
54 | |||||||
| Other |
533 | 515 | ||||||
| Tax effect of other comprehensive income |
8,933 | — | ||||||
| Gross deferred tax assets |
107,003 | 74,855 | ||||||
| Less: Valuation allowance |
(92,742 | ) | (62,076 | ) | ||||
| Net deferred tax assets |
14,261 | 12,779 | ||||||
| Deferred Tax Liabilities: |
||||||||
| Mark to market on loans transferred to portfolio |
(573 | ) | — | |||||
| FHLB stock dividends |
(790 | ) | (645 | ) | ||||
| Brokered CD swaps |
— | (126 | ) | |||||
| Discount accretion |
(170 | ) | (157 | ) | ||||
| Other |
(1,122 | ) | (578 | ) | ||||
| Tax effect of other comprehensive income |
— | (6,720 | ) | |||||
| Gross deferred tax liabilities |
(2,655 | ) | (8,226 | ) | ||||
| Net deferred tax assets |
$ | 11,606 | $ | 4,553 | ||||
At December 31, 2010, the Company had $95.1 million of state operating loss carry forwards that will begin to expire in 2020. In addition, the Company had a federal operating loss carry forward of $48.5 million that will begin to expire in 2029, a federal tax credit carry forward of $897,000 that will begin to expire in 2029 and a $1.4 million alternative minimum tax credit carry forward that can be carried forward indefinitely.
As of December 31, 2010 and 2009, the Company maintained a reserve for unrecognized tax positions of $90,000 and $98,000, respectively.
The Company is no longer subject to examination by federal tax authorities for the years 2004 and prior because the statute of limitations has expired. The Company, which is located and primarily does business in Illinois, is no longer subject to examination by the Illinois taxing authorities for the years 2004 and prior, as well as 2006.
107
Table of Contents
10. Notes Payable and Other Advances
Notes payable and other advances at December 31, 2010 and 2009 consisted of the following:
| 2010 | 2009 | |||||||
| (in thousands) | ||||||||
| Taylor Capital Group, Inc.: |
||||||||
| Revolving credit facility – $15.0 million maximum available at December 31, 2009; interest, at the Company’s election, at the prime rate or LIBOR plus 4.00%, with a minimum interest rate of 5.00%; interest rate at December 31, 2009 was 5.00%; matured March 31, 2010 |
$ | — | $ | 12,000 | ||||
| Cole Taylor Bank: |
||||||||
| Federal Reserve Bank Term Auction Facility 0.25%, matured January 14, 2010 |
— | 460,000 | ||||||
| FHLB overnight advance, 0.18%, due January 3, 2011 |
375,000 | — | ||||||
| FHLB advance – 0.62%, due November 10, 2010 |
— | 10,000 | ||||||
| FHLB advance – 0.91%, due June 1, 2011, non-callable |
10,000 | 10,000 | ||||||
| FHLB advance – 1.39%, matured January 11, 2012, non-callable |
10,000 | — | ||||||
| FHLB advance – 4.59%, due April 5, 2010, callable after April 4, 2008 |
— | 25,000 | ||||||
| FHLB advance – 4.83%, matured February 1, 2011, callable after January 8, 2004 |
25,000 | 25,000 | ||||||
| FHLB advance – 2.29%, due April 7, 2011, callable after April 7, 2009 |
25,000 | 25,000 | ||||||
| FHLB advance – 2.84%, due July 14, 2011, callable after July 14, 2009 |
17,500 | 17,500 | ||||||
| FHLB advance – 2.57%, due April 8, 2013, callable after April 7, 2010 |
25,000 | 25,000 | ||||||
| FHLB advance – 3.26%, due July 15, 2013, callable after July 14, 2010 |
17,500 | 17,500 | ||||||
| Total other advances |
505,000 | 155,000 | ||||||
| Total notes payable and other advances |
$ | 505,000 | $ | 627,000 | ||||
At December 31, 2009, the Company had a $15.0 million revolving credit facility, of which $12.0 million was outstanding. All amounts under this revolving credit facility were repaid in March 2010, and the Company did not renew this facility when it matured on March 31, 2010.
The Bank participates in the Federal Reserve Bank’s Borrower In Custody (“BIC”) program. At December 31, 2010 the Bank had pledged $813.1 million of commercial loans as collateral for available $504.9 million borrowing capacity under the BIC program at the FRB, however, there were no advances from the FRB at December 31, 2010. At December 31, 2009, the Bank had borrowings under the Federal Reserve Bank’s Term Auction Facility of $460.0 million. As of December 31, 2009, the Bank had pledged $85.3 million of securities and $790.8 million of commercial loans as collateral for these borrowings and had additional maximum borrowing capacity of $39.9 million.
At December 31, 2010, the Federal Home Loan Bank (“FHLB”) advances were collateralized by $521.6 million of investment securities and a blanket lien on $175.5 million of qualified first-mortgage residential, home equity and commercial real estate loans. Based on the value of collateral pledged at December 31, 2010, the Bank had additional borrowing capacity at the FHLB of $113.1 million. In comparison, at December 31, 2009, the FHLB advances were collateralized by $352.0 million of investment securities and a blanket lien on $143.0 million of qualified first-mortgage residential and home equity loans.
108
Table of Contents
11. Junior Subordinated Debentures
The following table summarizes the amount of junior subordinated debentures issued by the Company to TAYC Capital Trust I and TAYC Capital Trust II as of December 31, 2010 and 2009:
| TAYC Capital Trust I |
TAYC Capital Trust II | |||||
| (dollars in thousands) | ||||||
| Issuance Date |
Oct. 21, 2002 | June 17, 2004 | ||||
| Maturity Date |
Oct. 21, 2032 | June 17, 2034 | ||||
| Annual Rate |
9.75% | 3-mo LIBOR + 2.68% | ||||
| Amount of Junior Subordinated Debentures: |
||||||
| At December 31, 2009 |
$45,369 | $41,238 | ||||
| At December 31, 2010 |
45,369 | 41,238 | ||||
| Amount of Trust Preferred Securities Issued by Trust: |
||||||
| At December 31, 2009 |
$44,000 | $40,000 | ||||
| At December 31, 2010 |
44,000 | 40,000 | ||||
In October 2002, the Company formed TAYC Capital Trust I, a wholly-owned subsidiary and a Delaware statutory trust to issue trust preferred securities. TAYC Capital Trust I used the proceeds from the sale of these trust preferred securities, along with proceeds from the purchase of its common equity securities, to invest in 9.75% junior subordinated debentures of the Company. The sole assets of TAYC Capital Trust I are the Company’s junior subordinated debentures. Interest on both the trust preferred securities and junior subordinated debentures is payable quarterly at a rate of 9.75% per year.
In June 2004, the Company formed TAYC Capital Trust II, a wholly-owned subsidiary and a Delaware statutory trust to issue trust preferred securities. TAYC Capital Trust II used proceeds from the sale of these trust preferred securities and invested the proceeds, along with proceeds from the purchase of its common equity securities, in the floating rate junior subordinated debentures of the Company. The sole assets of TAYC Capital Trust II are the Company’s junior subordinated debentures. The interest rate on both the trust preferred securities and the junior subordinated debentures equals the three-month LIBOR plus 2.68% and re-prices quarterly on the 17th of September, December, March and June. The interest rate on both the trust preferred securities and the junior subordinated debenture was 2.98% and 2.93% at December 31, 2010 and 2009, respectively.
The Company may redeem all or part of each of the junior subordinated debentures at any time, subject to approval by the Federal Reserve Bank, at a redemption price equal to 100% of the aggregate liquidation amount of the debentures plus any accumulated and unpaid distributions thereon to the date of redemption. Each of the trust preferred securities are subject to mandatory redemption when the related junior subordinated debentures are paid at maturity or upon any earlier redemption of the debentures. Each of the trust preferred securities may also be redeemed at any time in the event of unfavorable changes in certain laws or regulations.
The Company may defer the payment of interest on each of the junior subordinated debentures at any time for a period not exceeding 20 consecutive quarters, provided that the deferral period does not extend past the stated maturity. During any such deferral period, distributions on the corresponding trust preferred securities will also be deferred and the Company’s ability to pay dividends on its common shares will be restricted. The Company also has agreed, consistent with our past practice, to continue to provide its regulators notice before the payment of interest on the junior subordinated debentures and the related issuance of trust preferred securities. Issuance costs from each issuance of the trust preferred securities, consisting primarily of underwriting discounts and professional fees, were capitalized and are being amortized over 30 years, or through the maturity dates, to interest expense using the straight-line method. At December 31, 2010 unamortized issuance costs related to TAYC Capital Trust I and TAYC Capital Trust II were $2.2 million and $368,000, respectively.
109
Table of Contents
The Company’s obligations with respect to each of the trust preferred securities and the related debentures, in the aggregate, constitute a full, irrevocable and unconditional guarantee on a subordinated basis by the Company of the obligations of each of the Trusts under the respective trust preferred securities.
In accordance with applicable accounting standards, the Company does not consolidate TAYC Capital Trust I and TAYC Capital Trust II. The equity investments in the Trusts of $2.6 million are reported in other assets on the Consolidated Balance Sheets at December 31, 2010 and 2009.
12. Subordinated Notes
The carrying value of subordinated notes at December 31, 2010 and 2009 is as follows:
| 2010 | 2009 | |||||||
| (in thousands) | ||||||||
| Taylor Capital Group, Inc.: |
||||||||
| 8% subordinated notes issued May 2010, due May 28, 2020 |
$ | 33,938 | $ | — | ||||
| Unamortized discount |
(4,347 | ) | — | |||||
| 8% subordinated notes issued October 2010, due May 28, 2020 |
3,562 | — | ||||||
| Unamortized discount |
(455 | ) | — | |||||
| Taylor Capital Group subordinated notes, net |
32,698 | — | ||||||
| Cole Taylor Bank: |
||||||||
| 10% subordinated notes issued September 2008, due Sept. 29, 2016 |
60,000 | 60,000 | ||||||
| Unamortized discount |
(3,863 | ) | (4,305 | ) | ||||
| Cole Taylor Bank subordinated notes, net |
56,137 | 55,695 | ||||||
| Total subordinated notes, net |
$ | 88,835 | $ | 55,695 | ||||
On September 24, 2008, the Bank issued $60.0 million of 10% subordinated notes. The subordinated notes pay interest quarterly at an annual rate of 10% and will mature on September 29, 2016, but may be prepaid at the Bank’s option after September 29, 2011. The subordinated notes are subordinated unsecured obligations of the Bank and are subordinate to all deposits, purchased funds, and senior indebtedness of the Bank. The notes also contain restrictions on the Bank’s ability to pay dividends to the Company in the event the Bank fails to make any required principal and interest payments. The Company also has agreed, consistent with its past practice, to continue to provide its regulators notice before the payment of any interest on the Bank’s subordinated notes. In addition, for every $1,000 in principal amount of the subordinated notes, investors received a warrant to purchase 15 shares of the Company’s common stock at an exercise price of $10.00 per share, subject to customary anti-dilution adjustments, which represents an aggregate of 900,000 shares of common stock. The warrants will expire on September 29, 2013. The proceeds received from this transaction were allocated to the subordinated notes and the warrants based upon their relative fair values. The discount represents the portion of the proceeds allocated to the warrants and is being amortized as additional interest expense on the subordinated notes over the remaining contractual life of the notes. The fair value allocated to the warrants, totaling $4.7 million at the issuance date of September 24, 2008, net of issuance costs, was credited to surplus in stockholders’ equity on the Consolidated Balance Sheet. The subordinated notes qualify as Tier 2 capital for regulatory capital purposes.
On May 28, 2010, the Company issued $33.9 million of 8% subordinated notes. The subordinated notes pay interest quarterly at an annual rate of 8% and will mature on May 28, 2020, but may be prepaid at the Company’s option on or after May 28, 2012. The subordinated notes are subordinated unsecured obligations of the Company and are subordinate to the general creditors of the Company. The notes also contain restrictions on the Company’s ability to pay dividends in the event the Company fails to make any required principal and interest payments. The Company also has agreed, consistent with its past practice, to continue to provide its regulators notice before the payment of any of the interest on the subordinated notes. In addition, for every $1,000 in principal amount of the subordinated notes, investors received a warrant to purchase 25 shares of the Company’s
110
Table of Contents
common stock at an exercise price of $12.28 per share, representing an aggregate of 848,450 shares of common stock. The warrants can be exercised on or after November 24, 2010, and will expire on May 28, 2015. The proceeds received from this transaction were allocated to the subordinated notes and the warrants based on their relative fair values. The discount represents the portion of the proceeds allocated to the warrants and is being amortized as additional interest expense on the subordinated notes over the remaining contractual life of the notes. The fair value allocated to the warrants, totaling $4.4 million at the issuance date of May 28 2010, net of issuance costs, was credited to surplus in stockholders’ equity on our Consolidated Balance Sheets. The subordinated notes qualify as Tier 2 capital for regulatory purposes.
On October 21, 2010, the Company issued $3.6 million of 8% subordinated notes which will pay interest quarterly at an annual rate of 8% and will mature on May 28, 2020, but may be prepaid at the Company’s option on or after May 28, 2012. These notes also contain restrictions on the Company’s ability to pay dividends in the event the Company fails to make any required principal and interest payments. In addition, for every $1,000 in principal amount of the subordinated notes, investors received a warrant to purchase 25 shares of the Company’s common stock at an exercise price of $12.28 per share, representing an aggregate of 89,050 shares of common stock. These warrants are immediately exercisable and will expire on May 28, 2015. The proceeds were allocated between the subordinated notes and the warrants based on their relative fair values. The discount represents the portion of the proceeds allocated to the warrants and is being amortized as additional interest expense on the subordinate notes over the remaining contractual life of the note. The fair value allocated to the warrants, totaling $420,000 at the issuance date of October 21, 2010, net of issuance costs, was credited to surplus in stockholders’ equity on our Consolidated Balance Sheets. The subordinated notes qualify as Tier 2 Capital for regulatory purposes.
13. Employee Benefit Plans
The Company’s employees participate in an employee benefit plan consisting of a 401(k) Plan. Contributions to the Plan are made at the discretion of the Board of Directors, with the exception of certain 401(k) matching of employee contributions. The 401(k) plan allows participants a choice of several equity and fixed income mutual funds. Company common stock is not an investment option for 401(k) participants. For the years ended December 31, 2010, 2009 and 2008, contributions paid to the Plans were $1.4 million, $1.1 million, and $1.1 million, respectively.
On May 31, 2008, the Company filed a request to terminate a previously established Profit Sharing/Employee Stock Ownership Plan (“ESOP”). The Company received its final determination letter from the IRS on December 14, 2009 allowing the termination of the Plan. As of December 31, 2009, the ESOP held 290,133 shares of Company common stock and cash totaling $256,000, for a total value of the Plan (cash plus value of shares on December 31, 2009) of $3.6 million. Participants became fully vested in their accounts when the request was filed. A final valuation was completed in May 2010, and all participants were notified in writing that they were entitled to take their distribution or rollover their account balances. As of December 31, 2010, all distributions had been made.
The Company also maintains a non-qualified deferred compensation plan for certain key employees that allow participants to defer a portion of base and incentive compensation. The Company also may make contributions and discretionary matching contributions to the plan. The deferrals and Company contributions are held in a rabbi trust for the participants. While the Company maintains ownership of the assets, the participants are able to direct the investment of the assets into several equity and fixed income mutual funds. Company common stock is not an investment option for the participants. The Company records the assets at their fair value in other assets on the Consolidated Balance Sheets. The liability to participants is recorded in other liabilities on the Consolidated Balance Sheets. Total assets and the corresponding liability in the nonqualified deferred compensation plan totaled $2.6 million and $2.5 million at December 31, 2010 and 2009, respectively.
111
Table of Contents
14. Stock-Based Compensation
The Company has an Incentive Compensation Plan (the “Plan”) that provides for the granting of stock-based compensation awards. Under the Plan, directors, officers and employees selected by the Board of Directors are eligible to receive awards, including incentive stock options, nonqualified stock options, stock appreciation rights, stock awards, and performance awards. The Company has only issued nonqualified stock options and restricted stock awards under the Plan. As of December 31, 2010, a total of 2,773,243 shares of common stock were authorized for use in the Plan and 388,110 shares were available for future grants.
During 2010, the Company recognized $2.2 million of stock based compensation expense which consisted of $1.6 million related to restricted stock grants and $512,000 related to stock options grants. In comparison, during 2009, the Company recognized $2.1 million of stock based compensation expense which consisted of $1.7 million for restricted stock grants and $406,000 for stock option grants, while total stock based compensation expense in 2008 was $2.2 million which consisted of $1.4 million for restricted stock grants and $811,000 for stock option grants.
Stock Options:
The Company is required to estimate the fair value of share-based payment awards on the date of grant using an option-pricing model. The value of the portion of the award that is ultimately expected to vest is recognized as compensation expense in the Company’s Consolidated Statements of Operations over the requisite service periods using a straight-line method. Since stock-based compensation expense is based on awards ultimately expected to vest, the expense is reduced for estimated forfeitures. Forfeitures are estimated at the time of grant and revised, if necessary, in subsequent periods if actual forfeitures differ from those estimates.
Generally, stock options are granted with an exercise price equal to the fair market value of the common stock on the date of grant. Since 2006, stock options granted vest over a four year period (vesting at 25% per year) and expire eight years following grant date. Stock options granted prior to 2006 vest over a five year period (vesting at 20% per year) and expire 10 years following the grant date. In either case, upon death, disability, retirement or change of control of the Company (as defined in the Plan) vesting may be accelerated to 100%.
During 2008, the Company granted options to purchase up to 150,000 shares of common stock to a new member of the Company’s Board of Directors at an exercise price of $20.00 per share, which was greater than the closing stock price of the Company’s common stock on the date of grant. This award was immediately vested and had a 10 year term. The entire $162,000 cost of the grant was recognized as compensation expense in 2008.
The following is a summary of stock option activity for the year ended December 31, 2010:
| Shares | Weighted- Average Exercise Price |
Weighted- Average Remaining Contractual Term in Years |
Aggregate Intrinsic Value ($000) |
|||||||||||||
| Outstanding at January 1, 2010 |
813,099 | $ | 18.76 | |||||||||||||
| Granted |
172,450 | 8.75 | ||||||||||||||
| Exercised |
(875 | ) | 6.23 | |||||||||||||
| Forfeited |
(23,577 | ) | 7.37 | |||||||||||||
| Expired |
(50,994 | ) | 25.04 | |||||||||||||
| Outstanding at December 31, 2010 |
910,103 | 16.82 | 5.6 | $ | 2,252 | |||||||||||
| Exercisable at December 31, 2010 |
542,529 | 22.13 | 4.7 | |||||||||||||
112
Table of Contents
As of December 31, 2010, the total compensation cost related to nonvested stock options that have not yet been recognized totaled $1.2 million and the weighted average period over which these costs are expected to be recognized is approximately 2.8 years.
Restricted Stock:
Under the Plan, the Company can grant restricted stock awards that vest upon completion of future service requirements or specified performance criteria. The fair value of these awards is equal to the market price of the common stock at the date of grant. The Company recognizes stock-based compensation expense for these awards over the vesting period, using the straight-line method, based upon the number of awards ultimately expected to vest. For grants prior to 2006, the Company recognized compensation expense over the service period of each separately vesting portion of the award, in effect treating each vesting portion as a separate award. Generally, restricted stock awards based upon completion of future service requirements vest 50% at the end of year three, 75% at the end of year four and 100% at the end of year five or upon death, disability, retirement or change of control of the Company (as defined in the Plan). However, in 2008 the Company granted a restricted stock award to an executive that vested 25% per year over a four year term. If a participant terminates employment prior to the end of the continuous service period, the unearned portion of the stock award is forfeited. The Company may also issue awards that vest upon satisfaction of specified performance criteria. For these types of awards, the final measure of compensation cost is based upon the number of shares that ultimately vest considering the performance criteria.
Under the United States Department of the Treasury’s Troubled Asset Relief Program (“TARP”), restrictions are placed on the top five most highly compensated employees from receiving incentive compensation, except in restricted stock valued at up to one-third of their total compensation. If granted, the restricted stock may not fully vest for at least two years and until the repayment of TARP, although for every 25% of TARP funds repaid, 25% of the restricted stock may become transferable.
The following table provides information regarding nonvested restricted stock:
| Nonvested Restricted Stock |
Shares | Weighted- Average Grant- Date Fair Value |
||||||
| Nonvested at January 1, 2010 |
572,322 | $ | 15.06 | |||||
| Granted |
36,575 | 12.03 | ||||||
| Vested |
(39,317 | ) | 27.39 | |||||
| Forfeited |
(31,119 | ) | 11.97 | |||||
| Nonvested at December 31, 2010 |
538,461 | $ | 14.13 | |||||
The fair value of restricted stock awards that vested during 2010 was $438,000, compared to $1.3 million and $722,000 during the years ended December 31, 2009 and 2008, respectively. As of December 31, 2010, the total compensation cost related to nonvested restricted stock that has not yet been recognized totaled $4.6 million, and the weighted average period over which these costs are expected to be recognized is approximately 2.3 years.
Valuation Information:
The Company uses the modified Black-Scholes option-pricing model (“Black-Scholes model”) for determining the fair value of stock options issued to employees and directors. The determination of the fair value of share-based payment awards using the Black-Scholes model is impacted by the Company’s stock price on the date of grant as well as several assumptions used as inputs into the model. The assumptions include the risk-free interest rate at grant date, expected stock price volatility, expected dividend payout, and expected option life.
113
Table of Contents
The risk-free interest rate assumption is based upon observed interest rates for the expected term of the Company’s stock options. The expected volatility input into the model takes into account the historical volatility of the Company’s common stock over the period that it has been publicly traded or the expected term of the option. The expected dividend yield assumption is based upon the Company’s historical dividend payout, if any, determined at the date of grant. In addition, the Company used the methodology outlined in the Securities and Exchange Commission’s Staff Accounting Bulletin No. 107 in determining the expected life of the awards. This methodology takes into account the vesting periods and the contractual term of the award.
The following are the assumptions used to determine the weighted average fair value of stock option awards, using the Black-Scholes model, for each of the periods indicated:
| For the Years Ended December 31, |
||||||||||||
| 2010 | 2009 | 2008 | ||||||||||
| Grant date fair value per share |
$ | 4.44 | $ | 3.03 | $ | 2.21 | ||||||
| Significant assumptions: |
||||||||||||
| Risk-free interest rate at grant date |
2.59 | % | 2.61 | % | 2.73 | % | ||||||
| Expected stock price volatility |
55.00 | % | 52.00 | % | 39.00 | % | ||||||
| Expected dividend payout |
0.00 | % | 0.00 | % | 0.50 | % | ||||||
| Expected option life, in years |
5.25 | 5.25 | 6.94 | |||||||||
15. Stockholders’ Equity
At both December 31, 2010 and 2009, the Company’s authorized capital stock was 55 million shares, consisting of 45 million shares of common stock, par value $0.01 per share, and 10 million shares of preferred stock, par value $0.01 per share. In September 2008, the Company designated and issued 2.4 million preferred shares as 8% Non-Cumulative Convertible Perpetual Preferred Stock, Series A (“Series A Preferred”) which was converted to common stock in May 2010. In November 2008, the Company designated and issued 104,823 shares of preferred stock as Fixed Rate Cumulative Perpetual Preferred Stock, Series B (“Series B Preferred”). In May 2010, the Company designated and issued 1,276,480 shares of preferred stock as 8% Non-Cumulative, Convertible Perpetual Preferred Stock, Series C (“Series C Preferred”). In October 2010, the Company designated and issued 405,330 preferred shares as Nonvoting, Convertible Preferred Stock, Series D (“Series D Preferred”) and 223,520 preferred shares of 8% Nonvoting Non-Cumulative Convertible Perpetual Preferred stock, Series E (“Series E Preferred”). The Company has agreed, consistent with past practice, to continue to provide its regulators notice before the payment of any dividends on its preferred stock.
Common Stock:
The holders of outstanding shares of common stock and Series D Preferred are entitled to receive dividends out of assets legally available at such times and in such amounts as the Company’s Board of Directors may determine. The terms of the Series B Preferred require the Company to obtain consent, under certain circumstances, before paying common dividends, and the terms of the junior subordinated debentures, the Series C Preferred and Series E Preferred place defined restrictions on the Company’s ability to pay common dividends in the event of deferral of the payment of interest or dividends on those securities. The shares of common stock are neither redeemable nor convertible, and the holders thereof have no preemptive or subscription rights to purchase any securities of the Company. Upon liquidation, dissolution or winding up of the Company, the holders of common stock are entitled to receive, pro rata, the assets of the Company which are legally available for distribution, after payment of all debts and other liabilities and subject to the prior rights of any holders of preferred stock then outstanding. Each outstanding share of common stock is entitled to one vote on all matters submitted to a vote of stockholders.
114
Table of Contents
Preferred Stock:
The Company’s Third Amended and Restated Certificate of Incorporation authorizes its Board of Directors to issue preferred stock in classes or series and to establish the designations, preferences, qualifications, limitations or restrictions of any class or series with respect to the rate and nature of dividends, the price and terms and conditions on which shares may be redeemed, the terms and conditions for conversion or exchange into any other class or series of the stock, voting rights and other terms.
Series A Preferred: In May 2010, the Company completed an exchange offering in which all of its outstanding Series A Preferred were converted into 7.2 million shares of common stock that included 1.2 million shares as an inducement to convert into common shares. The $15.8 million value attributed to the additional shares was considered a non-cash implied dividend to holders of the Series A Preferred and resulted in no net impact on total stockholders’ equity. This non-cash dividend was a deduction in arriving at net loss applicable to common stockholders on the Consolidated Statement of Operations and was considered in the determination of basic and diluted loss per common share. After the payment of the regular quarterly dividend of $1.2 million on April 15, 2010, the Company did not declare or pay any further dividends on the Series A Preferred. This compares to the period ended December 31, 2009, when the Company declared and paid dividends on Series A Preferred in the amount of $4.8 million.
Series B Preferred: On November 21, 2008, as part of the United States Department of the Treasury’s (“Treasury”) TARP Capital Purchase Program, the Company entered into a Letter Agreement and Securities Purchase Agreement (“Purchase Agreement”) with the Treasury, pursuant to which the Company sold, for an aggregate purchase price of $104.8 million, 104,823 shares of Series B Preferred, with a purchase price and liquidation preference of $1,000 per share, and warrants to purchase 1,462,647 shares of the Company’s common stock.
The total proceeds received of $104.8 million were allocated to the Series B Preferred and the warrants based upon their relative fair values. The fair values allocated to the Series B Preferred and warrants upon issuance were $96.6 million and $8.2 million, respectively. The Series B Preferred is recorded on the Company’s Consolidated Balance Sheets at the aggregate liquidation amount less the discount created by the allocation of a portion of the proceeds to the warrants. At December 31, 2010, the recorded balance of the Series B Preferred was $100.4 million, which is equal to the liquidation amount, net of unamortized discount of $5.1 million plus accumulated but undeclared dividends of $670,000. This compares to December 31, 2009 when the recorded balance of the Series B Preferred was $98.8 million, which was equal to the liquidation amount, net of unamortized discount of $6.6 million plus accumulated but undeclared dividends of $670,000. The discount on the Series B Preferred is being accreted as a dividend yield adjustment over five years, the period that the Company expects the Series B Preferred to remain outstanding. During 2010, the total discount accreted as a non-cash dividend was $1.5 million compared to $1.4 million during 2009. The discount amortization increased the net loss applicable to common stockholders and the net loss per common share during 2010 and 2009.
The Series B Preferred qualifies as Tier 1 capital for regulatory capital purposes and pays cumulative compounding dividends at a rate of 5% per year until November 21, 2013, and 9% per year thereafter. During 2010 and 2009, the Company declared and paid dividends on Series B Preferred stock in the amount of $5.2 million.
The Company’s Third Amended and Restated Certificate of Incorporation, as amended by the certificate of designations for the Series B Preferred (as amended, the “Charter”), provides that the Company may not redeem the Series B Preferred prior to November 21, 2011, except with proceeds from the sale of equity securities of the Company that qualify as Tier 1 capital at the time of issuance. On or after November 21, 2011, the Company may redeem shares of the Series B Preferred for the per share liquidation amount of $1,000 per share, plus any accrued and unpaid dividends.
In February 2009, subsequent to the issuance of the Series B Preferred, the American Recovery and Reinvestment Act of 2009 (“ARRA”) was enacted. Among other things, the ARRA provided that the Secretary
115
Table of Contents
of Treasury, after consultation with the appropriate federal banking agency, will permit any recipient of TARP funds to repay such funds without regard to the source of the funds or any waiting period. Furthermore, if such assistance has been repaid, the Secretary shall liquidate any associated warrants at the current market value. However, since the original redemption restrictions described above are contained in the Company’s Charter, any redemption of the Series B Preferred prior to November 21, 2011 other than with proceeds of equity securities of the Company that qualify as Tier 1 capital at the time of issuance also would require the Company to seek stockholder approval to amend the Charter to remove these restrictions.
In the event of any voluntary or involuntary liquidation, dissolution or winding up of the affairs of the Company, each holder of Series B Preferred will be entitled to receive the liquidation amount per share and the amount of any accrued and unpaid dividends, whether or not declared to the date of payment, out of the Company’s assets or proceeds available for distribution to stockholders of the Company, subject to the rights of any creditors and before any distribution of such assets or proceeds is made to or set aside for the Company’s common stock stockholders.
Series C Preferred: On May 28, 2010, the Company issued a total of 1,276,480 shares of Series C Preferred with a purchase price and liquidation preference of $25.00 per share. The Series C Preferred pay non-cumulative dividends at an annual rate of 8% of the liquidation preference of $25.00 per share, and each share can be converted into 2.03583 shares of common stock at a conversion price of $12.28 per common share. Holders of the Series C Preferred have the option of converting their shares at any time, into an aggregate of 2,598,696 common shares. The Series C Preferred is convertible at the Company’s option any time after the earlier of May 28, 2015 or the first date on which the volume-weighted average per share price of the Company’s common stock equals or has exceeded 130% of the then applicable conversion price of the Series C Preferred for at least 20 trading days within any period of 30 consecutive trading days occurring after May 28, 2013.
The Series C Preferred holders are entitled to vote on all matters voted on by the holders of the common stock on an as-converted basis. The Company is restricted from declaring and paying dividends on its common stock if the full quarterly dividends on the Series C Preferred have not been paid or declared.
In the event of any voluntary or involuntary liquidation, dissolution or winding up of the affairs of the Company, each holder of the Series C Preferred will be entitled, before any distributions or payments of the Company’s assets may be made to or set aside for common stock or other stock junior to the rights of the Series C Preferred and subject to the rights of the Company’s creditors, to receive a liquidation distribution in the amount equal to $25.00 per share, plus any accrued but unpaid dividends. A merger, consolidation, or sale of all or substantially all of the Company’s assets is not considered a liquidation.
At December 31, 2010, the recorded balance of the Series C Preferred was $31.9 million, which is equal to the liquidation value. During 2010, the Company declared and paid dividends on Series C Preferred in the amount of $1.6 million.
Series D Preferred: On October 21, 2010, the Company issued a total of 405,330 shares of Series D Preferred, in exchange for 405,330 shares of common stock held by investors. The Series D Preferred participates in any dividends paid to holders of the Company’s common stock. Each share of Series D Preferred will be automatically converted into one share of common stock immediately on any Widely Dispersed Offering or Conversion Event as defined in the Certificate of Designation.
The holders of Series D Preferred are entitled to notice of all stockholder meetings at which all holders of common stock shall be entitled to vote, but the Series D Preferred holders shall not be entitled to vote on any matter presented to the stockholders of the Company.
In the event of any reorganization, reclassification, consolidation, merger or sale, each holder of the Series D Preferred shall be treated the same as each holder of common stock. In the event that holders of common stock
116
Table of Contents
have the option to elect the form of consideration to be received, holders of Series D Preferred shall have the same election privileges. In all cases, if any of the securities otherwise receivable are “voting securities” for bank regulatory purposes, each Series D Preferred holder shall have the right to elect to receive “non-voting securities” in lieu of voting securities.
Series E Preferred: On October 21, 2010, the Company issued a total of 223,520 shares of Series E Preferred, with a purchase price and liquidation preference of $25.00 per share. The Series E Preferred pays non-cumulative dividends at an annual rate of 8% of the liquidation preference of $25.00 per share. Each share of Series E Preferred will be automatically converted into one share of Series C Preferred immediately on any Widely Dispersed Offering or Conversion Event as defined in the Certificate of Designation. Each share of the Series E Preferred is convertible into one share of Series D Preferred at any time at the holder’s option. If the Series C Preferred are converted into shares of common stock, the Company has the right to convert any Series E Preferred into Series D Preferred in the same proportion.
The holders of Series E Preferred are entitled to notice of all stockholder meetings at which all holders of common stock shall be entitled to vote, but the Series E Preferred holders shall not be entitled to vote on any matter presented to the stockholders of the Company.
In the event of any reorganization, reclassification, consolidation, merger or sale, each holder of the Series E Preferred shall be treated the same as each holder of Series C Preferred. In the event that holders of Series C Preferred have the option to elect the form of consideration to be received, holders of Series D Preferred shall have the same election privileges. In all cases, if any of the securities otherwise receivable are “voting securities” for bank regulatory purposes, each Series D Preferred holder shall have the right to elect to receive “non-voting securities” in lieu of voting securities.
At December 31, 2010, the recorded balance of the Series E Preferred was $5.6 million, which is equal to the liquidation value. During 2010, the Company declared dividends on Series E Preferred in the amount of $103,000.
Warrants to Purchase Common Stock:
At December 31, 2010, an aggregate of 3,800,147 warrants were issued and outstanding to purchase shares of the Company’s common stock. The warrants were issued in five different transactions as follows:
| Warrants issued |
Warrants outstanding at Dec. 31, 2010 |
Exercise price |
Date exercisable | Expiration date | ||||||||||||||||
| Warrant: |
||||||||||||||||||||
| FIC warrants |
500,000 | 500,000 | $ | 20.00 | Sept. 29, 2008 | Sept. 29, 2018 | ||||||||||||||
| Detachable warrants issued with Cole Taylor Bank subordinated notes |
900,000 | 900,000 | $ | 10.00 | Mar. 29, 2009 | Sept. 29, 2013 | ||||||||||||||
| Detachable warrants issued with Taylor Capital Group subordinated notes |
848,450 | 848,450 | $ | 12.28 | Nov. 24, 2010 | May 28, 2015 | ||||||||||||||
| Detachable warrants issued with Taylor Capital Group subordinated notes |
89,050 | 89,050 | $ | 12.28 | Oct. 21, 2010 | May 28, 2015 | ||||||||||||||
| Series B Preferred warrants |
1,462,647 | 1,462,647 | $ | 10.75 | Nov. 21, 2008 | Nov. 21, 2018 | ||||||||||||||
| Total |
3,800,147 | 3,800,147 | ||||||||||||||||||
On September 29, 2008, the Company entered into a Management Services Agreement (“MSA”) with Financial Investments Corporation (“FIC”). The term of the MSA was nine months and expired in June 2009. In connection with the MSA, in exchange for FIC providing the Company with certain management, advisory and consulting services, the Company paid FIC a cash fee of $750,000 and issued FIC warrants to purchase up to
117
Table of Contents
500,000 shares of the Company’s common stock at an exercise price of $20.00 per share. The FIC warrants are not transferable or assignable after their initial issuance, and are exercisable at any time up to the September 29, 2018 expiration date. As of December 31, 2010, no warrants have been exercised. A portion of the total cost of the MSA, which included the cash payment and the fair value of the FIC warrants, was allocated to the capital transaction and accounted for as other issuance costs. The remaining costs were recognized as an operating expense for services to be provided during the term of the MSA. During 2009 and 2008, $500,000 and $250,000, respectively, were recognized as operating expense for the cash fee paid to FIC. In accordance with the terms of MSA, two executives of FIC currently serve on the Company’s Board of Directors. In addition, the Company’s Third Amended and Restated Certificate of Incorporation allowed for the creation of a three member Executive Committee of the Board of Directors, the chairman of which is an executive at FIC.
In connection with the issuance of $60 million of subordinated notes on September 29, 2008, the Company issued detachable warrants to purchase an aggregate amount of 900,000 shares of the Company’s common stock. The exercise price of the warrants is $10.00 and the warrants are exercisable on or after March 29, 2009 and expire on September 29, 2013. The proceeds from the subordinated notes offering were allocated to the subordinated notes and the warrants based upon their relative fair values. The fair value of the warrants of $4.7 million was credited to surplus resulting in an increase in stockholders’ equity. As of December 31, 2010, no warrants have been exercised.
In connection with the issuance of $33.9 million of subordinated notes on May 28, 2010, the Company issued detachable warrants to purchase an aggregate amount of 848,450 shares of the Company’s common stock. The exercise price of the warrants is $12.28 and the warrants are exercisable on or after November 24, 2010 and expire on May 28, 2015. The proceeds from the subordinated notes offering were allocated to the subordinated notes and the warrants based on their relative fair value. The fair value of the warrants totaling $4.4 million at the issuance date of May 2010, net of issuance costs, was credited to surplus in stockholders’ equity resulting in an increase in stockholders’ equity. As of December 31, 2010, no warrants have been exercised.
In connection with the issuance of $3.6 million of subordinated notes on October 21, 2010, the Company issued detachable warrants to purchase an aggregate amount of 89,050 shares of the Company’s common stock. The exercise price of the warrants is $12.28 and the warrants are exercisable immediately after issuance and expire on May 28, 2015. The proceeds from the subordinated notes offering were allocated to the subordinated notes and the warrants based on their relative fair value. The fair value of the warrants totaling $420,000 at the issuance date of October 21, 2010, net of issuance costs, was credited to surplus in stockholders’ equity resulting in an increase in stockholders’ equity. As of December 31, 2010, no warrants have been exercised.
In connection with the Series B Preferred offering, the Company issued to the Treasury a warrant to purchase 1,462,647 shares of the Company’s common stock. This warrant has a 10-year term and is immediately exercisable upon its issuance, with an exercise price, subject to anti-dilution adjustments, equal to $10.75 per share of the common stock. The warrant is not subject to any contractual restrictions on transfer. Treasury has agreed not to exercise voting power with respect to any shares of common stock issued upon exercise of the warrant. As of December 31, 2010, no warrants have been exercised.
16. Regulatory Disclosures
The Company and the Bank are subject to various capital requirements administered by the federal and state banking agencies. Failure to meet minimum capital requirements can initiate certain mandatory and possibly additional discretionary actions by regulators, which, if undertaken, could have a direct material effect on the Company’s financial statements. Under capital adequacy guidelines and the regulatory framework for prompt corrective action, the Company and the Bank must meet specific capital guidelines that involve quantitative measures of the entity’s assets, liabilities, and certain off-balance sheet items as calculated under regulatory accounting practices. The Bank’s and Company’s capital amounts and classification are also subject to qualitative judgments by the regulators about components, risk weightings, and other factors.
118
Table of Contents
Quantitative measures established by regulation to ensure capital adequacy require the Company and the Bank to maintain minimum amounts and ratios (set forth in the table below) of total and Tier 1 Capital (as defined in the regulations) to risk-weighted assets (as defined), and of Tier 1 Capital (as defined) to average assets (as defined). As of December 31, 2010 and 2009, the Federal Deposit Insurance Corporation categorized the Bank as “well-capitalized” under the regulatory framework for prompt corrective action. To be categorized “well-capitalized” the Bank must maintain minimum total risk-based, Tier 1 risk-based, and Tier 1 leverage ratios as set forth in the table. At December 31, 2010, there were no conditions or events since that notification that management believes have changed the institution’s category. During 2010, the Company contributed an additional $60.0 million of capital to the Bank to further strengthen its regulatory capital.
The Company’s and the Bank’s actual and required capital amounts and ratios as of December 31, 2010 and 2009 are presented in the following table:
| Actual | For Capital Adequacy Purposes |
To Be Well-capitalized Under Prompt Corrective Action Provisions |
||||||||||||||||||||||
| Amount | Ratio | Amount | Ratio | Amount | Ratio | |||||||||||||||||||
| (dollars in thousands) | ||||||||||||||||||||||||
| As of December 31, 2010: |
||||||||||||||||||||||||
| Total Capital (to Risk Weighted Assets): |
||||||||||||||||||||||||
| Taylor Capital Group, Inc. – Consolidated |
$ | 448,389 | 12.98 | % | >$276,381 | >8.00 | % | >$345,476 | >10.00 | % | ||||||||||||||
| Cole Taylor Bank |
414,423 | 12.04 | >275,401 | >8.00 | >344,252 | >10.00 | ||||||||||||||||||
| Tier 1 Capital (to Risk Weighted Assets): |
||||||||||||||||||||||||
| Taylor Capital Group, Inc. – Consolidated |
$ | 308,397 | 8.93 | % | >$138,190 | >4.00 | % | >$207,286 | >6.00 | % | ||||||||||||||
| Cole Taylor Bank |
314,182 | 9.13 | >137,701 | >4.00 | >206,551 | >6.00 | ||||||||||||||||||
| Leverage (to Average Assets): |
||||||||||||||||||||||||
| Taylor Capital Group, Inc. – Consolidated |
$ | 308,397 | 6.89 | % | >$178,971 | >4.00 | % | >$223,714 | >5.00 | % | ||||||||||||||
| Cole Taylor Bank |
314,182 | 7.05 | >178,270 | >4.00 | >222,838 | >5.00 | ||||||||||||||||||
| As of December 31, 2009: |
||||||||||||||||||||||||
| Total Capital (to Risk Weighted Assets): |
||||||||||||||||||||||||
| Taylor Capital Group, Inc. – Consolidated |
$ | 433,197 | 12.72 | % | >$272,411 | >8.00 | % | >$340,514 | >10.00 | % | ||||||||||||||
| Cole Taylor Bank |
395,869 | 11.64 | >272,030 | >8.00 | >340,038 | >10.00 | ||||||||||||||||||
| Tier 1 Capital (to Risk Weighted Assets): |
||||||||||||||||||||||||
| Taylor Capital Group, Inc. – Consolidated |
$ | 333,479 | 9.79 | % | >$136,205 | >4.00 | % | >$204,308 | >6.00 | % | ||||||||||||||
| Cole Taylor Bank |
296,839 | 8.73 | >136,015 | >4.00 | >204,023 | >6.00 | ||||||||||||||||||
| Leverage (to Average Assets): |
||||||||||||||||||||||||
| Taylor Capital Group, Inc. – Consolidated |
$ | 333,479 | 7.60 | % | >$175,605 | >4.00 | % | >$219,506 | >5.00 | % | ||||||||||||||
| Cole Taylor Bank |
296,839 | 6.77 | >175,318 | >4.00 | >219,147 | >5.00 | ||||||||||||||||||
The Bank is also subject to dividend restrictions set forth by regulatory authorities. Because of the recent net losses, as of December 31, 2010, the Bank could not declare and pay dividends to the Company without notifying the appropriate regulatory authorities. Payment of any such dividends would also be subject to the Bank remaining in compliance with all applicable capital ratios
119
Table of Contents
17. Commitments and Financial Instruments with Off-Balance Sheet Risks
Commitments:
The Company is obligated in accordance with the terms of various long-term non-cancelable operating leases for certain premises (land and building) and office space and equipment, including the Company’s principal offices. The terms of the leases generally require periodic adjustment of the minimum lease payments based on an increase in the consumer price index. In addition, the Company is obligated to pay the real estate taxes assessed on the properties and certain maintenance costs. Certain of the leases contain renewal options for periods of up to five years. Total rental expense for the Company in connection with these leases for the years ended December 31, 2010, 2009 and 2008 was approximately $5.2 million, $4.8 million, and $4.2 million, respectively. Estimated future minimum rental commitments under all operating leases as of December 31, 2010 are as follows:
| Year |
Amount | |||
| (in thousands) | ||||
| 2011 |
$ | 4,215 | ||
| 2012 |
4,241 | |||
| 2013 |
4,323 | |||
| 2014 |
3,393 | |||
| 2015 |
1,421 | |||
| Thereafter |
13,366 | |||
| Total |
$ | 30,959 | ||
Financial Instruments with Off-Balance Sheet Risks:
At times, the Company is party to various financial instruments with off-balance sheet risks. The Company uses these financial instruments in the normal course of business to meet the financing needs of customers. These financial instruments include commitments to extend credit and financial guarantees, such as financial and performance standby letters of credit. When viewed in terms of the maximum exposure, those instruments may involve, to varying degrees, elements of credit and interest rate risk in excess of the amount recognized in the Consolidated Balance Sheet. Credit risk is the possibility that a counterparty to a financial instrument will be unable to perform its contractual obligations. Interest rate risk is the possibility that, due to changes in economic conditions, the Company’s net interest income will be adversely affected.
The Company mitigates its exposure to credit risk through its internal controls over the extension of credit. These controls include the process of credit approval and review, the establishment of credit limits, and, when deemed necessary, securing collateral. Collateral held varies but may include deposits held in financial institutions; U.S. Treasury securities; other marketable securities; income-producing commercial or multi-family rental properties, vacant land or land under development; accounts receivable; inventories; and property, plant and equipment. The Company manages its exposure to interest rate risk generally by setting variable rates of interest on extensions of credit and administered rates on interest bearing non-maturity deposits and, on a limited basis, by using derivative financial instruments to offset existing interest rate risk of its assets and liabilities.
The following is a summary of the contractual or notional amount of each significant class of financial instrument with off-balance sheet credit risk outstanding. The Company’s maximum exposure to credit loss in the event of nonperformance by the counterparty to the financial instrument for commitments to extend credit and financial guarantees is represented by the contractual notional amount of these instruments.
120
Table of Contents
At December 31, 2010 and 2009, the contractual amounts were as follows:
| 2010 | 2009 | |||||||
| (in thousands) | ||||||||
| Financial instruments wherein contract amounts represent credit risk: |
||||||||
| Commitments to extend credit |
$ | 905,485 | $ | 864,814 | ||||
| Financial guarantees: |
||||||||
| Financial standby letters of credit |
53,778 | 56,141 | ||||||
| Performance standby letters of credit |
14,135 | 27,435 | ||||||
Commitments to extend credit are agreements to lend to a customer as long as there is no violation of any condition established in the contract. Commitments generally have fixed expiration dates or other termination clauses and may require payment of a fee. Many customers do not utilize the total approved commitment amounts. Historically, available commitment amounts are not always drawn. Therefore, the total commitment amounts do not usually represent future cash requirements.
The Company issues financial guarantees in the form of financial and performance standby letters of credit to meet the needs of customers. Financial standby letters of credit are conditional commitments issued by the Company to guarantee the payment of a specified financial obligation of a customer to a third party. Performance standby letters of credit are conditional commitments issued by the Company to make a payment to a specified third party in the event a customer fails to perform under a non-financial contractual obligation. The terms of these financial guarantees primarily range from less than one year to three years. A contingent liability is recognized if it is probable that a liability has been incurred by the Company under a standby letter of credit. The credit risk involved in issuing these letters of credit is essentially the same as that involved in extending loan facilities to customers. Management expects most of the Company’s letters of credit to expire undrawn. Management expects no significant loss from its obligation under these financial guarantees to the extent not already recognized as a liability on the Company’s Consolidated Balance Sheets. At December 31, 2010 and 2009, the Company had established a reserve of $5.4 million and $3.5 million, respectively, for unfunded commitments because it was probable that a liability had been incurred by the Company under standby letters of credit that have not yet been funded. The Company had $5.4 million of letters of credit outstanding related to nonaccrual and impaired loans as of December 31, 2010.
18. Derivative Financial Instruments
The Company uses derivative financial instruments to accommodate customer needs and to assist in interest rate risk management. The Company uses interest rate exchange agreements, or swaps, and interest rate corridors to manage the interest rate risk associated with its commercial loan portfolio, brokered CDs and cash flows related to FHLB advances and repurchase agreements. The Company also has interest rate lock commitments and forward loan commitments associated with Cole Taylor Mortgage that are considered derivatives.
An interest rate swap is an agreement in which two parties agree to exchange, at specified intervals, interest payment streams calculated on an agreed-upon notional principal amount with at least one stream based on a specified floating-rate index. An interest rate corridor is an agreement in which one party pays an upfront premium to a second party in exchange for future interest payments based on a notional principal amount and the level of a floating-rate index relative to the pre-determined lower and upper bounds of the interest rate corridor. The net effect of the interest rate corridor, when combined with a floating-rate liability, is to lock in a fixed funding cost when the floating-rate index is between the lower and upper bounds of the interest rate corridor. For all types of these agreements, the notional amount does not represent the direct credit exposure. The Company is exposed to credit-related losses in the event of non-performance by the counterparty on the interest rate exchange or floor or collar payment, but does not anticipate that any counterparty will fail to meet its payment obligation.
121
Table of Contents
The following tables describe the derivative instruments outstanding as of the dates indicated (dollars in thousands):
| As of December 31, 2010 | ||||||||||||||||||||
| Notional Amount |
Strike Rates | Maturity | Balance Sheet/Income Statement Location |
Fair Value | ||||||||||||||||
| (dollars in thousands) | ||||||||||||||||||||
| Fair value hedging derivative instruments: |
||||||||||||||||||||
| Brokered CD interest rate swaps – pay variable/receive fixed |
$ | 57,862 |
|
Receive 2.74% Pay 0.371% |
|
4.5 yrs | |
Other assets/ Noninterest income |
|
$ | 1,714 | |||||||||
| Cash flow hedging derivative instruments: |
||||||||||||||||||||
| Interest rate corridors |
300,000 | 0.29%-1.29 | % | 1.6 yrs | Other assets/OCI | 1,127 | ||||||||||||||
| Total hedging derivative instruments |
357,862 | |||||||||||||||||||
| Non-hedging derivative instruments: |
||||||||||||||||||||
| Customer interest rate swap – pay fixed/receive variable |
232,342 |
|
Pay 3.67% Receive 0.447% |
|
|
Wtd. avg 2.6 yrs |
|
|
Other liabilities/ Noninterest income |
|
(11,630 | ) | ||||||||
| Customer interest rate swap – receive fixed/pay variable |
232,342 |
|
Receive 3.67% Pay 0.447% |
|
|
Wtd. avg 2.6 yrs |
|
|
Other assets/ Noninterest income |
|
11,404 | |||||||||
| Interest rate lock commitments |
129,015 | NA | 0.1 yrs | |
Other assets/ Noninterest income |
|
438 | |||||||||||||
| Forward loan sale commitments |
168,758 | NA | 0.1 yrs | |
Other assets/ Noninterest income |
|
3,611 | |||||||||||||
| Total non-hedging derivative instruments |
762,457 | |||||||||||||||||||
| Total derivative instruments |
$ | 1,120,319 | ||||||||||||||||||
| As of December 31, 2009 | ||||||||||||||||||||
| Notional Amount |
Strike Rates | Maturity | Balance Sheet/Income Statement Location |
Fair Value | ||||||||||||||||
| (dollars in thousands) | ||||||||||||||||||||
| Non-hedging derivative instruments: |
||||||||||||||||||||
| Customer Interest Rate Swap – pay fixed/receive variable |
$ | 188,781 |
|
Pay 4.21% Receive 0.44% |
|
|
Wtd avg. 3.2 years |
|
|
Other liabilities/ Noninterest income |
|
$ | (10,216 | ) | ||||||
| Customer Interest Rate Swap – receive fixed/pay variable |
188,781 |
|
Receive 4.21% Pay 0.44% |
|
|
Wtd avg. 3.2 years |
|
|
Other assets/ Noninterest income |
|
10,090 | |||||||||
| Forward loan sale contracts |
61,090 |
|
Wtd. avg interest rate 5.0% |
|
Jan. 2010 |
|
Other assets/ Noninterest income |
|
540 | |||||||||||
| Total |
$ | 438,652 | ||||||||||||||||||
Derivative Instruments Designated as Hedges:
The Company had derivative instruments with a notional amount of $57.9 million at December 31, 2010, which were designated as fair value hedges against the interest rate risk inherent in certain of its brokered certificates of deposits (“brokered CDs”). The CD swaps are used to convert the fixed rate paid on the brokered CDs to a variable rate based upon 3-month LIBOR computed on the notional amount. The fair value of these hedging derivative instruments is reported on the Consolidated Balance Sheets in other assets and the change in fair value of the related hedged brokered CD is reported as an adjustment to the carrying value of the brokered CDs. Total ineffectiveness on the interest rate swaps was $36,000 for the year ended December 31, 2010 and was recorded in noninterest income.
122
Table of Contents
The Company also entered into $300.0 million of notional amount interest rate corridors during the year ended December 31, 2010, which were designated as cash flow hedges against certain borrowings. The corridors are used to reduce the variability in the interest paid on borrowings attributable to changes in 1-month LIBOR. The fair value of these hedging derivative instruments is reported on the Consolidated Balance Sheets in other assets and the change in fair value is recorded in OCI. Total ineffectiveness on the interest rate corridors was $4,000 for the year ended December 31, 2010 and was recorded in noninterest income.
Non-hedging Derivative Instruments:
In order to accommodate customer borrowing needs, the Company enters into interest rate swap agreements with customers. At the same time, in order to offset the exposure and manage interest rate risk, the Company enters into an interest rate swap with a different counterparty with offsetting terms. These derivative instruments are not designated as accounting hedges and changes in fair value of these instruments, as well as any net cash settlements, are recognized in noninterest income as other derivative income or expense. As of December 31, 2010 and 2009, the Company had notional amounts of $232.3 million and $188.8 million, respectively, of interest rate swaps with customers where the Company has agreed to receive a fixed interest rate and pay a variable interest rate. In addition, as of December 31, 2010 and 2009, the Company has offsetting interest rate swaps with other counterparties with a notional amount of $232.3 million and $188.8 million, respectively, in which the Company has agreed to receive a variable interest rate and pay a fixed interest rate.
The Company enters into interest rate lock and forward loan sale commitments as a normal part of Cole Taylor Mortgage’s business. These non-hedging derivatives are recorded at their fair value on the Consolidated Balance Sheets in other assets with changes in fair value recorded in income currently in noninterest income.
Terminated Derivative Instruments:
In January 2009, the Company terminated a $100.0 million notional amount interest rate swap that was not designated as an accounting hedge. The Company discontinued hedge accounting in December 2008 when it determined that this hedge would no longer be effective. The unrealized gain of $6.4 million upon de-designation, which had accumulated in other comprehensive income (net of tax), is being amortized to loan interest income over what would have been the life of the hedge. From the date of de-designation to December 31, 2008, the change in fair value, along with net settlements attributed to this period, was recorded in other derivative income in noninterest income and totaled $394,000. This derivative was terminated in January 2009 and the Company received a cash payment $6.6 million, which represented the fair value of the swap at the date of termination.
At December 31, 2010 and 2009, the Company had $761,000 and $2.7 million, respectively, in accumulated other comprehensive income related to previously terminated cash flow hedges. The amount in accumulated other comprehensive income represents the net unamortized portion of the deferred gain that had accumulated in other comprehensive income when the hedging relationship was terminated. During 2010 and 2009, $3.2 million and $6.4 million of deferred gains from previously terminated cash flow hedges were amortized as a net increase to loan interest income. During 2011, the Company expects that $1.3 million of the deferred gain will be reclassified into loan interest income.
19. Fair Value of Financial Instruments
On January 1, 2008, the Company adopted FASB ASC 820—Fair Value Measurements and Disclosures. On January 1, 2010, the Company elected to account for all residential mortgage loans originated by Cole Taylor Mortgage and currently held for sale at fair value under the fair value option in accordance with ASC 825— Financial Instruments. The Company has not elected the fair value option for any other financial asset or liability.
123
Table of Contents
Fair Value Measurement
In accordance with FASB ASC 820, the Company groups financial assets and financial liabilities measured at fair value in three levels based on the markets in which the assets and liabilities are traded and the reliability of the assumptions used to determine fair value. These levels are defined as follows.
Level 1 – Quoted prices for identical assets or liabilities in active markets that the entity has the ability to access as of the measurement date.
Level 2 – Significant other observable inputs other than Level 1 prices, such as quoted prices for similar assets or liabilities, quoted prices in markets that are not active, and other inputs that are observable or can be corroborated by observable market data.
Level 3 – Significant unobservable inputs that reflect an entity’s own assumptions about the assumptions that market participants would use in pricing an asset or liability.
The Company used the following methods and significant assumptions to estimate fair values:
Available-for-Sale Investment Securities:
For these securities, the Company obtains fair value measurements from an independent pricing service. The fair value measurements consider observable data that may include dealer quotes, market spreads, cash flows, the U.S. Treasury yield curve, live trading levels, trade execution data, market consensus prepayment speeds, credit information, including credit spreads and current ratings from credit rating agencies and the bond’s terms and conditions, among other things. The Company has determined that these valuations are classified in Level 2 of the fair value hierarchy.
The Company does not have subprime loans in its mortgage related investment securities portfolio. As of December 31, 2010, the Company had $1.16 billion of mortgage related investment securities which consisted of mortgage-backed securities and collateralized mortgage obligations. Of the total mortgage related investment securities, $1.15 billion, or 99.4%, were issued by government sponsored enterprises, such as Ginnie Mae, Fannie Mae, and Freddie Mac. In comparison, of the $1.10 billion of mortgage related investment securities at December 31, 2009, $1.07 billion, or 97.6%, were issued by government sponsored enterprises. The mortgage related portfolio also includes $6.5 million of private-label mortgage related securities at December 31, 2010 that has received heightened monitoring because the Company believes the fair values of these securities have been impacted by illiquidity in the market place. While none of these securities contain subprime mortgage loans, the portfolio does include Alt-A loans, adjustable rate mortgages with initial interest only periods, and loans that are secured by collateral in geographic areas adversely impacted by the housing downturn. While the fair value of these securities has been impacted by market illiquidity, the Company does not modify the fair value determined by the independent pricing service, but takes additional steps to review for other-than-temporary impairment. See Footnote 3—“Investment Securities” for additional details of the evaluation of other-than-temporary impairment.
Assets Held in Employee Deferred Compensation Plans:
Assets held in employee deferred compensation plans are recorded at fair value and included in “other assets” on the Company’s Consolidated Balance Sheets. The assets associated with these plans are primarily invested in mutual funds and classified as Level 1 as the fair value measurement is based upon available quoted prices. The Company also records a liability included in accrued interest, taxes and other liabilities on its Consolidated Balance Sheets for the amount due to employees related to these plans.
Derivatives:
The Company has determined that its derivative instrument valuations, except for the interest rate lock mortgage derivatives, are classified in Level 2 of the fair value hierarchy. The valuation of these instruments is
124
Table of Contents
determined using widely accepted valuation techniques, including discounted cash flow analysis of the expected cash flows of each derivative. This analysis reflects the contractual terms of the derivatives, including the period to maturity, and uses observable market-based inputs, including interest rate curves, and implied volatilities. In accordance with accounting guidance of fair value measurements, the Company incorporates credit valuation adjustments to appropriately reflect both its own nonperformance risk and the respective counterparty’s nonperformance risk in the fair value measurements. In adjusting the fair value of its derivative contracts for the effect of nonperformance risk, the Company has considered the impact of netting and any applicable credit enhancements, such as collateral postings thresholds, mutual puts and guarantees.
Mortgage Derivatives:
Mortgage derivatives include interest rate lock commitments to originate residential mortgage loans held for sale for individual customers and forward commitments to sell residential mortgage loans to various investors. The fair value of forward loan sale commitments is based upon quoted prices for similar assets in active market that the Company has the ability to access and is classified in Level 2 of the hierarchy. The Company uses an internal valuation model to estimate the fair value of its interest rate lock commitments which is based upon unobservable inputs that reflects management’s assumptions and specific information about each borrower transaction and is classified in Level 3 of the hierarchy.
Loans Held for Sale:
At December 31, 2010, loans held for sale included $259.0 million of residential mortgage loans that have been originated by Cole Taylor Mortgage and for which the Company has elected to account for on a recurring basis under the fair value option.
In prior periods, the Company had certain residential mortgage loans that it acquired in a bulk purchase transaction and nonaccrual commercial loans classified as held for sale. These loans were recorded at the lower of cost or fair value and were recorded at fair value on a nonrecurring basis.
For all residential mortgage loans held for sale, the fair value is based on quoted market prices for similar assets in active markets and is classified in Level 2 of the fair value hierarchy. The fair value of the commercial loans was determined based on the estimated net contracted sales price, less cost to sell and was classified in Level 2 of the fair value hierarchy.
Loans:
The Company does not record loans at their fair value on a recurring basis. The Company evaluates certain loans for impairment when it is probable the payment of interest and principal will not be made in accordance with the contractual terms of the loan agreement. Once a loan has been determined to be impaired, it is measured to establish the amount of the impairment, if any, based on the present value of expected future cash flows discounted at the loan’s effective interest rate, except that collateral-dependent loans may be measured for impairment based on the fair value of the collateral, less cost to sell. If the measure of the impaired loan is less than the recorded investment in the loan, a valuation allowance is established. At December 31, 2010, a portion of the Company’s total impaired loans were evaluated based on the fair value of the collateral. In accordance with fair value measurements, only impaired loans for which an allowance for loan loss has been established based on the fair value of collateral require classification in the fair value hierarchy. As a result, a portion, but not all, of the Company’s impaired loans are classified in the fair value hierarchy. When the fair value of the collateral is based on an observable market price or an estimate of fair value from an independent third-party real estate professional, the Company classifies the impaired loan as nonrecurring Level 2 in the fair value hierarchy. When an independent valuation is not available or there is no observable market price and fair value is based upon management’s assessment of the liquidation value of collateral, the Company classifies the impaired loan as nonrecurring Level 3 in the fair value hierarchy.
125
Table of Contents
Other Real Estate Owned and Repossessed Assets:
The Company does not record other real estate owned (“OREO”) and repossessed assets at their fair value on a recurring basis. At foreclosure or obtaining possession of the assets, OREO and repossessed assets are recorded at the lower of the amount of the loan balance or the fair value of the collateral, less estimated costs to sell. Generally, the fair value of real estate is determined through the use of a current appraisal and the fair value of other repossessed assets is based upon the estimated net proceeds from the sale or disposition of the underlying collateral. Only assets that are recorded at fair value, less estimated cost to sell, are classified under the fair value hierarchy. When the fair value of the collateral is based upon an observable market price or an estimate of fair value from an independent third-party real estate professional, the Company classifies the OREO and repossessed asset as nonrecurring Level 2 in the fair value hierarchy. When an independent valuation is not available or there is no observable market price and fair value is based upon management’s assessment of liquidation of collateral, the Company classifies the other real estate owned and repossessed assets as nonrecurring Level 3 in the fair value hierarchy.
Assets and Liabilities Measured on a Recurring Basis
Assets and liabilities measured at fair value on a recurring basis are summarized below.
| As of December 31, 2010 | ||||||||||||||||
| Total Fair Value |
Quoted Prices in Active Markets (Level 1) |
Significant Other Observable Inputs (Level 2) |
Significant Unobservable Inputs (Level 3) |
|||||||||||||
| (in thousands) | ||||||||||||||||
| Assets: |
||||||||||||||||
| Available for sale securities |
$ | 1,153,487 | $ | — | $ | 1,153,487 | $ | — | ||||||||
| Loans held for sale |
259,020 | — | 259,020 | — | ||||||||||||
| Assets held in employee deferred compensation plans |
2,575 | 2,575 | — | — | ||||||||||||
| Derivative instruments |
14,245 | — | 14,245 | — | ||||||||||||
| Mortgage derivative instruments |
4,049 | — | 3,611 | 438 | ||||||||||||
| Liabilities: |
||||||||||||||||
| Derivative instruments |
11,630 | — | 11,630 | — | ||||||||||||
| As of December 31, 2009 | ||||||||||||||||
| Total Fair Value |
Quoted Prices in Active Markets (Level 1) |
Significant Other Observable Inputs (Level 2) |
Significant Unobservable Inputs (Level 3) |
|||||||||||||
| (in thousands) | ||||||||||||||||
| Assets: |
||||||||||||||||
| Available for sale securities |
$ | 1,271,271 | $ | — | $ | 1,271,271 | $ | — | ||||||||
| Assets held in employee deferred compensation plans |
2,461 | 2,461 | — | — | ||||||||||||
| Derivative instruments |
10,630 | — | 10,630 | — | ||||||||||||
| Liabilities: |
||||||||||||||||
| Derivative instruments |
10,216 | — | 10,216 | — | ||||||||||||
126
Table of Contents
The table below includes a rollforward of the Consolidated Balance Sheets amounts for the quarter and year ended December 31, 2010 and 2009 (including the change in fair value) for financial instruments measured on a recurring basis and classified by the Company within Level 3 of the valuation hierarchy.
| For the
Quarter Ended December 31, |
For the
Year Ended December 31, |
|||||||||||||||
| 2010 | 2009 | 2010 | 2009 | |||||||||||||
| (dollars in thousands, except per share amounts) | ||||||||||||||||
| Beginning Balance |
$ | 3,596 | $ | — | $ | — | $ | — | ||||||||
| Realized/unrealized gains/(losses) included in net income (loss) |
— | — | — | — | ||||||||||||
| Purchases, issuances and settlements, net |
(3,158 | ) | — | 438 | — | |||||||||||
| Transfers in and/or out of Level 3 |
— | — | — | — | ||||||||||||
| Fair value at period end |
$ | 438 | $ | — | $ | 438 | $ | — | ||||||||
Assets Measured on a Nonrecurring Basis
Assets measured at fair value on a nonrecurring basis are summarized below. The Company may be required, from time to time, to measure certain other financial assets at fair value on a nonrecurring basis. These assets generally consist of loans considered impaired that may require periodic adjustment to the lower of cost or fair value.
| As of December 31, 2010 | ||||||||||||||||
| Total Fair Value |
Quoted Prices in Active Markets (Level 1) |
Significant Other Observable Inputs (Level 2) |
Significant Unobservable Inputs (Level 3) |
|||||||||||||
| (in thousands) | ||||||||||||||||
| Assets: |
||||||||||||||||
| Held-to-maturity securities |
$ | 101,751 | $ | — | $ | 101,751 | $ | — | ||||||||
| Loans |
76,546 | — | 51,100 | 25,446 | ||||||||||||
| Other real estate and repossessed assets |
25,590 | — | 4,521 | 21,069 | ||||||||||||
| As of December 31, 2009 | ||||||||||||||||
| Total Fair Value |
Quoted Prices in Active Markets (Level 1) |
Significant Other Observable Inputs (Level 2) |
Significant Unobservable Inputs (Level 3) |
|||||||||||||
| (in thousands) | ||||||||||||||||
| Assets: |
||||||||||||||||
| Loans and loans held for sale |
$ | 83,868 | $ | — | $ | 68,269 | $ | 15,599 | ||||||||
| Other real estate and repossessed assets |
18,064 | — | 7,725 | 10,339 | ||||||||||||
At December 31, 2010, the Company had $25.4 million of impaired loans and $21.1 million of OREO and repossessed assets measured at fair value on a nonrecurring basis and classified in Level 3 in the fair value hierarchy. The change in Level 3 carrying value of impaired loans represents sales, payments or net chargeoffs of $11.4 million, nine additional impaired loans with fair value of $21.2 million and the related charge to earnings of $32.0 million to reduce these loans to fair value. The change in Level 3 OREO and repossessed assets during the year ended December 31, 2010 included $25.2 million of additions, $11.1 million of sales and $3.4 million of net writedowns that were included in the Consolidated Results of Operations.
At December 31, 2009, the Company had $15.6 million of impaired loans and $10.3 million of other real estate and repossessed assets measured at fair value on a nonrecurring basis and classified in Level 3 in the fair value hierarchy. The carrying value of the impaired loans totaled $24.5 million and was written down to fair
127
Table of Contents
value of $15.6 million through a provision for loan loss of $8.9 million which was included in earnings in 2009. The carrying value of the other real estate and repossessed assets totaled $16.2 million and was written down to fair value of $10.3 million, resulting in a loss of $5.9 million which was included in earnings in 2009.
Fair Value of Financial Instruments
The Company is required to provide certain disclosures of the estimated fair value of its financial instruments. A portion of the Company’s assets and liabilities are considered financial instruments. Many of the Company’s financial instruments, however, lack an available, or readily determinable, trading market as characterized by a willing buyer and willing seller engaging in an exchange transaction. The Company can use significant estimations and present value calculations for the purposes of estimating fair values. Accordingly, fair values are based on various factors relative to current economic conditions, risk characteristics, and other factors. The assumptions and estimates used in the fair value determination process are subjective in nature and involve uncertainties and significant judgment and, therefore, fair values cannot be determined with precision. Changes in assumptions could significantly affect these estimated values.
The methods and assumptions used to determine fair values for each significant class of financial instruments are presented below:
Cash and Cash Equivalents:
The carrying amount of cash, due from banks, interest-bearing deposits with banks or other financial institutions, federal funds sold, and securities purchased under agreement to resell with original maturities less than 90 days approximate fair value since their maturities are short-term.
Investment Securities:
The fair value measurements of investment securities consider observable data that may include dealer quotes, market spreads, cash flows, the U.S. Treasury yield curve, live trading levels, trade execution data, market consensus prepayment speeds, credit information, including credit spreads and current ratings from credit rating agencies and the bond’s terms and conditions, among other things.
Loans Held For Sale:
For commercial loans held for sale, the fair value has been determined based upon the estimated net contracted sales prices, less cost to sell. For the residential mortgage loans held for sale, the fair value has been determined based upon quoted market prices for similar assets in active markets.
Loans:
The fair values of loans have been estimated by the present value of future cash flows, using current rates at which similar loans would be made to borrowers with the same remaining maturities, less a valuation adjustment for general portfolio risks. This method of estimating fair value does not incorporate the exit price concept of fair value prescribed by ASC “Fair Value Measurements and Disclosures, (Topic 820).” Certain loans are accounted for at fair value when it is probable the payment of interest and principal will not be made in accordance with the contractual terms and impairment exists. In these cases, the fair value is determined based on the present value of expected future cash flows discounted at the loan’s effective interest rate, except that collateral-dependent loans may be measured for impairment based on the fair value of the collateral, less cost to sell.
Investment in FHLB and Federal Reserve Bank Stock:
The fair value of these investments in FHLB and Federal Reserve Bank stock equals its book value as these stocks can only be sold back to the FHLB, Federal Reserve Bank, or other member banks at their par value per share.
128
Table of Contents
Accrued Interest Receivable:
The carrying amount of accrued interest receivable approximates fair value since its maturity is short-term.
Derivative Financial Instruments:
The carrying amount and fair value of derivative financial instruments, such as interest rate swap, floors, collars, and corridors are based on independent valuation models, which use widely accepted valuation techniques, including discounted cash flow analysis on the expected cash flows of each derivative. This analysis reflects the contractual terms of the derivatives, including the period to maturity, and uses observable market-based inputs, including interest rate curves and implied volatilities. The Company incorporates credit valuation adjustments to appropriately reflect both its own nonperformance risk and the respective counterparty’s nonperformance risk in the fair value measurements. In adjusting the fair value of its derivative contracts for the effect of nonperformance risk, the Company has considered the impact of netting and any applicable credit enhancements, such as collateral posting thresholds, mutual puts and guarantees. The Company also has derivative financial instruments associated with Cole Taylor Mortgage including forward loan sale and interest rate lock commitments. The fair value of the forward loan sale commitments is based on quoted market prices for similar assets in active markets. The fair value of interest rate lock commitments is determined based on an internal valuation model using management assumptions and rate and pricing information from each loan commitment transaction. On the Company’s Consolidated Balance Sheets, instruments that have a positive fair value are included in other assets and those instruments that have a negative fair value are included in accrued interest, taxes and other liabilities.
Other Assets:
Financial instruments in other assets consist of assets in the Company’s nonqualified deferred compensation plan. The carrying value of these assets approximates their fair value and is based upon quoted market prices.
Deposit Liabilities:
Deposit liabilities with stated maturities have been valued at the present value of future cash flows using rates which approximate current market rates for similar instruments; unless this calculation results in a present value which is less than the book value of the reflected deposit, in which case the book value would be utilized as an estimate of fair value. Fair values of deposits without stated maturities equal the respective amounts due on demand.
Other Borrowings:
The carrying amount of overnight securities sold under agreements to repurchase, federal funds purchased, and the U.S. Treasury tax and loan note option, approximates fair value, as the maturities of these borrowings are short-term. Securities sold under agreements to repurchase with original maturities over one year have been valued at the present values of future cash flows using rates which approximate current market rates for instruments of like maturities.
Notes Payable and Other Advances:
Notes payable and other advances have been valued at the present value of estimated future cash flows using rates which approximate current market rates for instruments of like maturities.
Accrued Interest Payable:
The carrying amount of accrued interest payable approximates fair value since its maturity is short-term.
Junior Subordinated Debentures:
The fair value of the fixed rate junior subordinated debentures issued to TAYC Capital Trust I is computed based upon the publicly quoted market prices of the underlying trust preferred securities issued by the Trust. The
129
Table of Contents
fair value of the floating rate junior subordinated debentures issued to TAYC Capital Trust II has been valued at the present value of estimated future cash flows using current market rates and credit spreads for an instrument with a like maturity.
Subordinated Notes:
The subordinated notes issued by the Bank in 2008 and by the Company in 2010, have been valued at the present value of estimated future cash flows using current market rates and credit spreads for an instrument with a like maturity.
Off-Balance Sheet Financial Instruments:
The fair value of commercial loan commitments to extend credit is not material as they are predominantly floating rate, subject to material adverse change clauses, cancelable and not readily marketable. The carrying value and the fair value of standby letters of credit represent the unamortized portion of the fee paid by the customer. A reserve for unfunded commitments is established if it is probable that a liability has been incurred by the Company under a standby letter of credit or a loan commitment that has not yet been funded.
The estimated fair values of the Company’s financial instruments are as follows:
| December 31, 2010 | December 31, 2009 | |||||||||||||||
| Carrying Value |
Fair Value | Carrying Value |
Fair Value | |||||||||||||
| (in thousands) | ||||||||||||||||
| Financial Assets: |
||||||||||||||||
| Cash and cash equivalents |
$ | 81,329 | $ | 81,329 | $ | 48,469 | $ | 48,469 | ||||||||
| Available-for-sale investments |
1,153,487 | 1,153,487 | 1,271,271 | 1,271,271 | ||||||||||||
| Held-to-maturity investments |
100,990 | 101,751 | — | — | ||||||||||||
| Loans held for sale |
259,020 | 259,020 | 81,853 | 82,104 | ||||||||||||
| Loans, net of allowance |
2,710,770 | 2,704,051 | 2,847,290 | 2,799,863 | ||||||||||||
| Investment in FHLB and Federal Reserve Bank stock |
40,032 | 40,032 | 31,210 | 31,210 | ||||||||||||
| Accrued interest receivable |
15,707 | 15,707 | 16,653 | 16,653 | ||||||||||||
| Derivative financial instruments |
18,294 | 18,294 | 10,630 | 10,630 | ||||||||||||
| Other assets |
2,575 | 2,575 | 2,461 | 2,461 | ||||||||||||
| Total financial assets |
$ | 4,382,204 | $ | 4,376,246 | $ | 4,309,837 | $ | 4,262,661 | ||||||||
| Financial Liabilities: |
||||||||||||||||
| Deposits without stated maturities |
$ | 1,509,151 | $ | 1,509,151 | $ | 1,453,069 | $ | 1,453,069 | ||||||||
| Deposits with stated maturities |
1,517,755 | 1,540,863 | 1,523,731 | 1,554,230 | ||||||||||||
| Other borrowings |
511,008 | 520,202 | 337,669 | 352,352 | ||||||||||||
| Notes payable and other advances |
505,000 | 507,607 | 627,000 | 630,709 | ||||||||||||
| Accrued interest payable |
8,318 | 8,318 | 11,457 | 11,457 | ||||||||||||
| Derivative financial instruments |
11,630 | 11,630 | 10,216 | 10,216 | ||||||||||||
| Junior subordinated debentures |
86,607 | 62,254 | 86,607 | 50,583 | ||||||||||||
| Subordinated notes, net |
88,835 | 82,649 | 55,695 | 53,792 | ||||||||||||
| Total financial liabilities |
$ | 4,238,304 | $ | 4,242,674 | $ | 4,105,444 | $ | 4,116,408 | ||||||||
| Off-Balance-Sheet Financial Instruments: |
||||||||||||||||
| Unfunded commitments to extend credit |
$ | 5,417 | $ | 5,417 | $ | 3,485 | $ | 3,485 | ||||||||
| Standby letters of credit |
348 | 348 | 307 | 307 | ||||||||||||
| Total off-balance-sheet financial instruments |
$ | 5,765 | $ | 5,765 | $ | 3,792 | $ | 3,792 | ||||||||
130
Table of Contents
The remaining balance sheet assets and liabilities of the Company are not considered financial instruments and have not been valued differently than is required under historical cost accounting. Since assets and liabilities that are not financial instruments are excluded above, the difference between total financial assets and financial liabilities does not, nor is it intended to, represent the market value of the Company. Furthermore, the estimated fair value information may not be comparable between financial institutions due to the wide range of valuation techniques permitted, and assumptions necessitated, in the absence of an available trading market.
20. Litigation
The Company is, from time to time, a party to litigation arising in the normal course of business. Management knows of no threatened or pending legal actions against the Company that are likely to have a material adverse impact on its business, financial condition, liquidity or operating results.
21. Parent Company Only Financial Statements
Summarized financial information of Taylor Capital Group, Inc. is as follows:
BALANCE SHEETS
(in thousands)
| December 31, | ||||||||
| 2010 | 2009 | |||||||
| ASSETS | ||||||||
| Deposits with bank subsidiary |
$ | 23,106 | $ | 45,879 | ||||
| Investment in bank subsidiary |
291,684 | 305,536 | ||||||
| Investment in non-bank subsidiaries |
2,611 | 2,614 | ||||||
| Other assets |
12,048 | 4,697 | ||||||
| Total assets |
$ | 329,449 | $ | 358,726 | ||||
| LIABILITIES AND STOCKHOLDERS’ EQUITY | ||||||||
| Accrued interest, taxes and other liabilities |
$ | 1,343 | $ | 1,313 | ||||
| Notes payable |
— | 12,000 | ||||||
| Junior subordinated debentures |
86,607 | 86,607 | ||||||
| Subordinated notes, net |
32,698 | — | ||||||
| Stockholders’ equity |
208,801 | 258,806 | ||||||
| Total liabilities and stockholders’ equity |
$ | 329,449 | $ | 358,726 | ||||
131
Table of Contents
STATEMENTS OF OPERATIONS
(in thousands)
| For the Years
Ended December 31, |
||||||||||||
| 2010 | 2009 | 2008 | ||||||||||
| Income: |
||||||||||||
| Interest on deposits with subsidiary bank |
$ | 560 | $ | 896 | $ | — | ||||||
| Dividends from non-bank subsidiary |
171 | 180 | 209 | |||||||||
| Total income |
731 | 1,076 | 209 | |||||||||
| Expenses: |
||||||||||||
| Interest |
7,807 | 6,610 | 7,270 | |||||||||
| Salaries and employee benefits |
87 | 139 | 1,457 | |||||||||
| Legal fees, net |
234 | 410 | 920 | |||||||||
| Other |
1,706 | 1,693 | 1,193 | |||||||||
| Total expenses |
9,834 | 8,852 | 10,840 | |||||||||
| Loss before income taxes and equity in undistributed net loss of subsidiaries |
(9,103 | ) | (7,776 | ) | (10,631 | ) | ||||||
| Income tax benefit |
3 | 204 | 3,301 | |||||||||
| Equity in undistributed net loss of subsidiaries |
(44,723 | ) | (23,978 | ) | (117,198 | ) | ||||||
| Net loss |
$ | (53,823 | ) | $ | (31,550 | ) | $ | (124,528 | ) | |||
STATEMENTS OF CASH FLOWS
(in thousands)
| For the Years Ended December 31, |
||||||||||||
| 2010 | 2009 | 2008 | ||||||||||
| Cash flows from operating activities: |
||||||||||||
| Net loss |
$ | (53,823 | ) | $ | (31,550 | ) | $ | (124,528 | ) | |||
| Adjustments to reconcile net loss to net cash used in operating activities: |
||||||||||||
| Amortization of stock-based compensation |
87 | 130 | 440 | |||||||||
| Equity in undistributed net loss of subsidiary |
44,723 | 23,978 | 117,198 | |||||||||
| Gain on sale of other real estate |
(338 | ) | — | — | ||||||||
| Other, net |
— | (16 | ) | (16 | ) | |||||||
| Changes in assets and liabilities: |
||||||||||||
| Other assets |
(450 | ) | 3,289 | (1,399 | ) | |||||||
| Other liabilities |
652 | (1,063 | ) | (392 | ) | |||||||
| Net cash used in operating activities |
(9,149 | ) | (5,232 | ) | (8,697 | ) | ||||||
| Cash flows from investing activities: |
||||||||||||
| Capital contributed to subsidiary bank |
(60,000 | ) | (15,000 | ) | (107,491 | ) | ||||||
| Purchase of foreclosed property |
(11,117 | ) | — | — | ||||||||
| Proceeds from sale of foreclosed property |
4,498 | — | — | |||||||||
| Other, net |
57 | (178 | ) | (266 | ) | |||||||
| Net cash used in investing activities |
(66,562 | ) | (15,178 | ) | (107,757 | ) | ||||||
| Cash flows from financing activities: |
||||||||||||
| Proceeds from notes payable |
— | — | 12,000 | |||||||||
| Repayments of notes payable |
(12,000 | ) | — | — | ||||||||
| Dividends paid |
(8,613 | ) | (10,166 | ) | (2,136 | ) | ||||||
| Proceeds from the issuance of preferred stock, net |
36,245 | (27 | ) | 161,068 | ||||||||
| Proceeds from the issuance of common stock, net |
(21 | ) | — | — | ||||||||
| Net proceeds from the issuance of subordinated notes |
37,322 | — | — | |||||||||
| Proceeds from the exercise of employee stock options |
5 | — | 30 | |||||||||
| Net cash provided by (used in) financing activities |
52,938 | (10,193 | ) | 170,962 | ||||||||
| Net increase (decrease) in cash and cash equivalents |
(22,773 | ) | (30,603 | ) | 54,508 | |||||||
| Cash and cash equivalents, beginning of year |
45,879 | 76,482 | 21,974 | |||||||||
| Cash and cash equivalents, end of year |
$ | 23,106 | $ | 45,879 | $ | 76,482 | ||||||
132
Table of Contents
22. Other Comprehensive Income (Loss)
The following table presents other comprehensive income (loss) for the years ended December 31, 2010, 2009, and 2008:
| Before Tax Amount |
Tax Effect |
Net of Tax |
||||||||||
| (in thousands) | ||||||||||||
| Year ended December 31, 2008: |
||||||||||||
| Unrealized gains from securities: |
||||||||||||
| Change in unrealized gains and losses on available-for-sale securities |
$ | 14,405 | $ | (5,712 | ) | $ | 8,693 | |||||
| Add: reclassification adjustment for losses included in net income (loss) |
2,399 | (950 | ) | 1,449 | ||||||||
| Change in unrealized gains and losses on available for sale securities, net of reclassification adjustment |
16,804 | (6,662 | ) | 10,142 | ||||||||
| Change in net unrealized gains from cash flow hedging instruments |
6,408 | (2,540 | ) | 3,868 | ||||||||
| Change in deferred gains and losses from termination of cash flow hedging instruments |
(2,815 | ) | 1,097 | (1,718 | ) | |||||||
| Other comprehensive income |
$ | 20,397 | $ | (8,105 | ) | $ | 12,292 | |||||
| Year ended December 31, 2009: |
||||||||||||
| Unrealized gains from securities: |
||||||||||||
| Change in unrealized gains and losses on available-for-sale securities |
$ | 11,666 | $ | (6,157 | ) | $ | 5,509 | |||||
| Less: reclassification adjustment for gains included in net income (loss) |
(17,595 | ) | 6,971 | (10,624 | ) | |||||||
| Change in unrealized gains and losses on available-for-sale securities |
(5,929 | ) | 814 | (5,115 | ) | |||||||
| Change in deferred gains and losses from termination of cash flow hedging instruments |
(6,404 | ) | 2,539 | (3,865 | ) | |||||||
| Other comprehensive loss |
$ | (12,333 | ) | $ | 3,353 | $ | (8,980 | ) | ||||
| Year ended December 31, 2010: |
||||||||||||
| Unrealized gains from securities: |
||||||||||||
| Change in unrealized gains and losses on available-for-sale securities |
$ | 7,558 | $ | (9,521 | ) | $ | (1,963 | ) | ||||
| Less: reclassification adjustment for gains included in net income (loss) |
(41,376 | ) | 16,393 | (24,983 | ) | |||||||
| Change in unrealized gains and losses on available-for-sale securities, net of reclassification adjustment |
(33,818 | ) | 6,872 | (26,946 | ) | |||||||
| Changes in deferred loss on investments transferred to held-to-maturity from available-for-sale |
(456 | ) | 181 | (275 | ) | |||||||
| Change in net unrealized loss from cash flow hedging instruments |
(2,888 | ) | 819 | (2,069 | ) | |||||||
| Changes in deferred gains and losses from termination of cash flow hedging instruments |
(3,159 | ) | 1,255 | (1,904 | ) | |||||||
| Other comprehensive loss |
$ | (40,321 | ) | $ | 9,127 | $ | (31,194 | ) | ||||
The tax effects of changes in the beginning of the year deferred tax asset valuation allowance solely attributable to identifiable events recorded in other comprehensive income, primarily changes in unrealized gains on the available-for-sale investment portfolio, were allocated to other comprehensive income in accordance with general accepted accounting principals.
23. Earnings Per Share
The following table sets forth the computation of basic and diluted earnings (loss) per common share. Due to the net loss for the years ended December 31, 2010, 2009 and 2008, all common stock equivalents were considered antidilutive and were not included in the computation of diluted earnings per share. At December 31,
133
Table of Contents
2010, the common stock equivalents consisted of 910,103 stock options outstanding to purchase shares of common stock, 3,800,147 warrants to purchase shares of common stock, convertible Series C preferred stock which could be converted into 2,598,697 shares of common, convertible Series D preferred stock which could be converted into 405,330 shares of common stock and convertible Series E preferred stock which could be converted into 455,049 shares of common stock. At December 31, 2009, the common stock equivalents consisted of 813,099 stock options outstanding to purchase shares of common stock, 2,862,647 warrants to purchase shares of common stock, and the convertible Series A preferred stock which could be converted into 6,000,000 shares of common stock. At December 31, 2008 common stock equivalents consisted of 716,642 stock options outstanding to purchase shares of common stock, 2,862,647 warrants to purchase shares of common stock, and the convertible Series A preferred stock which could be converted into 6,000,000 shares of common stock.
| For the Years Ended December 31, | ||||||||||||
| 2010 | 2009 | 2008 | ||||||||||
| (dollars in thousands, except per share amounts) | ||||||||||||
| Basic: |
||||||||||||
| Net loss applicable to common stockholders |
$ | (79,278 | ) | $ | (43,033 | ) | $ | (143,358 | ) | |||
| Weighted average common shares outstanding |
15,049,868 | 10,492,911 | 10,450,177 | |||||||||
| Basic loss per share |
$ | (5.27 | ) | $ | (4.10 | ) | $ | (13.72 | ) | |||
| Diluted: |
||||||||||||
| Net loss applicable to common stockholders |
$ | (79,278 | ) | $ | (43,033 | ) | $ | (143,358 | ) | |||
| Weighted average common shares outstanding |
15,049,868 | 10,492,911 | 10,450,177 | |||||||||
| Diluted impact of common stock equivalents |
— | — | — | |||||||||
| Diluted weighted average common shares outstanding |
15,049,868 | 10,492,911 | 10,450,177 | |||||||||
| Diluted loss per share |
$ | (5.27 | ) | $ | (4.10 | ) | $ | (13.72 | ) | |||
24. Subsequent Events
Events subsequent to the balance sheet date of December 31, 2010 have been evaluated for potential recognition or disclosure in these financial statements that would provide additional evidence about conditions that existed at the date of the balance sheet, including the estimates inherent in the process of preparing the financial statements. The Company has determined that there was no additional evidence about conditions that existed at the date of the balance sheet or any new nonrecognized subsequent event, other than the issuance of Series F Preferred Stock described below, that would need to be disclosed to keep the financial statements from being misleading through the date these financial statements were filed.
On January 28, 2011 the Company entered into subscription agreements with respect to the sale of $25 million of a new series of preferred stock in a private placement. The Company has agreed to sell a total of 1,000,000 shares of the Company’s 8% Non-Cumulative, Non-Voting, Contingent Convertible Preferred Stock, Series F. Upon stockholder approval, the preferred stock will automatically convert into shares of the Company’s common stock (or in the case of certain investors, non-voting common stock equivalents) at a conversion price of $10.00 per share.
134
Table of Contents
Item 9. Changes in and Disagreements with Accountants on Accounting and Financial Disclosure
None.
Item 9A. Controls and Procedures
Conclusion Regarding the Effectiveness of Disclosure Controls and Procedures
Under the supervision and with the participation of our management, including our Chief Executive Officer and Chief Financial Officer, we conducted an evaluation of our disclosure controls and procedures, as such term is defined in Rules 13a-15(e) and 15d-15(e) under the Securities Exchange Act of 1934. Based on this evaluation, our Chief Executive Officer and Chief Financial Officer concluded that our disclosure controls and procedures were effective as of December 31, 2010.
Management’s Report on Internal Control Over Financial Reporting
Our management is responsible for establishing and maintaining adequate internal control over financial reporting, as such term is defined in Exchange Act Rules 13a-15(f) and 15d-15(f). Under the supervision and with the participation of our management, including our Chief Executive Officer and Chief Financial Officer, we conducted an evaluation of the effectiveness of our internal control over financial reporting as of December 31, 2010, based on the criteria established in Internal Control—Integrated Framework issued by the Committee of Sponsoring Organizations of the Treadway Commission (COSO). Based on our evaluation under the criteria established in Internal Control—Integrated Framework, our management concluded that our internal control over financial reporting was effective as of December 31, 2010.
Our management’s assessment of the effectiveness of our internal control over financial reporting as of December 31, 2010 has been audited by KPMG LLP, an independent registered public accounting firm. KPMG’s attestation report, which expresses an unqualified opinion on the effectiveness of our internal control over financial reporting, follows.
Changes in Internal Control Over Financial Reporting
There were no changes in our internal control over financial reporting that occurred during the quarter-ended December 31, 2010 that have materially affected, or are reasonably likely to materially affect, our internal controls over financial reporting.
135
Table of Contents
Report of Independent Registered Public Accounting Firm
To the Stockholders and Board of Directors of Taylor Capital Group, Inc.:
We have audited Taylor Capital Group, Inc.’s internal control over financial reporting as of December 31, 2010, based on criteria established in Internal Control—Integrated Framework issued by the Committee of Sponsoring Organizations of the Treadway Commission (COSO). Taylor Capital Group, Inc.’s management is responsible for maintaining effective internal control over financial reporting and for its assessment of the effectiveness of internal control over financial reporting, included in the accompanying Management’s Report on Internal Controls over Financial Reporting. Our responsibility is to express an opinion on Taylor Capital Group, Inc.’s internal control over financial reporting based on our audit.
We conducted our audit in accordance with the standards of the Public Company Accounting Oversight Board (United States). Those standards require that we plan and perform the audit to obtain reasonable assurance about whether effective internal control over financial reporting was maintained in all material respects. Our audit included obtaining an understanding of internal control over financial reporting, assessing the risk that a material weakness exists, and testing and evaluating the design and operating effectiveness of internal control, based on the assessed risk. Our audit also included performing such other procedures as we considered necessary in the circumstances. We believe that our audit provides a reasonable basis for our opinion.
A company’s internal control over financial reporting is a process designed to provide reasonable assurance regarding the reliability of financial reporting and the preparation of financial statements for external purposes in accordance with generally accepted accounting principles. A company’s internal control over financial reporting includes those policies and procedures that (1) pertain to the maintenance of records that, in reasonable detail, accurately and fairly reflect the transactions and dispositions of the assets of the company; (2) provide reasonable assurance that transactions are recorded as necessary to permit preparation of financial statements in accordance with generally accepted accounting principles, and that receipts and expenditures of the company are being made only in accordance with authorizations of management and directors of the company; and (3) provide reasonable assurance regarding prevention or timely detection of unauthorized acquisition, use, or disposition of the company’s assets that could have a material effect on the financial statements.
Because of its inherent limitations, internal control over financial reporting may not prevent or detect misstatements. Also, projections of any evaluation of effectiveness to future periods are subject to the risk that controls may become inadequate because of changes in conditions, or that the degree of compliance with the policies or procedures may deteriorate.
In our opinion, Taylor Capital Group, Inc. maintained, in all material respects, effective internal control over financial reporting as of December 31, 2010, based on criteria established in Internal Control—Integrated Framework issued by Committee of Sponsoring Organizations of the Treadway Commission (COSO).
We also have audited, in accordance with the standards of the Public Company Accounting Oversight Board (United States), the consolidated balance sheets of Taylor Capital Group, Inc. and subsidiaries as of December 31, 2010 and 2009, and the related consolidated statements of operations, changes in stockholders’ equity, and cash flows for each of the years in the three-year period ended December 31, 2010, and our report dated March 22, 2011 expressed an unqualified opinion on those consolidated financial statements.
March 22, 2011
Chicago, Illinois
None.
136
Table of Contents
TAYLOR CAPITAL GROUP, INC.
PART III
Item 10. Directors, Executive Officers and Corporate Governance
Information required by this item is incorporated herein by reference to our definitive Proxy Statement for the Annual Meeting of Stockholders to be held on or about May 12, 2011.
Item 11. Executive Compensation
Information required by this item is incorporated herein by reference to our definitive Proxy Statement for the Annual Meeting of Stockholders to be held on or about May 12, 2011.
Item 12. Security Ownership of Certain Beneficial Owners and Management and Related Stockholder Matters
Information required by this item is incorporated herein by reference to our definitive Proxy Statement for the Annual Meeting of Stockholders to be held on or about May 12, 2011.
Item 13. Certain Relationships and Related Transactions, and Director Independence
Information required by this item is incorporated herein by reference to our definitive Proxy Statement for the Annual Meeting of Stockholders to be held on or about May 12, 2011.
Item 14. Principal Accountant Fees and Services
Information required by this item is incorporated herein by reference to our definitive Proxy Statement for the Annual Meeting of Stockholders to be held on or about May 12, 2011.
137
Table of Contents
TAYLOR CAPITAL GROUP, INC.
PART IV
Item 15. Exhibits, Financial Statement Schedules
| (a)(1) Financial Statements |
| See Part II—Item 8. Financial Statements and Supplementary Data |
| (a)(2) Financial Statement Schedules |
| Schedules have been omitted because the information required to be shown in the schedules is not applicable or is included elsewhere in our financial statements or accompanying notes. |
| (a)(3) Exhibits: |
EXHIBIT INDEX
| Exhibit Number |
Description of Exhibits | |||
| 3.1 | Form of Third Amended and Restated Certificate of Incorporation of Taylor Capital Group, Inc. (incorporated by reference to Appendix A of the Company’s Definitive Proxy Statement filed September 15, 2008). | |||
| 3.2 | Form of Third Amended and Restated Bylaws of Taylor Capital Group, Inc. (incorporated by reference to Appendix B of the Company’s Definitive Proxy Statement filed September 15, 2008). | |||
| 3.3 | Certificate of Designations of Fixed Rate Cumulative Perpetual Preferred Stock, Series B, dated November 19, 2008 (incorporated by reference to Exhibit 3.1 of the Company’s Current Report on Form 8-K filed November 24, 2008). | |||
| 3.4 | Certificate of Designations of 8% Non-Cumulative, Convertible Perpetual Preferred Stock, Series C of Taylor Capital Group, Inc., dated May 28, 2010 (incorporated by reference to Exhibit 10.7 of the Company’s Current Report on Form 8-K filed June 1, 2010). | |||
| 3.5 | Certificate of Designations of Nonvoting Convertible Preferred Stock, Series D and 8% Nonvoting, Non-Cumulative, Convertible Perpetual Preferred Stock, Series E of Taylor Capital Group, Inc. dated October 21, 2010 (incorporated by reference to Exhibit 3.1 of the Company’s Current Report on Form 8-K filed October 28, 2010). | |||
| 4 | Certain instruments defining the rights of the holders of long-term debt of the Company and certain of its subsidiaries, none of which authorize a total amount of indebtedness in excess of 10% of the total assets of the Company and its subsidiaries on a consolidated basis, have not been filed as exhibits. The Company hereby agrees to furnish a copy of any of these agreements to the SEC upon request. | |||
| 4.1 | Form of certificate representing Taylor Capital Group, Inc. common stock (incorporated by reference to Exhibit 4.3 of the Company’s Amended Registration Statement on Form S-1/A filed October 1, 2002 (Registration No. 333-89158)). | |||
| 4.2 | Form of Warrant issued by Taylor Capital Group, Inc. to Financial Investments Corporation (incorporated by reference to Exhibit 10.2 of the Company’s Current Report on Form 8-K filed September 5, 2008). | |||
| 4.3 | Form of Registration Rights Agreement by and among Taylor Capital Group, Inc., the parties listed on Exhibit A and Exhibit B attached thereto and Financial Investments Corporation (incorporated by reference to Exhibit 10.2 of the Company’s Current Report on Form 8-K filed September 5, 2008). | |||
138
Table of Contents
| Exhibit Number |
Description of Exhibits | |||
| 4.4 | Form of Stock Purchase Warrant issued by Taylor Capital Group, Inc. (incorporated by reference to Appendix F of the Company’s Definitive Proxy Statement filed September 15, 2008). | |||
| 4.5 | Warrant, dated November 21, 2008, issued by Taylor Capital Group, Inc. (incorporated by reference to Exhibit 4.1 of the Company’s Current Report on Form 8-K filed November 24, 2008). | |||
| 4.6 | Form of Registration Rights Agreement, dated May 28, 2010, between Taylor Capital Group, Inc. and the holders party thereto (incorporated by reference to Exhibit 10.1 of the Company’s Current Report on Form 8-K filed May 25, 2010). | |||
| 4.7 | Form of Warrant issued by Taylor Capital Group, Inc. to the investors listed on the Schedule of Subdebt Buyers attached to the Securities Purchase Agreement dated May 21, 2010 (incorporated by reference to Exhibit 10.6 of the Company’s Current Report on Form 8-K filed June 2, 2010). | |||
| 4.8 | Warrant, dated October 21, 2010, issued by Taylor Capital Group, Inc. to Prairie Capital IV, L.P. (incorporated by reference to Exhibit 4.1 of the Company’s Quarterly Report on Form 10-Q filed November 12, 2010). | |||
| 4.9 | Warrant, dated October 21, 2010, issued by Taylor Capital Group, Inc. to Prairie Capital IV QP, L.P. (incorporated by reference to Exhibit 4.2 of the Company’s Current Report on Form 10-Q filed November 12, 2010). | |||
| 4.10 | Registration Rights Agreement, dated October 21, 2010, between Taylor Capital Group, Inc. and the holders party thereto (incorporated by reference to Exhibit 10.2 of the Company’s Quarterly Report on Form 10-Q filed on November 12, 2010). | |||
| 9.1 | Voting Trust Agreement, dated November 30, 1998, by and between the Depositors and Trustees as set forth therein (incorporated by reference to Exhibit 9.1 of the Company’s Registration Statement on Form S-1 filed May 24, 2002 (Registration No. 333-89158)). | |||
| 9.2 | Amendment Number One of Voting Trust Agreement, dated December 1, 1999, by and between the Depositors and Trustees as set forth therein (incorporated by reference to Exhibit 9.2 of the Company’s Amended Registration Statement on Form S-1/A filed September 16, 2002 (Registration No. 333-89158)). | |||
| 9.3 | Amendment Number Two of Voting Trust Agreement, dated June 1, 2002, by and between the Depositors and Trustees as set forth therein (incorporated by reference to Exhibit 9.3 of the Company’s Amended Registration Statement on Form S-1/A filed September 16, 2002 (Registration No. 333-89158)). | |||
| 9.4 | Share Restriction Agreement, dated November 30, 1998, by and among the Principal Stockholders (as defined therein) and Taylor Capital Group, Inc. (incorporated by reference to Exhibit 10.54 of the Company’s Amended Registration Statement on Form S-1/A filed September 16, 2002 (Registration No. 333-89158)). | |||
| 9.5 | Amendment Number One of Share Restriction Agreement, dated December 1, 1999, by and among the Principal Stockholders (as defined therein) and Taylor Capital Group, Inc. (incorporated by reference to Exhibit 10.55 of the Company’s Amended Registration Statement on Form S-1/A filed September 16, 2002 (Registration No. 333-89158)). | |||
| 10.1 | Taylor Capital Group, Inc. Deferred Compensation Plan effective December 30, 2008. (incorporated by reference to Exhibit 10.1 of the Company’s Annual Report on Form 10-K filed on March 11, 2009).+ | |||
139
Table of Contents
| Exhibit Number |
Description of Exhibits | |||
| 10.2 | Trust Under Taylor Capital Group, Inc. Deferred Compensation Plan, dated April 1, 2001. (incorporated by reference to Exhibit 10.17 of the Company’s Registration Statement on Form S-1 filed May 24, 2002 (Registration No. 333-89158)).+ | |||
| 10.3 | Taylor Capital Group, Inc. 2002 Incentive Compensation Plan, as amended and restated (incorporated by reference to Appendix A of the Company’s Definitive Proxy Statement filed April 29, 2008).+ | |||
| 10.4 | Pointe O’Hare Office Lease, between Orix O’Hare II Inc. and Cole Taylor Bank, dated March 5, 2003 (incorporated by reference to Exhibit 10.66 of the Company’s Annual Report on Form 10-K filed March 21, 2003). | |||
| 10.5 | Taylor Capital Group, Inc. Incentive Bonus Plan—Long Term Incentive Plan (incorporated by reference to Exhibit 10.68 of the Company’s Quarterly Report on Form 10-Q filed May 14, 2003).+ | |||
| 10.6 | Form of Non-Employee Director Restricted Stock Award (incorporated by reference to Exhibit 10.38 of the Company’s Annual Report on Form 10-K filed March 10, 2005).+ | |||
| 10.7 | Form of Officer and Employee Restricted Stock Award (incorporated by reference to Exhibit 10.39 of the Company’s Annual Report on Form 10-K filed March 10, 2005).+ | |||
| 10.8 | Form of Non-Employee Director Non-Qualified Stock Option Agreement (incorporated by reference to Exhibit 10.40 of the Company’s Annual Report on Form 10-K filed March 10, 2005).+ | |||
| 10.9 | Form of Officer and Employee Non-Qualified Stock Option Agreement (incorporated by reference to Exhibit 10.41 of the Company’s Annual Report on Form 10-K filed March 10, 2005).+ | |||
| 10.10 | Salary Continuation Following Death Benefit Letter to Bruce W. Taylor, dated June 15, 2005 (incorporated by reference to Exhibit 10.45 of the Company’s Quarterly Report on Form 10-Q filed August 3, 2005).+ | |||
| 10.11 | Office Lease by and between GQ 225 Washington, LLP, a Delaware limited liability partnership as Landlord and Cole Taylor Bank, an Illinois banking corporation as Tenant (incorporated by reference to Exhibit 10.1 of the Company’s Current Report on Form 8-K filed January 25, 2007). | |||
| 10.12 | Taylor Capital Group, Inc. 2007 Incentive Bonus Plan (incorporated by reference to Appendix A to the Company’s Definitive Proxy Statement filed April 30, 2007).+ | |||
| 10.13 | Executive Employment Agreement, dated January 30, 2008, by and among Taylor Capital Group, Inc., Cole Taylor Bank and Mark A. Hoppe (incorporated by reference to Exhibit 10.1 of the Company’s Current Report on Form 8-K filed February 5, 2008).+ | |||
| 10.14 | Officer and Employee 2008 Non-Qualified Stock Option Agreement between Mark A. Hoppe and Taylor Capital Group, Inc. (incorporated by reference to Exhibit 10.52 of the Company’s Annual Report on Form 10-K filed March 31, 2008).+ | |||
| 10.15 | Officer and Employee Restricted Stock Award between Mark A. Hoppe and Taylor Capital Group, Inc. (incorporated by reference to Exhibit 10.53 of the Company’s Annual Report on Form 10-K filed March 31, 2008).+ | |||
| 10.16 | Form of Management Services Agreement by and between Taylor Capital Group, Inc. and Financial Investments Corporation (incorporated by reference to Exhibit 10.2 of the Company’s Current Report on Form 8-K filed September 5, 2008).+ | |||
| 10.17 | Executive Employment Agreement, dated September 4, 2008, by and among Taylor Capital Group, Inc., Cole Taylor Bank and Bruce W. Taylor (incorporated by reference to Exhibit 10.4 of the Company’s Current Report on Form 8-K filed September 5, 2008).+ | |||
140
Table of Contents
| Exhibit Number |
Description of Exhibits | |||
| 10.18 | Letter Agreement, dated November 21, 2008, by and between Taylor Capital Group, Inc. and United States Department of the Treasury, which includes the Securities Purchase Agreement attached thereto, with respect to the issuance and sale of the Company’s Series B Preferred Stock and a Warrant to purchase shares of the Company’s common stock (incorporated by reference to Exhibit 10.1 of the Company’s Current Report on Form 8-K filed November 24, 2008). | |||
| 10.19 | Form of Waiver executed by each of the Company’s senior executive officers as required pursuant to the Securities Purchase Agreement, dated November 21, 2008, by and between Taylor Capital Group, Inc. and the United States Department of the Treasury (incorporated by reference to Exhibit 10.2 of the Company’s Current Report on Form 8-K filed November 24, 2008).+ | |||
| 10.20 | Form of TARP Capital Purchase Program Compliance, Amendment and Consent Agreement executed by each of the Company’s senior executive officers as required pursuant to the Securities Purchase Agreement, dated November 21, 2008, by and between Taylor Capital Group, Inc. and the United States Department of the Treasury (incorporated by reference to Exhibit 10.3 of the Company’s Current Report on Form 8-K filed November 24, 2008). + | |||
| 10.21 | Taylor Capital Group, Inc. Senior Officers Change in Control Severance Plan, as amended and restated effective December 31, 2008 (incorporated by reference to Exhibit 10.1 of the Company’s Quarterly Report on Form 10-Q filed August 17, 2009).+ | |||
| 10.22 | Taylor Capital Group, Inc. Senior Officers Change in Control Severance Plan and Lawrence Ryan (incorporated by reference to Exhibit 10.2 of the Company’s Quarterly Report on Form 10-Q filed August 17, 2009).+ | |||
| 10.23 | Voluntary Reduction of Compensation letter signed by Bruce W. Taylor, Chairman and Chief Executive Officer (incorporated by reference to Exhibit 10.25 of the Company’s Annual Report on Form 10-K filed March 29, 2010).+ | |||
| 10.24 | Voluntary Reduction of Compensation letter signed by Mark A. Hoppe, President (incorporated by reference to Exhibit 10.26 of the Company’s Annual Report on Form 10-K filed March 29, 2010).+ | |||
| 10.25 | Taylor Capital Group, Inc. and Cole Taylor Bank Executive Severance Plan, as amended and restated. effective January 1, 2010 (incorporated by reference to Exhibit 10.27 of the Company’s Annual Report on Form 10-K filed March 29, 2010).+ | |||
| 12.1 | Computation of Ratios of Earnings to Fixed Charges.* | |||
| 21.1 | List of Subsidiaries of Taylor Capital Group, Inc.* | |||
| 23.1 | Consent of KPMG LLP.* | |||
| 31.1 | Certification of Chief Executive Officer Pursuant to Rule 13a-14(a) under the Security Exchange Act of 1934.* | |||
| 31.2 | Certification of Chief Financial Officer Pursuant to Rule 13a-14(a) under the Security Exchange Act of 1934.* | |||
| 32.1 | Certification of the Chief Executive Officer and Chief Financial Officer pursuant to 18 U.S.C. Section 1350, as adopted pursuant to Section 906 of the Sarbanes-Oxley Act of 2002.* | |||
| 99.1 | Certification of Chief Executive Officer Pursuant to Section 111(b)(4) of the Emergency Economic Stabilization Act of 2008* | |||
| 99.2 | Certification of Chief Financial Officer Pursuant to Section 111(b)(4) of the Emergency Economic Stabilization Act of 2008* | |||
| + | Management contract or compensatory plan or arrangement required to be filed as an Exhibit to this Form 10-K. |
| * | Filed herewith |
141
Table of Contents
| (b) | Exhibits |
| See Item 15(a)(3) above. |
| (c) | Financial Statement Schedules |
| See Item 15(a)(2) above. |
142
Table of Contents
TAYLOR CAPITAL GROUP, INC.
SIGNATURES
Pursuant to the requirements of Section 13 or 15(d) of the Securities Exchange Act of 1934, the registrant has duly caused this report to be signed on its behalf by the undersigned, thereunto duly authorized on the 22nd day of March 2011.
| TAYLOR CAPITAL GROUP, INC. |
| /S/ MARK A. HOPPE |
| Mark A. Hoppe |
| President and Chief Executive Officer |
| (Principal Executive Officer) |
| /S/ RANDALL T. CONTE |
| Randall T. Conte |
| Chief Operating and Chief Financial Officer |
| (Principal Financial Officer) |
| (Principal Accounting Officer) |
Pursuant to the requirements of the Securities Exchange Act of 1934, this report has been signed below by the following persons on behalf of the registrant and in the capacities and the dates indicated.
| Signature |
Title |
Date | ||
| /S/ BRUCE W. TAYLOR Bruce W. Taylor |
Chairman of the Board |
March 22, 2011 | ||
| /S/ MARK A. HOPPE Mark A. Hoppe |
President and Chief Executive Officer |
March 22, 2011 | ||
| /S/ RONALD L. BLIWAS Ronald L. Bliwas |
Director |
March 22, 2011 | ||
| /S/ C. BRYAN DANIELS C. Bryan Daniels |
Director |
March 22, 2011 | ||
| /S/ RONALD EMANUEL Ronald Emanuel |
Director |
March 22, 2011 | ||
| /S/ M. HILL HAMMOCK M. Hill Hammock |
Director |
March 22, 2011 | ||
| /S/ ELZIE HIGGINBOTTOM Elzie Higginbottom |
Director |
March 22, 2011 | ||
| /S/ MICHAEL H. MOSKOW Michael H. Moskow |
Director |
March 22, 2011 | ||
| /S/ LOUISE O’SULLIVAN Louise O’Sullivan |
Director |
March 22, 2011 | ||
143
Table of Contents
| Signature |
Title |
Date | ||
| /S/ MELVIN E. PEARL Melvin E. Pearl |
Director |
March 22, 2011 | ||
| /S/ SHEPHERD G. PRYOR IV Shepherd G. Pryor IV |
Director |
March 22, 2011 | ||
| /S/ HARRISON I. STEANS Harrison I. Steans |
Director |
March 22, 2011 | ||
| /S/ JENNIFER W. STEANS Jennifer W. Steans |
Director |
March 22, 2011 | ||
| /S/ JEFFREY W. TAYLOR Jeffrey W. Taylor |
Director |
March 22, 2011 | ||
| /S/ RICHARD W. TINBERG Richard W. Tinberg |
Director |
March 22, 2011 | ||
144