Attached files
| file | filename |
|---|---|
| 8-K - REGULATION FD DISCLOSURE - LABORATORY CORP OF AMERICA HOLDINGS | form8-k19apr2012ppt.htm |

1 8-K Filed April 19, 2012

2 Introduction This slide presentation contains forward-looking statements which are subject to change based on various important factors, including without limitation, competitive actions in the marketplace and adverse actions of governmental and other third-party payors. Actual results could differ materially from those suggested by these forward-looking statements. Further information on potential factors that could affect the Company’s financial results is included in the Company’s Form 10-K for the year ended December 31, 2011, and subsequent SEC filings. The Company has no obligation to provide any updates to these forward-looking statements even if its expectations change.

3 First Quarter Results (In millions, except per share data) Three Months Ended Mar 31, 2012 2011 +/(-) Revenue $ 1,423.3 $ 1,368.4 4.0% Adjusted Operating Income (1) $ 283.5 $ 263.7 7.5% Adjusted Operating Income Margin (1) 19.9% 19.3% 60 bp Adjusted EPS Excluding Amortization (1) $ 1.74 $ 1.52 14.5% Operating Cash Flow $ 197.1 $ 215.3 -8.5% Less: Capital Expenditures $ (34.2) $ (29.4) 16.3% Free Cash Flow $ 162.9 $ 185.9 -12.4% (1) See Reconciliation of non-GAAP Financial Measures (included herein)

4 Cash Flow Trends $445 $564 $538 $574 $632 $710 $781 $862 $884 $905 $371 $481 $443 $481 $516 $567 $624 $748 $758 $759 $- $200 $400 $600 $800 $1,000 2002 2003 2004 2005 2006 2007 2008 2009 2010 2011 $ M illi on s Operating Cash Flow Free Cash Flow 12.8% FCF CAGR from 2001-2011 Note: 2011 Free Cash Flow Per Share calculation above does not include the $49.5 million Hunter Labs settlement Free Cash Flow Per Share is a non-GAAP metric (see reconciliation of non-GAAP Financial Measures included herein) Free Cash Flow CAGR calculation uses 2001 data (2001 Free Cash Flow was $228 million)

5 Cash Flow Trends $2.40 $3.11 $2.94 $3.32 $3.83 $4.68 $5.58 $6.85 $7.19 $7.46 $0.00 $1.00 $2.00 $3.00 $4.00 $5.00 $6.00 $7.00 $8.00 2002 2003 2004 2005 2006 2007 2008 2009 2010 2011 16.8% FCF Per Share CAGR from 2001-2011 Note: 2011 Free Cash Flow Per Share calculation above does not include the $49.5 million Hunter Labs settlement Free Cash Flow Per Share is a non-GAAP metric (see reconciliation of non-GAAP Financial Measures included herein) Free Cash Flow Per Share CAGR calculation uses 2001 data (2001 Free Cash Flow Per Share was $1.58)

6 Financial Guidance - 2012 Excluding the impact of restructuring and other special charges and share repurchase activity after March 31, 2012, guidance for 2012 is: • Revenue growth: Approximately 2.0% - 3.5% • Adjusted EPS Excluding Amortization: $6.75 - $7.05 • Operating cash flow: Approximately $950 Million • Capital expenditures: Approximately $155 Million

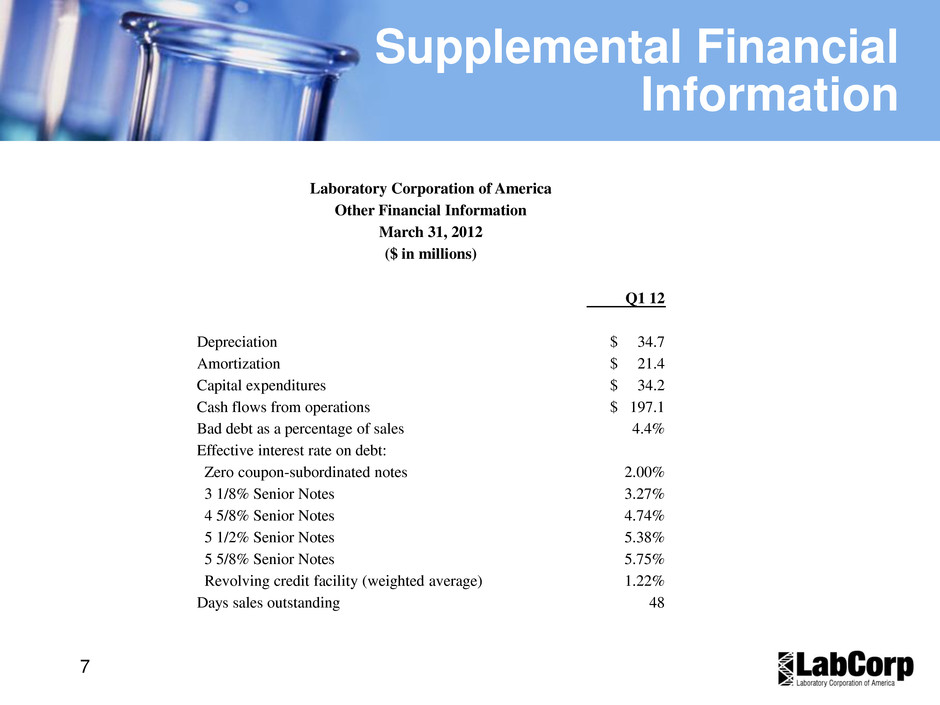
7 Supplemental Financial Information Laboratory Corporation of America Other Financial Information March 31, 2012 ($ in millions) Q1 12 Depreciation $ 34.7 Amortization $ 21.4 Capital expenditures $ 34.2 Cash flows from operations $ 197.1 Bad debt as a percentage of sales 4.4% Effective interest rate on debt: Zero coupon-subordinated notes 2.00% 3 1/8% Senior Notes 3.27% 4 5/8% Senior Notes 4.74% 5 1/2% Senior Notes 5.38% 5 5/8% Senior Notes 5.75% Revolving credit facility (weighted average) 1.22% Days sales outstanding 48

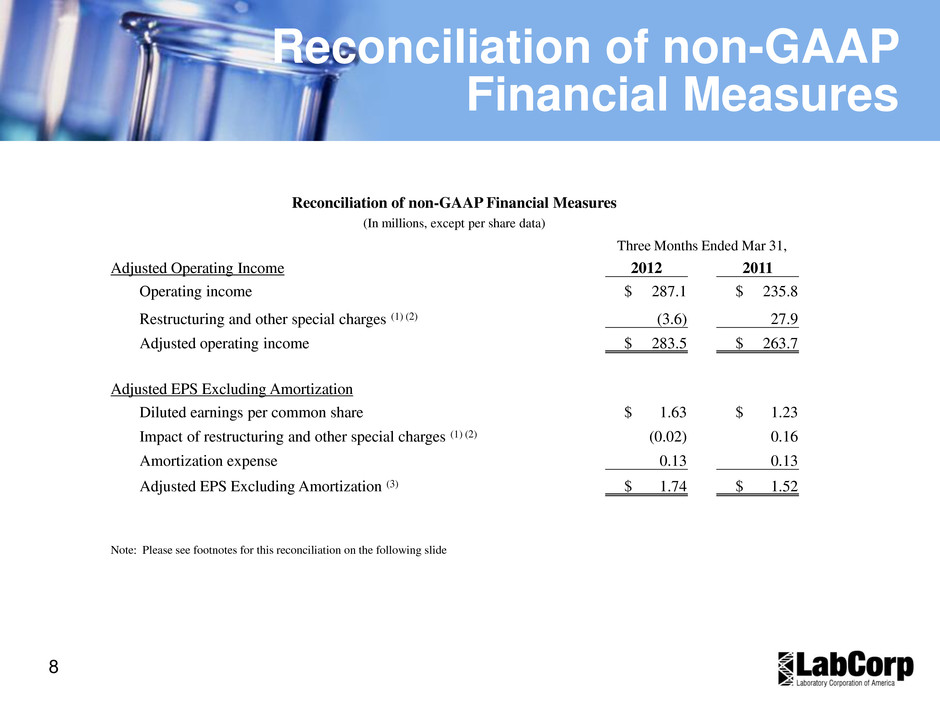
8 Reconciliation of non-GAAP Financial Measures Reconciliation of non-GAAP Financial Measures (In millions, except per share data) Three Months Ended Mar 31, Adjusted Operating Income 2012 2011 Operating income $ 287.1 $ 235.8 Restructuring and other special charges (1) (2) (3.6) 27.9 Adjusted operating income $ 283.5 $ 263.7 Adjusted EPS Excluding Amortization Diluted earnings per common share $ 1.63 $ 1.23 Impact of restructuring and other special charges (1) (2) (0.02) 0.16 Amortization expense 0.13 0.13 Adjusted EPS Excluding Amortization (3) $ 1.74 $ 1.52 Note: Please see footnotes for this reconciliation on the following slide

9 Reconciliation of non-GAAP Financial Measures - Footnotes Note: GENZYME GENETICS and its logo are trademarks of Genzyme Corporation and used by Esoterix Genetic Laboratories, LLC, a wholly-owned subsidiary of LabCorp, under license. Esoterix Genetic Laboratories and LabCorp are operated independently from Genzyme Corporation. 1) During the first quarter of 2012, the Company recorded a net credit of $3.6 million in restructuring and other special charges. The Company reversed previously established reserves of $3.8 million in unused severance and $2.4 million in unused facility-related costs. This net credit also includes charges of $1.7 million in severance and other personnel costs along with $0.9 million in facility- related costs primarily related to ongoing integration activities for Orchid and Genzyme Genetics. The after tax impact of the net credit increased net earnings for the quarter ended March 31, 2012, by $2.2 million and diluted earnings per share by $0.02 ($2.2 million divided by 99.1 million shares). 2) During the first quarter of 2011, the Company recorded restructuring and other special charges of $27.9 million. The charges included $4.0 million in severance and other personnel costs along with $9.8 million in facility-related costs associated with the integration of Genzyme Genetics. The charges also included a $14.8 million write-off of an investment made in a prior year. The after tax impact of these charges decreased net earnings for the quarter ended March 31, 2011, by $16.9 million and diluted earnings per share by $0.16 ($16.9 million divided by 103.2 million shares). 3) The Company continues to grow the business through acquisitions and uses Adjusted EPS Excluding Amortization as a measure of operational performance, growth and shareholder returns. The Company believes adjusting EPS for amortization provides investors with better insight into the operating performance of the business. For the quarters ended March 31, 2012 and 2011, intangible amortization was $21.4 million and $21.9 million, respectively ($13.1 million and $13.2 million net of tax, respectively) and decreased EPS by $0.13 ($13.1 million divided by 99.1 million shares) and $0.13 ($13.2 million divided by 103.2 million shares), respectively.

10 Reconciliation of Free Cash Flow and Free Cash Flow Per Share Reconciliation of non-GAAP Financial Measures (In millions, except per share data) 2011 2010 2009 2008 2007 2006 2005 2004 2003 2002 Cash flows from operations1 $ 905.1 $ 883.6 $ 862.4 $ 780.9 $ 709.7 $ 632.3 $ 574.2 $ 538.1 $ 564.3 $ 444.9 Capital expenditures (145.7) (126.1) (114.7) (156.7) (142.6) (115.9) (93.6) (95.0) (83.6) (74.3) Free cash flow2 759.4 757.5 747.7 624.2 567.1 516.4 480.6 443.1 480.7 370.6 Weighted average diluted shares outstanding 101.8 105.4 109.1 111.8 121.3 134.7 144.9 150.7 154.7 154.2 Free cash flow per share3 $ 7.46 $ 7.19 $ 6.85 $ 5.58 $ 4.68 $ 3.83 $ 3.32 $ 2.94 $ 3.11 $ 2.40 (1) 2011 cash flows from operations excludes the $49.5 million Hunter Labs settlement payment (2) Free cash flow represents cash flows from operations less capital expenditures (3) Free cash flow per share represents free cash flow divided by the weighted average diluted shares outstanding at the end of each period presented

11
