Attached files
| file | filename |
|---|---|
| 8-K - 8-K -- FIRST QUARTER 2012 RESULTS - CAPITAL ONE FINANCIAL CORP | d336765d8k.htm |
| EX-99.2 - EXHIBIT 99.2 - CAPITAL ONE FINANCIAL CORP | d336765dex992.htm |
| EX-99.1 - EXHIBIT 99.1 - CAPITAL ONE FINANCIAL CORP | d336765dex991.htm |
 First Quarter 2012
Results April 19, 2012
Exhibit 99.3 |
| 2
April 19, 2012
Forward-Looking Statements
Please note that the following materials containing information regarding Capital One's financial
performance speak only as of the particular date or dates indicated in these materials. Capital
One does not undertake any obligation to update or revise any of the information contained herein whether as a result of new information,
future events or otherwise.
Certain statements in this presentation and other oral and written statements made by Capital One from
time to time are forward-looking statements, including those that discuss, among other
things: strategies, goals, outlook or other non-historical matters; projections, revenues, income, returns, expenses, capital measures,
accruals for claims in litigation and for other claims against Capital One, earnings per share or other
financial measures for Capital One; future financial and operating results; Capital One's plans,
objectives, expectations and intentions; the projected impact and benefits of the acquisition of
ING Direct (the "ING Direct Transaction") and the pending acquisition of HSBC's U.S.
credit card business (the "HSBC Transaction" and, with the ING Direct Transaction, the "Transactions");
and the assumptions that underlie these matters.
To the extent that any such information is forward-looking, it is intended to fit within the safe
harbor for forward-looking information provided by the Private Securities Litigation Reform
Act of 1995. Numerous factors could cause Capital One's actual results to differ materially from
those described in such forward- looking statements, including, among other things: general
economic and business conditions in the U.S., the U.K., Canada and Capital One’s local markets,
including conditions affecting employment levels, interest rates, consumer income and confidence,
spending and savings that may affect consumer bankruptcies, defaults, charge-offs and deposit
activity; an increase or decrease in credit losses (including increases due to a worsening of general economic conditions in the
credit environment); the possibility that Capital One will not receive third-party consents
necessary to fully realize the anticipated benefits of the HSBC Transaction; the possibility that
Capital One may not fully realize the projected cost savings and other projected benefits of the Transactions; changes in the anticipated timing
for
closing
the
HSBC
Transaction;
difficulties
and
delays
in
integrating
the
assets
and
businesses
acquired
in
the
Transactions;
business disruption during the
pendency of or following the Transactions; diversion of management time on issues related to the
Transactions, including integration of the assets and businesses acquired; reputational risks and
the reaction of customers and counterparties to the Transactions; disruptions relating to the Transactions negatively impacting
Capital One’s ability to maintain relationships with customers, employees and suppliers; changes in
asset quality and credit risk as a result of the Transactions; the accuracy of estimates and
assumptions Capital One uses to determine the fair value of assets acquired and liabilities assumed in
the Transactions, and the potential
for its estimates or assumptions to change as additional information becomes available and Capital One
completes the accounting analysis of the Transactions; financial, legal, regulatory, tax or
accounting changes or actions, including the impact of the Dodd-Frank Wall Street Reform and Consumer Protection Act and the
regulations promulgated thereunder; developments, changes or actions relating to any litigation matter
involving Capital One; the inability to sustain revenue and earnings growth; increases or
decreases in interest rates; Capital One’s ability to access the capital markets at attractive rates and terms to capitalize and fund its
operations and future growth; the success of Capital One’s marketing efforts in attracting and
retaining customers; increases or decreases in Capital One’s aggregate loan balances or the
number of customers and the growth rate and composition thereof, including increases or decreases
resulting from factors such as
shifting
product
mix,
amount
of
actual
marketing
expenses
Capital
One
incurs
and
attrition
of
loan
balances;
the
level
of
future
repurchase or indemnification
requests Capital One may receive, the actual future performance of mortgage loans relating to such
requests, the success rates of claimants against it, any developments in litigation and the
actual recoveries Capital One may make on any collateral relating to claims against it; the
amount and rate of deposit growth; changes in the reputation of or expectations regarding the
financial services industry or Capital One with respect to practices, products or financial
condition; any significant disruption in Capital One’s operations or technology platform;
Capital One’s ability to maintain a compliance infrastructure suitable for its size and
complexity; Capital One’s ability to control costs; the amount of, and rate of growth in, its
expenses as its business develops or changes or as it expands into new market
areas;
Capital
One’s
ability
to
execute
on
its
strategic
and
operational
plans;
any
significant
disruption
of,
or
loss
of
public
confidence
in,
the
United States
Mail service affecting Capital One’s response rates and consumer payments; Capital One’s
ability to recruit and retain experienced personnel to assist in the management and operations of
new products and services; changes in the labor and employment markets; fraud or misconduct by Capital One’s customers,
employees or business partners; competition from providers of products and services that compete with
Capital One’s businesses; and other risk factors set forth from time to time in reports that
Capital One files with the Securities and Exchange Commission, including, but not limited to, the Annual Report on Form 10-K for
the year ended December 31, 2011.
You should carefully consider the factors discussed above in evaluating these forward-looking
statements. All information in these slides is based on the consolidated results of Capital One
Financial Corporation, unless otherwise noted. A reconciliation of any non-GAAP financial measures included in this
presentation can be found in Capital One's most recent Current Report on Form 8-K filed April 19,
2012, available on its website at www.capitalone.com under "Investors."
|
| 3
April 19, 2012
First Quarter 2012 Highlights
•
Q1 2012 net income was $1,403MM, or $2.72 per share, compared with Q4 2011 net income of
$407MM, or $0.88 per share
–
$1.56 per share excluding INGD related bargain purchase gain
–
Higher revenue due to impacts of the INGD acquisition, slightly higher loan balances and absence of Q4
2011 negative items
–
Lower provision expense driven by lower charge-offs and larger ALLL release
–
Lower non-interest expense driven by seasonally lower marketing expense and flat operating expense
•
Legacy operating expenses of ($2.0B)
•
Partially
offset
by
impact
of
merger-related
expenses
and
a
half
quarter of INGD expenses
–
Rep & Warranty expense of ($169M); ($95M) related to GSE settlement
•
ING Direct USA (INGD) acquisition closed on February 17, 2012
–
Merger-related impacts on Q1 2012 earnings include:
–
Bargain purchase gain increased non-interest income by $594M
–
Mark-to-market loss on related swap hedge of ($78M) in non-interest income
–
Loan premium amortization expense of ($30M) in interest income
–
Transaction and merger-related expenses of ($65M) in non-interest expense
–
Core deposit intangibles and other intangible amortization of ($12M )in operating expense
–
Half quarter impacts on Q1 2012 earnings excluding merger related impacts:
–
Revenue of ~ $185M
–
Non-interest expense of ~ ($77M) |
 4
April 19, 2012
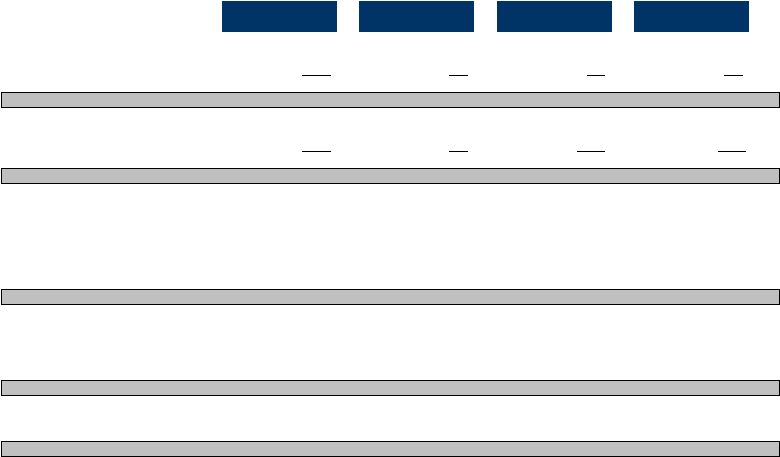
First quarter 2012 earnings reflected a significant impact from the
acquisition of ING Direct
*INGD impacts are estimated direct impacts post acquisition, including transaction & merger related
expenses ** Includes ~$25M of HSBC transaction & merger-related expenses
**
Actual
Est. INGD* Impact
COF (excl. est INGD)
Actual
$MM
Q1'12
Q1'12
Q1'12
Q4'11
Net Interest Income
3,414
$
136
$
3,278
$
3,182
$
Non-Interest Income
1,521
535
986
868
Total Revenue
4,935
671
4,264
4,050
$
Marketing
321
8
313
420
Operating Expense
2,183
150
2,033
2,198
Non-Interest Expense
2,504
158
2,346
2,618
Pre-Provision Earnings (before tax)
2,431
513
1,918
1,432
Net Charge-offs
780
1
779
884
Other
(17)
-
(17)
7
Allowance Build (Release)
(190)
-
(190)
(30)
Provision Expense
573
1
572
861
Pretax Income
1,858
512
1,346
571
Taxes
353
(23)
376
160
Operating Earnings (after tax)
1,505
535
970
411
Discontinued Operations, net of tax
(102)
-
(102)
(4)
Total Company (after tax)
1,403
$
535
$
868
$
407
$
|
 5
April 19, 2012
The addition of ING Direct’s assets & liabilities had a significant impact
on our first quarter balance sheet
$B
3/31/2012
INGD Impacts
12/31/2011
2/17/2012
Assets:
Cash and cash equivalents
31.7
$
20.1
$
6.6
$
Securities
60.8
30.6
38.8
Loans held for investment
173.8
40.4
135.9
Less: Allowance for loan and lease losses
(4.0)
-
(4.3)
Net loans held for investment
169.8
40.4
131.6
Other Assets
32.2
3.0
29.0
Total assets
294.5
$
94.1
$
206.0
$
Liabilities:
Deposits
216.5
$
84.4
$
128.2
$
Debt
32.9
-
39.5
Other liabilities
8.1
0.2
8.6
Total liabilities
257.5
84.6
176.3
Stockholders' Equity:
37.0
-
29.7
Total liabilities and stockholders' equity
294.5
$
84.6
$
206.0
$
|
 6
April 19, 2012
The quarterly NIM decrease was caused by the addition of ING Direct
Average Balances & Margin Highlights
Average
Yield/
Average
Yield/
(Dollars in millions)
Balance
Rate
Balance
Rate
Interest-earning assets:
Loans held for investment
$
152,900
9.56
%
131,581
$
10.46
%
Investment securities
50,543
2.36
39,005
2.50
Cash equivalents and other
16,803
0.62
5,685
1.20
Total interest-earning assets
$
220,246
7.23
%
176,271
$
8.40
%
Interest-bearing liabilities:
Total interest-bearing deposits
$
151,625
0.82
%
109,914
$
0.96
%
Securitized debt obligations
16,185
1.98
16,780
1.91
Senior and subordinated notes
3.43
10,237
3.48
Other borrowings
3.61
7,794
4.41
Total interest-bearing liabilities
$
1.20
%
144,725
$
1.43
%
Impact of non-interest bearing deposits
0.17
%
0.25
%
Net interest margin
6.20
%
7.22
%
2012 Q1
2011 Q4
10,268
9,541
187,619 |
 7
April 19, 2012
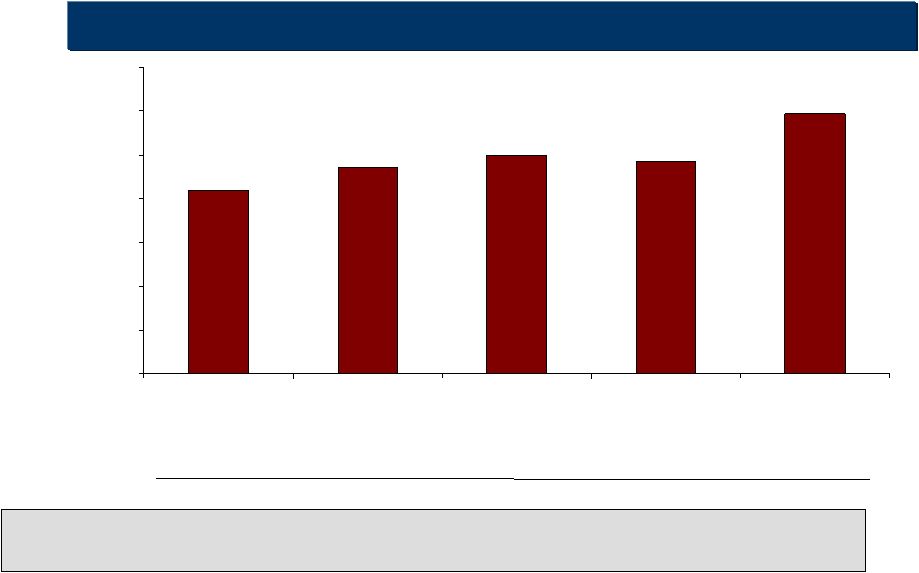
Our capital position was strengthened by issuance of deal related
shares and strong earnings
1
Tier 1 common ratio is a regulatory capital measure calculated based on Tier 1 common capital divided
by risk-weighted assets. See "Exhibit 99.2—Table 13: Reconciliation of
Non-GAAP Measures and Calculation of Regulatory Capital Measures" for the calculation of this ratio.
Tier
1
Common
Ratio
(Basel
I)
1
8.4%
9.4%
10.0%
9.7%
11.9%
0%
2%
4%
6%
8%
10%
12%
14%
Q111
Q211
Q311
Q411
Q112
Disallowed DTA
RWA
EOP Loans
(1.4)
142
124
Tier 1 common capital
including disallowed DTA
($B)
13.4
Tier 1 common capital
12.0
(0.6)
146
129
14.3
13.7
(0.2)
149
130
15.1
14.9
(0.5)
155
15.6
15.1
136
(0.9)
183
22.6
21.7
174 |
| 8
April 19, 2012
The acquisition of HSBC’s US Credit Card business will significantly
impact results in the second quarter and beyond
•
Significant earnings impact from:
–
Allowance for non-impaired loans and finance charge & fee reserve (FCFR) build
–
Purchase accounting
•
PCCR
•
Fair Value of delinquent and current loans
•
Other assets and intangibles
–
Transaction and merger-related expenses
•
Capital Impact
–
Expected to bring 2Q 2012 Tier 1 common ratio to mid-9% range
•
Increased risk weighted assets
•
Lower earnings due to above impacts
–
Capital generative beginning in Q3 2012 |
 9
April 19, 2012
Domestic Card Financial Highlights
Commentary
•
5% year-over-year loan
growth; expected seasonal
decline in Q1
•
Strong year-over-year
growth in purchase
volumes, new accounts
•
Revenue margin decline
driven by unique items;
loan yields stable
•
NIE decline on lower
marketing and lower
operating expense
•
Underlying improvement
trend in charge-off and
delinquency rates, aided
by expected seasonal
tailwinds
Domestic Card delivered strong profits, improving credit and year-
over-year growth in loans and purchase volumes
2012
2011
2011
(Dollars in millions)
Q1
Q4
Q1
Net interest income
1,713
1,706
1,651
Non-interest income
497
613
583
Total revenue
2,210
2,319
2,234
Provision for credit losses
361
519
230
Non-interest expense
1,052
1,183
990
Income from continuing operations before taxes
797
617
1,014
Income tax provision
282
222
360
Income from continuing operations, net of tax
515
$
395
$
654
$
Selected metrics:
Period-end loans held for investment
53,173
$
56,609
$
50,570
$
Average loans held for investment
54,131
54,403
51,889
Average yield on loans held for investment
14.11
%
14.05
%
14.42
%
Revenue margin
16.33
17.05
17.22
Net charge-off rate
3.92
4.07
6.20
30+ day deliquency rate
3.25
3.66
3.59
Purchase volume
31,418
$
34,586
$
25,024
$ |
 10
April 19, 2012
Consumer Banking Financial Highlights
Commentary
2012
2011
2011
(Dollars in millions)
Q1
Q4
Q1
Earnings:
Net interest income
1,288
$
1,105
$
983
$
Non-interest income
176
152
186
Total revenue
1,464
1,257
1,169
Provision for credit losses
174
180
95
Non-interest expense
943
893
740
Income from continuing operations before taxes
347
184
334
Income tax provision
123
67
119
Income from continuing operations, net of tax
224
$
117
$
215
$
Selected metrics:
Period-end loans held for investment
77,300
$
36,315
$
34,306
$
Average loans held for investment
56,263
35,791
34,236
Average yield on loans held for investment
7.20
%
9.46
%
9.60
%
Auto loan originations
4,270
$
3,586
$
2,571
$
Period-end deposits
176,007
88,540
86,355
Average deposits
129,915
88,390
83,884
Deposit interest expense rate
0.73
%
0.84
%
1.06
%
Core deposit intangible amortization
37
$
31
$
35
$
Net charge-off rate
0.77
%
1.65
%
1.57
%
Net charge-off rate (excluding acquired loans)
1.29
1.87
1.82
Nonperforming loans as a % of loans held for investment
0.77
1.79
1.84
Nonperforming asset rate
0.82
1.94
2.00
30+ day performing delinquency rate
1.63
4.47
3.42
30+ day performing delinquency rate (excluding acquired
loans)
3.63
5.06
3.98
30+ day deliquency rate
—
5.99
4.96
Period-end loans serviced for others
17,586
$
17,998
$
19,956
$
•
Trends in loan and deposit
balances, revenue, NIE,
and yields all driven by
addition of ING Direct on
2/17/12
•
$1.8 billion growth in auto
loans, strong growth in
auto loan originations
•
Modestly lower provision
expense:
–
Mix shift to home
loans
–
Lower home loan
charge-off rate
–
Seasonal
improvement in
auto credit
–
Partially offset by
allowance build for
auto loan growth
The addition of ING Direct and strong Auto Finance performance
drove Consumer Banking results |
 11
April 19, 2012
Commercial Banking Financial Highlights
Commentary
2012
2011
2011
(Dollars in millions)
Q1
Q4
Q1
Earnings:
Net interest income
431
$
425
$
376
$
Non-interest income
85
87
71
Total revenue
516
512
447
Provision for credit losses
(69)
76
(16)
Non-interest expense
261
254
212
Income from continuing operations before taxes
324
182
251
Income tax provision
114
65
89
Income from continuing operations, net of tax
210
$
117
$
162
$
Selected metrics:
Period-end loans held for investment
34,906
$
34,327
$
30,265
$
Average loans held for investment
34,032
32,843
30,027
Average yield on loans held for investment
4.47
%
4.70
%
4.81
%
Period-end deposits
28,046
$
26,683
$
24,336
$
Average deposits
27,569
26,185
24,232
Deposit interest expense rate
0.37
%
0.42
%
0.55
%
Core deposit intangible amortization
9
$
9
$
11
$
Net charge-off rate
0.19
%
0.62
%
0.80
%
Nonperforming loans as a percentage of loans
held for investment
1.15
1.08
1.83
Nonperforming asset rate
1.23
1.17
1.94
•
15% year-over-year
growth in loans, deposits,
and revenue
•
Increases in NIE more
than offset by
improvements in provision
•
Charge-off rate improved;
NPA rate relatively stable
The Commercial Banking business continues to deliver strong and
steady performance |
 12
April 19, 2012
We expect strong loan growth in several of our businesses to be
largely offset by significant run-off portfolios
Run-off Portfolios
(expected annual run-off)
Growth Opportunities
•
Auto Finance
•
Domestic Card
•
Commercial Banking
•
Consumer Banking (~$8.5 billion)
–
Home Loans inherited in acquisitions
•
Domestic Card (~$1.8 billion)
–
Portions of HSBC U.S. credit card
portfolio
–
Closed End Loans (ILs)
•
Commercial Banking (~$150 million)
–
Small Ticket CRE |
 13
April 19, 2012
Building a Great
Customer Franchise
Strong Returns and
Capital Generation
Sure-footed Integration
We are focused on delivering sustained shareholder value |
 |