Attached files
| file | filename |
|---|---|
| 8-K - CURRENT REPORT OF MATERIAL EVENTS OR CORPORATE CHANGES - Monogram Residential Trust, Inc. | a12-9517_18k.htm |
Exhibit 99.1
|
|
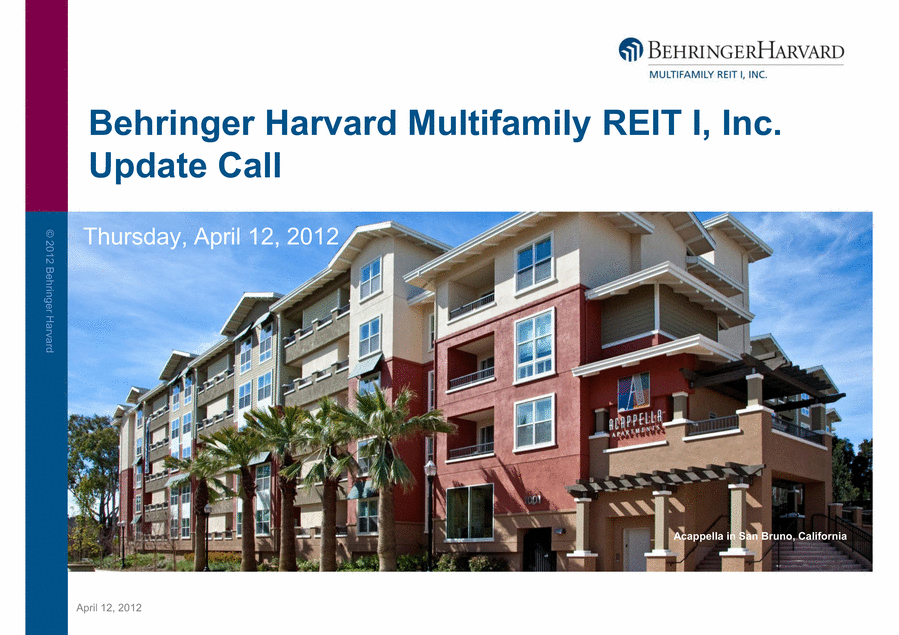
© 2012 Behringer Harvard April 12, 2012 Acappella in San Bruno, California Behringer Harvard Multifamily REIT I, Inc. Update Call Thursday, April 12, 2012 |
|
|
© 2012 Behringer Harvard 2 Forward-Looking Statements This presentation contains forward-looking statements, including discussion and analysis of the financial condition of -looking expressions are intended to identify forward-looking statements. We intend that such forward-looking statements be subject are subject to risks, uncertainties and other factors, some of which are beyond our control, are difficult to predict and could cause actual results to differ materially from those expressed or forecasted in the forward-looking statements. Forward-looking statements that were true at the time made may ultimately prove to be incorrect or false. We caution you not to place undue reliance on forward- of this presentation. We undertake no obligation to update or revise forward-looking statements to reflect changed assumptions the occurrence of unanticipated events or changes to future operating results. You should not to place undue reliance on forward-looking statements. You should consider the areas of risk described - 10-K for the year ended December 31, 2011 as filed with the Securities and Exchange Commission on March 29, 2012, in connection with any forward-looking statements that may be made by us and our businesses generally. Forward- update or revise forward-looking statements to reflect changed assumptions, the occurrence of unanticipated events or changes to future operating results. We intend for these forward-looking statements to be covered by the applicable safe harbor provisions created by Section 27A of the Securities Act and Section 21E of the Exchange Act. Behringer Harvard Multifamily REIT I, Inc. (the “REIT”) and its subsidiaries and other matters. These forward statements are not historical facts but are the intent, belief or current expectations of the REIT’s management based on their knowledge and understanding of the REIT’s business and industry. Words such as “may,” “anticipates,” “expects,” “intends,” “plans,” “believes,” “seeks,” “estimates,” “would,” “could,” “should” and variations of these words and similar to the safe harbor provisions created by Section 27A of the Securities Act of 1933 (the “Securities Act”) and Section 21E of the Securities Exchange Act of 1934 (the “Exchange Act”). These statements are not guarantees of future performance and looking statements, which reflect the REIT’s management's view only as of the date under the heading “Forward-Looking Statements” in our periodic reports under the Exchange Act, and those risk factors included in “Item 1A. Risk Factors” of the REIT’s Annual Report on Form Forward-looking statements in this presentation reflect the REIT’s management’s views only as of the date, and may ultimately prove to be incorrect or false. We undertake no obligation to |

|
|
© 2012 Behringer Harvard 3 Forward-Looking Statements Risks that could cause actual results to vary materially from those expressed in forward-looking statements include: limited operating history; limited transferability and lack of liquidity; risks associated with lending activities ; no assurance that distributions will continue to be made or that any particular rate of distribution will be maintained; until the proceeds from an offering are invested and generating cash flow from operating activities, some or all of the distributions will be paid from other sources, which may be deemed a return of capital, such as from the proceeds of an offering, cash advances by the advisor, cash resulting from a waiver of asset management fees, proceeds from the sales of assets, and borrowings in anticipation of future cash flow from operating activities, which could result in less proceeds to make investments in real estate; payment of significant fees to the advisor and their affiliates ; potential conflicts of interest; lack of diversification in property holdings; Market and economic challenges experienced by the U.S. economy or real estate industry as a whole and the local economic conditions in the markets in which our properties are located; assets; Availability of cash flow from operating activities for distribution; by its debt agreements; the availability of credit generally, and any failure to obtain debt financing at favorable terms or a failure to satisfy the conditions and requirements of that debt; the ability to secure resident leases at favorable rental rates; the ability to raise future capital through equity and debt security offerings and through joint venture arrangements; the ability to retain our executive officers and other key personnel of our advisor, our property manager and their affiliates; conflicts of interest arising out of our relationships with our advisor and its affiliates; unfavorable changes in laws or regulations impacting our business, our assets or our key relationships; factors that could affect our ability to qualify as a real estate investment trust; potential development risks and construction delays; the potential inability to retain current tenants and attract new tenants due to a competitive real estate market; investments; risks related to investments in distressed properties or debt include possible default under the original loan; unforeseen increases in operating and capital expenses; declines in real estate values; and, lack of availability of due diligence information. results, returns to its shareholders, and ability to make distributions Harvard real estate programs is subject to substantial risks and may result in the loss of principal invested. Real Estate programs are not suitable for all investors. absence of a public market for the REIT’s securities; reliance on the program’s advisor; the REIT’s ability to make accretive investments in a diversified portfolio of the REIT’s level of debt and the terms and limitations imposed on the REIT risk that a program’s operating results will be affected by economic and regulatory changes that have an adverse impact on a program’s These risks may impact the REIT’s financial condition, operating as stated in the REIT’s offering. Investment in securities of Behringer |

|
|
© 2012 Behringer Harvard 4 Questions? During the call, please e-mail questions to: bhreit@behringerharvard.com |

|
|
© 2012 Behringer Harvard 5 Robert S. Aisner Chief Executive Officer Mark T. Alfieri Chief Operating Officer Howard S. Garfield Chief Financial Officer |

|
|
© 2012 Behringer Harvard 6 The Economy Fourth Quarter 2011 Positive momentum in labor market and overall economic recovery Gasoline prices in U.S. a worry Federal Reserve reiterates a highly accommodative monetary policy GDP and Employment Growth Slow GDP: 2008: -0.3%; 2009: -3.5%; 2010: +3.0%; 2011: +1.7% In Q4 2011, GDP +3.0% Unemployment Rate: 8.2% (March 2012) Gain of 120,00 jobs in March a disappointment However, best six months of job growth since 2006 The Consumer Thomson Reuters/University of Michigan August consumer sentiment index: 76.2 (March 2012) Improvement in confidence is primarily driven by positive news from the labor market. Sources: Bureau of Economic Analysis, Bureau of Labor Statistics, Thomson Reuters/ University of Michigan Surveys of Consumers |

|
|
© 2012 Behringer Harvard 7 U.S. Job Growth Persistent Source: U.S. Bureau of Labor Statistics establishment survey (1,000) (800) (600) (400) (200) 0 200 400 2007 2008 2009 2010 2011 2012 Jobs gained/lost per month (thousands) Adjusted for temporary U.S. Census jobs |

|
|
© 2012 Behringer Harvard 8 Consumer Confidence Up in March Source: Bloomberg, Thomson-Reuters/University of Michigan Surveys of Consumers Consumer Sentiment (Index) 50 55 60 65 70 75 80 2010 2011 2012 |

|
|
© 2012 Behringer Harvard 9 Multifamily Outperforming Other Real Estate Sectors Vacancy rates fell to 4.9% in Q1 2012 Rental rates continue to strengthen Asking rents improved 0.5% quarter-over-quarter Effective rents improved 0.9% Demographic forces positive Cohort of 25-to-35 years old college graduates have lower unemployment than general population Only 7,342 new apartment homes delivered in Q1 2012 70,000 predicted for all of 2012 and 150,000 to 200,000 in 2013 Sources: Reuters, Reis, Inc.:”US apartment vacancy rate falls to decade low,” April 4, 2012; Calculatedrisk.com |

|
|
Annualized 2012 distribution rate of 4.725%** *For additional information on the REIT’s distribution reinvestment plan and share redemption program, please refer to each filed as exhibits to the REIT’s Annual Report on Form 10-K for the year ended December 31, 2011 filed with the S.E.C. **First quarter 2012 annualized distribution rate was 6% assumes the 3.5% distribution rate approved for the second quarter 2012 is approved in the third and fourth quarters of 2012 and adding the special cash distribution. Distribution rates are based on a $10 share price. © 2012 Behringer Harvard 10 Recent Organizational Actions New distribution rate set: an annualized 3.5% rate (based on $10 share price) Effective for months of second quarter 2012 First quarter distributions already declared paid at previous rate Special cash distribution of $0.06 per share to be paid to shareholders of record on July 6, 2012 Distribution to be paid from proceeds of sale of Mariposa Loft Apartments in Atlanta Payment Date July 11, 2012 Share price to be adjusted by $0.06 per share to new price of $9.94 per share for distribution reinvestment plan and share redemption program* Investment Bank engaged to assist board of directors in exploring strategic options for the REIT |

|
|
© 2012 Behringer Harvard 11 Projected Multifamily Rental and Occupancy Growth Source: Witten Advisors LLC* *Used with permission by Witten Advisors LLC 85% 90% 95% 100% 1Q95 1Q96 1Q97 1Q98 1Q99 1Q00 1Q01 1Q02 1Q03 1Q04 1Q05 1Q06 1Q07 1Q08 1Q09 1Q10 1Q11 1Q12 1Q13 1Q14 Occupancy -5% 0% 5% 10% Year-Year Effective Rent Growth Occupancy Occupancy Forecast Rent Growth Rent Growth Forecast |

|
|
© 2012 Behringer Harvard 12 Relationship between yield and values Cap rate compression causes multifamily values to rise and cap rates to drop When values rise, yields drop Prudently deploying cash is challenging in current environment Price Yield Cap Rates Value/NOI |

|
|
© 2012 Behringer Harvard 13 Adaptive Investment Strategy 34% 60% 6% 3% 97% Mezz/Land Loan Development Operating 4% 2% 94% 2008 2010 2011 Portfolio Composition Over Time* * Percentages based on cumulative equity investment by each type |

|
|
© 2012 Behringer Harvard 14 Portfolio Characteristics Florida 6% Georgia 10% Mid-Atlantic 13% Mid-West 3% Mountain 14% New England 6% Northern California 8% Northwest 5% Southern California 9% Texas 26% Regions by Percentage of Total Units 42 Investments 35 Operating Properties 4 Mezzanine and Land Loans 3 Developments 11,115 Total Units |

|
|
© 2012 Behringer Harvard 15 Portfolio Growth $0 $20 $40 $60 $80 $100 $120 $140 $160 2010 2011 $28.9 $67.4 $61.4 $92.0 $ millions Rental Revenues Unconsolidated Joint Ventures Consolidated Properties $159.4 $90.3 91% 91% 92% 92% 93% 93% 94% 2010 2011 92% 93% Weighted Average Occupancy Operating Properties |

|
|
© 2012 Behringer Harvard 16 Same Store Net Operating Income ($ millions) $11 $12 $13 $14 $15 Q4 2010 Q4 2011 $12.7 $14.9 Q4 2010 to Q4 2011 Growth There were 20 stabilized comparable properties in the 4th quarter year over year comparison. $22 $23 $24 $25 Q3 2011 Q4 2011 $23.2 $24.8 Q3 2011 to Q4 2011 Growth There were 33 stabilized comparable properties in the quarterly comparison between 3rd and 4th quarter 2011. Please see slides 29 through 34 for a reconciliation and additional information related to any non-GAAP measure used in this presentation. |

|
|
© 2012 Behringer Harvard 17 2011 Acquisitions Argenta – San Francisco, CA – 179 units Renaissance – Concord, CA 132 units Stone Gate – Marlborough, MA 332 units West Village – Mansfield, MA 200 units Aggregate total contract purchase price $235.4 million Argenta in San Francisco, California – REIT’s share based on ownership percentages is $167.0 million |

|
|
© 2012 Behringer Harvard 18 Dispositions Waterford Place Gross Sales Price $110 million 38% Increase from Purchase Price Milky Way Gross Sales Price $178.6 million 24% Increase from Purchase Price Mariposa Gross Sales Price $40 million 39% Increase from Purchase Price Waterford Place in Dublin, California |

|
|
© 2012 Behringer Harvard 19 Development Pipeline Property Name Investment Type Location Units Total Estimated Cost (millions) (1) The Franklin (2) Wholly owned equity Delray Beach, FL 180 $32.2 Allegro Phase II Wholly owned equity Addison, TX 121 $16.1 Renaissance Phase II JV equity Concord, CA 163 $37.0 7 Rio JV equity Austin, TX 221 $53.7 West University (2) JV equity Houston, TX 231 $40.0 Fairmount (2) JV equity Dallas, TX 299 $42.0 Pacifica at Newport Plaza Wholly owned land loan Costa Mesa, CA 113 $31.3 Total 1,328 $252.3 (1) We may obtain construction financing. (2) Acquisition of the land occurred subsequent to December 31, 2011. |

|
|
© 2012 Behringer Harvard 20 Financial Summary Entering 2012 Completed Initial Public Offering in September 2011 Initial public offering: $1.5 billion gross Private offering: $127 million gross Total assets: $2.8 billion Low leverage Growing revenues, earnings and cash flow from operations |

|
|
© 2012 Behringer Harvard 21 Improving GAAP Net Income in 2011 ($40) ($20) $0 $20 $40 $60 $80 $100 2010 2011 ($34.6) $98.6 $ millions Net Income (Loss) Attributable to Common Stockholders Cash realized gains Waterford Place sale- $18.1 million Milky Way sale of JV interest - $5.7 million (net income does not include additional paid-in capital of $39.6 million in cash) Non-cash unrealized gains Consolidation of JVs to fair value - $103.8 million |

|
|
© 2012 Behringer Harvard 22 MFFO Growth 2009 2011 $4.6 $18.7 $34.2 $0.14 $0.22 $0.25 $0.00 $0.05 $0.10 $0.15 $0.20 $0.25 $0.30 $0 $5 $10 $15 $20 $25 $30 $35 $40 2009 2010 2011 MFFO per Share ($) Total MFFO ($ millions) Total MFFO MFFO per Share 32.5 million shares 83.5 million shares 138.1 million shares Please see slides 29 through 34 for a reconciliation and additional information related to any non-GAAP measure used in this presentation. |

|
|
© 2012 Behringer Harvard 23 Cash Flow from Operations $0 $5 $10 $15 $20 $25 $30 $35 2010 2011 $2.6 $31.7 Year-over-year growth driven by acquisitions and operational improvements Excludes proceeds from sales $ millions |

|
|
© 2012 Behringer Harvard 24 Distributions $0 $10 $20 $30 $40 $50 $60 $70 $80 2010 2011 $2.6 $31.7 $48.0 $50.7 $ millions Sources of Distributions Cash Flow from Operations Gain on Sales Balance Sheet Cash $53.3 $79.7 Total distributions paid were $53.3 million and $79.7 million for 2010 and 2011, respectively. Total gain on sales for 2011 were $63.4 million and when combined with cash flow from operations of $31.7 million, the total exceeds distributions paid by $15.4 million. 0% 10% 20% 30% 40% 50% 60% 70% 80% 90% 100% 2010 2011 5% 6% 54% 95% 40% Tax Classifications of Distributions Capital Gains Ordinary Income Return of Capital |

|
|
© 2012 Behringer Harvard 25 Selected Balance Sheet Data ($ thousands) $0 $500 $1,000 $1,500 $2,000 $2,500 2007 2008 2009 2010 2011 Combined Real Estate Assets Unconsolidated Joint Ventures Consolidated Properties $0 $200 $400 $600 $800 $1,000 2007 2008 2009 2010 2011 Combined Property Debt Unconsolidated Joint Ventures Consolidated Properties $0 $500 $1,000 $1,500 $2,000 $2,500 $3,000 2007 2008 2009 2010 2011 Consolidated Balance Sheet Details Total Assets Total Liabilities Shareholder's Equity |

|
|
© 2012 Behringer Harvard 26 Debt Characteristics 76% 24% Fixed Rate Variable Rate 49% 26% 23% 2% GSEs INS COS FIN'L INST CMBS All amounts are as of December 31, 2011 and represent 100% of the property Average rate on outstanding debt – 4% $150 million credit facility – 2.4% Property-related debt to total assets – 34% Mortgage debt to real estate assets (cost basis) – 48% Fixed versus Variable Rate Lender Type level debt and not the REIT’s share based on ownership percentages. |

|
|
© 2012 Behringer Harvard 27 Debt Maturities by Year $0 $50 $100 $150 $200 $250 2012 2013 2014 2015 2016 2017 2018 2019 2020 $37 $212 $24 $75 $161 $172 $161 $96 $26 All amounts are as of December 31, 2011 and represent 100% of the property Weighted average maturity of 4.5 years $ millions level debt and not the REIT’s share based on ownership percentages. |

|
|
© 2012 Behringer Harvard 28 Cash and Liquidity $655.5 $2,150.2 Additional liquidity from the $150 million credit facility through 2017 Total Assets = $2.8 Billion Cash Amounts on graph are in $ millions |

|
|
© 2012 Behringer Harvard 29 Non-GAAP Reconciliations FFO is a non-GAAP financial measure that is widely recognized as a measure of REIT operating performance. We use FFO, defined by GAAP, impairment charges and gains (or losses) from sales of property (including deemed sales and settlements of pre-existing relationships), plus depreciation and amortization on real estate assets, and after related adjustments for unconsolidated partnerships, joint ventures, subsidiaries and noncontrolling interests, as one measure to evaluate our operating performance. Since FFO was promulgated, several new accounting pronouncements have been issued, such that management, industry investors and analysts have considered the presentation of FFO alone to be insufficient. Accordingly, in addition to FFO, we use (1) acquisition fees and expenses; (2) straight line rent amounts, both income and expense; (3) amortization of above- or below-market intangible lease assets and liabilities; (4) amortization of discounts and premiums on debt investments; (5) gains or losses from the early extinguishment of debt; (6) gains or losses on the extinguishment or sales of hedges, foreign exchange, securities and other derivative holdings except where the trading of such instruments is a fundamental attribute of our operations; (7) gains or losses related to fair value adjustments for interest rate swaps and other derivatives not qualifying for hedge accounting, foreign exchange holdings and other securities; (8) gains or losses related to consolidation from, or deconsolidation to, equity accounting; (9) gains or losses related to contingent purchase price adjustments; and (10) adjustments related to the above items for unconsolidated entities in the application of equity accounting. defined by the National Association of Real Estate Investment Trusts (“NAREIT”) to be net income (loss), computed in accordance with accounting principles generally accepted in the United States of America (“GAAP”), excluding extraordinary items, MFFO, as defined by the Investment Program Association (“IPA”), which excludes from FFO the following items: |

|
|
© 2012 Behringer Harvard 30 Non-GAAP Reconciliations (continued) FFO or MFFO should not be considered as an alternative to net income (loss), nor as an indication of our liquidity, nor are they indicative of funds available to fund our cash needs, including our ability to fund distributions. In particular, as we are currently in the acquisition phase of our life cycle, acquisition costs and other adjustments which are increases to MFFO are, and may continue to be, a significant use of cash, an expense in the determination of our GAAP net income, and a use of our cash flow from operating activities. Investors are cautioned that MFFO should only be used to assess the sustainability of our operating performance after our acquisition stage is completed, as it excludes acquisition costs that have a negative effect on our operating performance and the reported book value of our common stock and stockholders' equity during the periods in which properties are acquired. Additionally, the exclusion of impairments limits the usefulness of FFO and MFFO as historical operating performance measures for a company such are ours where the disclosed value of a share of common stock is an estimated value, and there is no net assets value determination during the offering stage and for a period thereafter. FFO and MFFO are not useful measures in evaluating net asset value because impairments are taken into account in determining net asset value but not in determining FFO and MFFO. Investors are therefore cautioned that we may not recover any impairment charges. MFFO also excludes rental revenue adjustments and unrealized gains and losses related to certain other fair value adjustments. Although the related holdings are not held for sale or used in trading activities, if the holdings were sold currently, it could affect our operating results and any fair value losses may not be recoverable from future operations. Accordingly, both FFO and MFFO should be reviewed in connection with other GAAP measurements. Our FFO and MFFO as presented may not be comparable to amounts calculated by other REITs. FFO and MFFO are not indicative of our cash available to fund distributions since other uses of cash, such as capital expenditures and principal payment of debt related to investments in unconsolidated real estate joint ventures, are not deducted when calculating FFO and MFFO. FFO and MFFO are not replacements for financial information presented in conformity with GAAP and should be reviewed in connection with other GAAP measurements. |

|
|
© 2012 Behringer Harvard 31 Non-GAAP Reconciliations (continued) The following table presents our calculation of FFO and MFFO for the years ended December 31, 2011, 2010 and 2009 (in millions, except per share amounts): 2011 2010 2009 Net income (loss) attributable to common stockholders 98.6 $ (34.6) $ (8.3) $ Real estate depreciation and amortization, net of noncontrolling interests (a) 56.1 43.1 7.6 Gain on sale of joint venture interests (b) (5.7) - - FFO attributable to common stockholders 149.0 8.5 (0.7) Gain on revaluation of equity on a business combination (c) (121.9) (2.7) - Gain on early extinguishment of debt - (0.1) - Acquisition expenses, net of noncontrolling interests (d) 6.3 12.1 5.0 Straight-line rents, net of noncontrolling interests 0.8 0.9 0.3 MFFO attributable to common stockholders 34.2 $ 18.7 $ 4.6 $ GAAP weighted average common shares (e) 138.1 83.5 32.5 Net income (loss) per common share 0.71 $ (0.41) $ (0.26) $ FFO per common share 1.08 $ 0.10 $ (0.02) $ MFFO per common share 0.25 $ 0.22 $ 0.14 $ For the Year Ended December 31, |

|
|
© 2012 Behringer Harvard 32 Non-GAAP Reconciliations (continued) a) The real estate depreciation and amortization amount includes our share of consolidated real estate-related depreciation and amortization of intangibles, less amounts attributable to noncontrolling interests, and our similar estimated share of unconsolidated Co-Investment Venture depreciation and amortization, which is included in earnings of unconsolidated real estate joint venture investments. b) As provided in our definition of FFO, we excluded in our computation of FFO above the $5.7 million gain from the sale of our partial interests in six multifamily communities to the MW CO-JV in December 2011. In conjunction with this transaction, we realized cash proceeds of $100.6 million and an increase to paid-in capital of $39.6 million. c) As provided in our definition of MFFO, we excluded in our computation of MFFO above the $121.9 million gain on revaluation of equity on business combinations in 2011. In May 2011, the primary asset acquired in a business combination, the Waterford Place multifamily community, was sold, providing proceeds, net of the assumption of the related mortgage loan and settle of other net assets, liabilities and noncontrolling interest, of approximately $27.8 million and a gain on revaluation of equity of $18.1 million. Additionally, in December 2011, the business combinations of our investments in the BHMP CO-JVs and MW CO-JVs resulted in an aggregate gain of approximately $103.8 million. The gain was primarily a function of the recognition of recording the assets of the multifamily communities at their fair value on December 1, 2011. d) Acquisition expenses include our share of expenses incurred by us, less amounts attributable to noncontrolling interests, and our unconsolidated investments in real estate joint ventures, including amounts incurred with our Advisor. Acquisition expenses also include operating expenses that were identified or given credit by the seller in the acquisition but are expensed in accordance with GAAP. e) During the year ended December 31, 2011, GAAP weighted average common shares were 138.1 million resulting in an increase of 65% from the comparable period of 2010. The increases are due to increases in number of shares sold under our Initial Public Offering during 2011. |

|
|
© 2012 Behringer Harvard 33 Non-GAAP Reconciliations (continued) We define Combined NOI as rental revenue, less property operating expenses, real estate taxes and property management fees, including similar amounts related to unconsolidated real estate joint ventures. We believe that Combined NOI provides a supplemental measure of our operating performance because Combined NOI reflects the operating performance of our properties and excludes items that are not associated with property operations of the Company, such as general and administrative expenses, asset management fees and interest expense. Combined NOI also excludes revenues not associated with property operations, such as interest income and other non-property related revenues. Because our activity includes transactions that consolidated or unconsolidated our multifamily investments, Combined NOI may be helpful in evaluating all of our multifamily operations and providing comparability to other real estate companies. The following table presents our Combined NOI for the years ended December 31, 2011, 2010 and 2009 (in thousands): 2011 2010 2009 Rental revenue 159,448 $ 90,268 $ 13,783 $ Expenses: Property operating expenses 48,528 33,479 8,103 Real estate taxes 21,348 12,767 2,029 69,876 46,246 10,132 Combined NOI 89,572 $ 44,022 $ 3,651 $ For the Year Ended December 31, |

|
|
© 2012 Behringer Harvard 34 Non-GAAP Reconciliations (continued) Combined NOI should not be considered as an alternative to net income (loss) or income (loss) from continuing operations, as an indication of our liquidity, nor an indication of funds available to fund our cash needs, including our ability to fund distributions. Because Combined NOI does not include interest expense, general and administrative expenses, impairment charges and other non-property operations and revenues, investors are cautioned that Combined NOI should only be used to assess operating performance of multifamily communities. Further, because Combined NOI excludes certain GAAP expenses incurred in operating the REIT, particularly impairment and interest expense, Combined NOI is not a useful measure in evaluating net asset value of the REIT. Accordingly, Combined NOI should not be viewed with greater prominence to GAAP measurements but in connection with other GAAP measurements. Our Combined NOI, particularly the inclusion of amounts related to unconsolidated joint ventures, may not be comparable to amounts calculated by other REITs. Combined NOI is not indicative of our funds available to fund distributions since other uses of cash, such as interest expense, general and administrative expenses, capital expenditures and principal payments, are not deducted in calculating Combined NOI. The following table presents a reconciliation of our Income (loss) from continuing operations to Combined NOI for the years ended December 31, 2011, 2010 and 2009 (in thousands): 2011 2010 2009 Income (loss) from continuing operations 93,919 $ (34,520) $ (8,116) $ Adjustments to reconcile income (loss) from continuing operations to Combined NOI: Asset management fees 6,307 5,146 2,051 General and administrative expenses 4,570 4,242 3,160 Acquisition expenses 6,163 10,775 3,393 Interest expense 11,245 4,916 101 Depreciation and amortization 38,813 20,147 2,113 Interest income (3,360) (1,376) (1,089) Gain on revaluation of equity on business combinations (121,938) - - Gain on sale of joint venture interests (5,724) - - Equity in loss of investments in unconsolidated real estate joint ventures 7,877 6,892 238 NOI of unconsolidated investments in joint ventures 51,700 27,800 1,800 Combined NOI 89,572 $ 44,022 $ 3,651 $ For the Year Ended December 31, |

|
|
© 2012 Behringer Harvard 35 Multifamily REIT I, Inc. Investments Grand Reserve The Eclipse The Reserve at John Creek Walk 55 Hundred The Cameron All communities pictured above are joint venture owned communities Bailey’s Crossing. |

|
|
© 2012 Behringer Harvard 36 Questions? During the call, please e-mail questions to: bhreit@behringerharvard.com |

|
|
© 2012 Behringer Harvard 37 Playback Information Representatives may log on to the password protected portion of the Behringer Harvard website (www.behringerharvard.com) call Investors may dial toll free (855) 859-2056 and use conference ID 36464964 call Replays will be available until Friday, May 11 for a playback of today’s to access a playback of today’s |
