Attached files
| file | filename |
|---|---|
| 8-K - FORM 8-K - Delta Tucker Holdings, Inc. | d330949d8k.htm |
| EX-99.1 - PRESS RELEASE ISSUED BY THE COMPANIES ON APRIL 9, 2012 - Delta Tucker Holdings, Inc. | d330949dex991.htm |
 April 9, 2012
Delta Tucker Holdings, Inc.
Parent of DynCorp International, Inc.
4th Quarter 2011 Final Earnings
Presentation
Exhibit 99.2 |
 Page 2
April 9, 2012
Forward-Looking Statements and Non-GAAP Measures
This presentation includes forward-looking statements about Company’s future
business and financial performance, plans, goals, beliefs, or
expectations. All of these forward-looking statements are based on estimates and assumptions made by
the Company’s management that, although believed by the Company to be
reasonable, are inherently uncertain. Forward- looking statements involve
risks and uncertainties, including, but not limited to, our substantial level of indebtedness; the
outcome of any litigation, government investigation, audit or other regulatory
matters; award fee determination; termination or modification of key
contracts; changes in the demand for services; acts of war or terrorist activities; changes
in significant operating expenses; and other economic, competitive, governmental,
political and technological factors outside of the Company’s
control. These risks and uncertainties may cause the Company’s business, strategy or actual
results or events to differ materially from the statements made herein.
All
forward
looking
statements
included
in
this
presentation
are
based
upon
information
presently
available.
DynCorp
International undertakes no obligation to update or revise any forward-looking
statement it makes to reflect events or circumstances after the date of this
presentation or to reflect the occurrence of unanticipated events. The risks and
uncertainties relating to the forward-looking statements in this presentation
include those described under the caption “Risk
Factors”
and
“Forward-Looking
Statements”
detailed
from
time
to
time
in
our
reports
filed
with
the
SEC.
This presentation includes non-GAAP financial measures, including Adjusted
EBITDA, that are different from financial measures
calculated
in
accordance
with
GAAP
and
may
be
different
from
non-GAAP
calculations
made
by
other
companies. Management believes these non-GAAP financial measures are useful in
evaluating operating performance and are regularly used by investors, lenders
and other interested parties in reviewing the Company. For a reconciliation of these
non-GAAP financial measures to the most comparable GAAP financial measures, see
the earnings press release dated April 9,
2012 filed with the SEC on Current Report on Form 8-K and posted on our
website. |
 Page 3
April 9, 2012
DI Year in Review
2011 Initiatives Made an Impact
Reorganized Business & COEs
Win Rate Above 40% / Booked Over $5.1B of Orders
Stood Up a Supply Chain Organization
Leveraged $75M in Annual Savings
Implemented a Working Capital Improvement Plan
DSO Improves 13 Days from 2010 Levels
Focused on Leadership
Developed and Aligned the Team
Achieved Solid Financial Performance
Revenue of $3.7B –
Up 9.9% From 2010 Levels
Recorded $193.6M in Adjusted EBITDA –
Margins at 5.2%
Reduced Term Loan by $151M |
 Page 4
April 9, 2012
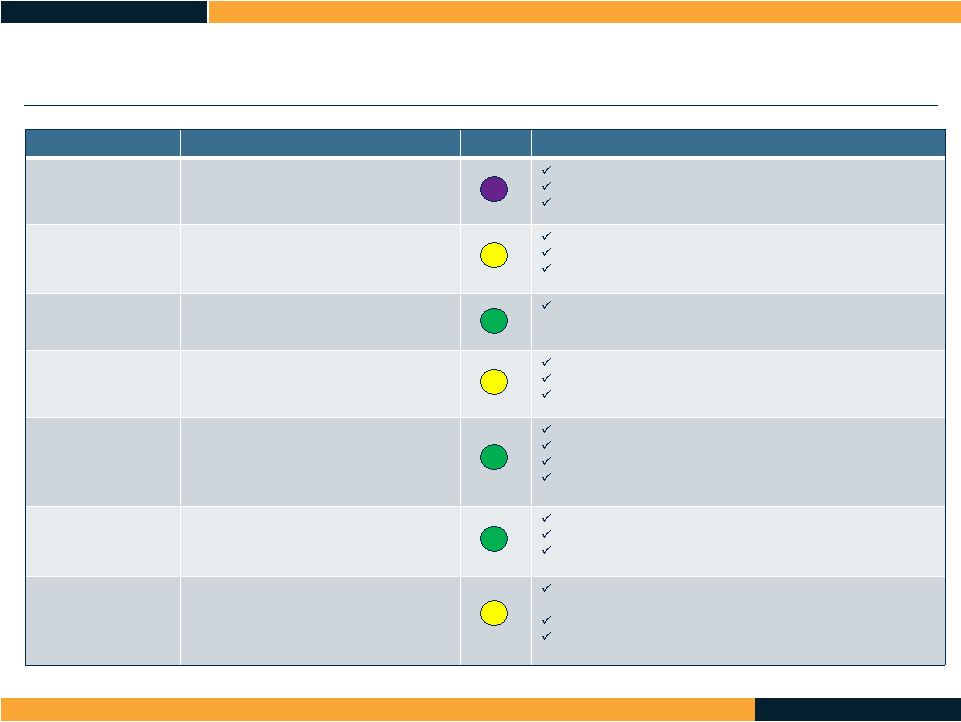
Area of Concern
Priority Actions
Status
Comments
Business
Development
Redesign
•
Develop Marketing Department
•
Enhance Capture Process
•
Align Pricing Function
Redesigned Business Development Function
Created Marketing Function
Increased Funnel by $6.2 Billion (38% Increase)
Business System
Redesign
•
Leverage Company spend
•
Strategize Terms and Conditions (T/Cs)
•
Develop Strategic Discriminator
Prior Corrective Action Plans Scrubbed
Enhanced Focus on Business Systems
Launched 3-Phase Business System Remediation Plan
Cost Structure
•
Delayer
•
Develop Market Focus
•
Optimize Business Processes
De-layered: Introduced Business Area Teams (“BAT”) and
Centers of Excellence (“COE”)
Supply Chain
Redesign
•
Identify the Right Leaders
•
Develop Second and Third Tier
Leaders to Support Growth
Organization Redesign Completed
Spend Analysis Underway
Master Service Agreements Being Developed
Compliance
•
Identify and Develop Brand Identity
•
Educate External Audiences (Media,
Administration, Congress, Customers,
Partners, Oversight, decision Makers
and Opinion leaders)
Formalized Investigation and Adjudication Process
Code of Ethics and Business Conduct Rollout
Compliance Newsletter
Re-vamped Training
Leadership
Development
•
Who Are We Training?
•
When Do We Reach Them?
•
With What Information?
Talent Review Conducted
New Organization Formed
Training Framework Defined; Courses in Development
Brand and
Communications
•
Focus on Employees
•
Build a Foundation of Public
Understanding
•
Take a Strategic Approach to Proactive
Communications
Launched Advertising and Online Reputation
Management Campaigns
Launched Employee Spotlight for Internal/External Use
Increased Proactive Outreach Around BAT Teams
2011 Critical Action Plan -
Status |
 Page 5
April 9, 2012
CEO View on 2012
Environment Remains Uncertain
The U.S. Afghan Strategy Under a Microscope
Middle East Remains Unstable
U.S. Presidential Election
2012 DoD Budget Still Robust
2012 O&M Budget at $197B
Continue to Make Progress on Strategic Initiatives
Large IDIQs
Diversify Offering
Focus on Program and Operational Excellence
LOGCAP Award Fee Scores
Reorganized into Strategic Groups to Fit the Changing Environment
|
 Page 6
April 9, 2012
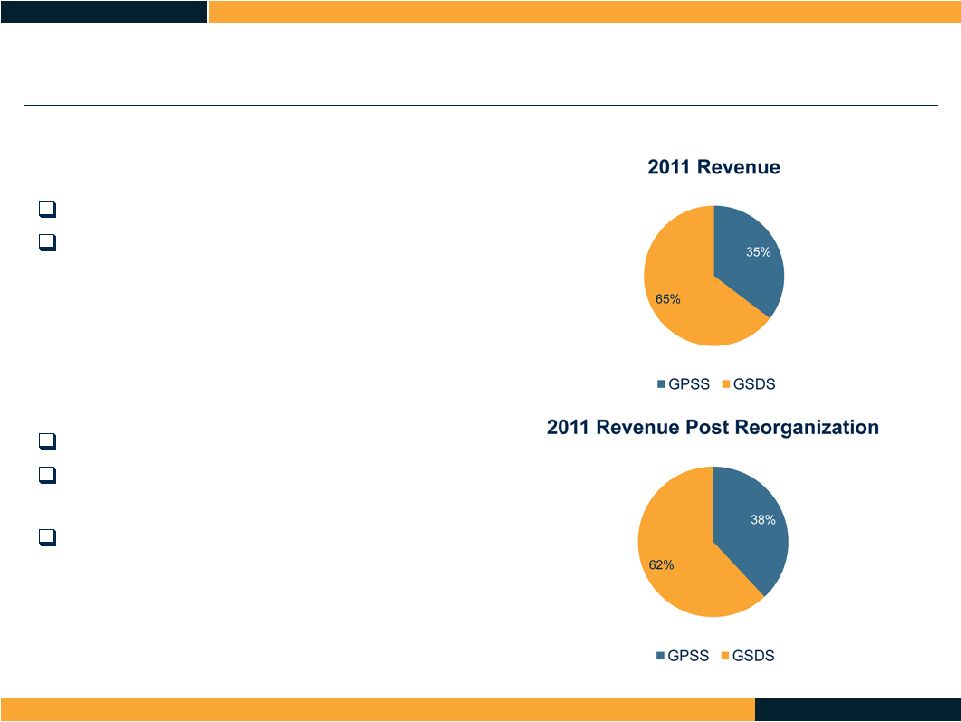
2012 New Business Construct –
Strategic Groups
GPSS:
Aviation Group –
Aviation BAT, Air Ops BAT
Global Logistics & Development Solutions
Group –
Development, O&M and
Contingency Operations BATs (excluding
LOGCAP IV)
GSDS:
Security Services Group –
Security BAT
Training & Intelligence Group –
T&M BAT,
Intelligence Training & Solutions BAT
LOGCAP IV program –
Standalone Group
to Optimize Management, Oversight and
Performance of the Program |
 Page 7
April 9, 2012
Big Drivers in U.S. Defense and Foreign Policy
Budget Season
Sequester would “Automatically
hollow out the force!”
Secretary Leon Panetta
FY12 DOD Enacted
•
$646B
FY13 DOD Request
•
$613.9B
FY13 DOD Budget
Winners/Losers
•
FY13 Modernization cut 53%
•
O&M Base --
$209B (+$11.7B)
FY12 State Enacted
•
$54B
FY13 State Request
•
$51.6B
FY13 State Winners/Losers
•
Topline down $2.4B
•
OCO --
up in Afghanistan,
down in Iraq
•
State funding is Obama
priority
Sequester
•
“Goofy!”
Secretary Panetta
Derailing the Strategy?
•
Green on Blue
•
Quran Burning
•
Civilian Shootings
Transition to Afghan Lead
•
Advisory teams embedded
Afghan Security Forces
Strategy
State Department Transition
•
“Early phases of military-to-
civilian transition”
•
Embassy branches in
Kandahar, Mazar-i-Sharif,
Herat, and Jalalabad
Long Term Presence
•
Strategic Partnership
•
De-scope vs. MILCON
•
Special Operations lead
Afghanistan: Transition
not Withdrawal
“Our forces will still be
fighting on the ground,
before, during and after
2014.”
Ambassador Neumann
War with Iran
“We will take every step available
to prevent Iran from obtaining a
nuclear weapon.”
President
Barack Obama
“Zone of Immunity”
•
Israeli strike?
•
“Iran will have nuclear
capability of a dozen
weapons within 60 months.”
General Barry McCaffrey
Iranian Military Capable
•
Submarines
•
Modern missile boats
•
Capable of significant damage
to Saudi and GCC oil shipping
and production
Worldwide Economic Impact
•
Iran
is
4
th
largest
oil
producer
•
Massive oil market disruptions
Policy Options
•
Acquiescence
•
Diplomacy.
•
Containment / Deterrence
/SPECOPS
•
Military Action
Interesting Times
“The United States should lead
an international effort to protect
key population centers in Syria.”
Senator John McCain
Syrian Crisis
•
Civil War
Pakistan
•
Secret cable warns about
havens
Iraq
•
Stabilizing or not?
African Contingency
•
Washington Post:
“Constellation of
secret bases”
Latin American Drug Wars
•
Mexico: Merida Initiative
•
Central America Security
Initiative
•
Caribbean Basin Security
Initiative
Pivot to Asia
•
Philippine Base Access
•
Australia hosts American
troops |
 Page 8
April 9, 2012
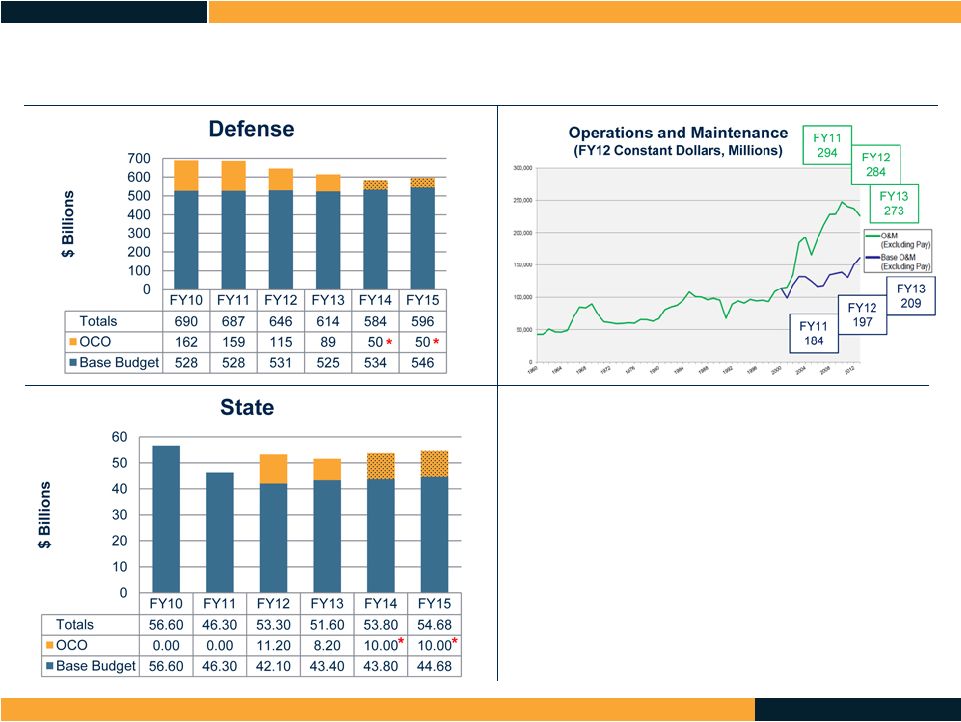
2013 Budget Request Outlook
•
OCO Declines as Wars Wind Down
•
Base Requirement Continues
•
O&M Base Adjusting –
Big
Requirement Moving Forward
•
Fundamental Shift in how DoS Funds
Global Demands |
 Page 9
April 9, 2012
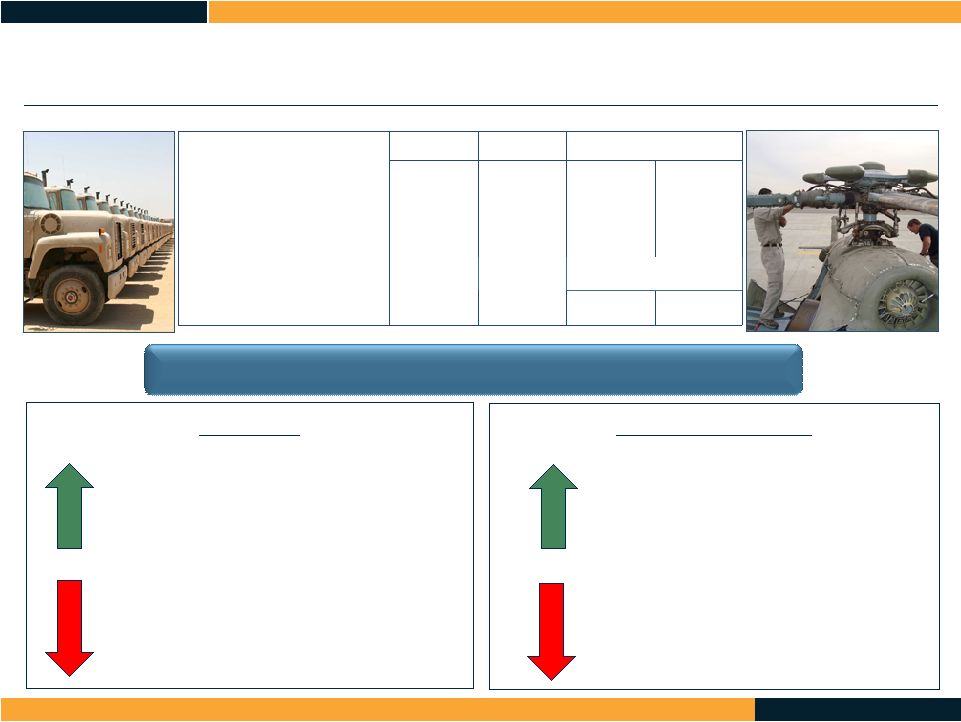
Strategy to Market Alignment
Cut Procurement & RDT&E Funding
Reduce Force Structure
Increase O&M Funding
Enterprise IDIQs
MRAP Sustainment and Support $2B+
Aviation Field Maintenance (AFM) $2B+
CNTPO $3B+
Eagle (Follow on to First) IDIQ $30B
DI Strategies and Actions
Arab Awakening
GCC Customers Spending
Increased Opportunity in Africa
Spending + Central/South America
Established KSA Office
U.K. Opportunities
LOGCAP Africa
ARAVI Win
Egypt PSS Win
DI Strategies and Actions
Region Rife with Tension
U.S. Repositioning Forces
Maritime & Aviation Focus
Increased SOCOM Activity
Partnering for Australian Opportunities
Expand in the Philippines
Align with U.S. Asia/Pacific BOS Expansion
DI Strategies and Actions
Market Dynamics / Customer Actions
Market Dynamics / Geopolitics
Market Dynamics / Pivot to Asia |
 Page 10
April 9, 2012
Financial Review |
 Page 11
April 9, 2012
Full Year Highlights
Revenue
LOGCAP IV
INL Air Wing
CSTC-A, AMDP
CNTPO, CFT Aviation
CivPol Afghanistan and Iraq
Program Losses-APK Somalia,
LCCS
Adjusted EBITDA
LOGCAP IV Volume
INL Air Wing
CFT Margins
CNTPO
Aviation New Contracts
CivPol Volume & Mix
MRAP Lower Profitability
Program Losses
GLS (JV) Lower Troop Levels in Iraq
Dollars in millions
Q4 2011
CY 2011
2011 vs. 2010
Revenue
$983.0
$3,721.5
$334.4
9.9%*
Adjusted EBITDA
$41.4
$193.6
($26.2)
(11.9%)
Adjusted EBITDA Margin
4.2%
5.2%
(129 bps)
Total Backlog
$5,741
$959
20.1%
2011 Results
*excluding GLS revenue in 2010 |
 Page 12
April 9, 2012
Global Stabilization and Development Solutions
Adjusted EBITDA
Training and Mentoring –
CSTC-A, AMDP, CivPol
Security Services
Contingency Operations –
LOGCAP IV AF Score
Total Backlog
LOGCAP IV, Security Services, ITS
CivPol, CSTC-A, Development, APK, MNSTC-I
Dollars in millions
Revenue
Contingency Operations –
LOGCAP IV, AFRICAP
Training and Mentoring –
AMDP, CSTC-A
Security Services –
WPS
CivPol
Q4 2011
CY 2011
2011 vs. 2010
Revenue
$638.8
$2,402.1
$315.3
15.1%
Adjusted EBITDA
$12.5
$77.2
($22.3)
(22.4%)
Adjusted EBITDA
Margin
2.0%
3.2%
(155 bps)
Total Backlog
$2,940
$184
6.7%
4Q-Highlights |
 Page 13
April 9, 2012
Global Platform Support Solutions
Total Backlog
CFT, Andrews, C21, Pax River, International
INL Air Wing, Columbus, Sheppard
Dollars in millions
Revenue
Air Operations –
INL Air Wing
Aviation –
CFT, VIPSAM, CNTPO,
Ft. Campbell, Pax River
O&M-MRAP Programs
Aviation –
LCCS Loss
Adjusted EBITDA
Air Operations –
INL Air Wing
Aviation –
CNTPO Volume, CFT Margins,
VIPSAM, Pax River
O&M –
MRAP –
Lower Profit on New Contract
Aviation –
LCCS Loss
4Q-Highlights
Q4 2011
CY 2011
2011 vs. 2010
Revenue
$349.4
$1,313.6
$17.5
1.3%
Adjusted EBITDA
$30.0
$104.8
$5.7
5.8%
Adjusted EBITDA
Margin
8.6%
8.0%
(33 bps)
Total Backlog
$2,801
$775
38.3% |
 Page 14
April 9, 2012
EBITDA Down on Lower Troop Levels in Iraq
Represents DI’s 51% Share of Joint Venture
Investment in GLS Written Down in 3Q
Dollars in millions
Global Linguist Solutions Joint Venture (GLS)
Q4 2011
CY 2011
2011 vs. 2010
Adjusted EBITDA
$0.0
$11.8
($8.4)
(41.5%) |
 Page 15
April 9, 2012
2011 Free Cash Flow of $163.1M
Cash From Operating Activities –
$168M
Purchase of Property, Equipment and Software –
($4.9M)
Working Capital of $376M –
10.1%
Improved Substantially from Q3 levels of 11.5%
DSO at 69 –
Improved 7 Days from Q3 & 13 Days from 2010
Current Net Debt Position of $802.7M
Improved $83.4M from Q3 2011
Improved $169.0M from December 2010
Net Cash Position of $70.2M at December 2011
$151.3M of Total Debt Reduction in 2011
Financial Review –
CY11 |
 Page 16
April 9, 2012
Internal Plan Forecasts Growth
Revenue Growth Expected in Mid-Single Digit Range
Adjusted EBITDA to Grow as Well
Margins to Remain Flat
Profitability & Margins to Expand in Aviation Group
Final Year of Headwind from CivPol / AMDP Transition
Loss of GLS Profitability in Iraq also a Headwind
Cash Flows to Remain Strong
Continued Liquidation of Investment in Working Capital
2012 Guidance |
 Page 17
April 9, 2012
CEO Summary
Proud of the Team’s Accomplishments In 2011
Foreign Policy Environment Remains Uncertain
Reorganized the Business to Align with New Realities
Strong Backlog Provides Momentum for 2012
Must Focus On Program and Operational Excellence
Increase LOGCAP Award fee Scores
Continue to Execute our Strategies
Enterprise IDIQs
Diversify Our Offering
Continue the Momentum
Make Our Commitments in 2012 |
 Page 18
April 9, 2012
Q&A |
 Page 19
April 9, 2012
Appendix |
 Page 20
April 9, 2012
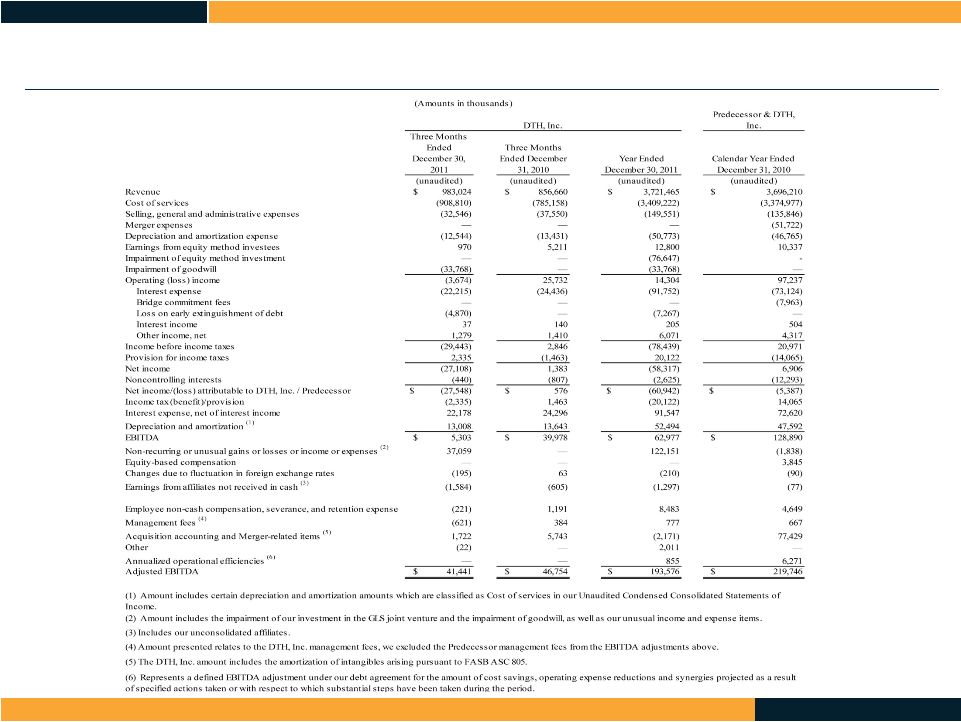
Condensed Consolidated Statement of Operations |
 Page 21
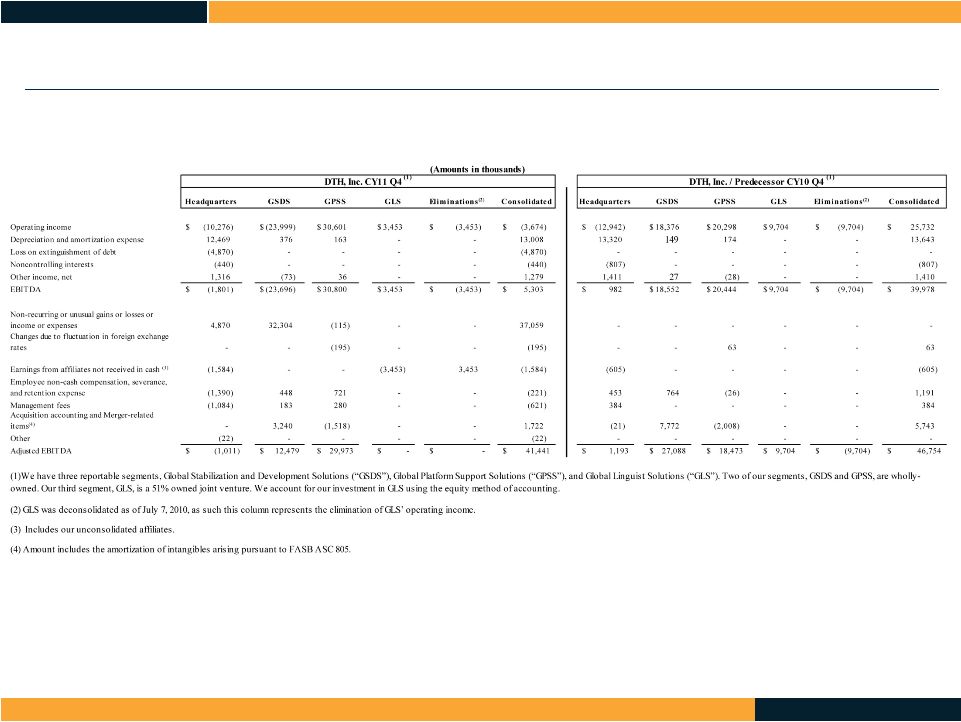
April 9, 2012
Adjusted EBITDA by Segment |
 Page 22
April 9, 2012
Condensed Consolidated Balance Sheets
December 30, 2011
December 31, 2010
(unaudited)
(unaudited)
ASSETS
Current assets:
Cash and cash equivalents
70,205
$
52,537
$
Restricted cash
10,773
9,342
Accounts receivable, net of allowances of $1,947 and $558,
respectively 752,756
782,095
Other current assets
88,877
150,613
Total current assets
922,611
994,587
Non-current assets
1,091,810
1,268,768
Total assets
2,014,421
$
2,263,355
$
LIABILITIES AND EQUITY
Current portion of long-term debt
-
$
5,700
$
Other current liabilities
633,259
639,172
Total current liabilities
633,259
644,872
Long-term debt, less current portion
872,909
1,018,512
Other long-term liabilities
50,768
82,645
Total equity attributable to Delta Tucker Holdings, Inc.
452,299
512,975
Noncontrolling interest
5,186
4,351
Total equity
457,485
517,326
Total liabilities and equity
2,014,421
$
2,263,355
$
(Amounts in thousands)
|