Attached files
| file | filename |
|---|---|
| EXCEL - IDEA: XBRL DOCUMENT - COVER ALL TECHNOLOGIES INC | Financial_Report.xls |
| EX-31.1 - EX-31.1 - COVER ALL TECHNOLOGIES INC | d29041_ex31-1.htm |
| EX-31.2 - EX-31.2 - COVER ALL TECHNOLOGIES INC | d29041_ex31-2.htm |
| EX-23.1 - EX-23.1 - COVER ALL TECHNOLOGIES INC | d29041_ex23-1.htm |
| EX-32.1 - EX-32.1 - COVER ALL TECHNOLOGIES INC | d29041_ex32-1.htm |
| EX-32.2 - EX-32.2 - COVER ALL TECHNOLOGIES INC | d29041_ex32-2.htm |
UNITED STATES
SECURITIES AND EXCHANGE COMMISSION
SECURITIES AND EXCHANGE COMMISSION
Washington, D.C. 20549
FORM 10-K
[X] |
Annual Report Pursuant to Section 13 or 15(d) of the Securities Exchange Act of 1934 |
For the fiscal year ended
December 31, 2011.
[ ] |
Transition Report Pursuant to Section 13 or 15(d) of the Securities Exchange Act of 1934 |
For the transition period from
______ to ______.
Commission file number 1-09228
COVER-ALL TECHNOLOGIES INC.
(Exact name of Registrant as specified in its
charter)
Delaware (State or other jurisdiction of incorporation or organization) |
13-2698053 (I.R.S. Employer Identification No.) |
|||||
55 Lane
Road, Fairfield, New Jersey (Address of principal executive office) |
07004 (Zip Code) |
|||||
(973) 461-5200
(Registrant’s telephone number, including area code)
(Registrant’s telephone number, including area code)
Securities registered pursuant to Section 12(b) of the
Act:
None
None
Securities registered pursuant to Section 12(g) of the
Act:
Common Stock, par value $.01 per share
Common Stock, par value $.01 per share
Indicate by check mark if the
registrant is a well-known seasoned issuer, as defined in Rule 405 of the Securities Act. Yes [ ] No [X]
Indicate by check mark if the
registrant is not required to file reports pursuant to Section 13 or Section 15(d) of the Exchange Act. Yes [ ] No [X]
Indicate by check mark whether
the registrant (1) has filed all reports required to be filed by Section 13 or 15(d) of the Securities Exchange Act of 1934 during the preceding 12
months (or for such shorter period that the registrant was required to file such reports), and (2) has been subject to such filing requirements for the
past 90 days. Yes [X] No [ ]
Indicate by check mark whether
the registrant has submitted electronically and posted on its corporate Web site, if any, every Interactive Data File required to be submitted and
posted pursuant to Rule 405 of Regulation S-T (§232.405 of this chapter) during the preceding 12 months (or for such shorter period that the
registrant was required to submit and post such files). Yes [X] No [ ]
Indicate by check mark if
disclosure of delinquent filers pursuant to Item 405 of Regulation S-K (§229.405 of this chapter) is not contained herein, and will not be
contained, to the best of registrant’s knowledge, in definitive proxy or information statements incorporated by reference in Part III of this Form
10-K or any amendment to this Form 10-K. [X]
Indicate by check mark whether
the registrant is a large accelerated filer, an accelerated filer, a non-accelerated filer, or a smaller reporting company. See the definitions of
“larger accelerated filer,” “accelerated filer” and “smaller reporting company” in Rule 12b-2 of the Exchange Act. (Check
one):
Large accelerated
filer [ ] |
Accelerated filer
[ ] |
|||||
Non-accelerated
filer (Do not check if a smaller reporting company) [ ] |
Smaller reporting
company [X] |
|||||
Indicate by check mark whether
the registrant is a shell company (as defined in Rule 12b-2 of the Act).
Yes [ ] No [X]
Yes [ ] No [X]
The aggregate market value of the voting and non-voting
common equity held by non-affiliates of the registrant as of June 30, 2011, the last business day of the registrant’s most recently completed
second fiscal quarter, was approximately $39,494,000.
As of March 19, 2012, there were 25,782,730 shares
outstanding of our common stock.
Documents Incorporated by Reference:
Portions of the Registrant’s Proxy Statement for the
2012 Annual Meeting of Stockholders (“Proxy Statement”), to be filed with the Securities and Exchange Commission (the “SEC”) not
later than 120 days after the close of the Registrant’s fiscal year, are incorporated by reference as described in Part III.
FORWARD-LOOKING STATEMENTS
Certain of the matters discussed
in this annual report on Form 10-K, including, without limitation, matters discussed under Item 1 — “Business”, Item 1A —
“Risk Factors” and Item 7 — “Management’s Discussion and Analysis of Financial Condition and Results of Operations,” may
constitute forward-looking statements within the meaning of Section 21E of the Securities Exchange Act of 1934, as amended (the “Exchange
Act”). These forward-looking statements are necessarily subjective and involve known and unknown risks, uncertainties and other important factors
that could cause our actual results, performance or achievements, or industry results, to differ materially from any future results, performance or
achievement described or implied by such statements. Certain of these forward-looking statements can be identified by the use of forward-looking
terminology such as “believes,” “expects,” “may,” “will,” “should,” “seeks,”
“approximately,” “intends,” “plans,” “estimates,” or “anticipates” or the negative of these terms or
other comparable terminology, or by discussions of strategy, objectives, expectations, plans or intentions. Statements contained in this annual report
on Form 10-K that are not historical facts are forward-looking statements. Without limiting the generality of the preceding statement, all statements
in this annual report on Form 10-K concerning or relating to estimated and projected earnings, margins, costs, expenditures, cash flows, growth rates
and financial results are forward-looking statements. In addition, through our senior management, from time to time we make forward-looking statements
concerning our expected future operations and performance and other developments. Such forward-looking statements are necessarily estimates reflecting
our best judgment based upon current information and involve a number of risks and uncertainties. Other factors may affect the accuracy of these
forward-looking statements and our actual results may differ materially from the results anticipated in these forward-looking statements. While it is
impossible to identify all such factors, factors that could cause actual results to differ materially from those estimated by us include, but are not
limited to, those factors or conditions described under Item 1A — “Risk Factors” and Item 7 — “Management’s Discussion
and Analysis of Financial Condition and Results of Operations — Critical Accounting Policies and Estimates” and general conditions in the
economy and capital markets. Except to the extent required by applicable laws and regulations, we undertake no obligations to update any
forward-looking statements to reflect events or circumstances after the date of this annual report on Form 10-K or to reflect the occurrence of
unanticipated events.
PART I |
|||||||||||
ITEM
1. |
BUSINESS |
1 | |||||||||
ITEM
1A. |
RISK
FACTORS |
8 | |||||||||
ITEM
1B. |
UNRESOLVED STAFF COMMENTS |
12 | |||||||||
ITEM
2. |
PROPERTIES |
12 | |||||||||
ITEM
3. |
LEGAL
PROCEEDINGS |
12 | |||||||||
ITEM
4. |
MINE
SAFETY DISCLOSURES |
12 | |||||||||
PART II |
|||||||||||
ITEM
5. |
MARKET FOR REGISTRANT’S COMMON EQUITY, RELATED STOCKHOLDER MATTERS AND ISSUER PURCHASES OF EQUITY SECURITIES |
13 | |||||||||
ITEM
6. |
SELECTED FINANCIAL DATA |
16 | |||||||||
ITEM
7. |
MANAGEMENT’S DISCUSSION AND ANALYSIS OF FINANCIAL CONDITION AND RESULTS OF OPERATIONS |
17 | |||||||||
ITEM
7A. |
QUANTITATIVE AND QUALITATIVE DISCLOSURES ABOUT MARKET RISK |
28 | |||||||||
ITEM
8. |
FINANCIAL STATEMENTS AND SUPPLEMENTARY DATA |
28 | |||||||||
ITEM
9. |
CHANGES IN AND DISAGREEMENTS WITH ACCOUNTANTS ON ACCOUNTING AND FINANCIAL DISCLOSURE |
28 | |||||||||
ITEM
9A. |
CONTROLS AND PROCEDURES |
28 | |||||||||
ITEM
9B. |
OTHER
INFORMATION |
29 | |||||||||
PART III |
|||||||||||
ITEM
10. |
DIRECTORS, EXECUTIVE OFFICERS AND CORPORATE GOVERNANCE |
30 | |||||||||
ITEM
11. |
EXECUTIVE COMPENSATION |
31 | |||||||||
ITEM
12. |
SECURITY OWNERSHIP OF CERTAIN BENEFICIAL OWNERS AND MANAGEMENT AND RELATED STOCKHOLDER MATTERS |
31 | |||||||||
ITEM
13. |
CERTAIN RELATIONSHIPS AND RELATED TRANSACTIONS, AND DIRECTOR INDEPENDENCE |
31 | |||||||||
ITEM
14. |
PRINCIPAL ACCOUNTING FEES AND SERVICES |
31 | |||||||||
PART IV |
|||||||||||
ITEM
15. |
EXHIBITS AND FINANCIAL STATEMENT SCHEDULES |
32 | |||||||||
i
PART I
ITEM
1. |
BUSINESS |
In this annual report on Form
10-K, “Cover-All,” “the Registrant,” “the Company,” “our Company,” “we,” “us” and
“our” refer to Cover-All Technologies Inc. and its wholly-owned subsidiary, Cover-All Systems, Inc. Cover-All®, My Insurance CenterTM (MIC) NexGen and Insurance Policy DatabaseTM (IPD) are trademarks of Cover-All Technologies Inc.
GENERAL
We provide advanced,
cost-effective business-focused solutions to the property and casualty insurance industry. Our customers include insurance companies, agents, brokers
and managing general agents (MGAs). Our proprietary technology solutions and services are designed to enable our customers to introduce new products
quickly, expand their distribution channels, reduce costs and improve service to their customers. In addition, we also offer an innovative Business
Intelligence suite of products to enable our customers to leverage their information assets for real time business insights and for better risk
selection, pricing and financial reporting.
In December 2011, we expanded our
portfolio of insurance solutions by acquiring the assets of a leading claims solution provider, BlueWave Technology. The acquisition of claims software
marked another milestone in our goal of becoming a leading full solution provider to the property and casualty insurance industry.
Our software products and
services focus on the functions required to underwrite, rate, quote, issue, print, bill and support the entire lifecycle of insurance policies and with
the BlueWave acquisition, the important claims functions. Our products and services combine an in-depth knowledge of property and casualty insurance
with an innovative and proprietary state-of-the-art technology platform. Our products provide advanced insurance functionality available on an
“off-the-shelf” basis yet also provide additional flexibility for accommodating a high degree of customization for our customers to compete
in the marketplace through differentiation. Our software is licensed for use in the customer’s data centers or can be provided through our
application services provider, referred to as “ASP,” using third party technology platforms and support.
We generate revenue from software
contract licenses, professional services fees from ongoing software customization and continuing maintenance fees for technical and regulatory software
updates on a monthly basis. We provide a wide range of professional services that support product customizations, conversion from existing systems,
data integration with other software or reporting agencies and other technical services. We also offer ongoing support services including incorporating
recent insurance rates, rules and forms changes. These support services provide turnkey solutions to our customers as we perform analysis, development,
quality assurance, documentation and distribution for delivering changes in a timely fashion.
Our ongoing maintenance and
support services, usually through five-year minimum customer contracts, typically generate significant recurring revenue of approximately 25 to 30
cents for every dollar spent on licensing fees.
We were incorporated in Delaware
in April 1985 as Warner Computer Systems, Inc. and changed our name to Warner Insurance Services, Inc. in March 1992. In June 1996, we changed our name
to Cover-All Technologies Inc. Our products and services are offered through our wholly-owned subsidiary, Cover-All Systems, Inc., also a Delaware
corporation.
PRODUCTS
My Insurance
Center
Our My Insurance Center, referred
to as “MIC,” is a customizable and configurable web-based, data-centric “hub and spoke” software platform built around a shared
“information hub” and suite of product components. MIC is designed for insurance agents, brokers and carriers with integrated workflows and
access to real-time information. By centralizing the data in the MIC platform and using customized components to enable processes, we can quickly build
a unique solution for each customer.
1
My Insurance Center is designed
to efficiently and rapidly adapt to changes in our customer’s business needs as well as to address the complexity and rate of change of the
insurance business, state regulation and technology innovation. The MIC architecture concept was originally introduced in 2001 and it has been
significantly enhanced and expanded every year since. The early implementations of My Insurance Center utilized our then-existing rating and issuance
products. In 2009, we announced MIC NexGen, a set of capabilities designed and built to support the entire policy issuance process to add significant
functionality, enhance performance and position Cover-All to introduce new service offerings.
Our My Insurance Center NexGen
component is a powerful set of tools and capabilities providing full policy support (data capture, rate, quote, issue, statistical reporting, print,
audits and complete policy lifecycle management) for customized products that we believe is unparalleled in the insurance industry. We have also
developed a set of processes and tools that enable us to work together with our customers in an interactive development process that, when combined
with our off-shore development resources, deliver these products in short time frames.
In addition to our ability to
create and support custom products, we offer off-the-shelf products including full support for such complex products as ISO’s (Insurance Services
Office) Commercial Automobile and Commercial Package products for all states as well as full support for Workers Compensation. Some of these new
products have been developed and released in 2010. With the delivery of the NexGen products, we have completely replaced all our older platforms,
collectively known as Classic, with new, fully integrated state-of-the-art technologies.
These NexGen products have been
redesigned by us to enable us to provide services to our customers that can be measured in terms of quality, speed and value. In addition, we are able
to provide a significant number of capabilities to our customers to enable them to customize, personalize and control their My Insurance Center
platform in real time.
MIC is designed to be the
platform to serve players throughout the entire insurance value chain, including the insured, agents, brokers, insurance companies and reinsurers.
Because it is scalable, MIC is able to serve both large and small organizations. MIC can be accessed securely over the Internet. MIC is designed to be
deployed globally in the future to adapt to different languages and currencies and to support different insurance products in other
countries.
MIC provides an integrated
platform with baseline common insurance functions that can be customized by us for customers’ business needs. MIC also provides many configuration
capabilities that are used by customers for further tailoring the application. Finally, MIC allows end users to personalize screens and content for
meeting their roles and responsibilities.
MIC is designed to fully support
STP (Straight-Through-Processing). MIC enables our customers to utilize our rating, policy issuance, billing and other software components into a
fully-integrated platform that, among other things, eliminates redundant data entry. Information is stored in a client-centric database and becomes
immediately available to other users or functions. MIC may be customized to generate user alerts when a user-specified condition occurs. Additionally,
MIC has been designed to allow the customer to configure features according to their own look and feel preferences and workflow processes. For
instance, the browser-based user interface allows employees, agents and other end users to personalize their desktops so they see only the information
they need or desire. We believe that MIC allows our customers to reduce costs, leverage the latest technologies, better manage risk, provide better
service to their customers, enter new markets, introduce new products and grow premiums.
We are investing in research and
development for evolving the MIC platform to meet customers’ business needs in a rapidly changing marketplace. We have added new and advanced
capabilities to MIC, such as our NexGen policy administration platform, workflow management, rules-based underwriting, financial modules for
determining profitability by policy, account-centric and policy-centric views, integration with partners’ accounting, claims processing systems
and certain other new components. With these new capabilities, MIC enables us to develop complex and custom products in shorter timeframes for
introducing new insurance products into the marketplace.
My Insurance Center utilizes a
data-centric architecture which enables us to provide our customers with an integrated solution of shared information. When combined with the
straight-through processing and information access tools, My Insurance Center provides outstanding access to information for business leaders. In
addition, this data centric approach enables us to interface with external data sources and other internal systems very effectively.
Access to accurate and timely
information can be a significant competitive advantage for better pricing, risk selection and service. With this access to information, our customers
can develop insights and tools to create competitive
2
advantage. The nimbleness of My Insurance Center can then be leveraged to open new markets, develop new products, or implement new predictive modeling tools to improve underwriting.
In order to exploit these information-driven opportunities, in April 2010 we
purchased certain assets of Moore Stephens Business Solutions LLC (“MSBS”), a provider of custom business intelligence solutions for the property and
casualty insurance industry. While creating custom business intelligence solutions for a number of insurance clients, MSBS had developed a template for
new customers that created a starting point for new implementations. Utilizing our experience in creating customizable, out-of-the-box products, we
developed a new product that, while utilizing some of the design concepts of MSBS, is both fully integrated with MIC and a stand-alone product with interfaces
to other policy administration, claims and reinsurance systems. We expect that this new product will be sold as an additional component to MIC customers
and will “plug in” to their existing MIC, as well as to other customers to interface with their existing infrastructure of systems.
MIC is being made available to
users either for in-house implementation or through our ASP. We also support “Software as a Service” (SaaS) to meet emerging customer
requirements.
MIC offers the following benefits
to our customers:
• |
Straight-Through-Processing — Business acquisition and the processing side of commercial property and casualty insurance is not only complex but it is highly regulated and spans across multiple constituents in the value chain. Straight-Through-Processing helps customers to reduce expenses, provide faster service times and obtain a higher degree of compliance. MIC provides Straight-Through-Processing through browser-based accessibility, roles-based security, rules-based underwriting, advanced workflow referrals and comprehensive insurance processing functions such as rating, issuance, printing and statistical coding. |
• |
Speed To Market — In a highly competitive insurance marketplace, insurers seek to maintain competitive advantage and high profit margins through innovation and introduction of new insurance products. The information-hub architecture of MIC enables development of complex and custom products in rapid timeframes. |
• |
Regulatory Compliance — In highly state regulated insurance industry, compliance requires frequent software updates and audit capabilities. MIC provides regulatory updates, which are delivered on a monthly basis through our support services. |
• |
Security — MIC provides roles-based security with fine-grained access control, and encryption with data auditing helps enterprise data centers meet their security requirements. |
• |
Configurability — MIC provides a wide scope of customization to allow MIC to meet customers’ business and operational needs while taking advantage of its baseline common capabilities for achieving cost-effective and rapid implementation. |
• |
Integration — MIC provides real-time integration with audit logs for seamlessly integrating MIC with other systems in our customers’ technical ecosystem. |
• |
Openness and Scalability — MIC is based on open technologies such as J2EE, XML, Oracle and Web 2.0 (AJAX, GWT) through which we can deliver technological changes. MIC is designed to scale “horizontally” without adding significant cost to meet customers’ growing business needs. |
MIC NexGen — The Policy
Administration Component of MIC
The MIC NexGen software uses a
unique design that separates the “insurance product definition” from the actual technology “engines.” The sophistication of this
design is intended to enable us to stay current with technology innovations while preserving our “insurance knowledge” investment. In
addition, by centralizing many of the complexities of insurance in the core (similar to a video game console), we are able to create metadata-driven
“cartridges” that define the actual insurance product (rates, rules, forms, etc.) very quickly. In addition, MIC NexGen is designed for
change and flexibility.
The MIC NexGen software and
products support the following policy functions:
• |
Data capture and editing |
• |
Rating |
• |
Policy issuance including multiple recipient print |
• |
All policy transactions including quotes, new lines, endorsements, renewals, audits and cancellations |
• |
Statistical coding |
• |
Full Policy Print (with variable data) |
3
• |
Audits |
• |
Out of Sequence Processing |
• |
Full Policy Life Cycle support |
• |
Installments |
MIC NexGen is designed to
accommodate all lines of property and casualty insurance. We believe that it is especially effective in coping with the complexity and variability of
commercial lines of insurance.
We believe that this flexibility
of MIC NexGen is a competitive advantage, and we have utilized its capabilities to develop many custom products as well as all state support for
Workers Compensation, ISO Commercial Automobile (delivered in the first quarter of 2011) and ISO Commercial Package (delivered in the second quarter of
2011). The NexGen products have now replaced our earlier MIC Rating & Issuance products that have been in use by our customers for many years.
Today, we offer off-the-shelf support for more than 40 lines of commercial business in all 50 states, the District of Columbia and Puerto
Rico.
Both the older Rating &
Issuance and the new NexGen platform leverage the Engine/Metadata design and are fully integrated with the MIC platform. The innovative design of the
product isolates insurance product knowledge from the application itself in data files, referred to as “Metadata.” We have built an extensive
knowledge base, estimated at more than 100 person-years of effort, in this Metadata that defines the details of virtually hundreds of insurance policy
types and coverages.
The MIC Rating & Insurance
product is in use in over 30 companies.
The new NexGen policy
administration platform of MIC provides the following advanced capabilities:
• |
Dynamic data capture for reducing data entry and different views for brokers and underwriters |
• |
Improved user interface and features for boosting user productivity |
• |
Custom and complex rating algorithm |
• |
Custom or branded document generation capability |
• |
Rapid development of new products and changes in existing products |
• |
Better audit support for compliance checks |
• |
Out of Sequence endorsement processing |
My Insurance Center —
Functional Capabilities
We have, through MIC, a deep
inventory of insurance software components combined with a sophisticated implementation platform. MIC includes the following critical
components:
• |
My Insurance Center Portal |
• |
Enterprise, Customer-centric Oracle database |
• |
Underwriting Tools |
• |
End User access to information in real time — Straight-Through-Processing |
• |
Rating and Issuance |
• |
Full policy lifecycle support |
• |
Clear and comprehensive data collection with extensive real time edits |
• |
Policy history — easy policy changes and useful for activities such as coverage inquiries |
• |
On-line system, screen and field level look-ups |
• |
On-line Commercial Lines Manual Tables and Footnotes |
• |
Easy and direct system navigation |
• |
Standard ISO (Insurance Service Office)/NCCI coverages and rates support |
• |
Company customized coverages and rates support |
• |
Fully automated recipient-driven issuance of insurance policies, worksheets, ID cards, etc., including print preview |
• |
Policy database |
• |
Multiple company/program/state/coverage support |
• |
Templates to reduce data entry time |
4
• |
Advanced Billing Capabilities — integrating with NetSuite |
• |
Claims Repository |
• |
Customer Relationship Management |
• |
Agency and Program Management |
• |
Advanced Administration Tools |
• |
Access to Web Services and Information Providers |
• |
Policy Dashboard — premium and loss information |
• |
Advanced Workflows, Diaries |
• |
Electronic Underwriting files |
• |
Compliance Assist, Help Desk |
• |
Interfaces to “back end” accounting and reporting systems |
• |
Policy-level Premium and Loss Information for profitability tracking/accounting |
• |
Quote, Binder, Policy Lifecycle support |
We continue to utilize and expand
these capabilities to expand and leverage our ability to respond to broadening marketplace and new customer opportunities with solutions that address
the special needs of carriers, managing general agents, agents, brokers and third party providers with both off-the-shelf and custom
solutions.
We are also increasing and
enhancing our services portfolio. We have expanded our professional services with conversion and interface offerings. We developed new rules-based
capabilities to enable us to implement data exchange services that will save our customers time and effort converting to our products or linking our
products to existing systems. We also have developed a “custom” service offering for customers who desire specially-tailored services,
service level agreements and other services that enable them to achieve their business objectives.
We believe that our
business-focused approach allows customers to accelerate their time to market, solve ongoing business challenges and achieve sustainable competitive
advantages during periods of economic uncertainty.
COMPETITION
The computer software and
services industry is highly competitive and rapidly changing, as current competitors expand their product offerings and new companies enter the
marketplace. Because of our extensive base of knowledge in the insurance industry, however, we believe that our products offer customers certain
advantages not available from our competitors. Our customers have access to our extensive experience and software inventory in the area of rating and
policy issuance of commercial lines policies, among the most complex of insurance transactions.
There are a number of larger
companies, including computer software, services and outsourcing companies, consulting firms, computer manufacturers and insurance companies that have
greater financial resources than we have and possess the technological ability to develop software products similar to those we offer. These companies
represent a significant competitive challenge to our business. Very large insurers that internally develop systems similar to ours may or may not
become our major customers for software or services. We compete on the basis of our insurance knowledge, products, service, price, system functionality
and performance and technological advances.
MARKETING
We maintain an in-house sales and
marketing staff. We also utilize outside consultants and other complimentary service providers to market our products. We redesigned our Internet site
and established linkages to portals and other websites. We will continue to expand in 2012 as we focus on the Internet as a valuable source of
information for current and potential customers interested in our products and services. We participate in, display and demonstrate our software
products at industry trade shows. Our consulting staff, business partners and other third parties also generate sales leads. We also communicate with
our existing customers in a variety of ways including an annual Customer Conference.
RESEARCH AND DEVELOPMENT
Our business is characterized by
rapid business and technological change. We believe our success will depend, in part, on our ability to meet the new needs of our customers and the
marketplace as well as continuing to enhance our products
5
based on new technologies. Accordingly, we must maintain ongoing research and development programs to add value to our suite of products, as well as any possible expansion of our product lines.
Our goal with all of our products
and services is to enhance the ease of implementation, functionality, long-term flexibility and the ability to provide improved customer
service.
Research and development expenses
were $617,000, $847,000 and $891,000 for the years ended December 31, 2011, 2010 and 2009, respectively.
INTELLECTUAL PROPERTY
We currently have no patents or
patent applications pending. We rely on a combination of trade secret, copyright and trademark laws, nondisclosure and other contractual agreements and
technical measures to protect our proprietary rights.
BACKLOG
We had no licenses, support
services or professional services backlog of unbilled work of as of December 31, 2011.
MAJOR CUSTOMERS
Our product line is in use in
over 30 companies. For the years ended December 31, 2011, 2010 and 2009, we had three, four and three customers who contributed revenues in excess of
10% of our total revenues for the respective years.
As our business has grown, we
have become less reliant on any one major customer, including three units of Chartis Inc., formerly units of American International Group, Inc.
(“CHARTIS”). For the year ended December 31, 2011, two customers, none of which are units of CHARTIS, generated approximately 19% and 13% of
our revenues, respectively.
A third customer, a unit of
CHARTIS, generated approximately 10%, 11% and 15% of our revenues for the years ended December 31, 2011, 2010 and 2009, respectively. Another customer,
a second unit of CHARTIS, generated approximately 5%, 5% and 12% of our revenue for the years ended December 31, 2011, 2010 and 2009, respectively, and
one other customer, a third unit of CHARTIS, generated approximately 4%, 4% and 6% of our revenue for the years ended December 31, 2011, 2010 and 2009,
respectively. The aggregate percentage of our total revenue generated by the three CHARTIS customers for the years ended December 31, 2011, 2010 and
2009, respectively, is 19%, 20% and 33%.
On March 29, 2012, we received notice from the third, and on March 30, 2012,
we received notice from the second of the CHARTIS units referred to above that each will not renew its respective contractual arrangements, pursuant to which
they were primarily receiving support services, with us when those arrangements expire on September 30, 2012. We have not received any notice of
non-renewal of our contractual arrangements from the first of the CHARTIS units referred to above, and we expect that our contractual arrangements with such
unit will continue upon the same terms and conditions as had been in effect in 2011. For the year ended December 31, 2011, the revenues we generated from
support services for the three units of CHARTIS represented approximately 8%, 4% and 4%, respectively, of our total revenues, and the total revenues we
generated from the three units of CHARTIS represented approximately 10%, 5% and 4%, respectively, of our total revenues.
6
EMPLOYEES
We had 71 employees, all of whom
were full-time employees, as of December 31, 2011. None of our employees is represented by a labor union, and we have not experienced any work
stoppages. We believe that relations with our employees are good.
AVAILABLE INFORMATION
We are subject to the reporting
requirements of the Exchange Act, and the rules and regulations promulgated thereunder, and accordingly file reports, information statements or other
information with the SEC, including annual reports on Form 10-K, quarterly reports on Form 10-Q, reports of current events on Form 8-K and proxy or
information statements. The public may read and copy any materials we file with the SEC at its Public Reference Room at 100 F Street, NE, Washington,
D.C. 20549. The public may obtain information on the operation of the Public Reference Room by calling the SEC at 1-800-SEC-0330. The SEC maintains an
Internet site that contains reports, proxy and information statements and other information regarding issuers that file electronically with the
SEC.
Our website address is
www.cover-all.com. We make available, free of charge, through our website our annual reports on Form 10-K, quarterly reports on Form 10-Q and current
reports on Form 8-K filed or furnished pursuant to Section 13(a) or 15(d) of the Exchange Act as soon as reasonably practicable after we electronically
file such material with, or furnish it to, the SEC. The information on our website is not incorporated by reference into this annual report on Form
10-K.
7
ITEM
1A. |
RISK FACTORS |
RISK FACTORS
In addition to the other
information described elsewhere in this annual report on Form 10-K, you should carefully consider the following risk factors, which could materially
adversely affect our business, financial condition and results of operations. The risks described below are not the only risks facing our Company.
Additional risks and uncertainties not currently known to us or that we currently deem to be immaterial may materially adversely affect our business,
financial condition and results of operations.
RISKS RELATED TO OUR BUSINESS AND OUR
INDUSTRY
If we do not continue to innovate
and provide products and services that are useful to insurance companies in a cost-effective way, we may not remain competitive, and our revenues and
operating results could suffer.
Our future success depends on our
ability to provide innovative and quality products and services for the insurance marketplace. Because our products and services represent the core
functionality that powers the businesses of our customers, our competitors are constantly developing innovations in similar products and services. As a
result, we must continue to invest significant resources in research and development in order to enhance our existing products and services and
introduce new products and services that insurance companies can easily and effectively use. If we are unsuccessful in these endeavors, we may not
remain competitive, and our revenues and operating results could suffer. Additionally, we rely on our references from existing customers for new sales.
If we are unable to provide quality products and services, then our customers may become dissatisfied and may not provide these references. We also
rely on an offshore software development vendor for developing and servicing our products, and our operating results would suffer if we cannot maintain
our current cost structure through offshore development resources in the future.
We depend on product
introductions in order to remain competitive in our industry.
We are currently investing
resources in product development and expect to continue to do so in the future. Our future success will depend on our ability to continue to enhance
our current product line and to continue to develop and introduce new products that keep pace with competitive product introductions and technological
developments, satisfy diverse and evolving insurance industry requirements and otherwise achieve market acceptance. We may not be successful in
continuing to introduce and market, on a timely and cost-effective basis, product enhancements or new products that respond to technological advances
by others. Any failure by us to anticipate or respond adequately to changes in technology and insurance industry preferences, or any significant delays
in product development or introduction, would significantly and adversely affect our business, operating results and financial
condition.
Our products may not achieve
market acceptance, which may make it difficult for us to compete.
Our future success will depend
upon our ability to increase the number of insurance companies that license our software products. As a result of the intense competition in our
industry and the rapid technological changes which characterize it, our products may not achieve significant market acceptance. Further, insurance
companies are typically characterized by slow decision-making and numerous bureaucratic and institutional obstacles which will make our efforts to
significantly expand our customer base difficult.
We depend on key
personnel.
Our success depends to a
significant extent upon a limited number of members of senior management and other key employees, including John W. Roblin, our Chief Executive
Officer, Manish D. Shah, our President and Chief Technology Officer, and Maryanne Gallagher, our Executive Vice President and Chief Operating Officer.
We maintain “key-man” life insurance on Mr. Roblin, Mr. Shah and Ms. Gallagher in the amount of $1,000,000 per individual. The loss of the
service of one or more key managers or other key employees could have a significant and adverse effect upon our business, operating results or
financial condition. In addition, we believe that our future success will depend in large part upon our ability to attract and retain additional highly
skilled technical, management, sales and marketing personnel. Competition for such personnel in the computer software industry is intense. We may not
be successful in attracting and retaining such personnel, and the failure to do so could have a material adverse effect on our business, operating
results or financial condition.
8
We may be subject to information
technology system failures and network disruptions.
Information technology system
failures, network disruptions and breaches of data security caused by such factors, including, but not limited to, earthquakes, fire, flood, theft,
fraud, malicious attack, acts of terrorism or other causes could disrupt our operations. While we have taken steps to address these concerns by
implementing internal control measures, there can be no assurance that such a system failure, disruption or breach will not materially adversely affect
our financial condition and operating results, including loss of revenue due to adverse customer reaction or required corrective action. In addition,
our property and business interruption insurance coverage may not be adequate to fully compensate us for losses that may occur.
Our market is highly
competitive.
Both the computer software and
the insurance software systems industries are highly competitive. There are a number of larger companies, including computer manufacturers, computer
service and software companies and insurance companies, that have greater financial resources than we have. These companies currently offer and have
the technological ability to develop software products that are core to the business of insurance companies and similar to those offered by us. These
companies present a significant competitive challenge to our business. Because we do not have the same financial resources as these competitors, we may
have a difficult time in the future in competing with these companies. In addition, very large insurers internally develop systems similar to our
systems and as a result, they may not become customers of our software. We compete on the basis of our insurance knowledge, products, service, price,
system functionality and performance and technological advances. Although we believe we can continue to compete on the basis of these factors, some of
our current competitors have longer operating histories, larger customer bases, greater brand recognition and significantly greater financial,
marketing and other resources than we do. Our current competitors may be able to:
• |
undertake more extensive marketing campaigns for their brands and services; |
• |
devote more resources to product development; |
• |
adopt more aggressive pricing policies; and |
• |
make more attractive offers to potential employees and third-party service providers. |
We may need additional financing
in order to continue to develop our business.
We may need additional financing
to continue to fund acquisitions and business development and to expand and grow our business generally. If equity securities are issued in connection
with a financing or business acquisition, dilution to our stockholders may result, and if additional funds are raised through the incurrence of debt,
we may be subject to further restrictions on our operations and finances both in and outside the ordinary course of business. As of December 31, 2011,
we had net stockholders’ equity of approximately $16,921,000 and net working capital of approximately $3,251,000.
We depend upon proprietary
technology and we are subject to the risk of third party claims of infringement.
Our success and ability to
compete depends in part upon our proprietary software technology. We also rely on certain software that we license from others. We rely on a
combination of trade secret, copyright and trademark laws, nondisclosure and other contractual agreements and technical measures to protect our
proprietary rights. We currently have no patents or patent applications pending. Despite our efforts to protect our proprietary rights, unauthorized
parties may attempt to copy aspects of our products or to obtain and use information that we regard as proprietary. The steps we take to protect our
proprietary technology may not prevent misappropriation of our technology, and this protection may not stop competitors from developing products which
function or have features similar to our products.
While we believe that our
products and trademarks do not infringe upon the proprietary rights of third parties, third parties may claim that our products infringe, or may
infringe, upon their proprietary rights. Any infringement claims, with or without merit, could be time-consuming, result in costly litigation and
diversion of technical and management personnel, cause product shipment delays or require us to develop non-infringing technology or enter into royalty
or licensing agreements. Royalty or licensing agreements, if required, may not be available on terms acceptable to us or at all. If a claim of product
infringement against us is successful and we fail or are unable to develop non-infringing technology or license the infringed or similar technology,
our business, operating results and financial condition could be significantly and adversely affected.
9
We depend on existing major
customers, the loss of one or more of which could have a material adverse effect on our results of operations and financial
condition.
We anticipate that our operations will continue to depend upon the continuing
business of our existing customers, particularly our major customers, and the ability to attract new customers. The loss of one or more of our existing
major customers or our inability to continue to attract new customers could significantly and adversely affect our business, operating results and financial
condition.
In 2011, 2010 and 2009, our software products operations depended primarily on
certain existing major customers. Two customers generated approximately 19% and 13% of our revenues in 2011. One additional customer, a unit of
CHARTIS, accounted for approximately 10%, 11% and 15% of our total revenues in 2011, 2010 and 2009, respectively. One other customer, a second unit of
CHARTIS, accounted for approximately 5%, 5% and 12% of our total revenues in 2011, 2010 and 2009, respectively. Another customer, a third unit of CHARTIS,
generated approximately 4%, 4% and 6% of our total revenues for the years ended December 31, 2011, 2010, and 2009, respectively.
NYSE Amex’s listing standards, we may be delisted. In the event of delisting, trading of our common stock would most likely be conducted in the over the counter market on an electronic bulletin board established for unlisted securities, which could have a material adverse effect on the market liquidity and value of our common stock.
significant increase in its accounts receivable in 2009 due to the license sales to new customers offset by non-cash expenses and payment of liabilities.
On March 29, 2012, we received notice from the third, and on March 30, 2012,
we received notice from the second of the CHARTIS units referred to above that each will not renew its respective contractual arrangements, pursuant to which
they were primarily receiving support services, with us when those arrangements expire on September 30, 2012. We have not received any notice of
non-renewal of our contractual arrangements from the first of the CHARTIS units referred to above, and we expect that our contractual arrangements with such
unit will continue upon the same terms and conditions as had been in effect in 2011. For the year ended December 31, 2011, the revenues we generated from
support services for the three units of CHARTIS represented approximately 8%, 4% and 4%, respectively, of our total revenues, and the total revenues we
generated from the three units of CHARTIS represented approximately 10%, 5% and 4%, respectively, of our total revenues. See “Business – Major
Customers”. The impact of the non-renewal by the second and third CHARTIS units of their contractual arrangements would not be realized until the
fourth quarter of 2012, and for that quarter the maximum potential impact to our revenue resulting from any such non-renewal would be approximately $360,000.
A decline in computer software
spending may result in a decrease in our revenues or lower our growth rate.
A decline in the demand for
computer software among our current and prospective customers may result in decreased revenues or a lower growth rate for us because our sales depend,
in part, on our customers’ level of funding for new or additional computer software systems and services. Moreover, demand for our solutions may
be reduced by a decline in overall demand for computer software and services. The current decline in overall technology spending may cause our
customers to reduce or eliminate software and services spending and cause price erosion for our solutions, which would substantially affect our sales
of new software licenses and the average sales price for these licenses. Because of these market and economic conditions, we believe there will
continue to be uncertainty in the level of demand for our products and services. Accordingly, we cannot assure you that we will be able to increase or
maintain our revenues.
We may not get the full benefit
of our tax loss carry forwards.
Under the United States Internal
Revenue Code, companies that have not been operating profitably are allowed to apply certain of their past losses to offset future taxable income
liabilities they may incur once they reach profitability. These amounts are known as net operating tax loss carryforwards. At December 31, 2011, we had
approximately $9 million of federal net operating tax loss carryforwards expiring at various dates through 2026. Because of certain provisions of the
Tax Reform Act of 1986 related to change of control, however, we may not get the full benefit of these loss carryforwards. If we are limited from using
net operating tax loss carryforwards to offset any of our income, this would increase our taxes owed and reduce our cash for
operations.
RISKS RELATED TO OUR COMMON STOCK
If we are unable to maintain the
listing standards of the NYSE Amex, our common stock may be delisted, which may have a material adverse effect on the liquidity and value of our common
stock.
Our common stock is traded on the
NYSE Amex. To maintain our listing on the NYSE Amex, we must meet certain financial and liquidity criteria. The market price of our common stock has
been and may continue to be subject to significant fluctuation as a result of periodic variations in our revenues and results of operations. If we fail
to meet any of the
10
NYSE Amex’s listing standards, we may be delisted. In the event of delisting, trading of our common stock would most likely be conducted in the over the counter market on an electronic bulletin board established for unlisted securities, which could have a material adverse effect on the market liquidity and value of our common stock.
Holders of our common stock may
have difficulty in selling those shares.
While our common shares trade on
the NYSE Amex, our stock is thinly traded and investors may have difficulty in selling their shares. The low trading volume of our common stock is
outside of our control, and may not increase in the near future or, even if it does increase in the future, may not be maintained. In addition, because
our common stock trades at a price less than $5.00 per share, brokers effecting transactions in our common stock may be subject to additional customer
disclosure and record keeping obligations, including disclosure of the risks associated with low price stocks, stock quote information and broker
compensation. Brokers effecting transactions in our common stock may also be subject to additional sales practice requirements under certain Exchange
Act rules, including making inquiries into the suitability of investments for each customer or obtaining a prior written agreement for the specific
stock purchase. Because of these additional obligations, some brokers will not effect transactions in our common stock.
Our stock price has been
volatile.
Quarterly operating results have
fluctuated and are likely to continue to fluctuate. The market price of our common stock has been and may continue to be volatile. Factors that are
difficult to predict, such as quarterly revenues and operating results, limited trading volumes and overall market performance, may have a significant
effect on the price of our common stock. Revenues and operating results have varied considerably in the past from period to period and are likely to
vary considerably in the future. We plan product development and other expenses based on anticipated future revenue. If revenue falls below
expectations, financial performance is likely to be adversely affected because only small portions of expenses vary with revenue. As a result,
quarterly period-to-period comparisons of operating results are not necessarily meaningful and should not be relied upon to predict future
performance.
Provisions of our certificate of
incorporation, as amended, and by-laws and Delaware law might discourage, delay or prevent a change of control of or changes in our management and, as
a result, depress the trading price of our common stock.
Our certificate of incorporation,
as amended (the “Certificate of Incorporation”), and by-laws contain provisions that could discourage, delay or prevent a change in control
or changes in our management that our stockholders may deem advantageous. These provisions:
• |
require super-majority voting to amend some provisions in our Certificate of Incorporation and by-laws; |
• |
establish a staggered board of directors; |
• |
limit the ability of our stockholders to call special meetings of stockholders; |
• |
prohibit stockholder action by written consent, which requires all stockholder actions to be taken at a meeting of our stockholders; |
• |
provide that the board of directors is expressly authorized to make, alter or repeal our by-laws; and |
• |
establish advance notice requirements for nominations for election to our board of directors or for proposing matters that can be acted upon by stockholders at stockholder meetings. |
In addition, we are subject to
Section 203 of the Delaware General Corporation Law, which, subject to some exceptions, prohibits “business combinations” between a Delaware
corporation and an “interested stockholder,” which is generally defined as a stockholder who becomes a beneficial owner of 15% or more of a
Delaware corporation’s voting stock for a three-year period following the date that the stockholder became an interested stockholder. Section 203
could have the effect of delaying, deferring or preventing a change in control that our stockholders might consider to be in their best
interests.
These anti-takeover defenses
could discourage, delay or prevent a transaction involving a change in control. These provisions could also discourage proxy contests and make it more
difficult for you and other stockholders to elect directors of your choosing and cause us to take corporate actions other than those you
desire.
11
We may not pay any cash dividends
on our common stock in the future.
Declaration and payment of any
dividend on our common stock is subject to the discretion of our board of directors. The timing and amount of dividend payments will be dependent upon
factors such as our earnings, financial condition, cash requirements and availability, and restrictions in our credit facilities. While we paid a
special cash dividend in April 2009, the payment of future dividends is not guaranteed or assured. Accordingly, it is likely that investors may have to
rely on sales of their common stock after price appreciation, which may never occur, as the only way to realize any future gains on their
investment.
RISKS RELATED TO ACQUISITIONS
We may fail to realize the
anticipated benefits of the acquisitions of the PipelineClaims assets of Ho’ike Services, Inc. dba BlueWave Technology, and the assets of Moore
Stephens Business Solutions, LLC.
On December 30, 2011, we acquired
substantially all of the PipelineClaims assets (excluding working capital) of Ho’ike Services, Inc. dba BlueWave Technology (“BlueWave”), and on April 12, 2010, we
acquired substantially all of the assets (excluding working capital) of MSBS, in each instance through our wholly-owned subsidiary, Cover-All Systems,
Inc. The success of these acquisitions will depend on, among other things, our ability to realize anticipated benefits, growth opportunities and cost
savings and to integrate the operations of BlueWave and MSBS in a manner that does not materially disrupt our own operations. If we are not able to
successfully achieve these objectives, the anticipated benefits of the acquisition may not be realized fully, or at all, or may take longer to realize
than expected. Further, it is possible that the integration process could result in the disruption of the ongoing business or inconsistencies in
standards, controls, procedures and policies that would adversely affect our business, financial condition or results of operations.
ITEM
1B. |
UNRESOLVED STAFF COMMENTS |
Not applicable.
ITEM
2. |
PROPERTIES |
Our headquarters is located in
Fairfield, New Jersey, where we occupy approximately 20,000 square feet under a lease that expires on October 31, 2012. Currently, we fully utilize
this facility. We believe that our headquarters is well maintained and adequate to meet our needs for the foreseeable future. Based upon the upcoming
expiration of this lease, however, we are currently assessing our operational needs and evaluating our options for remaining at our present location
under a new lease or entering into a new lease at a different location following the end of our current lease. We believe that if we do not remain at
our current location, we could find alternative space and relocate our operations to such new location without any material disruption to our
business.
As a consequence of our
acquisition of MSBS, we also have office space of approximately 6,000 square feet located in mid-town Manhattan under a separate lease which is due to
expire on January 31, 2014. We believe that this office space is also well maintained and will be adequate to meet our needs for the foreseeable
future. In connection with our BlueWave acquisition, we are continuing to use a portion of the premises used by the business prior to the acquisition
located in Honolulu, Hawaii, pursuant to a short-term transitional arrangement between us and Ho’ike Services, Inc. We are currently in the
process of seeking new office space in Honolulu from which we will continue to operate the BlueWave business.
ITEM
3. |
LEGAL PROCEEDINGS |
None.
ITEM
4. |
MINE SAFETY DISCLOSURES |
Not applicable.
12
PART II
ITEM 5.
|
MARKET FOR REGISTRANT’S COMMON EQUITY, RELATED STOCKHOLDER MATTERS AND ISSUER PURCHASES OF EQUITY SECURITIES |
MARKET PRICE OF AND DIVIDENDS ON COMMON
STOCK
Our common stock has been quoted
on the NYSE Amex under the symbol “COVR” since May 25, 2011. Prior to May 25, 2011, our common stock was quoted on the OTCQB market under the
symbol “COVR.PK” and prior to February 23, 2011, our common stock was quoted on the OTC Bulletin Board under the symbol “COVR.OB”.
The table below sets forth (x) for the periods indicated commencing from and after May 25, 2011, the high and low sales prices for our common stock on
the NYSE Amex and (y) for periods preceding May 25, 2011, the high and low bid prices for our common stock as reported on the OTCQB or OTC Bulletin
Board, as applicable. The quotations below for OTCQB or OTC Bulletin Board, as applicable, bid prices reflect inter-dealer prices, without retail
mark-up, mark-down or commission and may not necessarily represent actual transactions.
| 2011: |
High |
Low |
||||||||
|---|---|---|---|---|---|---|---|---|---|---|
4th
Quarter |
$ | 1.95 | $ | 1.29 | ||||||
3rd
Quarter |
2.69 | 1.75 | ||||||||
2nd
Quarter |
3.37 | 1.90 | ||||||||
1st
Quarter |
2.30 | 1.51 | ||||||||
2010: |
High | Low | ||||||||
4th Quarter |
$ | 1.62 | $ | 1.20 | ||||||
3rd Quarter |
1.45 | 1.17 | ||||||||
2nd Quarter |
1.75 | 1.12 | ||||||||
1st Quarter |
1.49 | 0.94 | ||||||||
As of March 19, 2012, there were
445 holders of record of our common stock. This number does not include beneficial owners who may hold their shares in street name.
No dividends were declared in
2011 or 2010.
The closing sales price for our
common stock on March 19, 2012 was $2.31, as reported by the NYSE Amex.
13
EQUITY COMPENSATION PLAN INFORMATION
The following table sets forth,
as of December 31, 2011, information related to our equity compensation plans. All options to acquire our equity securities are exercisable for or
represent the right to purchase our common stock.
| Plan Category |
Number of Securities to be Issued Upon Exercise of Outstanding Options, Warrants and Rights (a) |
Weighted-Average Exercise Price of Outstanding Options, Warrants and Rights (b) |
Number of Securities Remaining Available for Future Issuance Under Equity Compensation Plans (Excluding Securities Referenced in Column (a)) (c) |
|||||||||||
|---|---|---|---|---|---|---|---|---|---|---|---|---|---|---|
Equity
Compensation Plans Approved by Security Holders(1) |
1,777,463 | 1.24 | 2,195,179 | |||||||||||
Equity
Compensation Plans Not Approved by Security Holders |
— | — | — | |||||||||||
Total |
1,777,463 | 1.24 | 2,195,179 | |||||||||||
(1) |
Reflects grants under our Amended and Restated 2005 Stock Incentive Plan. The numbers in the table include the restricted stock granted under our 2005 Stock Incentive Plan. |
14
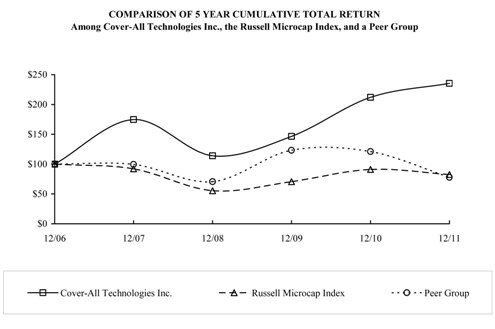
PERFORMANCE GRAPH
The graph below compares the
cumulative total stockholder returns (including reinvestment of dividends) from the period from December 31, 2006 through December 31, 2011 on an
investment of $100 in (i) our common stock, (ii) the Russell Microcap Index (an index of microcap companies), and (iii) an index of peer companies
selected by us (the “Peer Group”), as described below. You should be aware that historical results are not necessarily indicative of future
performance.
We have selected the Russell
Microcap Index for comparative purposes. We believe that, given our current size of operations and market capitalization, the Russell Microcap Index,
which measures the performance of stocks in the microcap segment of the U.S. equity securities market, provides an appropriate benchmark against which
to measure our stock performance.
Our Peer Group consists of
Computer Sciences Corporation, Ebix Inc., Pegasystems Inc. and Sapient Corp.
| December 31, |
|||||||||||||||||||||||||||
|---|---|---|---|---|---|---|---|---|---|---|---|---|---|---|---|---|---|---|---|---|---|---|---|---|---|---|---|
| 2006 |
2007 |
2008 |
2009 |
2010 |
2011 |
||||||||||||||||||||||
Cover-All
Technologies Inc. |
$ | 100.00 | $ | 174.68 | $ | 113.92 | $ | 146.50 | $ | 211.90 | $ | 235.44 | |||||||||||||||
Russell
Microcap Index |
$ | 100.00 | $ | 92.00 | $ | 55.40 | $ | 70.63 | $ | 91.03 | $ | 82.59 | |||||||||||||||
Peer
Group |
$ | 100.00 | $ | 99.50 | $ | 70.51 | $ | 123.18 | $ | 121.05 | $ | 77.82 | |||||||||||||||
15
ITEM
6. |
SELECTED FINANCIAL DATA |
The following selected historical
consolidated financial information as of December 31, 2011 and 2010, and for each of the years ended December 31, 2011, 2010 and 2009, have been
derived from and should be read in conjunction with our audited consolidated financial statements and related notes thereto and “Management’s
Discussion and Analysis of Financial Condition and Results of Operations” included elsewhere in this annual report on Form 10-K. The selected
historical consolidated financial information as of December 31, 2009, 2008 and 2007 and for the years ended December 31, 2008 and 2007 have been
derived from our audited consolidated financial statements which are not included in this annual report on Form 10-K.
Selected Five-Year Consolidated Financial
Data
The following is a summary of
selected five-year consolidated financial data as of and for the years ended December 31, 2011, 2010, 2009, 2008 and 2007:
| Year ended December 31, |
|||||||||||||||||||||||
|---|---|---|---|---|---|---|---|---|---|---|---|---|---|---|---|---|---|---|---|---|---|---|---|
| 2011 |
2010 |
2009 |
2008 |
2007 |
|||||||||||||||||||
| (in thousands, except per share amounts) | |||||||||||||||||||||||
Statement
of Operations Data: |
|||||||||||||||||||||||
Revenues |
$ | 17,596 | $ | 17,457 | $ | 14,515 | $ | 13,467 | $ | 9,777 | |||||||||||||
Income
before income tax |
1,185 | 2,215 | 3,335 | 2,904 | 1,245 | ||||||||||||||||||
Net income
|
1,185 | 2,952 | (1) | 3,917 | (1) | 4,556 | (2) | 1,231 | |||||||||||||||
Net income
per share — basic |
0.05 | 0.12 | 0.16 | 0.19 | 0.06 | ||||||||||||||||||
Net income
per share — diluted |
0.05 | 0.12 | 0.16 | 0.19 | 0.05 | ||||||||||||||||||
Cash
dividends per share |
$ | — | $ | — | $ | 0.03 | $ | — | $ | — | |||||||||||||
| As of December 31, |
|||||||||||||||||||||||
|---|---|---|---|---|---|---|---|---|---|---|---|---|---|---|---|---|---|---|---|---|---|---|---|
| 2011 |
2010 |
2009 |
2008 |
2007 |
|||||||||||||||||||
| (in thousands) |
|||||||||||||||||||||||
Balance
Sheet Data: |
|||||||||||||||||||||||
Cash and cash
equivalents |
$ | 3,282 | $ | 5,893 | $ | 4,324 | $ | 4,686 | $ | 11 | |||||||||||||
Working
capital |
3,251 | 5,013 | 7,232 | 4,806 | 545 | ||||||||||||||||||
Total
assets |
20,458 | 19,513 | 14,999 | 11,039 | 5,864 | ||||||||||||||||||
Short-term
debt |
— | 400 | — | — | 262 | ||||||||||||||||||
Long-term
debt |
— | — | — | — | — | ||||||||||||||||||
Stockholders’ equity |
$ | 16,921 | $ | 15,204 | $ | 11,502 | $ | 7,804 | $ | 2,285 | |||||||||||||
(1) |
Net income for such year included a deferred income tax benefit of $0.8 million as a result of the Company’s reversal of a portion of its Deferred Tax Asset valuation allowance. |
(2) |
Net income for such year included a deferred income tax benefit of $1.7 million as a result of the Company’s reversal of a portion of its Deferred Tax Asset valuation allowance. |
16
Selected Quarterly Financial Data
(Unaudited)
The following is a summary of
selected quarterly financial data for the years ended December 31, 2011 and 2010:
| 2011 |
|||||||||||||||||||
|---|---|---|---|---|---|---|---|---|---|---|---|---|---|---|---|---|---|---|---|
| Q1 |
Q2 |
Q3 |
Q4 |
||||||||||||||||
| (in thousands, except per share amounts) | |||||||||||||||||||
Total
revenues |
$ | 5,197 | $ | 5,996 | $ | 3,384 | $ | 4,019 | |||||||||||
Operating
income (loss) |
$ | 1,237 | $ | 674 | $ | (701 | ) | $ | (31 | ) | |||||||||
Net income
(loss) |
$ | 1,205 | $ | 681 | $ | (710 | ) | $ | 9 | ||||||||||
Net income
(loss) per common share |
|||||||||||||||||||
Basic |
$ | 0.05 | $ | 0.03 | $ | (0.03 | ) | $ | 0.00 | ||||||||||
Diluted |
$ | 0.05 | $ | 0.03 | $ | (0.03 | ) | $ | 0.00 | ||||||||||
| 2010 |
|||||||||||||||||||
|---|---|---|---|---|---|---|---|---|---|---|---|---|---|---|---|---|---|---|---|
| Q1 |
Q2 |
Q3 |
Q4 |
||||||||||||||||
| (in thousands, except per share amounts) | |||||||||||||||||||
Total
revenues |
$ | 3,754 | $ | 4,695 | $ | 4,669 | $ | 4,339 | |||||||||||
Operating
income |
$ | 792 | $ | 673 | $ | 522 | $ | 194 | |||||||||||
Net
income |
$ | 721 | $ | 566 | $ | 448 | $ | 1,217 | |||||||||||
Net income
per common share |
|||||||||||||||||||
Basic |
$ | 0.03 | $ | 0.02 | $ | 0.02 | $ | 0.05 | |||||||||||
Diluted |
$ | 0.03 | $ | 0.02 | $ | 0.02 | $ | 0.05 | |||||||||||
ITEM
7. |
MANAGEMENT’S DISCUSSION AND ANALYSIS OF FINANCIAL CONDITION AND RESULTS OF OPERATIONS |
OVERVIEW
We are a supplier of software
products for the property and casualty insurance industry, supplying a wide range of professional services that support product customization,
conversion from existing systems and data integration with other software or reporting agencies. We also offer on-going support services including
incorporating recent insurance rate and rule changes in our solutions. These support services also include analyzing the changes, developments, quality
assurance, documentation and distribution of insurance rate and rule changes.
We earn revenue from software
contract licenses, fees for servicing the product, which we call support services, and professional services. Total revenue in 2011 increased to
$17,596,000 from $17,457,000 in 2010, due to an increase in license and support services offset by a decrease in professional
services.
The following is an overview of
the key components of our revenue and other important financial data in 2011:
Software Licenses. License
revenue was $4,770,000 in 2011 compared to $2,288,000 in 2010 as a result of new customer sales and sales to existing customers in 2011. Our new
software license revenue is affected by the strength of general economic and business conditions and the competitive position of our software products.
New software license sales are characterized by long sales cycles and intense competition. Timing of new software license sales can substantially
affect our quarterly results.
Support Services. Support
services revenue was $8,346,000 in 2011 compared to $8,099,000 in 2010. The increase in maintenance revenue in 2011 was mainly due to the annual
renewal of existing customers’ maintenance and maintenance from new customer contracts. Support services revenue is influenced primarily by the
following factors: the renewal rate from our existing customer base, the amount of new support services associated with new license sales and annual
price increases.
17
Professional Services. The
decrease in professional services revenue to $4,480,000 in 2011 from $7,070,000 in 2010 was a result of decreased demand for new software capabilities
and customizations from our current customer base and the shift of MSBS revenue from professional services to license sales.
Income before Provision for
Income Taxes. Income before provision for income taxes was $1,185,000 in 2011 compared to $2,125,000 in 2010, primarily due to a decrease in
professional services revenue.
Income Tax Benefit. We
recorded income taxes, which are comprised of New Jersey state tax and Federal alternative minimum tax, of $0 and $63,000 in 2011 and 2010,
respectively. We also recorded income tax benefit of $0 and $800,000 in 2011 and 2010, respectively.
Net Income. Net income for
2011 was $1,185,000 compared to $2,952,000 in 2010, mainly as a result of a decrease in professional services revenue.
EBITDA. Earnings before
interest, taxes, depreciation and amortization (“EBITDA”), a non-GAAP metric, was $3.0 million for 2011 compared to $3.1 million for
2010.
Cash Flow. We generated
$3,317,000 in positive cash flow from operations in 2011 and ended the year with $3,282,000 in cash and cash equivalents and $1,818,000 in accounts
receivable.
We continue to face competition
for growth in 2012 mainly in the marketing and selling of our products and services to new customers caused by a number of factors, including long
sales cycles and general economic and business conditions. In addition, there are risks related to customers’ acceptance and implementation delays
which could affect the timing and amount of license revenue we are able to recognize. However, given the positive response to our new software from
existing customers, the significant expansion of our relationship with a very large customer and the introduction of additional software capabilities,
we are expanding our sales and marketing efforts to both new and existing customers. Consequently, we continue to incur additional sales and marketing
expense in advance of generating the corresponding revenue.
As we shift over time from
software development to deployment, from a financial perspective, the non-cash charges for amortization of developed software will increasingly impact
our bottom line. Therefore, in order to provide more visibility to investors, we have decided to also report EBITDA to show what we believe is the
Company’s earnings power without the impact of, among other items, amortization. In 2011, the non-cash charge for amortization of capitalized
software increased more than 150% from 2010 to $1.5 million, and we expect this amount could exceed $3 million, or $0.12 per share, in 2012, depending
on our sales success. Therefore, we believe that EBITDA will be a useful measure of the true earnings power of the Company while we complete the
development and deployment cycle. As such, we expect to increasingly focus on EBITDA to evaluate our progress.
USE OF NON-GAAP FINANCIAL MEASURES
In evaluating our business, we
consider and use EBITDA as a supplemental measure of our operating performance. The Company defines EBITDA as earnings before interest, taxes,
depreciation and amortization. The Company presents EBITDA because it believes it is frequently used by securities analysts, investors and other
interested parties as a measure of financial performance.
The term EBITDA is not defined
under U.S. generally accepted accounting principles, or U.S. GAAP, and is not a measure of operating income, operating performance or liquidity
presented in accordance with U.S. GAAP. EBITDA has limitations as an analytical tool, and when assessing the Company’s operating performance,
investors should not consider EBITDA in isolation, or as a substitute for net income (loss) or other consolidated income statement data prepared in
accordance with U.S. GAAP. Among other things, EBITDA does not reflect the Company’s actual cash expenditures. Other companies may calculate
similar measures differently than Cover-All limiting their usefulness as comparative tools. We compensate for these limitations by relying on our U.S.
GAAP results and using EBITDA only supplementally.
18
The following is an unaudited
reconciliation of U.S. GAAP net income to EBITDA for the years ended December 31, 2011 and 2010:
| 2011 |
2010 |
|||||||||
|---|---|---|---|---|---|---|---|---|---|---|
Net
Income |
$ | 1,184,766 | $ | 2,951,786 | ||||||
Interest
income, net |
13,498 | 10,053 | ||||||||
Income tax
(benefit) expense |
— | (736,933 | ) | |||||||
Depreciation |
146,397 | 159,835 | ||||||||
Amortization |
1,686,647 | 717,148 | ||||||||
EBITDA |
$ | 3,031,308 | $ | 3,101,889 | ||||||
EBITDA per
common share: |
||||||||||
Basic |
$ | 0.12 | $ | 0.12 | ||||||
Diluted |
$ | 0.12 | $ | 0.12 | ||||||
CRITICAL ACCOUNTING POLICIES AND
ESTIMATES
This discussion and analysis of
our financial condition and results of operations are based on our consolidated financial statements that have been prepared under accounting
principles generally accepted in the United States. The preparation of financial statements requires our management to make estimates and assumptions
that affect the reported amount of assets and liabilities at the date of the financial statements and the reported amounts of revenue and expenses
during the reporting periods. Actual results could materially differ from those estimates. We have disclosed all significant accounting policies in
Note 1 to the consolidated financial statements included in this annual report on Form 10-K. The consolidated financial statements and the related
notes thereto should be read in conjunction with the following discussion of our critical accounting policies. Critical accounting policies and
estimates are:
• |
Revenue Recognition; |
• |
Valuation of Capitalized Software; |
• |
Valuation of Allowance for Doubtful Accounts Receivable; and |
• |
Business Combinations and Goodwill. |
Revenue
Recognition
Revenue recognition rules are
very complex, and certain judgments affect the application of our revenue policy. The amount and timing of our revenue is difficult to predict, and any
shortfall in revenue or delay in recognizing revenue could cause our operating results to vary significantly from quarter to quarter. In addition to
determining our results of operations for a given period, our revenue recognition determines the timing of certain expenses, such as commissions,
royalties and other variable expenses.
Our revenues are recognized in
accordance with the Financial Accounting Standards Board (“FASB”) Accounting Standards Codification (“ASC”) 985-605, Software
Revenue Recognition, as amended. Revenue from the sale of software licenses is predominately from standardized software and is recognized when
standard software modules are delivered and accepted by the customer, the license term has begun, the fee is fixed or determinable and collectability
is probable. Revenue from support services is recognized ratably over the life of the contract. Revenue from professional consulting services is
recognized when the service is provided.
Amounts invoiced to our customers
in excess of recognized revenues are recorded as deferred revenues. The timing and amounts invoiced to customers can vary significantly depending on
specific contract terms and can therefore have a significant impact on deferred revenues in any given period.
19
Our revenue is derived from the
licensing of our software products, professional services and support services. We recognize revenue when persuasive evidence of an arrangement exists,
we have delivered the product or performed the service, the fee is fixed or determinable and collection is probable.
License Revenue
We recognize our license revenue
upon delivery, provided collection is determined to be probable and no significant obligations remain.
Services and Support
Revenue
Our services and support revenue
is composed of professional services (such as consulting services and training) and support services (maintenance, support and ASP services). Our
professional services revenue is recognized when the services are performed. Our support services revenues are recognized ratably over the term of the
arrangement.
Multiple Element
Arrangement
We enter into revenue
arrangements in which a customer may purchase a combination of software, support and professional services (multiple-element arrangements). When
vendor-specific objective evidence (“VSOE”) of fair value exists for all elements, we allocate revenue to each element based on the relative
fair value of each of the elements. VSOE of fair value is established by the price charged when that element is sold separately. For support services,
VSOE of fair value is established by renewal rates when they are sold separately. For arrangements where VSOE of fair value exists only for the
undelivered elements, we defer the full fair value of the undelivered elements and recognize the difference between the total arrangement fee and the
amount deferred for the undelivered items as revenue, assuming all other criteria for revenue recognition have been met.
Valuation of Capitalized
Software
Costs for the conceptual
formulation and design of new software products are expensed as incurred until technological feasibility has been established. Once technological
feasibility has been established, we capitalize costs to produce the finished software products. Capitalization ceases when the product is available
for general release to customers. Costs associated with product enhancements that extend the original product’s life or significantly improve the
original product’s marketability are also capitalized once technological feasibility has been established. Amortization is calculated on a
product-by-product basis as the greater of the amount computed using (a) the ratio that current gross revenues for a product bear to the total current
and anticipated future gross revenues for that product or (b) the straight-line method over the remaining economic life of the product. At each balance
sheet date, the unamortized capitalized costs of each computer software product is compared to the net realizable value of that product. If an amount
of unamortized capitalized costs of a computer software product is found to exceed the net realizable value of that asset, such amount will be written
off. The net realizable value is the estimated future gross revenues from that product reduced by the estimated future costs of completing and
deploying that product, including the costs of performing maintenance and customer support required to satisfy our responsibility set forth at the time
of sale.
Valuation of Allowance for Doubtful
Accounts Receivable
Our estimate of the allowance for
doubtful accounts is based on historical information, historical loss levels and an analysis of the collectibility of individual accounts. We routinely
assess the financial strength of our customers and, based upon factors concerning credit risk, establish an allowance for uncollectible accounts. We
believe that accounts receivable credit risk exposure beyond such allowance is limited.
Business Combination, Goodwill and
Other Intangible Assets
ASC 805, Business
Combinations, requires that the purchase method of accounting be used for all business combinations. It further specifies criteria as to intangible
assets acquired in a business combination that must be recognized and reported separately from goodwill. The intangible assets, other than goodwill,
acquired in the MSBS and BlueWave transactions will be amortized using the straight-line method over their estimated useful lives.
20
Goodwill represents the cost of
the MSBS assets in excess of the fair value of identifiable tangible and intangible net assets purchased. Goodwill is not amortized but is tested for
impairment. We review our goodwill for impairment annually in the fourth quarter. We also analyze whether any indicators of impairment exist each
quarter. A significant amount of judgment is involved in determining if an indicator of impairment has occurred. Such indicators may include a
sustained, significant decline in our share price and market capitalization, a decline in our expected future cash flows, a significant adverse change
in legal factors or in the business climate, unanticipated competition, the testing for recoverability of our assets, and/or slower growth rates, among
others.
We estimate the fair value of
MSBS using discounted expected future cash flows, supported by the results of various market approach valuation models. If the fair value of MSBS
exceeds net book value, goodwill is not impaired, and no further testing is necessary. If the net book value exceeds fair value, we perform a second
test to measure the amount of impairment loss. To measure the amount of any impairment charge, we determine the implied fair value of goodwill in the
same manner as in a business combination.
Specifically, we allocate fair
value to all assets and liabilities, including any unrecognized intangible assets, in a hypothetical calculation that would yield the implied fair
value of goodwill. If the implied fair value of goodwill is less than the goodwill recorded on our consolidated balance sheet, we record an impairment
charge for the difference.
21
RESULTS OF OPERATIONS
The following table sets forth,
for the periods indicated, certain items from the consolidated statements of operations expressed as a percentage of total revenues:
| Year Ended December 31, |
|||||||||||||||
|---|---|---|---|---|---|---|---|---|---|---|---|---|---|---|---|
| 2011 |
2010 |
2009 |
|||||||||||||
Revenues: |
|||||||||||||||
License |
27.1 | % | 13.1 | % | 28.5 | % | |||||||||
Support
Services |
47.4 | 46.4 | 48.9 | ||||||||||||
Professional
Services |
25.5 | 40.5 | 22.6 | ||||||||||||
Total
Revenues |
100.0 | 100.0 | 100.0 | ||||||||||||
Cost of
Revenues: |
|||||||||||||||
License |
16.7 | 7.6 | 12.5 | ||||||||||||
Support
Services |
26.8 | 25.9 | 30.1 | ||||||||||||
Professional
Services |
24.5 | 28.5 | 10.9 | ||||||||||||
Total Cost
of Revenues |
68.0 | 62.0 | 53.5 | ||||||||||||
Direct
Margin |
32.0 | 38.0 | 46.5 | ||||||||||||
Operating
Expenses: |
|||||||||||||||
Sales and
Marketing |
10.1 | 8.2 | 6.3 | ||||||||||||
General and
Administrative |
10.9 | 10.9 | 11.5 | ||||||||||||
Acquisition
Costs |
0.8 | 1.6 | — | ||||||||||||
Research and
Development |
3.5 | 4.8 | 6.1 | ||||||||||||
Provision for
Doubtful Accounts |
— | — | — | ||||||||||||
Total
Operating Expenses |
25.3 | 25.5 | 23.9 | ||||||||||||
Operating
Income |
6.7 | 12.5 | 22.6 | ||||||||||||
Other
(Income) Expense: |
|||||||||||||||
Interest
Expense |
0.1 | 0.1 | — | ||||||||||||
Interest
Expense — Related Party |
— | — | — | ||||||||||||
Interest
Income |
— | (0.1 | ) | (0.1 | ) | ||||||||||
Other
Expense |
— | — | — | ||||||||||||
Other
Income |
(0.1 | ) | (0.2 | ) | (0.3 | ) | |||||||||
Total
Other (Income) Expense |
(0.0 | ) | (0.2 | ) | (0.4 | ) | |||||||||
Income
Before Income Taxes |
6.7 | 12.7 | 23.0 | ||||||||||||
Income Tax
Benefit: |
— | 4.2 | 4.0 | ||||||||||||
Net
Income |
6.7 | % | 16.9 | % | 27.0 | % | |||||||||
YEAR ENDED DECEMBER 31, 2011 COMPARED WITH YEAR ENDED DECEMBER
31, 2010
Revenues
Total revenues were $17,596,000
for the year ended December 31, 2011 compared to $17,457,000 for the year ended December 31, 2010. License fees were $4,770,000 for the year ended
December 31, 2011 compared to $2,288,000 in 2010, an increase of 108%, as a result of new customer license sales, sales to existing customers and an
increased sales and marketing effort in 2011. For the year ended December 31, 2011, support services revenues were $8,346,000 compared to $8,099,000 of
the prior year, due to the annual renewal of existing customers’ maintenance and maintenance from new customer contracts. Professional services
revenue contributed $4,480,000 for the year ended December 31, 2011 compared to $7,070,000 for the year ended December 31, 2010 as a result of
decreased demand for new software capabilities and customizations from our current customer base and the shift of MSBS revenue from professional
services to license sales.
22
Cost of sales increased to
$11,974,000 for the year ended December 31, 2011 as compared to $10,817,000 for 2010, due to higher salaries and personnel-related expenses associated
with staffing changes. Non-cash capitalized software amortization was $1,549,000 for the year ended December 31, 2011 as compared to $618,000 in 2010.
We capitalized software development costs of $4,545,000 in 2011 compared to $3,260,000 in 2010.
Expenses
Research and Development.
Research and development expenses were $617,000 for the year ended December 31, 2011 compared to $847,000 in 2010, primarily due to our research and
development staff working on developing various new software capabilities that were capitalized in 2011. We intend to continue to maintain our ongoing
effort to enhance the functionality of our products and solutions to remain competitive.
Sales and Marketing. Sales
and marketing expenses increased to $1,777,000 for the year ended December 31, 2011 from $1,424,000 in 2010, primarily due to personnel-related costs
and advertising and promotion expenses.
Acquisition. Acquisition
expenses were approximately $137,000 for the year ended December 31, 2011 as compared to $285,000 in 2010. These expenses were in connection with the
acquisition of BlueWave in 2011.
General and
Administrative. General and administrative expenses were $1,913,000 in 2011 as compared to $1,902,000 in 2010. The increase in the general and
administrative expenses was mainly due to an increase in stock based compensation related to options and restricted stock issued to employees and
directors.
Other Income. We had
$20,000 of other income for the year ended December 31, 2011 compared to $43,000 of other income for the year ended December 31, 2010.
Income Tax Benefit. In
2011, we recorded income taxes of $0. We also recorded an income tax benefit of $63,000 in 2010, which was comprised of New Jersey state tax and
Federal alternative minimum tax.
YEAR ENDED DECEMBER 31, 2010 COMPARED WITH YEAR ENDED DECEMBER
31, 2009
Revenues
Total revenues were $17,457,000
for the year ended December 31, 2010 compared to $14,515,000 for the year ended December 31, 2009, an increase of 20%. License fees were $2,288,000 for
the year ended December 31, 2010 compared to $4,138,000 in 2009, as a result of fewer new customer license sales and sales to existing customers in
2010. For the year ended December 31, 2010, maintenance revenues were $5,545,000 compared to $4,987,000 of the prior year, due to the annual renewal of
existing customers’ maintenance and maintenance from new customer contracts signed in 2009. Professional services revenue contributed $7,070,000
for the year ended December 31, 2010 compared to $3,282,000 for the year ended December 31, 2009 as a result of increased demand for new software
capabilities and customizations from our current customer base and our recent acquisition of MSBS. ASP revenues were $2,554,000 for the year ended
December 31, 2010 compared to $2,108,000 for the year ended December 31, 2009 due primarily to an expanded and extended contractual relationship with
two large customers.
Cost of sales increased to
$10,817,000 for the year ended December 31, 2010 as compared to $7,760,000 for 2009, due to higher salaries and personnel-related expenses associated
with staffing changes and our recent acquisition of MSBS. Non-cash capitalized software amortization was $618,000 for the year ended December 31, 2010
as compared to $917,000 in 2009. We capitalized software development costs of $3,260,000 in 2010 compared to $1,411,000 in 2009.
Expenses
Research and Development.
Research and development expenses were $847,000 for the year ended December 31, 2010 compared to $891,000 in 2009, primarily due to our research and
development staff working on developing various new software capabilities that were capitalized in 2010. We intend to continue to maintain our ongoing
effort to enhance the functionality of our products and solutions to remain competitive.
Sales and Marketing. Sales
and marketing expenses increased to $1,424,000 for the year ended December 31, 2010 from $906,000 in 2009, primarily due to costs related to increased
advertising and promotion and personnel-related costs.
23
Acquisition. Acquisition
expenses were approximately $285,000 for the year ended December 31, 2010 as compared to zero in the same period of 2009. These expenses were in
connection with the acquisition of MSBS.
General and
Administrative. General and administrative expenses were $1,902,000 in 2010 as compared to $1,674,000 in 2009. The increase in the general and
administrative expenses was mainly due to the costs related to our recent acquisition of MSBS.
Other Expense. We had $0
of other expense for the year ended December 31, 2010 compared to $1,000 for the year ended December 31, 2009.
Other Income. We had
$43,000 of other income for the year ended December 31, 2010 compared to $45,000 of other income for the year ended December 31, 2009.
Income Tax Benefit. In
2010, we recorded income taxes of $63,000, which is comprised of New Jersey state tax and Federal alternative minimum tax. We also recorded an income
tax benefit of $800,000 in 2010.
LIQUIDITY AND CAPITAL RESOURCES
Sources of
Liquidity
We have funded our operations
primarily from cash flow from operations. Cash from operations results primarily from net income from the income statement plus non-cash expenses
(depreciation and amortization) and adjusted for changes in working capital from the balance sheet.
Our largest source of operating
cash flows is cash collections from our customers following the purchase or renewal of software licenses, product support agreements and other related
services. Payments from customers for software licenses are generally received at the beginning of the contract term. Payments from customers for
product support and ASP services are generally received in advance on a quarterly basis. Payments for professional services are generally received 30
days after the services are performed.
At December 31, 2011, we had cash
and cash equivalents of $3,282,000 compared to cash and cash equivalents of $5,893,000 at December 31, 2010. The decrease in cash and cash equivalents
is primarily attributable to fewer new customer sales in 2011 and a decrease in professional services revenues in 2011.
Cash Flows
Our ability to generate cash has
depended on a number of different factors, primarily our ability to continue to secure and retain customers and generate new license sales and related
product support agreements. In order to attract new customers and maintain or grow existing revenue streams, we utilize our existing sources of capital
to invest in sales and marketing, technology infrastructure and research and development.
Our ability to continue to
control expenses, maintain existing revenue streams and anticipate new revenue will impact the amounts and certainty of cash flows. We intend to
maintain our expenses in line with existing revenue streams from maintenance support, ASP services and professional services.
Balance sheet items that should
be considered in assessing our liquidity include cash and cash equivalents, accounts receivable, prepaid expenses, accounts payable and accrued
liabilities. Income statement items that should be considered in assessing our liquidity include revenue, cost of revenue (net of depreciation and
amortization), operating expenses (net of depreciation and amortization) and other expenses. Statement of cash flows items that should be considered in
assessing our liquidity include net cash flows from operating activities, net cash flows from investing activities and net cash flows from financing
activities.
In December 31, 2011, we had
working capital of $3,251,000 compared to working capital of $5,013,000 at December 31, 2010. This decrease in our working capital resulted primarily
from a decrease in professional services revenue in 2011. Net cash provided from operating activities totaled approximately $3,317,000 in 2011 compared
to approximately $6,899,000 in 2010. In 2011, cash flow from operating activities represented the Company’s principal source of cash and results
primarily from net income (loss), less non-cash expense and changes in working capital. The Company had a
24
significant increase in its accounts receivable in 2009 due to the license sales to new customers offset by non-cash expenses and payment of liabilities.
In 2011, net cash used for
investing activities was approximately $5,581,000 compared to approximately $5,172,000 in 2010. The increase in net cash used for investing activities
was mainly due to capitalized acquisition expenditures related to the acquisition of BlueWave and a significant increase in capitalized software. We
expect capital expenditures and capital software expenditures to continue to be funded by cash generated from operations. We use cash to invest in
capital and other assets to support our growth.
In 2011, net cash provided from
(used for) financing activities was approximately $347,000 compared to approximately $(159,000) in 2010. The cash provided from financing activities in
2011 consisted of proceeds from the exercise of stock options and warrants and included the payment of debt related to the acquisition of MSBS. The
cash provided from (used for) financing activities in 2009 consisted of dividends paid to common stockholders and proceeds from the exercise of stock
options and warrants.
Funding
Requirements
Our primary uses of cash are for
personnel-related expenditures, facilities and technology costs.
We do not anticipate any large
capital expenditures that will require us to seek new sources of capital. We lease computer equipment for terms of three years in order to have the
latest available technology to serve our customers and develop new products.
On June 18, 2008, we announced
that our board of directors authorized a share buyback plan of up to 1,000,000 shares of the Company’s common stock, in accordance with Rule
10b-18 of the Exchange Act. In 2008, the Company purchased an aggregate of 201,870 shares of the Company’s common stock on the open market at an
average purchase price of $0.82 per share for a total purchase price of approximately $164,894.
On February 17, 2009, we
announced that our board of directors declared a special cash dividend in the amount of $0.03 per share on our common stock. This dividend was paid on
April 7, 2009 to common stockholders of record as of the close of business on March 27, 2009. The Company also announced that in light of its decision
to declare a special cash dividend, our board of directors had determined that the Company would suspend its share buyback plan until further
notice.
On April 12, 2010, the Company
announced the acquisition of MSBS, a provider of business intelligence and advanced analytical solutions to the insurance industry based in New York,
New York. The Company acquired substantially all of MSBS’ assets (excluding working capital) for an aggregate purchase price of $2,450,000, with
no assumed indebtedness, payable as follows: (i) a cash payment in the amount of $1,760,000; (ii) the execution and delivery by the Company to MSBS of
a non-negotiable, subordinated promissory note in the aggregate principal amount of $600,000; and (iii) the delivery to MSBS of 76,014 shares of our
common stock, which number of shares had a fair market value of $90,000 calculated as provided for in the purchase agreement.
On December 16, 2011, we
announced that our board of directors authorized a share buyback plan of up to 1,000,000 shares of the Company’s common stock, in accordance with
Rule 10b-18 of the Exchange Act.
On December 30, 2011, the Company
completed the acquisition of the PipelineClaims assets of BlueWave, a provider of enterprise claims management software to the property and casualty
insurance industry based in Honolulu, Hawaii. The aggregate purchase price for the acquisition, in addition to the assumption by the Company of certain
assumed liabilities, consisted of the following: (i) $1,100,000 in cash on the closing date, (x) $635,821 of which (net of adjustments for certain
prepayments to BlueWave and other prorations) was paid in cash to BlueWave, and (y) $400,000 of which was deposited into an escrow account to be held
and distributed by an escrow agent pursuant to the terms of an escrow agreement to secure possible future indemnification claims and certain other
post-closing matters in favor of the Company; and (ii) up to an aggregate of $750,000 in an earnout, which earnout will be based upon the performance
of the acquired business in the five years following the closing. More particularly, for each of the five years following the closing, BlueWave will be
entitled to receive an amount equal to ten percent (10%) of the PipelineClaims Free Cash Flow (as such term is defined in the purchase agreement) but
in no event will the Company be required to pay to BlueWave in excess of $750,000 in the aggregate for the 5-year period.
25
We prepare monthly cash flow
projections on a rolling twelve-month basis based on a detailed review of anticipated receipts and revenue from licenses, support and professional
services. We also perform a detailed review of our disbursements, including fixed costs, variable costs, legal costs, payroll costs and other specific
payments, on a rolling twelve-month basis.
We believe that our current cash
balances and anticipated cash flows from operations will be sufficient to meet our normal operating needs for at least the next twelve months. We do
not anticipate any material changes in our sources of and needs for capital. Our ability to fund our working capital needs and address planned capital
expenditures will depend on our ability to generate cash in the future. We anticipate generating future working capital through sales to new customers
and continued sales and services to our existing customers.
Our future liquidity and capital
resource requirements will depend on many factors, including but not limited to the following trends and uncertainties we face:
• |
Our ability to generate cash is subject to general economic, financial, competitive and other factors beyond our control; |
• |
Our need to invest resources in product development in order to continue to enhance our current products, develop new products, attract and retain customers and keep pace with competitive product introductions and technological developments; |
• |
We experience intense competition in our industry and continuing technological changes; |
• |
Insurance companies typically are slow in making decisions and have numerous bureaucratic and institutional obstacles, which can make our efforts to attain new customers difficult; |
• |
We compete with a number of larger companies who have greater resources than ours — we do so on the basis of insurance knowledge, products, services, price, technological advances and system functionality and performance; |
• |
Our operations depend upon the continuing business of our existing customers and our ability to attract new customers; and |
• |
A decline in software spending in the insurance industry could result in a decrease in our revenue. |
Material risks to cash flow from
operations include delayed or reduced cash payments accompanying sales of new licenses or a decline in our services business. There can be no assurance
that changes in our plans or other events affecting our operations will not result in materially accelerated or unexpected
expenditures.
We do not expect for there to be
a change in the mix or relative cost of our sources of capital.
Net Operating Tax Loss
Carryforwards
At December 31, 2011, we had
approximately $9,000,000 of federal net operating tax loss carryforwards expiring at various dates through 2026. The Tax Reform Act of 1986 enacted a
complex set of rules which limit a company’s ability to utilize net operating tax loss carryforwards and tax credit carryforwards in periods
following an ownership change. These rules define ownership change as a greater than 50 percent point change in stock ownership within a defined
testing period, which is generally a three-year period. As a result of stock which may be issued by us from time to time or the result of other changes
in ownership of our outstanding stock, we may experience an ownership change and consequently our utilization of net operating tax loss carryforwards
could be significantly limited.
26
CONTRACTUAL OBLIGATIONS
The following table summarizes
our significant contractual obligations at December 31, 2011:
Payments due by period
(in thousands)
(in thousands)
| Contractual Obligations |
Total |
Less than 1 Year |
1-3 Years |
3-5 Years |
More than 5 Years |
|||||||||||||||||
|---|---|---|---|---|---|---|---|---|---|---|---|---|---|---|---|---|---|---|---|---|---|---|
Operating
Leases |
$ | 1,471 | $ | 811 | $ | 660 | $ | — | $ | — | ||||||||||||
Total |
$ | 1,471 | $ | 811 | $ | 660 | $ | — | $ | — | ||||||||||||
We lease one facility in
Fairfield, New Jersey, which lease expires October 31, 2012, and one facility in New York, New York, which lease expires January 31, 2014. We are
currently using certain premises in Honolulu, Hawaii, under a short-term arrangement. We also lease various telephone and computer
equipment.
OFF-BALANCE-SHEET ARRANGEMENTS
During the year ended December
31, 2011, we did not have any off-balance-sheet arrangements, as defined in Item 303(a)(4)(ii) of SEC Regulation S-K promulgated under the Exchange
Act.
RECENT ACCOUNTING AND AUDITING
DEVELOPMENTS
In September 2011, the FASB
issued Accounting Standards Update (“ASU”) No. 2011-08, Intangibles — Goodwill and Other (Topic 350): Testing Goodwill for
Impairment. The amendment permits an entity to first assess qualitative factors to determine whether it is more likely than not that the fair value
of a reporting unit is less than its carrying amount as a basis for determining whether it is necessary to perform the two-step goodwill impairment
test described in FASB ASC Topic 350. The more-likely-than-not threshold is defined as having a likelihood of more than 50%. The guidance also includes
examples of the types of events and circumstances to consider in conducting the qualitative assessment. It is effective for annual and interim goodwill
impairment tests performed for fiscal years beginning after December 15, 2011. Early adoption is permitted, including for annual and interim goodwill
impairment tests performed as of a date before September 15, 2011, if an entity’s financial statements for the most recent annual or interim
period have not yet been issued or, for nonpublic entities, have not yet been made available for issuance.
In June 2011, the FASB issued ASU
No. 2011-05, Presentation of Comprehensive Income. The updated guidance requires companies to disclose the total of comprehensive income, the
components of net income, and the components of other comprehensive income either in a single continuous statement of comprehensive income or in two
separate but consecutive statements. The updated guidance does not affect how earnings per share is calculated or presented. The updated guidance is
effective for fiscal years, and interim periods within those years, beginning after December 15, 2011. The Company does not believe the adoption of
this guidance will have a material impact on its consolidated financial statements.
In May 2011, the FASB issued ASU
No. 2011-04, Amendments to Achieve Common Fair Value Measurement and Disclosure Requirements in U.S. GAAP and IFRSs. ASU No. 2011-04 amends FASB
ASC Topic 820, Fair Value Measurements and Disclosures, to establish common requirements for measuring fair value and for disclosing information
about fair value measurements in accordance with Generally Accepted Accounting Principles and International Financial Reporting Standards. ASU No.
2011-04 is effective for fiscal years beginning after December 15, 2011 and for interim periods within those fiscal years. The Company does not believe
the adoption of this guidance will have a material impact on its consolidated financial statements.
We believe there is no additional
new accounting guidance adopted, but not yet effective, that is relevant to the readers of our financial statements. However, there are numerous new
proposals under development which may have a significance impact on the Company’s financial reporting, if and when enacted.
27
ITEM
7A. |
QUANTITATIVE AND QUALITATIVE DISCLOSURES ABOUT MARKET RISK |
We are a smaller reporting
company and this Item is not applicable to us.
ITEM
8. |
FINANCIAL STATEMENTS AND SUPPLEMENTARY DATA |
The financial statements and
supplementary data listed in Item 15(a)(1) and (2) of this annual report on Form 10-K are included beginning on page F-1 herein.
ITEM
9. |
CHANGES IN AND DISAGREEMENTS WITH ACCOUNTANTS ON ACCOUNTING AND FINANCIAL DISCLOSURE |
None.
ITEM
9A. |
CONTROLS AND PROCEDURES |
DISCLOSURE CONTROLS AND PROCEDURES
As of the end of the period
covered by this annual report on Form 10-K, we carried out an evaluation, under the supervision and with the participation of our management, including
our Chief Executive Officer and our Chief Financial Officer, of the effectiveness of the design and operation of the Company’s “disclosure
controls and procedures” (as defined in Rule 13a-15(e) under the Exchange Act). Based upon that evaluation, our Chief Executive Officer and our
Chief Financial Officer have concluded that our disclosure controls and procedures are effective to ensure that information required to be disclosed by
us in the reports that we file or submit under the Exchange Act is (1) recorded, processed, summarized and reported, within the time periods specified
in the SEC’s rules and forms, and (2) accumulated and communicated to our management, including our principal executive and principal financial
officers, as appropriate to allow timely decisions regarding required disclosure.
MANAGEMENT’S REPORT ON INTERNAL CONTROL OVER FINANCIAL
REPORTING
The management of the Company is
responsible for establishing and maintaining adequate internal control over financial reporting. The Exchange Act defines internal control over
financial reporting in Rule 13a-15(f) and 15d-15(f) as a process designed by, or under the supervision of, the company’s principal executive and
principal financial officers and effected by the company’s board of directors, management and other personnel, to provide reasonable assurance
regarding the reliability of financial reporting and the preparation of financial statements for external purposes in accordance with generally
accepted accounting principles and includes those policies and procedures that:
• |
pertain to the maintenance of records that in reasonable detail accurately and fairly reflect the transactions and dispositions of the assets of the company; |
• |
provide reasonable assurance that transactions are recorded as necessary to permit preparation of financial statements in accordance with generally accepted accounting principles, and that receipts and expenditures of the company are being made only in accordance with authorizations of management and directors of the company; and |
• |
provide reasonable assurance regarding prevention or timely detection of unauthorized acquisition, use or disposition of the company’s assets that could have a material effect on the consolidated financial statements. |
Because of its inherent
limitations, internal control over financial reporting may not prevent or detect misstatements. Also, projections of any evaluation of effectiveness to
future periods are subject to risk that controls may become inadequate because of changes in conditions, or that the degree of compliance with the
policies or procedures may deteriorate.
The Company’s management
assessed the effectiveness of the Company’s internal control over financial reporting as of December 31, 2011. In making this assessment, the
Company’s management used the criteria set forth by the Committee of Sponsoring Organizations, or COSO, of the Treadway Commission in
“Internal Control — Integrated Framework.”
28
Based upon its assessment,
management concluded that, as of December 31, 2011, the Company’s internal control over financial reporting is effective based upon those
criteria.
CHANGES IN INTERNAL CONTROL OVER FINANCIAL
REPORTING
There has been no change in our
internal control over financial reporting during the quarter ended December 31, 2011 that has materially affected, or is reasonably likely to
materially affect, our internal control over financial reporting.
ITEM
9B. |
OTHER INFORMATION |
Not applicable.
29
PART III
ITEM
10. |
DIRECTORS, EXECUTIVE OFFICERS AND CORPORATE GOVERNANCE |
The information required by this
Item and not otherwise set forth below will be included in the Proxy Statement and is incorporated herein by reference.
EXECUTIVE OFFICERS OF THE REGISTRANT
The following table sets forth
certain information, as of March 19, 2012, regarding our executive officers:
| Name |
Age |
Position |
||||||||
|---|---|---|---|---|---|---|---|---|---|---|
John W.
Roblin |
66 |
Chairman of the Board of Directors and Chief Executive Officer |
||||||||
Manish D.
Shah |
40 |
Director, President and Chief Technology Officer |
||||||||
Maryanne Z.
Gallagher |
50 |
Executive Vice President and Chief Operating Officer |
||||||||
Ann F.
Massey |
53 |
Chief
Financial Officer and Secretary |
||||||||
The biographies of our executive
officers are set forth below:
John W. Roblin has served
as our Chief Executive Officer since December 1999 and as a director since March 2000. He was named Chairman of the Board of Directors in February
2001. He served as our President from December 1999 to November 2008. Prior to joining us, Mr. Roblin was Chief Information Officer and Senior Vice
President for CIGNA Property and Casualty, positions he held since 1998. From 1994 until 1998, he was Chief Information Officer and Senior Vice
President for Advanta Corporation. Prior to 1994, he was the Chief Information Officer at Chubb & Son, USF&G and Traveler’s Personal Lines
Division.
Manish D. Shah has served
as a member of our Board and as our President since November 2008 and has served as our Chief Technology Officer since May 2004. Prior to his promotion
to the position of our President, he served as our Executive Vice President since May 2008. Mr. Shah served as our Director of Technology from December
2002 through May 2004 and served as our technology consultant from September 2000 through December 2001. He graduated with Honors from the Columbia
University Executive MBA Program in May 2008. Prior to joining us, Mr. Shah held several technology management positions at various companies such as
Andersen Consulting, P&O Nedlloyd and Tata Consultancy Services in different industries for over 10 years.
Maryanne Z. Gallagher has
served as our Executive Vice President and Chief Operating Officer since May 2008 and February 2001, respectively. Prior to holding the position of
Chief Operating Officer, she served as our Senior Vice President since January 2000. From November 1998 until December 1999, Ms. Gallagher served as
our Vice President — Customer Service. Ms. Gallagher joined us in 1990 and has held various development and support positions in our Classic
division through 1998.
Ann F. Massey has served
as our Chief Financial Officer since February 2001, as our Secretary since April 1997 and as our Controller since March 1997. From March 1996 to March
1997, Ms. Massey served as our Assistant Treasurer. From 1994 until February 1996, Ms. Massey served as Assistant Controller for our insurance services
division. Prior to 1994, Ms. Massey had served as our Accounting Manager.
30
ITEM
11. |
EXECUTIVE COMPENSATION |
The information required by this
Item will be included in the Proxy Statement and is incorporated herein by reference.
ITEM
12. |
SECURITY OWNERSHIP OF CERTAIN BENEFICIAL OWNERS AND MANAGEMENT AND RELATED STOCKHOLDER MATTERS |
The information required by this Item will be included in the Proxy Statement and is incorporated herein by
reference.
ITEM
13. |
CERTAIN RELATIONSHIPS AND RELATED TRANSACTIONS, AND DIRECTOR INDEPENDENCE |
The information required by this
Item will be included in the Proxy Statement and is incorporated herein by reference.
ITEM
14. |
PRINCIPAL ACCOUNTING FEES AND SERVICES |
The information required by this
Item will be included in the Proxy Statement and is incorporated herein by reference.
31
PART IV
ITEM
15. |
EXHIBITS AND FINANCIAL STATEMENT SCHEDULES |
(a) |
The following documents are filed as a part of this annual report on Form 10-K: |
(1) |
Financial Statements: |
Reference is made to the Index to
Consolidated Financial Statements on Page 33 of this annual report on Form 10-K.
(2) |
Financial Statement Schedule: |
Schedule II — Valuation and Qualifying Accounts. |
F-25 |
All other schedules are omitted
since the required information is not present or is not present in amounts sufficient to require submission of the schedules, or because the
information required is included in the financial statements and notes thereto.
(3) |
Exhibits: |
See Exhibit Index.
32
COVER-ALL TECHNOLOGIES INC.
INDEX TO CONSOLIDATED FINANCIAL STATEMENTS
| Page |
||||||
|---|---|---|---|---|---|---|
Report of
Independent Registered Public Accounting Firm |
F-1 | |||||
Consolidated
Balance Sheets — December 31, 2011 and 2010 |
F-2 | |||||
Consolidated
Statements of Operations — Years Ended December 31, 2011, 2010 and 2009 |
F-4 | |||||
Consolidated
Statements of Changes in Stockholders’ Equity — Years Ended December 31, 2011, 2010 and 2009 |
F-6 | |||||
Consolidated
Statements of Cash Flows — Years Ended December 31, 2011, 2010 and 2009 |
F-7 | |||||
Notes to
Consolidated Financial Statements |
F-9 | |||||
Financial
Statement Schedule II — Valuation and
Qualifying Accounts |
F-25 | |||||
33
REPORT OF INDEPENDENT REGISTERED PUBLIC ACCOUNTING
FIRM
To the Stockholders and the Board of Directors of Cover-All
Technologies Inc.
We have audited the accompanying consolidated balance
sheets of Cover-All Technologies Inc. and its subsidiary as of December 31, 2011 and 2010, and the related consolidated statements of operations,
changes in stockholders’ equity, and cash flows for each of the three years in the period ended December 31, 2011. Our audits also included the financial
statement schedule listed in the Index at Item 15(a). These consolidated financial
statements and the consolidated financial statement schedule are the responsibility of the Company’s management. Our responsibility is to express
an opinion on these consolidated financial statements and consolidated financial statement schedule based on our audits.
We conducted our audits in accordance with the standards of
the Public Company Accounting Oversight Board (United States). Those standards require that we plan and perform the audit to obtain reasonable
assurance about whether the financial statements are free of material misstatement. An audit includes examining, on a test basis, evidence supporting
the amounts and disclosures in the financial statements. An audit also includes assessing the accounting principles used and significant estimates made
by management, as well as evaluating the overall financial statement presentation. We believe that our audits provide a reasonable basis for our
opinion.
In our opinion, the consolidated financial statements
referred to above present fairly, in all material respects, the financial position of Cover-All Technologies Inc. and its subsidiary as of December 31,
2011 and 2010, and the consolidated results of their operations and their cash flows for each of the three years in the period ended December 31, 2011,
in conformity with U.S. generally accepted accounting principles.
Our audit was conducted for the purpose of forming an opinion on
the financial statements as a whole. The Financial Statement Schedule II — Valuation and Qualifying Accounts is presented for purposes of complying with the
Securities and Exchange Commission’s Rules and Regulations under the Securities Exchange Act of 1934 and is not otherwise a required part of the basic
consolidated financial statements. Such information is the responsibility of management and was derived from and relates directly to the underlying accounting and other
records used to prepare the basic consolidated financial statements. The information has been subjected to the auditing procedures applied in the audit of the consolidated
financial statements and certain additional procedures, including comparing and reconciling such information directly to the underlying accounting and other records
used to prepare the consolidated financial statements or to the basic consolidated financial statements themselves, and other additional procedures in accordance
with auditing standards generally accepted in the United States of America. In our opinion, the information is fairly stated in all material respects in relation to the
financial statements as a whole.
We were not engaged to examine management’s assessment
of the effectiveness of Cover-All Technologies Inc.’s internal control over financial reporting as of December 31, 2011, included in the
accompanying Management’s Report on Internal Control Over Financial Reporting and, accordingly, we do not express an opinion
thereon.
MSPC |
||||||||||
Certified Public Accountants and Advisors, A Professional Corporation |
||||||||||
New York, New York
March 30, 2012
March 30, 2012
F-1
COVER-ALL TECHNOLOGIES INC. AND SUBSIDIARY
CONSOLIDATED BALANCE SHEETS
| December 31, |
|||||||||||
|---|---|---|---|---|---|---|---|---|---|---|---|
| 2011 |
2010 |
||||||||||
Assets: |
|||||||||||
Current
Assets: |
|||||||||||
Cash and Cash
Equivalents |
$ | 3,281,965 | $ | 5,892,649 | |||||||
Accounts
Receivable (Less Allowance for Doubtful Accounts of $25,000 in 2011 and 2010) |
1,817,793 | 1,895,205 | |||||||||
Prepaid
Expenses |
576,522 | 691,020 | |||||||||
Deferred Tax
Asset |
1,099,000 | 800,000 | |||||||||
Total
Current Assets |
6,775,280 | 9,278,874 | |||||||||
Property
and Equipment — At Cost: |
|||||||||||
Furniture,
Fixtures and Equipment |
912,527 | 956,269 | |||||||||
Less:
Accumulated Depreciation |
(633,356 | ) | (530,701 | ) | |||||||
Property
and Equipment — Net |
279,171 | 425,568 | |||||||||
Goodwill |
1,039,114 | 1,039,114 | |||||||||
Customer
Lists/Relationships (Less Accumulated Amortization of $126,093 and $52,759 in 2011 and 2010, Respectively) |
93,907 | 167,241 | |||||||||
Non-Competition Agreements (Less Accumulated Amortization of $116,044 and $46,044 in 2011 and 2010, Respectively) |
49,956 | 113,955 | |||||||||
Capitalized Software (Less Accumulated Amortization of $14,134,024 and $12,584,710 in 2011 and 2010, Respectively) |
8,799,711 | 5,804,093 | |||||||||
Deferred
Tax Asset |
2,168,500 | 2,467,500 | |||||||||
Business
Acquisition |
1,035,821 | — | |||||||||
Other
Assets |
216,971 | 217,015 | |||||||||
Total
Assets |
$ | 20,458,431 | $ | 19,513,360 | |||||||
See Notes to Consolidated Financial
Statements.
F-2
COVER-ALL TECHNOLOGIES INC. AND SUBSIDIARY
CONSOLIDATED BALANCE SHEETS
| December 31, |
|||||||||||
|---|---|---|---|---|---|---|---|---|---|---|---|
| 2011 |
2010 |
||||||||||
Liabilities and Stockholders’ Equity: |
|||||||||||
Current
Liabilities: |
|||||||||||
Accounts
Payable |
$ | 440,635 | $ | 273,910 | |||||||
Accrued
Liabilities |
753,888 | 1,363,706 | |||||||||
Deferred
Charges |
43,788 | 52,545 | |||||||||
Note
Payable |
— | 400,000 | |||||||||
Unearned
Revenue |
2,298,985 | 2,175,683 | |||||||||
Total
Current Liabilities |
3,537,296 | 4,265,844 | |||||||||
Long-Term
Liabilities: |
|||||||||||
Deferred
Charges |
— | 43,788 | |||||||||
Total
Liabilities |
3,537,296 | 4,309,632 | |||||||||
Commitments and Contingencies |
— | — | |||||||||
Stockholders’ Equity: |
|||||||||||
Common Stock,
$.01 Par Value, Authorized 75,000,000 Shares; 25,782,730 and 25,201,671 Shares Issued and 25,782,730 and 24,999,801 Shares Outstanding in 2011 and
2010, Respectively |
257,827 | 252,017 | |||||||||
Capital In
Excess of Par Value |
30,812,059 | 30,450,122 | |||||||||
Accumulated
Deficit |
(14,148,751 | ) | (15,333,517 | ) | |||||||
Treasury
Stock — Nil and 201,870 Shares — At Cost |
— | (164,894 | ) | ||||||||
Total
Stockholders’ Equity |
16,921,135 | 15,203,728 | |||||||||
Total
Liabilities and Stockholders’ Equity |
$ | 20,458,431 | $ | 19,513,360 | |||||||
See Notes to Consolidated Financial
Statements.
F-3
COVER-ALL TECHNOLOGIES INC. AND SUBSIDIARY
CONSOLIDATED STATEMENTS OF OPERATIONS
| Years ended |
|||||||||||||||
|---|---|---|---|---|---|---|---|---|---|---|---|---|---|---|---|
| December 31, |
|||||||||||||||
| 2011 |
2010 |
2009 |
|||||||||||||
Revenues: |
|||||||||||||||
Licenses |
$ | 4,769,863 | $ | 2,288,202 | $ | 4,138,252 | |||||||||
Support
Services |
8,345,792 | 8,098,908 | 7,095,167 | ||||||||||||
Professional
Services |
4,480,043 | 7,069,715 | 3,281,973 | ||||||||||||
Total
Revenues |
17,595,698 | 17,456,825 | 14,515,392 | ||||||||||||
Costs of
Revenues: |
|||||||||||||||
Licenses |
2,948,667 | 3,006,221 | 3,497,643 | ||||||||||||
Support
Services |
4,711,864 | 2,834,910 | 2,685,549 | ||||||||||||
Professional
Services |
4,313,160 | 4,976,200 | 1,577,075 | ||||||||||||
Total
Costs of Revenues |
11,973,691 | 10,817,331 | 7,760,267 | ||||||||||||
Direct
Margin |
5,622,007 | 6,639,494 | 6,755,125 | ||||||||||||
Operating
Expenses: |
|||||||||||||||
Sales and
Marketing |
1,776,573 | 1,423,656 | 906,074 | ||||||||||||
General and
Administrative |
1,913,129 | 1,901,673 | 1,674,445 | ||||||||||||
Acquisition
Costs |
137,020 | 285,240 | — | ||||||||||||
Research and
Development |
616,703 | 847,496 | 890,951 | ||||||||||||
Total
Operating Expenses |
4,443,425 | 4,458,065 | 3,471,470 | ||||||||||||
Operating
Income |
1,178,582 | 2,181,429 | 3,283,655 | ||||||||||||
Other
(Income) Expense: |
|||||||||||||||
Interest
Expense |
13,767 | 18,740 | — | ||||||||||||
Interest
Income |
(269 | ) | (8,687 | ) | (6,172 | ) | |||||||||
Other
Expense |
— | — | 616 | ||||||||||||
Other
Income |
(19,682 | ) | (43,477 | ) | (45,370 | ) | |||||||||
Total
Other (Income) Expense |
(6,184 | ) | (33,424 | ) | (50,926 | ) | |||||||||
Income
Before Income Taxes |
1,184,766 | 2,214,853 | 3,334,581 | ||||||||||||
Income Tax
(Benefit) |
— | (736,933 | ) | (582,325 | ) | ||||||||||
Net
Income |
$ | 1,184,766 | $ | 2,951,786 | $ | 3,916,906 | |||||||||
See Notes to Consolidated Financial
Statements.
F-4
COVER-ALL TECHNOLOGIES INC. AND SUBSIDIARY
CONSOLIDATED STATEMENTS OF OPERATIONS
| Years ended |
|||||||||||||||
|---|---|---|---|---|---|---|---|---|---|---|---|---|---|---|---|
| December 31, |
|||||||||||||||
| 2011 |
2010 |
2009 |
|||||||||||||
Basic
Earnings Per Common Share |
$ | .05 | $ | .12 | $ | .16 | |||||||||
Diluted
Earnings Per Common Share |
$ | .05 | $ | .12 | $ | .16 | |||||||||
Weighted
Average Number of Common Shares Outstanding for Basic Earnings Per Common Share |
25,324,000 | 24,828,000 | 24,591,000 | ||||||||||||
Weighted
Average Number of Common Shares Outstanding for Diluted Income Earnings Per Common Share |
26,002,000 | 25,590,000 | 25,057,000 | ||||||||||||
See Notes to Consolidated Financial
Statements.
F-5
COVER-ALL TECHNOLOGIES INC. AND SUBSIDIARY
CONSOLIDATED STATEMENTS OF CHANGES IN STOCKHOLDERS’
EQUITY (DEFICIT)
| Common Stock |
Capital in Excess of Par Value |
Accumulated Deficit |
Treasury Stock |
Total Stockholders’ Equity |
||||||||||||||||||
|---|---|---|---|---|---|---|---|---|---|---|---|---|---|---|---|---|---|---|---|---|---|---|
Balance at
January 1, 2009 |
$ | 246,902 | $ | 29,185,646 | $ | (21,463,824 | ) | $ | (164,894 | ) | $ | 7,803,830 | ||||||||||
Exercise of
26,429 Stock Options and Warrants |
264 | 13,036 | — | — | 13,300 | |||||||||||||||||
Vesting of
75,000 Shares of Restricted Stock to One of Our Executives |
750 | (750 | ) | — | — | — | ||||||||||||||||
Grant of
84,000 Shares of Restricted Stock to Non- Employee Directors |
840 | 83,160 | — | — | 84,000 | |||||||||||||||||
Grant of
10,000 Shares of Restricted Stock to Our Investor Relations Firm |
100 | 12,400 | — | — | 12,500 | |||||||||||||||||
Non-Cash
Stock-Based Compensation |
— | 409,762 | — | — | 409,762 | |||||||||||||||||
Dividends
Paid to Common Stockholders |
— | — | (738,384 | ) | — | (738,384 | ) | |||||||||||||||
Net
Income |
— | — | 3,916,906 | — | 3,916,906 | |||||||||||||||||
Balance at
December 31, 2009 |
248,856 | 29,703,254 | (18,285,302 | ) | (164,894 | ) | 11,501,914 | |||||||||||||||
Exercise of
60,000 Stock Options and Warrants |
600 | 40,700 | — | — | 41,300 | |||||||||||||||||
Vesting of
107,500 Shares of Restricted Stock to Several of Our Employees |
1,075 | (1,075 | ) | — | — | — | ||||||||||||||||
Grant of
72,501 Shares of Restricted Stock to Non- Employee Directors |
725 | 99,164 | — | — | 99,889 | |||||||||||||||||
Grant of
76,014 Shares of Stock to MSBS Related to the Acquisition |
760 | 89,240 | — | — | 90,000 | |||||||||||||||||
Non-Cash
Stock-Based Compensation |
— | 518,839 | — | — | 518,839 | |||||||||||||||||
Net
Income |
— | — | 2,951,786 | — | 2,951,786 | |||||||||||||||||
Balance at
December 31, 2010 |
252,016 | 30,450,122 | (15,333,516 | ) | (164,894 | ) | 15,203,728 | |||||||||||||||
Retirement of
Treasury Stock |
(4,468 | ) | (627,176 | ) | — | 631,644 | — | |||||||||||||||
Exercise of
820,000 Stock Options and Warrants |
8,200 | 511,500 | — | (466,750 | ) | 52,950 | ||||||||||||||||
Vesting of
165,000 Shares of Restricted Stock to Several of Our Employees |
1,650 | (1,650 | ) | — | — | — | ||||||||||||||||
Grant of
42,858 Shares of Restricted Stock to Non- Employee Directors |
429 | 86,571 | — | — | 87,000 | |||||||||||||||||
Non-Cash
Stock-Based Compensation |
— | 392,691 | — | — | 392,691 | |||||||||||||||||
Net
Income |
— | — | 1,184,766 | — | 1,184,766 | |||||||||||||||||
Balance at
December 31, 2011 |
$ | 257,827 | $ | 30,812,058 | $ | (14,148,750 | ) | $ | — | $ | 16,921,135 | |||||||||||
See Notes to Consolidated Financial
Statements.
F-6
COVER-ALL TECHNOLOGIES INC. AND SUBSIDIARY
CONSOLIDATED STATEMENTS OF CASH FLOWS
| Years ended |
|||||||||||||||
|---|---|---|---|---|---|---|---|---|---|---|---|---|---|---|---|
| December 31, |
|||||||||||||||
| 2011 |
2010 |
2009 |
|||||||||||||
Cash Flows
from Operating Activities: |
|||||||||||||||
Net
Income |
$ | 1,184,766 | $ | 2,951,786 | $ | 3,916,906 | |||||||||
Adjustments
to Reconcile Net Income to Net Cash Provided by Operating Activities: |
|||||||||||||||
Depreciation |
146,397 | 159,835 | 72,165 | ||||||||||||
Amortization
of Capitalized Software |
1,549,314 | 618,345 | 917,207 | ||||||||||||
Amortization
of Customer Lists/Relationships |
73,333 | 52,759 | — | ||||||||||||
Amortization
of Non-Competition Agreements |
64,000 | 46,044 | — | ||||||||||||
Amortization
of Stock-Based Compensation |
392,691 | 518,839 | 409,762 | ||||||||||||
Stock-Based
Compensation Provided for Services |
87,000 | 99,889 | 96,500 | ||||||||||||
Deferred Tax
Benefit |
— | (800,000 | ) | (787,500 | ) | ||||||||||
Write-off of
Leasehold Improvement |
— | — | 616 | ||||||||||||
Changes in
Assets and Liabilities: |
|||||||||||||||
(Increase)
Decrease in: |
|||||||||||||||
Accounts
Receivable |
77,412 | 3,191,277 | (3,030,667 | ) | |||||||||||
Prepaid
Expenses |
114,498 | (245,274 | ) | (80,688 | ) | ||||||||||
Other
Assets |
44 | (106,864 | ) | — | |||||||||||
Increase
(Decrease) in: |
|||||||||||||||
Accounts
Payable |
166,725 | 65,096 | (18,193 | ) | |||||||||||
Accrued
Liabilities |
(609,818 | ) | 88,648 | 213,993 | |||||||||||
Taxes
Payable |
— | (139,035 | ) | 139,035 | |||||||||||
Deferred
Charges |
(52,545 | ) | (27,510 | ) | (22,503 | ) | |||||||||
Unearned
Revenue |
123,302 | 425,380 | (50,182 | ) | |||||||||||
Net Cash
Provided by Operating Activities |
3,317,119 | 6,899,215 | 1,776,451 | ||||||||||||
Cash Flows
from Investing Activities: |
|||||||||||||||
Capital
Expenditures |
— | (119,810 | ) | (2,335 | ) | ||||||||||
Capitalized
Software Expenditures |
(4,544,932 | ) | (3,260,479 | ) | (1,411,057 | ) | |||||||||
Cost of
Acquisition |
(1,035,821 | ) | (1,792,023 | ) | — | ||||||||||
Net Cash
Used for Investing Activities |
(5,580,753 | ) | (5,172,312 | ) | (1,413,392 | ) | |||||||||
Cash Flows
from Financing Activities: |
|||||||||||||||
Payment of
Debt |
(400,000 | ) | (200,000 | ) | — | ||||||||||
Dividends
Paid to Common Stockholders |
— | — | (738,383 | ) | |||||||||||
Proceeds from
Exercise of Stock Options, Restricted Stock and Warrants |
52,950 | 41,300 | 13,300 | ||||||||||||
Purchase of
Treasury Stock |
— | — | — | ||||||||||||
Net Cash
(Used for) Financing Activities |
(347,050 | ) | (158,700 | ) | (725,083 | ) | |||||||||
(Decrease)
Increase in Cash and Cash Equivalents |
(2,610,684 | ) | 1,568,203 | (362,024 | ) | ||||||||||
Cash and
Cash Equivalents — Beginning of Years |
5,892,649 | 4,324,446 | 4,686,470 | ||||||||||||
Cash and
Cash Equivalents — End of Years |
$ | 3,281,965 | $ | 5,892,649 | $ | 4,324,446 | |||||||||
See Notes to Consolidated Financial
Statements.
F-7
COVER-ALL TECHNOLOGIES INC. AND SUBSIDIARY
CONSOLIDATED STATEMENTS OF CASH FLOWS
| Years ended |
|||||||||||||||
|---|---|---|---|---|---|---|---|---|---|---|---|---|---|---|---|
| December 31, |
|||||||||||||||
| 2011 |
2010 |
2009 |
|||||||||||||
Supplemental Disclosures of Cash Flow Information: |
|||||||||||||||
Cash paid
during the years for: |
|||||||||||||||
Interest |
$ | 13,767 | $ | 18,740 | $ | — | |||||||||
Income
Taxes |
$ | 27,413 | $ | 267,102 | $ | 66,140 | |||||||||
Supplemental Disclosures of Non-Cash Investing
Activities:
On April 12, 2010, the Company purchased certain assets of
Moore Stephens Business Solutions, LLC (“MSBS”). In connection with the acquisition, debt was issued as follows:
Fair Value of
Assets Acquired |
$ | 2,482,023 | ||||
Cash Paid for
the Assets Acquired |
(1,792,023 | ) | ||||
Fair Value of
Common Stock Issued |
(90,000 | ) | ||||
Debt
Issued |
$ | 600,000 |
The Company issued an aggregate of 76,014 shares of its
common stock in connection with the acquisition. See Note 3 of the Consolidated Financial Statements for further details on the
acquisition.
See Notes to Consolidated Financial
Statements.
F-8
COVER-ALL TECHNOLOGIES INC. AND SUBSIDIARY
NOTES TO CONSOLIDATED FINANCIAL STATEMENTS
NOTES TO CONSOLIDATED FINANCIAL STATEMENTS
[1] Summary of Significant Accounting
Policies
Description of Business - Cover-All
Technologies Inc., through its wholly-owned subsidiary, Cover-All Systems, Inc., licenses and maintains its software products for the property/casualty
insurance industry throughout the United States and Puerto Rico. The subsidiary also provides professional consulting services to its customers
interested in customizing their software.
Principles of Consolidation - The
consolidated financial statements include the accounts of Cover-All Technologies Inc. and its wholly-owned subsidiary. All material intercompany
balances and transactions have been eliminated.
Use of Estimates - The preparation of
financial statements in conformity with accounting principles generally accepted in the United States requires management to make estimates and
assumptions that affect reported amounts of assets and liabilities and disclosure of contingent assets and liabilities at the date of the financial
statements and the reported amounts of revenues and expenses during the reporting period. Actual results could differ from those
estimates.
Revenue Recognition - Our revenues are
recognized in accordance with Accounting Standards Codification (“ASC”) 986-605, Software Revenue Recognition. Revenue from the sale
of software licenses is recognized when standardized software modules are delivered to and accepted by the customer, the license term has begun, the
fee is fixed or determinable and collectibility is probable. Revenue from support services are recognized ratably over the lives of the contracts.
Revenue from professional services is recognized when the service is provided.
We enter into revenue arrangements in which a customer may
purchase a combination of software, support, and professional services (multiple-element arrangements). When vendor-specific objective evidence
(“VSOE”) of fair value exists for all elements, we allocate revenue to each element based on the relative fair value of each of the elements.
VSOE of fair value is established by the price charged when that element is sold separately. For support, VSOE of fair value is established by renewal
rates, when they are sold separately. For arrangements where VSOE of fair value exists only for the undelivered elements, we defer the full fair value
of the undelivered elements and recognize the difference between the total arrangement fee and the amount deferred for the undelivered items as
revenue, assuming all other criteria for revenue recognition have been met.
Cash and Cash Equivalents - We consider all
highly liquid investments, with a maturity of three months or less when purchased, to be cash equivalents.
Risk Concentrations - Financial instruments
which potentially subject us to concentrations of credit risk consist principally of cash and cash equivalents and trade accounts receivable. We place
our cash and cash equivalents with high credit quality institutions to limit credit exposure. We believe no significant concentration of credit risk
exists with respect to these deposits. Management believes that the amount of cash beyond insured amounts at December 31, 2011 is not at significant
risk.
Concentrations of credit risk with respect to trade
accounts receivable are limited due to the wide variety of customers principally major insurance companies, who are dispersed across many geographic
regions. As of December 31, 2011, five customers accounted for approximately 73% of our trade accounts receivable portfolio. As of December 31, 2010,
four customers accounted for approximately 70% of our trade accounts receivable portfolio. We routinely assess the financial strength of customers and,
based upon factors concerning credit risk, we establish an allowance for doubtful accounts. Management believes that accounts receivable credit risk
exposure beyond such allowance is limited.
F-9
COVER-ALL TECHNOLOGIES INC. AND SUBSIDIARY
NOTES TO CONSOLIDATED FINANCIAL STATEMENTS, Sheet #2
NOTES TO CONSOLIDATED FINANCIAL STATEMENTS, Sheet #2
[1] Summary of Significant Accounting Policies
[Continued]
Impairment of Long-Lived Assets - We review
our long-lived assets and identifiable intangibles for impairment whenever events or changes in circumstances indicate that the carrying amount of an
asset may not be recoverable. When such factors and circumstances exist, we compare the projected undiscounted future cash flows associated with the
future use and disposal of the related asset or group of assets to their respective carrying amounts. Impairment, if any, is measured as the excess of
the carrying amount over the fair value based on market value (when available) or discounted expected cash flows of those assets, and is recorded in
the period in which the determination is made.
Stock-Based Compensation - We follow the
guidance of ASC 718, Accounting for Stock Options and Other Stock-Based Compensation. ASC 718 requires companies to record compensation expense
for share-based awards issued to employees and directors in exchange for services provided. The amount of the compensation expense is based on the
estimated fair value of the awards on their grant dates and is recognized over the required service periods. Our share-based awards include stock
options and restricted stock awards. Prior to our adoption of ASC 718, we applied the intrinsic value method to calculate the compensation expense for
share-based awards. Historically, we have generally set the exercise price for our stock options equal to the market value on the grant date. As a
result, the options generally had no intrinsic value on their grant dates, and we did not record any compensation expense unless the terms of the
options were subsequently modified. For restricted stock awards, the calculation of compensation expense is the same.
For the year ended December 31, 2011, we recognized
$479,691 of stock-based compensation expense in our consolidated financial statements. For the year ended December 31, 2010, we recognized $618,728 of
stock-based compensation expense in our consolidated financial statements. For the year ended December 31, 2009, we recognized $506,262 of stock-based
compensation expense in our consolidated financial statements. We recognized expense because we had (a) stock options granted prior to January 1, 2006
that had not yet vested as of January 1, 2006 and (b) stock options and restricted stock granted subsequent to January 1, 2006.
The estimated fair value underlying our calculation of
compensation expense for stock options is based on the Black-Scholes pricing model. ASC 718 requires forfeitures of share-based awards to be estimated
at the time of grant and revised, if necessary, in subsequent periods if our estimates change based on the actual amount of forfeitures we have
experienced.
Property and Equipment - Furniture, fixtures
and equipment are carried at cost. Depreciation is recorded on the straight-line method over three to ten years, which approximates the estimated
useful lives of the assets. Depreciation expense in 2011, 2010 and 2009 was $146,397, $159,835 and $72,165, respectively.
Routine maintenance and repair costs are charged to expense
as incurred and renewals and improvements that extend the useful life of the assets are capitalized. Upon sale or retirement, the cost and related
accumulated depreciation are eliminated from the respective accounts and any resulting gain or loss is reported in the statement of
operations.
F-10
COVER-ALL TECHNOLOGIES INC. AND SUBSIDIARY
NOTES TO CONSOLIDATED FINANCIAL STATEMENTS, Sheet #3
NOTES TO CONSOLIDATED FINANCIAL STATEMENTS, Sheet #3
[1] Summary of Significant Accounting Policies
[Continued]
Intangible Assets - All of the Company’s
intangible assets are amortized using the straight-line method over their estimated useful lives, which ranges from 30 months to 3 years. The Company
evaluates its intangible assets for impairment whenever events or changes in circumstances indicate that the carrying amount of such assets may not be
recoverable. Impairment is assessed by comparing the undiscounted cash flows expected to be generated by the intangible asset to its carrying value. If
an impairment exists, the Company calculates the impairment by comparing the carrying value of the intangible asset to its fair value as determined by
discounted expected cash flows. The Company has not recorded any impairments in 2011, 2010 or 2009.
Goodwill - We review our goodwill for
impairment annually in the fourth quarter. We also analyze whether any indicators of impairment exist each quarter. A significant amount of judgment is
involved in determining if an indicator of impairment has occurred. Such indicators may include a sustained, significant decline in our share price and
market capitalization, a decline in our expected future cash flows, a significant adverse change in legal factors or in the business climate,
unanticipated competition, the testing for recoverability of our assets, and/or slower growth rates, among others.
We estimate the fair value of MSBS using discounted
expected future cash flows, supported by the results of various market approach valuation models. If the fair value of MSBS exceeds net book value,
goodwill is not impaired, and no further testing is necessary. If the net book value exceeds fair value, we perform a second test to measure the amount
of impairment loss. To measure the amount of any impairment charge, we determine the implied fair value of goodwill in the same manner as in a business
combination.
Specifically, we allocate fair value to all assets and
liabilities, including any unrecognized intangible assets, in a hypothetical calculation that would yield the implied fair value of goodwill. If the
implied fair value of goodwill is less than the goodwill recorded on our consolidated balance sheet, we record an impairment charge for the difference.
There was no recorded impairment of goodwill during the year ended December 31, 2011.
Capitalized Software - Costs for the
conceptual formulation and design of new software products are expensed as incurred until technological feasibility has been established. Once
technological feasibility has been established, we capitalize costs to produce the finished software products. Capitalization ceases when the product
is available for general release to customers. Costs associated with product enhancements that extend the original product’s life or significantly
improve the original product’s marketability are also capitalized once technological feasibility has been established. Amortization is calculated
on a product-by-product basis as the greater of the amount computed using (a) the ratio that current gross revenues for a product bear to the total of
current and anticipated future gross revenues for that product or (b) the straight-line method over the remaining economic life of the product. At each
balance sheet date, the unamortized capitalized costs of each computer software product is compared to the net realizable value of that product. If an
amount of unamortized capitalized costs of a computer software product is found to exceed the net realizable value of that asset, such amount will be
written off. The net realizable value is the estimated future gross revenues from that product reduced by the estimated future costs of completing and
deploying that product, including the costs of performing maintenance and customer support required to satisfy our responsibility set forth at the time
of sale.
Advertising Expense - We expense advertising
costs as incurred. Advertising expense in 2011, 2010 and 2009 was $268,489, $243,136 and $121,460, respectively, and is reported as a component of
sales and marketing expense.
F-11
COVER-ALL TECHNOLOGIES INC. AND SUBSIDIARY
NOTES TO CONSOLIDATED FINANCIAL STATEMENTS, Sheet #4
NOTES TO CONSOLIDATED FINANCIAL STATEMENTS, Sheet #4
[1] Summary of Significant Accounting Policies
[Continued]
Income Taxes - As defined by ASC 740,
Accounting for Income Taxes, income tax expense (or benefit) for the year is the sum of deferred tax expense (or benefit) and income taxes
currently payable (or refundable). Deferred tax expense (or benefit) is the change during the year in a company’s deferred tax liabilities and
assets. Deferred tax liabilities and assets are determined based on differences between financial reporting and tax bases of assets and liabilities,
and are measured using the enacted tax rates and laws that will be in effect when the differences are expected to reverse.
Earnings Per Share - We follow the provisions
of ASC 260, Earnings per Share. Basic earnings per share is computed by dividing income available to common stockholders by the weighted average
number of common shares outstanding during the period. ASC 260 also requires a dual presentation of basic and diluted earnings per share on the face of
the statement of operations for all companies with complex capital structures. Diluted earnings per share reflects the amount of earnings for the
period available to each share of common stock outstanding during the reporting period, while giving effect to all dilutive potential common shares
that were outstanding during the period, such as common shares that could result from the potential exercise or conversion of securities into common
stock.
The computation of diluted earnings per share does not
assume conversion, exercise or contingent issuance of securities that would have an antidilutive effect on per share amounts (i.e., increasing earnings
per share or reducing loss per share). The dilutive effect of outstanding options and warrants and their equivalents are reflected in dilutive earnings
per share by the application of the treasury stock method which recognizes the use of proceeds that could be obtained upon exercise of options and
warrants in computing diluted earnings per share. It assumes that any proceeds would be used to purchase common stock at the average market price
during the period. Options and warrants will have a dilutive effect only when the average market price of the common stock during the period exceeds
the exercise price of the options or warrants. Equity instruments that may dilute earnings per share in the future are listed in Note
8.
The dilutive effect of convertible debt is reflected in
diluted earnings per share by the application of the if-converted method. The convertible debt could potentially dilute basic earnings per share in
future periods.
Deferred Charges - The Company’s lease
on its premises provides for periodic increases over the lease term. Pursuant to ASC 840, Accounting for Leases, the Company records rent
expense on a straight-line basis. The effect of this difference is recorded as deferred charges.
Fair Value of Financial Instruments -
Generally accepted accounting principles require disclosing the fair value of financial instruments to the extent practicable for financial
instruments, which are recognized or unrecognized in the balance sheet. The fair value of the financial instruments disclosed herein is not necessarily
representative of the amount that could be realized or settled, nor does the fair value amount consider the tax consequences of realization or
settlement. In assessing the fair value of these financial instruments, the Company used a variety of methods and assumptions, which were based on
estimates of market conditions and risks existing at that time. For certain instruments, including the cash accounts receivable, accounts payable and
accrued expenses, it was estimated that the carrying amount approximated fair value for the majority of these instruments because of their short
maturity. The fair value of property and equipment is estimated to approximate their net book value.
F-12
COVER-ALL TECHNOLOGIES INC. AND SUBSIDIARY
NOTES TO CONSOLIDATED FINANCIAL STATEMENTS, Sheet #5
NOTES TO CONSOLIDATED FINANCIAL STATEMENTS, Sheet #5
[2] Recently Issued Accounting
Standards
In September 2011, the FASB issued Accounting Standards
Update (“ASU”) No. 2011-08 “Intangibles—Goodwill and Other (Topic 350): Testing Goodwill for Impairment.” The amendment
permits an entity to first assess qualitative factors to determine whether it is more likely than not that the fair value of a reporting unit is less
than its carrying amount as a basis for determining whether it is necessary to perform the two-step goodwill impairment test described in FASB ASC
Topic 350. The more-likely-than-not threshold is defined as having a likelihood of more than 50%. The guidance also includes examples of the types of
events and circumstances to consider in conducting the qualitative assessment. It is effective for annual and interim goodwill impairment tests
performed for fiscal years beginning after December 15, 2011. Early adoption is permitted, including for annual and interim goodwill impairment tests
performed as of a date before September 15, 2011, if an entity’s financial statements for the most recent annual or interim period have not yet
been issued or, for nonpublic entities, have not yet been made available for issuance.
In June 2011, the FASB issued ASU No. 2011-05
“Presentation of Comprehensive Income.” The updated guidance requires companies to disclose the total of comprehensive income, the components
of net income, and the components of other comprehensive income either in a single continuous statement of comprehensive income or in two separate but
consecutive statements. The updated guidance does not affect how earnings per share is calculated or presented. The updated guidance is effective for
fiscal years, and interim periods within those years, beginning after December 15, 2011. The Company does not believe the adoption of this guidance
will have a material impact on its consolidated financial statements.
In May 2011, the FASB issued ASU No. 2011-04
“Amendments to Achieve Common Fair Value Measurement and Disclosure Requirements in U.S. GAAP and IFRSs.” ASU No. 2011-04 amends FASB ASC
Topic 820, Fair Value Measurements and Disclosures, to establish common requirements for measuring fair value and for disclosing information about fair
value measurements in accordance with Generally Accepted Accounting Principles and International Financial Reporting Standards. ASU No. 2011-04 is
effective for fiscal years beginning after December 15, 2011 and for interim periods within those fiscal years. The Company does not believe the
adoption of this guidance will have a material impact on its consolidated financial statements.
We believe there is no additional new accounting guidance
adopted, but not yet effective, that is relevant to the readers of our financial statements. However, there are numerous new proposals under
development which may have a significant impact on the Company’s financial reporting, if and when enacted.
F-13
COVER-ALL TECHNOLOGIES INC. AND SUBSIDIARY
NOTES TO CONSOLIDATED FINANCIAL STATEMENTS, Sheet #6
NOTES TO CONSOLIDATED FINANCIAL STATEMENTS, Sheet #6
[3] Acquisition, Goodwill and Other Intangible
Assets
On April 12, 2010, the Company announced the acquisition of
MSBS, a provider of business intelligence and advanced analytics solutions to the insurance industry based in New York, New York. The Company acquired
substantially all of MSBS’ assets (excluding working capital) for an aggregate purchase price of $2,450,000, with no assumed indebtedness, payable
as follows: (i) a cash payment in the amount of $1,760,000; (ii) the execution and delivery by us to MSBS of a non-negotiable, subordinated promissory
note in the aggregate principal amount of $600,000; and (iii) the delivery to MSBS of 76,014 shares of our common stock, which number of shares had a
fair market value of $90,000 calculated as provided for in the purchase agreement.
MSBS serves the insurance industry exclusively, providing
business intelligence and advanced analytics solutions. Leveraging its Insurance Analytic Framework (IAF), which delivers accurate, available and
actionable key metric and dimensions specific to the insurance industry, MSBS has established a dominant presence in an otherwise underserved market.
With the integration of these capabilities into the Cover-All portfolio, the combined company will be well positioned to deliver additional value to
the existing customers of both companies, as well as benefit from an unrivaled and unique competitive advantage in its combined
offerings.
On April 12, 2010 the MSBS acquisition was valued at
$2,482,023. As a result of that acquisition, the Company acquired the following assets:
Prepaid
Expenses |
$ | 30,253 | ||||
Computer
Equipment |
106,400 | |||||
Furniture and
Fixtures |
89,480 | |||||
Leasehold
Improvements |
16,775 | |||||
Partially
Complete Software |
820,000 | |||||
Agreements |
160,000 | |||||
Customer
Lists/Relationships |
220,000 | |||||
Goodwill |
1,039,115 | |||||
Total |
$ | 2,482,023 |
The above amounts represent the allocation of the purchase
price based on the asset valuation which occurred during April 2010. Goodwill resulted from the acquisition price exceeding the fair market value of
assets acquired.
On December 30, 2011, the Company entered into an Asset
Purchase Agreement with Ho’ike Services, Inc., dba BlueWave Technology, a Hawaii corporation (the “Seller”). Under the terms of the
Purchase Agreement, the Company purchased from Seller certain of the assets (excluding working capital) and assumed certain liabilities of
Seller’s business of developing and servicing enterprise claims management software for use in the property and casualty insurance industry,
including for use by property and casualty insurance companies, third party administrators, managing general agents, self-insured employers and state
funds and providing certain services related thereto, which Business Seller had marketed under the name “PipelineClaims.”
F-14
COVER-ALL TECHNOLOGIES INC. AND SUBSIDIARY
NOTES TO CONSOLIDATED FINANCIAL STATEMENTS, Sheet #7
NOTES TO CONSOLIDATED FINANCIAL STATEMENTS, Sheet #7
[3] Acquisition, Goodwill and Other Intangible Assets
[Continued]
The purchase price for the Assets, in addition to the
assumption by the Company of the Assumed Liabilities, consists of the following: (i) $1,1000,000 in cash (subject to adjustment) on the Closing Date,
(x) $635,821 of which (net of adjustments for certain prepayments to Seller and other prorations) was paid in cash to Seller, and (y) $400,000 of which
was deposited into an escrow account to be held and distributed by an escrow agent pursuant to the terms of an escrow agreement to secure possible
future indemnification claims and certain other post-closing matters in favor of the Company; and (ii) up to an aggregate of $750,000 in an earnout,
which earnout shall be based upon the performance of the Business in the five (5) years following the closing of the Acquisition. More particularly,
for each of the five (5) years following the Acquisition, Seller will be entitled to receive an amount equal to ten percent (10%) of the PipelineClaims
Free Cash Flow (as such term is defined in the Purchase Agreement) but in no event will the Company be required to pay to Seller in excess of $750,000
in the aggregate for the 5-year period.
On December 30, 2011, the acquisition was valued at
$1,035,821. As a result of this acquisition, the Company acquired the following assets:
Prepaid
Expenses |
$ | 13,163 | ||||
Computer
Equipment |
10,658 | |||||
Customer
List |
182,000 | |||||
Software |
830,000 | |||||
Total |
$ | 1,035,821 |
The above amounts represent the allocation of the purchase
price based on the asset valuation which occurred during March 2012.
[4] Commitments, Contingencies and Related Party
Transactions
Operating Leases - We lease approximately
20,000 square feet of office space under a lease which expires in October 2012 and approximately 6,000 square feet of office space under a lease which
expires in January 2014.
Rent expense was $709,976, $600,904 and $442,816 for the
years ended December 31, 2011, 2010 and 2009, respectively.
Our future minimum lease commitments under the
noncancellable operating leases for rental of our office space in effect at December 31, 2011 were as follows:
Year ending
December 31, |
||||||
2012 |
$ | 630,450 | ||||
2013 |
277,048 | |||||
2014 and
Thereafter |
23,125 | |||||
Total |
$ | 930,623 |
F-15
COVER-ALL TECHNOLOGIES INC. AND SUBSIDIARY
NOTES TO CONSOLIDATED FINANCIAL STATEMENTS, Sheet #8
NOTES TO CONSOLIDATED FINANCIAL STATEMENTS, Sheet #8
[4] Commitments, Contingencies and Related Party
Transactions [Continued]
Employment Contracts - Effective January 1,
2011, we have an employment contract with one of our executives with an expiration date of December 31, 2013. The aggregate commitment for future
salary at December 31, 2010 was approximately $700,000. The aggregate commitment for future salary at December 31, 2010 was approximately $350,000. The
contract also includes a bonus based on the performance of the Company. We had an employment contract with one of our executives with an expiration
date of December 31, 2011. The aggregate commitment for future salary at December 31, 2009 was approximately $700,000. The contract also included a
bonus based on the performance of the Company. The contract also granted stock options and 150,000 shares of restricted stock on the effective
date.
[5] Income Taxes
An analysis of the components of the income tax provision
is as follows:
| Years ended |
|||||||||||||||
|---|---|---|---|---|---|---|---|---|---|---|---|---|---|---|---|
| December 31, |
|||||||||||||||
| 2011 |
2010 |
2009 |
|||||||||||||
Current: |
|||||||||||||||
Federal |
$ | — | $ | 11,492 | $ | 106,412 | |||||||||
State |
— | 51,575 | 98,763 | ||||||||||||
Totals |
— | 63,067 | 205,175 | ||||||||||||
Deferred: |
|||||||||||||||
Federal |
— | (800,000 | ) | (787,500 | ) | ||||||||||
State |
— | — | — | ||||||||||||
Totals |
— | (800,000 | ) | (787,500 | ) | ||||||||||
Income Tax (Benefit) Expense |
$ | — | $ | (736,933 | ) | $ | (582,325 | ) | |||||||
The income tax for continuing operations differs from the
amount computed by applying the statutory federal income tax rate as follows:
| Years ended |
|||||||||||||||
|---|---|---|---|---|---|---|---|---|---|---|---|---|---|---|---|
| December 31, |
|||||||||||||||
| 2011 |
2010 |
2009 |
|||||||||||||
Computed
Federal Statutory Tax (Benefit) |
$ | — | $ | 753,050 | $ | 1,133,758 | |||||||||
Valuation
Allowance Adjustment to Deferred Tax Asset |
— | (800,000 | ) | (787,500 | ) | ||||||||||
Tax Benefit
of Federal Net Operating Loss Carryforward |
— | (689,983 | ) | (928,583 | ) | ||||||||||
Actual Tax (Benefit) |
$ | — | $ | (736,933 | ) | $ | (582,325 | ) | |||||||
F-16
COVER-ALL TECHNOLOGIES INC. AND SUBSIDIARY
NOTES TO CONSOLIDATED FINANCIAL STATEMENTS, Sheet #9
NOTES TO CONSOLIDATED FINANCIAL STATEMENTS, Sheet #9
[5] Income Taxes [Continued]
The components of the net deferred tax asset and liability
were as follows:
| Years ended |
|||||||||||
|---|---|---|---|---|---|---|---|---|---|---|---|
| December 31, |
|||||||||||
| 2011 |
2010 |
||||||||||
Deferred Tax
Assets — Current: |
|||||||||||
Accounts
Receivable Allowance |
$ | 10,000 | $ | 10,000 | |||||||
Vacation
Accrual |
10,000 | 10,000 | |||||||||
Net Operating
Loss Carryforward |
1,079,000 | 780,000 | |||||||||
Current Deferred Tax Asset |
$ | 1,099,000 | $ | 800,000 | |||||||
Deferred Tax
Asset (Liability) — Long-Term: |
|||||||||||
Net Operating
Loss Carryforward |
$ | 6,232,000 | $ | 6,232,000 | |||||||
Capitalized
Software |
(1,818,000 | ) | (2,322,000 | ) | |||||||
Depreciation
and Amortization |
59,000 | 64,000 | |||||||||
Valuation
Allowance |
(2,304,500 | ) | (1,506,500 | ) | |||||||
Long-Term Deferred Tax Asset |
$ | 2,168,500 | $ | 2,467,500 | |||||||
The net change during 2011 in the total valuation allowance
was $2,078,750.
We adjusted our Deferred Tax Asset Valuation Allowance as
of December 31, 2010 by decreasing the allowance by $800,000. This amount represents the tax benefit, which is based upon anticipated profitability
that we have determined to be more likely than not to be realized in future periods. The net change during 2010 in the total valuation allowance was
$2,156,750.
At December 31, 2011, we had approximately $9,000,000 of
federal net operating tax loss carryforwards expiring at various dates through 2026. The Tax Reform Act of 1986 enacted a complex set of rules which
limits a company’s ability to utilize net operating loss carryforwards and tax credit carryforwards in periods following an ownership change.
These rules define an ownership change as a greater than 50 percent point change in stock ownership within a defined testing period which is generally
a three-year period. As a result of stock which may be issued by us from time to time, and the conversion of outstanding warrants, or the result of
other changes in ownership of our outstanding stock, we may experience an ownership change and consequently our utilization of net operating loss
carryforwards could be significantly limited.
[6] Note Payable
In connection with the
acquisition of MSBS (see Note 3), the Company issued a $600,000, 5% note payable. The note was to be paid in $100,000 quarterly installments, with the
final payment made in 2011.
F-17
COVER-ALL TECHNOLOGIES INC. AND SUBSIDIARY
NOTES TO CONSOLIDATED FINANCIAL STATEMENTS, Sheet #10
NOTES TO CONSOLIDATED FINANCIAL STATEMENTS, Sheet #10
[7] Stock-Based Compensation
Stock Options
In June 2005, we adopted the 2005 Stock Incentive Plan
(which was amended in 2006 and in 2008). Options and stock awards for the purchase of up to 5,000,000 shares may be granted by the Board of Directors
to our employees and consultants at an exercise or grant price determined by the Board of Directors on the date of grant. Options may be granted as
incentive or nonqualified stock options with a term of not more than ten years. The 2005 Plan allows the Board of Directors to grant restricted or
unrestricted stock awards or awards denominated in stock equivalent units, securities or debentures convertible into common stock, or any combination
of the foregoing and may be paid in common stock or other securities, in cash, or in a combination of common stock or other securities and cash. At
December 31, 2011 and 2010, an aggregate of 2,195,179 and 2,238,037 shares, respectively, were available for grant under the 2005 Stock Incentive
Plan.
The Company uses the Black-Scholes-Merton option-pricing
model (“Black-Scholes”) to measure fair value of the share-based awards. The Black-Scholes model requires us to make significant judgments
regarding the assumptions used within the model, the most significant of which are the expected stock price volatility, the expected life of the option
award, the risk-free interest rate of return and dividends during the expected term.
- Expected volatilities are based on historical volatility
of the Company’s stock during the preceding periods. The Company uses “Level 1” inputs, which are our trading market values in active
markets.
- The Company uses historical data to estimate expected
life of the option award. The expected term of options granted is derived from the output of the option valuation model and represents the period of
time that options granted are expected to be outstanding.
- The risk-free interest rate for periods within the
contractual life of the option is based on the U.S. Treasury yield curve in effect at the time of grant.
- The Company does not anticipate issuance of dividends
during the expected term.
| 2011 |
2010 |
|||||||||
|---|---|---|---|---|---|---|---|---|---|---|
Expected
volatility |
41% – 50 | % | 45% – 50 | % | ||||||
Weighted-average volatility |
41 | % | 47 | % | ||||||
Expected
dividends |
0 | % | 0 | % | ||||||
Expected term
(in years) |
3 – 5 | 3 – 5 | ||||||||
Risk-free
interest rate |
3 | % | 3 | % | ||||||
As of December 31, 2011, there was approximately $294,000
of total unrecognized compensation cost related to nonvested share-based compensation arrangements granted by the Company. That cost is expected to be
recognized over a weighted-average period of 1.4 years.
F-18
COVER-ALL TECHNOLOGIES INC. AND SUBSIDIARY
NOTES TO CONSOLIDATED FINANCIAL STATEMENTS, Sheet #11
NOTES TO CONSOLIDATED FINANCIAL STATEMENTS, Sheet #11
[7] Stock-Based Compensation
[Continued]
A summary of the changes in outstanding common stock
options for all outstanding plans is as follows:
| Shares |
Exercise Price Per Share |
Weighted-Average Remaining Contractual Life |
Weighted-Average Exercise Price |
|||||||||||||||
|---|---|---|---|---|---|---|---|---|---|---|---|---|---|---|---|---|---|---|
Balance,
January 1, 2009 |
1,497,463 | $ | 0.36 – 1.40 | 3.4 Years |
$ | .92 | ||||||||||||
Granted |
360,000 | 1.00 – 1.05 | 4.2 Years |
1.01 | ||||||||||||||
Exercised |
(55,000 | ) | 0.61 – 1.16 | .66 | ||||||||||||||
Canceled |
— | — | — | |||||||||||||||
Expired |
— | — | — | |||||||||||||||
Balance,
December 31, 2009 |
1,802,463 | $ | 0.36 – 1.40 | 2.8 Years |
$ | .95 | ||||||||||||
Granted |
567,500 | 1.12 – 1.55 | 4.3 Years |
1.40 | ||||||||||||||
Exercised |
(10,000 | ) | 1.05 – 1.05 | 1.05 | ||||||||||||||
Canceled |
(75,000 | ) | 1.25 | 1.25 | ||||||||||||||
Expired |
— | — | — | |||||||||||||||
Balance,
December 31, 2010 |
2,284,963 | $ | 0.36 – 1.55 | 2.3 Years |
$ | 1.05 | ||||||||||||
Granted |
— | — | — |
— | ||||||||||||||
Exercised |
(720,000 | ) | .36 – .79 | .62 | ||||||||||||||
Canceled |
(40,000 | ) | 1.50 – 1.55 | 1.54 | ||||||||||||||
Expired |
— | — | — | |||||||||||||||
Balance,
December 31, 2011 |
1,524,963 | $ | 0.85 – 1.55 | 2.0 Years |
$ | 1.21 | ||||||||||||
The options granted during 2011 are distributed as follows,
relative to the difference between the exercise price and the stock price at grant date:
| Number Granted |
Weighted-Average Exercise Price |
Weighted-Average Fair Value |
||||||||||||
|---|---|---|---|---|---|---|---|---|---|---|---|---|---|---|
Exercise
Price at Stock Price |
— | $ | — | $ | — | |||||||||
The options granted during 2010 are distributed as
follows:
| Number Granted |
Weighted-Average Exercise Price |
Weighted-Average Fair Value |
||||||||||||
|---|---|---|---|---|---|---|---|---|---|---|---|---|---|---|
Exercise
Price at Stock Price |
567,500 | $ | 1.40 | $ | .60 | |||||||||
The options granted during 2009 are distributed as
follows:
| Number Granted |
Weighted-Average Exercise Price |
Weighted-Average Fair Value |
||||||||||||
|---|---|---|---|---|---|---|---|---|---|---|---|---|---|---|
Exercise
Price at Stock Price |
360,000 | $ | 1.01 | $ | .66 | |||||||||
F-19
COVER-ALL TECHNOLOGIES INC. AND SUBSIDIARY
NOTES TO CONSOLIDATED FINANCIAL STATEMENTS, Sheet #12
NOTES TO CONSOLIDATED FINANCIAL STATEMENTS, Sheet #12
[7] Stock-Based Compensation
[Continued]
Exercisable options at December 31, 2011, 2010 and 2009
were as follows:
| December 31, |
Number of Exercisable Options |
Weighted-Average Exercise Price |
||||||||
|---|---|---|---|---|---|---|---|---|---|---|
2011 |
830,963 |
$1.20 |
||||||||
2010 |
1,385,963 |
$ .92 |
||||||||
2009 |
1,145,463 |
$ .86 |
||||||||
The following table summarizes information about stock
options at December 31, 2011:
| Outstanding Stock Options |
Exercisable Stock Options |
||||||||||||||||||||||
|---|---|---|---|---|---|---|---|---|---|---|---|---|---|---|---|---|---|---|---|---|---|---|---|
| Range of Exercise Prices |
Shares |
Weighted-Average Remaining Contractual Life |
Weighted-Average Exercise Price |
Shares |
Weighted-Average Exercise Price |
||||||||||||||||||
| $.85 – $1.05 | 625,000 | 1.9 Years | $ | .94 | 308,500 | $ | .95 | ||||||||||||||||
| $1.12 – $1.55 | 899,963 | 1.2 Years | $ | 1.40 | 522,463 | $ | 1.36 | ||||||||||||||||
| 1,524,963 | 2.0 Years | $ | 1.21 | 830,963 | $ | 1.20 | |||||||||||||||||
Warrants - There were -0- warrants outstanding at
December 31, 2011.
A summary of the changes in outstanding warrants is as
follows:
| Outstanding and Exercisable Warrants |
Exercise Price Per Warrant |
Weighted-Average Remaining Contractual Life |
Weighted-Average Exercise Price |
|||||||||||||||
|---|---|---|---|---|---|---|---|---|---|---|---|---|---|---|---|---|---|---|
Balance,
December 31, 2009 |
100,000 | $ | .35 | 1.11 Years |
$ | .35 | ||||||||||||
Balance,
December 31, 2010 |
100,000 | $ | .35 | .11 Years |
$ | .35 | ||||||||||||
Exercised |
(100,000 | ) | .35 | .35 | ||||||||||||||
Balance,
December 31, 2011 |
— | $ | — | |||||||||||||||
Exercisable Warrants at December 31, 2011, 2010 and 2009
were as follows:
| December 31, |
Number of Exercisable Warrants |
Weighted-Average Exercise Price |
||||||||
|---|---|---|---|---|---|---|---|---|---|---|
2011 |
— |
$ — |
||||||||
2010 |
100,000 |
$.35 |
||||||||
2009 |
100,000 |
$.35 |
||||||||
F-20
COVER-ALL TECHNOLOGIES INC. AND SUBSIDIARY
NOTES TO CONSOLIDATED FINANCIAL STATEMENTS, Sheet #13
NOTES TO CONSOLIDATED FINANCIAL STATEMENTS, Sheet #13
[7] Stock-Based Compensation [Continued]
Time-Based Restricted Stock Units - In 2011, 2010
and 2009, we granted 42,858, 387,000 and -0-, respectively, time-based RSUs vesting through June 2, 2013.
A summary of our time-based RSUs for the years ended
December 31, 2011, 2010 and 2009 are as follows:
| Shares |
Weighted-Average Grant Date Fair Value |
|||||||||
|---|---|---|---|---|---|---|---|---|---|---|
Balance,
January 1, 2009 |
382,500 | $ | 1.24 | |||||||
Granted |
— | — | ||||||||
Vested |
(150,000 | ) | — | |||||||
Forfeited or
Expired |
(17,500 | ) | — | |||||||
Balance, December 31, 2009 |
215,000 | $ | 1.13 | |||||||
Granted |
387,000 | $ | 1.38 | |||||||
Vested |
(107,500 | ) | — | |||||||
Forfeited or
Expired |
(25,000 | ) | — | |||||||
Balance, December 31, 2010 |
469,500 | $ | 1.28 | |||||||
Granted |
42,858 | $ | 2.03 | |||||||
Vested |
(207,858 | ) | — | |||||||
Forfeited or
Expired |
(52,000 | ) | — | |||||||
Balance, December 31, 2011 |
252,500 | $ | 1.42 | |||||||
The Black-Scholes option valuation model was developed for
use in estimating the fair value of traded options which have no vesting restrictions and are fully transferable. In addition, option valuation models
require the input of highly subjective assumptions including the expected stock price volatility. Because our employee stock options have
characteristics significantly different from those of traded options, and because changes in the subjective input assumptions can materially affect the
fair value estimate, in management’s opinion, the existing models do not necessarily provide a reliable single measure of the fair value of our
employee stock options.
We follow ASC 718, Accounting for Stock Options and
Other Stock-Based Compensation. Among other items, ASC 718 requires companies to record compensation expense for share-based awards issued to
employees and directors in exchange for services provided. The amount of the compensation expense is based on the estimated fair value of the awards on
their grant dates and is recognized over the required service periods. Our share-based awards include stock options and restricted stock awards. For
restricted stock awards, the calculation of compensation expense under ASC 718 is based on the intrinsic value of the grant.
F-21
COVER-ALL TECHNOLOGIES INC. AND SUBSIDIARY
NOTES TO CONSOLIDATED FINANCIAL STATEMENTS, Sheet #14
NOTES TO CONSOLIDATED FINANCIAL STATEMENTS, Sheet #14
[7] Stock-Based Compensation
[Continued]
For the year ended December 31, 2011, we recognized
$392,691 of stock-based compensation expense in our consolidated financial statements. For the year ended December 31, 2010, we recognized $518,839 of
stock-based compensation expense in our consolidated financial statements. For the year ended December 31, 2009, we recognized $409,762 of stock-based
compensation expense in our consolidated financial statements.
[8] Basic Earnings Per Share
Disclosures
The following is a reconciliation of the numerators and
denominators of the basic and diluted earnings per share (“EPS”) computations:
| 2011 |
2010 |
2009 |
||||||||||||
|---|---|---|---|---|---|---|---|---|---|---|---|---|---|---|
Numerator: |
||||||||||||||
Net
Income |
$ | 1,184,766 | $ | 2,951,786 | $ | 3,916,906 | ||||||||
Numerator for Diluted Earnings Per Common Share |
$ | 1,184,766 | $ | 2,951,786 | $ | 3,916,906 | ||||||||
Denominator: |
||||||||||||||
Weighted
Average Number of Common Shares |
||||||||||||||
Outstanding
for Basic Earnings Per Common Share |
25,324,000 | 24,828,000 | 24,591,000 | |||||||||||
Effect of
Dilutive Securities: |
||||||||||||||
Exercise of
Options and Restricted Stock |
678,000 | 687,000 | 398,000 | |||||||||||
Exercise of
Warrants |
— | 75,000 | 68,000 | |||||||||||
Denominator for Diluted Earnings Per Common Share |
26,002,000 | 25,590,000 | 25,057,000 | |||||||||||
Basic Earnings Per Common Share |
$ | .05 | $ | .12 | $ | .16 | ||||||||
Diluted Earnings Per Common Share |
$ | .05 | $ | .12 | $ | .16 | ||||||||
Equity instruments that may dilute earnings per share in
the future are listed in Note 5. We use the treasury stock method to compute diluted earnings per share, whereby the proceeds from the exercise of
dilutive instruments are hypothetically used to repurchase outstanding shares at market prices.
Options to purchase an aggregate of 342,500 shares of
common stock and restricted stock of 229,500 shares ranging from $1.50 to $1.55 per share were outstanding at December 31, 2010, but were not included
in the computation of diluted EPS because the options’ exercise prices were greater than the average market price of the common
shares.
Options to purchase an aggregate of 554,963 shares of
common stock at prices ranging from $1.38 to $1.40 per share were outstanding at December 31, 2009, but were not included in the computation of diluted
EPS because the options’ exercise prices were greater than the average market price of the common shares.
F-22
COVER-ALL TECHNOLOGIES INC. AND SUBSIDIARY
NOTES TO CONSOLIDATED FINANCIAL STATEMENTS, Sheet #15
NOTES TO CONSOLIDATED FINANCIAL STATEMENTS, Sheet #15
[9] Supplemental Data
Accrued liabilities consist of the
following:
| Years ended December 31, |
|||||||||||
|---|---|---|---|---|---|---|---|---|---|---|---|
| 2011 |
2010 |
||||||||||
Accrued
Bonuses, Payroll, Commissions, Benefits, Temporary Help and Consulting |
$ | 354,249 | $ | 1,080,402 | |||||||
Accrued
Professional Fees |
327,600 | 227,900 | |||||||||
Other |
72,039 | 55,404 | |||||||||
Totals |
$ | 753,888 | $ | 1,363,706 | |||||||
[10] 401(k) Plan
Upon date of hire, employees are eligible to participate in
our Tax Saver 401(k) Salary Reduction Plan. Employees can save a percentage of pay on a pre-tax basis to an annual maximum of $22,000 for the year
ended December 31, 2011. We match $.50 for each $1.00 of the first 5% of pay employees elect to defer. Expenses associated with this plan in 2011, 2010
and 2009 were approximately $147,358, $127,228 and $81,274, respectively.
[11] Stockholders’ Equity
In December 2011, the Board of Directors authorized a share
buyback plan of up to 1,000,000 shares of the Company’s common stock.
In February 2009, we announced that our Board of Directors
declared a special cash dividend in the amount of $0.03 per share on our common stock. This dividend was paid on April 7, 2009 to common stockholders
of record as of the close of business on March 27, 2009. The Company also announced that, in light of their decision to declare a special cash
dividend, the Board of Directors had determined that the Company would suspend its common stock buyback plan until further notice.
On June 25, 2008, John Roblin, our Chairman and Chief
Executive Officer, and certain other investors elected to convert all of the unpaid principal amount due on convertible debentures in their possession,
totaling $262,265, into an aggregate of 874,217 shares of our common stock at the conversion price of $0.30 per share. We made an aggregate of $10,000
of interest payments on the debentures during 2008.
In June 2008, the Board of Directors authorized a share
buyback plan of up to 1,000,000 shares of the Company’s Common Stock.
In 2008, we purchased an aggregate of 201,870 shares of
treasury stock on the open market at an average purchase price of $0.82 per share for a total purchase price of approximately
$164,894.
F-23
COVER-ALL TECHNOLOGIES INC. AND SUBSIDIARY
NOTES TO CONSOLIDATED FINANCIAL STATEMENTS, Sheet #16
NOTES TO CONSOLIDATED FINANCIAL STATEMENTS, Sheet #16
[12] Fair Value of Financial
Instruments
ASC 825, Disclosures about Fair Value of Financial
Instruments, defines the fair value of a financial instrument as the amount at which the instrument could be exchanged in a current transaction
between willing parties. In assessing the fair value of our cash and cash equivalents, trade receivables and accounts payables and accrued expenses,
management concluded that the carrying amount of these financial instruments approximates fair value because of their short
maturities.
[13] Major Customers
For the year ended December 31, 2011, sales to three
customers amounted to approximately 19%, 13% and 11% of revenues, respectively.
For the year ended December 31, 2010, sales to four
customers amounted to approximately 19%, 11%, 11% and 10% of revenues, respectively.
For the year ended December 31, 2009, sales to three
customers amounted to approximately 15%, 15% and 12% of revenues, respectively.
All of the major customers referred to above, other than
the two customers in 2011 with 19% and 13%, three customers in 2010, with 19%, 11% and 10% of revenues, and one customer in 2009 with 15% of revenues,
are units of CHARTIS, Inc., formerly associated with American International Group, Inc.
. . . . . . . . . .
F-24
COVER-ALL TECHNOLOGIES INC. AND SUBSIDIARY
SCHEDULE II—VALUATION AND QUALIFYING ACCOUNTS
| Balance at Beginning of Period |
Additions |
Deductions |
Balance at End of Period |
|||||||||||||||
|---|---|---|---|---|---|---|---|---|---|---|---|---|---|---|---|---|---|---|
Accumulated
amortization of capitalized software and software license: |
||||||||||||||||||
Year Ended
December 31, 2011 |
$ | 12,584,710 | $ | 1,549,314 | $ | — | $ | 14,134,024 | ||||||||||
Year Ended
December 31, 2010 |
$ | 11,966,365 | $ | 618,345 | $ | — | $ | 12,584,710 | ||||||||||
Year Ended
December 31, 2009 |
$ | 11,049,157 | $ | 917,208 | $ | — | $ | 11,966,365 | ||||||||||
Accumulated
amortization of Customer lists/relationship: |
||||||||||||||||||
Year Ended
December 31, 2011 |
$ | 52,759 | $ | 73,334 | $ | — | $ | 126,093 | ||||||||||
Year Ended
December 31, 2010 |
$ | — | $ | 52,759 | $ | — | $ | 52,759 | ||||||||||
Year Ended
December 31, 2009 |
$ | — | $ | — | $ | — | $ | — | ||||||||||
Accumulated
amortization of non-compete agreements: |
||||||||||||||||||
Year Ended
December 31, 2011 |
$ | 46,044 | $ | 64,000 | $ | — | $ | 110,0444 | ||||||||||
Year Ended
December 31, 2010 |
$ | — | $ | 46,044 | $ | — | $ | 46,044 | ||||||||||
Year Ended
December 31, 2009 |
$ | — | $ | — | $ | — | $ | — | ||||||||||
Allowance for
Doubtful Accounts: |
||||||||||||||||||
Year Ended
December 31, 2011 |
$ | 25,000 | $ | — | $ | — | $ | 25,000 | ||||||||||
Year Ended
December 31, 2010 |
$ | 25,000 | $ | — | $ | — | $ | 25,000 | ||||||||||
Year Ended
December 31, 2009 |
$ | 25,000 | $ | — | $ | — | $ | 25,000 | ||||||||||
F-25
SIGNATURES
Pursuant to the requirements of
Section 13 or 15(d) of the Securities Exchange Act of 1934, the Registrant has duly caused this annual report on Form 10-K to be signed on its behalf
by the undersigned, thereunto duly authorized.
COVER-ALL TECHNOLOGIES INC. |
||||||
Date: March 30,
2012 |
By: /s/ John W. Roblin John W. Roblin Chairman of the Board of Directors and Chief Executive Officer |
|||||
Pursuant to the requirements of
the Securities Exchange Act of 1934, this annual report on Form 10-K has been signed below by the following persons on behalf of the Registrant and in
the capacities and on the dates indicated.
| Signatures |
Title |
Date |
||||||||
|---|---|---|---|---|---|---|---|---|---|---|
/s/ John W.
Roblin John W. Roblin |
Chairman of the Board and Chief Executive Officer (Principal Executive Officer) |
March
30, 2012 |
||||||||
/s/ Ann F.
Massey Ann F. Massey |
Chief
Financial Officer, Controller and Secretary (Principal Financial Officer and Principal Accounting Officer) |
March
30, 2012 |
||||||||
/s/ Manish D.
Shah Manish D. Shah |
Director, President and Chief Technology Officer |
March
30, 2012 |
||||||||
/s/ Russell
Cleveland Russell Cleveland |
Director |
March
30, 2012 |
||||||||
/s/ Earl
Gallegos Earl Gallegos |
Director |
March
30, 2012 |
||||||||
/s/ Stephen M.
Mulready Stephen M. Mulready |
Director |
March
30, 2012 |
||||||||
EXHIBIT INDEX
The following is a list of
exhibits required by Item 601 of Regulation S-K filed as part of this Form 10-K. For exhibits incorporated by reference, the location of the exhibit in
the previous filing is indicated in parentheses.
| Exhibit No. |
Description |
|||||
|---|---|---|---|---|---|---|
2 |
Certificate of Merger of the Company Computer Systems, Inc. (a New York corporation) into the Registrant, filed on June 11, 1985 [incorporated
by reference to Exhibit 2 to the Registrant’s Annual Report on Form 10-K (Commission File No. 0-13124) filed on January 29,
1986]. |
|||||
3(a) |
Certificate of Incorporation of the Registrant filed on April 22, 1985 [incorporated by reference to Exhibit 3 (a) to the Registrant’s
Annual Report on Form 10-K (Commission File No. 0-13124) filed on January 29, 1986]. |
|||||
3(b) |
Certificate of Amendment of Certificate of Incorporation of the Registrant filed on May 6, 1987 [incorporated by reference to Exhibit 3.2 to
the Registrant’s Registration Statement on Form S-1 (Commission File No. 33-17533) filed on September 29, 1987]. |
|||||
3(c) |
Certificate of Amendment of Certificate of Incorporation of the Registrant filed on March 26, 1990 [incorporated by reference to Exhibit 3(d)
to the Registrant’s Quarterly Report on Form 10-Q (Commission File No. 0-13124) filed on June 14, 1990]. |
|||||
3(d) |
Certificate of Amendment of Certificate of Incorporation of the Registrant filed on March 18, 1992 [incorporated by reference to Exhibit 1 to
the Registrant’s Current Report on Form 8-K (Commission File No. 0-13124) filed on March 30, 1992]. |
|||||
3(e) |
Certificate of Amendment of Certificate of Incorporation of the Registrant [incorporated by reference to Exhibit 3(e) to the Registrant’s
Amendment No. 1 to Registration Statement on Form S-3 (Commission File No. 0-13124) filed on July 10, 1996]. |
|||||
3(f) |
Certificate of Amendment of Certificate of Incorporation of the Registrant filed on July 12, 2000 [incorporated by reference to Exhibit 3(g)
to the Registrant’s Quarterly Report on Form 10-Q (Commission File No. 0-13124) filed on August 11, 2000]. |
|||||
3(g) |
By-laws of the Registrant, as amended [incorporated by reference to Exhibit 3(g) to the Registrant’s Amendment No. 1 to Registration
Statement on Form S-3 (Commission File No. 0-13124) filed on July 10, 1996]. |
|||||
4 |
Form
of Common Stock Certificate of the Registrant [incorporated by reference to Exhibit 4(a) to the Registrant’s Annual Report on Form 10-K
(Commission File No. 0-13124) filed on January 29, 1986]. |
|||||
4(b) |
Non-Negotiable Subordinated Promissory Note, dated April 12, 2010, in the principal amount of $600,000 for the benefit of Moore Stephens
Business Solutions, LLC [incorporated by reference to Exhibit 4(b) to the Registrant’s Post-Effective Amendment No. 1 to Form S-1 (Commission File
No. 333-156397) filed on May 7, 2010]. |
|||||
10(a) |
Warner Insurance Services, Inc. Tax Saver 401(k) Salary Reduction Plan adopted May 31, 1985 and restated as of August 11, 1992 [incorporated
by reference to Exhibit 10(k) to the Registrant’s Annual Report on Form 10-K (Commission File No. 0-13124) filed on January 28,
1993]. |
|||||
10(c)(14)† |
Form
of Non-Qualified Stock Option Agreement [incorporated by reference to Exhibit 10(c)(14) the Registrant’s Quarterly Report on Form 10-Q (Commission
File No. 0-13124) filed on May 15, 2006]. |
|||||
10(c)(15)† |
Form
of Incentive Stock Option Agreement [incorporated by reference to Exhibit 10(c)(15) the Registrant’s Quarterly Report on Form 10-Q (Commission
File No. 0-13124) filed on May 15, 2006]. |
|||||
10(c)(16)† |
Form
of Restricted Stock Grant Agreement [incorporated by reference to Exhibit 10(c)(16) the Registrant’s Quarterly Report on Form 10-Q (Commission
File No. 0-13124) filed on May 15, 2006]. |
|||||
10(c)(17)† |
Form
of Non-Qualified Stock Option Agreement (for Consultants) [incorporated by reference to Exhibit 10 (c)(13) the Registrant’s Quarterly Report on
Form 10-Q (Commission File No. 0-13124) filed on May 15, 2006]. |
|||||
| Exhibit No. |
Description | |||||
|---|---|---|---|---|---|---|
10(c)(18)† |
Cover-All Technologies, Inc. Amended and Restated 2005 Stock Incentive Plan [incorporated by reference to Exhibit 10(c)(18) to the
Registrant’s Form 8-K (Commission File No. 0-13124) filed on March 27, 2008]. |
|||||
10(c)(20)† |
Summary of 2010 Non-Employee Director Compensation dated March 12, 2010 [incorporated by reference to Exhibit 10(c)(20) to the
Registrant’s Form 8-K (Commission File No. 0-13124) filed on March 16, 2010]. |
|||||
10(c)(21)† |
Amendment No. 1 to the Cover-All Technologies Inc. Amended and Restated 2005 Stock Incentive Plan [incorporated by reference to Exhibit
10(c)(21) to the Registrant’s Form 8-K (Commission File No. 0-13124) filed on January 3, 2011]. |
|||||
10(c)(22)† |
Summary of 2011 Non-Employee Director Compensation, dated March 16, 2011 [incorporated by reference to Exhibit 99.1 to the Registrant’s
Form 8-K (Commission File No. 0-13124) filed on March 17, 2011]. |
|||||
10(c)(23)† |
Summary of Amended 2011 Non-Employee Director Compensation, dated August 10, 2011 [incorporated by reference to Exhibit 99.2 to the
Registrant’s Form 8-K (Commission File No. 1-09228) filed on August 11, 2011]. |
|||||
10(c)(24)† |
Summary of 2012 Non-Employee Director Compensation, dated February 21, 2012 [incorporated by reference to Exhibit 99.1 to the
Registrant’s Form 8-K (Commission File No. 1-09228) filed on February 24, 2012]. |
|||||
10(d)(1) |
Lease
Agreement, dated March 3, 2005, by and between the Registrant and Fairfield 80 Venture, LLC [incorporated by reference to Exhibit 10(d)(4) to the
Registrant’s Annual Report on Form 10-K (Commission File No. 0-13124) filed on March 25, 2005]. |
|||||
10(d)(2) |
Agreement of Lease, dated December 11, 2008, by and between Moore Stephens Business Solutions, LLC and Green 317 Madison, LLC [incorporated by
reference to Exhibit 10(d)(2) to the Registrant’s Annual Report on Form 10-K (Commission File No. 0-13124) filed on March 24,
2011]. |
|||||
10(e)(9)† |
Employment Agreement, dated December 30, 2011, by and between the Registrant and John Roblin [incorporated by reference to Exhibit 10(e)(9) to
the Registrant’s Form 8-K (Commission File No. 1-09228) filed on January 6, 2012]. |
|||||
10(e)(10)† |
Employment Agreement, dated March 7, 2012, by and between the Registrant and Manish D. Shah [incorporated by reference to Exhibit 10(e)(10) to
the Registrant’s Form 8-K (Commission File No. 1- 09228) filed on March 12, 2012]. |
|||||
10(j)(i) |
Asset
Purchase Agreement, dated January 22, 2007, between the Registrant and Maloy Risk Services, Inc. [incorporated by reference to Exhibit 10(j)(i) to the
Registrant’s Form 8-K (Commission File No. 0-13124) filed on January 26, 2007]. |
|||||
10(j)(ii) |
Commission Agreement, dated January 22, 2007, between the Registrant and Maloy Risk Services, Inc. [incorporated by reference to Exhibit
10(j)(ii) to the Registrant’s Form 8-K (Commission File No. 0-13124) filed on January 26, 2007]. |
|||||
10(k) |
Client Services Addendum, effective as of January 1, 2005, between the Registrant and AIG [incorporated by reference to Exhibit 10(k) to the
Registrant’s Registration Statement on Form S-1/A (Commission File No. 333-156397) filed on August 6, 2009].** |
|||||
10(l)(1) |
Asset
Purchase Agreement, dated April 12, 2010, among the Registrant, Hays & Company LLP, Moore Stephens Consulting Limited and The Rachlin Group
[incorporated by reference to Exhibit 10(l)(1) to the Registrant’s Post-Effective Amendment No. 1 to Form S-1 (Commission File No. 333-156397)
filed on May 7, 2010]. |
|||||
10(l)(2) |
Mutual Non-Competition Agreement, dated April 12, 2010, between the Registrant and Moore Stephens Consulting Limited [incorporated by
reference to Exhibit 10(l)(2) to the Registrant’s Post-Effective Amendment No. 1 to Form S-1 (Commission File No. 333-156397) filed on May 7,
2010]. |
|||||
10(m)† |
Employment Agreement, dated April 12, 2010, by and between the Registrant and Seth Rachlin [incorporated by reference to Exhibit 10(m) to the
Registrant’s Post-Effective Amendment No. 1 to Form S-1 (Commission File No. 333-156397) filed on May 7, 2010]. |
|||||
| Exhibit No. |
Description | |||||
|---|---|---|---|---|---|---|
10(n)(1) |
Asset
Purchase Agreement, dated December 30, 2011, between Cover-All Systems, Inc. and Ho’ike Services, Inc., dba BlueWave Technology [incorporated by
reference to Exhibit 10(n)(1) to the Registrant’s Form 8-K (Commission File No. 1-09228) filed on January 6, 2012]. |
|||||
14 |
Code
of Ethics and Business Conduct [incorporated by reference to Exhibit 14 to the Registrant’s Annual Report on Form 10-K (Commission File No.
0-13124) filed on March 31, 2006]. |
|||||
21 |
Subsidiaries of the Registrant [incorporated by reference to Exhibit 21 to the Registrant’s Annual Report on Form 10-K (Commission File
No. 0-13124) filed on April 11, 1996]. |
|||||
23.1* |
Consent of MSPC. |
|||||
31.1* |
Certification of Chief Executive Officer pursuant to Securities Exchange Act Rules 13a-14(a) and 15d-14(a), as adopted pursuant to Section 302
of the Sarbanes-Oxley Act of 2002. |
|||||
31.2* |
Certification of Chief Financial Officer pursuant to Securities Exchange Act Rules 13a-14(a) and 15d-14(a), as adopted pursuant to Section 302
of the Sarbanes-Oxley Act of 2002. |
|||||
32.1* |
Certification of Chief Executive Officer pursuant to 18 U.S.C. Section 1350, as adopted pursuant to Section 906 of the Sarbanes-Oxley Act of
2002. |
|||||
32.2* |
Certification of Chief Financial Officer pursuant to 18 U.S.C. Section 1350, as adopted pursuant to Section 906 of the Sarbanes-Oxley Act of
2002. |
|||||
101.1*** |
The
following materials from the Registrant’s Annual Report on Form 10-K for the year ended December 31, 2011 formatted in Extensible Business
Reporting Language (XBRL): (i) the Consolidated Balance Sheets, (ii) the Consolidated Statements of Operations, (iii) the Consolidated Statements of
Changes in Stockholders’ Equity, (iv) the Consolidated Statements of Cash Flows, and (v) the related Notes to Consolidated Financial
Statements. |
|||||
* |
Filed herewith. |
** |
Confidential treatment has been requested for certain provisions of this Exhibit pursuant to Rule 24b-2 under the Exchange Act. |
*** |
Furnished herewith. Pursuant to Rule 406T of Regulation S-T, the Interactive Data Files in Exhibit 101.1 hereto are not to be deemed “filed” or part of a registration statement or prospectus for purposes of Sections 11 or 12 of the Securities Act of 1933, and are not to be deemed “filed” for purposes of Section 18 of the Exchange Act, and otherwise are not subject to liability under those sections, except as shall be expressly set forth by specific reference in such filing. |
† |
Denotes a management contract or compensatory plan or arrangement. |