Attached files
| file | filename |
|---|---|
| EXCEL - IDEA: XBRL DOCUMENT - CRAILAR TECHNOLOGIES INC | Financial_Report.xls |
| EX-23.1 - AUDITOR CONSENT LETTER - CRAILAR TECHNOLOGIES INC | exhibit23-1.htm |
| EX-31.1 - CERTIFICATION OF CHIEF EXECUTIVE OFFICER - CRAILAR TECHNOLOGIES INC | exhibit31-1.htm |
| EX-31.2 - CERTIFICATION OF CHIEF FINANCIAL OFFICER - CRAILAR TECHNOLOGIES INC | exhibit31-2.htm |
| EX-32.1 - SECTION 906 CERTIFICATIONS - CRAILAR TECHNOLOGIES INC | exhibit32-1.htm |
UNITED STATES
SECURITIES AND EXCHANGE COMMISSION
Washington, D.C.
20549
FORM 10-K
Mark One
[X] ANNUAL REPORT PURSUANT TO SECTION 13 OR 15(d) OF THE SECURITIES EXCHANGE ACT OF 1934
For the fiscal year ended December 31, 2011
[ ] TRANSITION REPORT PURSUANT TO SECTION 13 OR 15(d) OF THE SECURITIES EXCHANGE ACT OF 1934
For the transition period from _______ to _______
Commission File No.:000-50367
NATURALLY ADVANCED TECHNOLOGIES
INC.
(Exact name of registrant in its charter)
| British Columbia | 98-0359306 |
| (State or other jurisdiction of incorporation | (I.R.S. Employer Identification No.) |
| or organization) |
Suite 305, 4420 Chatterton Way, Victoria, British
Columbia, Canada V8X 5J2
(Address of principal executive
offices)
(250) 658-8582
(Registrant’s telephone
number)
Securities registered pursuant to Section 12(b) of the Act:
| Title of each class: | Name of each exchange on which registered: |
| None | N/A |
Securities registered pursuant to Section 12(g) of the
Act:
Common Stock, without par value
(Title of Class)
Indicate by checkmark if registrant is a well-known seasoned
issuer, as defined in Rule 405 of the Securities Act.
[ ]
Yes [X] No
Indicate by check mark if the registrant is not required to file
reports pursuant to Section 13 or 15(d) of the Exchange Act.
[ ]
Yes [X] No
Indicate by check mark whether the registrant (i) has filed all
reports required to be filed by Section 13 or 15(d) of the Exchange Act during
the past 12 months (or for such shorter period that the registrant was required to file such reports), and (ii) has been subject to
such filing requirements for the past 90 days.
[X]
Yes [ ] No
1
Indicate by check mark whether the registrant has submitted
electronically and posted on its corporate Web site, if any, every Interactive
Data File required to be submitted and posted pursuant to Rule 405 of Regulation
S-T (§ 232.405 of this chapter) during the preceding 12 months (or for such
shorter period that the registrant was required to submit and post such files).
[X] Yes [ ] No
Indicate by check mark if disclosure of delinquent filers pursuant to Item 405 of Regulation S-K is not contained herein, and will not be contained, to the best of registrant’s knowledge, in definitive proxy or information statements incorporated by reference in Part III of this Form 10-K or any amendment to this Form 10-K. [X]
Indicate by check mark whether the registrant is a large accelerated filer, an accelerated filer, a non-accelerated filer, or a smaller reporting company.
| Large accelerated filer [ ] | Accelerated filer [X] |
| Non-accelerated filer [ ] | Smaller reporting company [ ] |
| (Do not check if smaller reporting company) |
Indicate by checkmark whether the registrant is a shell company
(as defined in Rule 12b-2 of the Exchange Act).
Yes [
] No [X]
The aggregate market value of the voting and non-voting common equity held by non-affiliates computed by reference to the price at which the common equity was sold, or the average bid and asked price of such common equity, as of the last business day of the registrant’s most recently completed second fiscal quarter, was $99,259,000
The registrant had 42,422,804common stock outstanding as of March 15, 2012.
2
TABLE OF CONTENTS
3
Forward-Looking Statements
Statements made in this Form 10-K that are not historical or current facts are “forward-looking statements” made pursuant to the safe harbor provisions of Section 27A of the Securities Act of 1933, as amended (the “Securities Act”) and Section 21E of the Securities Exchange Act of 1934, as amended (the “Exchange Act”). These statements often can be identified by the use of terms such as “may,” “will,” “should,” “expect,” “plan,” “intend,” “anticipate,” “believe,” “estimate,” “predict,” “approximate,” “potential” or “continue,” or the negative of such terms or other comparable terminology. We intend that such forward-looking statements be subject to the safe harbors for such statements. We wish to caution readers not to place undue reliance on any such forward-looking statements, which speak only as of the date made. Any forward-looking statements represent management’s best judgment as to what may occur in the future. However, forward-looking statements are subject to risks, uncertainties and important factors beyond our control that could cause actual results and events to differ materially from historical results of operations and events and those presently anticipated or projected. We disclaim any obligation subsequently to revise any forward-looking statements to reflect events or circumstances after the date of such statement or to reflect the occurrence of anticipated or unanticipated events.
Available Information
We file annual, quarterly, current reports, proxy statements, and other information with the Securities and Exchange Commission (the “SEC”). You may read and copy documents referred to in this Annual Report on Form 10-K that have been filed with the SEC at the SEC’s Public Reference Room, 100 F Street, N.E., Washington, D.C., 20549. You may obtain information on the operation of the Public Reference Room by calling the SEC at 1-800-SEC-0330. You can also obtain copies of our SEC filings by going to the SEC’s website at http://www.sec.gov.
References
As used in this annual report: (i) the terms “we,” “us,” “our,” or the “Company” refer to Naturally Advanced Technologies Inc. and our subsidiaries, unless the context otherwise requires; (ii) “SEC” refers to the Securities and Exchange Commission; (iii) “Securities Act” refers to the United States Securities Act of 1933, as amended; (iv) “Exchange Act” refers to the United States Securities Exchange Act of 1934, as amended; and (v) all dollar amounts refer to United States dollars unless otherwise indicated.
PART I
ITEM 1. BUSINESS
Corporate Structure and Subsidiaries
We were incorporated under the laws of British Columbia, Canada, on October 6, 1998, under the name “Hemptown Clothing Inc.” The current corporate structure is a single public company, incorporated under the Business Corporations Act (British Columbia). On February 22, 2006, our Board of Directors authorized and approved the change in our corporate name to “Naturally Advanced Technologies Inc.” and the subsequent filing of the Amendment with the Registrar of Companies for the Province of British Columbia. This name change to Naturally Advanced Technologies Inc. became effective March 21, 2006, and our trading symbol for our shares of common stock trading on the OTC Bulletin Board was changed to “NADVF:OB”. Our shares of common stock commenced trading under the symbol “NAT.V” on the TSX Venture Exchange (the “TSX-V”) at the opening of market on July 8, 2008.
We were founded in response to the growing demand for environmentally friendly, socially responsible clothing, and we adhere to a “triple bottom line” philosophy, respecting the human rights of employees, the environmental impact of our operations and fiscal responsibility to our shareholders.
4
Our wholly-owned subsidiaries are as follows:
CRAiLAR®Fiber Technologies Inc.
Our wholly owned subsidiary CRAiLAR®Fiber Technologies Inc. (“CRAiLAR®”) was incorporated on April 5, 2005. It was incorporated for the purpose of developing BastFiber Technology for uses in textiles, cellulose pulp, paper, and composites.
HTnaturals Apparel Corp.
HTnaturals Apparel Corp. (“HTnaturals”) was incorporated under the laws of the Province of British Columbia on December 7, 2007, for the purpose of carrying out the natural and sustainable apparel portion of our business. We, through our wholly owned subsidiary HTnaturals, were also a provider of environmentally sustainable hemp, bamboo, organic cotton and soy blended apparel.
During our fiscal year ended December 31, 2009, we discontinued our apparel division in order to focus our resources on our CRAiLAR® technology.
0697872 B.C. Ltd.
Our wholly-owned subsidiary, 0697872 B.C. Ltd., was incorporated under the laws of the Province of British Columbia on June 18, 2004, and held the title to real property located in Craik, Saskatchewan. We decided against proceeding with the intended use of the property and returned all rights to the town of Craik.
Hemptown USA, Inc.
Our wholly-owned subsidiary, Hemptown USA, Inc., was incorporated under the laws of the State of Nevada on November 22, 2004, for factoring purposes so that business dealings could be accomplished daily without currency valuations and fluctuations, as well as to provide an American base inventory control to customers.
Naturally Advanced Technologies US Inc.
Naturally Advanced Technologies US Inc. was incorporated under the laws of the State of Nevada on August 24, 2010, to manage our U.S. business operations. This company was also issued a Certificate of Authorization by the State of South Carolina to transact business on October 21, 2010.
Our principal offices are located at Suite 305, 4420 Chatterton Way, Victoria, British Columbia V8X 5J2, our telephone number is (250) 658-8582, and our web site address is www.naturallyadvanced.com.
5
Business Operations
Naturally Advanced Technologies (NAT) is bringing sustainable bast fiber-based products to market, providing environmentally friendly natural fiber alternatives for a broad range of existing and emerging product applications, with equivalent or superior performance characteristics to cotton, wood or fossil-fuel based competitors. As of the date of this report, our business operations consists primarily of the deployment and execution of our proprietary and natural CRAiLAR® Flax Fibers, as well as our CRAiLEXTM high grade dissolving pulp technology, which are bast fiber processing technologies targeted at the textile, pulping, composite and plastics industries.
Industry Opportunity for CRAiLAR® and CRAiLEXTM
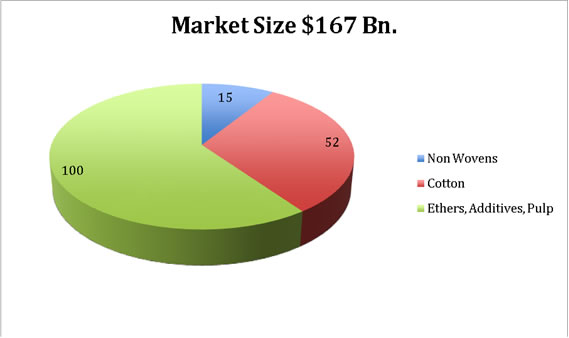
With a projected increase of global population and continued development of market economies, we expect to see a rise in the need for fibers worldwide. Management estimates that global demand for fiber will increase by almost 30million tons in the next ten years. We do not believe that this increased demand can be met by the existing natural fibers market. While some demand is likely to be filled by synthetic fibers, management expects that the desires for consumers to live both sustainably and naturally will outweigh their desire for un-naturally derived products. We believe that the Company has a unique opportunity to fill this shortfall through the production of CRAiLAR® fiber.
CRAiLAR® Fiber processing involves the enzymatic processing of bast fibers, by removing the lignin which binds the fibers together, to produce individual, separated fibers into the equivalent of ginned cotton. The CRAiLAR® Fiber technology has been developed by Dr. Wing Sung and his team at the National Research Council of Canada. Under development since 2004, this technology has undergone successful final demonstration scale testing. The technology involves the use of enzymes to effectively clean and polish the raw bast fiber such as flax and hemp.
6
The CRAiLAR® Fiber enzymatic process is significantly faster than existing methods of bast fiber processing, produces highly consistent results, and is environmentally benign, as compared to the toxic chemical baths employed elsewhere for the processing of bast fibers. The resulting CRAiLAR® Fibers are vastly superior to traditionally processed bast fibers for textile applications, and integrate seamlessly with cotton fibers. Because the CRAiLAR® Fiber enzymatic processing is so effective at cleaning bast fiber, it can be spun on traditional cotton equipment at commercially viable speeds.
The capital costs involved in building a commercial CRAiLAR® Fibers processing facility have been determined to be relatively modest. All of our final products can be processed utilizing existing industry equipment.
CRAiLEX Advanced Materials technology was developed with Alberta Innovates — Technology Futures. The unique pulping process does not require the numerous harsh chemicals or expensive pressurized equipment used in the traditional kraft pulping industry. The result is a superior dissolving pulp from the flax and hemp plants to be used in performance yarns, industrial additives and absorbent pulp and paper products.
Naturally Advanced Technologies holds the exclusive worldwide license to these patented technologies.
CRAiLAR® is a versatile technology which performs well on all bast fiber crops. At the end of April of 2010, we announced that we had successfully spun flax-cotton and help-cotton yarns. We found the CRAiLAR® flax to be of very high quality and ideally suited for fine knit items such as T-shirts. The environmental sustainability of flax is virtually identical to hemp. Differences are that hemp produces more biomass per acre while flax generates a higher percentage of bast fiber. We feel for a wide range of applications and a superior hand-feel that flax is the right crop with which to launch our CRAiLAR® brand.
Flax has the potential to be a zero waste crop. We are already in the process of investigating by-product opportunities that are beneficial to both the consumer and economy (those by-products being seed and shive).
Flax has been used for textile applications for thousands of years and is known as linen when it is processed using traditional mechanical techniques. It is labor intensive, costly to process and has a rougher hand feel than cotton and polyester. In addition, it is prone to wrinkling and high shrinkage if washed in hot water and tumble dried. Traditionally processed flax must also be spun on specialty linen machinery making it unviable for mass production.
Flax is a cost-effective raw material for fiber production. Flax is easy to grow with minimal use of herbicides, and requires only regular rainfall for irrigation, which significantly reduces costs as compared to other natural fibers.
We also enjoy the ability to use the straw of the oilseed flax crop, which is cultivated for food and industrial applications. This straw would normally be discarded and burned following the seed harvest. Making use of this waste byproduct will only further enhance the CRAiLAR® Flax Fiber sustainability rating.
With mill delivered cotton priced between $0.95 to $1.05 per pound, flax is a cost-effective raw material for fiber production. Flax is easy to grow with minimal use of herbicides, pesticides and engineered irrigation that significantly reduces costs as compared to other natural fibers.
The CRAiLAR® Fiber process is a clean, sustainable, environmentally responsible process, which works with bast fiber feed stocks. Bast fiber plants grow abundantly, without excessive water, herbicide, fertilizer and pesticide use. Initially, CRAiLAR® Flax Fibers will be used in union with cotton, which when blended together, results in a much better performing fabric than cotton alone. The resulting fabric (if simply an 80/20 blend) takes on the characteristics of CRAiLAR® Flax Fibers, which are enhanced moisture management and comfort (wicking), durability, superior dye uptake characteristics (a potential minimal dye reduction of 10%), and garment shrinkage reduction (a potential minimum of 50%).
7
Recent Developments
On September 20, 2010, we announced that we have created a sustainable, commercially viable complement to cotton using flax as a raw material. After successfully transforming hemp fibers into yarns and fabrics with the desirable qualities of cotton, we are now engaged in a strategic shift to use flax fibers as the foundation for the next phase of our proprietary CRAiLAR® Fiber technology.
We believe that compared to current cotton prices, flax is a cost-effective raw material for fiber production. The CRAiLAR® process can also be used with the stalk portion of the oilseed flax plant – traditionally cultivated for food and industrial applications – which would normally be discarded during processing. We believe that making use of this byproduct, in addition to processing fiber-variety flax, enhances CRAiLAR®’s sustainability factor.
The all-natural CRAiLAR® process removes the binding agents from flax that contribute to its stiff texture. The process bathes bast fibers in a proprietary enzyme wash that transforms them into soft, yet strong and durable textile fibers, which can be used in both fashion and industrial applications. We believe that fibers made through the CRAiLAR® process have the comfort and breathability of cotton, with the strength, moisture-wicking properties and shrink-resistance of sturdy bast fibers. Our recent trials have shown that flax can be spun on existing machinery to produce a yarn that can be used alone or blended with other fibers.
On January 18, 2011, we announced that we have joined forces with Hanesbrands Inc. and the U.S. Department of Agriculture’s Agricultural Research Service (USDA-ARS) in a cooperative research project designed to cultivate and evaluate the viability of various flax strains for use in CRAiLAR® technology. The project takes place in South Carolina and has an initial term of one year with a renewal option for two additional years.
On March 17, 2011, we announced that we signed a ten-year CRAiLAR® fiber supply agreement with Hanesbrands Inc. to commercialize the Company’s proprietary fibers.
On April 14, 2011, we announced that we had entered into a short term CRAiLAR® Flax fiber development agreement with Levi Strauss & Co. beginning in April 2011 to support evaluation of processing CRAiLAR® flax fiber in woven casual apparel products, specifically denim and non-denim, bottom and top weight fabrics.
In June 2011 the Company entered into a short-term CRAiLAR® Flax fiber development agreement with Cintas Corporation beginning June 2011 to support evaluation of processing CRAiLAR® flax fiber in corporate identity uniform programs.
In June 2011 the Company entered into a joint development agreement with Hercules Incorporated, a subsidiary of Ashland Inc., beginning June 2011 to support evaluation of CRAiLEXTM cellulosic products for multiple products.
On July 14, 2011 the Company entered into an agreement with Carolina Eastern Precision Ag, of Pamplico, S.C., to provide agronomic consultation to the Company and its contractors in the region. Under the terms of the agreement, Carolina Eastern will assist NAT in the recruitment of growers and contractors, and advise on all cultivation related to flax that will be turned into its branded CRAiLAR® fiber including seeding rates, fertilization, and weed control.
8
On July 8, 2011 the Company completed the public offering of 3,800,000 units (the “Units”) of the Company at a price of C$3.45 per Unit for aggregate gross proceeds of C$13,110,000 (the “Offering”). Each Unit is comprised of one common share and one half of one common share purchase warrant of the Company (each whole common share purchase warrant, a “Warrant”). Each Warrant entitles the holder thereof to acquire one common share of the Company at an exercise price of C$4.50 per common share at any time prior to July 8, 2013.
On July 20, 2011 the Underwriter’s over-allotment option was partially exercised and the Underwriters purchased an additional 212,500 units (each a “Over-Allotment Unit”), at C$3.45 per Over-Allotment Unit, and 100,445 warrants (each a “Over-Allotment Warrant”) of the Company, at C$0.32 per Over-Allotment Warrant, for aggregate gross proceeds to the Company of approximately C$765,267. Each Over-Allotment Unit is comprised of one common share and one half of one common share purchase warrant of the Company. Each whole warrant entitles the holder thereof to acquire one common share of the Company at an exercise price of C$4.50 per common share at any time prior to July 8, 2013.
The Company plans to use the net proceeds from the Offering (including the net proceeds from the over-allotment option exercise) for capacity expansion, debt repayment, working capital and other general corporate purposes.
In August 2011, the Company named Jay Nalbach to the role of Chief Marketing Officer. Mr. Nalbach was previously Brand Director at adidas Group Japan KK, and Global Head of Men’s Lifestyle Footwear for Reebok International.
In September, 2011, the Company entered into a three year CRAiLAR® Fiber supply agreement with Georgia Pacific Consumer Products LLC, for the use of CRAiLAR® fiber in formed substrates for the industrial and personal care markets. The agreement is automatically extendable to ten years upon notification by GP of the intention to do so.
In September, 2011, the Company announced the appointment of Tom Robinson to the role of Chief Operating Officer, and the transition of Jason Finnis, the Company’s co-founder, to the role of Chief Innovation Officer. Mr. Robinson joins the company after twenty-seven years of experience in the textile industry. He joins the Company from International Textile Group, where he was most recently Vice President of Cotton Operations Planning and Technical Support in the company’s apparel division. Mr. Finnis’ newly created role will focus on ways to improve NAT’s processing techniques, throughput efficiencies, and yield.
In September, 2011, the Company entered into an agreement with Westex Inc, for the evaluation and development of CRAiLAR® Fibers in flame and arc resistant fabrics for the industrial, military and service sector industries. Westex Inc. is the market leader in this category.
In September, 2011, the Company entered into a purchasing agreement for a minimum of one and a half million pounds of CRAiLAR® Flax fiber with Brilliant Global LTD, the Hong Kong-based private label knitwear manufacturer which produces a broad spectrum of sweater and accessory items in natural fibers for globally recognized brands and retailers. The first retail introduction of CRAiLAR® fibers in this market is expected to be at the beginning of the second quarter 2012.
9
In October 2011, the Company entered into an agreement with Carhartt Inc., for the evaluation and development of CRAiLAR® Fiber in work wear apparel. Carhartt are the industry leader in work wear apparel, with a broad distribution of product in both retail and corporate markets. CRAiLAR® Fibers are expected to add performance improvements to Carhartt garments in durability, moisture management and dye chemical savings.
In December 2011, the Company entered into an agreement with Target to evaluate the use of its CRAiLAR® Flax fiber in Target’s domestic textiles category beginning December 1, 2011. The agreement includes two years of exclusivity in the category and calls for target’s evaluation of CRAiLAR® Flax in a number of products including sheets, top or bed, shower curtains, window treatments, table linens, decorative pillows, towels, and more.
In January 2012, the Company entered into a non-exclusive and non-transferable license with Tuscarora Yarns, one of the world’s premier yarn innovators, to explore a host of new blended yarns and related products using CRAiLAR® Flax, which Tuscarora is expected to design and manufacture for sale and distribution to third party licensees of CRAiLAR®.
In February 2012, the Company appointed Mr. Scott Staff as a director of the Company. Mr. Staff serves as the Director of Business Development for Perkins Coie LLP, an international law firm where he leads the firm's business development strategy, and oversees its client service interview, client service and industry teams programs. Mr. Staff joined Perkins Coie in 2004 and currently works out of the Seattle office. Mr. Staff is on the boards of advisors of DNA Response Inc. and Rouxbe Video Technologies.
In February 2012, the Company appointed Mr. Gregg Wright as Vice President of Strategic Fiber Markets, with an initial focus on the distribution of secondary fiber and byproducts from the CRAiLAR® decortication platform.
In March 2012, the Company appointed Mr. Steve Sandroni as Vice President of Agriculture. Mr. Sandroni brings more than 34 years of experience working in various aspects of agribusiness to the Company.
Strategic Alliances
National Research Counsel of Canada
Collaboration Agreement
In October 2007, we entered into a joint collaboration agreement with the National Research Counsel of Canada (the “NRC”) to continue to develop a patentable enzyme technology for the processing of hemp fibers. The agreement was for three years and was set to expire on May 9, 2010. On February 19, 2010, we signed an amendment to the agreement which will now expire on May 9, 2012. We will continue our joint collaboration of enzyme technology with the NRC, however the research will refocus on cellulose technology for the production of lignocellulosic ethanol. The NRC is to be paid as it conducts work on the joint collaboration. There are no further costs or other off-balance sheet liabilities associated with the NRC agreement.
Over the term of the amended agreement, we will pay the NRC a total of $280,536 divided into nine payments up to May 9, 2012. As of the date of these statements all payments due in 2011($130,044) have been paid.
10
Technology License Agreement
On November 1, 2006, the Company entered into a technology license agreement with the NRC. The license agreement provides the Company a worldwide license to use and sublicense the NRC technology called CRAiLAR®. The Company paid an initial $20,525 (CDN $25,000) fee and will pay an ongoing royalty of 3% on sales of products derived from the CRAiLAR® process to the NRC with a minimum annual payment set at $14,750 (CDN$15,000) per year. During the year ended December 31, 2011 the Company paid $7,375 (CDN$7,500) and accrued $7,375 (CDN$7,500) of the minimum annual royalty.
Alberta Innovates – Technology Futures
In June 2007, the Company's subsidiary, Crailar Fiber Technologies Inc. (“CFT”), entered into a Master Agreement for Technology Development with Alberta Innovates – Technology Futures (“AITF”, formerly Alberta Research Council) (the “Technology Agreement”) to further develop and commercialize bast fiber technology. The Technology Agreement is intended to act as an umbrella agreement for further bast fiber development planned to be performed by the AITF under separate Project Agreements. Under the terms of the Technology Agreement, commencing July 1, 2007, we will pay $20,525 (CDN $25,000) per quarter to the AITF and can terminate the agreement with 90 days notice, unless there are Project Agreements in effect, in which case this Technology Agreement shall expire when there are no longer any Project Agreements in effect. In addition to the above payments, CFT will be responsible for providing work-in-kind with a value of $20,525 (CDN $25,000) per calendar quarter commencing with the first Project Agreement. During 2011, we paid AITF for specific tasks to further the development of AITF's Technology, the amount paid was $135,890 (2010-$7,991). Under the terms of the Project Agreements signed with AITF the Company will be entitled to an exclusive, worldwide, royalty-bearing license to use any new intellectual property developed pursuant to the Project Agreements. The royalty based on this option will be 3% of gross sales for the first $50,000,000 and 1.5% of gross sales on excess of $50,000,000. The Technology Agreement is in effect as long as there is an active Project Agreement.
Research and Development
During fiscal year 2007, CRAiLAR® completed proof of concept testing on three separate bast fiber processing techniques with the NRC in Ottawa and the AITF in Edmonton. Proof of concept testing at the NRC included the completion of the first CRAiLAR® Fiber processing equipment which was constructed in Montreal and installed at the NRC facility in Ottawa. Ongoing tests with this equipment continue to establish the efficacy of CRAiLAR® enzymatic processes, with early test fibers meeting the requirements of the textile producing industry.
During the fourth quarter of 2007, and first three quarters of 2008, we began scaling CRAiLAR® Fiber processing equipment at a pilot plant facility in Montreal. The equipment became operational during the second quarter of 2008. During the third and fourth quarters of 2008, the pilot plant facility processed 1000kgs of fiber, a portion of which was sent to North Carolina State’s Textile College, where it was spun and then knitted into a fabric suitable for T-shirt or other knit garments.
In May 2007, AITF filed two provisional patent applications related to decortication and degumming technologies for which we have secured exclusive worldwide licensing rights from the AITF. We completed the installation of proprietary decortication equipment at the AITF. We completed proof of concept testing on the proprietary degumming technology at the NRC’s Industrial Materials Institute in Montreal. Test results were in line with expectations and suitable for industrial use.
11
During 2009, our research and development efforts for CRAiLAR® Fibers were concentrated on producing fiber for spinning trials. Different variations of our enzymatic process, drying, carding and equipment was tested to optimize the fiber for spinning using traditional cotton spinning equipment. These research and development efforts led to the successful initial spinning trials of CRAiLAR® fibers. The spinning trials were sponsored by Hanesbrands Inc. at North Carolina State University. We carded and spun a blended CRAiLAR® yarn on a cotton ring spinning system with no modifications using CRAiLAR® Fiber Technology. The resulting 20/1 Ne* ring spun yarn was knitted into a 5-ounces per square yard jersey fabric. Management believes that this was the first time hemp was processed on conventional cotton spinning equipment.
Through CRAiLEXTM Advanced Materials we concentrated our research and development to refining our decortication technology and producing enough decorticated fiber for tests using our proprietary pulp. We engaged an independent testing company to verify the quality of our dissolving pulp and their test results confirmed our AITF lab results and showed the CRAiLEXTM dissolving pulp has qualities far in excess of standard soft or hardwood pulps on the market. We also began commercial trials at a leading North American consumer paper products company where paper products made from our pulp were successfully made and further market applications for CRAiLEXTM pulp were determined.
We have invested a considerable amount of time and effort into product research and development. Our research and development costs for our fiscal year ended December 31, 2011 totaled $757,443 (2010 - $596,212), all of which was attributable to the CRAiLAR® and CRAiLEXTM technology development.
Trademark and Domain Name Rights
In September 2005, we trademarked the term CRAiLAR® to identify our proprietary technology platform relating to the engineering, processing and production of bast fibers including technology co-developed with and licensed from the NRC. Under the CRAiLAR® Technology platform, we have secured the exclusive worldwide licensing rights to intellectual property arising from our collaborative research agreements. In May 2007, the NRC filed a patent application for intellectual property related to the extraction of hemp fibers, under the Patent Cooperation Treaty simultaneously seeking protection in up to 117 countries worldwide. We have secured the exclusive worldwide licensing rights from AITF related to the CRAiLEXTM Technology for use in textile, composite and pulp applications.
We are currently evaluating partnering opportunities for multiple product development and commercialization of our proprietary CRAiLAR® and CRAiLEXTM Technologies for environmentally sustainable bast fiber processing and production. Exclusive international licensing rights to these patent applications allow us to protect our investment to date in the development of CRAiLAR® and CRAiLEXTM Technologies and confidently move forward in seeking an appropriate development and commercialization partner.
We also own the web sites www.naturallyadvanced.com, www.crailar.com and www.crailex.com.
Marketing Strategy
Our primary target markets are the natural yarn, the cellulose pulp and composites markets. We believe that our technologies have the potential to redefine the platform of sustainable yarns, delivering a complete solution from a consumer’s perspective. This implies market relevant performance attributes that are also cost benefit relevant, in a delivery that is sustainable and transparent. The current areas of focus, from a comparison and proof of concept perspective, are the cotton, high performance yarn and pulping industries. Each have entrenched market plays that are either toxic, resource limited, or potentially offensive to informed consumers. Our technologies provide enhanced performance solutions to these industries, whilst delivering a triple bottom line philosophy, respecting the human rights of employees, the environmental impact of our operations and fiscal responsibility to our shareholders. We believe that we offer two key opportunities for development:
12
-
CRAiLAR® Fiber for textiles, which fiber will be flax, hemp (or other sustainable bast fiber) available in a variety of blends, textures, colors and applications; and
-
CRAiLEXTM Advanced Materials, which develops technologies for the processing of these cellulose-based fibers in pulp and paper, high grade dissolving pulp and performance apparel industries.
Marketing Initiatives
Because CRAiLAR® Fibers can be an ingredient in countless products, management believes that partnering with the largest, most successful brands, all of which are top of mind to the North American consumer, is the path to successful commercialization. The Company has signed development and supply agreements with some of the world’s largest fiber consuming companies such as Hanesbrands Inc, Levis Strauss & Co., Georgia-Pacific, and Target. Sustainability, risk mitigation, consumer satisfaction and product enhancement are all offered within the CRAiLAR® experience.
We believe that our marketing model will drive a pull-through marketing strategy, which draws from detailed brand building and delivers that promise directly to consumers. Brand building strategies imply a strong direct to consumer platform, which will allow us to build equity in a consumer focused model ultimately allowing transfer of that equity to establishing branding partnerships with some of the worlds leading consumer brands. We further believe that the CRAiLAR® and CRAiLEXTM processes will entice those in North America to ramp up flax and hemp farming and/or processing as it is expected to create significant margins. Another target market will be partners. We believe that the creation of partnerships is an important strategy for a small company, and our public partnerships with NRC and AITF have been very important to us. We believe additional partnerships with consumer brands will also be important for the branding opportunities that these global brands will provide.
Further down the road, the Company will be working in tandem with our partners to communicate the benefits of CRAiLAR® through co-branding, ingredient call-outs, co-op marketing efforts, in-store signage, point of purchase and with links to the relevant social media networks and websites. The Company believes that our own presence and prosperity will grow in concert with the growth of our growers and business partners, allowing CRAiLAR® to be top of mind, similar to ingredient brand successes such as Gore-Tex® and Intel®.
Pricing Strategy
It is expected that fibers and yarns produced with the CRAiLAR® process will be competitively priced vis-a-vis current natural and synthetic fibers and allow us to realize significant margins. Add to that, a transparent and certifiable sustainability platform, and we believe that CRAiLAR® has the potential to establish a new industry standard.
Global Strategies
Global Industry Partners
We recognize that our patented technologies have global, multi industry applications, and as such represents a significant opportunity for companies currently in those industries. Additionally, speed to market and being first to establish new industry standards is a crucial and strategic marketing advantage. With that understanding in mind, we are evaluating potential strategic partnerships with global leaders in the pulp and paper, yarn, fabric, carpeting, upholstery and composites industries.
13
In addition, we believe that the opportunity exists to partner with global brands, which we believe will allow us to leverage the considerable branding and marketing talent of global brands to increase the brand power of CRAiLAR® and CRAiLEXTM. More than just an enzyme or pulping technology, we believe that CRAiLAR® and CRAiLEXTM can be consumer recognized performance brands that are valued and demanded by an informed public.
We have negotiated and signed agreements with some of the largest fiber consuming companies in the world. We have done this by following through on enquiries from CEOs, COOs, CMOs as well as Innovation Officers to confirm the attributes and benefits of CRAiLAR® fibers. We have been able to showcase an extraordinary opportunity that has been worked into the fabric of corporate responsibility & sustainability platforms. We understand that in order for new initiatives to be pulled through the corporate system to market reality, you need to start at the top. By linking our sales and marketing goals to our production and operations plans, we decided very early that if we are here for good, and are willing to assist the consumer on the path to sustainability, we need to positively affect the national footprint of “dirtier” fibers and processes as quickly as we can.
As we move forward to commercialization, our partners are not only successfully integrating our CRAiLAR® flax fiber within their biggest product categories, but as well, discovering benefits and enhancements which are exclusive to their developments, allowing the CRAiLAR® brand to evolve and grow, while servicing both the consumer and business needs.
Government Regulation
Trade Regulation
Our operations are subject to the effects of international treaties and regulations such as the North American Free Trade Agreement (NAFTA). We are also subject to the effects of international trade agreements and embargoes by entities such as the World Trade Organization. Generally, these international trade agreements benefit our business rather than burden it because they tend to reduce trade quotas, duties, taxes and similar impositions. However, these trade agreements may also impose restrictions that could have an adverse impact on our business, by limiting the countries from whom we can purchase our fabric or other component materials, or limiting the countries where we may market and sell our products.
Environmental Regulation
Our operations are subject to various environmental and occupational health and safety laws and regulations. We believe that we are in compliance with the regulatory requirements of British Columbia. We will continue to make expenditures to comply with these requirements, and we do not believe that compliance will have a material adverse effect on our business. As is the case with manufacturers in general, if a release of hazardous substances occurs on or from our properties or any associated offsite disposal locations, or if contamination from prior activities is discovered at any of our properties, we may be held liable. While the amount of such liability could be material, we endeavor to conduct our operations in a manner that reduces such risks.
Employees
We currently employ eighteen full time employees.
14
Transfer Agent
Our transfer agent is Computershare Investor Services Inc., 510 Burrard Street, 2nd Floor, Vancouver, B.C. V6C 3B9.
ITEM 1A. RISK FACTORS
An investment in our common stock involves a number of very significant risks. You should carefully consider the following risks and uncertainties in addition to other information in evaluating our company and its business before purchasing shares of our common stock. Our business, operating results and financial condition could be seriously harmed due to any of the following risks. The risks described below are all of the material risks that we are currently aware of that are facing our company. Additional risks not presently known to us may also impair our business operations. You could lose all or part of your investment due to any of these risks.
Risks Related to Our Business
We Have a History of Operating Losses and There Can Be No Assurance We Will Be Profitable in the Future.
We have a history of operating losses, expect to continue to incur losses, may never be profitable, and must be considered to be in the development stage. Further, we have been dependent on sales of our equity securities and debt financing to meet our cash requirements. We have incurred losses totaling approximately $6,907,844 and $3,293,439, respectively, for fiscal years ended December 31, 2011 and 2010. As of December 31, 2011, we had accumulated deficits of $22,846,476. As at December 31, 2011 we had cash and cash equivalents of $6,340,505 and working capital of $5,932,991. Further, we do not expect positive cash flow from operations until Q4 2012. There is no assurance that actual cash requirements will not exceed our estimates.
We May Need to Raise Capital To Continue Our Operations.
Based upon our historical losses from operations, we may require additional funding in the future. If we cannot obtain capital through financings or otherwise, our ability to execute our development plans and achieve profitable operational levels will be greatly limited. Historically, we have funded our operations through the issuance of equity and short-term debt financing arrangements. We may not be able to obtain additional financing on favorable terms, if at all. Our future cash flows and the availability of financing will be subject to a number of variables, including demand for CRAiLAR® and CRAiLEXTM technologies. Further, debt financing could lead to a diversion of cash flow to satisfy debt-servicing obligations and create restrictions on business operations. If we are unable to raise additional funds, it would have a material adverse effect upon our operations.
Our Success is Dependent Upon the Acceptance of CRAiLAR®and CRAiLEXTMTechnologies.
Our success depends upon our achieving significant market acceptance of our CRAiLAR®and CRAiLEXTM Technology and demand for alternative bio-based products. Acceptance of our CRAiLAR®and CRAiLEXTM Technology will depend on the success of our and our partners’ promotional and marketing efforts and ability to attract customers. To date, we have not spent significant funds on marketing and promotional efforts, although in order to increase awareness of our products we expect our partners to spend a significant amount on promotion, marketing and advertising in the future. If these expenses fail to develop an awareness of our CRAiLAR®and CRAiLEXTM Technologies and products, these expenses may never be recovered and we may never be able to generate any significant future revenues. In addition, even if awareness of our CRAiLAR®and CRAiLEXTM Technology increases, we may not be able to produce enough product to meet demand.
15
We May Be Unable to Retain Key Employees or Management Personnel.
The loss of Messrs. Kenneth Barker, Jason Finnis, Guy Prevost, Tom Robinson, Jay Nalbach, Ms. Larisa Harrison or any of our key management personnel would have an adverse impact on our future development and could impair our ability to succeed. Our performance is substantially dependent upon the expertise of our Chief Executive Officer, Mr. Kenneth Barker and our Chief Innovation Officer, Mr. Jason Finnis, and other key management personnel and our ability to continue to hire and retain such personnel. Messrs. Barker, Finnis, Prevost, Robinson and Nalbach spend substantially all, or most, of their working time with us and our subsidiaries. It may be difficult to find sufficiently qualified individuals to replace Mr. Barker, Mr. Finnis, Mr. Prevost, Mr. Robinson, Mr. Nalbach, Ms. Harrison or other key management personnel if we were to lose any one or more of them. The loss of Mr. Barker, Mr. Finnis, Mr. Robinson, Mr. Nalbach or Mr. Prevost, or any of our other key management personnel could have a material adverse effect on our business, development, financial condition, and operating results. We maintain “key person” life insurance on our senior executive officers.
Our Officers and Directors May Be Subject to Conflicts of Interest.
Certain of our officers and directors may be subject to conflicts of interest. Certain of our directors devote part of their working time to other business endeavors, including consulting relationships with other entities, and have responsibilities to other entities. Such conflicts include deciding how much time to devote to our affairs, as well as what business opportunities should be presented to us. Because of these relationships, certain of our directors may be subject to conflicts of interest. Currently, we have no policy in place to address such conflicts of interest. However, such directors have acknowledged their fiduciary duty to perform their duties in our best interest and those of our shareholders.
Government Regulation and Trade Restrictions Could Have a Negative Impact on Our Business.
Governments or special interest groups may attempt to protect existing industries through the use of duties, tariffs or public relations campaigns. These efforts may adversely affect interest in and demand for our CRAiLAR® and CRAiLEXTM Technology.
Moreover, any negative changes to international treaties and regulations such as NAFTA and to the effects of international trade agreements and embargoes imposed by such entities such as the World Trade Organization which could result in a rise in trade quotas, duties, taxes and similar impositions or which could limit the countries from whom we can purchase component materials, or which could limit the countries where we or our customers might market and sell products created using CRAiLAR® Technology, which could have an adverse effect on our business.
The laws, regulations, policies or current administrative practices of any government body, organization or regulatory agency in the United States or any other jurisdiction, may be changed, applied or interpreted in a manner which will fundamentally alter our ability to carry on business. The actions, policies or regulations, or changes thereto, of any government body or regulatory agency, or other special interest groups, may have a detrimental effect on us. Any or all of these situations may have a negative impact on our ability to operate and/or our profitability.
16
If Our Competitors Misappropriate Unpatented Proprietary Know-How and Our Trade Secrets, It May Have a Material Adverse Affect on Our Business.
The loss of or inability to enforce our trademark CRAiLAR® and other proprietary know-how, including our CRAiLAR® and CRAiLEXTM process, and trade secrets could adversely affect our business. We depend heavily on trade secrets and the design expertise of our employees. If any of our competitors copies or otherwise gains access to our trade secrets or develops similar technologies or processes independently, we would not be able to compete as effectively. The measures we take to protect our trade secrets and design expertise may not be adequate to prevent their unauthorized use. Further, the laws of foreign countries may provide inadequate protection of such intellectual property rights. We may need to bring legal claims to enforce or protect such intellectual property rights. Any litigation, whether successful or unsuccessful, could result in substantial costs and diversions of resources. In addition, notwithstanding the rights we have secured in our intellectual property, other persons may bring claims against us that we have infringed on their intellectual property rights or claims that our intellectual property right interests are not valid. Any claims against us, with or without merit, could be time consuming and costly to defend or litigate and therefore could have an adverse affect on our business.
Currency Fluctuations May Cause Translation Gains and Losses.
A significant portion of our expenses are incurred in Canadian dollars. As a result, appreciation in the value of these currencies relative to the United States dollar could adversely affect our operating results. Foreign currency translation gains and losses arising from normal business operations are credited to or charged against other income for the period incurred. Fluctuations in the value of Canadian dollars relative to United States dollars may cause currency translation gains and losses.
Risks Related to Our Common Stock
Sales of a Substantial Number of Shares of Our Common Stock May Result in Significant Downward Pressure on the Price of Our Common Stock and Could Affect Your Ability to Realize the Current Trading Price of Our Common Stock.
As of December 31, 2011, there were 41,701,604 shares of our common stock issued and outstanding. (As of March 15, 2012, there were 42,422,804 shares of our common stock issued and outstanding). Further, as of December 31, 2011 there were an aggregate of 5,290,970 Stock Options and 3,294,219 share purchase warrants outstanding that are exercisable into 5,290,970 shares of common stock (at a weighted average exercise price of $1.48) and 3,294,219 shares of common stock (at a weighted average exercise price of $3.57), respectively.
Any significant downward pressure on the price of our common stock as certain stockholders sell their shares of our common stock may encourage short sales. Any such short sales could place further downward pressure on the price of our common stock.
The Trading Price of Our Common Stock on the OTC Bulletin Board Has Been and May Continue to Fluctuate Significantly and Stockholders May Have Difficulty Reselling Their Shares.
During our fiscal year ended December 31, 2011, our common stock has traded as low as $1.03 and as high as $4.50. In addition to volatility associated with Bulletin Board securities in general, the value of your investment could decline due to the impact of any of the following factors upon the market price of our common stock:
- changes in the demand for flax and other eco-friendly products;
17
-
disappointing results from our or our partners’ marketing and sales efforts;
-
failure to meet our revenue or profit goals or operating budget;
-
decline in demand for our common stock;
-
downward revisions in securities analysts’ estimates or changes in general market conditions;
-
lack of funding generated for operations;
-
investor perception of our industry or our business prospects; and
-
general economic trends.
In addition, stock markets have experienced extreme price and volume fluctuations and the market prices of securities have been highly volatile. These fluctuations are often unrelated to operating performance and may adversely affect the market price of our common stock. As a result, investors may be unable to sell their shares at a fair price and you may lose all or part of your investment.
Additional Issuances of Equity Securities May Result in Dilution to Our Existing Stockholders.
Our Articles of Incorporation authorize the issuance of 100,000,000 shares of common stock. The Board of Directors has the authority to issue additional shares of our capital stock to provide additional financing in the future and the issuance of any such shares may result in a reduction of the book value or market price of the outstanding shares of our common stock. If we do issue any such additional shares, such issuance also will cause a reduction in the proportionate ownership and voting power of all other stockholders. As a result of such dilution, if you acquire shares of our common stock, your proportionate ownership interest and voting power could be decreased. Further, any such issuances could result in a change of control.
We are not authorized to issue shares of preferred stock. However, there are provisions of British Columbia law that permit a company’s board of directors, without shareholder approval, to issue shares of preferred stock with rights superior to the rights of the holders of shares of common stock. As a result, shares of preferred stock could be issued quickly and easily, adversely affecting the rights of holders of shares of common stock and could be issued with terms calculated to delay or prevent a change in control or make removal of management more difficult. Although we have no present plans to issue any shares of preferred stock, the issuance of preferred stock in the future could adversely affect the rights of the holders of common stock and reduce the value of the common stock.
Our Common Stock is Classified as a “Penny Stock” Under SEC Rules Which Limits the Market For Our Common Stock.
Because our stock is not traded on the NASDAQ National Market or the NASDAQ Small Cap Market, and because the market price of the common stock is less than $5 per share, the common stock is classified as a “penny stock.” Our stock has not traded above $5 per share. SEC Rule 15g-9 under the Exchange Act imposes additional sales practice requirements on broker-dealers that recommend the purchase or sale of penny stocks to persons other than those who qualify as an “established customer” or an “accredited investor.” This includes the requirement that a broker-dealer must make a determination that investments in penny stocks are suitable for the customer and must make special disclosures to the customers concerning the risk of penny stocks. Many broker-dealers decline to participate in penny stock transactions because of the extra requirements imposed on penny stock transactions. Application of the penny stock rules to our common stock reduces the market liquidity of our shares, which in turn affects the ability of holders of our common stock to resell the shares they purchase, and they may not be able to resell at prices at or above the prices they paid.
18
We Are a Canadian Company and a Majority of Our Directors and Officers Are Canadian Citizens and/or Residents, Which Could Make It Difficult for Investors to Enforce Judgments Against Us in the United States.
We are a company incorporated under the laws of the Province of British Columbia, Canada and a majority of our directors and officers reside in Canada. Therefore, it may be difficult for investors to enforce within the United States any judgments obtained against us or any of our directors or officers. All or a substantial portion of such persons’ assets may be located outside the United States. As a result, it may be difficult for investors to effect service of process on our directors or officers, or enforce within the United States or Canada any judgments obtained against us or our officers or directors, including judgments predicated upon the civil liability provisions of the securities laws of the United States or any state thereof. Consequently, you may be effectively prevented from pursuing remedies under U.S. federal securities laws against them. In addition, investors may not be able to commence an action in a Canadian court predicated upon the civil liability provisions of the securities laws of the United States. We have been advised by our Canadian counsel that there is doubt as to the enforceability, in original actions in Canadian courts, of liability based upon the U.S. federal securities laws and as to the enforceability in Canadian courts of judgments of U.S. courts obtained in actions based upon the civil liability provisions of the U.S. federal securities laws. Therefore, it may not be possible to enforce those actions against us or any of our directors or officers.
A Decline in the Price of Our Common Stock Could Affect Our Ability to Raise Further Working Capital and Adversely Impact Our Operations.
A decline in the price of our common stock could result in a reduction in the liquidity of our common stock and a reduction in our ability to raise additional capital for our operations. Because our operations to date have been principally financed through the sale of equity securities, a decline in the price of our common stock could have an adverse effect upon our liquidity and our continued operations. A reduction in our ability to raise equity capital in the future would have a material adverse effect upon our business plan and operations, including our ability to continue our current operations. If our stock price declines, we may not be able to raise additional capital or generate funds from operations sufficient to meet our obligations.
ITEM 1B. UNRESOLVED STAFF COMMENTS
As of the date of this Annual Report, there are no unresolved comments pending from either the SEC or the British Columbia Securities Commission.
ITEM 2. PROPERTIES
Our Vancouver office space lease expired on November 30, 2011 where we paid a monthly rent of CDN$6,000 plus applicable taxes. On June 30, 2011 we entered into a lease for approximately 1,571 square feet of office space in Victoria, British Columbia for a monthly basic net rent of CDN$2,749.25 (US$2,703.29 based on the exchange rate on December 31, 2011 of US$1.00 = CDN$1.0170) . The new lease is for a term of three (3) years commencing on August 1, 2011 and expiring on July 31, 2014 with one renewal term of three (3) years.
Effective August 9, 2010, we signed a ten-month sublease of a facility at 164 County Camp Road, Kingstree, SC, 29556, at a rental cost of $4,400 per month. We attained the space for use as an initial scale-up flax fiber facility to conduct the decortication process of CRAiLAR® Fibers. The property is housed near 300 acres of flax crops that we intend to use to conduct our flax fiber growing trials. On July 1, 2011, we signed a one year lease for this same property and facility in Kingstree, South Carolina, for a monthly rent of $3,300 expiring on June 30, 2012.
19
Effective August 15, 2011, we entered into a lease for approximately 1468 square feet of office space in Lake Oswego, Oregon for a monthly rent of $3,000 during the first year, $3,500 during the second year and $4,000 during the third year. This lease is for a term of three (3) years expiring on August 14, 2014.
ITEM 3. LEGAL PROCEEDINGS
Management is not aware of any legal proceedings contemplated by any governmental authority or any other party involving us or our properties. As of the date of this Annual Report, no director, officer or affiliate is a party adverse to us in any legal proceeding, or has an adverse interest to us in any legal proceedings. Management is not aware of any other legal proceedings pending or that have been threatened against us or our properties.
ITEM 4. MINE SAFETY DISCLOSURES
Not applicable.
PART II
ITEM 5. MARKET FOR REGISTRANT’S COMMON EQUITY, RELATED STOCKHOLDER MATTERS AND ISSUER PURCHASES OF EQUITY SECURITIES
Market for Common Stock
Shares of our common stock have been quoted on the OTC Bulletin Board under the symbol “NADVF.OB” since March 21, 2006. The market for our common stock is limited, and can be volatile. The following table sets forth the high and low bid prices relating to our common stock on a quarterly basis for the periods indicated as quoted by the OTC Bulletin Board. These quotations reflect inter-dealer prices without retail mark-up, mark-down, or commissions, and may not reflect actual transactions.
| Quarter Ended | High Bid | Low Bid |
| December 31, 2011 | $2.55 | $1.57 |
| September 30, 2011 | $3.45 | $1.95 |
| June 30, 2011 | $4.50 | $1.87 |
| March 31, 2011 | $1.98 | $1.03 |
| December 31, 2010 | $1.26 | $0.63 |
| September 30, 2010 | $1.04 | $0.80 |
| June 30, 2010 | $1.35 | $0.90 |
| March 31, 2010 | $1.29 | $0.80 |
In addition, shares of our common stock have been listed on the TSX-V under the symbol “NAT.V”) since July 8, 2008. The following table sets forth the high and low sales prices of our common stock on a quarterly basis for the periods indicated as quoted by the TSX-V.
20
| Quarter Ended | High | Low |
| December 31, 2011 | CDN$2.66 | CDN$1.50 |
| September 30, 2011 | CDN$3.30 | CDN$2.05 |
| June 30, 2011 | CDN$4.49 | CDN$1.73 |
| March 31, 2011 | CDN$1.87 | CDN$0.98 |
| December 31, 2010 | CDN$1.40 | CDN$0.66 |
| September 30, 2010 | CDN$1.06 | CDN$0.82 |
| June 30, 2010 | CDN$1.53 | CDN$0.92 |
| March 31, 2010 | CDN$1.30 | CDN$0.87 |
As of March 1, 2011, there were approximately 63 shareholders of record of our common shares as reported by our transfer agent, Computershare Investor Services Inc., which does not include shareholders who shares are held in street or nominee names. We believe that there are approximately 300 beneficial owners of our common stock. There are no other classes of shares issued or outstanding.
Dividend Policy
No dividends have ever been declared by the Board of Directors on our common stock. Our losses do not currently indicate the ability to pay any cash dividends, and we do not indicate the intention of paying cash dividends either on our common stock in the foreseeable future.
Securities Authorized for Issuance under Compensation Plans
We have one equity compensation plan: our 2011 Fixed Share Option Plan. As described below, the 2011 Plan adopted all options outstanding under our previous stock option plans, including our 2006 Stock Option Plan (the “2006 Plan”), our 2008 Fixed Share Option Plan (the “2008 Plan”) and our 2010 Fixed Share Option Plan (the “2010 Plan”). The table set forth below presents information relating to our equity compensation plans as of December 31, 2011.
| Number of Securities | ||||||
| Remaining Available for | ||||||
| Number of Securities to | Weighted-Average | Future Issuance Under | ||||
| be Issued Upon Exercise | Exercise Price of | Equity Compensation | ||||
| of Outstanding Options, | Outstanding Options, | Plans (excluding column | ||||
| Plan Category | Warrants and Rights | Warrants and Rights | (a)) | |||
| (a) | (b) | (c) | ||||
| Equity Compensation Plans | ||||||
| Approved by Security | ||||||
| Holders (2011 Plan Stock | ||||||
| Options, Including Stock | ||||||
| Options Originally Granted | ||||||
| Under 2006 Plan, 2008 | ||||||
| Plan and 2010 Plan) | 5,290,970 | $1.48 | 2,364,395 | |||
| Equity Compensation Plans | ||||||
| Not Approved by Security | ||||||
| Holders | N/A | N/A | N/A | |||
| Total | 5,290,970 | $1.48 | 2,364,395 |
21
2011 Fixed Share Option Plan
Effective August 9, 2011, our Board of Directors authorized and approved the adoption of our 2011 Fixed Share Option Plan (the “2011 Plan”) as of such date, under which an aggregate of 8,224,240 of our shares, representing 20% of the issued and outstanding common share capital of the Company as of August 9, 2011, may be issued. Our shareholders approved the 2011 Plan at our annual general meeting held on September 15, 2011. As described below, all options issued under our Previous Option Plan (as defined below) are covered by our 2011 Plan.
Prior to the adoption of the 2011 Plan, we had a stock option plan outstanding, the 2010 Fixed Share Option Plan (the “Previous Option Plan”). Under the Previous Option Plan, a maximum of 7,057,640 options were reserved for issuance. As of August 9, 2011, 4,499,421 options were issued and outstanding under the Previous Option Plan. All outstanding options under the Previous Option Plan were rolled into the 2011 Plan and are counted against the number of common shares available for option under the 2011 Plan.
The purpose of the 2011 Plan is to enhance our long-term stockholder value by offering opportunities to our directors, officers, employees and eligible consultants to acquire and maintain stock ownership in order to give these persons the opportunity to participate in our growth and success, and to encourage them to remain in our service.
The 2011 Plan is to be administered by our Board of Directors or a committee appointed by the Board of Directors, which shall determine, among other things:
-
the persons to be granted options under the 2011 Plan;
-
the number of options to be granted; and
-
the terms and conditions of the options granted.
An option may not be exercised after the termination date of the option and may be exercised following the termination of an eligible participant’s continuous service only to the extent provided by the terms of the 2011 Plan.
Based on the terms of the individual option grants, options granted under the 2011 Plan generally expire three to ten years after the grant date (with a maximum exercise period of 10 years from grant) and become exercisable over a period of one year based on continued employment, either with monthly vesting or upon achievement of pre-determined deliverable.
Form S-8 Registration Statement
On February 15, 2012, we filed a registration statement on Form S-8 relating to a maximum of 8,124,240 shares of common stock, without par value, issuable directly by us under our 2011 Plan or pursuant to the exercise of options that have been or may be granted under the 2011 Plan (including options granted under our Previous Stock Option Plan as described above).
Common Stock Purchase Warrants
As of the date of this annual report, there are an aggregate of 3,019,219 common stock purchase warrants issued and outstanding.
22
Recent Sales of Unregistered Securities
On May 19, 2010, we issued 1,424,739 units pursuant to a private placement to 16 subscribers at $1.00 per unit, for proceeds of $1,424,739. Each unit consists of one common share and one-half of one non-transferable common stock purchase warrant, with each whole warrant exercisable to purchase one additional share at $1.25 per share, expiring on May 19, 2013. The units issued to eight of the subscribers under an exemption from the registration requirements of the U.S. Securities Act pursuant to Regulation S and to the remaining eight subscribers under an exemption from the registration requirements of the U.S. Securities Act pursuant to Rule 506 for accredited investors, in each case based on representations and warranties made by the subscribers in their respective subscription agreements with the Company. One of the subscribers is an officer and director of the Company, and another subscriber is a director of the Company. We paid a total $62,152 for agent commissions and other expenses which have been recorded as share issue costs.
On April 7, 2011, we issued 2,000 shares of our common stock upon exercise of previously issued share purchase warrants at an exercise price of CDN$1.50 per share. The shares were issued outside the United States to one non-U.S. Person (as such terms are defined in Regulation S) in reliance on Regulation S.
On April 19, 2011, we issued 5,000 shares of our common stock upon exercise of previously issued share purchase warrants at an exercise price of CDN$1.95 per share. The shares were issued outside the United States to one non-U.S. Person in reliance on Regulation S.
On April 25, 2011, we issued 25,000 shares of our common stock upon exercise of previously issued share purchase warrants at an exercise price of U.S.$1.25 per share. The shares were issued to an accredited investor in reliance on Regulation D. Also on April 25, 2011, we issued a further 7,137 shares of our common stock upon exercise of previously issued share purchase warrants at an exercise price of CDN$1.50 per share. The shares were issued outside the United States to one non-U.S. Person in reliance on Regulation S.
On April 28, 2011, we issued 100,000 shares of our common stock upon exercise of previously issued share purchase warrants at an exercise price of CDN$1.95 per share. The shares were issued outside the United States to one non-U.S. Person in reliance on Regulation S.
On May 2, 2011, we issued 32,556 shares of our common stock upon exercise of previously issued share purchase warrants at an exercise price of CDN$1.95 per share. The shares were issued outside the United States to four non-U.S. Persons in reliance on Regulation S.
On May 4, 2011, we issued 18,708 shares of our common stock upon exercise of previously issued share purchase warrants at an exercise price of CDN$1.95 per share. These shares were issued outside the United States to three non- U.S. Persons in reliance on Regulation S. Also on May 4, 2011, we issued a further 53,000 shares of our common stock upon exercise of previously issued share purchase warrants at an exercise price of US$1.25 per share. The shares were issued outside the United States to two non-U.S. Persons in reliance on Regulation S.
On May 5, 2011, we issued 8,334 shares of our common stock upon exercise of previously issued share purchase warrants at an exercise price of CDN$1.95 per share. The shares were issued outside the United States to two non-U.S. Persons in reliance on Regulation S.
On May 9, 2011, we issued 11,364 shares of our common stock upon exercise of previously issued share purchase warrants at an exercise price of CDN$1.50 per share and a further 17,500 shares of our common stock upon exercise of previously issued share purchase warrants at an exercise price of U.S.$1.25 per share. The shares were issued to an accredited investor in reliance on Regulation D.
23
On May 10, 2011, we issued 5,000 shares of our common stock upon exercise of previously issued share purchase warrants at an exercise price of CDN$1.95 per share. The shares were issued outside the United States to one non-U.S. Person in reliance on Regulation S.
On May 12, 2011, we issued 70,593 shares of our common stock upon exercise of previously issued share purchase warrants at an exercise price of CDN$1.95 per share. These shares were issued outside the United States to one non-U.S. Person in reliance on Regulation S. Also on May 12, 2011, we issued a further 2,000 shares of our common stock upon exercise of previously issued share purchase warrants at an exercise price of CDN$1.50 per share. The shares were issued outside the United States to one non-U.S. Person in reliance on Regulation S.
On May 17, 2011, we issued 5,556 shares of our common stock upon exercise of previously issued share purchase warrants at an exercise price of CDN$1.95 per share. The shares were issued outside the United States to one non-U.S. Person in reliance on Regulation S.
On May 19, 2011, we issued 1,852 shares of our common stock upon exercise of previously issued share purchase warrants at an exercise price of CDN$1.95 per share. The shares were issued outside the United States to one non-U.S. Person in reliance on Regulation S.
On May 24, 2011, we issued 20,000 shares of our common stock upon exercise of previously issued share purchase warrants at an exercise price of CDN$1.95 per share. The shares were issued outside the United States to one non-U.S. Person in reliance on Regulation S.
On May 26, 2011, we issued 34,960 shares of our common stock upon exercise of previously issued share purchase warrants at an exercise price of CDN$1.20 per share and a further 17,480 shares of our common stock upon exercise of previously issued share purchase warrants at an exercise price of CDN$1.50 per share. The shares were issued outside the United States to two non-U.S. Persons in reliance on Regulation S.
On June 1, 2011, we issued 114,654 shares of our common stock upon exercise of previously issued share purchase warrants at an exercise price of CDN$1.95 per share. The shares were issued outside the United States to three non-U.S. Persons in reliance on Regulation S.
On June 10, 2011, we issued 40,741 shares of our common stock upon exercise of previously issued share purchase warrants at an exercise price of CDN$1.95 per share. The shares were issued outside the United States to two non-U.S. Persons in reliance on Regulation S.
On June 13, 2011, we issued 30,558 shares of our common stock upon exercise of previously issued share purchase warrants at an exercise price of CDN$1.95 per share. The shares were issued outside the United States to five non-U.S. Persons in reliance on Regulation S.
On June 16, 2011, we issued 26,760 shares of our common stock upon exercise of previously issued share purchase warrants at an exercise price of CDN$1.95 per share. These shares were issued outside the United States to five non-U.S. Persons in reliance on Regulation S. Also on June 16, 2011, we issued a further 5,000 shares of our common stock upon exercise of previously issued share purchase warrants at an exercise price of CDN$1.50 per share. The shares were issued outside the United States to one non-U.S. Person in reliance on Regulation S.
24
On June 23, 2011, we issued 16,852 shares of our common stock upon exercise of previously issued share purchase warrants at an exercise price of CDN$1.95 per share. These shares were issued outside the United States to two non-U.S. Persons in reliance on Regulation S. Also on June 23, 2011, we issued a further 5,834 shares of our common stock upon exercise of previously issued share purchase warrants at an exercise price of CDN$1.50 per share. The shares were issued outside the United States to two non-U.S. Persons in reliance on Regulation S.
On June 28, 2011, we issued 173,384 shares of our common stock upon exercise of previously issued share purchase warrants at an exercise price of CDN$1.95 per share. 99,680 of these shares were issued to two accredited investor in reliance on Regulation D, and the remaining 73,704 shares were issued outside the United States to six non-U.S. Persons in reliance on Regulation S.
On July 4, 2011, we issued 58,175 shares of our common stock upon exercise of previously issued share purchase warrants at an exercise price of CDN$1.95 per share. These shares were issued outside the United States to seven non- U.S. Persons in reliance on Regulation S.
On July 5, 2011, we issued 6,500 shares of our common stock upon exercise of previously issued share purchase warrants at an exercise price of $1.12 per share. These shares were issued outside the United States to one non- U.S. Person in reliance on Regulation S.
On July 7, 2011, we issued 10,000 shares of our common stock upon exercise of previously issued share purchase warrants at an exercise price of $1.02 per share. These shares were issued outside the United States to one non- U.S. Person in reliance on Regulation S.
On July 8, 2011, we completed the public offering of 3,800,000 units (the “Units”) of the Company at a price of CDN$3.45 per Unit for aggregate gross proceeds of CDN$13,110,000 (the “Offering”). Each Unit is comprised of one common share and one half of one common share purchase warrant of the Company (each whole common share purchase warrant, a “Warrant”). Each Warrant entitles the holder thereof to acquire one common share of the Company at an exercise price of CDN$4.50 per common share at any time prior to July 8, 2013. The Units were issued outside the United States to non-U.S. Persons in reliance on Regulation S and within the United States in reliance on Rule 144A and Regulation D.
The Company has paid to the underwriters 6% of the gross proceeds of the Offering (including with respect to the Over-Allotment Units as described below) and granted the underwriters options (the “Compensation Options”) to purchase that number of units (each, a “Compensation Unit”) equal to 6% of the number of Units sold in the Offering (including with respect to Over-Allotment Units as described below) at an exercise price of CDN$3.45 per Compensation Unit for 24 months after closing of the Offering. Each Compensation Unit includes one common share (each, a “Compensation Share”) and one half of one warrant (each, a “Compensation Warrant”). Each whole Compensation Warrant is exercisable for 24 months after closing at CDN$4.50 per common share.
The Company also granted the underwriters an option (the “Over-Allotment Option”), exercisable in whole or in part at any time up to 30 days following the closing of the Offering, to purchase up to an additional 570,000 units (each, an “Over-Allotment Unit”) at CDN$3.45 per Over-Allotment Unit and up to 285,000 warrants (each, an “Over-Allotment Warrant”) at CDN$0.32 per Over-Allotment Warrant.
Effective July 20, 2011, the underwriters’ Over-Allotment Option was partially exercised and the underwriters have purchased an additional 212,500 Over-Allotment Units at CDN$3.45 per unit, and 100,445 Over-Allotment Warrants at CDN$0.32 per warrant, for aggregate gross proceeds to the Company of approximately CDN$765,267. Each Over-Allotment Unit is comprised of one common share and one half of one common share purchase warrant of the Company. Each whole warrant entitles the holder thereof to acquire one common share of the Company at an exercise price of CDN$4.50 per common share at any time prior to July 8, 2013. The Over-Allotment Units and Over-Allotment Warrants were issued outside the United States to non-U.S. Persons in reliance on Regulation S and within the United States in reliance on Regulation D.
25
On July 25, 2011, we issued 1,500 shares of our common stock upon exercise of previously issued share purchase warrants at an exercise price of $1.12 per share. These shares were issued outside the United States to one non- U.S. Person in reliance on Regulation S.
On September 7, 2011, we issued 2,500 shares of our common stock upon exercise of previously issued share purchase warrants at an exercise price of $1.12 per share. These shares were issued outside the United States to one non- U.S. Person in reliance on Regulation S.
Comparative Stock Performance
Our shares of common stock commenced trading on the OTC Bulletin Board on March 21, 2006. Our shares of common stock were also listed for trading on the TSX Venture Exchange since July 8, 2008. The graph below compare the cumulative total stockholder return on our common stock for the years ended December 31, 2007 through to December 31, 2011, with the cumulative total return on the shares of common stock of Ecosphere Technologies Inc. (“ETI”), Provectus Pharmaceuticals, Inc. (“PPI”) and White Mountain Titanium Corp. (“WMT”) over the same periods (assuming an investment of $100 in our common stock, Ecosphere Technologies Inc., Provectus Pharmaceuticals, Inc. and White Mountain Titanium Corp. on December 31, 2006, and the reinvestment of all dividends, if any).
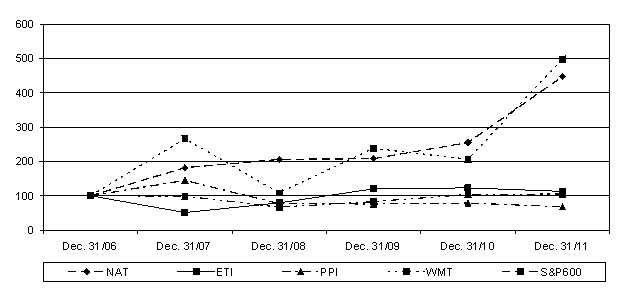
Since we were not able to identify a published industry or line-of-business index and were not able to reasonably identify a peer group, we selected the comparative issuers based on such issuers having a similar market capitalization.
26
| 31-Dec-06 | 31-Dec-07 | 31-Dec-08 | 31-Dec-09 | 31-Dec-10 | 31-Dec 11 | |
| Naturally Advanced Technologies Inc. | $100.00 | $181.63 | $206.12 | $208.16 | $255.10 | $446.94 |
| Ecosphere Technologies Inc. | $100.00 | $51.28 | $79.49 | $120.51 | $123.08 | $112.82 |
| Provectus Pharmaceuticals, Inc. | $100.00 | $144.53 | $77.31 | $76.47 | $78.99 | $68.06 |
| White Mountain Titanium Corp. | $100.00 | $265.96 | $108.51 | $238.30 | $206.39 | $497.88 |
| S&P 600 | $100.00 | $98.78 | $67.19 | $83.16 | $103.98 | $104.99 |
ITEM 6. SELECTED FINANCIAL DATA
The following selected financial data has been derived from and should be read in conjunction with (i) our audited financial statements as at and for the years ended December 31, 2011, 2010, 2009, 2008 and 2007, together with the notes to these financial statements, and (ii) the section of this annual report entitled “Business” and “Management’s Discussion and Analysis of Financial Condition and Results of Operations”.
During fiscal 2009 we decided to discontinue the apparel business to focus on developing our bast fiber technology. We did not renew our warehouse lease which expired in 2009 and no longer have sales staff or any selling expenses. In addition, we restated our audited financial statements for the fiscal period ended December 31, 2009 to correct the accounting for warrants that were issued in connection with a previous private placement. The exercise price of these warrants is denominated in United States dollars, which differs from the Company's functional currency (Canadian dollars) and therefore these warrants cannot be considered to be indexed to the Company's own stock. Accordingly the fair value of the warrants must be accounted for as a derivative liability with changes in fair value recorded in the statement of operations. Accordingly, the financial information presented below may not be comparable from period to period.
Selected Financial Data:
Balance Sheet Data
| As at December 31 | |||||
| Item | 2011 | 2010 | 2009 | 2008 | 2007 |
| Cash and cash equivalents | $6,340,505 | $18,493 | $421,452 | $319,358 | $660,407 |
| Working capital (deficiency) | $5,932,991 | ($2,646,925) | ($57,687) | ($13,862) | $832,018 |
| Total Assets | $10,884,414 | $258,894 | $740,845 | $1,786,438 | $2,309,827 |
| Total Liabilities | 1,641,641 | $2,773,536 | $1,965,653 | $1,466,722 | $1,544,291 |
| Total stockholders’ equity | $9,242,773 | ($2,514,643) | ($1,224,808) | $319,716 | $765,536 |
27
Statement of Operations Data
| Under U.S. GAAP | For the years ended December 31 | ||||
| Item | 2011 | 2010 | 2009 | 2008 | 2007 |
| Revenue | Nil | Nil | Nil | $2,607,153 | $2,490,885 |
| Expenses | $6,430,084 | $3,308,769 | $3,118,988 | $4,312,307 | $2,731,717 |
| Loss from continuing operations | ($6,998,922) | ($3,304,756) | ($2,391,294) | ($3,382,718) | ($1,937,171) |
| Profit (loss) from discontinued operations | n/a | $11,317 | ($659,946) | n/a | n/a |
| Net Loss | ($6, 998,922) | ($3,293,439) | ($3,051,240) | ($3,382,718) | ($1,937,171) |
| Loss from continuing operations per common share | ($0.18) | ($0.10) | ($0.07) | ($0.12) | ($0.08) |
| Earnings (Loss) from discontinued operations per common share (basic and diluted) | n/a | n/a | ($0.02) | n/a | n/a |
| Weighted average number of common shares outstanding (basic and diluted) | 38,582,587 | 34,584,288 | 32,939,968 | 29,378,370 | 25,140,373 |
| Common shares issued and outstanding | 41,701,604 | 35,313,202 | 33,354,215 | 30,827,046 | 27,913,589 |
ITEM 7. MANAGEMENT’S DISCUSSION AND ANALYSIS OF FINANCIAL CONDITION AND RESULTS OF OPERATIONS
The following discussion and analysis of our results of operations and financial position should be read in conjunction with our financial statements and the notes thereto included elsewhere in this Report. Our consolidated financial statements are prepared in accordance with U.S. GAAP. All references to dollar amounts in this section are in U.S. dollars unless expressly stated otherwise.
The matters discussed in these sections that are not historical or current facts deal with potential future circumstances and developments. Such forward-looking statements include, but are not limited to, the development plans for the Company’s growth, trends in the results of the Company’s development, anticipated development plans, operating expenses and the Company’s anticipated capital requirements and capital resources. As such, these forward-looking statements may include words such as “plans,” “intends,” “anticipates,” “should,” “estimates,” “expects,” “believes,” “indicates,” “targeting,” “suggests” and similar expressions. The actual results are expected to differ from these forward-looking statements and these differences may be material.
28
RESULTS OF OPERATIONS
Fiscal Year Ended December 31, 2011 Compared to Fiscal Year Ended December 31, 2010
| Twelve months ended December 31st | |||
| 2011 |
2010 |
% Change |
|
| Loss from Continuing Operations | ($6,998,922) | ($3,304,756) | (110%) |
| Gain (Loss) from Discontinued Operations | $- | $11,475 | |
| Net Loss | ($6,998,922) | ($3,293,439) | (110%) |
| Loss/share continuing operations | ($0.18) | ($0.10) | |
Revenue and Gross Margins
Our net operational loss from continuing operations during the twelve-month period ended December 31, 2011, was ($6,998,922) compared to ($3,304,756) during the twelve-month period ended December 31, 2010 (an increase in loss of $3,694,166). The increase in loss was due to an increase in Consulting and Contract Labour expense, an increase in general and administrative expense, costs associated with commercialization start up, professional fees, research and development and salaries and benefits expense as well as a loss from the fair value adjustment of a derivative liability.
Operating Expenses
During the twelve-month period ended December 31, 2011, we recorded operating expenses of $6,998,922 compared to operating expenses of $3,304, 756 for the same period in 2010. Operating expenses consisted of:
- $236,488 (2010: $216,937) in advertising and promotion, an increase of 9%
- $61,809 (2010: $34,486) in amortization and depreciation, an increase of 79 %;
- $1,304,960 (2010: $682,796) in consulting and contract labour, an increase of 91%;
- $605,837 (2010: $352,996) in general and administrative, an increase of 72%;
- $96,975 (2010: $161,990) in interest, a decrease of 60%;
- $401,254 (2010: $226,985) in professional fees, an increase of 77%;
- $757,443 (2010: $596,212) in research and development, an increase of 27%; and
- $2,965,318 (2010: $1,036,367) in salaries and benefits, an increase of 186%
29
Advertising and promotion expenses increased to $236,488 for the twelve month period ended December 31, 2011, from $216,937 for the same period in 2010. The increase in advertising and promotion was primarily due to an increase in public relations costs.
Amortization and depreciation expenses increased to $61,809 for the twelve month period ended December 31, 2011, from $34,486 for the same period in 2010. The increase in plant equipment depreciation was the cause for the increase in expense.
Consulting and contract labor expenses increased to $1,304,960 for the twelve-month period ended December 31, 2011, from $682,796, compared to the same period in 2010 due to an increase in stock based compensation and the hiring of consultants to assist in agronomics.
General and administrative expenses decreased to $605,837 for the twelve-month period ended December 31, 2011, compared to $352,996 for the same period in 2010. The increase in general and administrative expenses was primarily due to travel and new office costs.
Interest expenses decreased to $96,975 for the twelve-month period ended December 31, 2011, compared to $161,990 for the same period in 2010. The decrease is attributable to the repayment of all outstanding loans.
Professional fees were $401,254 for the twelve month period ended December 31, 2011, compared to $226,985 for the same twelve month period in 2010. The primary cause for the increase was SOX 404 compliance preparation, and the public offering completed during the year.
Research and development costs were $757,443 for the twelve-month period ended December 31, 2011, compared to $596,212 for the same twelve-month period in 2010. Increased amounts of CRAiLAR® fiber have been produced for testing purposes for our development partners and the cost of that fiber has been expensed to research and development. Our development partners also purchased approximately $29,200 of Crailar fiber which has been subtracted from those costs.
Salaries and benefits expenses increased to $2, 965,318 for the twelve-month period ended December 31, 2011, compared with $1,036,367 for the same period in 2010. This increase was caused by an increase in stock based compensation, an increase in employee bonuses and additional hires as the company moves toward commercialization.
Net Loss
Our net loss during the twelve-month period ended December 31, 2011, was ($6,998,922), or $0.18 per share) compared to ($3,293,439, or $0.10 per share) during the twelve-month period ended December 31, 2010, which represents an increase in net loss of 110%. The increase in loss was due to an increase in Consulting and Contract Labour expense, an increase in general and administrative expense, costs associated with commercialization start up, professional fees, research and development and salaries and benefits expense as well as a loss from the fair value adjustment of a derivative liability. For the twelve-month period ended December 31, 2011, the weighted average number of shares outstanding was 38,582,587 compared to 34,584,288 at December 31, 2010.
Liquidity and Capital Resources
For the twelve-month period ended December 31, 2011, our current assets were $7,574,632 (2010 - $126,611) and our current liabilities were $ 1,641,641 (2010 - $2,133,045) which resulted in working capital of $5,932,991 (2010 - working capital deficit of $2,646,925). As at December 31, 2011, total assets were $10,884,414, consisting of:
30
- $6,340,505 in cash and cash equivalents;
- $150,914 in accounts receivable;
- $1,035,966 in inventory;
- $47,247 in prepaid expenses and other;
- $3,202,611 in property and equipment; and
- $107,171 in intangible assets.
As at December 31, 2011, total liabilities were $1,641,641 and were comprised of:
- $235,716 in accounts payable;
- $352,428 in accrued liabilities; and
- $1,053,498 in derivative liabilities
Stockholders’ Equity increased by $11,757,415 from ($2,514,642), at December 31, 2010, to $9,242,773 at December 31, 2011.
Cash Flows from Operating Activities
The cash flows used in operations of continuing operations for the twelve-month period ended December 31, 2011, were ($5,323,521) compared with ($2,038,060) for the same period in 2010. Cash flows used in operations for the twelve-month period ended December 31, 2011, consisted primarily of a net loss of ($6,998,922) from continuing operations, offset by certain items, stock based compensation of $2,561,066 (2010 - $930,644), loss on foreign exchange on loans $nil (2010 -$71,990), fair value adjustment of derivative liability $566,070 (2010 – ($98,449)); an increase in accounts receivable ($120,088), (2010 - $19,274); and increase in inventory ($1,035,966), (2010 - $nil); decrease in accounts payable of $290,524 (2010 – $291,926), a decrease in customer deposits of ($125,000) (2009- $125,000); and an increase in accrued liabilities of $27,567 (2010 – ($22,102)).
Cash Flows from Investing Activities
The cash flows used in investing activities for the twelve-month period ended December 31, 2011, were ($3,242,076) compared to ($43,999) for the same period in 2010. Cash flows used in investing activities consisted of a purchase of property and equipment totaling ($3,180,390) in (2010 – ($31,084)) and the acquisition of trademarks and licenses totaling ($61,686) in (2010 – ($12,915)).
Cash Flows from Financing Activities
Cash flows provided by financing activities for the year ended December 31, 2011, totaled $15,183,460 versus $1,668,235 during the same period in 2010. The Company issued capital stock for proceeds of $16,340,405 (2010 - $1,668,235) made related party payments of $956,945, (2010 - $nil) and repaid notes payable $200,000 (2010 - $nil).
Effect of Exchange Rate
The effect of exchange rates on cash resulted in an unrealized loss of ($298,197) for the twelve months ended December 31, 2011, as compared with an unrealized loss of ($40,234) in the same period of 2010.
31
Discontinued Operations - HTNaturals
During fiscal 2009, we closed our apparel business, which operated under the brand name “HTnaturals”. The apparel business is classified as discontinued operations in our consolidated financial statements. We decided to close our apparel division to focus on our CRAiLAR® and CRAiLEXTM technology. The warehouse lease was not renewed, the sales team was terminated and all other elements of our apparel division were discontinued.
Plan of Operation
Because CRAiLAR® Fibers can be an ingredient in countless products, management believes that partnering with the largest, most successful brands, all of which are top of mind to the North American consumer, is the path to successful commercialization. The Company has signed development and supply agreements with some of the world’s largest fiber consuming companies such as Hanesbrands Inc, Levis Strauss & Co., Georgia-Pacific, and Target. Sustainability, risk mitigation, consumer satisfaction and product enhancement are all offered within the CRAiLAR® experience.
As we move forward to commercialization, our partners are not only successfully integrating our CRAiLAR® flax fiber within their biggest product categories, but as well, discovering benefits and enhancements which are exclusive to their developments, allowing the CRAiLAR® brand to evolve and grow, while servicing both the consumer and business needs.
In the near future, we will be working in tandem with our partners to extoll the virtues of CRAiLAR® through co-branding, ingredient call-outs, co-op marketing efforts, in-store signage, point of purchase and naturally, with links to the relevant social media networks and websites that have taken the communications world by storm. Our own presence and prosperity will grow in concert with the growth of our growers and business partners, allowing CRAiLAR® to be top of mind, similar to great ingredient brand successes such as Gore-Tex® and Intel®.
Partnerships and Industry Expertise
The Company has identified the Williamsburg County / Florence County regions of South Carolina as ideal region for growing winter flax crops.
As a result of identifying this geographical area as an ideal growing region, we incorporated a wholly owned subsidiary, Naturally Advanced Technologies, US Inc. The purpose of this subsidiary is to develop a US based flax fiber industry based around our CRAiLAR® fiber technology; from the contracting of crops through to the processing of the fiber.
Our first commercialization partner, Hanesbrands, is headquartered in North Carolina. Hanesbrands uses contract spinners located throughout the states of North and South Carolina. Therefore, being able to procure textile grade fiber in this region allows the Company to take advantage of strategic logistical opportunities.
We entered into a sub lease of a mid volume decortication facility located in Kingstree, South Carolina, in early August of 2010. The facility was originally established under a USDA flax initiative that failed to reach commercial viability. The equipment in this facility is designed to mechanically separate the flax fiber from the rest of the plant. This stage is called decortication. This is the first step of our process before it goes through our patented CRAiLAR® wet process. We have used this facility to prove out the viability of flax farming in this region, perfect our decortication process and to commence early volumes of CRAiLAR® fiber to our commercial partners. In August 2011, we took over the lease for a term of one year.
32
In addition to signing our joint development agreements with Hanesbrands and Georgia Pacific, we licensed a third party processor of natural fibers, Littlewoods Inc. of Philadelphia, to run interim scale quantities of up to 40,000 pounds per week of CRAiLAR® Fiber, to feed our commercialization scale up and additional market development plans, in denim, work wear, knit garments, domestic textiles and home furnishings. To support that strategy, we also licensed our first commercial spinner of CRAiLAR® Fiber yarns, Patrick Yarns of Kings Mountain, North Carolina. To date Patrick Yarns have shown CRAiLAR® Fiber at the Outdoor Retail Show, and are sampling fiber to customers in the above mentioned industries. In addition, they are capable of supporting our development partners with scale up quantities to commercialization, should they be called upon to do so.
In late January of 2012, we announced that we had signed our second yarn development partner, Tuscarora Yarns of Greensboro NC. Tuscarora are a highly innovative yarn spinner, capable of blending Crailar with fibers other than cotton, to broaden our market capabilities in performance sportswear, higher end fashion and outerwear. This is a strategic initiative that will add to the CRAiLAR® list of performance attributes, while strengthening our brand capabilities at the consumer interface.
PROCESS FLOW
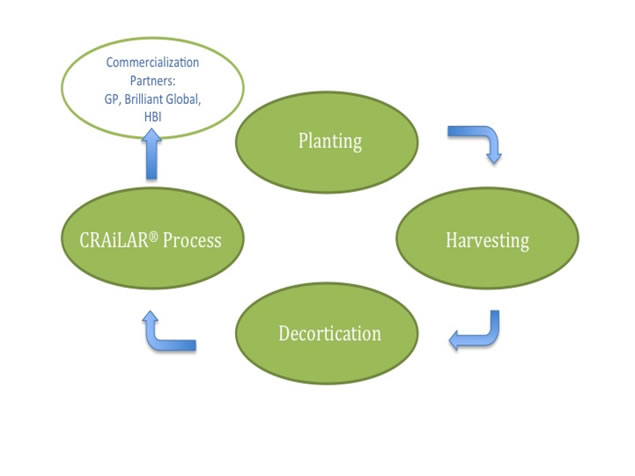
33
Agronomics Plan - USDA
We announced in January of 2011 that we had entered into growing trials with Hanesbrands and the USDA-ARS, further developing our agronomic know-how and our ability to produce fiber capable of being spun into finer-gauge yarns suitable for undergarments, shirting and finer-knit garments. These trials were designed to enable us to move to an unprecedented level of flax-fiber refinement by allowing us to develop flax strains capable of accessing all sectors of the industry. The research project has resulted in 200 acres of flax being planted in the Kingstree region this past winter. The trial crop was harvested in mid May and will dew ret in the fields before being baled and then entering the CRAiLAR® process. Summer crops such as cotton and soybeans will be planted in time for a full summer season proving the viability of flax as a winter rotation crop in the South East. We expect to contract significantly higher acreage for the 2011/2012 growing season. We have also identified other suitable North American growing regions, such as the Willamette Valley in Oregon, Southern Vermont, and growing regions in Michigan and Maine
In July 2011, we entered into an agreement with Carolina Eastern to provide agronomic consultation. Carolina Eastern will assist in the recruitment of growers and contractors and advise on all cultivation plans regarding flax. The Company has planted enough acres to produce roughly 5,000,000 lbs of CRAiLAR®. To assist on the recruitment of growers Carolina Eastern and the Company hosted a farm day in Kingstree, South Carolina in August of 2011, which was attended by approximately 90 growers interested in growing flax.
In March 2012, the Company appointed Mr. Steve Sandroni as Vice President of Agriculture. Mr. Sandroni brings more than 34 years of experience working in various aspects of agribusiness to the Company. Mr. Sandroni will oversee the Company’s global agricultural efforts. He will liase with farmers and hire regional support staff in all of the Companies growing regions.
PRODUCTION PLAN
With the completion of our financing in July 2011, we intend to install our first fully integrated CRAiLAR® Fiber processing facility in the Florence region of South Carolina. The company is finalizing the lease of an existing building in the region, for the housing of its first fully integrated decortication and enzyme treatment processing facility. Purchase orders plus deposits for the equipment needed to both decorticate and enzymatically process CRAiLAR® Fiber have been issued, and installation of that equipment in the new facility is expected to commence in the first quarter of 2012. The company expects the new facility to become operational in the 2nd quarter of 2012, and to ramp up production through 2012. At full capacity, the new facility will be capable of producing 620,000 pounds of CRAiLAR® Fiber per week. Feedstock will come from the prairies, the American Southeast, Northeast, Northwest and Europe.
In March 2012, we announced an improvement of our CRAiLAR® wet process time by 40 percent, therefore significantly increasing anticipated volume capabilities at planned facilities. The evaluation and resulting improvements were conducted internally in conjunction with research partners. The resulting changes encompass processes, as well as the utilization of industry standard equipment, including that which was purchased by the Company for its first production facility.
These reductions in overall cycle time increase throughput and production capacity in each planned facility. These efficiencies also allowed the Company to evaluate third-party manufacturers to increase overall production volume of CRAiLAR® Flax through a quicker expansion model.
As a result of this optimized process, we entered into an agreement with Tintoria Piana t to execute the CRAiLAR® enzymatic process, augmenting the Company’s plans for manufacturing capacity. The agreement calls for Tintoria to commence production in Q2 2012. Tintoria’s history in textiles dates to 1582 in Biella, Italy. The privately held, family-owned business has dyed fiber for the traditional apparel business for more than 60 years, and operates principally out of Cartersville, Georgia in North America. The Company believes that outsourced manufacturing allows for faster expansion of our technology proposition while significantly reducing the capital requirements to scale up to meet demand.
34
CRAILEX
Finally, the testing and evaluation of our CRAiLEXTM Advanced Materials pulping technology continues with a joint development agreement with Hercules Incorporated, a subsidiary of Ashland Inc.
CRAiLEXTM is the brand name for the purified pulp created from a patented process that is exclusively held by the Company. In recent tests, CRAiLEXTM has proven to exhibit higher-grade value pulps than other hard or soft-wood pulps. This is due to the unique cellular structure of bast fibers, namely hemp, and the less damaging CRAiLEXTM pulping process which preserves the fiber integrity. The pulps are used by Ashland to create its line of cellulosic products including ethers and additives for multiple industries. We would create market opportunities in the higher end cellulosic yarns market, which we plan to market to our growing roster of global apparel brands. We expect the completion of the final round of evaluation and testing of our dissolving pulp qualities to be confirmed by Ashland in Q1 of 2012, whereafter the structure of commercialization of the technology will become a key priority.
INTEGRATED PRODUCTION MODEL
CRAiLAR®and CRAiLEXTM production models integrate seamlessly at the agricultural and decortication level. The separation into the two distinctive patented manufacturing process thereafter creates the two unique opportunities in the natural fiber and dissolving pulp markets, with go to market strategies overlapping in the natural fiber and cellulosic yarn markets, along with composites and non-woven manufacturing. The additives and ethers market dominated by Ashland Inc, would potentially be controlled by Ashland in an integrated business venture with Ashland.
With the necessary strategic partnerships and management team in place the Company believes it is well positioned to execute its commercial roll out plan in 2012.
Note on Plan of Operation
While the Company expects that profitable operations will be achieved in the future, there can be no assurance that revenue, margins, and profitability will increase, or be sufficient to support operations over the long term. Management expects that the Company will need to raise additional capital to meet short and long-term operating requirements. Management believes that private placements of equity capital and debt financing may be adequate to fund the Company’s long-term operating requirements. Management may also encounter business endeavors that require significant cash commitments or unanticipated problems or expenses that could result in a requirement for additional cash. If the Company raises additional funds through the issuance of equity or convertible debt securities other than to current shareholders, the percentage ownership of current shareholders would be reduced, and such securities might have rights, preferences or privileges senior to the Company’s common stock. Additional financing may not be available upon acceptable terms, or at all. If adequate funds are not available or are not available on acceptable terms, the Company may not be able to take advantage of prospective business endeavors or opportunities, which could significantly and materially restrict business operations. Management is continuing to pursue external financing alternatives to improve the Company’s working capital position and to grow the business to the greatest possible extent.
MATERIAL COMMITMENTS
Production Equipment
At December 31, 2011, the Company had commitments of $5,024,744 (Euro 3,654,360) to purchase production equipment to begin commercial production of Crailar fiber. The Company intends to fulfill these commitments with a mixture of cash and debt.
35
Note Payable
At December 31, 2011, the Company owed $Nil (2010 - $200,000) on a note payable. On November 8, 2011, the total amount of $355,218 including the principal and all outstanding accrued interest was repaid in full.
Loan from Director
As at December 31, 2011, the Company owed $Nil, (2010 - $956,945) to a director of the Company. On July 12, 2011 the loan was repaid including all interest.
Annual Leases
The Company is committed to current annual lease payments totaling $280,570 for premises under lease. Approximate minimum lease payments over the remainder of the leases are as follows:
| $ | ||||||
| 2012 | 114,614 | |||||
| 2013 | 100,814 | |||||
| 2014 | 65,142 | |||||
| Total | 280,570 |
NRC Agreements
Collaboration Agreement
In October 2007, the Company entered into a joint collaboration agreement with the NRC to continue to develop a patentable enzyme technology for the processing of hemp fibres. The agreement was for three years and was set to expire on May 9, 2010. On February 19, 2010, the Company signed an amendment to the agreement which will now expire on May 9, 2012. The Company will continue its joint collaboration of enzyme technology with the NRC, however the research will refocus on cellulose technology for the production of lignocellulosic ethanol. The NRC is to be paid as it conducts work on the joint collaboration. There are no further costs or other off-balance sheet liabilities associated with the NRC agreement.
Over the term of the amended agreement, the Company will pay the NRC a total of $280,536 divided into nine payments up to May 9, 2012. As of the date of these statements all payments due in 2011($130,044) have been paid.
36
Technology License Agreement
On November 1, 2006, the Company entered into a technology license agreement with the NRC. The license agreement provides the Company a worldwide license to use and sublicense the NRC technology called CRAiLAR®. The Company paid an initial $20,525 (CDN $25,000) fee and will pay an ongoing royalty of 3% on sales of products derived from the CRAiLAR® process to the NRC with a minimum annual payment set at $14,750 (CDN$15,000) per year. During the year ended December 31, 2011 the Company paid $7,375 (CDN$7,500) and accrued $7,375 (CDN$7,500) of the minimum annual royalty.
Alberta Innovates – Technology Futures
In June 2007, the Company's subsidiary, Crailar Fiber Technologies Inc. ("CFT"), entered into a Master Agreement for Technology Development with the Alberta Research Council ("ARC") now know as Alberta Innovates-Technology Futures (“AITF”) (the "Technology Agreement") to further develop and commercialize bast fiber technology. The Technology Agreement is intended to act as an umbrella agreement for further bast fiber development planned to be performed by the AITF under separate Project Agreements. Under the terms of the Technology Agreement, commencing July 1, 2007, the Company will pay $20,525 (CDN $25,000) per quarter to the AITF and can terminate the agreement with 90 days notice, unless there are Project Agreements in effect, in which case this Technology Agreement shall expire when there are no longer any Project Agreements in effect. In addition to the above payments, CFT will be responsible for providing work-in-kind with a value of $20,525 (CDN $25,000) per calendar quarter commencing with the first Project Agreement. During 2011 the Company paid the ARC for specific tasks to further the development of AITF's Technology, the amount paid was $135,890 (2010-$7,991). Under the terms of the Project Agreements signed with AITF the Company will be entitled to an exclusive, worldwide, royalty-bearing license to use any new intellectual property developed pursuant to the Project Agreements. The royalty based on this option will be 3% of gross sales for the first $50,000,000 and 1.5% of gross sales on excess of $50,000,000. The Technology Agreement is in effect as long as there is an active Project Agreement.
Investor Relations Agreement
On August 9, 2011, the Company renewed the agreement for a firm to perform investor relations activities. The agreement term is one year with ninety days notice of termination by either party. The monthly fee is $10,000 with 70,000 stock options exercisable at $2.77 expiring August 19, 2016.The options were granted under the 2010 Option Stock Plan and were valued at $148,862 using the Black-Scholes option pricing model.
Research Agreement
Starting in December 2010, a co-operative research project designed to cultivate and evaluate the viability of various flax strains for use in CRAiLAR® technology was signed with the United States Department of Agriculture, HanesBrands and the Company. The project has an initial term of one year with a renewal option for two additional years. We will contribute annually $51,000 of in-kind expenses towards the project.
37
Farming and Consulting Agreements
During the year ended December 31, 2011, the Company signed agreements with farmers to plant and to produce flax using the seed provided by the Company. Flax straw and flaw seed harvested will be purchased by the Company at the agreed prices.
The Company signed a consulting agreement for identifying, securing and providing agronomic supports to farmers, and the Company will pay $6.50 per acre under successful cultivation.
OFF-BALANCE SHEET ARRANGEMENTS
As of the date of this Annual Report, we do have any off-balance sheet arrangements that have, or are reasonably likely to have, a current or future effect on our financial condition, changes in financial condition, revenues or expenses, results of operations, liquidity, capital expenditures or capital resources that are material to investors. The term “off-balance sheet arrangement” generally means any transaction, agreement or other contractual arrangement to which an entity unconsolidated with us is a party, under which we have any obligation arising under a guarantee contract, derivative instrument or variable interest; or a retained or contingent interest in assets transferred to such entity or similar arrangement that serves as credit, liquidity or market risk support for such assets.
RECENTLY ADOPTED ACCOUNTING PRONOUNCEMENTS
The Company has implemented all new accounting pronouncements that are in effect and that may impact its financial statements and does not believe that there are any other new accounting pronouncements that have been issued that might have a material impact on its financial position or results of operations.
SUBSEQUENT EVENTS
On February 15, 2012, we filed a registration statement on Form S-8 relating to a maximum of 8,124,240 shares of common stock, without par value, issuable directly by us under our 2011 Plan or pursuant to the exercise of options that have been or may be granted under the 2011 Plan
In February 2012, the Company appointed Mr. Scott Staff as a director of the Company and Mr. Gregg Wright as Vice President of Strategic Fiber Markets.
In March 2012, the Company appointed Mr. Steve Sandroni as Vice President of Agriculture.
Subsequent to December 31, 2011, the Company granted 125,000, five year common stock options to employees, exercisable at between $1.91 and $3.05 per share for an aggregate fair value of $210,136. These options were granted under the terms of the Company’s 2011 Fixed Share Option Plan.
Subsequent to December 31, 2011, 446,200 shares were issued pursuant to the exercise of stock options at prices between $0.87 and $1.12 per share for total proceeds of $469,895.
Subsequent to December 31, 2011, 275,000 shares were issued pursuant to the exercise of warrants at prices between $1.25 and $1.50 per share for total proceeds of $350,000.
Subsequent to December 31, 2011, the Company signed agreement to purchase production equipment for a total price of $241,038 (Euro 175,300) and the Company paid $48,208 (Euro 35,060) as deposits.
38
ITEM 7A. QUANTITATIVE AND QUALITATIVE DISCLOSURES ABOUT MARKET RISKS
Currency risk
Although the Company conducts its business principally in Canada, the majority of its purchases are made in U.S. currency. Additionally, the majority of the Company's debt is denominated in U.S. currency. The Company does not currently hedge its foreign currency exposure and accordingly is at risk for foreign currency exchange fluctuations.
Credit risk
Credit risk is managed by dealing with customers whose credit standing meets internally approved policies, and by ongoing monitoring of credit risk. The risk in cash accounts is managed through the use of a major financial institution which has high credit quality as determined by the rating agencies. As at December 31, 2011, the Company does not have significant concentrations of credit exposure.
Interest rate risk
All term debt has fixed interest rates and the Company has no significant exposure to interest rate fluctuation risk other than at renewal.
ITEM 8. FINANCIAL STATEMENTS AND SUPPLEMENTARY DATA
|
Report of Independent Registered Public Accounting Firm Dated March 19, 2012. |
|
|
|
Consolidated Balance Sheets as at December 31, 2011 and December 31, 2010. |
|
|
|
|
|
|
|
|
39

REPORT OF INDEPENDENT REGISTERED PUBLIC ACCOUNTING FIRM
To the Stockholders and Board of Directors of Naturally Advanced Technologies Inc.
Consolidated financial statements
We have audited the accompanying consolidated balance sheets of Naturally Advanced Technologies Inc. (a development stage company) as of December 31, 2011 and 2010 and the related consolidated statements of operations, cash flows and stockholders’ equity for the years then ended and the period from October 1, 2009 (date of re-entry into the development stage) to December 31, 2011. These financial statements are the responsibility of the Company’s management. Our responsibility is to express an opinion on these financial statements based on our audits.
We conducted our audits of the Company’s financial statements in accordance with the standards of the Public Company Accounting Oversight Board (United States). Those standards require that we plan and perform an audit to obtain reasonable assurance whether the financial statements are free of material misstatement. A financial statement also includes examining, on a test basis, evidence supporting the amounts and disclosures in the financial statements. A financial statement also includes assessing the accounting principles used and significant estimates made by management, as well as evaluating the overall financial statement presentation. We believe that our audits provide a reasonable basis for our opinion.
In our opinion, these consolidated financial statements present fairly, in all material respects, the financial position of Naturally Advanced Technologies Inc. as of December 31, 2011 and 2010 and the results of its operations and its cash flows for the years then ended and the period from October 1, 2009 (date of re-entry into the development stage) to December 31, 2011 in conformity with accounting principles generally accepted in the United States of America.
The accompanying consolidated financial statements have been prepared assuming that the Company will continue as a going concern. As discussed in Note 1 to the financial statements, the Company has incurred losses in developing its business, and further losses are anticipated in the future. The Company requires additional funds to meet its obligations and the costs of its operations and there is no assurance that additional financing can be raised when needed. These factors raise doubt about the Company’s ability to continue as a going concern. Management’s plans in this regard are described in Note 1. The financial statements do not include any adjustments that might result from the outcome of this uncertainty.
Internal control over financial reporting
We have also audited the Company’s internal control over financial reporting as at December 31, 2011, based on criteria established in Internal Control - Integrated Framework issued by the Committee of Sponsoring Organizations of the Treadway Commission (COSO). The Company’s management is responsible for maintaining effective internal control over financial reporting and for its assessment of the effectiveness of internal control over financial reporting, which is set out in Management’s Report on Internal Control Over Financial Reporting included in Management’s Discussion and Analysis. Our responsibility is to express an opinion on the effectiveness of the Company’s internal control over financial reporting based on our audit.
…cont’d

We conducted our audit of internal control over financial reporting in accordance with the standards of the Public Company Accounting Oversight Board (United States). Those standards require that we plan and perform the audit to obtain reasonable assurance about whether effective internal control over financial reporting was maintained in all material respects. An audit of internal control over financial reporting includes obtaining an understanding of internal control over financial reporting, assessing the risk that a material weakness exists, testing and evaluating the design and operating effectiveness of internal control based on the assessed risk, and performing such other procedures as we consider necessary in the circumstances. We believe that our audits provide a reasonable basis for our opinion.
A company’s internal control over financial reporting is a process designed to provide reasonable assurance regarding the reliability of financial reporting and the preparation of financial statements for external purposes in accordance with generally accepted accounting principles. A company’s internal control over financial reporting includes those policies and procedures that (i) pertain to the maintenance of records that, in reasonable detail, accurately and fairly reflect the transactions and dispositions of the assets of the company; (ii) provide reasonable assurance that transactions are recorded as necessary to permit preparation of financial statements in accordance with generally accepted accounting principles, and that receipts and expenditures of the company are being made only in accordance with authorizations of management and directors of the company; and (iii) provide reasonable assurance regarding prevention or timely detection of unauthorized acquisition, use, or disposition of the company’s assets that could have a material effect on the financial statements.
Because of its inherent limitations, internal control over financial reporting may not prevent or detect misstatements. Also, projections of any evaluation of effectiveness to future periods are subject to the risk that controls may become inadequate because of changes in conditions, or that the degree of compliance with the policies or procedures may deteriorate.
In our opinion, the Company maintained, in all material respects, effective internal control over financial reporting as at December 31, 2011 based on criteria established in Internal Control — Integrated Framework issued by the COSO.
“DMCL”
DALE MATHESON CARR-HILTON LABONTE LLP
CHARTERED ACCOUNTANTS
Vancouver, Canada
March 19, 2012
41
Naturally Advanced Technologies, Inc.
(A Development Stage Company)
Consolidated Balance
Sheets
(In US Dollars)
| December 31, | December 31, | |||||
| 2011 | 2010 | |||||
| ASSETS | ||||||
| Current | ||||||
| Cash and cash equivalents | $ | 6,340,505 | $ | 18,493 | ||
| Receivables | 150,914 | 30,826 | ||||
| Inventory (Note 4) | 1,035,966 | - | ||||
| Prepaid expenses and other | 47,247 | 74,946 | ||||
| Current assets of discontinued operations (Note 16) | - | 2,346 | ||||
| 7,574,632 | 126,611 | |||||
| Property and Equipment (Note 8) | 3,202,611 | 58,783 | ||||
| Intangible Assets (Note 9) | 107,171 | 73,500 | ||||
| $ | 10,884,414 | $ | 258,894 | |||
| LIABILITIES | ||||||
| Current | ||||||
| Accounts payable | $ | 235,715 | $ | 526,239 | ||
| Customer Deposits (Note 5) | - | 125,000 | ||||
| Accrued Liabilities | 352,428 | 324,861 | ||||
| Due to related party (Note 7) | - | 956,945 | ||||
| Note payable (Note 6) | - | 200,000 | ||||
| Derivative liability (Note 10) | 1,053,498 | 640,491 | ||||
| 1,641,641 | 2,773,536 | |||||
| Capital Stock (Note 11) | ||||||
| Authorized:
100,000,000 common shares without par
value Issued and outstanding : 41,701,604 common shares (December 31, 2010 - 35,313,202) |
27,428,844 | 10,778,742 | ||||
| Additional Paid-in Capital | 5,174,834 | 2,770,402 | ||||
| Accumulated Other Comprehensive Loss | (423,351 | ) | (125,154 | ) | ||
| Deficit | (11,485,251 | ) | (11,485,251 | ) | ||
| Deficit accumulated in the development stage | (11,452,303 | ) | (4,453,381 | ) | ||
| 9,242,773 | (2,514,642 | ) | ||||
| $ | 10,884,414 | $ | 258,894 | |||
| Commitments (Note 13) | ||||||
| Subsequent Events (Note 17) |
The accompanying notes are an integral part of these consolidated financial statements.
42
Naturally Advanced Technologies, Inc.
(A Development Stage Company)
Consolidated Statements of
Operations
(In US Dollars)
| Year ended December 31, | Cumulative | ||||||||
| from October | |||||||||
| 1, 2009 to | |||||||||
| December 31, | |||||||||
| 2011 | 2010 | 2011 | |||||||
| Expenses | |||||||||
| Advertising and promotion | 236,488 | 216,937 | 524,092 | ||||||
| Amortization and depreciation | 61,809 | 34,486 | 107,058 | ||||||
| Consulting and Contract Labour (Note 15) | 1,304,960 | 682,796 | 2,110,111 | ||||||
| General and Administrative | 605,837 | 352,996 | 1,136,031 | ||||||
| Interest | 96,975 | 161,990 | 297,007 | ||||||
| Professional Fees | 401,254 | 226,985 | 743,102 | ||||||
| Research and Development | 757,443 | 596,212 | 1,591,105 | ||||||
| Salaries and Benefits (Note 15) | 2,965,318 | 1,036,367 | 4,391,466 | ||||||
| - | - | ||||||||
| 6,430,084 | 3,308,769 | 10,899,972 | |||||||
| Loss before other items | (6,430,084 | ) | (3,308,769 | ) | (10,899,972 | ) | |||
| Other Items | |||||||||
| Other income | - | - | 1,177 | ||||||
| Write down of equipment | (2,768 | ) | (94,486 | ) | (97,254 | ) | |||
| Fair value adjustment of derivative liabilities (Note 10) | (566,070 | ) | 98,499 | (467,571 | ) | ||||
| Loss from continuing operations | (6,998,922 | ) | (3,304,756 | ) | (11,463,620 | ) | |||
| Profit from discontinued operations (Note 16) | - | 11,317 | 11,317 | ||||||
| Net loss for the period | $ | (6,998,922 | ) | $ | (3,293,439 | ) | $ | (11,452,303 | ) |
| Loss from continuing operations per share (basic and diluted) | $ | (0.18 | ) | $ | (0.10 | ) | |||
| Earnings from discontinued operations per share (basic and diluted) | $ | 0.00 | $ | 0.00 | |||||
| Weighted average number of common shares outstanding (basic and diluted) | 38,582,587 | 34,584,288 | |||||||
The accompanying notes are an integral part of these consolidated financial statements.
43
Naturally Advanced Technologies, Inc.
(A Development
Stage Company)
Consolidated Statements of Cash Flows
(In US Dollars)
| Cumulative from | |||||||||
| October 1, 2009 | |||||||||
| Year ended December 31, | to | ||||||||
| 2011 | 2010 | December 31, 2011 | |||||||
| Cash flows from (used in) operating activities | |||||||||
| Net loss from continuing operations for the period | $ | (6,998,922 | ) | $ | (3,304,756 | ) | (11,463,620 | ) | |
| Adjustments to reconcile net loss to net cash from operating activities | |||||||||
| Amortization and depreciation | 61,809 | 34,486 | 107,058 | ||||||
| Write down of equipment | 2,768 | 94,486 | 97,254 | ||||||
| Stock based compensation | 2,561,066 | 930,644 | 3,740,490 | ||||||
| (Gain) Loss on foreign exchange | - | (71,990 | ) | (71,990 | ) | ||||
| Fair value adjustment of derivative liability | 566,070 | (98,499 | ) | 467,571 | |||||
| Changes in working capital assets and liabilities | |||||||||
| Increase in accounts receivable | (120,088 | ) | (19,274 | ) | (73,967 | ) | |||
| (Increase) in inventory | (1,035,966 | ) | - | (1,035,966 | ) | ||||
| Decrease in prepaid expenses | 27,699 | (26,579 | ) | 22,878 | |||||
| (Decrease) Increase in accounts payable | (290,524 | ) | 291,926 | (102,146 | ) | ||||
| Increase in customer deposits | (125,000 | ) | 125,000 | - | |||||
| (Decrease) increase in accrued liabilities | 27,567 | (22,102 | ) | 222,739 | |||||
| Increase in due to related parties | - | 28,598 | 56,945 | ||||||
| Net cash used in operating activities of continuing operations | (5,323,521 | ) | (2,038,060 | ) | (8,032,754 | ) | |||
| Net cash provided by discontinued operations | 2,346 | 51,189 | 79,982 | ||||||
| Cash flows from (used in) investing activities | |||||||||
| Purchase of property and equipment | (3,180,390 | ) | (31,084 | ) | (3,219,477 | ) | |||
| Acquisition of trademarks and license | (61,686 | ) | (12,915 | ) | (74,601 | ) | |||
| Net cash flows used in investing activities | (3,242,076 | ) | (43,999 | ) | (3,294,078 | ) | |||
| Cash flows from (used in) financing activities | |||||||||
| Issuance of capital stock and warrants | 16,340,405 | 1,668,235 | 18,015,073 | ||||||
| Note payable | (200,000 | ) | - | (200,000 | ) | ||||
| Related party payments | (956,945 | ) | - | (1,025,960 | ) | ||||
| Net cash flows from financing activities | 15,183,460 | 1,668,235 | 16,789,113 | ||||||
| Effect of exchange rate changes on cash and cash equivalents | (298,197 | ) | (40,324 | ) | (255,205 | ) | |||
| Increase (decrease) in cash | 6,322,012 | (402,959 | ) | 5,287,058 | |||||
| Cash and cash equivalents, beginning of period | 18,493 | 421,452 | 1,053,447 | ||||||
44
| Cash and cash equivalents, end of period | $ | 6,340,505 | $ | 18,493 | $ | 6,340,505 | |||
| SUPPLEMENTAL CASH FLOW INFORMATION AND NON-CASH FINANCING AND INVESTING ACTIVITIES: | |||||||||
| Cash paid for interest | $ | 289,798 | $ | 84,252 | |||||
| Cash paid for income taxes | $ | - | $ | - | |||||
| Agent warrants issued as share issue costs | $ | 562,634 | $ | - |
The accompanying notes are an integral part of these consolidated financial statements.
45
Naturally Advanced Technologies Inc.
(A Development Stage Company)
Consolidated Statement of Stockholders' Equity
December 31, 2011
(In US Dollars)
| Accumulated | |||||||||||||||||||||
| Additional | other | Deficit | |||||||||||||||||||
| Common shares | paid-in | comprehensive | (Development | ||||||||||||||||||
| Shares | Amount | capital | income \ (loss) | Deficit | stage) | Total | |||||||||||||||
| $ | $ | $ | $ | $ | $ | ||||||||||||||||
| Balance, December 31, 2009 | 33,354,215 | 9,422,178 | 2,011,047 | (12,840 | ) | (11,485,251 | ) | (1,159,942 | ) | (1,224,808 | ) | ||||||||||
| - | |||||||||||||||||||||
| Issuance of common stock on January 12, 2010 for exercise of options at $0.80 per share | 3,700 | 2,960 | - | - | - | - | 2,960 | ||||||||||||||
| Issuance of common stock on January 27, 2010 for exercise of options at $0.80 per share | 2,800 | 2,240 | - | - | - | - | 2,240 | ||||||||||||||
| Issuance of common stock on February 4, 2010 for exercise of options at $0.80 per share | 6,300 | 5,040 | - | - | - | - | 5,040 | ||||||||||||||
| Issuance of common stock on February 23, 2010 for exercise of options at $0.80 per share | 3,075 | 2,460 | - | - | - | - | 2,460 | ||||||||||||||
| Issuance of common stock on March 5, 2010 for exercise of options at $0.37 per share | 25,000 | 9,250 | - | - | - | - | 9,250 | ||||||||||||||
| Issuance of common stock on March 11, 2010 for exercise of options at $0.50 per share | 10,000 | 5,000 | - | - | - | - | 5,000 | ||||||||||||||
| Issuance of common stock on March 15, 2010 for exercise of options at $0.50 per share | 10,000 | 5,000 | - | - | - | - | 5,000 | ||||||||||||||
| Issuance of common stock on March 23, 2010 for exercise of options at $0.50 per share | 20,000 | 10,000 | - | - | - | - | 10,000 | ||||||||||||||
| Issuance of common stock on March 23, 2010 for exercise of options at $0.50 per share | 10,000 | 5,000 | - | - | - | - | 5,000 | ||||||||||||||
| Issuance of common stock on March 23, 2010 for exercise of options at $0.50 per share | 10,000 | 5,000 | - | - | - | - | 5,000 | ||||||||||||||
| Issuance of common stock on March 29, 2010 for exercise of options at $0.80 per share | 1,750 | 1,400 | - | - | - | - | 1,400 | ||||||||||||||
| Issuance of common stock on April 13, 2010 for exercise of options at $0.80 per share | 25,000 | 20,000 | - | - | - | - | 20,000 | ||||||||||||||
| Issuance of common stock on April 29, 2010 for exercise of options at $0.50 per share | 48,000 | 24,000 | - | - | - | - | 24,000 | ||||||||||||||
| Issuance of common stock on May 5, 2010 for exercise of options at $0.50 per share | 24,000 | 12,000 | - | - | - | - | 12,000 | ||||||||||||||
| Issuance of common stock on May 7, 2010 for exercise of options at $0.50 per share | 68,000 | 34,000 | - | - | - | - | 34,000 | ||||||||||||||
| Issuance of common stock on May 13, 2010 for exercise of options at $0.50 per share | 50,000 | 25,000 | - | - | - | - | 25,000 | ||||||||||||||
| Issuance of common stock on May14, 2010 for exercise of options at $0.50 per share | 120,000 | 60,000 | - | - | - | - | 60,000 | ||||||||||||||
| Issuance of common stock on May 19, 2010 for cash - $1.00, net of share issue costs | 1,424,739 | 1,362,587 | - | - | - | - | 1,362,587 | ||||||||||||||
| Issuance of common stock on June 15, 2010 for exercise of options at $0.80 per share | 25,000 | 20,000 | - | - | - | - | 20,000 | ||||||||||||||
| Issuance of common stock on June 15, 2010 for exercise of options at $0.80 per share | 12,500 | 10,000 | - | - | - | - | 10,000 | ||||||||||||||
| Issuance of common stock on July 19, 2010 for exercise of options at $0.80 per share | 17,061 | 13,649 | - | - | - | - | 13,649 | ||||||||||||||
46
| Issuance of common stock on July 19, 2010 for exercise of options at $0.80 per share | 17,062 | 13,650 | - | - | - | - | 13,650 | ||||||||||||||
| Issuance of common stock on August 4, 2010 for exercise of options at $0.80 per share | 25,000 | 20,000 | - | - | - | - | 20,000 | ||||||||||||||
| Transfer addition paid-in capital for options exercised in the year | - | 171,289 | (171,289 | ) | - | - | - | - | |||||||||||||
| Stock-based compensation | - | - | 930,644 | - | - | - | 930,644 | ||||||||||||||
| Set up delivative liabilites for warrants granted in the year | - | (482,960 | ) | - | - | - | - | (482,960 | ) | ||||||||||||
| Foreign currency translation | - | - | - | (112,314 | ) | - | - | (112,314 | ) | ||||||||||||
| Loss from continuing operations | - | - | - | - | - | (3,304,756 | ) | (3,304,756 | ) | ||||||||||||
| Profit from discontinued operations | - | - | - | - | - | 11,317 | 11,317 | ||||||||||||||
| Balance, December 31, 2010 | 35,313,202 | 10,778,742 | 2,770,402 | (125,154 | ) | (11,485,251 | ) | (4,453,381 | ) | (2,514,642 | ) | ||||||||||
| Issuance of common stock on January 11, 2011 for exercise of options at US$0.87per share | 10,000 | 8,700 | - | - | - | - | 8,700 | ||||||||||||||
| Issuance of common stock on January 18, 2011 for exercise of options at US$1.15 per share | 60,000 | 69,000 | - | - | - | - | 69,000 | ||||||||||||||
| Issuance of common stock on January 27, 2011 for exercise of options at US$1.15 per share | 10,800 | 12,420 | - | - | - | - | 12,420 | ||||||||||||||
| Issuance of common stock on January 27, 2011 for exercise of options at US$0.87 per share | 1,775 | 1,544 | - | - | - | - | 1,544 | ||||||||||||||
| Issuance of common stock on January 31, 2011 for exercise of options at US$1.15 per share | 10,000 | 11,500 | - | - | - | - | 11,500 | ||||||||||||||
| Issuance of common stock on February 1, 2011 for exercise of options at US$1.15 per share | 10,000 | 11,500 | - | - | - | - | 11,500 | ||||||||||||||
| Issuance of common stock on February 1, 2011 for exercise of options at US$1.15 per share | 2,500 | 2,875 | - | - | - | - | 2,875 | ||||||||||||||
| Issuance of common stock on February 1, 2011 for exercise of options at US$0.87 per share | 2,500 | 2,175 | - | - | - | - | 2,175 | ||||||||||||||
| Issuance of common stock on February 10, 2011 for exercise of options at US$0.87 per share | 1,000 | 870 | - | - | - | - | 870 | ||||||||||||||
| Issuance of common stock on February 17, 2011 for exercise of options at US$1.12 per share | 25,000 | 28,000 | - | - | - | - | 28,000 | ||||||||||||||
| Issuance of common stock on February 24, 2011 for exercise of warrants at US$1.25 per share | 50,000 | 62,500 | - | - | - | - | 62,500 | ||||||||||||||
| Issuance of common stock on February 25, 2011 for exercise of options at US $0.87 per share | 5,750 | 5,003 | - | - | - | - | 5,003 | ||||||||||||||
| Issuance of common stock on March 8, 2011 for exercise of options at US$0.87 per share | 4,706 | 4,094 | - | - | - | - | 4,094 | ||||||||||||||
| Issuance of common stock on March 10, 2011 for exercise of warrants at US$1.25 per share | 25,000 | 31,250 | - | - | - | - | 31,250 | ||||||||||||||
| Issuance of common stock on March 16, 2011 for exercise of options at US$0.96 per share | 6,250 | 6,000 | - | - | - | - | 6,000 | ||||||||||||||
| Issuance of common stock on March 16, 2011 for exercise of options at US$1.12 per share | 18,750 | 21,000 | - | - | - | - | 21,000 | ||||||||||||||
| Issuance of common stock on March 22, 2011 for exercise of options at US$1.12 per share | 20,000 | 22,400 | - | - | - | - | 22,400 | ||||||||||||||
| Issuance of common stock on March 25, 2011 for exercise of options at US$0.87 per share | 4,000 | 3,480 | - | - | - | - | 3,480 | ||||||||||||||
| Issuance of common stock on March 28, 2011 for exercise of warrants at CAD $1.20 per share | 14,273 | 15,700 | - | - | - | - | 15,700 | ||||||||||||||
| Issuance of common stock on March 29, 2011 for exercise of options at US$0.96 per share | 320,000 | 307,200 | - | - | - | - | 307,200 | ||||||||||||||
| Issuance of common stock on March 30, 2011 for exercise of options at US$0.96 per share | 30,000 | 28,800 | - | - | - | - | 28,800 | ||||||||||||||
| Issuance of common stock on April 7, 2011 for exercise of warrants at CAD $1.50 per share | 2,000 | 2,760 | - | - | - | - | 2,760 | ||||||||||||||
| Issuance of common stock on April 8, 2011 for exercise of options at US$0.87 per share | 10,000 | 8,700 | - | - | - | - | 8,700 | ||||||||||||||
| Issuance of common stock on April 8, 2011 for exercise of options at $1.12 per share | 40,000 | 44,800 | - | - | - | - | 44,800 | ||||||||||||||
| Issuance of common stock on April 14, 2011 for exercise of options at US$1.12 per share | 30,000 | 33,600 | - | - | - | - | 33,600 | ||||||||||||||
| Issuance of common stock on April 14, 2011 for exercise of options at US$1.02 per share | 11,500 | 11,730 | - | - | - | - | 11,730 | ||||||||||||||
| Issuance of common stock on April 19, 2011 for exercise of options at US$0.87 per share | 5,000 | 4,350 | - | - | - | - | 4,350 |
47
| Issuance of common stock on April 19, 2011 for exercise of warrants at CDN $1.95 per share | 5,000 | 9,750 | - | - | - | - | 9,750 | ||||||||||||||
| Issuance of common stock on April 21, 2011 for exercise of options at US$1.12 per share | 36,000 | 40,320 | - | - | - | - | 40,320 | ||||||||||||||
| Issuance of common stock on April 25, 2011 for exercise of warrants at CAD $1.50 per share | 7,137 | 9,849 | - | - | - | - | 9,849 | ||||||||||||||
| Issuance of common stock on April 25, 2011 for exercise of warrants at US$1.25 per share | 25,000 | 31,250 | - | - | - | - | 31,250 | ||||||||||||||
| Issuance of common stock on April 28, 2011 for exercise of warrants at CDN $1.95 per share | 100,000 | 195,000 | - | - | - | - | 195,000 | ||||||||||||||
| Issuance of common stock on April 28, 2011 for exercise of options at US$1.12 per share | 50,000 | 56,000 | - | - | - | - | 56,000 | ||||||||||||||
| Issuance of common stock on May 2, 2011 for exercise of options at US$1.12 per share | 20,000 | 22,400 | - | - | - | - | 22,400 | ||||||||||||||
| Issuance of common stock on May 2, 2011 for exercise of options at US$1.12 per share | 20,000 | 22,400 | - | - | - | - | 22,400 | ||||||||||||||
| Issuance of common stock on May 2, 2011 for exercise of warrants at CDN $1.95 per share | 32,556 | 63,484 | - | - | - | - | 63,484 | ||||||||||||||
| Issuance of common stock on May 4, 2011 for exercise of warrants at CDN $1.95 per share | 18,708 | 36,480 | - | - | - | - | 36,480 | ||||||||||||||
| Issuance of common stock on May 4, 2011 for exercise of warrants at US $1.25 per share | 3,000 | 3,750 | - | - | - | - | 3,750 | ||||||||||||||
| Issuance of common stock on May 4, 2011 for exercise of warrants at US $1.25 per share | 50,000 | 62,500 | - | - | - | - | 62,500 | ||||||||||||||
| Issuance of common stock on May 5, 2011 for exercise of warrants at CDN $1.95 per share | 8,334 | 16,251 | - | - | - | - | 16,251 | ||||||||||||||
| Issuance of common stock on May 5, 2011 for exercise of options at US$1.12 per share | 1,000 | 1,120 | - | - | - | - | 1,120 | ||||||||||||||
| Issuance of common stock on May 9, 2011 for exercise of warrants at US $1.25 per share | 28,864 | 36,080 | - | - | - | - | 36,080 | ||||||||||||||
| Issuance of common stock on May 10, 2011 for exercise of warrants at CDN $1.95 per share | 5,000 | 9,750 | - | - | - | - | 9,750 | ||||||||||||||
| Issuance of common stock on May 12, 2011 for exercise of warrants at CDN $1.50 per share | 2,000 | 2,760 | - | - | - | - | 2,760 | ||||||||||||||
| Issuance of common stock on May 12, 2011 for exercise of warrants at CDN $1.95 per share | 70,593 | 137,656 | - | - | - | - | 137,656 | ||||||||||||||
| Issuance of common stock on May 17, 2011 for exercise of options at US$1.12 per share | 1,500 | 1,680 | - | - | - | - | 1,680 | ||||||||||||||
| Issuance of common stock on May 17, 2011 for exercise of warrants at CDN $1.95 per share | 5,556 | 10,834 | - | - | - | - | 10,834 | ||||||||||||||
| Issuance of common stock on May 19, 2011 for exercise of warrants at CDN $1.95 per share | 1,852 | 3,611 | - | - | - | - | 3,611 | ||||||||||||||
| Issuance of common stock on May 19, 2011 for exercise of options at US$1.12 per share | 1,200 | 1,344 | - | - | - | - | 1,344 | ||||||||||||||
| Issuance of common stock on May 24, 2011 for exercise of warrants at CDN $1.95 per share | 20,000 | 39,000 | - | - | - | - | 39,000 | ||||||||||||||
| Issuance of common stock on May 26, 2011 for exercise of warrants at CDN $1.20 per share | 34,960 | 38,456 | - | - | - | - | 38,456 | ||||||||||||||
| Issuance of common stock on May 26, 2011 for exercise of warrants at CDN 1.50 per share | 17,480 | 24,123 | - | - | - | - | 24,123 | ||||||||||||||
| Issuance of common stock on June 1 , 2011 for exercise of warrants at CDN 1.95 per share | 114,654 | 223,575 | - | - | - | - | 223,575 | ||||||||||||||
| Issuance of common stock on June 9, 2011 for exercise of options at US $1.02 per share | 9,000 | 9,180 | - | - | - | - | 9,180 | ||||||||||||||
| Issuance of common stock on June 10, 2011 for exercise of warrants at CDN 1.95 per share | 40,741 | 79,445 | - | - | - | - | 79,445 | ||||||||||||||
| Issuance of common stock on June 13, 2011 for exercise of warrants at CDN 1.95 per share | 30,558 | 59,588 | - | - | - | - | 59,588 | ||||||||||||||
| Issuance of common stock on June 16, 2011 for exercise of warrants at CDN 1.95 per share | 26,760 | 52,182 | - | - | - | - | 52,182 | ||||||||||||||
| Issuance of common stock on June 16, 2011 for exercise of warrants at CDN $1.50 per share | 5,000 | 6,900 | - | - | - | - | 6,900 | ||||||||||||||
| Issuance of common stock on June 23, 2011 for exercise of warrants at CDN $1.50 per share | 5,834 | 8,050 | - | - | - | - | 8,050 | ||||||||||||||
| Issuance of common stock on June 23, 2011 for exercise of warrants at CDN $1.95 per share | 16,852 | 32,861 | - | - | - | - | 32,861 | ||||||||||||||
| Issuance of common stock on June 28, 2011 for exercise of warrants at CDN $1.95 per share | 116,680 | 227,529 | - | - | - | - | 227,529 | ||||||||||||||
| Issuance of common stock on June 28, 2011 for exercise of warrants at CDN $1.95 per share | 56,704 | 110,573 | - | - | - | - | 110,573 | ||||||||||||||
| Issuance of common stock on July 4, 2011 for exercise of warrants at CDN $1.95 per share | 58,175 | 113,442 | - | - | - | - | 113,442 | ||||||||||||||
| Issuance of common stock on July 5, 2011 for exercise of options at US$1.12 per share | 6,500 | 7,280 | - | - | - | - | 7,280 |
48
| Issuance of common stock on July 5, 2011 for exercise of options at US$1.02 per share | 10,000 | 10,200 | - | - | - | - | 10,200 | ||||||||||||||
| Issuance of common stock on July 8, 2011 for cash $3.45 net of share issuance costs | 3,800,000 | 11,617,021 | 562,634 | - | - | - | 12,179,655 | ||||||||||||||
| Issuance of common stock on July 20, 2011 for exercise of warrants at CDN$3.45 per unit , net of commission | 212,500 | 729,622 | 18,386 | - | - | - | 748,008 | ||||||||||||||
| Issuance of common stock on July 25, 2011 for exercise of options at US$1.12 per share | 1,500 | 1,680 | - | - | - | - | 1,680 | ||||||||||||||
| Issuance of common stock on Sep 7, 2011 for exercise of options at US$1.12 per share | 2,500 | 2,800 | - | - | - | - | 2,800 | ||||||||||||||
| Issuance of common stock on Oct 14, 2011 for exercise of options at US$1.45 per share | 500,000 | 725,000 | - | - | - | - | 725,000 | ||||||||||||||
| Issuance of common stock on Oct 18, 2011 for exercise of options at US$0.87 per share | 20,000 | 17,400 | - | - | - | - | 17,400 | ||||||||||||||
| Issuance of common stock on Nov 2, 2011 for exercise of options at US$1.02 per share | 2,000 | 2,040 | - | - | - | - | 2,040 | ||||||||||||||
| Issuance of common stock on Nov 14, 2011 for exercise of options at US$1.12 per share | 3,750 | 4,200 | - | - | - | - | 4,200 | ||||||||||||||
| Issuance of common stock on Nov 14, 2011 for exercise of options at US$0.87 per share | 6,250 | 5,437 | - | - | - | - | 5,437 | ||||||||||||||
| Issuance of common stock on Nov 17, 2011 for exercise of options at US$1.12 per share | 2,000 | 2,240 | - | - | - | - | 2,240 | ||||||||||||||
| Issuance of common stock on Nov 25, 2011 for exercise of options at US$0.95 per share | 25,000 | 23,750 | - | - | - | - | 23,750 | ||||||||||||||
| Issuance of common stock on Dec 5, 2011 for exercise of options at US$0.87 per share | 10,000 | 8,700 | - | - | - | - | 8,700 | ||||||||||||||
| Issuance of common stock on Dec 15, 2011 for exercise of options at US$0.87 per share | 7,500 | 6,525 | - | - | - | - | 6,525 | ||||||||||||||
| Issuance of common stock on Dec 19, 2011 for exercise of options at US$1.12 per share | 1,400 | 1,568 | - | - | - | - | 1,568 | ||||||||||||||
| Transfer addition paid-in capital for options exercised in the year | - | 770,452 | (770,452 | ) | - | - | - | - | |||||||||||||
| Stock-based compensation | - | - | 2,561,066 | - | - | - | 2,561,066 | ||||||||||||||
| Transfer derivative liability for warrants exercised in the year | - | 153,063 | - | - | - | - | 153,063 | ||||||||||||||
| Proceeds from issue of warrants | - | - | 32,798 | - | - | - | 32,798 | ||||||||||||||
| Foreign currency translation | - | - | - | (298,197 | ) | - | - | (298,197 | ) | ||||||||||||
| Loss from continuing operations | - | - | - | - | - | (6,998,922 | ) | (6,998,922 | ) | ||||||||||||
| Balance, December 31, 2011 | 41,701,604 | 27,428,844 | 5,174,834 | (423,351 | ) | (11,485,251 | ) | (11,452,303 | ) | 9,242,773 |
The accompanying notes are an integral part of these consolidated financial statements.
49
NATURALLY ADVANCED TECHNOLOGIES INC.
(A
Development Stage Company)
NOTES TO CONSOLIDATED FINANCIAL STATEMENTS
DECEMBER 31, 2011
(In US Dollars)
1. Nature of Operations and Basis of Presentation
Naturally Advanced Technologies Inc. (the "Company") was incorporated in the Province of British Columbia, Canada, on October 6, 1998, and is in the business of technological development and of natural sustainable fibers. Effective October 1, 2009, the Company decided to exit the apparel business, which operated under the brand "HTnaturals". The apparel business is classified as discontinued operations in the Company's consolidated financial statements. As a result, the Company re-entered the development stage and plans to focus on its CRAiLAR® and CRAiLEXTM technology.
The Company's shares of common stock trade under the symbol "NAT.V", on the TSX Venture Exchange and under the symbol "NADVF", on the OTC Bulletin Board.
Going concern
The Company's consolidated financial statements are prepared using generally accepted accounting principles ("GAAP") in the United States of America applicable to a going concern, which contemplates the realization of assets and payment of liabilities in the normal course of business. The Company has incurred losses since inception of $ 23,937,554 and further losses are anticipated in the development of its business. There can be no assurance that the Company will be able to achieve or maintain profitability. Accordingly, these factors raise doubt as to the Company's ability to continue as a going concern.
During 2011 the Company raised $16,340,405 from equity funding for capacity expansion and working capital requirements. The Company may raise additional financing in 2012 through equity placements for future capacity expansion. However, there can be no assurance that capital will be available or, if the capital is available, that it will be on terms acceptable to the Company.
2. Significant Accounting Policies
a) Principles of Consolidation
The consolidated financial statements include the accounts of the Company and its wholly-owned subsidiaries, Naturally Advanced Technologies US Inc., a Nevada incorporated company; Hemptown USA, Inc., a Nevada incorporated company; 0697872 B.C. Ltd., a British Columbia incorporated company; Crailar Fiber Technologies Inc., a British Columbia incorporated company, and HTNaturals Apparel Corp, a British Columbia incorporated company. All inter-company transactions and account balances have been eliminated upon consolidation.
50
NATURALLY ADVANCED TECHNOLOGIES INC.
(A
Development Stage Company)
NOTES TO CONSOLIDATED FINANCIAL STATEMENTS
DECEMBER 31, 2011
(In US Dollars)
b) Cash and Cash Equivalents
Cash equivalents consist of cash on deposit and term deposits with original maturities of three months or less at the time of issuance. As at December 31, 2011, the Company held $10,000 (2010 - $10,000) is in cash equivalents.
c) Inventory
Inventory consist of flax seed purchased to be used for cultivation in the future and seed planted but not yet harvested. The seed is valued at the lower of cost or market and related growing cost is capitalized to inventory.
d) Use of Estimates
The preparation of financial statements in conformity with generally accepted accounting principles requires management to make estimates and assumptions that affect the reported amounts of assets and liabilities and disclosure of contingent assets and liabilities at the date of the financial statements and the reported amounts of revenues and expenses during the period. Actual results could differ from those estimates. Significant areas requiring management's estimates and assumptions are the fair value of transactions involving inventory costing, common stock, warrants, options, derivative liabilities, provision for income taxes, depreciation and financial instruments.
e) Property and Equipment
Property and equipment are stated at cost and are depreciated as follows:
| Computer equipment | 30% declining balance |
| Equipment | 30% declining balance |
| Furniture and fixtures | 20% declining balance |
| Production Equipment | 30% declining balance |
| Leasehold improvements | Term of lease |
f) Intangible Assets
Intangible assets are stated at cost and are amortized as follows:
| Trademarks | 5 year straight - line |
| License Fee | 10 year straight - line |
| Patent | 10 year straight – line |
51
NATURALLY ADVANCED TECHNOLOGIES INC.
(A
Development Stage Company)
NOTES TO CONSOLIDATED FINANCIAL STATEMENTS
DECEMBER 31, 2011
(In US Dollars)
g) Foreign Currency Translation
The Company's functional currency is Canadian dollars. The Company translates its financial statements to U.S. dollars using the following method:
All assets and liabilities are translated into U.S. dollars at the exchange rate in effect at the period-end. Revenues and expenses are translated throughout the period at the weighted average exchange rate. Exchange gains or losses from such translations are included in accumulated comprehensive income (loss), as a separate component of stockholders' equity.
Foreign currency transaction gains and losses are included in the results of operations.
h) Income Taxes
The Company utilizes the liability method of accounting for income taxes. Under the liability method, future income taxes are determined based on the temporary differences between the financial statement and tax bases of assets and liabilities using enacted tax rates. A valuation allowance is recorded when it is more likely than not that potential the future tax assets will not be realized.
i) Comprehensive Income
The Company presents changes in accumulated comprehensive income in its Statement of Stockholders' Equity (Deficit). Total comprehensive income includes, in addition to net loss, changes in equity that are excluded from the Statements of Operations.
j) Stock-based Compensation
The Company accounts for stock-based payment transactions in which an enterprise receives services in exchange for (a) equity instruments of the enterprise or (b) liabilities that are based on the fair value of the enterprise's equity instruments or that may be settled by the issuance of such equity instruments. The Company uses the Black-Scholes option-pricing model to establish the fair-value of stock-based awards.
k) Earnings (Loss) Per Share
Basic and diluted earnings (loss) per share is computed using the weighted average number of shares outstanding during the period. Common stock equivalents from stock options and warrants were excluded from the calculation of net loss per share for December 31, 2011, and 2010 as their effect is anti-dilutive.
52
NATURALLY ADVANCED TECHNOLOGIES INC.
(A
Development Stage Company)
NOTES TO CONSOLIDATED FINANCIAL STATEMENTS
DECEMBER 31, 2011
(In US Dollars)
l) Long-Lived Asset Impairment
Long-lived assets of the Company are reviewed when changes in circumstances suggest their carrying value has become impaired. Management considers assets to be impaired if the carrying value exceeds the estimated discounted future projected cash flows to result from the use of the asset and its eventual disposition. If impairment is deemed to exist, the assets will be written down to fair value. Fair value is generally determined using a hierarchy of fair value methodologies under GAAP, primarily based on a discounted cash flow analysis.
m) Risk Management
Currency risk. Although the Company conducts its business principally in Canada, the majority of its purchases are made in U.S. currency. Additionally, the majority of the Company's debt is denominated in U.S. currency. The Company does not currently hedge its foreign currency exposure and accordingly is at risk for foreign currency exchange fluctuations.
Credit risk. Credit risk is managed by dealing with customers whose credit standing meets internally approved policies, and by ongoing monitoring of credit risk. The credit risk in cash accounts is managed through the use of a major financial institution which has high credit quality as determined by the rating agencies. As at December 31, 2011, the Company does not have significant concentrations of credit exposure.
Interest rate risk. All term debt has fixed interest rates and the Company has no significant exposure to interest rate fluctuation risk.
n) Research and Development
Research and development costs are charged to operations as incurred.
o) Comparative figures
Certain of the comparative figures have been reclassified to conform to the current year's presentation.
p) Adoption of New Accounting Pronouncements
The Company has implemented all new accounting pronouncements that are in effect and that may impact its financial statements. Management does not believe that there are any other new accounting pronouncements that have been issued that might have a material impact on the financial statements of the Company.
53
NATURALLY ADVANCED TECHNOLOGIES INC.
(A
Development Stage Company)
NOTES TO CONSOLIDATED FINANCIAL STATEMENTS
DECEMBER 31, 2011
(In US Dollars)
3. Financial Instruments
As at December 31, 2011, the Company concluded that the carrying amount of cash and cash equivalents, receivables and accounts payable to approximate fair value because of the short maturity of these financial instruments.
4. Inventory
As at December 31, 2011, the inventory consists cost of flax seed planted and to be planted and no indirect costs has been capitalized.
5. Customer Deposit
During the year ended December 31, 2011, the Company received a deposit of $250,000 (2010 - $125,000). On December 19, 2011, the Company refunded the deposit net of $11,700 for goods that were delivered during 2011.
6. Note Payable
At December 31, 2011, the Company owed $Nil (2010 - $200,000) on a note payable. On November 8, 2011, the note was repaid including accrued interest of $164,544.
7. Due to Related Party
As at December 31, 2011, the Company owed $Nil, (2010 - $956,945) to a director of the Company. On July 12, 2011 the loan was repaid including accrued interest of $116,834.
54
NATURALLY ADVANCED TECHNOLOGIES INC.
(A
Development Stage Company)
NOTES TO CONSOLIDATED FINANCIAL STATEMENTS
DECEMBER 31, 2011
(In US Dollars)
8. Property and Equipment
| Net Book | ||||||||||||
| Net Book Value | Value | |||||||||||
| Accumulated | December 31, | December 31, | ||||||||||
| Cost | Depreciation | 2011 | 2010 | |||||||||
| Computer equipment | $ | 40,418 | $ | 18,832 | $ | 21,586 | $ | 7,612 | ||||
| Equipment | 40,308 | 8,084 | 32,224 | 28,664 | ||||||||
| Furniture and fixtures | 60,161 | 24,922 | 35,239 | 18,574 | ||||||||
| Leasehold improvements | 21,450 | 21,450 | - | 3,933 | ||||||||
| Production Equipment | 475,749 | 23,695 | 452,054 | - | ||||||||
| Production Equipment in construction | 2,661,508 | - | 2,661,508 | - | ||||||||
| $ | 3,299,594 | $ | 96,983 | $ | 3,202,611 | $ | 58,783 |
During the year, the Company signed agreements to purchase production equipment for a total price of $7,686,252 (Euro 5,590,815), which is payable in installments and due upon the achievement of certain milestones. Full payment is expected within 12 months after December 31, 2011. The Company paid $2,661,508 (Euro 1,935,642) as deposits. No amortization was taken in the year until the equipment are in operation.
During the year, the Company wrote off $2,768 (2010 - $Nil) of leasehold improvements and $Nil (2010 - $94,486) of equipment.
9. Intangible Assets
| Net Book Value | Net Book Value | |||||||||||
| Accumulated | December 31, | December 31, | ||||||||||
| Cost | Amortization | 2011 | 2010 | |||||||||
| Patents | $ | 101,087 | $ | 24,134 | $ | 76,953 | $ | 35,341 | ||||
| Trademarks | 97,623 | 78,640 | 18,983 | 24,110 | ||||||||
| License fee | 24,535 | 13,300 | 11,235 | 14,049 | ||||||||
| $ | 223,245 | $ | 116,074 | $ | 107,171 | $ | 73,500 |
55
NATURALLY ADVANCED TECHNOLOGIES INC.
(A
Development Stage Company)
NOTES TO CONSOLIDATED FINANCIAL STATEMENTS
DECEMBER 31, 2011
(In US Dollars)
10. Derivative liability
The derivate liability consist of warrants that were originally issued in private placements which have exercise prices denominated in a currency other than the Canadian dollar, the Company’s functional currency. The derivative liability is a non-cash liability and the Company is not required to expend any cash to settle this liability. The fair value of these warrants as at December 31, 2011 and 2010 is as follows:
| Exercise | 2011 | 2010 | |||||||
| price | |||||||||
| 736,223 warrants expiring on July 3, 2011 | US $ 1.95 | $ | - | $ | 55,923 | ||||
| 416,532 warrants expiring on Sept 21, 2012 | US $ 1.38 | 418,836 | 188,354 | ||||||
| 530,506 warrants expiring on May 19, 2013 | US $ 1.25 | 634,662 | 396,214 | ||||||
| $ | 1,053,498 | $ | 640,491 |
The fair value of these warrants was determined using the Black-Scholes option pricing model, using the following assumptions:
| 2011 | 2010 | |
| Volatility | 81% - 86% | 70% - 76% |
| Dividend yield | - | - |
| Risk-free interest rate | 0.12% | 0.19% - .61% |
| Expected life | 0.72 – 1.38 yrs | 0.50 yrs – 2.38 yrs |
56
NATURALLY ADVANCED TECHNOLOGIES INC.
(A
Development Stage Company)
NOTES TO CONSOLIDATED FINANCIAL STATEMENTS
DECEMBER 31, 2011
(In US Dollars)
11. Common Stock
During the period ended December 31, 2011, the Company issued 6,388,402 shares of common stock as follows:
| a) |
On July 8, 2011 the Company completed an offering of 3,800,000 units (the “Units”) of the Company at a price of $3.52 (CDN$3.45) per Unit for aggregate gross proceeds of $13,376,133 (CDN$13,110,000) (the “Offering”). Each Unit is comprised of one common share and one half of one common share purchase warrant of the Company (each whole common share purchase warrant, a “Warrant”). Each Warrant entitles the holder thereof to acquire one common share of the Company at an exercise price of $4.59 (CDN$4.50) per common share at any time prior to July 8, 2013. The fair value of the Warrants was estimated to be $2,107,462 using the Black Scholes option pricing model, a 2 year term, an expected volatility of 88% and a risk free interest rate of 1.20%. The fair value of the Warrants is included in share capital. The Warrants are exercisable in Canadian dollar only, which is the Company’s functional currency, and as a result they did not give rise to a derivate liability as described in Note 10. |
|
The Company granted to the syndicate of underwriters, an option (the “Over-Allotment Option”), exercisable in whole or in part at any time up to 30 days following the closing of the Offering, to purchase up to an additional 15% of the Offering solely to cover over- allotments. The Over-Allotment Option entitles the underwriter to purchase a maximum of 570,000 units (the “Over-Allotment Unit”) at the Offering price, and 285,000 warrants (the “Over-Allotment Warrant”) at $0.33 (CDN$0.32). The estimated fair value of the Over- Allotment Option was estimated to be $261,065 using the Black Scholes option pricing model using a 30-day term, an expected volatility of 61% and a risk free interest rate of 1.00%. The fair value of the Over-Allotment Option was recorded as share issue costs. Prior to the expiry of the Over-Allotment Option, the Underwriters purchased 212,500 Over-Allotment Unit for gross proceeds of $748,007 and 100,455 Over-Allotment Warrant for a gross proceed of $32,798. Each Over-Allotment Unit is comprised of one common share and one half of one common share purchase warrant of the Company. Each whole warrant entitles the holder thereof to acquire one common share of the Company at an exercise price of $4.59 (CDN$4.50) per common share at any time prior to July 8, 2013. The estimated fair value of the warrants is $129,074 using the Black Scholes option pricing model using a 2 year term, an expected volatility of 88% and a risk free interest rate of 1.20%. The fair value of the warrants is included in share capital. The gross proceed of the Over-Allotment Warrant is included in additional paid in capital. Each Over-Allotment Warrant entitles the holder to acquire one common share of the Company at an exercise price of $4.59 (CDN$4.50) per common share at any time prior to July 8, 2013. | |
|
The Company paid 6% of the gross proceeds of the offering as a cash commission. The cash commission and other expenses totaling of $1,196,478 was recorded as share issue costs. The Company also granted an option (the “Compensation Option”) equal to 6% of the Offering including the issue of Over-Allotment Units. The total 240,750 Compensation |
57
NATURALLY ADVANCED TECHNOLOGIES INC.
(A
Development Stage Company)
NOTES TO CONSOLIDATED FINANCIAL STATEMENTS
DECEMBER 31, 2011
(In US Dollars)
|
Option entitles the underwriter to purchase one unit (the “Compensation Unit”) for 24 months after closing of the Offering. Each Compensation unit includes one common share (the “Compensation Share”) and one half of one warrant (the “Compensation Warrant”). Each Compensation Warrant is exercisable for 24 months after closing at $4.59 (CDN$4.50) per warrant. The estimated fair value of the Compensation Options was estimated to be $319,956 using the Black Scholes option pricing model using a 2 year term, an expected volatility of 88% and a risk free interest rate of 1.20%. The fair value of the Over-Allotment Option was recorded as share issue costs. | |
| b) |
Total of 1,376,631 shares were issued pursuant to the exercise of employee and consultants options between $0.87 and $1.45 per share for proceeds of $1,623,005. Total of 1,245,731 options with total proceed of $1,483,521 were exercised by the directors and officers of the Company. |
|
| |
| c) |
Total of 910,587 shares issued pursuant to the exercise of warrants between $1.25 and $1.95 per share for proceeds of $1,648,440. |
|
| |
| d) |
Total of 39,451 shares issued pursuant to the exercise of agent’s warrants at $1.38 per share for proceeds of $ 54,442. |
|
| |
| e) |
Total of 49,233 units were issued pursuant to the exercise of agent’s warrants at $1.10 for proceeds of $ 54,156. Each agent’s unit consists of one common share and one half non- transferable common stock purchase warrant exercisable at $1.38 per share expiring September 2012. |
During the year ended December 31, 2010, the Company issued 1,958,987 shares of common stock as follows:
| a) |
During the year ended December 31, 2010, 534,248 shares were issued pursuant to the exercise of employee and consultants options between $0.37 and $0.80 per share for proceeds of $305,648. |
| b) |
During the year ended December 31, 2010, 1,424,739 units were issued at $1.00 per unit for gross proceeds of $1,424,739. |
|
Each unit consists of one common share and one-half of one share purchase warrant. Each whole warrant entitles the subscriber to acquire one additional common share of the Company at an exercise price of $1.25 per share up to and including May 19, 2013. The estimated fair value of the warrants is $482,960 using the Black Scholes option pricing model using a 3 year term, an expected volatility of 90% and a risk free interest rate of 1.37%. The fair value of the warrants are included in share capital. The Company paid a total $62,152 for agent commissions and other expenses which have been recorded as share issue costs. |
58
NATURALLY ADVANCED TECHNOLOGIES INC.
(A
Development Stage Company)
NOTES TO CONSOLIDATED FINANCIAL STATEMENTS
DECEMBER 31, 2011
(In US Dollars)
Warrants
Stock purchase warrants outstanding at December 31, 2011 are summarized as follows:
| Range of Exercise | Number of Shares | Weighted Average | ||
| Prices | Remaining | |||
| Contractual Life | ||||
| $1.10 - $4.59 | 3,294,219 | 1.35 years |
A summary of the Company’s stock purchase warrants are as follows:
| Weighted- | ||||||
| Shares | Average | |||||
| Exercise Price | ||||||
| Warrants outstanding at December 31, 2009 | 1,319,790 | 1.70 | ||||
| Warrants granted during the year | 712,370 | 1.25 | ||||
| Warrants expired during the year | (103,242 | ) | 1.42 | |||
| Warrants outstanding at December 31, 2010 | 1,928,918 | 1.54 | ||||
| Warrants granted during the year | 3,227,072 | 3.92 | ||||
| Warrants expired during the year | (549,545 | ) | 2.43 | |||
| Warrants exercised during the year | (1,312,226 | ) | 1.93 | |||
| Warrants outstanding at December 31, 2011 | 3,294,219 | $ | 3.57 |
59
NATURALLY ADVANCED TECHNOLOGIES INC.
(A
Development Stage Company)
NOTES TO CONSOLIDATED FINANCIAL STATEMENTS
DECEMBER 31, 2011
(In US Dollars)
12. Stock Options
2011 Fixed Share Option Plan
In September 2011, the Company's Board of Directors approved the 2011 Fixed Share Option Plan (the "2011 Plan"), a non-shareholder approved plan for grants of stock options to directors, officers, employees, eligible consultants of the Company and any related company. Based on the terms of the individual option grants, options granted under the 2011 Plan generally expire three to ten years after the grant date and become exercisable over a period of one year, based on continued employment, either with monthly vesting or upon achievement of predetermined deliverables. The 2011 Plan permits the granting of incentive stock options and nonqualified stock options up to an aggregate at any point in time of 8,224,240 shares.
The fair value of options issued during the year ended December 31, 2011 was determined using the Black-Scholes option pricing model with the following assumptions:
| Year ended | |
| December 31, 2011 | |
| Risk-free interest rates | 1.08% |
| Volatility factor | 87.70% |
| Expected life of options, in years | 5 |
| Weighted average fair value of options granted | $1.47 |
During the year ended December 31, 2011, the Company granted a total of 50,000, common stock options to directors, officers, employees, eligible consultants, exercisable at $2.18 per share, with a term of five years with an estimated fair value of $73,486. During the year ended December 31, 2011, 8,333 options vested. Total expense of $12,248 was charged to Salaries and Benefits expense.
2010 Fixed Share Option Plan
In September 2010, the Company’s Board of Directors approved the 2010 Fixed Share Option Plan (the “2010 Plan”), a non-shareholder approved plan for grants of stock options to directors, officers, employees, eligible consultants of the Company and any related company. Based on the terms of the individual option grants, options granted under the 2010 Plan generally expire three to ten years after the grant date and become exercisable over a period of one year, based on continued employment, either with monthly vesting or upon achievement of predetermined deliverables. The 2010 Plan permits the granting of incentive stock options and nonqualified stock options up to an aggregate at any point in time of 7,057,640 shares.
60
NATURALLY ADVANCED TECHNOLOGIES INC.
(A
Development Stage Company)
NOTES TO CONSOLIDATED FINANCIAL STATEMENTS
DECEMBER 31, 2011
(In US Dollars)
The fair value of options issued during the year ended December 31, 2011 was determined using the Black-Scholes option pricing model with the following assumptions:
| Year ended | Year ended | |
| December 31, 2011 | December 31, 2010 | |
| Risk-free interest rates | 0.90% to 1.56% | 1.56% |
| Volatility factor | 85% to 91% | 68% |
| Expected life of options, in years | 5 | 3-5 |
| Weighted average fair value of options granted | $1.72 | $0.50 |
During the year ended December 31, 2011, the Company granted a total of 1,720,000, common stock options to directors, officers, employees, eligible consultants, exercisable between $1.55 - $2.77 per share, with a term of five years with an estimated fair value of $ 2,966,692.
During the year ended December 31, 2011, 1,752,206 (2010 – 47,918) options vested. Total expense of $2,548,818 (2010 - $24,196) was recorded as stock-based compensation, $976,168 (2010 - $2,319) was included in Consulting and contract labour expense and $1,572,650 (2010 - $21,877) was included in Salaries and benefits expense.
During the year ended December 31, 2011, 1,376,631, options were exercised and a total of $770,452 has been reclassified from additional paid-in capital to capital stock.
2008 Fixed Share Option Plan
Under the 2008 Stock Option Plan, Nil (2010 - 825,409) options vested. Total expense of $Nil (2010 - $906,448) was recorded as stock-based compensation, $Nil (2010- $441,725) was included in Consulting and contract labour expense, $Nil (2010 - $464,723) was included in Salaries and Benefits expense.
During the year ended December 31, 2011, Nil (2010 - 534,248) options were exercised and a total of $Nil (2010 - $171,289) has been reclassified from additional paid-up capital to capital stock.
61
NATURALLY ADVANCED TECHNOLOGIES INC.
(A
Development Stage Company)
NOTES TO CONSOLIDATED FINANCIAL STATEMENTS
DECEMBER 31, 2011
(In US Dollars)
A summary of the Company's stock options are as follows:
| Weighted-Average | ||||||
| Shares | Exercise Price | |||||
| Options outstanding, December 31, 2009 | 4,724,125 | $ | 1.01 | |||
| Options exercised during the year | (534,248 | ) | 0.57 | |||
| Options granted during the year | 2,563,377 | 0.93 | ||||
| Options expired during the year | (1,313,377 | ) | 0.80 | |||
| Options cancelled during the year | (100,000 | ) | 1.25 | |||
| Options outstanding, December 31, 2010 | 5,339,877 | 1.08 | ||||
| Options exercised during the year | (1,376,631 | ) | 1.18 | |||
| Options granted during the year | 1,770,000 | 2.39 | ||||
| Options expired during the year | (435,200 | ) | 1.15 | |||
| Options cancelled during the year | (7,076 | ) | 2.10 | |||
| Options outstanding, December 31, 2011 | 5,290,970 | $ | 1.48 |
| December 31, 2011 | |||||
| Options Outstanding | Options Exercisable | ||||
| Weighted | |||||
| Average | Weighted | Weighted | |||
| Range of | Remaining | Average | Average | ||
| Exercise | Number | Contractual | Exercise | Number | Exercise |
| Prices | Outstanding | Life (yr) | Price | Exercisable | Price |
| $0.87 - $2.77 | 5, 290,970 | 3.50 | $1.48 | 3,444,445 | $1.27 |
| December 31, 2010 | |||||
| Options Outstanding | Options Exercisable | ||||
| Weighted | |||||
| Average | Weighted | Weighted | |||
| Range of | Remaining | Average | Average | ||
| Exercise | Number | Contractual | Exercise | Number | Exercise |
| Prices | Outstanding | Life (yr) | Price | Exercisable | Price |
| $0.87 - $1.45 | 5,339,877 | 3.20 | $1.08 | 1,992,255 | $1.14 |
62
NATURALLY ADVANCED TECHNOLOGIES INC.
(A
Development Stage Company)
NOTES TO CONSOLIDATED FINANCIAL STATEMENTS
DECEMBER 31, 2011
(In US Dollars)
13. Commitments
a) Leases
The Company is committed to lease payments totaling $280,570 for premises under lease. The minimum lease payments over the remainder of the leases are as follows:
| 2012 | 114,614 | |||||
| 2013 | 100,814 | |||||
| 2014 | 65,142 | |||||
| Total | 280,570 |
b) National Research Council of Canada ("NRC")
Joint Collaboration Agreement
In October 2007, the Company entered into a joint collaboration agreement with the NRC to continue to develop a patentable enzyme technology for the processing of hemp fibers. The agreement was for three years and expired on May 9, 2010. On February 19, 2010, the Company signed an amendment to the agreement to extend expiry to May 9, 2012. The Company intends to continue its joint collaboration of enzyme technology with the NRC, however the research will refocus on cellulose technology for the production of lignocellulosic ethanol. The NRC is to be paid as it conducts work on the joint collaboration. There are no further costs or other off-balance sheet liabilities associated with the NRC agreement.
Over the term of the amended agreement, the Company will pay the NRC a total of $280,536 (CDN$294,822) divided into nine payments up to May 9, 2012. As of the date of these statements all payments due in 2011($130,044) have been paid.
Technology License Agreement
On November 1, 2006, the Company entered into a technology license agreement with the NRC. The license agreement provides the Company a worldwide license to use and sublicense the NRC technology called CRAiLAR®. The Company paid an initial $20,525 (CDN $25,000) fee and will pay an ongoing royalty of 3% on sales of products derived from the CRAiLAR® process to the NRC with a minimum annual payment set at $14,750 (CDN$15,000) per year in two installments. During the year ended December 31, 2011 the Company paid $7,375 (CDN$7,500) and accrued $7,375 (CDN$7,500) of the minimum annual royalty.
63
NATURALLY ADVANCED TECHNOLOGIES INC.
(A
Development Stage Company)
NOTES TO CONSOLIDATED FINANCIAL STATEMENTS
DECEMBER 31, 2011
(In US Dollars)
c) Alberta Innovates – Technology Futures (“AITF”)
In June 2007, the Company's subsidiary, Crailar Fiber Technologies Inc. ("CFT"), entered into a Master Agreement for Technology Development with the Alberta Research Council ("ARC") now know as Alberta Innovates-Technology Futures (“AITF”) (the "Technology Agreement") to further develop and commercialize bast fiber technology. The Technology Agreement is intended to act as an umbrella agreement for further bast fiber development planned to be performed by AITF under separate Project Agreements. Under the terms of the Technology Agreement, commencing July 1, 2007, the Company will pay $20,525 (CDN $25,000) per quarter to AITF and can terminate the agreement with 90 days notice, unless there are Project Agreements in effect, in which case this Technology Agreement shall expire when there are no longer any Project Agreements in effect. In addition to the above payments, CFT will be responsible for providing work-in-kind with a value of $20,525 (CDN $25,000) per calendar quarter commencing with the first Project Agreement. During 2011 the Company paid the ARC for specific tasks to further the development of AITF's Technology, the amount paid was $135,890 (2010-$7,991). Under the terms of the Project Agreements signed with AITF the Company will be entitled to an exclusive, worldwide, royalty-bearing license to use any new intellectual property developed pursuant to the Project Agreements. The royalty based on this option will be 3% of gross sales for the first $50,000,000 and 1.5% of gross sales on excess of $50,000,000. The Technology Agreement is in effect as long as there is an active Project Agreement.
d) Investor Relations Agreement
On August 9, 2011, the Company renewed the agreement for a third party firm to perform investor relations activities. The agreement term is one year with ninety days notice of termination by either party. The monthly fee is $10,000 with 70,000 stock options exercisable at $2.77 expiring August 19, 2016. The options were granted under the 2010 Option Stock Plan and were valued at $148,862 using the Black-Scholes option pricing model with the assumptions disclosed in Note 12.
64
NATURALLY ADVANCED TECHNOLOGIES INC.
(A
Development Stage Company)
NOTES TO CONSOLIDATED FINANCIAL STATEMENTS
DECEMBER 31, 2011
(In US Dollars)
e) Research Agreement
Starting in December 2010, a co-operative research project designed to cultivate and evaluate the viability of various flax strains for use in CRAiLAR® technology was signed with the United States Department of Agriculture , HanesBrands and Naturally Advanced Technologies US Inc. The project has an initial term of one year with a renewal option for two additional years. Naturally Advanced Technologies US Inc will contribute annually $51,000 of in-kind expenses towards the project.
f) Farming and Consulting Agreements
During the year ended December 31, 2011, the Company signed agreements with farmers to plant and to produce flax using the seed provided by the Company. Flax straw and flaw seed harvested will be purchased by the Company at the agreed prices. Subsequent to the year end, the Company paid an advance totaling $161,420 to the farmers who had signed the agreement after an assessment of their flax crop was made by the Company.
The Company signed a consulting agreement with impendent consultant for indentifying, securing and providing agronomic supports to farmers, and the Company will pay $6.50 per acre under successful cultivation.
14. Income Taxes
As at December 31, 2011, the Company has estimated tax loss carry forwards for tax purposes of approximately $15,356,000 (2010 - $12,141,000) which expire between 2015 and 2031. This amount may be applied against future federal taxable income. Management has determined that the realization of the potential deferred tax assets resulting from these tax pools and other temporary differences is uncertain at this time, and cannot be viewed as more likely than not. Accordingly, the Company has recorded a full valuation allowance for the potential deferred tax asset.
65
NATURALLY ADVANCED TECHNOLOGIES INC.
(A
Development Stage Company)
NOTES TO CONSOLIDATED FINANCIAL STATEMENTS
DECEMBER 31, 2011
(In US Dollars)
The reported income taxes differ from the amounts obtained by applying statutory rates to the loss before income taxes as follows:
| 2011 | 2010 | |||||
| Loss before income taxes | $ | 6,998,922 | $ | 3,293,439 | ||
| Corporate tax rate | 27.31% | 28.50% | ||||
| Expected income tax recovery | (1,911,117 | ) | (938,630 | ) | ||
| Increase (Decrease) resulting from: | ||||||
| Permanent differences and others | 831,044 | 257,569 | ||||
| Effect on share issue costs recognized | (307,371 | ) | (17,713 | ) | ||
| Change in valuation allowance | 1,306,095 | 815,004 | ||||
| Impact of foreign exchange changes | 20,850 | (231,877 | ) | |||
| Impact of tax rate changes | 60,499 | 115,647 | ||||
| Future income tax recovery | $ | - | $ | - |
The tax effects of temporary differences that give rise to the Company's future tax assets and (liability) are as follows:
| 2011 | 2010 | |||||
| Property and equipment | $ | 69,945 | $ | 53,667 | ||
| Intangible assets | (4,611 | ) | (7,553 | ) | ||
| Research and development costs | 603,622 | 401,776 | ||||
| Share issue costs | 248,042 | 36,007 | ||||
| Loss carry forwards | 3,908,068 | 3,035,074 | ||||
| 4,825,066 | 3,518,971 | |||||
| Valuation allowance | (4,825,066 | ) | (3,518,971 | ) | ||
| $ | - | $ | - |
As the criteria for recognizing future income tax assets have not been met due to the uncertainty of realization, a valuation allowance of 100% has been recorded for the current and prior year.
66
NATURALLY ADVANCED TECHNOLOGIES INC.
(A
Development Stage Company)
NOTES TO CONSOLIDATED FINANCIAL STATEMENTS
DECEMBER 31, 2011
(In US Dollars)
The Company's non-capital losses, which can be applied to reduce future taxable income, expire as follows:
| Year of Expiry | Amount | ||
| 2014 | $ | 1,037,000 | |
| 2015 | 1,172,000 | ||
| 2026 | 1,570,000 | ||
| 2027 | 1,408,000 | ||
| 2028 | 2,263,000 | ||
| 2029 | 2,875,000 | ||
| 2030 | 1,734,000 | ||
| 2031 | 3,297,000 | ||
| $ | 15,356,000 |
15. Related Party Transactions
During the year ended December 31, 2011, $1,274,505 (2010 - $624,310) was incurred as remuneration to officers and directors of the Company. Of this amount, $1,103,503 (2010 - $441,310) is recorded as Salaries and Benefits expense and $171,000 (2010 - $183,000) is recorded as Consulting and Contract labour expense. During the year ended December 31, 2011, $2,243,274 (2010 - $788,534) was recorded as stock-based compensation to officers and directors of the Company. Of this amount, $1,269,236 (2010 - $472,859) is recorded as Salaries and Benefits expense and $1,006,810 (2010 - $315,675) is recorded as Consulting and Contract labour expense.
67
NATURALLY ADVANCED TECHNOLOGIES INC.
(A
Development Stage Company)
NOTES TO CONSOLIDATED FINANCIAL STATEMENTS
DECEMBER 31, 2011
(In US Dollars)
16. Discontinued Operations
During fiscal 2009 the Company decided to discontinue the apparel business to focus on developing its bast fiber technology. The Company did not renew its warehouse lease which expired in 2009 and no longer has sales staff or any selling expenses.
The following table summaries the operating results of the discontinued operations for the fiscal year ended December 31:
| 2011 | 2010 | |||||
| Revenue | $ | - | $ | 53,470 | ||
| Expenses | - | 42,153 | ||||
| Profit (loss) from discontinued operations | $ | - | $ | 11,317 |
The following table sets forth the assets and liabilities of the discontinued operations:
| 2011 | 2010 | |||||
| Accounts receivable, net | $ | - | $ | 2,346 | ||
| Inventories, net | - | - | ||||
| Current assets of discontinued operations | $ | - | $ | 2,346 |
17. Subsequent Events
| a) |
Subsequent to December 31, 2011, the Company granted 125,000, five year common stock options to employees, exercisable at between $1.91 and $3.05 per share for an aggregate fair value of $210,136. These options were granted under the terms of the Company’s 2011 Fixed Share Option Plan. |
| b) |
Subsequent to December 31, 2011, 446,200 shares were issued pursuant to the exercise of stock options at prices between $0.87 and $1.12 per share for total proceeds of $469,895. |
| c) |
Subsequent to December 31, 2011, 275,000 shares were issued pursuant to the exercise of warrants at $1.50 for total proceeds of $ 350,000. |
| d) |
Subsequent to December 31, 2011, the Company signed agreement to purchase production equipment for a total price of $241,038 (Euro 175,300) and the Company paid $48,208 (Euro 35,060) as deposits. The amount is expected to be fully paid before the end of 2012. |
68
ITEM 9. CHANGES IN AND DISAGREEMENTS WITH ACCOUNTANTS ON ACCOUNTING AND FINANCIAL DISCLOSURE
Not applicable.
ITEM 9A. CONTROLS AND PROCEDURES
Disclosure Controls and Procedures
Kenneth Barker, our Chief Executive Officer, and Guy Prevost, our Chief Financial Officer, have evaluated the effectiveness of our disclosure controls and procedures (as defined in Rule 13a-15(e) of the Exchange Act) as of the end of the period covered by this Annual Report. Based on that evaluation, they concluded that our disclosure controls and procedures were effective as of December 31, 2011.
Management’s Annual Report on Internal Control over Financial Reporting
Our management is responsible for establishing and maintaining adequate internal control over financial reporting, as defined in Rules 13a-15(f) under the Exchange Act.
Management assessed the effectiveness of our internal control over financial reporting based on criteria for effective internal control over financial reporting described in Internal Control-Integrated Framework issued by the Committee of Sponsoring Organizations of the Treadway Commission. Based on its assessment, management concluded that we maintained effective internal control over financial reporting as of December 31, 2011.
The independent registered public accounting firm that audited the financial statements has issued an attestation report on our internal control over financial reporting which has been included in the financial statements.
We will continue to monitor and evaluate the effectiveness of our internal controls and procedures over financial reporting on an ongoing basis and are committed to taking further action by implementing additional enhancements or improvements, or deploying additional human resources as may be deemed necessary.
Changes in Internal Control over Financial Reporting
There were no changes to our internal control over financial reporting that occurred during the last quarter of our fiscal year ended December 31, 2011, that have materially affected, or are reasonably likely to materially affect, our internal control over financial reporting.
ITEM 9B. OTHER INFORMATION
Not applicable.
69
PART III
ITEM 10. DIRECTORS, EXECUTIVE OFFICERS AND CORPORATE GOVERNANCE
Directors and Executive Officers
All of our directors hold office until the next annual general meeting of the shareholders or until their successors are elected and qualified. Our officers are appointed by our board of directors and hold office until their earlier death, retirement, resignation or removal.
Our directors and executive officers, their ages, positions held are as follows:
| Name | Age | Position with the Company |
| Kenneth C. Barker | 55 | Chief Executive Officer and a Director |
| Jason Finnis | 40 | President/Chief Innovation Officer and a Director |
| Larisa Harrison | 39 | Chief Administration Officer and Secretary/Treasurer and a Director |
| Guy Prevost | 53 | Chief Financial Officer and a Director |
| Thomas C. Robinson | 50 | Chief Operating Officer |
| Jay Nalbach | 40 | Chief Marketing Officer |
| Robert Edmunds | 53 | Director |
| Peter C. Moore | 68 | Director |
| Miljenko Horvat | 51 | Director |
| Jeremy Jones | 57 | Director |
| Scott Staff | 46 | Director |
The following is a brief account of the education and business experience of each director, executive officer and key employee during at least the past five years, indicating each person’s principal occupation during the period, and the name and principal business of the organization by which he or she was employed, and including other directorships held in reporting companies.
70
Kenneth C. Barker, Portland, Oregon. Mr. Barker has been our Chief Executive Officer since August 24, 2006, and a member of our Board of Directors since February 6, 2006. Mr. Barker has over twenty years of apparel experience, including merchandising, sourcing and full profit and loss responsibility, public market experience and corporate governance. Mr. Barker is currently a co-president of The Meriwether Group, Inc. of Portland, Oregon, which is a corporate investment and business acceleration firm. From approximately October 2003 through April 2005, Mr. Barker was the head of apparel for the North American region for adidas International, where he was responsible for all strategic product and marketing functions within the region. His duties also included providing overall apparel direction and strategy for the adidas North American apparel business, creation of the global brand vision of apparel, and being responsible for sales delivery and brand strategy in the North American marketplace. From approximately January 2001 to October 2003, Mr. Barker was the director of apparel for adidas America, where he was responsible for overall profit and loss for the entire apparel business in the United States. Mr. Barker also previously worked for Adidas Canada Limited in Toronto, Canada and Levi Strauss & Co. The Board of Directors has concluded that Mr. Barker should serve as a director given his significant experience in the apparel business over the past twenty years as well as his involvement with our Company since 2006.
Jason Finnis, Vancouver, British Columbia. Mr. Finnis has been a member of the Board of Directors and our President since December 15, 2000, Chief Innovation Officer since September 7, 2011 and previously our Chief Operating Officer until September 7, 2011. Mr. Finnis has been working as an entrepreneur in the hemp industry since 1994. He has started and grown three different hemp enterprises since 1994 and has built a market for his products. Mr. Finnis has established strong ties with the Federal Government of Canada and was instrumental in removing the Canadian tariff on all imported hemp fabric. Mr. Finnis has been a sought after speaker at many North American universities and conferences speaking on a wide variety of business and industrial hemp related topics. Mr. Finnis attended the University of Victoria in the Faculty of Fine Arts, and possesses broad experience in apparel manufacturing, marketing and sales. The Board of Directors has concluded that Mr. Finnis should serve as a director given his involvement with our Company since 2000 as well as his experience as an entrepreneur in the hemp industry since 1994.
Larisa Harrison, Vancouver, British Columbia. Ms. Harrison has been a member of the Board of Directors and our Chief Administration Officer and Secretary/Treasurer since December 15, 2000. Ms. Harrison has been working in the hemp clothing industry since 1995. Ms. Harrison was instrumental in creating the growth in demand for our products over the past years. From 1998 to 2005, Ms. Harrison worked as a self-employed administrative consultant providing human resource management, developing customizing computer databases, and providing bookkeeping services for several Canadian businesses. In May of 1998, Ms. Harrison was employed by one of Canada’s largest providers of private label fashion to North American department and chain stores. In this role, Ms. Harrison provided product development, sales support and production management for a number of clients. Ms. Harrison possesses extensive experience in the apparel industry, network administration, and graphic design. Ms. Harrison is a graduate of the University of Victoria with a Fine Arts degree from the School of Music. The Board of Directors has concluded that Ms. Harrison should serve as a director given her involvement with our Company since 2000 as well as her experience in the hemp clothing industry since 1995.
Guy Prevost, Vancouver, British Columbia. Mr. Prevost is a member of our Board of Directors and, since May 2, 2005, has been our Chief Financial Officer. Mr. Prevost has over twenty-five years of public market experience in accounting, finance and corporate governance. Mr. Prevost’s duties and responsibilities on our behalf will generally entail financial reporting and establishing internal procedures and controls. Mr. Prevost is a member of the Certified General Accountants Association of British Columbia and Canada. The Board of Directors has concluded that Mr. Prevost should serve as a director given his involvement with our Company since 2005 as well as his experience in accounting, finance and corporate governance.
71
Thomas C. Robinson, Greensboro, North Carolina. Mr. Robinson has been our Chief Operating Officer since September 7, 2011. Mr. Robinson is a 27 year veteran of the textiles industry where he was most recently Vice President of Cotton Operations Planning and Technical Support in International Textile Group's (“ITG”) apparel division. Mr. Robinson began his textiles career in 1984 with Burlington Industries, a full service apparel solutions organization for apparel manufacturers and retailers. From 1984 to 2004 he held a number of leadership roles for Burlington Industries, culminating in Executive Vice President of Manufacturing and Operations Planning. His experience included greenfieldstartup manufacturing facilities as well as oversight of multi-plant operations throughout the U.S., China, Mexico, India, Vietnam and Nicaragua. ITG later purchased Burlington Industries to become one of its six current companies, and positioned it alongside Cone Mills, a denim manufacturer and wholesaler. In 2004, Mr. Robinson became Vice President of Operations Planning and Customer Support at Cone Mills, where he was responsible for global denim operations planning, customer service, technical product development and quality control. He played a key operations role in the integration of Burlington Industries and Cone Mills as they each became part of ITG. Mr. Robinson has a BA in economics and business from North Carolina State University and an Executive Program Certificate from the University of North Carolina.
Jay Nalbach, Portland, Oregon. Mr. Nalbach has been our Chief Marketing Officer since August 31, 2011. Mr. Nalbach has more than 16 years in the sports and fashion industries, mostly recently serving as Brand Director at adidas Group Japan KK, leading the execution of subsidiary brand Reebok's first ever 360-degree product and marketing campaigns in Japan. Before this he was Global Head of Men's Lifestyle Footwear for Reebok International. This came at the critical post-acquisition period of Reebok by adidas. Mr. Nalbach has also held senior roles with adidas AG, including key work with Reebok, adidas Originals, Foot Locker Europe in footwear, apparel, supply chain and account management. Mr. Nalbach’stime with adidas, where he began in 1995, paused briefly for a nearly three-year senior role with Fila International.
Robert Edmunds, C.A., Calgary, Alberta. Mr. Edmunds has been a member of the Board of Directors since December 15, 2000 and previously our Chief Financial officer until his resignation effective April 27, 2005. Mr. Edmunds received a Chartered Accountant designation in 1992. He has worked as the proprietor of a public practice from 1992 through 1998. Since 1998, Mr. Edmunds has been performing consulting work, providing business strategy, financial planning and accounting services for various clients in the entertainment and E-commerce industries. The Board of Directors has concluded that Mr. Edmunds should serve as a director given his involvement with our Company since 2000 as well as his experience in accounting.
Peter C. Moore, Portland, Oregon. Mr. Moore has been one of our directors since July 11, 2006, and on our Advisory Board since October 2004. We believe Mr. Moore is generally considered one of the top branding and design experts in the industry. He has over twenty years of footwear and apparel experience, including design and development, involving Nike, adidas and several other prominent brands and concepts in sportswear history. His roles have included creative director at Nike (Air Jordan, Nike Air). Mr. Moore was one of two individuals responsible for creation of the Air Jordan concept during the mid-1980’s after which he subsequently left with a colleague to form Sports Inc. a sports marketing company in Portland, Oregon. Mr. Moore was also previously the chief executive officer adidas North America and worldwide creative director of adidas AG. The Board of Directors has concluded that Mr. Moore should serve as a director given his involvement with our Company since 2004 as well as his branding and design expertise.
Miljenko Horvat, Vancouver, British Columbia. Mr. Horvat has been one of our directors since July 11, 2006. Mr. Horvat has over twenty years of experience in the investment banking and private investing industry. Mr. Horvat currently is the President of Horvat Capital Corp., a Vancouver-based investment firm. Mr. Horvat’s duties include sourcing and managing leverage buyout transactions throughout Canada on behalf of The Riverside Company, a private equity firm that has over $1.5 billion under management involving investments in industry segment-leading companies with enterprise values between $15,000,000 and $150,000,000. Previously, Mr. Horvat was the president and chief executive officer of NewspaperDirect, Inc., a corporation based in New York and Vancouver, Canada, which is an Internet based, print on demand distributor of daily newspapers. While at NewspaperDirect, Inc., Mr. Horvat was responsible for raising a total of $12,500,000 in funding, establishing relationships with 185 publishers of daily newspapers around the world, expanding market presence to 65 countries, implementing a radical restructuring in response to market conditions during 2001, and growing revenues of 450% in twelve months resulting in sales for fiscal year 2003 of $1,500,000. Mr. Horvat’s prior experience also includes employment at Citicorp as managing director, Russia Direct Equity, and at Citibank, Russia, where he led the creation of Citibank’s full service commercial banking operations in Russia. Mr. Horvat is also a member of the Advisory Board of the Maurice Young Center for Entrepreneurship. He earned an M.A. in International Relations at Yale University and a B.A. in Political Science from Zagreb University. The Board of Directors has concluded that Mr. Horvat should serve as a director given his involvement with our Company since 2006 as well as his business experience, financial expertise and proven ability to raise funding.
72
Jeremy Jones, Medford, Massachusetts. Mr. Jones has been one of our directors since August 5, 2009 and on our Advisory Board since March 2009. Mr. Jones was Vice President of Koch Genesis, the venture arm or Koch Industries, the largest private company in the United States from 2007 through 2009. At Koch he was responsible for deal sourcing, diligence and structuring in areas such as renewable fuels, biopolymers, medical textiles and advanced fibers for Koch’s operating businesses INVESTA, Georgia-Pacific and Flint Hills Resources. Prior to Koch, Mr. Jones was in leadership and corporate officer roles in Fortune 500 companies such as Polaroid, Motorola and Cabot Microelectronics, where he built several businesses in optical and electronic materials, as well as in start-ups such as Crosslink, a St. Louis company commercializing conductive polymer materials. The Board of Directors has concluded that Mr. Jones should serve as a director given his experience in building small companies as well as his specific experience with companies involved in renewable fuels, biopolymers, textiles and fibres.
Scott Staff, Bainbridge Island, Washington. Mr. Staff has been one of our directors since February 3, 2012. Mr. Staff serves as the Director of Business Development for Perkins Coie LLP, an international law firm with 18 offices and more than 800 lawyers. He leads the firm's business development strategy, and oversees its client service interview, client service and industry teams programs. Mr. Staff joined Perkins Coie in 2004 and currently works out of the Seattle office. Mr. Staff is on the boards of advisors of DNA Response Inc. and Rouxbe Video Technologies. Mr. Staff earned his BA from Lewis and Clark College in 1987 and graduated from Lewis and Clark Law School in 1991. He served in senior administrative positions at the law school after graduation, including assistant dean for development and external relations. In 1997, Mr. Staff was appointed vice-president for college relations for Lewis and Clark College. The Board of Directors has concluded that Mr. Staff, the newest member of our Board of Directors, should serve as a director given his business experience and legal expertise.
Term of Office
All of our directors hold office until the next annual general meeting of the shareholders or until their successors are elected and qualified. Our officers are appointed by our board of directors and hold office until their earlier death, retirement, resignation or removal.
Significant Employees
Mr. Gregg Wright, Knoxville, Tennessee. Mr. Wright has been our Vice President of Strategic Fiber Markets, since February of 2012.Mr.Wright joins the Company from International Paper Company (“IP”) in National Accounts, Business Development, and Regional Management. He served in several advisory roles during his 12+ years with IP. He earned his BA from Denison University in 1990.
Mr. Steve Sandroni, Ballwin, Missouri. Mr. Sandroni has been Vice President of Agriculture for the Company since March 2012. Mr. Sandroni brings more than 34 years of experience working in various aspects of agribusiness to the Company. Most recently, Mr. Sandroni served as Director of Production and Logistics at Sustainable Oils, where he oversaw the production of Camelina sativa, a member of the mustard family that is closely related to canola, for innovative bio-fuel applications such as jet fuel for the U.S. Navy and Air Force. In that position, he led campaigns to strengthen Sustainable Oils’ relationships with researchers and contract growers, while building a foundational commercial production program for camelina throughout the United States and Canada. Mr. Sandroni’s professional experience also includes time spent at Monsanto Company, Emergent Genetics Stoneville, and the Delta and Pine Land Company. His roots in the industry, though, began as a farmer, growing cotton, rice, and soybeans in the fertile Mississippi Delta from 1978 to 1990.
73
Family Relationships
Ms. Harrison and Mr. Finnis are married. Otherwise, there are no family relationships among our directors or officers.
Involvement in Certain Legal Proceedings
Except as disclosed in this annual report, during the past ten years none of the following events have occurred with respect to any of our directors or executive officers:
| 1. |
A petition under the Federal bankruptcy laws or any state insolvency law was filed by or against, or a receiver, fiscal agent or similar officer was appointed by a court for the business or property of such person, or any partnership in which he was a general partner at or within two years before the time of such filing, or any corporation or business association of which he was an executive officer at or within two years before the time of such filing; | |
| 2. |
Such person was convicted in a criminal proceeding or is a named subject of a pending criminal proceeding (excluding traffic violations and other minor offenses); | |
| 3. |
Such person was the subject of any order, judgment, or decree, not subsequently reversed, suspended or vacated, of any court of competent jurisdiction, permanently or temporarily enjoining him from, or otherwise limiting, the following activities: |
| i. |
Acting as a futures commission merchant, introducing broker, commodity trading advisor, commodity pool operator, floor broker, leverage transaction merchant, any other person regulated by the Commodity Futures Trading Commission, or an associated person of any of the foregoing, or as an investment adviser, underwriter, broker or dealer in securities, or as an affiliated person, director or employee of any investment company, bank, savings and loan association or insurance company, or engaging in or continuing any conduct or practice in connection with such activity; | |
| ii. |
Engaging in any type of business practice; or | |
| iii. |
Engaging in any activity in connection with the purchase or sale of any security or commodity or in connection with any violation of Federal or State securities laws or Federal commodities laws; |
| 4. |
Such person was the subject of any order, judgment or decree, not subsequently reversed, suspended or vacated, of any Federal or State authority barring, suspending or otherwise limiting for more than 60 days the right of such person to engage in any activity described in paragraph (3)(i) above, or to be associated with persons engaged in any such activity; | |
| 5. |
Such person was found by a court of competent jurisdiction in a civil action or by the SEC to have violated any Federal or State securities law, and the judgment in such civil action or finding by the SEC has not been subsequently reversed, suspended, or vacated; |
74
| 6. |
Such person was found by a court of competent jurisdiction in a civil action or by the Commodity Futures Trading Commission to have violated any Federal commodities law, and the judgment in such civil action or finding by the Commodity Futures Trading Commission has not been subsequently reversed, suspended or vacated; | |
| 7. |
Such person was the subject of, or a party to, any Federal or State judicial or administrative order, judgment, decree, or finding, not subsequently reversed, suspended or vacated, relating to an alleged violation of: |
| i. |
Any Federal or State securities or commodities law or regulation; or | |
| ii. |
Any law or regulation respecting financial institutions or insurance companies including, but not limited to, a temporary or permanent injunction, order of disgorgement or restitution, civil money penalty or temporary or permanent cease-and-desist order, or removal or prohibition order; or | |
| iii. |
Any law or regulation prohibiting mail or wire fraud or fraud in connection with any business entity; or |
| 8. |
Such person was the subject of, or a party to, any sanction or order, not subsequently reversed, suspended or vacated, of any self-regulatory organization (as defined in Section 3(a)(26) of the Exchange Act), any registered entity (as defined in Section 1(a)(29) of the Commodity Exchange Act), or any equivalent exchange, association, entity or organization that has disciplinary authority over its members or persons associated with a member. |
There are currently no legal proceedings to which any of our directors or officers is a party adverse to us or in which any of our directors or officers has a material interest adverse to us.
Audit Committee
Mr. Edmunds, Mr. Horvat and Ms. Harrison are the members of our audit committee. The Board of Directors has determined that one of the audit committee members, Mr. Horvat, qualifies as an independent director under the listing standards of the NYSE Amex Equities Exchange. The Board of Directors has determined that Mr. Robert Edmunds, C.A., chairman of the audit committee, qualifies as a financial expert. Mr. Edmunds is not considered independent under the listing standards of the NYSE Amex Equities Exchange.
The audit committee operates under a written charter adopted by the board of directors on February 28, 2008. The audit committee’s primary function is to provide advice with respect to our financial matters and to assist the Board of Directors in fulfilling its oversight responsibilities regarding finance, accounting, and legal compliance. The audit committee’s primary duties and responsibilities will be to:
-
serve as an independent and objective party to monitor our financial reporting process and internal control system;
-
review and appraise the audit efforts of our independent accountants;
-
evaluate our quarterly financial performance as well as our compliance with laws and regulations;
-
oversee management’s establishment and enforcement of financial policies and business practices; and
-
provide an open avenue of communication among the independent accountants, management and the Board of Directors.
75
Code of Ethics
Our Board of Directors has adopted a code of ethics applicable to all our employees and directors (the “Code of Ethics”).
The Code of Ethics is intended to describe our core values and beliefs and to provide the foundation for all business conduct. The Code of Ethics is further intended to focus our Board of Directors and each director, officer and employee on areas of ethical risk, provide guidance to our directors, officers and employees to help them recognize and deal with ethical issues, provide mechanisms to report unethical conduct, and help foster a culture of honesty and accountability. Our guidelines for conducting business are consistent with the highest standards of business ethics. Each director, officer and employee must comply with the letter and spirit of this Code of Ethics.
We have posted the text of the Code of Ethics on our Internet website at www.naturallyadvanced.com Furthermore, upon request, we shall provide to any person without charge a copy of the Code of Ethics. Any such requests should be directed to Ms. Larisa Harrison, Chief Administration Officer, Suite 305, 4420 Chatterton Way, Victoria, British Columbia, Canada V8X 5J2.
Other Corporate Governance Matters
Effective February 27, 2008, our Board of Directors adopted certain policies, terms of reference, charters and guidelines (collectively, the “Corporate Governance Policies”), for our Board of Directors and senior management to follow:
-
Corporate Governance Policy;
-
Corporate Disclosure Policy;
-
Securities Trading Policy;
-
Board of Directors’ Charter;
-
Audit Committee Charter;
-
Corporate Governance Committee Charter;
-
Compensation Committee Charter;
-
Disclosure Charter Policy;
-
Code of Conduct; and
-
Insider Trading and Reporting Guidelines.
In general, the Corporate Governance Policies set forth our governance policies and our practice among our Board of Directors and senior management, including the constitution and independence of the Board, the functions to be performed by the Board of Directors and its committees and the effectiveness of the administration by Board members. The Corporate Governance Policies can also be found on our website at www.naturallyadvanced.com.
Compliance with Section 16(a) of the Exchange Act
Section 16(a) of the Exchange Act requires directors and officers, and the persons who beneficially own more than 10% of common stock, of certain companies to file reports of ownership and changes in ownership with the SEC. We are not required to file reports under Section 16 of the Exchange Act.
76
ITEM 11. EXECUTIVE COMPENSATION
Compensation Discussion and Analysis
The Compensation Committee of the Board of Directors of the Company, which is composed of Miljenko Horvat (the committee chair), Robert Edmunds and Larisa Harrison, is responsible for the development and supervision of the Company’s approach to compensation for directors, officers and senior management as well as bonuses and any increases in compensation to employees or staff that would have a material impact on the Company’s expenses. The Compensation Committee shall:
| A. |
Review and make recommendations regarding compensation issues, in particular: | |
| (i) |
compensation philosophy and policies; | |
| (ii) |
competitive positioning; | |
| (iii) |
annually review the performance of the CEO, the COO and the CFO on behalf of the Board; | |
| (iv) |
make recommendations to the Board for payment and awards to Senior Officers under the Company’s salary and incentive plans; | |
| (v) |
make recommendations to the Board for annual aggregate incentive compensation payouts to management, including security based compensation arrangements, and profit sharing to employees; and | |
| (vi) |
make recommendations to the Board regarding Director compensation. | |
| B. |
Review: | |
| (i) |
senior management succession planning; | |
| (ii) |
senior management development and training; and | |
| (iii) |
significant changes in organizational structure. | |
| C. |
Ensure for each meeting that minutes are recorded, drafted and circulated on a timely basis to committee members. | |
The Board assumes responsibility for reviewing and monitoring the long-range compensation strategy for the senior management of the Company although the Compensation Committee guides it in this role. The Company’s Compensation Committee receives independent competitive market information on compensation levels for executives.
Philosophy and Objectives
The compensation program for the senior management of the Company is designed to ensure that the level and form of compensation achieves certain objectives, including:
| (a) |
attracting and retaining talented, qualified and effective executives; | |
| (b) |
motivating the short and long-term performance of these executives; and | |
| (c) |
better aligning their interests with those of the Company’s shareholders. |
In compensating its senior management, the Company has employed a combination of base salary, bonus compensation and equity participation through its stock option plan.
Base Salary
In the Board’s view paying base salaries which are competitive in the markets in which the Company operates is a first step to attracting and retaining talented, qualified and effective executives. Competitive salary information on comparable companies within the industry is compiled from a variety of sources, including surveys conducted by independent consultants and national and international publications.
77
Bonus Incentive Compensation
The Company’s objective is to achieve certain strategic objectives and milestones. The Board will consider executive bonus compensation dependent upon the Company meeting those strategic objectives and milestones and sufficient cash resources being available for the granting of bonuses. The Board approves executive bonus compensation dependent upon compensation levels based on recommendations of the Compensation Committee, and such recommendations are generally based on survey data provided by independent consultants. Each Named Executive Officer receives a base salary and is also eligible for an annual bonus. Annual bonuses are calculated and approved by the Company's compensation committee and can range from 25% to 125% of a Named Executive Officer’s base salary.
Equity Participation
The Company believes that encouraging its executives and employees to become shareholders is the best way of aligning their interests with those of its shareholders. Equity participation is accomplished through the Company’s 2011 fixed share option plan. Stock options are granted to executives and employees taking into account a number of factors, including the amount and term of options previously granted, base salary and bonuses and competitive factors. The amounts and terms of options granted are determined by the Compensation Committee. Given the evolving nature of the Company’s business, the Board continues to review and redesign the overall compensation plan for senior management so as to continue to address the objectives identified above.
Compensation of Named Executive Officers
The following table sets forth the compensation paid to our Chief Executive Officer and those executive officers that earned in excess of $100,000 during fiscal years ended December 31, 2011 and 2010 (collectively, the “Named Executive Officers”):
Summary Compensation Table
Name and Principal Position |
Year |
Salary ($) |
Bonus ($) |
Stock Awards ($) |
Option Awards (1) ($) |
Non- Equity Incentive Plan Compen- sation ($) |
Non- Qualified Deferred Compen- sation Earnings ($) |
All Other Compen- sation ($) |
Total ($) |
| Kenneth Barker Chief Executive Officer |
2011 | 221,000 | 75,000 | Nil | 805,546 | Nil | Nil | Nil | 1,101,546 |
| 2010 | 183,000 | Nil | Nil | 787,161 | Nil | Nil | Nil | 970,161 | |
| Jason Finnis President & Chief Innovation Officer |
2011 | 126,844 | 86,726 | Nil | 379,727 | Nil | Nil | Nil | 593,297 |
| 2010 | 105,462 | 42,641 | Nil | 147,349 | Nil | Nil | Nil | 295,452 | |
| Guy Prevost CFO |
2011 | 126,844 | 86,726 | Nil | 480,696 | Nil | Nil | Nil | 694,539 |
| 2010 | 105,462 | 42,641 | Nil | 63,054 | Nil | Nil | Nil | 211,157 | |
| Larisa Harrison CAO, Secretary and Treasurer |
2011 | 106,195 | 67,060 | Nil | 245,102 | Nil | Nil | Nil | 418,357 |
| 2010 | 105,462 | 42,641 | Nil | 147,349 | Nil | Nil | Nil | 295,452 |
| (1) |
Amounts presented in this column represent the fair value as of the grant date of such stock options. |
78
Stock Option Grants
We granted options to purchase shares of our common stock to the Names Executive Officers in the fiscal year ended December 31, 2011 as follows:
Name |
Grant Date |
Number of Securities
Underlying Options |
Exercise Price |
Grant Date Fair Value
of Option |
| Kenneth Barker CEO |
April 8, 2011 August 19, 2011 |
125,000 325,000 |
$1.55 $2.77 |
$805,546 |
| Jason Finnis President and Chief Innovation Officer |
April 8, 2011 August 19, 2011 |
100,000 125,000 |
$1.55 $2.77 |
$379,727 |
| Guy Prevost CFO |
April 8, 2011 August 19, 2011 |
175,000 125,000 |
$1.55 $2.77 |
$480,696 |
| Larisa Harrison CAO, Secretary and Treasurer |
August 19, 2011 |
125,000 |
$2.77 |
$245,102 |
Outstanding Equity Awards Held by Named Executive Officers at Fiscal Year End
The following table sets forth information as at December 31, 2011, relating to unexercised options, stock that has not vested, and equity incentive plan awards for each Named Executive Officer:
79
| Outstanding Equity Awards At Fiscal Year-End | |||||||||
| Option Awards | Stock Awards | ||||||||
Name |
Number of Securities Underlying Unexercised Options Exercisable (#) |
Number of Securities Underlying Unexercised Options Unexercisable (#) |
Equity Incentive Plan Awards: Number of Securities Underlying Unexercised Unearned Options (#) |
Option Exercise Price ($) |
Option Expiration Date |
Number of Shares or Units of Stock That Have Not Vested (#) |
Market Value of Shares or Units of Stock That Have Not Vested ($) |
Equity Incentive Plan Awards: Number of Unearned Shares, Units or Other Rights That Have Not Vested (#) |
Equity Incentive Plan Awards: Market or Payout Value of Unearned Shares, Units or Other Rights That Have Not Vested (#) |
| Kenneth Barker |
200,000 | Nil | Nil | $1.17 | Oct-20-14 | Nil | Nil | Nil | Nil |
| 543,750 | Nil | Nil | $0.96 | Aug -26-15 | Nil | Nil | Nil | Nil | |
| 500,000 | Nil | Nil | $0.87 | Nov-25-15 | Nil | Nil | Nil | Nil | |
| 83,336 | 41,664 | Nil | $1.55 | Apr-8-16 | Nil | Nil | Nil | Nil | |
| 108,336 | 216,664 | Nil | $2.77 | Aug-19-16 | Nil | Nil | Nil | Nil | |
| Jason Finnis | 82,550 | Nil | Nil | $1.12 | Jan-21-12 | Nil | Nil | Nil | Nil |
| 300,000 | Nil | Nil | $1.17 | Jun-18-14 | Nil | Nil | Nil | Nil | |
| 132,939 | Nil | Nil | $1.02 | Aug-9-15 | Nil | Nil | Nil | Nil | |
| 125,000 | Nil | Nil | $0.87 | Nov-25-15 | Nil | Nil | Nil | Nil | |
| 100,000 | Nil | Nil | $1.55 | Apr-8-16 | Nil | Nil | Nil | Nil | |
| 41,672 | 83,328 | Nil | $2.77 | Aug-19-16 | Nil | Nil | Nil | Nil | |
| Guy Prevost | 300,000 | Nil | Nil | $1.11 | Oct-20-14 | Nil | Nil | Nil | Nil |
| 59,994 | Nil | Nil | $0.87 | Nov-25-15 | Nil | Nil | Nil | Nil | |
| 150,000 | 25,000 | Nil | $1.55 | Apr-8-16 | Nil | Nil | Nil | Nil | |
| 41,672 | 83,328 | Nil | $2.77 | Aug-19-16 | Nil | Nil | Nil | Nil | |
80
| 64,750 | Nil | Nil | $1.12 | Jan-21-12 | Nil | Nil | Nil | Nil | |
| Larisa Harrison |
132,938 | Nil | Nil | $1.02 | Aug-9-15 | Nil | Nil | Nil | Nil |
| 125,000 | Nil | Nil | $0.87 | Nov-25-15 | Nil | Nil | Nil | Nil | |
| 41,672 | 83,328 | Nil | $2.77 | Aug-19-16 | Nil | Nil | Nil | Nil |
Director Compensation
The following table sets forth information relating to compensation paid to our directors during fiscal year ended December 31, 2011. Our Directors who are also Named Executive Officers do not receive any additional compensation beyond what is disclosed above in relation to their service as directors. As such, such Named Executive Officers are not listed in the table below.
Director Compensation Table
Name |
Fees Earned or Paid in Cash ($) |
Stock Awards ($) |
Option Awards (1) ($) |
Non-Equity Incentive Plan Compensation ($) |
Nonqualified Deferred Compensation Earnings ($) |
All Other Compensation ($) |
Total ($) |
| Robert Edmunds | Nil | Nil | 98,041 | Nil | Nil | Nil | 98,041 |
| Peter Moore | Nil | Nil | 49,020 | Nil | Nil | Nil | 49,020 |
| Miljenko Horvat | Nil | Nil | 49,020 | Nil | Nil | Nil | 49,020 |
| Jeremy Jones | Nil | Nil | 49,020 | Nil | Nil | Nil | 49,020 |
| (1) |
Amounts presented in this column represent the fair value as of the grant date of such stock options. |
Our directors do not have specific compensation arrangements based on attendance at board or committee meetings or serving as a committee chair. From time to time directors may receive bonus payments or options, which are granted on a discretionary basis. The amount of any bonus payments or the number of options granted is based on the experience of the director, time spent on Company matters and the compensation paid to other directors of companies in the industry.
ITEM 12. SECURITY OWNERSHIP OF CERTAIN BENEFICIAL OWNERS AND MANAGEMENT AND RELATED STOCKHOLDER MATTERS
As of February 24, 2012, the following table sets forth certain information with respect to the beneficial ownership of our common stock by each stockholder known by us to be the beneficial owner of more than 5% of our common stock and by each of our current directors and executive officers. Each person has sole voting and investment power with respect to the shares of common stock, except as otherwise indicated. Beneficial ownership consists of a direct interest in the shares of common stock, except as otherwise indicated. As of February 24, 2012, there were 42,101,704 shares of common stock issued and outstanding.
81
| Amount and Nature of | Percentage of Beneficial | |
| Name and Address of Beneficial Owner(1) | Beneficial Ownership(1) | Ownership |
| Directors and Officers: | ||
| Kenneth Barker Suite 305, 4420 Chatterton Way Victoria, British Columbia Canada V8X 5J2 |
1,942,549 (2)
|
4.4% |
| Jason Finnis and Larisa
Harrison(3) Suite 305, 4420 Chatterton Way Victoria, British Columbia Canada V8X 5J2 |
2,901,310 (4)
|
6.7% |
| Guy Prevost Suite 305, 4420 Chatterton Way Victoria, British Columbia Canada V8X 5J2 |
687,744 (5)
|
1.6% |
| Robert Edmunds Suite 305, 4420 Chatterton Way Victoria, British Columbia Canada V8X 5J2 |
2,160,641 (6)
|
5.1% |
| Peter Moore Suite 305, 4420 Chatterton Way Victoria, British Columbia Canada V8X 5J2 |
2,118,750 (7)
|
5.0% |
| Miljenko Horvat Suite 305, 4420 Chatterton Way Victoria, British Columbia Canada V8X 5J2 |
407,850 (8)
|
Less than 1%
|
| Jeremy Jones Suite 305, 4420 Chatterton Way Victoria, British Columbia Canada V8X 5J2 |
143,750 (9)
|
Less than 1%
|
| Thomas C. Robinson Suite 305, 4420 Chatterton Way Victoria, British Columbia Canada V8X 5J2 |
66,667 (10)
|
Less than 1%
|
| Jay Nalbach Suite 305, 4420 Chatterton Way Victoria, British Columbia Canada V8X 5J2 |
76,500 (11)
|
Less than 1%
|
82
| Amount and Nature of | Percentage of Beneficial | |
| Name and Address of Beneficial Owner(1) | Beneficial Ownership(1) | Ownership |
| Scott Staff Suite 305, 4420 Chatterton Way Victoria, British Columbia Canada V8X 5J2 |
6,750 (12)
|
Less than 1%
|
| All Officers and Directors
as a Group (9) 5% or Greater Beneficial Owners |
10,512,511 (13)
|
22.8% |
| Dennis Howitt Trust Suite 305, 4420 Chatterton Way Victoria, British Columbia Canada V8X 5J2 |
3,469,775(14)
|
8.2%
|
| (1) |
Under Rule 13d-3, a beneficial owner of a security includes any person who, directly or indirectly, through any contract, arrangement, understanding, relationship, or otherwise has or shares: (i) voting power, which includes the power to vote, or to direct the voting of shares; and (ii) investment power, which includes the power to dispose or direct the disposition of shares. Certain shares may be deemed to be beneficially owned by more than one person (if, for example, persons share the power to vote or the power to dispose of the shares). In addition, shares are deemed to be beneficially owned by a person if the person has the right to acquire the shares (for example, upon exercise of an option) within 60 days of the date as of which the information is provided. In computing the percentage ownership of any person, the amount of shares outstanding is deemed to include the amount of shares beneficially owned by such person (and only such person) by reason of these acquisition rights. As a result, the percentage of outstanding shares of any person as shown in this table does not necessarily reflect the person’s actual ownership or voting power. As of February 24, 2012, there were 42,101,704 issued and outstanding. |
| (2) |
This figure includes: (i) 30,049 shares of common stock; (ii) 1,858,333 stock options which have vested and are exercisable into 1,858,333shares of common stock; and (iii) 54,167 stock options which will vest within 60 days and are exercisable into 54,167 shares of common stock. |
| (3) |
Jason Finnis and Larisa Harrison are married. |
| (4) |
This figure includes: (i) 1,797,993 shares of common stock; (ii) 1,061,711 stock options which have vested and exercisable into 1,061,711 shares of common stock; and (iii) 41,666 stock options which will vest within 60 days and are exercisable into 41,666 shares of common stock. |
| (5) |
This figure includes: (i) 79,000 shares of common stock; (ii) 587,911 stock options which have vested and are exercisable into 587,911 shares of common stock; and (iii) 20,833 stock options which will vest within 60 days and are exercisable into 20,833 shares of common stock. |
| (6) |
This figure includes: (i) 1,815,641 shares of common stock held of record by Robert Edmunds; (ii) 272,500 shares of common stock held of record by Lesley Hayes, the wife of Robert Edmunds; (iii) 54,167 stock options held of record by Robert Edmunds which have vested and are exercisable into 54,167 shares of common stock; (iv) 8,333 stock options held of record by Robert Edmunds which will vest within 60 days and are exercisable into 8,333 shares of common stock; and (v) 10,000 stock options held of record by Lesley Hayes which have vested and are exercisable into 10,000 shares of common stock. |
| (7) |
This figure includes: (i) 2,075,000 shares of common stock; (ii) 39,583 stock options which have vested and are exercisable into 39,583 shares of common stock; and (iii) 4,167 stock options which will vest within 60 days and are exercisable into 4,167 shares of common stock. |
| (8) |
This figure includes: (i) 371,600 shares of common stock; (ii) 19,583 stock options which have vested and are exercisable into 19,583 shares of common stock; (iii) 4,167 stock options which will vest within 60 days and are exercisable into 4,167 shares of common stock; and (iv) 12,500 warrants exercisable into 12,500 shares of common stock. |
| (9) |
This figure includes: (i) 100,000 shares of common stock; (ii) 39,583 stock options which have vested and are exercisable into 39,583 shares of common stock; and (iii) 4,167 stock options which will vest within 60 days and are exercisable into 4,167 shares of common stock. |
| (10) |
This figure includes: (i) 50,000 stock options which have vested and are exercisable into 50,000 shares of common stock; and (ii) 16,667 stock options which will vest within 60 days and are exercisable into 16,667 shares of common stock. |
| (11) |
This figure includes: (i) 1,500 shares of common stock; (ii) 58,333 stock options which have vested and are exercisable into 58,333 shares of common stock; and (iii) 16,667 stock options which will vest within 60 days and are exercisable into 16,667 shares of common stock. |
| (12) |
This figure includes: (i) 500 shares of common stock; (ii) 2,083 stock options which have vested and are exercisable into 2,083 shares of common stock; and (iii) 4,167 stock options which will vest within 60 days and are exercisable into 4,167 shares of common stock. |
83
| (13) |
This figure includes: (i) 6,543,723 shares of common stock; (ii) 3,781,287 stock options which have vested and are exercisable into 3,781,287 shares of common stock; (iii) 175,001 stock options which will vest within 60 days and are exercisable into 175,001 shares of common stock; and (iv) 12,500 warrants exercisable into 12,500 shares of common stock. |
| (14) |
This figure consists of 3,469,775 shares of common stock. |
Changes in Control
We are unaware of any contract, or other arrangement or provision, the operation of which may at a subsequent date result in a change of control of our Company.
ITEM 13. CERTAIN RELATIONSHIPS AND RELATED TRANSACTIONS AND DIRECTOR INDEPENDENCE
Except for the transactions described below, none of our directors, officers or principal stockholders, nor any associate or affiliate of the foregoing, have any interest, direct or indirect, in any transaction during our fiscal years ended December 31, 2009 and 2010, or in any currently proposed transaction.
During the year ended December 31, 2011, $896,395(2010 - $624,310) was incurred as remuneration to officers and directors of the Company.
As at December 31, 2011, the Company owed $Nil, (2010 - $956,945) to a director of the Company. On July 12, 2011 the loan was repaid including all interest.
Our agreement through which we engage Kenneth Barker as or Chief Executive Officer is described above under Item 11, “Executive Compensation”, under the subheading “Chief Executive Officer (“CEO”) Agreement”.
ITEM 14. PRINCIPAL ACCOUNTING FEES AND SERVICES
Dale Matheson Carr-Hilton LaBonte LLP served as our independent registered public accounting firm and audited our financial statements for the fiscal years ended December 31, 2010 and December 31, 2009. Aggregate fees for professional services rendered to us by our auditor are set forth below:
| Year Ended | Year Ended | ||
| December 31, 2011 | December 31, 2010 | ||
| (estimated) | |||
| Audit Fees | $75,000 | $76,750 | |
| Audit-Related Fees | Nil | Nil | |
| Tax Fees | 10,000 | 7,500 | |
| All Other Fees | Nil | Nil | |
| Total | $85,000 | $84,250 |
Audit Fees
Audit fees are the aggregate fees billed for professional services rendered by our independent auditors for the audit of our annual financial statements, the review of the financial statements included in each of our quarterly reports and services provided in connection with statutory and regulatory filings or engagements.
84
Audit Related Fees
Audit related fees are the aggregate fees billed by our independent auditors for assurance and related services that are reasonably related to the performance of the audit or review of our financial statements and are not described in the preceding category.
Tax Fees
Tax fees are billed by our independent auditors for tax compliance, tax advice and tax planning.
All Other Fees
All other fees include fees billed by our independent auditors for products or services other than as described in the immediately preceding three categories.
Policy on Pre-Approval of Services Performed by Independent Auditors
It is our audit committee’s policy to pre-approve all audit and permissible non-audit services performed by the independent auditors. We approved all services that our independent accountants provided to us in the past two fiscal years.
ITEM 15. EXHIBITS
The following exhibits are filed as part of this Annual Report.
| Exhibit No. | Document |
| 3.1 |
Articles of Incorporation, as amended (1) |
| 3.2 |
Bylaws (1) |
| 10.1 |
Collaboration Agreement dated effective May 7, 2004 between Hemptown Clothing, Inc., and the National Research Council of Canada(2) |
| 10.2 |
Renewed Collaboration Agreement dated effective December 7, 2007 between Crailar Fiber Technologies, Inc., and the National Research Council of Canada(2) |
| 10.3 |
Amendment to the Renewed Collaboration Agreement dated effective February 19, 2010 between Naturally Advanced Technologies, Inc. and the National Research Council of Canada(2) |
| 10.4 |
Master Agreement for Technology Development between Alberta Research Council and Crailar Fiber Technologies dated January 1, 2007 (3) |
| 10.5 |
CEO Executive Services Agreement between Naturally Advanced Technologies Inc. and Meriwether Accelerators LLC dated November 27, 2007 with effective date of August 24, 2007 (4) |
| 10.6 |
2006 Stock Option Plan (5) |
| 10.7 |
Letter Agreement dated September 2, 2008 between Naturally Advanced Technologies Inc. and Lipper/Heilshorn& Associates, Inc. (6) |
| 10.8 |
Renewal of CEO Executive Services Agreement Between Naturally Advanced Technologies Inc. And Meriwether Accelerators LLC dated October 14, 2008 (7) |
| 10.9 |
2008 Fixed Share Stock Option Plan (8) |
| 10.10 |
CEO Executive Services Agreement between Naturally Advanced Technologies Inc. and Kenneth Barker, dated for reference August 24, 2009 |
| 10.11 |
Service Agreement between Naturally Advanced Technologies Inc. and OrganicWorks Marketing LLC dated November 25, 2010 Equipment Lease and Location Sublease dated August 9, 2010 between Naturally Advanced |
| 10.12 |
Technologies, Inc. and Eastern Flax of South Carolina, LLC. (11) |
| 10.13 |
2010 Fixed Share Option Plan (12) |
85
| 10.14 | Lease Agreement, dated June 30, 2011 between 0702311 BC Ltd. and Naturally Advanced Technologies Inc. |
| 10.15 | Office Lease Agreement dated August 8, 2011 between Naturally Advanced Technologies Inc. and MDW Properties, LLC. |
| 10.16 | Lease Agreement dated July 1, 2011 between Naturally Advanced Technologies Inc. and Jessie Dale McCollough. |
| 10.17 | 2011 Fixed Share Option Plan (13) |
| 14.1 | Corporate Governance Policy (9) |
| 14.2 | Corporate Disclosure Policy (9) |
| 14.3 | Securities Trading Policy (9) |
| 14.4 | Board of Directors Charter (9) |
| 14.5 | Terms of Reference for the Chief Financial Officer (9) |
| 14.6 | Terms of Reference of Committee Chairs (9) |
| 14.7 | Audit Committee Charter (9) |
| 14.8 | Corporate Governance Committee Charter (9) |
| 14.9 | Compensation Committee Charter (9) |
| 14.10 | Disclosure Charter Policy (9) |
| 14.11 | Code of Ethics (9) |
| 14.12 | Insider Trading and Reporting Guidelines (9) |
| 23.1 | |
| 31.1 | |
| 31.2 | |
| 32.1 |
| (1) |
Filed as an exhibit to our Form 10-KSB for fiscal year ended December 31, 2004, as filed with the SEC on March 31, 2005. |
| (2) |
Filed as an exhibit to our Form 8-K as filed with the SEC on March 8, 2010. |
| (3) |
Filed as an exhibit to our Form 8-K as filed with the SEC on June 25, 2007. |
| (4) |
Filed as an exhibit to our Form 8-K as filed with the SEC on December 21, 2007. |
| (5) |
Filed as an exhibit to our Form 10-KSB for fiscal year ended December 31, 2006 as filed with the SEC Commission on March 31, 2007. |
| (6) |
Filed as an exhibit to our Form 8-K as filed with the SEC on September 8, 2008. |
| (7) |
Filed as an exhibit to our Form 8-K as filed with the SEC on October 28, 2008. |
| (8) |
Filed as an exhibit to our Form S-8 as filed with the SEC on October 10, 2008. |
| (9) |
Filed as an exhibit to our Form 10-KSB for fiscal year ended December 31, 2007 as filed with the SEC on April 11, 2008. |
| (10) |
Filed as an exhibit to our Form 10-K for the fiscal year ended December 31, 2010, as filed with the SEC on April 13, 2010. |
| (11) |
Filed as an exhibit to our Form 8-K as filed with the SEC on August 12, 2010. |
| (12) |
Filed as an exhibit to our Form 10-Q for the quarter ended September 30, 2010, as filed with the SEC on November 15, 2011 |
| (13) |
Filed as an exhibit to our Form S-8 as filed with the SEC on February 16, 2012. |
86
SIGNATURES
Pursuant to the requirements of Section 13 or 15(d) of the Securities Exchange Act of 1934, as amended, the registrant has duly caused this report to be signed on its behalf by the undersigned, thereunto duly authorized.
| NATURALLY ADVANCED TECHNOLOIGES INC. | |
| Dated: March 20, 2012 | By: /s/ Kenneth C. Barker |
| Kenneth C. Barker, Chief Executive Officer | |
| (Principal Executive Officer) | |
| Dated: March 20, 2012 | By: /s/ Guy Prevost |
| Guy Prevost, Chief Financial Officer | |
| (Principal Financial Officer) |
Pursuant to the requirements of the Securities Exchange Act of 1934, as amended, this report has been signed below by the following persons no behalf of the registrant and in the capacities and on the dates indicated.
| Dated: March 20, 2012 | By: /s/ Kenneth C. Barker |
| Kenneth C. Barker, Chief Executive Officer and a director | |
| Dated: March 20, 2012 | By: /s/ Guy Prevost |
| Guy Prevost, Chief Financial Officer and a director | |
| Dated: March 20, 2012 | By: /s/ Jason Finnis |
| Jason Finnis, President, Chief Innovation Officer and a director | |
| Dated: March 20, 2012 | By: /s/ Larisa Harrison |
| Larisa Harrison, Chief Administrative Officer, Secretary, Treasurer | |
| and a director | |
| Dated: March 20, 2012 | By: /s/ Robert Edmunds |
| Robert Edmunds, Director | |
| Dated: March 20, 2012 | By: /s/ Peter C. Moore |
| Peter C. Moore, Director | |
| Dated: March 20, 2012 | By: /s/ Miljenko Horvat |
| Miljenko Horvat, Director |
| Dated: March 20, 2012 | By: /s/ Jeremy Jones |
| Jeremy Jones, Director | |
| Dated March 20, 2012 | By: /s/ Scott Staff |
| Scott Staff, Director |
- 88 -