Attached files
| file | filename |
|---|---|
| EX-21 - EX-21 - USANA HEALTH SCIENCES INC | a2208091zex-21.htm |
| EX-31.1 - EX-31.1 - USANA HEALTH SCIENCES INC | a2208091zex-31_1.htm |
| EX-23.1 - EX-23.1 - USANA HEALTH SCIENCES INC | a2208091zex-23_1.htm |
| EXCEL - IDEA: XBRL DOCUMENT - USANA HEALTH SCIENCES INC | Financial_Report.xls |
| EX-31.2 - EX-31.2 - USANA HEALTH SCIENCES INC | a2208091zex-31_2.htm |
| EX-32.1 - EX-32.1 - USANA HEALTH SCIENCES INC | a2208091zex-32_1.htm |
| EX-32.2 - EX-32.2 - USANA HEALTH SCIENCES INC | a2208091zex-32_2.htm |
Use these links to rapidly review the document
Table of Contents
Item 15. Exhibits, Financial Statement Schedules
UNITED STATES
SECURITIES AND EXCHANGE COMMISSION
Washington, D.C. 20549
FORM 10-K
| (Mark One) | ||
ý |
ANNUAL REPORT PURSUANT TO SECTION 13 OR 15(d) OF THE SECURITIES EXCHANGE ACT OF 1934 |
|
For the fiscal year ended December 31, 2011 |
||
OR |
||
o |
TRANSITION REPORT PURSUANT TO SECTION 13 OR 15(d) OF THE SECURITIES EXCHANGE ACT OF 1934 |
|
For the transition period from to |
||
Commission file number: 0-21116
USANA HEALTH SCIENCES, INC.
(Exact name of registrant as specified in its charter)
| Utah (State or other jurisdiction of incorporation or organization) |
87-0500306 (I.R.S. Employer Identification No.) |
3838 West Parkway Blvd., Salt Lake City, Utah 84120
(Address of principal executive offices, Zip Code)
(801) 954-7100
(Registrant's telephone number, including area code)
Securities registered pursuant to Section 12(b) of the Act:
| (Title of each class) | (Name of each exchange on which registered) | |
|---|---|---|
| Common Stock, Par Value $0.001 Per Share | New York Stock Exchange |
Securities registered pursuant to Section 12(g) of the Act: None
Indicate by check mark if the registrant is a well-known seasoned issuer, as defined in Rule 405 of the Securities Act. Yes o No ý
Indicate by check mark if the registrant is not required to file reports pursuant to Section 13 or 15(d) of the Act. Yes o No ý
Indicate by check mark whether the registrant (1) has filed all reports required to be filed by Section 13 or 15(d) of the Securities Exchange Act of 1934 during the preceding 12 months (or for such shorter period that the registrant was required to file such reports), and (2) has been subject to such filing requirements for the past 90 days. Yes ý No o
Indicate by check mark whether the registrant has submitted electronically and posted on its corporate Website, if any, every Interactive Data File required to be submitted and posted pursuant to Rule 405 of Regulation S-T (§ 232.405 of this chapter) during the preceding 12 months (or for such shorter period that the registrant was required to submit and post such files). Yes ý No o
Indicate by check mark if disclosure of delinquent filers pursuant to Item 405 of Regulation S-K (§ 229.405 of this chapter) is not contained herein, and will not be contained, to the best of the registrant's knowledge, in definitive proxy or information statements incorporated by reference in Part III of this Form 10-K or any amendment to this Form 10-K. ý
Indicate by check mark whether the registrant is a large accelerated filer, an accelerated filer, a non-accelerated filer, or a smaller reporting company. See the definitions of "large accelerated filer," "accelerated filer" and "smaller reporting company" in Rule 12b-2 of the Exchange Act.
| Large accelerated filer o | Accelerated filer ý | Non-accelerated filer o | Smaller reporting company o |
Indicate by check mark whether the registrant is a shell company (as defined in Rule 12b-2 of the Act). Yes o No ý
The aggregate market value of common stock held by non-affiliates of the registrant as of July 1, 2011 was approximately $234,357,000, based on a closing market price of $33.54 per share.
There were 14,990,415 shares of the registrant's common stock outstanding as of March 2, 2012.
Documents incorporated by reference. The registrant incorporates information required by Part III (Items 10, 11, 12, 13, and 14) of this report by reference to the registrant's definitive proxy statement to be filed pursuant to Regulation 14A for its 2012 Annual Shareholders Meeting.
USANA HEALTH SCIENCES, INC.
FORM 10-K
For the Fiscal Year Ended December 31, 2011
INDEX
2
3
The statements contained in this report on Form 10-K that are not purely historical are considered to be "forward-looking statements" within the meaning of the Private Securities Litigation Reform Act of 1995 and Section 21E of the Securities Exchange Act of 1934, as amended (the "Exchange Act"). These statements represent our expectations, beliefs, anticipations, commitments, intentions, and strategies regarding the future and include, but are not limited to, the risks and uncertainties outlined in Item 1A Risk Factors and Item 7 Management's Discussion and Analysis of Financial Condition and Results of Operations. Readers are cautioned that actual results could differ materially from the anticipated results or other expectations that are expressed in forward-looking statements within this report. The forward-looking statements included in this report speak only as of the date hereof.
In this Annual Report on Form 10-K, unless otherwise expressly indicated, references to "dollars" and "$" are to United States dollars.
USANA Health Sciences, Inc. was founded in 1992 by Myron W. Wentz, Ph.D. We develop and manufacture high-quality, science-based nutritional and personal care products with a primary focus on promoting long-term health and reducing the risk of chronic degenerative disease. In so doing, we are committed to continuous product innovation and sound scientific research. We have operations in 15 markets worldwide where we distribute and sell our products by way of direct selling. Our net sales in fiscal year 2011 were $582 million, of which 74.6% were in markets outside of the United States. As a U.S.-based multi-national company with an expanding international presence, our operating results are becoming more sensitive to currency fluctuations, as well as economic and political conditions in markets throughout the world. Additionally, we are subject to the various laws and regulations unique both to the products that we sell and to our method of distribution.
Our customer base comprises two types of customers: "Associates" and "Preferred Customers." Associates are independent distributors of our products, who also purchase our products for personal use. Preferred Customers purchase our products strictly for personal use and are not permitted to resell or to distribute the products. As of December 31, 2011, we had 222,000 active Associates and 64,000 active Preferred Customers worldwide.
In 2011, we increased our international expansion efforts by announcing and preparing for our entry into Thailand, France, and Belgium. We expect our operations in France and Belgium to begin at the end of the first quarter of 2012, and we expect our operations in Thailand to have fully commenced by the middle of the second quarter of 2012. Thailand and France are among the top Direct Selling markets in the world, and we are encouraged by the growth opportunity that these markets provide. Further, we believe the opening of France and Belgium will provide our North American Associates additional opportunity to expand their business internationally. This is particularly true for many of our Canadian Associates who have direct ties to France.
We continued integrating our China subsidiary, BabyCare, into our business during 2011. We introduced several USANA products for sale in China and continued educating our Associates on our China compensation plan to help them understand how to appropriately grow their businesses in China. Additionally, we continued to make progress on obtaining additional provincial direct selling licenses.
In 2011, we also began implementing a strategy to stabilize and grow our North America region. This strategy is centered on a number of key initiatives, including: (i) strengthening the partnership between USANA and its North American Associates; (ii) developing the leadership and marketing
4
skills of our Associates; (iii) personalizing our products, technologies and systems to meet the individual needs of our Associates; (iv) innovating to develop new products and technologies; and (v) offering North America-specific incentives and promotions. To develop and support these initiatives, we have expanded our corporate and management team. While this is a long-term strategy that will require upfront investment and patience, we believe that our successful execution of this strategy could produce results as early as the fourth quarter of 2012. Additionally, we believe our entry into the France and Belgium markets will encourage North American Associates to expand their businesses.
The following table summarizes our product lines.
Product Line/Category
|
Description | Percent of Product Sales by Fiscal Year |
Product examples | |||
|---|---|---|---|---|---|---|
USANA® Nutritionals |
||||||
Essentials |
Includes core vitamin and mineral supplements that provide a foundation of advanced total body nutrition for every age group beginning with children 13 months of age. | 2009—33% 2010—30% 2011—29% |
USANA® Essentials HealthPak 100™ |
|||
Optimizers |
Consists of targeted supplements designed to meet individual health and nutritional needs. These products support needs such as cardiovascular health, skeletal/structural health, and digestive health, and are intended to be used in conjunction with the Essentials. |
2009—43% |
Proflavanol |
|||
Foods |
Includes low-glycemic meal replacement shakes, snack bars, and other related products that provide optimal macro-nutrition (complex carbohydrates, complete proteins, and beneficial fats) in great tasting and convenient formats. These products can be used along with Essentials and Optimizers to provide a complete and healthy diet, and sustained energy throughout the day. |
2009—12% |
Nutrimeal |
|||
Sensé—beautiful science® |
Includes premium, science-based, personal care products that support healthy skin and hair by providing advanced topical nourishment, moisturization, and protection. These products are designed to complement inner nutrition for the skin provided by the USANA Nutritionals and are manufactured with our patented, self-preserving technology, which uses a unique blend of botanicals, antioxidants, and active ingredients to keep products fresh without adding traditional chemical preservatives. |
2009—9% |
Daytime Protective Emulsion |
5
Product Line/Category
|
Description | Percent of Product Sales by Fiscal Year |
Product examples | |||
|---|---|---|---|---|---|---|
All Other |
Includes materials and online tools that are designed to assist our Associates in building their businesses and in marketing our products. |
2009—3% |
Associate Starter Kit |
In addition to the products described above, we offer products designed specifically for prenatal, infant, and young child age groups in China.
As we continue to increase our focus on personalization and innovation, we will look for product opportunities such as our MyHealthPak™ product. MyHealthPak is a fully customized pre-packaged supplement regimen, similar to the HealthPak 100™ and can include virtually any of the Essentials and Optimizers. Additionally, MyHealthPak is currently only available to our customers in the United States and as part of our personalization and innovation initiative we will look for opportunities to expand this offering into other of our markets.
The approximate percentage of total product sales represented by our top-selling products for the last three fiscal years are as follows:
| |
Year Ended | |||||||||
|---|---|---|---|---|---|---|---|---|---|---|
Top-selling products
|
2009 | 2010 | 2011 | |||||||
USANA® Essentials |
19 | % | 18 | % | 18 | % | ||||
Proflavanol® |
11 | % | 11 | % | 12 | % | ||||
HealthPak 100™ |
12 | % | 10 | % | 9 | % | ||||
Our products are distributed and sold in 15 markets. We have organized our markets into two geographic regions: North America and Asia Pacific, with three sub-regions under Asia Pacific.
North America
North America is our most mature region and includes the United States (including direct sales from the United States to the United Kingdom and the Netherlands), Canada, and Mexico. The most recent market expansion in this region was our entry into Mexico in 2004. For several years, North America has been our most challenging region. Our North America growth strategy, which is discussed elsewhere in this report, is intended to reverse our declining trend in North America and generate growth. We note that North America will become our North America/Europe region with the opening of business in France and Belgium in 2012.
Asia Pacific
Asia Pacific is organized into three sub-regions: Southeast Asia/Pacific, Greater China, and North Asia. Markets included in each of these sub-regions are as follows:
- •
- Southeast Asia/Pacific—Australia, New Zealand, Singapore, Malaysia, and the Philippines
- •
- Greater China—Hong Kong, Taiwan, and China(1)
- •
- North Asia—Japan and South Korea
- (1)
- Our business in China is that of BabyCare, our wholly-owned subsidiary.
6
Growth in our Asia Pacific region over the last several years has been led by our Hong Kong market. Our most recent market expansions in this region include our entry into the Philippines in 2009 and our entry into mainland China in 2010 through our acquisition of BabyCare. These two markets have contributed to our recent growth in this region. Moving forward we anticipate growth in this region to come from emerging markets such as the Philippines, South Korea, China, and Thailand. Our Thailand market will be included in Southeast Asia/Pacific.
Net Sales by Region
The following table shows net sales by geographic region for our last three fiscal years. We report net sales in a geographic region if a product shipment originates in that geographic region. Additional financial information relating to our geographic regions can be found in Note M to the Consolidated Financial Statements.
| |
Years Ended | ||||||||||||||||||
|---|---|---|---|---|---|---|---|---|---|---|---|---|---|---|---|---|---|---|---|
Region
|
2009 | 2010 | 2011 | ||||||||||||||||
| |
(in thousands) |
||||||||||||||||||
North America |
|||||||||||||||||||
United States |
$ | 151,663 | 34.7 | % | $ | 150,893 | 29.2 | % | $ | 148,061 | 25.4 | % | |||||||
Canada |
65,682 | 15.1 | % | 69,411 | 13.4 | % | 67,024 | 11.5 | % | ||||||||||
Mexico |
22,384 | 5.1 | % | 21,843 | 4.2 | % | 21,301 | 3.7 | % | ||||||||||
|
239,729 | 54.9 | % | 242,147 | 46.8 | % | 236,386 | 40.6 | % | ||||||||||
Asia Pacific |
|||||||||||||||||||
Southeast Asia/Pacific |
95,185 | 21.8 | % | 99,311 | 19.2 | % | 111,447 | 19.2 | % | ||||||||||
Greater China |
81,455 | 18.6 | % | 152,280 | 29.4 | % | 204,822 | 35.2 | % | ||||||||||
North Asia |
20,571 | 4.7 | % | 23,906 | 4.6 | % | 29,284 | 5.0 | % | ||||||||||
|
197,211 | 45.1 | % | 275,497 | 53.2 | % | 345,553 | 59.4 | % | ||||||||||
|
$ | 436,940 | 100.0 | % | $ | 517,644 | 100.0 | % | $ | 581,939 | 100.0 | % | |||||||
Our research and development efforts are focused on developing and providing high-quality, science-based products that promote long-term health and reduce the risk of chronic degenerative disease. Our research and development activities include developing products that are new to USANA and new to the industry, updating existing formulas to keep them current with the latest science, and adapting existing formulas to meet ever-changing regulations in new and existing international markets. Our scientific staff includes experts on human nutrition, cellular biology, biochemistry, natural product chemistry, and clinical research. These experts continually review the latest published research on nutrition, attend scientific conferences, and work with a number of third-party research institutions and researchers to identify possible new products and opportunities to reformulate our existing products.
In 2011, we continued our relationship with the Linus Pauling Institute ("LPI") at Oregon State University. Our goal is to better determine and understand the function and role of micronutrients such as vitamins, minerals, and antioxidants in promoting optimal health and preventing disease. As part of this relationship, our in-house research team works closely with LPI on nutritional and clinical research. In 2012, we plan to continue our research efforts with LPI and maintain our ongoing nutrition research in preventing oxidative stress, glycemic stress, and chronic inflammation.
Our goal is to maintain a sharp focus on nutrition—both inside and outside the body—in promoting health and preventing chronic degenerative disease. Because we believe in focusing primarily on key health issues within our society rather than on fads, we typically do not introduce a new product
7
unless we believe that it can provide health benefits to a significant number of our customers. As a result, we maintain a focused and compact line of products, which we believe simplifies the selling and buying process for our Associates and Preferred Customers.
We follow pharmaceutical standards established by the U.S. Pharmacopeia and other pharmacopeias in the development and formulation of our products. Our ingredients are selected to meet a number of criteria, including, but not limited to: safety, potency, purity, stability, bio-availability, and natural versus synthetic. We control the quality of our products beginning at the formulation stage, and we maintain our quality control through controlled sourcing of raw ingredients, manufacturing, packaging, and labeling. In fiscal years 2009, 2010, and 2011, we expended $3.6 million, $3.8 million, and $4.1 million, respectively, on product research and development activities. We intend to continue dedicating resources at similar levels for research and development in future years.
Manufacturing and Quality Assurance
We conduct nearly all of the manufacturing, production and quality control operations for our nutritional and personal care products in-house. We have established and maintain a manufacturing and quality control facility in Salt Lake City, Utah. BabyCare manufactures and produces nearly all of its products in-house and maintains manufacturing and quality control facilities in Beijing, China and Tianjin, China. Additional information about our U.S. manufacturing, production and quality control operations is set out below.
Tablet Manufacturing
Tablet manufacturing is conducted at our Salt Lake City, Utah manufacturing facility. Our tablet production process uses automatic and semi-automatic equipment and includes the following activities: identifying and evaluating suppliers of raw materials, acquiring raw materials, analyzing raw material quality, weighing or otherwise measuring raw materials, mixing raw materials into batches, forming mixtures into tablets, coating and sorting the tablets, analyzing tablet quality, packaging finished products, and analyzing finished product quality. We conduct sample testing of raw materials, in-process materials, and finished products for purity, potency, and composition to determine whether our products conform to our internal specifications, and we maintain complete documentation for each of these tests. We employ a qualified staff of professionals to develop, implement and maintain a quality system designed to assure that our products are manufactured to our internal and applicable regulatory agency specifications.
Our Salt Lake City manufacturing facility is registered with the U.S. Food and Drug Administration ("FDA"), Health Canada Natural Health Products Directorate, the Australian Therapeutic Goods Administration ("TGA"), and other governmental agencies, as required. This facility is audited regularly by various organizations and government agencies to assess, among other things, compliance with Good Manufacturing Practice regulations ("GMPs") and with labeling claims. Based on these audits, our Salt Lake City manufacturing facility has received and maintains certifications from the Islamic Foods and Nutrition Counsel of America in compliance with Halal, NSF International in compliance with product testing and GMPs, and the TGA in compliance with the Therapeutic Goods Act of 1989.
The manufacture of nutritional or dietary supplements and related products in the United States requires compliance with dietary supplement GMPs, which are based on the food-model GMPs, with additional requirements that are specific to dietary supplements. We believe our manufacturing processes comply with the GMPs for dietary supplements.
8
Personal Care Manufacturing
Historically, we have manufactured the majority of our personal care products at our Draper, Utah manufacturing facility. In 2011, we moved the manufacturing of our personal care products to our Salt Lake City facility to maximize efficiency and reduce costs on these items. The production process for personal care products includes identifying and evaluating suppliers of raw materials, acquiring raw materials, analyzing raw material quality, weighing or otherwise measuring the raw materials, mixing raw materials into batches, analyzing liquid batch quality, packaging finished products, and analyzing finished product quality. We conduct sample testing of raw materials, in-process materials, and finished products for purity, potency, and composition to determine whether our products conform to our internal specifications, and we maintain complete documentation for each of these tests.
At our Salt Lake City facility, we have standard technology for producing batches of personal care items, and we have semi-automatic packaging equipment for packaging end products. We employ qualified staff to develop, implement, and maintain a quality system. Although the FDA has not promulgated GMPs for personal care items, it has issued guidelines for manufacturing personal care products. We voluntarily maintain compliance with the guidance established by FDA and the Personal Care Products Council.
Third-Party Suppliers and Manufacturers
We contract with third-party suppliers and manufacturers for the production of some of our products, which account for approximately 26% of our product sales. These third-party suppliers and manufacturers produce and, in most cases, package these products according to formulations that have been developed by, or in conjunction with, our in-house product development team. These products include most of our gelatin-capsulated supplements, Rev3 Energy™ Drink, Probiotic, our powdered drink mixes and nutrition bars, and certain of our personal care products. Products manufactured at these locations must also go through quality control and assurance procedures to ensure they are manufactured in conformance with our specifications.
Quality Control/Assurance
We conduct quality control processes in two in-house laboratories that are located in Salt Lake City, Utah. In our microbiology laboratory, scientists test for biological contamination of raw materials and finished goods. In our analytical chemistry laboratory, scientists test for chemical contamination and accurate levels of active ingredients in both raw materials and finished products. Both laboratories conduct stability tests on finished products to determine the shelf life of our products. Our laboratory staff also performs chemical assays on vitamin and mineral constituents, using United States Pharmacopoeia methods and other internally validated methods. In addition to our quality control and clinical laboratories, our headquarters facility also houses a laboratory designated for research and development. We also perform processes similar to those described above at our labs in China.
Raw Materials
Most of the raw ingredients that are used in the manufacture of our products are available from a number of suppliers. We have not generally experienced difficulty in obtaining necessary quantities of raw ingredients. When supplies of certain raw materials have tightened, we have been able to find alternative sources of raw materials, and believe we will be able to do so in the future, if the need arises. Accordingly, we are not subject to a single-source supplier for our required supplies of raw ingredients. Our raw material suppliers must demonstrate stringent process and quality control before we use their products in our manufacturing process.
9
General
We distribute our products internationally through a network marketing system, which is a form of person-to-person direct selling. Under this system, distributors purchase products at wholesale prices from the manufacturer for resale to consumers and for personal consumption. The concept of network marketing is based on the strength of personal recommendations that frequently come from friends, neighbors, relatives, and close acquaintances. We believe that network marketing is an effective way to distribute our products because it allows person-to-person product education and testimonials as well as higher levels of customer service, all of which are not as readily available through other distribution channels.
Structure of Network Marketing Program
Associates. A person who wishes to sell USANA products must join our independent sales force as an Associate. A person becomes an Associate by completing an application under the sponsorship of an existing Associate. The new Associate then becomes part of the sponsoring Associate's "down-line" sales organization. New Associates sign a written contract and agree to adhere to the USANA policies and procedures. Under the policies and procedures, Associates may not, among other things: (i) use deceptive or unlawful practices to sell USANA products; (ii) make deceptive or unlawful claims or representations concerning our products or Compensation Plan; or (iii) sell competitive products to other USANA Associates or solicit USANA Associates to participate in other network marketing opportunities. New Associates are required to purchase a starter kit that includes a detailed manual describing our business and products as well as our policies and procedures. We sell these kits at a nominal cost averaging $30 in each of our markets. No other investment is required to become an Associate and start a home-based business with USANA.
Once a person becomes an Associate, he or she is able to purchase products directly from us at wholesale prices for personal use and resale to customers. Our Associates are also entitled to build sales organizations by attracting and enrolling new Associates and establishing a network of product users. The sponsoring of new Associates results in the creation of multiple levels within our network marketing structure. Sponsored Associates are referred to as part of the "down-line" of the sponsoring Associate. Down-line Associates may also sponsor new Associates, creating additional levels in their network, but also forming a part of the same down-line as the original sponsoring Associate. As outlined below, Associates who are interested in earning additional income must successfully sell USANA products and establish a business network/down-line in order to qualify for commissions, including bonuses. Subject to payment of a minimal annual account renewal fee, Associates may continue to distribute or consume our products as long as they adhere to our policies and procedures.
Individuals who reside in China and who are interested in being part of USANA's organization in China may do so by joining BabyCare as an Associate. The process for joining BabyCare is very similar to the process for joining USANA and requires an initial Associate application and an agreement by the Associate to adhere to the policies and procedures in China. Much like our operations in other markets, an Associate in China is provided with opportunities to build a sales organization and receive compensation for sales generated by that organization. Associates in China do not participate in USANA's Compensation Plan and, therefore, are compensated under the plan created and implemented specifically for China.
Preferred Customers. We also sell directly to customers who purchase products only for personal use. This program is our "Preferred Customer" program. Preferred Customers may not resell or distribute our products. We believe this program gives us access to a market that would otherwise be missed, by targeting customers who enjoy USANA products, but who prefer not to maintain a distribution relationship with us. Although our policies prohibit Preferred Customers from engaging in
10
retail sales of products, they may enroll as Associates at any time, if they desire. Preferred Customers are not eligible to earn commissions or to participate in our Compensation Plan. Our China operations also utilize a Preferred Customer program, which is similar to USANA's Preferred Customer program in other markets.
Associate Training and Motivation
Initial training of Associates about the products, the Compensation Plan, network marketing, and about USANA is provided primarily by an Associate's sponsor and others in their sales organization. We develop and sell training materials and sales tools to assist Associates in building their businesses, as well as provide reprints from other commercial publications that feature USANA and may be used as sales tools. We also sponsor and conduct regional, national, and international Associate events, as well as intensive leadership training seminars. Attendance at these sessions is voluntary, and we undertake no generalized effort to provide individualized training to Associates, although experience shows that the most effective and successful Associates participate in training activities. Although we provide leadership training and sales tools, we ultimately rely on our Associates to: sell our products, attract new Associates and Preferred Customers to purchase our products, and educate and train new Associates regarding our products and Compensation Plan.
Associate Compensation
As outlined below, our Compensation Plan provides several opportunities for Associates to earn compensation, provided they are willing to consistently work at building, training, and retaining their down-line organizations to sell USANA products to consumers. The purpose behind each form of compensation under our Compensation Plan is to reward Associates for generating product sales either directly or indirectly through their down-line sales organization and network of product consumers. We believe our Compensation Plan is among the most generous in the network marketing industry and distinctive for its weekly payouts to Associates.
Associates can earn compensation in four ways:
- •
- Commissions. The primary way an Associate is compensated
is through earning commissions. Associates earn commissions through generating sales volume points, which are a measure of the product sales of their down-line sales organization. Sales
volume points are assigned to each of our products and comprise a certain percent of the product price in U.S. dollars. To be eligible to earn commissions, an Associate must purchase a certain amount
of product each month ("Qualifying Purchases"), which they may resell to consumers or use personally. Associates do not earn commissions on these Qualifying Purchases. Associates only earn commissions
on the purchase of products by Associates in their down-line organization and Preferred Customers. Additionally, Associates do not earn commissions for simply recruiting and enrolling
others in their down-line organization. Commissions are paid only when products are sold. We pay Associate commissions on a weekly basis. As noted elsewhere in this report, our China
operations maintain their own compensation plan, which is structured differently than USANA's plan in other markets.
- •
- Bonuses. We offer Associates several bonus opportunities,
including our leadership bonus, elite bonus, and matching bonus. These bonus opportunities are based on a pay-for-performance philosophy and, therefore, are paid out when the
Associate achieves the required performance measures.
- •
- Retail Mark-Ups. As discussed previously, our Associates purchase products from us at wholesale prices and resell them to consumers at higher retail prices. The Associate retains the retail mark-up as another form of compensation.
11
- •
- Contests and Promotions. We periodically sponsor contests and promotions designed to incentivize Associates to generate sales and grow their down-line organization and product users. These promotions are also based on a pay-for-performance philosophy and, therefore, are only paid upon the achievement of the promotion objectives.
We endeavor to integrate our Compensation Plan seamlessly across all markets where legally permissible, allowing Associates to receive commissions for global—not merely local—product sales. This seamless down-line structure is designed to allow an Associate to build a global network by establishing or expanding their down-line in any of the markets where we operate. We believe our Compensation Plan significantly enhances our ability to expand internationally, and we intend, where permitted, to continue to integrate new markets into our Compensation Plan. As a result of the direct selling laws in China, our Associates in that market do not participate in USANA's Compensation Plan. Instead, they are compensated under a plan that has been created and implemented specifically for China.
Our principal objective is to be a leading developer, manufacturer and distributor of science-based nutritional and personal care products and to create a rewarding opportunity through network marketing for our Associates who distribute our products. Our strategy is to capitalize on our operating strengths, which include: a strong research and development program; in-house manufacturing capability; science-based products; an attractive Associate compensation plan; a scalable business model; and an experienced management team.
Emphasis on Research and Development. We have a technical team of experienced scientists, including several holding Ph.D. degrees, quality engineers, and regulatory specialists who contribute to our research and development activities. In our research and development laboratories, our scientists and researchers:
- •
- Investigate activities of natural extracts and formulated products in laboratory and clinical settings;
- •
- Identify and research combinations of nutrients that may be candidates for new products;
- •
- Develop new nutritional ingredients for use in supplements;
- •
- Study the metabolic activities of existing and newly identified nutritional ingredients;
- •
- Enhance existing products, as new discoveries in nutrition and skin care are made; and
- •
- Formulate products to meet diverse regulatory requirements across all of our markets.
Our scientists and researchers also conduct double-blind, placebo-controlled, clinical studies which are intended to further evaluate the efficacy of our products. In addition, we work with outside research organizations to further support various aspects of our research and development efforts. One of these organizations is the Linus Pauling Institute at Oregon State University. Our work with the Linus Pauling Institute advances the science of human nutrition and health, provides us with valuable information to formulate and upgrade our nutritional products, and allows us to better advise our customers on how to use USANA products. We have also funded clinical research programs at Boston University, the University of Colorado, the University of Utah, Sydney University in Australia, The Orthopedic Specialty Hospital ("TOSH") and Utah State University. Additionally, our Scientific Advisory Council, comprised of health care professionals and nutritional science experts worldwide, provides us with valuable insights into product applications and efficacy. It is through our internal research and development efforts and our relationships with outside research organizations and health care providers that we can provide what we believe to be some of the highest quality health products in the industry.
12
In-house Manufacturing. We manufacture products that account for approximately 74% of our product sales. We believe that our ability to manufacture our own products in-house is a significant competitive advantage for the following reasons:
- •
- We can better control the quality of raw materials and finished products;
- •
- We can more reliably monitor the manufacturing process to better guarantee potency and bioavailability and to reduce the
risk of product contamination;
- •
- We can better control production schedules to increase the likelihood of maintaining an uninterrupted supply of products
for our customers;
- •
- We are able to produce most of our own prototypes in the research phase of product development; and
- •
- We are better able to manage the underlying costs associated with manufacturing our products.
Science-based Products. As a result of our emphasis on research and development and our in-house manufacturing capabilities, we have developed a focused line of high-quality health products that we believe provides health benefits to our customers. Our products have been developed based on a combination of published research, in-house laboratory and third-party clinical studies, and sponsored research. Additionally, we design, manufacture, package, and label our products in a manner that we believe is consistent with the more stringent pharmaceutical standards, rather than the standards set for dietary supplements.
Attractive Associate Compensation Plan and Support. We are committed to increasing our product sales by providing a highly competitive compensation plan to attract and retain Associates who constitute our sales force. We believe that our Compensation Plan is one of the most financially rewarding in the network marketing industry. We further incent our Associates by paying incentives on a weekly basis. Additionally, our Compensation Plan is, where legally permissible, a global-seamless plan, meaning that Associates can be compensated each week for their business success in any market in which they have a down-line organization where we conduct business. As noted elsewhere in this report, our China operations maintain their own compensation plan, which is structured differently than USANA's plan in other markets. We believe that our compensation plan in China is also among the most rewarding distributor compensation plans in that market.
To support our Associates, we sponsor meetings and events throughout the year, which offer information about our products and our network marketing system. These meetings are designed to assist Associates in business development and to provide a forum for interaction with some of our Associate leaders and with members of the USANA management team. We also provide low-cost sales tools and resources, which we believe are an integral part of building and maintaining a successful home-based business for our Associates. For example, we offer an interactive presentation tool, called Health and Freedom Solution, which was created and designed to help our Associates easily explain and share the USANA opportunity, including the benefits of our products and our Compensation Plan.
In addition to Company-sponsored meetings and sales tools and resources, we maintain a website exclusively for our Associates, where they can keep up on the latest USANA news, obtain training materials, manage their personal information, enroll new customers, shop for products, and register for Company-sponsored events. Additionally, through this website, Associates can access other online services to which they may subscribe. For example, we offer an online business management service, which includes a tool that helps Associates track and manage their business activity, a personal webpage to which prospects or retail customers can be directed, e-cards for advertising, and a tax tracking tool.
We also believe that recognition is an important factor in supporting and retaining our Associates. We understand that being a successful USANA Associate requires hard work and dedication. We
13
frequently hold a variety of contests and promotions, rewarding our Associates for their achievements to help motivate them and recognize their efforts. We also celebrate key achievements and rank advancements of our Associates. We believe that our recognition programs and contests greatly contribute to our ability to retain our Associates.
Business Model. We believe that our business model provides, among others, the following advantages:
- •
- No requirement for a company-employed sales force to sell our products, with a relatively low incremental cost to add a
new Associate;
- •
- Commissions paid to our Associates are tied to sales performance;
- •
- Accounts receivable are minimal because payment is required at the time an Associate or Preferred Customer purchases
product;
- •
- A stream of recurring revenue from our monthly product subscription program known as "Autoship," which we utilize in all
of our markets (for the year ended December 31, 2011, this program represented 35% of our sales); and
- •
- We can expand into new international markets with moderate investment because, for markets other than China, we generally maintain only one administrative and customer support office and one warehouse in each of these markets.
Experienced Management Team. Our management team includes individuals with expertise in various scientific and managerial disciplines, including nutrition, product research and development, international development, marketing, customer network development, information technology, finance, legal, regulatory and operations. This team is responsible for supporting growth, research and development, international expansion, strengthening our financial condition, and improving our internal controls.
We seek to grow our business by pursuing the following strategies:
Attract and Retain Associates. Our Associates are the key to the growth of our business. Accordingly, we must continue to attract and retain Associates. For this reason, our management team maintains a close working relationship with our Associate leaders. One of our key initiatives in 2012 is to continue to strengthen this working relationship by holding more in-person meetings between management and Associates and by providing additional leadership training for Associates. In addition to our Annual International Convention and our Asia Pacific Convention, we hold several regional events in key growth areas to provide support and training to new Associates. Additionally, we continue to increase our investment in these events and in the marketing of our Compensation Plan to aid Associates in improving the productivity of their businesses. Over the last couple of years we have worked closely with certain of our Associate leaders to develop new and unique training tools to assist in the personal development and growth of our new Associates. These training tools are designed to serve as a guide for someone new to USANA and network marketing who has the entrepreneurial spirit to own and operate a home-based business. In addition to these new sales tools, we have also increased our emphasis on building global awareness of the USANA brand. This includes our new sponsorship of the U.S. Ski Team, as well as our enhanced partnership with the Women's Tennis Association ("WTA"). Not only are we the official health supplement supplier to the WTA, but we now have six top players who are dedicated to promoting our products and brand. We seek to leverage this relationship to build brand credibility and increase product consumption and loyalty. In addition to our sponsorship of professional athletes, we seek to advertise and collaborate with credible, nationally recognized organizations and individuals to enhance our global brand. In 2012, we began a strategic
14
relationship with Dr. Mehmet Oz. Over the past 5 or 6 years, the world has witnessed the overwhelming rise in popularity of Dr. Oz and, now, he has become a nationally recognized part of American culture. In January 2012, Dr. Oz participated as a surprise guest on the USANA monthly leadership call and the response from our Associates was overwhelmingly positive. In February 2012, USANA participated in "The Health and Happiness Summit with Dr. Oz" at Radio City Music Hall in New York City. Dr. Wentz and Dave Wentz directly participated in this event and thousands of our Associates attended this event as well. Going forward, this relationship will include Dr. Oz's participation on future leadership calls and, more importantly, his participation at our Annual International Convention in August 2012. While branding efforts such as this have a global reach, the primary objective of this initiative is to grow sales and the number of Associates in North America.
Successfully Develop China. In light of the rapid growth in our Asia Pacific region and our successful Asian Associate base, we believe that China represents the most significant and imminent growth opportunity for us. To capitalize on this opportunity, in August 2010, we indirectly acquired BabyCare, a direct selling company organized under the laws of China. We believe our acquisition of BabyCare accelerates our growth potential in China for several reasons, including: (i) the license granted to BabyCare from the Chinese government, which allows BabyCare to engage in direct selling in the municipality of Beijing; and (ii) BabyCare's existing management team, which has agreed to continue to operate BabyCare and has extensive experience in the Chinese direct selling market as well as in Chinese government relations. BabyCare is working to obtain similar direct selling licenses in other provinces within China. Our growth strategy in China entails continuing to register USANA products in China and educate our Associates on BabyCare's Compensation Plan in China. In 2011, we successfully launched several of our key Optimizers and Sensé products in China through BabyCare. The launch of these products expanded our presence in China's adult supplement market and, consequently, expanded our Associates' sales opportunities to existing and prospective Chinese customers.
Introduce New and Re-formulate Existing Products. Our research and development team is continually reviewing the latest scientific findings related to nutrition, conducting in-house research and clinical trials, looking at new technologies, and attending scientific conferences. If, in the process, we see potential for a new product or ingredient that provides a measurable and important health benefit, and if we believe this benefit can be realized by our customers, we will generally pursue development of that product. Our research and development focus in 2012 and going forward will be centered on personalization and innovation. To the extent reasonably possible, we intend to personalize our product offering and product delivery systems to our customers' individual needs. An example of our personalization efforts is our MyHealthPak™ product, which is a fully customized, pre-packaged supplement regimen that can include virtually any of our Essentials and Optimizers. We will also enhance our focus on innovation to develop new products and technologies. To facilitate this, we have expanded our research and development team, increased our research and development investment, and expanded our collaborations with outside scientific experts and organizations.
Enter New Markets. We believe that significant growth opportunities continue to exist in markets where we currently conduct business and in new international markets. In 2011, we announced our intent to become more aggressive in our international expansion efforts. To this end, we announced that we would commence operations in Thailand, France and Belgium in 2012. We expect our operations in France and Belgium to begin at the end of the first quarter of 2012, and we expect our operations in Thailand to have fully commenced by the middle of the second quarter of 2012. These new markets, as well as any future markets we may consider, are selected following an assessment of several factors, including market size, anticipated demand for USANA products, receptiveness to network marketing, and the market entry process, which includes consideration of possible regulatory restrictions on our products or our network marketing system. We have also begun to register certain products with regulatory and government agencies in other countries in preparation for further
15
international expansion. Wherever possible, we expect to seamlessly integrate the Compensation Plan in each market to allow Associates to receive commissions for global—not merely local—product sales. This seamless down-line structure is designed to allow an Associate to build a global network by creating a down-line across national borders. We believe our seamless Compensation Plan significantly enhances our ability to expand internationally, and we intend, where permitted, to integrate the future markets that we open into this plan. While we deem new market expansion as a key growth strategy, given the significant opportunity that currently exists in China, we plan to focus the majority of our time and resources on growing sales in that market.
Pursue Strategic Acquisitions. We believe that attractive acquisition opportunities may arise in the future. We intend to pursue strategic acquisition opportunities that would grow our customer base, expand our product lines, enhance our manufacturing and technical expertise, allow vertical integration, or otherwise complement our business or further our strategic goals.
Personalization. In pursuing the personalization of our products, technologies, and systems to meet the individual needs of our Associates, we will look to and consider the opportunities that each of the above items present in helping to accomplish this objective. We plan to introduce some of the results of our focus on personalization and innovation at our Annual International Convention in 2012.
We compete with manufacturers, distributors, and retailers of nutritional products for consumers, and with network marketing companies for distributors. On both fronts, some of our competitors are significantly larger than we are, have longer operating history, higher visibility and name recognition, and greater financial resources than we do. We compete with these entities by emphasizing the underlying science, value, and superior quality of our products, the simplicity in our product offerings, and the convenience and financial benefits afforded by our network marketing system and global seamless Compensation Plan.
Our business is driven primarily by our distributors, whom we refer to as Associates. Our ability to compete with other network marketing companies depends, in significant part, on our success in attracting and retaining Associates. There can be no assurance that our programs for attracting and retaining Associates will be successful. The pool of individuals interested in network marketing is limited in each market and is reduced to the extent other network marketing companies successfully attract these individuals into their businesses. Although we believe that we offer an attractive opportunity for our Associates, there can be no assurance that other network marketing companies will not be able to recruit our existing Associates or deplete the pool of potential Associates in a given market.
We believe that the leading network marketing company in the world, based on total sales, is Amway Corporation and its affiliates, and that Avon Products, Inc. is the leading direct seller of beauty and related products worldwide. Leading competitors in the nutritional network marketing and nutritional product industry include Herbalife Ltd., Inc.; Nu Skin Enterprises, Inc.; and NBTY, Inc. Based on information that is publicly available, 2010 net sales of the aforementioned companies ranged from $1.5 billion to $10.3 billion. There are other manufacturers of competing product lines that have or may launch direct selling enterprises that compete with us in certain product lines and in the recruiting of Associates. There can be no assurance that we will be able to successfully meet the challenges posed by increased competition.
Product returns have not been a material factor in our business, totaling approximately 1.6% in 2009, and 1.1% in both 2010 and 2011. Because our emphasis on customer satisfaction is a hallmark of our business model, our standard policy allows Associates to return any unused product from their first
16
purchase within the first 30 days following their purchase for a 100% refund of the sales price. Thereafter, any returned product that is unused and resalable is refunded up to one year from the date of purchase at 100% of the sales price, less a 10% restocking fee. According to the terms of the Associate agreement, return of product where the purchase amount exceeds $100 and was not damaged at the time of receipt by the Associate may result in cancellation of the Associate's distributorship. Depending upon the conditions under which product was returned Associates and Preferred Customers may either receive a refund based on their original form of payment, or credit on account for a product exchange. This standard policy differs slightly in a few of our international markets due to the regulatory environment in those markets.
Sales are made to independent Associates and Preferred Customers. No single customer accounted for 10% or more of net sales. Notwithstanding the foregoing, the nature of our business model results in a significant amount of sales to several different Associate leaders and their downline sales organizations. Although no single Associate accounted for 10% or more of our net sales, the loss of a key Associate leader or that Associate's downline sales organization could adversely affect our net sales and our overall operating results.
We continually monitor and review our Associates' compliance with our policies and procedures as well as the laws and regulations applicable to our business. Part of this review entails an assessment of our Associates' sales activities to ensure that Associates are actually selling products to consumers. Our policies and procedures require Associates to present our products and the USANA opportunity ethically and honestly. Associates are not permitted to make claims about our products or Compensation Plan that are not consistent with our policies and procedures and applicable laws and regulations. The majority of our Associates must use marketing and promotional materials provided by USANA. Associates who have achieved a certain leadership threshold are permitted, however, to produce their own marketing and promotional materials, but only if such materials are approved by USANA prior to use.
From time to time, some Associates fail to adhere to our policies and procedures. We systematically review reports of alleged Associate misbehavior. Infractions of the policies and procedures are reported to our compliance group, who determine what disciplinary action is warranted in each case. More serious infractions are reported to our Compliance Committee, which includes USANA executives. If we determine that an Associate has violated any of our policies and procedures, we may take a number of disciplinary actions, such as warnings, fines or probation. We may also withdraw or deny awards, suspend privileges, withhold commissions until specific conditions are satisfied, or take other appropriate actions in our discretion. More serious infractions may result in termination of the Associate's purchase and distribution rights.
We believe that Associate compliance is critical to the integrity of our business, and, therefore, we are aggressive in ensuring that our Associates comply with our policies and procedures. As explained above, when an Associate fails to comply with our policies and procedures, we may terminate their purchase and distribution rights. From time to time, we become involved in litigation with Associates whose purchase and distribution rights have been terminated. We consider such litigation to be routine and incidental to our business and will continue to be aggressive in ensuring that our Associates comply with our policies and procedures.
17
We believe that the ability to efficiently manage distribution, compensation, manufacturing, inventory, and communication functions through the use of sophisticated and dependable information processing systems is critical to our success. Our information technology resources are maintained primarily by our in-house staff to optimally support our customer base and core business processes. Our IT staff manages an array of systems and processes which support our global operations 24 hours a day and 365 days a year. Three of our most critical applications include:
- •
- A web-based application that provides online services to Associates, such as training sessions and
presentations, online shopping, enrollment, real-time reporting engine, Company and product information, web-hosting, email, and other tools to help Associates effectively
manage their business and down-line organizations.
- •
- A web-based order-entry system that handles order entry, customer information, compensation, the hierarchy of
Associates, returns, invoices, and other transactional-based processes.
- •
- A fully integrated world-wide Enterprise Resource Planning ("ERP") system that handles accounting, human resources, inventory management, production processes, quality assurance, and reporting requirements in a multinational environment.
Our web applications are supported by a clustered environment and a redundant system outside of our home office, which serves as a disaster recovery site.
Product Regulation. Numerous governmental agencies in the United States and other countries regulate the manufacturing, packaging, labeling, advertising, promoting, distributing, and the selling of nutrition, health, beauty, and weight-management products. In the United States, advertisement of our products is regulated by the Federal Trade Commission ("FTC") under the FTC Act and, where such advertising is considered to be product labeling by the FDA, under the Food, Drug, and Cosmetic Act ("FDCA") and the regulations thereunder. USANA products in the U.S. are also subject to regulation by, among others, the Consumer Product Safety Commission, the U.S. Department of Agriculture, and the Environmental Protection Agency. The manufacturing, labeling, and advertising of our products are also regulated by various governmental agencies in each country in which they are distributed. For example, in Australia, product registration, labeling and manufacturing is regulated by the TGA and, in Japan, the Ministry of Health, Labor and Welfare. In China, the State Food and Drug Administration ("SFDA") regulates product registration, labeling and manufacturing.
Our largest selling product group includes products that are regulated as dietary supplements under the FDCA. Dietary supplements are also regulated in the United States under the Dietary Supplement Health and Education Act of 1994 ("DSHEA"), which we believe is generally favorable to the dietary supplement industry. Some of our powdered drink, food bar, and other nutrition products are regulated as foods under the Nutrition Labeling and Education Act of 1990 ("NLEA"). The NLEA establishes requirements for ingredient and nutritional labeling including product labeling claims.
The manufacture of nutritional or dietary supplements and related products in the United States requires compliance with dietary supplement GMPs, which are based on the food-model GMPs, with additional requirements that are specific to dietary supplements. We believe our manufacturing processes comply with these GMPs for dietary supplements.
In general, our personal care products, which are regulated as cosmetic products by the FDA, are not subject to pre-market approval by that agency. Cosmetics, however, are subject to regulation by the FDA under the FDCA adulteration and misbranding provisions. Cosmetics also are subject to specific labeling regulations, including warning statements, if the safety of a cosmetic is not adequately
18
substantiated or if the product may be hazardous, as well as ingredient statements and other packaging requirements under the Fair Packaging and Labeling Act. Cosmetics that meet the definition of a drug (i.e., that are intended to treat or prevent disease or affect the structure or function of the body), such as sunscreens, are regulated as drugs. Over-the-counter ("OTC") drug products, including cosmetics, may be marketed if they conform to the requirements of the OTC monograph that is applicable to that drug. Drug products not conforming to monograph requirements require an approved New Drug Application ("NDA") before marketing may begin. Under these provisions, if the agency were to find that a product or ingredient of one of our OTC drug products is not generally recognized as safe and effective or is not included in a final monograph that is applicable to one of our OTC drug products, we would be required to reformulate or cease marketing that product until it is the subject of an approved NDA or until the time, if ever, that the monograph is amended to include such product.
Advertising of our products in the U.S. is subject to regulation by the FTC under the FTC Act. Under the FTC's Substantiation Doctrine, an advertiser is required to have a "reasonable basis" for all objective product claims before the claims are made. Failure to adequately substantiate claims may be considered either deceptive or unfair practices. Pursuant to this FTC requirement, we are required to have adequate substantiation for all material advertising claims that we make for our products in the U.S.
In recent years, the FTC has initiated numerous investigations of and actions against companies that sell dietary supplement, weight-management, and cosmetic products. The FTC has issued guidance to assist companies in understanding and complying with its substantiation requirement. We believe that we have adequate substantiation for all material advertising claims that we make for our products in the U.S., and we believe that we have organized the documentation to support our advertising and promotional practices in compliance with these guidelines. However, no assurance can be given that the FTC would reach the same conclusion if it were to review or question our substantiation for our advertising claims in the U.S.
The FTC may enforce compliance with the law in a variety of ways, both administratively and judicially, using compulsory process, cease and desist orders, and injunctions. FTC enforcement can result in orders requiring, among other things, limits on advertising, corrective advertising, consumer redress, divestiture of assets, rescission of contracts, and such other relief as the agency deems necessary to protect the public. Violation of these orders could result in substantial financial or other penalties. Although, to our knowledge, we have not been the subject of any action by the FTC, no assurance can be given that the FTC will not question our advertising or other operations in the U.S. in the future. Any action in the future by the FTC could materially and adversely affect our ability to successfully market our products in the U.S.
The Dietary Supplement & Nonprescription Drug Consumer Protection Act requires manufacturers of dietary supplement and over-the-counter products to notify the FDA when they receive reports of serious adverse events occurring within the United States. We have an internal adverse event reporting system that has been in place for several years and believe that we are in compliance with this law.
In markets outside the United States, prior to commencing operations or marketing products, we may be required to obtain approvals, licenses, or certifications from a country's Food Administration, Ministry of Health or comparable agency. Approvals or licensing may be conditioned on reformulation of USANA products for the market or may be unavailable with respect to certain products or product ingredients. We must also comply with local product labeling and packaging regulations that vary from country to country. For example, China extensively regulates the registration, labeling and marketing of our products. In China, our nutritional products are typically classified as "health foods" and our personal care products are typically classified as "non-special purpose cosmetics". The registration process for health foods is complex and generally requires extensive analysis and approval by the
19
SFDA. As a result, it may take several years to register a product as a health food in China. In addition to the health food products for which registration has already been successfully completed, we registered several USANA health food products and introduced these products for sale by our Associates in China during 2011. We continue to work through the registration process for other health food products, which we also hope to begin selling through BabyCare in the future.
We cannot predict the nature of any future laws, regulations, interpretations, or applications, nor can we determine what effect additional governmental regulations or administrative orders, when and if promulgated, would have on our business. Future changes could include requirements for the reformulation of certain products to meet new standards, the recall or discontinuation of certain products that cannot be reformulated, additional record keeping, expanded documentation of the properties of certain products, expanded or different labeling, and additional scientific substantiation. Any or all of these requirements could have a material adverse effect on our business, financial condition, and operating results.
Network Marketing Regulation. Laws and regulations in each country in which we operate prevent the use of deceptive or fraudulent practices that have sometimes been inappropriately associated with legitimate direct selling and network marketing activities. Generally these laws are directed at ensuring that product sales ultimately are made to consumers and that advancement within sales organizations is based on sales of the enterprise's products, rather than on investments in the organizations or on other criteria or activity that are not related to retail sales. Where required by law, we obtain regulatory approval of our network marketing system, or, where approval is not required or available, the favorable opinion of local counsel as to regulatory compliance.
In addition to the FTC, each state has enacted its own "Little FTC Act" to regulate sales and advertising. Occasionally, we receive requests to supply information regarding our network marketing plan to regulatory agencies. Although we have, from time to time, modified our network marketing system to comply with interpretations of various regulatory authorities, we believe that our network marketing program is compliant with the laws and regulations relating to network marketing activities in our current markets. Nevertheless, we remain subject to the risk that, in one or more of our present or future markets, the marketing system or the conduct of certain Associates could be found not to be compliant with applicable laws and regulations. Failure by an Associate or by us to comply with these laws and regulations could have a material adverse effect on our business in a particular market or in general.
The direct selling laws and regulations in China require us to operate under a business model, which is different from our global business model. To expand into China and comply with these regulations, we indirectly acquired BabyCare in August 2010 and will utilize BabyCare's existing business model, which has been designed specifically for China. China's direct selling regulations contain both financial and operational restrictions for direct selling companies. For example, BabyCare, and other direct selling companies, are not permitted to pay multi-level compensation to sales representatives and are also limited in the amount of single-level compensation that they may pay to sales representatives. Additionally, BabyCare is required to obtain various licenses and approvals to conduct its direct selling business in China. BabyCare has been granted a license to engage in direct selling activities in the municipality of Beijing and is working to obtain similar licenses in other cities and provinces. This license allows BabyCare to operate under its direct selling business model in Beijing by utilizing non-employee sales representatives to sell products away from fixed retail locations. In cities and provinces where BabyCare has not been issued a direct selling license, it must operate under a retail sales model. Under this retail model, BabyCare utilizes non-employee sales representatives to sell its products through retail stores in the applicable city or province. BabyCare has also engaged independent service providers that meet both the requirements to operate their own business under Chinese law as well as the conditions set forth by BabyCare to sell products and provide services to BabyCare customers. If, and when, BabyCare receives a direct selling license in other cities
20
and provinces, it will continue to transition away from this retail model and integrate its direct selling business model in these cities and provinces.
We cannot predict the nature of any future law, regulation, interpretation, or application, nor can we predict what effect additional governmental legislation or regulations, judicial decisions, or administrative orders, when and if promulgated, would have on our business. It is possible that future legal requirements may require that we revise our network marketing program. Such new requirements could have a material adverse effect on our business, financial condition, and operating results.
Transfer Pricing Regulation. In the U.S. and many other countries, we are subject to transfer pricing and other tax regulations that are designed to ensure that appropriate levels of income are reported by our U.S. or international entities and are taxed accordingly. We have adopted transfer prices, which are supported by a formal transfer pricing study for the sale of products to our subsidiaries in accordance with applicable transfer pricing laws. In addition, agreements between our subsidiaries and us have been entered into for services and contractual obligations, such as the payment of Associate incentives that are also supported by the same formal transfer pricing study. If the U.S. Internal Revenue Service or the taxing authorities of any other jurisdiction were to successfully challenge these agreements or require changes in our standard transfer pricing practices for products, we could become subject to higher taxes and our earnings may be adversely affected. The tax treaties between the U.S. and most countries provide competent authority for relief to avoid any double taxation. We believe that we operate in compliance with all applicable transfer pricing regulations. There can be no assurance, however, that we will continue to be found to be operating in compliance with transfer pricing regulations or that those laws will not be modified, which may require that we change our operating procedures.
Trademarks. We have developed and we use registered trademarks in our business, particularly relating to our corporate and product names. We own 16 trademarks that are registered with the United States Patent and Trademark Office. Federal registration of a trademark enables the registered owner of the mark to bar the unauthorized use of the registered mark in connection with a similar product in the same channels of trade by any third-party anywhere in the United States, regardless of whether the registered owner has ever used the trademark in the area where the unauthorized use occurs. We have filed applications and own trademark registrations, and we intend to register additional trademarks in countries where USANA products are or may be sold in the future. Protection of registered trademarks in some jurisdictions may not be as extensive as the protection in the United States.
We also claim ownership and protection of certain product names, unregistered trademarks, and service marks under common law. Common law trademark rights do not provide the same level of protection that is afforded by the registration of a trademark. In addition, common law trademark rights are limited to the geographic area in which the trademark is actually used. We believe these trademarks, whether registered or claimed under common law, constitute valuable assets, adding to recognition of USANA and the effective marketing of USANA products. Trademark registration once obtained is essentially perpetual, subject to the payment of a renewal fee. We therefore believe that these proprietary rights have been and will continue to be important in enabling us to compete.
Trade Secrets. We own certain intellectual property, including trade secrets that we seek to protect, in part, through confidentiality agreements with employees and other parties. Even where these agreements exist, there can be no assurance that these agreements will not be breached, that we would have adequate remedies for any breach, or that our trade secrets will not otherwise become known to or independently developed by competitors. Our proprietary product formulations are generally considered trade secrets, but are not otherwise protected under intellectual property laws.
21
Patents. We have three U.S. patents. Two of our patents relate to the method of extracting an antioxidant from olives and the byproducts of olive oil production. These patents were issued in 2002 and will continue in force until December 20, 2019. In 2003, we entered into a licensing agreement with a supplier to make olive extract using our patented process. Our third patent relates to a method of self-preserving our Sensé™ line of personal care products. This patent was issued in May 2007 and will continue in force until August 5, 2024.
We intend to protect our legal rights concerning intellectual property by all appropriate legal action. Consequently, we may become involved from time to time in litigation to determine the enforceability, scope, and validity of any of the foregoing proprietary rights. Any patent litigation could result in substantial cost and divert the efforts of management and technical personnel.
We typically see a decrease in the activity of many of our North American Associates during the third quarter due to the summer vacation season. Additionally, many Associates reduce their spending prior to our International Convention, which is held toward the end of the third quarter every year, in anticipation of new product launches or product upgrades.
Similarly, we typically see a decrease in the activity of many of our Asia Pacific Associates during the first quarter due to cultural events such as Chinese New Year.
Our products are typically shipped within 72 hours after receipt of an order. As of March 2, 2012 we had no significant backlog of orders.
We maintain sufficient amounts of inventory in stock in order to provide a high level of service to our Associates and Preferred Customers. Substantial inventories are required to meet the needs of our dual role as manufacturer and distributor. We also watch seasonal commodity markets and may buy ahead of normal demand to hedge against cost increases and supply risks.
We are not aware of any instance in which we have contravened federal, state, or local laws relating to protection of the environment or in which we otherwise may be subject to liability for environmental conditions that could materially affect operations.
As of March 2, 2012 we had approximately 1,290 employees worldwide, as measured by full-time equivalency. Our employees are not currently represented by a collective bargaining agreement, and we have not experienced work stoppages as a result of labor disputes. We believe that we have a good relationship with our employees.
Additional Available Information
We maintain executive offices and principal facilities at 3838 West Parkway Boulevard, Salt Lake City, Utah 84120. Our telephone number is (801) 954-7100. We maintain a World Wide Web site at www.usanahealthsciences.com. The information on our web site should not be considered part of this report on Form 10-K.
22
We make available, free of charge at our corporate web site, copies of our annual reports on United States Securities and Exchange Commission ("SEC") Form 10-K, quarterly reports on SEC Form 10-Q, current reports on SEC Form 8-K, proxy statements, and all amendments to these reports, as soon as reasonably practicable after such material is electronically filed with or furnished to the SEC pursuant to Section 13(a) or 15(d) of the Exchange Act. This information may also be obtained from the SEC's on-line database, which is located at www.sec.gov.
Forward-Looking Statements and Certain Risks
We encounter substantial risks in our business, any one of which may adversely affect our business, results of operations or financial condition. The fact that some of these risk factors may be the same or similar to those that we have filed with the Securities and Exchange Commission in past reports, means only that the risks are present in multiple periods. We believe that many of the risks that are described here are part of doing business in the industry in which we operate and will likely be present in all periods. The fact that certain risks are endemic to the industry does not lessen their significance. These risk factors should be read together with the other items in this report, including Item 1, "Business," and Item 7, "Management's Discussion and Analysis of Financial Condition and Results of Operations." Among others, risks and uncertainties that may affect our business, financial condition, performance, development, and results of operations include the following:
Our Hong Kong market accounts for a significant part of our business. Any decline in sales or customers in this market, without a corresponding increase in sales and customers in our China market through BabyCare, would harm our business, financial condition and results of operations. Over the past few years, the majority of our sales and Associate growth has occurred in our Hong Kong market, which represented 26.9% of our net sales in 2011. Following our acquisition of BabyCare in China, we announced that we would shift our international attention to growing our business in China. As a result of this strategy, we will likely experience a decline in sales and/or customers in our Hong Kong market. Factors that could contribute to a decline in Hong Kong include, among other things: (i) we have many Associate leaders in Hong Kong who qualify to do business in both Hong Kong and China and who may shift their attention to growing their businesses in China; and (ii) many of our Associates, who act simply as consumers of our products and have historically purchased our products in Hong Kong, may begin to purchase our products in China. Any decline in the performance of our Hong Kong market without a corresponding increase in the performance in China would harm our business, financial condition and results of operations. We must comply with significant legal and regulatory requirements to engage in direct selling in China and must also use a separate compensation plan for our Associates in China, which is structured differently than our compensation plan in other markets. Although we believe that, in light of our successful Asian Associate base, we will be successful in growing our business in China, it is difficult to assess the extent to which our Chinese business model and Associate compensation plan will be accepted or successful in that market. Although we are required to conduct our operations in China through BabyCare, we believe that our success in China will depend on our ability to successfully integrate, to the extent legally possible, our operations with BabyCare's operations. This includes, among other things, registering USANA products, in a timely manner, for sale in China and educating our Associates on our Compensation Plan in China. In light of the factors listed above, and the other risks to our business, there can be no assurance that we will not experience a decline in sales and/or customers in our Hong Kong market or that we will be successful in growing sales and customers in China.
Difficult economic conditions may adversely affect our business. Over the past few years, economic conditions in many of the markets where we sell our products have resulted in challenges to our business. This is particularly true in our North America region, where, despite various initiatives, our business has continued to decline. We cannot predict whether world or market specific economies
23
will improve or deteriorate in the future. If difficult economic conditions continue or worsen, we could experience declines in net sales, profitability and cash flow due to lower demand for our products or other factors caused by economic challenges faced by our customers, potential customers or suppliers. Additionally, these conditions may result in a material adverse effect on our liquidity and capital resources or otherwise negatively impact our operations or overall financial condition.
As a network marketing company, we are dependent upon an independent sales force and we do not have direct control over the marketing of our products. We rely on non-employee, independent Associates to market and sell our products and to generate our sales. Associates typically market and sell our products on a part-time basis and likely will engage in other business activities, some of which may compete with us. We have a large number of Associates and a relatively small corporate staff to implement our marketing programs and to provide motivational support to our Associates. We rely primarily upon our Associates to attract, train and motivate new Associates. Our sales are directly dependent upon the efforts of our Associates. Our ability to maintain and increase sales in the future will depend in large part upon our success in increasing the number of new Associates, retaining and motivating our existing Associates, and in improving the productivity of our Associates.
We can provide no assurances that the number of Associates will increase or remain constant or that their productivity will increase. Our Associates may terminate their services at any time, and, like most direct selling companies, we experience a high turnover among new Associates from year to year. We experienced a 2.6% decline in the number of active Associates during 2011. Prior to 2011, we experienced a 14.6% increase in the number of active Associates during 2010, and a 0.5% increase during 2009. In particular, we have experienced declines in the number of active Associates in the United States and, most recently, Hong Kong. If our initiatives for 2012 do not drive growth in our Associate numbers, particularly in the United States and other markets where our Associate numbers have declined, our operating results could be harmed. We cannot accurately predict any fluctuation in the number and productivity of Associates because we primarily rely upon existing Associates to sponsor and train new Associates and to motivate new and existing Associates. Our operating results in other markets could also be adversely affected if we and our existing Associates do not generate sufficient interest in our business to successfully retain existing Associates and attract new Associates.
The loss of a significant USANA Associate or downline sales organization could adversely affect our business. We rely on the successful efforts of our Associates that become leaders within our Compensation Plan. Our Compensation Plan is designed to permit Associates to sponsor new Associates, creating multiple "business centers," or levels in the downline organization. Sponsored Associates are referred to as "downline" Associates within the sponsoring Associate's "downline network." If these downline Associates in turn sponsor new Associates, additional business centers are created, with the new downline Associates becoming part of the original sponsoring Associate's downline network. As a result of this network marketing system, Associates develop business relationships with other Associates. The loss of a key Associate or group of Associates, large turnover or decreases in the size of the key Associate force, seasonal or other decreases in purchase volume, sales volume reduction, the costs associated with training new Associates, and other related expenses may adversely affect our business, financial condition, or results of operations. Moreover, our ability to continue to attract and retain Associates can be affected by a number of factors, some of which are beyond our control, including:
- •
- General business and economic conditions;
- •
- Adverse publicity or negative misinformation about us or our products;
- •
- Public perceptions about network marketing programs;
- •
- High-visibility investigations or legal proceedings against network marketing companies by federal or state authorities or private citizens;
24
- •
- Public perceptions about the value and efficacy of nutritional, personal care, or weight management products generally;
- •
- Other competing network marketing organizations entering into the marketplace that may recruit our existing Associates or
reduce the potential pool of new Associates; and
- •
- Changes to the Compensation Plan required by law or implemented for business reasons that make attracting and retaining Associates more difficult.
There can be no assurance that we will be able to continue to attract and retain Associates in sufficient numbers to sustain future growth or to maintain our present growth levels, which could have a material adverse effect on our business, financial condition, or results of operations.
Our Associate Compensation Plan, or changes we make to it, may be viewed negatively by some Associates, could fail to achieve our desired objectives, and could have a negative impact on our business. Our line of business is highly competitive and sensitive to the introduction of new competitors, new products and/or new distributor compensation plans. Network marketing companies commonly attempt to attract new distributors by offering generous distributor compensation plans. We believe our Compensation Plan is among the most competitive and generous in the network marketing industry. From time to time, we modify components of our Compensation Plan in an effort to (i) keep it competitive and attractive to existing and potential Associates, (ii) cause or address a change in Associate behavior, (iii) incent Associates to grow our business, (iv) conform to legal and regulatory requirements, and (v) address other business needs. In light of the size and diversity of our Associate force and the complexity of our Compensation Plan, it is difficult to predict how any changes to the plan will be viewed by Associates and whether such changes will achieve their desired results. For example, certain changes we made to our Compensation Plan in 2008 were very successful in certain markets in our Asia Pacific region, but were unsuccessful in many of our markets and regions. In 2010, we made additional changes to our Compensation Plan in an effort to encourage more entrepreneurial Associates to join the Company and build a sales organization at an accelerated pace. While these changes successfully caused us to enroll more entrepreneurial Associates, they have made it more challenging for us to enroll Associates in general, including those who simply consume our products and are less entrepreneurial. As a result, our Associate counts have decreased in most of our markets, including North America. We cannot assure you that our Associate Compensation Plan will allow us to successfully attract new Associates or retain existing Associates, nor can we assure you that any changes we make to our Compensation Plan will achieve our desired results.
The violation of marketing or advertising laws by Associates in connection with the sale of our products or the improper promotion of our Compensation Plan could adversely affect our business. All Associates sign a written contract and agree to adhere to our policies and procedures. Although these policies and procedures prohibit Associates from making false, misleading and other improper claims regarding products or income potential from the distribution of the products, Associates may, from time to time, without our knowledge and in violation of our policies, create promotional materials or otherwise provide information that does not accurately describe our marketing program. They also may make statements regarding potential earnings, product claims, or other matters in violation of our policies or applicable laws and regulations concerning these matters. These violations may result in legal action against us by regulatory agencies, state attorneys general, or private parties. Legal actions against our Associates or others who are associated with us could lead to increased regulatory scrutiny of our business, including our network marketing system. We take what we believe to be commercially reasonable steps to monitor the activities of our Associates to guard against misrepresentation and other illegal or unethical conduct by Associates and to assure that the terms of our policies and procedures and Compensation Plan are observed. There can be no assurance, however, that our efforts in this regard will be sufficient to accomplish this objective. Adverse publicity resulting from such
25
activities could also make it more difficult for us to attract and retain Associates and may have an adverse effect on our business, financial condition, and results of operations.
Legal action by former Associates or third parties against us could harm our business. We continually monitor and review our Associates' compliance with our policies and procedures as well the laws and regulations applicable to our business. From time to time, some Associates fail to adhere to our policies and procedures. If this happens, we may take disciplinary action against the particular Associate. This disciplinary action is based on the facts and circumstances of the particular case and may include anything from warnings for minor violations to termination of an Associate's purchase and distribution rights for more serious violations. From time to time, we become involved in litigation with an Associate whose purchase and distribution rights have been terminated. We consider this type of litigation to be routine and incidental to our business. While neither the existence nor the outcome of this type of litigation is typically material to our business, in the past we have been involved in litigation of this nature that resulted in a large cash award against the Company. Our competitors have also been involved in this type of litigation, and in some cases class actions, where the result has been a large cash award against the competitor or a large cash settlement by the competitor. These types of challenges, awards or settlements could provide incentives for similar actions by other former Associates against us in the future. Any such challenge involving us or others in our industry could harm our business by resulting in fines or damages against us, creating adverse publicity about us or our industry, or hurting our ability to attract and retain customers. We believe that Associate compliance is critical to the integrity of our business, and, therefore, we will continue to be aggressive in ensuring that our Associates comply with our policies and procedures. As such, we cannot assure you that this type of litigation will not occur again in the future or result in an award or settlement that has a materially adverse effect on our business.
Network marketing is subject to intense government scrutiny and regulation, which adds to the expense of doing business and the possibility that changes in the law might adversely affect our ability to sell some of our products in certain markets. Network marketing systems, such as ours, are frequently subject to laws and regulations, both in the U.S. and internationally, that are directed at ensuring that product sales are made to consumers of the products and that compensation, recognition, and advancement within the marketing organization are based on the sale of products rather than on investment in the sponsoring company. Regulatory authorities, in one or more of our present or future markets, could determine that our network marketing system does not comply with these laws and regulations or that it is prohibited. Failure to comply with these laws and regulations or such a prohibition could have a material adverse effect on our business, financial condition, or results of operations. Further, we may simply be prohibited from distributing products through a network-marketing channel in some countries, or we may be forced to alter our Compensation Plan.
We are also subject to the risk that new laws or regulations might be implemented or that current laws or regulations might change, which could require us to change or modify the way we conduct our business in certain markets. This could be particularly detrimental to us if we had to change or modify the way we conduct business in markets that represent a significant percentage of our net sales. For example, the FTC released a proposed New Business Opportunity Rule in April 2006. As initially drafted, the proposed rule would have required pre-sale disclosures for all business opportunities, which may have included network marketing compensation plans such as ours. However, in March 2008 the FTC issued a revised notice of proposed rulemaking, which indicates that the New Business Opportunity Rule as drafted will not apply to multi-level marketing companies.
We may have or incur obligations relating to the activities of our Associates. Our Associates are subject to taxation, and, in some instances, legislation or governmental agencies impose an obligation on us to collect taxes, such as sales taxes or value added taxes, and to maintain appropriate records of such transactions. In addition, we are subject to the risk in some jurisdictions of being responsible for
26
social security and similar taxes with respect to our Associates. In the event that local laws and regulations or the interpretation of local laws and regulations change to require us to treat our independent Associates as employees, or if our Associates are deemed by local regulatory authorities in one or more of the jurisdictions in which we operate to be our employees rather than independent contractors, under existing laws and interpretations, we may be held responsible for a variety of obligations that are imposed upon employers relating to their employees, including social security and related taxes in those jurisdictions, plus any related assessments and penalties, which could harm our financial condition and operating results.
Our business is subject to the effects of adverse publicity and negative public perception. Our ability to attract and retain Associates and to sustain and enhance sales through our Associates can be affected by adverse publicity or negative public perception regarding our industry, our competition, or our business generally. This negative public perception may include publicity regarding the legality of network marketing, the quality or efficacy of nutritional supplement products or ingredients in general or our products or ingredients specifically, and regulatory investigations, regardless of whether those investigations involve us or our Associates or the business practices or products of our competitors or other network marketing companies. In 2007, we were the victim of false statements made to the press and regulatory agencies, causing us to incur significant expense in defending and dispelling the allegations during 2007 and 2008. This adverse publicity also adversely impacted the market price of our stock and caused insecurity among our Associates. There can be no assurance that we will not be subject to adverse publicity or negative public perception in the future or that such adverse publicity will not have a material adverse effect on our business, financial condition, or results of operations.
The loss of key management personnel could adversely affect our business. Our Founder, Dr. Myron Wentz, is a highly visible spokesman for our products and our business, and our message is based in large part on his vision and reputation, which helps distinguish us from our competitors. Any loss or limitation on Dr. Wentz as a lead spokesman for our mission, business, and products could have a material adverse effect upon our business, financial condition, or results of operations. In addition, our executive officers are primarily responsible for our day-to-day operations, and we believe our success depends in part on our ability to retain our executive officers, to compensate our executive officers at attractive levels, and to continue to attract additional qualified individuals to our management team. We cannot guarantee continued service by our key executive officers. We do not maintain key man life insurance on any of our executive officers, nor do we have an employment agreement with any of our executive officers. The loss or limitation of the services of any of our executive officers or the inability to attract additional qualified management personnel could have a material adverse effect on our business, financial condition, or results of operations.
The beneficial ownership of a significant percentage of our common stock gives our founder and parties related to or affiliated with him effective control, and limits the influence of other shareholders on important policy and management issues. Gull Holdings, Ltd., an entity that is solely owned and controlled by Dr. Wentz, owned 50.1% of our outstanding common stock at December 31, 2011. By virtue of this stock ownership, Dr. Wentz is able to exert significant influence over the election of the members of our Board of Directors and our business affairs. This concentration of ownership could also have the effect of delaying, deterring, or preventing a change in control that might otherwise be beneficial to shareholders. In addition, Dr. Wentz also currently serves as Chairman of our Board of Directors. There can be no assurance that conflicts of interest will not arise with respect to this directorship or that conflicts will be resolved in a manner favorable to other shareholders of the Company.
Sales by our shareholders of a substantial number of shares of our common stock in the public market could adversely affect the market price of our common stock. A large number of outstanding shares of our common stock are held by several of our principal shareholders. If any of these principal shareholders were to decide to sell large amounts of stock over a short period of time such sales could cause the market price of our common stock to decline.
27
Our stock price has been volatile and subject to various market conditions. There can be no assurance that an active market in our stock will be sustained. The trading price of our common stock has been subject to wide fluctuations. The price of our common stock may fluctuate in the future in response to quarter-to-quarter variations in operating results, material announcements by us or our competitors, governmental regulatory action, conditions in the nutritional supplement industry, negative publicity, or other events or factors, many of which are beyond our control. In addition, the stock market has historically experienced significant price and volume fluctuations, which have particularly affected the market prices of many dietary and nutritional supplement companies and which have, in certain cases, not had a strong correlation to the operating performance of these companies. Our operating results in future quarters may be below the expectations of securities analysts and investors. If that were to occur, the price of our common stock would likely decline, perhaps substantially.
Our products and manufacturing activities are subject to extensive government regulation, which could limit or prevent the sale of our products in some markets. The manufacture, packaging, labeling, advertising, promotion, distribution, and sale of our products are subject to regulation by numerous national and local governmental agencies in the United States and other countries, including the U.S. Food and Drug Administration ("FDA") and the U.S. Federal Trade Commission ("FTC"). For example, failure to comply with FDA regulatory requirements may result in, among other things, injunctions, product withdrawals, recalls, product seizures, fines, and criminal prosecutions. Any action of this type by the FDA could materially adversely affect our ability to successfully market our products. With respect to FTC matters, if the FTC has reason to believe the law is being violated (e.g., failure to possess adequate substantiation for product claims), it can initiate an enforcement action. The FTC has a variety of processes and remedies available to it for enforcement, both administratively and judicially, including compulsory process authority, cease and desist orders, and injunctions. FTC enforcement could result in orders requiring, among other things, limits on advertising, consumer redress, divestiture of assets, rescission of contracts, or such other relief as may be deemed necessary. Violation of these orders could result in substantial financial or other penalties. Any action against us by the FTC could materially and adversely affect our ability to successfully market our products.
The manufacture of nutritional or dietary supplements and related products in the United States requires compliance with dietary supplement GMPs, which are based on the food-model GMPs, with additional requirements that are specific to dietary supplements. We believe our manufacturing processes comply with these GMPs for dietary supplements. Nevertheless, any action by the FDA which determined that our processes were non-compliant with dietary supplement GMPs, could materially adversely affect our ability to manufacture and market our products. Additionally, the Dietary Supplement & Nonprescription Drug Consumer Protection Act requires manufacturers of dietary supplement and over-the-counter products to notify the FDA when they receive reports of serious adverse events occurring within the United States. Potential FDA responses to any such report could include injunctions, product withdrawals, recalls, product seizures, fines, or criminal prosecutions. We have an internal adverse event reporting system that has been in place for several years and believe that we are in compliance with this new law. Nevertheless, any action by the FDA in response to a serious adverse event report that may be filed by us could materially and adversely affect our ability to successfully market our products.
In markets outside the United States, prior to commencing operations or marketing our products, we may be required to obtain approvals, licenses, or certifications from a country's ministry of health or a comparable agency. For example, our manufacturing facility has been registered with the FDA and Health Canada and is certified by Australia's TGA. Approvals or licensing may be conditioned on reformulation of products or may be unavailable with respect to certain products or product ingredients. We must also comply with product labeling and packaging regulations that vary from
28
country to country. These activities are also subject to regulation by various agencies of the countries in which our products are sold.
We cannot predict the nature of any future laws, regulations, interpretations, or applications, nor can we determine what effect additional governmental regulations or administrative orders, when and if promulgated, could have on our business. These potential effects could include, however, requirements for the reformulation of certain products to meet new standards, the recall or discontinuance of certain products, additional record keeping and reporting requirements, expanded documentation of the properties of certain products, expanded or different labeling, or additional scientific substantiation. Any or all of these requirements could have a material adverse effect on our business, financial condition, or results of operations.
Risks associated with operating in international markets could restrict our ability to expand globally and harm our business and prospects, and we could be adversely affected by our failure to comply with the laws applicable to our foreign activities, including the U.S. Foreign Corrupt Practices Act and other similar worldwide anti-bribery laws. Our international operations are presently conducted in various foreign countries, and we expect that the number of countries in which we operate could expand over the next few years. Economic conditions, including those resulting from wars, civil unrest, acts of terrorism and other conflicts or volatility in the global markets, may adversely affect our customers, their demand for our products and their ability to pay for our products. In addition, there are numerous risks inherent in conducting our business internationally, including, but not limited to, potential instability in international markets, changes in regulatory requirements applicable to international operations, currency fluctuations in foreign countries, political, economic and social conditions in foreign countries and complex U.S. and foreign laws and treaties, including tax laws and the U.S. Foreign Corrupt Practices Act (FCPA). These risks could restrict our ability to sell products to or to obtain international customers or to operate our international business profitably, and our overall business and results of operations could be negatively impacted by our foreign activities.
The FCPA and similar anti-bribery laws in other jurisdictions prohibit U.S.-based companies and their intermediaries from making improper payments to government officials for the purpose of obtaining or retaining business. We pursue opportunities in certain parts of the world that experience government corruption, and in certain circumstances, compliance with anti-bribery laws may conflict with local customs and practices. Our policies mandate compliance with all applicable anti-bribery laws. Further, we require our partners, subcontractors, agents and others who work for us or on our behalf to comply with the FCPA and other anti-bribery laws. Although we have policies and procedures designed to ensure that we, our employees, our agents and others who work with us in foreign countries comply with the FCPA and other anti-bribery laws, there is no assurance that such policies or procedures will protect us against liability under the FCPA or other laws for actions taken by our agents, employees and intermediaries. If we are found to be liable for FCPA violations (either due to our own acts or our inadvertence, or due to the acts or inadvertence of others), we could incur severe criminal or civil penalties or other sanctions, which could have a material adverse effect on our reputation, business, results of operations or cash flows. In addition, detecting, investigating and resolving actual or alleged FCPA violations is expensive and could consume significant time and attention of our senior management.
Our net sales are significantly affected by our success in growing existing markets, as well as opening new markets. As we continue to expand into international markets, our business becomes increasingly subject to political, economic, legal and other risks. Changes in these markets could adversely affect our business. We have a history of expanding into new international markets. We believe that our ability to achieve future growth is dependent in part on our ability to continue our international expansion efforts. There can be no assurance, however, that we will be able to grow in our existing international markets, enter new international markets on a timely basis, or that new markets will be profitable. We must overcome significant regulatory and legal barriers before we can
29
begin marketing in any international market. Also, before marketing commences in a new country or market, it is difficult to assess the extent to which our products and sales techniques will be accepted or successful in any given country. In addition to significant regulatory barriers, we may also encounter problems conducting operations in new markets with different cultures and legal systems from those encountered elsewhere. We may be required to reformulate certain of our products before commencing sales in a given country. Once we have entered a market, we must adhere to the regulatory and legal requirements of that market. No assurance can be given that we will be able to successfully reformulate our products in any of our current or potential international markets to meet local regulatory requirements or to attract local customers. Our failure to do so could have a material adverse effect on our business, financial condition, or results of operations. There can be no assurance that we will be able to obtain and retain necessary permits and approvals in new markets, or that we will have sufficient capital to finance our expansion efforts in a timely manner.
In many market areas, other network marketing companies already have significant market penetration, the effect of which could be to desensitize the local Associate population to a new opportunity, such as USANA, or to make it more difficult for us to attract qualified Associates. Even if we are able to commence operations in new markets, there may not be a sufficient population of persons who are interested in our network marketing system. We believe our future success will depend in part on our ability to seamlessly integrate our Compensation Plan across all markets where legally permissible. There can be no assurance, however, that we will be able to utilize our Compensation Plan seamlessly in all existing or future markets. For example, in August 2010, we indirectly acquired BabyCare, a nutritional supplement company that is licensed by the government of the People's Republic of China (the "PRC" or "China") to engage in direct selling in the Municipality of Beijing. Under Chinese law, single-level compensation models are permitted, but multi-level compensation models, as practiced by USANA and many other direct selling companies, are not. Our operations in China, therefore, utilize a single-level compensation model, which is separate and different from our Compensation Plan in our other markets. We will continue to utilize a separate compensation model in China, and USANA's Compensation Plan will not be integrated into or utilized in China.
Our operations in China are subject to significant government scrutiny and may be harmed by the results of such scrutiny. Because of the government's significant concerns about direct selling activities, government regulators in China closely scrutinize activities of direct selling companies or activities that resemble direct selling. The regulatory environment in China with regard to direct selling is evolving, and officials in multiple national and local levels in the Chinese government often exercise broad discretion in deciding how to interpret and apply applicable regulations. In the past, the government has taken significant actions against companies that the government has found have been engaging in direct selling activities in violation of applicable law, including shutting down their businesses and imposing substantial fines.
Any determination that our operations or activities, or the activities of our sales employees, contractual sales promoters, direct sellers or Associates are not in compliance with applicable regulations could result in substantial fines, extended interruptions of business, termination of necessary licenses and permits, including our direct selling licenses, or restrictions on our ability to open new stores, obtain approvals for service centers or expand into new locations, all of which could harm our business.
Our business will be adversely affected if Chinese regulatory authorities view our direct selling and other corporate activities as non-compliant with applicable Chinese laws and regulations. Our operations in China may be deemed to be subject to numerous Chinese commercial laws, including restrictions on foreign investments. In addition, the Chinese regulatory authorities with jurisdiction over our operations may change applicable laws and regulations or impose additional requirements and conditions with which we may be unable to comply. Our operations in China are licensed to engage in direct selling activity in the Municipality of Beijing. We have not sought confirmation from Chinese
30
regulatory governmental authorities whether our structure and business in China complies with applicable Chinese laws and regulations, including regulation of direct selling business in China. If:
- •
- Chinese authorities deem our corporate activities as violating applicable Chinese laws and regulations (including
restrictions on foreign investments);
- •
- Chinese regulatory authorities change applicable laws and regulations or impose additional requirements and conditions
with which we are unable to comply; or
- •
- We are found to violate any existing or future Chinese laws or regulations;
the relevant Chinese authorities would have broad discretion to deal with such a violation by levying fines, revoking business licenses, requiring us to restructure our China ownership or operations, and require us to discontinue some or all of our business in China. Any of these actions would adversely affect our business.
The direct selling license granted to our operations in China is limited in its scope. To engage in direct selling activity outside the Municipality of Beijing, we will be required to obtain licenses from other municipalities and provinces within China. If we are unable to obtain additional necessary national and local government approvals in China as quickly as we would like, our ability to expand and grow our business could be negatively impacted. The process for obtaining the necessary government approvals to conduct direct selling continues to evolve. The process is time-consuming and expensive. The complexity of the approval process, as well as the government's continued cautious approach as direct selling develops in China, makes it difficult to predict the timeline for obtaining additional approvals. If the results of the government's evaluation of our direct selling activities result in further delays in obtaining licenses elsewhere, or if the current processes for obtaining approvals are delayed further for any reason or are changed or are interpreted differently than currently understood, our ability to expand direct selling in China and our growth prospects in this market, could be negatively impacted. We currently are only allowed by the PRC to sell through direct selling the limited number of products that are manufactured in China by us. If we wish to sell additional products (other than those already approved) through the direct-selling channel, we must successfully complete a product approval process similar to the process described above. We cannot assure that we will be successful in obtaining such additional product approvals on a timely basis or at all.
A return to profit repatriation controls may limit the ability to expand business and reduce the attractiveness of investing in Chinese business opportunities. Chinese law allows enterprises owned by foreign investors to remit their profits, dividends and bonuses earned in China to other countries, and the remittance does not require prior approval by the State Administration of Foreign Exchange ("SAFE"). SAFE regulations require extensive documentation and reporting, some of which are burdensome and slows payments. If there is a return to payment restrictions and reporting, the ability of a Chinese company to attract investors will be reduced. Also, current investors may not be able to obtain the profits of the businesses they own for other reasons. Relevant Chinese law and regulation permit payment of dividends only from retained earnings, if any, determined in accordance with Chinese accounting standards and regulations. It is possible that the Chinese tax authorities may require changes in the calculation of distributable net income of our operations in China that may limit our ability to pay dividends and other distributions to stockholders. Chinese law requires companies to set aside a portion of net income to fund certain reserves, which amounts are not distributable as dividends. These rules and possible changes could restrict us from repatriating funds.
Our ability to enforce our material agreements in China is uncertain. Chinese law will govern our material operating agreements. There is no assurance that we will be able to enforce those material agreements or that remedies will be available outside China. The Chinese judiciary is relatively inexperienced in enforcing corporate and commercial laws, leading to a substantial degree of
31
uncertainty as to the outcome of litigation. The inability to enforce or obtain a remedy under our agreements may have a material adverse impact on our operations.
Intellectual property rights are difficult to enforce in China. Chinese commercial law is relatively undeveloped compared to most of our other major markets, and, as a result, we may have limited legal recourse in the event we encounter significant difficulties with patent or trademark infringers. Limited protection of intellectual property is available under Chinese law, and the local manufacturing of our products may subject us to an increased risk that unauthorized parties may attempt to manufacture and sell counterfeited products or copy or otherwise obtain or use our product formulations. As a result, we cannot assure that we will be able to adequately protect our product formulations or other intellectual property in China.
An increase in the amount of incentives paid to Associates reduces our profitability. The payment of Associate incentives is our most significant expense. These incentives include commissions, bonuses, and certain awards and prizes. From time to time, we adjust our Compensation Plan to better manage these incentives as a percentage of net sales. We closely monitor the amount of Associate incentives that are paid as a percentage of net sales, and may periodically adjust our Compensation Plan to prevent Associate incentives from having a significant adverse effect on our earnings. There can be no assurance that changes to the Compensation Plan or product pricing will be successful in achieving target levels of Associate incentives as a percentage of net sales. Furthermore, such changes may make it difficult to attract and retain qualified and motivated Associates or cause us to lose some of our longer-standing Associates.
Our business is subject to the risks associated with intense competition from larger, wealthier, and more established competitors. We face intense competition in the business of distributing and marketing nutritional supplements, vitamins and minerals, personal care products, and other nutritional products, as described in greater detail in "Business—Competition." Numerous manufacturers, Associates, and retailers compete actively for consumers and, in the case of other network marketing companies, for Associates. There can be no assurance that we will be able to compete in this intensely competitive environment. In addition, nutrition and personal care products can be purchased in a wide variety of channels of distribution, including retail stores. Our product offerings in each product category are also relatively small, compared to the wide variety of products offered by many of our competitors.
We are also subject to significant competition from other network marketing organizations for the time, attention, and commitment of new and existing Associates. Our ability to remain competitive depends, in significant part, on our success in recruiting and retaining Associates. There can be no assurance that our programs for recruiting and retaining Associates will be successful. The pool of individuals who may be interested in network marketing is limited in each market, and it is reduced to the extent other network marketing companies successfully recruit these individuals into their businesses. Although we believe we offer an attractive opportunity for Associates, there can be no assurance that other network marketing companies will not be able to recruit our existing Associates or deplete the pool of potential Associates in a given market.
Taxation and transfer pricing considerations affect our operations. In many countries, including the United States, we are subject to transfer pricing and other tax regulations that are designed to ensure that appropriate levels of income are reported by our U.S. and foreign entities and are taxed appropriately. Although we believe that we are in compliance with all material regulations and restrictions in this regard, we are subject to the risk that taxing authorities could audit our transfer pricing and related practices and assert that additional taxes are owed. We are also subject to the risk that taxing authorities in any of our markets could change the laws in a manner that may increase our effective tax rate and/or duties on our products. Under tax treaties, we are eligible to receive foreign tax credits in the United States for foreign taxes actually paid abroad. In the event any audits or
32
assessments are concluded adversely to us, we may or may not be able to offset the consolidated effect of foreign income tax assessments through the use of U.S. foreign tax credits. Currently, we are utilizing all foreign tax credits in the year in which they arise. Because the laws and regulations governing U.S. foreign tax credits are complex and subject to periodic legislative amendment, we cannot be sure that we would in fact be able to take advantage of any foreign tax credits in the future. As a result, adverse outcomes in these matters could have a material impact on our financial condition or operating results.
Fluctuation in the value of currency exchange rates with the U.S. dollar affects our operations and our net sales and earnings. Over the past several years, a significant portion of our net sales have been generated outside the United States. Such sales for the year ended December 31, 2011 represented 74.6% of our total net sales. We will likely continue to expand our operations into new markets, exposing us to expanding risks of changes in social, political, and economic conditions, including changes in the laws and policies that govern investment or exchange in these markets. Because a significant portion of our sales are generated outside the United States, exchange rate fluctuations will have a significant effect on our sales and earnings. Further, if exchange rates fluctuate dramatically, it may become uneconomical for us to establish or to continue activities in certain countries. For instance, changes in currency exchange rates may affect the relative prices at which we and our competitors sell similar products in the same market. As our business expands outside the United States, an increasing share of our net sales and operating costs will be transacted in currencies other than the U.S. dollar. Accounting practices require that our non-U.S. financial results be converted to U.S. dollars for reporting purposes. Consequently, our reported net earnings may be significantly affected by fluctuations in currency exchange rates, with earnings generally increasing with a weaker U.S. dollar and decreasing with a strengthening U.S. dollar. Product purchases by our subsidiaries are transacted in U.S. dollars. As our operations expand in countries where transactions may be made in currencies other than the U.S. dollar, our operating results will be increasingly subject to the risks of exchange rate fluctuations and we may not be able to accurately estimate the impact that these changes might have on our future business, product pricing, results of operations, or financial condition. In addition, the value of the U.S. dollar in relation to other currencies may also adversely affect our sales to customers outside the United States. Currently our strategy for reducing our exposure to currency fluctuation includes the timely and efficient repatriation of earnings from international markets and settlement of intercompany transactions. At times in the past we have sought to reduce exposure to fluctuations in currency exchange rates by creating offsetting positions through the use of currency exchange contracts on cash that we repatriate. We did not enter into any such contracts during 2011, but we may look to something like this in the coming year. We do not use derivative instruments for speculative purposes. There can be no assurance that we will be successful in protecting our operating results or cash flows from potentially adverse effects of currency exchange fluctuations. Any such adverse effects could also adversely affect our business, financial condition, or results of operations.
Disruptions to shipping channels that we use to distribute our products to international warehouses may adversely affect our margins and profitability in those markets. In the past, we have felt the impact of disruptions to the shipping channels used to distribute our products; these disruptions have included increased port congestion, a lack of capacity on the railroads, and a shortage of manpower. Although we have not recently experienced significant shipping disruptions, we continue to watch for signs of upcoming congestion. Congestion to ports can affect previously negotiated contracts with shipping companies, resulting in unexpected increases in shipping costs and reduction in our net sales.
The inability to obtain adequate supplies of raw materials for products at favorable prices, or at all, or the inability to obtain certain products from third-party suppliers, could have a material adverse effect on our business, financial condition, or results of operations. We acquire all of our raw
33
materials for the manufacture of our products from third-party suppliers. Materials used in manufacturing our products are purchased through purchase order, often invoking pre-negotiated annual supply agreements. We have very few long-term agreements for the supply of these materials. We also contract with third-party manufacturers and suppliers for the production of some of our products, including most of our gelatin-capsuled supplements, Probiotic, Rev3 Energy™ Drink, our powdered drink mixes and nutrition bars, and certain of our personal care products. These third-party suppliers and manufacturers produce and, in most cases, package these products according to formulations that have been developed by, or in conjunction with, our in-house product development team. There is a risk that any of our suppliers or manufacturers could discontinue manufacturing our products or selling their products to us. Although we believe that we could establish alternate sources for most of our products, any delay in locating and establishing relationships with other sources could result in product shortages or back orders for products, with a resulting loss of net sales. In certain situations, we may be required to alter our products or to substitute different products from another source. We have, in the past, discontinued or temporarily stopped sales of certain products that were manufactured by third parties while those products were on back order. There can be no assurance that suppliers will provide the raw materials or manufactured products that are needed by us in the quantities that we request or at the prices that we are willing to pay. Because we do not control the actual production of certain raw materials and products, we are also subject to delays caused by any interruption in the production of these materials, based on conditions not within our control, including weather, crop conditions, transportation interruptions, strikes by supplier employees, and natural disasters or other catastrophic events.
Shortages of raw materials may temporarily adversely affect our margins or our profitability related to the sale of those products. In the past, we have experienced temporary shortages of the raw materials used in certain of our nutritional products. Although we had identified multiple sources to supply such raw material ingredients, quantities of the materials we purchased during these shortages were at higher prices, which negatively impacted our gross margins for those products. While we periodically experience price increases due to unexpected raw material shortages and other unanticipated events, this has historically not resulted in a material effect on our overall cost of goods sold. However, there is no assurance that our raw materials will not be significantly adversely affected in the future, causing our profitability to be reduced.
Nutritional supplement products may be supported by only limited availability of conclusive clinical studies. Our products include nutritional supplements that are made from vitamins, minerals, herbs, and other substances for which there is a long history of human consumption. Some of our products contain innovative ingredients or combinations of ingredients. Although we believe that all of our products are safe when taken as directed, there is little long-term experience with human consumption of certain of these product ingredients or combinations of ingredients in concentrated form. We conduct research and test the formulation and production of our products, but we have performed or sponsored only limited clinical studies. Furthermore, because we are highly dependent on consumers' perception of the efficacy, safety, and quality of our products, as well as similar products distributed by other companies, we could be adversely affected in the event that those products prove or are asserted to be ineffective or harmful to consumers or in the event of adverse publicity associated with any illness or other adverse effects resulting from consumers' use or misuse of our products or similar products of our competitors.
As a manufacturer, we may be subject to product liability claims. As a manufacturer and a distributor of products for human consumption and topical application, we could become exposed to product liability claims and litigation. Additionally, the manufacture and sale of these products involves the risk of injury to consumers due to tampering by unauthorized third parties or product contamination. To date, we have not been a party to any product liability litigation, although, like any dietary supplement company, we have received reports from individuals who have asserted that they
34
suffered adverse consequences as a result of using our products. The number of reports we have received to date is nominal. These matters historically have been settled to our satisfaction and have not resulted in material payments. We are aware of no instance in which any of our products are or have been defective in any way that could give rise to material losses or expenditures related to product liability claims. Although we maintain product liability insurance, which we believe to be adequate for our needs, there can be no assurance that we will not be subject to such claims in the future or that our insurance coverage will be adequate.
Our business is subject to particular intellectual property risks. Most of our products are not protected by patents. The labeling regulations governing our nutritional supplements require that the ingredients of such products be precisely and accurately indicated on product containers. Accordingly, patent protection for nutritional supplements often is impractical given the large number of manufacturers who produce nutritional supplements having many active ingredients in common. Additionally, the nutritional supplement industry is characterized by rapid change and frequent reformulations of products, as the body of scientific research and literature refines current understanding of the application and efficacy of certain substances and the interactions among various substances. In this respect, we maintain an active research and development program that is devoted to developing better, purer, and more effective formulations of our products. We protect our investment in research, as well as the techniques we use to improve the purity and effectiveness of our products, by relying on trade secret laws. We have also entered into confidentiality agreements with certain of our employees involved in research and development activities. Additionally, we endeavor to seek, to the fullest extent permitted by applicable law, trademark and trade dress protection for our products, which protection has been sought in the United States, Canada, and in many of the other countries in which we are either presently operating or plan to commence operations in the future. Notwithstanding our efforts, there can be no assurance that our efforts to protect our trade secrets and trademarks will be successful. Nor can there be any assurance that third-parties will not assert claims against us for infringement of their intellectual proprietary rights. If an infringement claim is asserted, we may be required to obtain a license of such rights, pay royalties on a retrospective or prospective basis, or terminate our manufacturing and marketing of our infringing products. Litigation with respect to such matters could result in substantial costs and diversion of management and other resources and could have a material adverse effect on our business, financial condition, or operating results.
Our manufacturing activity is subject to certain risks. We manufacture approximately 74% of the products sold to our customers at our Salt Lake City location. As a result, we are dependent upon the uninterrupted and efficient operation of our manufacturing facilities. Those operations are subject to power failures, the breakdown, failure, or substandard performance of equipment, the improper installation or operation of equipment, natural or other disasters, and the need to comply with the requirements or directives of government agencies, including the FDA. There can be no assurance that the occurrence of these or any other operational problems at our facility would not have a material adverse effect on our business, financial condition, or results of operations. We are subject to a variety of environmental laws relating to the storage, discharge, handling, emission, generation, manufacture, use and disposal of chemicals, solid and hazardous waste, and other toxic and hazardous materials. Our manufacturing operations presently do not result in the generation of material amounts of hazardous or toxic substances. Nevertheless, complying with new or more stringent laws or regulations, or more vigorous enforcement of current or future policies of regulatory agencies, could require substantial expenditures by us that could have a material adverse effect on our business, financial condition, or results of operations. Environmental laws and regulations require us to maintain and comply with a number of permits, authorizations, and approvals and to maintain and update training programs and safety data regarding materials used in our processes. Violations of those requirements could result in financial penalties and other enforcement actions and could require us to halt one or more portions of our operations until a violation is cured. The combined costs of curing incidents of non-compliance, resolving enforcement actions that might be initiated by government authorities, or of satisfying new
35
legal requirements could have a material adverse effect on our business, financial condition, or results of operations.
A failure of our information technology systems would harm our business. The global nature of our business and our seamless global compensation plan requires the development and implementation of robust and efficiently functioning information technology systems. Such systems are vulnerable to a variety of potential risks, including damage or interruption resulting from natural disasters and telecommunication failures and human error or intentional acts of sabotage, vandalism, break-ins and similar acts. Although we have adopted and implemented a business continuity and disaster recovery plan, which includes routine back-up, off-site archiving and storage, and certain redundancies, the occurrence of any of these events could result in costly interruptions or failures adversely affecting our business and the results of our operations.
We may incur liability under our "Athlete Guarantee" program, if and to the extent participating athletes make a successful claim against USANA for testing positive for certain banned substances while taking USANA nutritional supplements. USANA believes that its nutritional supplement products are free from substances that have been banned by world-class training and competitive athletic programs. The Company retains independent testing agencies to conduct periodic checks for banned substances. The Company further believes that, while its products promote good health, they are not otherwise considered to be "performance enhancing" as that term has been used in defining substances that are banned from use in international competition by the World Anti-Doping Agency ("WADA"). For many years, USANA has been a sponsor of Olympic athletes and professional competitors around the world. These athletes have been tested on many occasions and have never tested positive for banned substances as a result of taking USANA nutritional products. To back up its claim that athletes who use the Company's products as part of their training regimen will not be consuming banned substances, the Company has offered to enter into agreements with select athletes, some of whom have high-profiles and are highly compensated, which state that, during the term of the agreement, should the athlete test positive for a banned substance included in the WADA, and should such positive result be the result of taking USANA nutritional products, USANA will compensate that athlete two times their current annual earnings up to one million dollars, based on the athlete's personal level of competition, endorsement, and other income, as well as other factors. To mitigate potential exposure under these agreements, we:
- •
- Designate lots identified as dedicated to the Athlete Guarantee program and retain additional samples;
- •
- Store designated lot samples externally with a third-party; and
- •
- Establish a chain of custody that requires signatures on behalf of USANA and the third-party to transfer possession of the product lots and that restricts access by USANA employees after the transfer.
All applicants to this Athlete Guarantee program are subject to screening and acceptance by the Company in its sole discretion. Contracts are tailored to fit the athlete's individual circumstances and the amount of the Company's exposure is limited based on the level of sponsorship of the participating athlete. Although the Company believes that the pool of current and potential participants in the program is small, there is no guarantee that an athlete who is accepted in the program will not successfully make a claim against us. The Company currently has no insurance to protect it from potential claims under this program.
Based on the mitigating factors, screening process and the Company's view that its products are not "performance enhancing," management believes there is a less than remote chance that the Company will incur a liability under the Athlete Guarantee program.
36
Item 1B. Unresolved Staff Comments
None.
Corporate Headquarters
Our world-wide corporate headquarters is a 354,000 square foot company-owned facility located in Salt Lake City, Utah. This facility includes space for manufacturing, distribution, and administrative functions.
Additional Manufacturing
We own a 31,000 square foot manufacturing facility in Tianjin, China, which is currently used to manufacture our Sensé products that are sold in China and a nominal amount of third-party skin-care products. The majority of our other China products are manufactured at leased facilities in this market.
Other Office and Distribution Warehouse Facilities
We own a 45,000 square foot office/warehouse building in Sydney, Australia and we lease regional offices and distribution warehouses located in each of the remainder of our markets. Additionally, we lease retail centers for our operations in China.
We believe that the facilities referenced above are in good condition and are adequately utilized. Further, we believe that our manufacturing facilities provide for the productive capacity to meet our foreseeable needs.
From time to time we are involved in litigation arising out of our operations. We maintain liability insurance, including product liability coverage, in amounts our management believes is adequate. We are not currently engaged in any legal proceedings that we expect would materially harm our business or financial condition.
Item 4. Mine Safety Disclosures
None.
Item 5. Market for Registrant's Common Equity, Related Stockholder Matters and Issuer Purchases of Equity Securities
Our common stock trades on the New York Stock Exchange ("NYSE") under the symbol "USNA." The following table contains the reported high and low sale prices for our common stock as reported on the NYSE for the periods indicated:
2010
|
High | Low | |||||
|---|---|---|---|---|---|---|---|
First Quarter |
$ | 32.84 | $ | 24.34 | |||
Second Quarter |
$ | 39.20 | $ | 30.11 | |||
Third Quarter |
$ | 45.00 | $ | 36.71 | |||
Fourth Quarter |
$ | 45.50 | $ | 39.00 | |||
37
2011
|
High | Low | |||||
|---|---|---|---|---|---|---|---|
First Quarter |
$ | 44.22 | $ | 32.00 | |||
Second Quarter |
$ | 38.50 | $ | 26.81 | |||
Third Quarter |
$ | 33.68 | $ | 23.10 | |||
Fourth Quarter |
$ | 35.88 | $ | 25.69 | |||
The market price of our common shares is subject to fluctuations in response to variations in our quarterly operating results, general trends in the market for our products and product candidates, economic and currency exchange issues in the markets where we operate, as well as other factors, many of which are not within our control. In addition, broad market fluctuations, as well as general economic, business and political conditions may adversely affect the market for our common shares, regardless of our actual or projected performance.
On March 2, 2012, the high and low sales prices of our common stock as reported by NYSE were $37.14 and $36.12, respectively.
As of March 2, 2012, we had 384 holders of record of our common stock.
We have never declared or paid cash dividends on our common stock and we currently have no plans to do so. Future cash dividends, if any, will be determined by our Board of Directors and will be based on earnings, available capital, our financial condition, and other factors that the Board of Directors deems to be relevant.
Purchases made during the quarter ended December 31, 2011 for each fiscal month therein are summarized in the following table:
Issuer Purchases of Equity Securities
(amounts in thousands, except per share data)
Period
|
Total Number of Shares Purchased |
Average Price Paid per Share |
Total Number of Shares Purchased as Part of Publicly Announced Plans or Programs |
Approximate Dollar Value of Shares that May Yet Be Purchased Under the Plans or Programs* |
|||||||||
|---|---|---|---|---|---|---|---|---|---|---|---|---|---|
Fiscal October |
0 | $ | 0.00 | 0 | $ | 29,004 | |||||||
(Oct. 2, 2011 through Nov. 5, 2011) |
|||||||||||||
Fiscal November |
0 |
$ |
0.00 |
0 |
$ |
29,004 |
|||||||
(Nov. 6, 2011 through Dec. 3, 2011) |
|||||||||||||
Fiscal December |
25 |
$ |
30.57 |
25 |
$ |
28,246 |
|||||||
(Dec. 4, 2011 through Dec. 31, 2011) |
|||||||||||||
|
25 | $ | 30.57 | 25 | |||||||||
- *
- The Company's share repurchase plan has been ongoing since the fourth quarter of 2000, with the Company's Board of Directors periodically approving additional dollar amounts for share repurchases under the plan. The Company began the fourth quarter with $29,004 remaining under the plan. There currently is no expiration date on the approved repurchase amount.
38
The following graph and table compares the performance of our common stock to the S&P 500 Index, the Nasdaq Stock Market Index*, and nine companies selected in good faith from our industry (the "Peer Group") over the last five years. The data shown assumes an investment on December 31, 2006, of $100 and reinvestment of all dividends into additional shares of the same class of equity, if applicable to the stock or index.
Each of the companies included in the Peer Group markets or manufactures products similar to USANA's products or markets its products through a similar marketing channel. The Peer Group includes the following companies: Avon Products, Inc., NuSkin Enterprises, Inc., Herbalife Ltd., Natural Alternatives International, Inc., Perrigo Company, Reliv International, Inc., Hain Celestial Group, and Lifeway Foods, Inc.
Cumulative Shareholder Return
Dec. 2006 - Dec. 2011
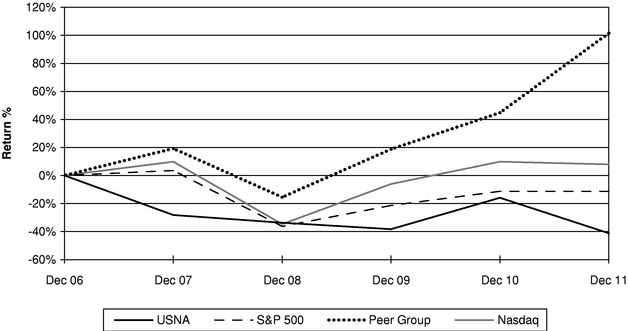
| |
USNA | S&P 500 | Peer Group | Nasdaq* | |||||||||
|---|---|---|---|---|---|---|---|---|---|---|---|---|---|
Dec 06 |
$ | 100 | $ | 100 | $ | 100 | $ | 100 | |||||
Dec 07 |
$ | 72 | $ | 104 | $ | 119 | $ | 110 | |||||
Dec 08 |
$ | 66 | $ | 64 | $ | 84 | $ | 65 | |||||
Dec 09 |
$ | 62 | $ | 79 | $ | 119 | $ | 94 | |||||
Dec 10 |
$ | 84 | $ | 89 | $ | 145 | $ | 110 | |||||
Dec 11 |
$ | 59 | $ | 89 | $ | 201 | $ | 108 | |||||
- *
- On January 3, 2011, we transferred the listing of our common stock to the New York Stock Exchange from the Nasdaq. We have, therefore, included Nasdaq on our stock performance graph for 2011.
39
Item 6. Selected Financial Data
The following selected consolidated financial data should be read in conjunction with "Management's Discussion and Analysis of Financial Condition and Results of Operations" and the Consolidated Financial Statements and related notes thereto that are included in this report.
| |
Fiscal Year(1) | |||||||||||||||
|---|---|---|---|---|---|---|---|---|---|---|---|---|---|---|---|---|
| |
2007 | 2008 | 2009 | 2010 | 2011 | |||||||||||
| |
(in thousands, except per share data) |
|||||||||||||||
Consolidated Statements of Earnings Data: |
||||||||||||||||
Net sales |
$ | 423,149 | $ | 429,012 | $ | 436,940 | $ | 517,644 | $ | 581,939 | ||||||
Cost of sales |
87,891 | 88,878 | 89,803 | 95,482 | 101,692 | |||||||||||
Gross profit |
335,258 | 340,134 | 347,137 | 422,162 | 480,247 | |||||||||||
Operating expenses: |
||||||||||||||||
Associate incentives |
170,383 | 178,309 | 196,363 | 233,187 | 265,928 | |||||||||||
Selling, general and administrative(2) |
94,174 | 113,828 | 99,983 | 120,759 | 137,063 | |||||||||||
Total operating expenses |
264,557 | 292,137 | 296,346 | 353,946 | 402,991 | |||||||||||
Earnings from continuing operations |
70,701 | 47,997 | 50,791 | 68,216 | 77,256 | |||||||||||
Other income (expense), net |
471 | (1,676 | ) | 187 | 648 | 222 | ||||||||||
Earnings from continuing operations before income taxes |
71,172 | 46,321 | 50,978 | 68,864 | 77,478 | |||||||||||
Income taxes |
25,530 | 16,376 | 17,422 | 23,213 | 26,726 | |||||||||||
Income from continuing operations |
45,642 | 29,945 | 33,556 | 45,651 | 50,752 | |||||||||||
Loss from discontinued operations, net of tax |
(612 | ) | — | — | — | — | ||||||||||
Net earnings |
$ | 45,030 | $ | 29,945 | $ | 33,556 | $ | 45,651 | $ | 50,752 | ||||||
Earnings (loss) per common share: |
||||||||||||||||
Basic |
||||||||||||||||
Continuing operations |
$ | 2.73 | $ | 1.87 | $ | 2.19 | $ | 2.94 | $ | 3.30 | ||||||
Discontinued operations |
(0.04 | ) | — | — | — | — | ||||||||||
Net earnings |
$ | 2.69 | $ | 1.87 | $ | 2.19 | $ | 2.94 | $ | 3.30 | ||||||
Diluted |
||||||||||||||||
Continuing operations |
$ | 2.65 | $ | 1.85 | $ | 2.17 | $ | 2.86 | $ | 3.26 | ||||||
Discontinued operations |
(0.03 | ) | — | — | — | — | ||||||||||
Net earnings |
$ | 2.62 | $ | 1.85 | $ | 2.17 | $ | 2.86 | $ | 3.26 | ||||||
Weighted average common shares outstanding: |
||||||||||||||||
Basic |
16,734 | 16,048 | 15,340 | 15,528 | 15,361 | |||||||||||
Diluted |
17,206 | 16,163 | 15,432 | 15,942 | 15,574 | |||||||||||
Dividends per share |
— | — | — | — | — | |||||||||||
Cash Flow Related Data: |
||||||||||||||||
Net cash provided by (used in): |
||||||||||||||||
Operating activities |
$ | 58,205 | $ | 45,956 | $ | 32,469 | $ | 66,108 | $ | 70,108 | ||||||
Investing activities |
(26,010 | ) | (15,206 | ) | (3,197 | ) | (46,853 | ) | (10,609 | ) | ||||||
Financing activities |
(46,886 | ) | (29,765 | ) | (29,502 | ) | (9,577 | ) | (33,372 | ) | ||||||
Purchase of property and equipment |
(26,264 | ) | (16,061 | ) | (4,128 | ) | (4,192 | ) | (10,643 | ) | ||||||
Repurchase of common stock |
(79,580 | ) | (39,873 | ) | (1,654 | ) | (17,031 | ) | (33,459 | ) | ||||||
40
| |
As of | |||||||||||||||
|---|---|---|---|---|---|---|---|---|---|---|---|---|---|---|---|---|
| |
Dec. 29, 2007 |
Jan. 3, 2009 |
Jan. 2, 2010 |
Jan. 1, 2011(3)(4) |
Dec. 31 2011 |
|||||||||||
| |
(in thousands, except other data) |
|||||||||||||||
Consolidated Balance Sheet Data: |
||||||||||||||||
Cash and cash equivalents |
$ | 12,865 | $ | 13,281 | $ | 13,658 | $ | 24,222 | $ | 50,353 | ||||||
Working capital |
118 | (1,860 | ) | 11,448 | 22,648 | 46,363 | ||||||||||
Current assets |
45,992 | 52,674 | 51,926 | 81,677 | 106,059 | |||||||||||
Goodwill |
5,690 | 5,690 | 5,690 | 17,267 | 17,740 | |||||||||||
Intangible assets, net |
— | — | — | 41,915 | 42,637 | |||||||||||
Total assets |
109,128 | 122,572 | 123,438 | 216,636 | 244,496 | |||||||||||
Total current liabilities |
45,874 | 54,534 | 40,478 | 59,029 | 59,696 | |||||||||||
Line of credit |
28,000 | 34,990 | 7,000 | — | — | |||||||||||
Other long-term liabilities |
2,305 | 1,212 | 1,587 | 1,012 | 942 | |||||||||||
Stockholders' equity |
32,949 | 31,836 | 74,373 | 146,802 | 173,910 | |||||||||||
Other Data: |
||||||||||||||||
Active Associates |
176,000 | 198,000 | 199,000 | 228,000 | 222,000 | |||||||||||
Active Preferred Customers |
78,000 | 71,000 | 67,000 | 70,000 | 64,000 | |||||||||||
- (1)
- The
Company's fiscal year ends on the Saturday that is closest to December 31. The 2007, 2009, 2010, and 2011 fiscal years were 52-week
years. Fiscal year 2008 was a 53-week year. The extra week in 2008 added nearly $7,000 to net sales.
- (2)
- During
2008, an unanticipated arbitration award was rendered against the Company in the amount of $7,020.
- (3)
- Revisions
relating to deferred taxes and intangible assets have been made to certain balance sheet items as of January 1, 2011. These revisions are
discussed further in the Revisions item in Note A to the Consolidated Financial Statements.
- (4)
- The active Preferred Customer count as of January 1, 2011 has been updated to correct an inaccuracy, which is explained further in the Active Preferred Customers by Region table in Item 7 below.
Item 7. Management's Discussion and Analysis of Financial Condition and Results of Operations
The following discussion and analysis of USANA's financial condition and results of operations is presented in ten sections:
- •
- Overview
- •
- Customers
- •
- Recent Developments
- •
- Presentation
- •
- Results of Operations
- •
- Quarterly Financial Information
- •
- Liquidity and Capital Resources
- •
- Contractual Obligations
- •
- Inflation
- •
- Critical Accounting Estimates
41
This discussion and analysis should be read in conjunction with the Consolidated Financial Statements and notes thereto appearing elsewhere in this report.
We develop and manufacture high-quality, science-based nutritional and personal care products that are distributed internationally through a network marketing system, which is a form of direct selling. Our customer base comprises two types of customer: "Associates" and "Preferred Customers." Associates are independent distributors of our products who also purchase our products for their personal use. Preferred Customers purchase our products strictly for their personal use and are not permitted to resell or to distribute the products. As of December 31, 2011, we had approximately 222,000 active Associates and approximately 64,000 active Preferred Customers worldwide.
We have ongoing operations in 15 markets, which are grouped and presented as follows:
- •
- North America—
- •
- United States (including direct sales from the United States to the United Kingdom and the Netherlands)
- •
- Canada
- •
- Mexico
- •
- Asia Pacific—
- •
- Southeast Asia/Pacific—Australia, New Zealand, Singapore, Malaysia, and the Philippines
- •
- Greater China—Hong Kong, Taiwan, and China(1)
- •
- North Asia—Japan and South Korea
Additionally, in 2012 we will expand our business to Thailand, France, and Belgium. Thailand will be grouped into Southeast Asia/Pacific, and North America will become our North America/Europe region. Because we have operations in multiple markets, with sales and expenses being generated and incurred in multiple currencies, our reported U.S. dollar sales and earnings can be significantly affected by fluctuations in currency exchange rates. In general, net sales, gross profit margins, and earnings are affected positively by a weakening of the U.S. dollar and negatively by a strengthening of the U.S. dollar. Currency fluctuations, however, have the opposite effect on our Associate incentives and selling, general and administrative expenses.
Because we utilize a direct selling model for the distribution of our products the success and growth of our business is primarily based on our ability to attract new and retain existing Associates to sell and consume our products. Notably, sales to Associates account for the majority of our product sales and represented 90% of product sales during 2011. Changes in our product sales are typically the result of variations in product sales volume relating to fluctuations in the number of active Associates and Preferred Customers purchasing our products. The number of active Associates and Preferred Customers is, therefore, used by management as a key non-financial measure.
The following tables summarize the changes in our active customer base by geographic region. These numbers have been rounded to the nearest thousand as of the dates indicated. For purposes of this report, we only count as active customers those Associates and Preferred Customers who have
- (1)
- Our business in China is that of BabyCare, our wholly-owned subsidiary.
42
purchased product from us at any time during the most recent three-month period, either for personal use or for resale.
| |
Active Associates By Region | |
|
||||||||||||||||
|---|---|---|---|---|---|---|---|---|---|---|---|---|---|---|---|---|---|---|---|
| |
As of January 1, 2011 |
As of December 31, 2011 |
Change from Prior Year |
Percent Change |
|||||||||||||||
North America: |
|||||||||||||||||||
United States |
51,000 | 22.4 | % | 45,000 | 20.2 | % | (6,000 | ) | (11.8 | )% | |||||||||
Canada |
24,000 | 10.5 | % | 23,000 | 10.4 | % | (1,000 | ) | (4.2 | )% | |||||||||
Mexico |
11,000 | 4.8 | % | 10,000 | 4.5 | % | (1,000 | ) | (9.1 | )% | |||||||||
North America Total |
86,000 | 37.7 | % | 78,000 | 35.1 | % | (8,000 | ) | (9.3 | )% | |||||||||
Asia Pacific: |
|||||||||||||||||||
Southeast Asia/Pacific |
41,000 | 18.0 | % | 49,000 | 22.1 | % | 8,000 | 19.5 | % | ||||||||||
Greater China |
93,000 | 40.8 | % | 86,000 | 38.7 | % | (7,000 | ) | (7.5 | )% | |||||||||
North Asia |
8,000 | 3.5 | % | 9,000 | 4.1 | % | 1,000 | 12.5 | % | ||||||||||
Asia Pacific Total |
142,000 | 62.3 | % | 144,000 | 64.9 | % | 2,000 | 1.4 | % | ||||||||||
|
228,000 | 100.0 | % | 222,000 | 100.0 | % | (6,000 | ) | (2.6 | )% | |||||||||
| |
Active Preferred Customers By Region | |
|
||||||||||||||||
|---|---|---|---|---|---|---|---|---|---|---|---|---|---|---|---|---|---|---|---|
| |
As of January 1, 2011(1) |
As of December 31, 2011 |
Change from Prior Year |
Percent Change |
|||||||||||||||
North America: |
|||||||||||||||||||
United States |
36,000 | 51.4 | % | 35,000 | 54.7 | % | (1,000 | ) | (2.8 | )% | |||||||||
Canada |
14,000 | 20.0 | % | 14,000 | 21.9 | % | — | 0.0 | % | ||||||||||
Mexico |
4,000 | 5.7 | % | 3,000 | 4.7 | % | (1,000 | ) | (25.0 | )% | |||||||||
North America Total |
54,000 | 77.1 | % | 52,000 | 81.3 | % | (2,000 | ) | (3.7 | )% | |||||||||
Asia Pacific: |
|||||||||||||||||||
Southeast Asia/Pacific |
6,000 | 8.6 | % | 6,000 | 9.4 | % | — | 0.0 | % | ||||||||||
Greater China |
9,000 | 12.9 | % | 5,000 | 7.8 | % | (4,000 | ) | (44.4 | )% | |||||||||
North Asia |
1,000 | 1.4 | % | 1,000 | 1.5 | % | — | 0.0 | % | ||||||||||
Asia Pacific Total |
16,000 | 22.9 | % | 12,000 | 18.7 | % | (4,000 | ) | (25.0 | )% | |||||||||
|
70,000 | 100.0 | % | 64,000 | 100.0 | % | (6,000 | ) | (8.6 | )% | |||||||||
- (1)
- The Preferred Customer count as of January 1, 2011 has been updated to correct an inaccuracy reported under Greater China. The Preferred Customer count previously reported for our China operations was 14,000, which brought the Preferred Customer count for Greater China to 16,000. These numbers have been corrected to 7,000 for our China operations, and 9,000 for Greater China. This correction represents a change of 7,000 to total Preferred Customers reported as of January 1, 2011.
In addition to preparing for entry into Thailand, France, and Belgium, during 2011, we continued integrating our China operations into our business. We introduced several USANA products for sale in China, and continued educating our Associates on our China compensation plan to help them understand how to appropriately grow in this market. Additionally, we continued to make progress on obtaining additional provincial direct selling licenses.
43
In 2011, we also began implementing a strategy to stabilize and grow our North America region. This strategy is centered on a number of key initiatives, including: (i) strengthening the partnership between USANA and its North American Associates; (ii) developing the leadership and marketing skills of our Associates; (iii) personalizing our products, technologies and systems to meet the individual needs of our Associates; (iv) innovating to develop new products and technologies; and (v) offering North America-specific incentives and promotions. To develop and support these initiatives, we have expanded our corporate and management team. While this is a long-term strategy that will require upfront investment and patience, we believe that our successful execution of this strategy could produce results as early as the fourth quarter of 2012. Additionally, we believe our entry into the France and Belgium markets will encourage North American Associates to expand their businesses.
Product sales and the shipping and handling fees billed to our customers are recorded as revenue net of applicable sales discounts when the product is delivered, title has transferred, and the risk of loss passes to the customer. Payments received for undelivered products are recorded as deferred revenue and are included in other current liabilities. Also reflected in net sales is a provision for product returns and allowances, which is estimated based on our historical experience. Additionally, the Company collects an annual renewal fee from Associates that is deferred on receipt and is recognized as income on a straight-line basis over a twelve-month period.
Cost of sales primarily consists of expenses related to raw materials, labor, quality assurance, and overhead costs that are directly associated with the production and distribution of our products and sales materials, as well as duties and taxes that are associated with the import and export of our products. As our international sales increase as a percentage of net sales, cost of sales are increasingly affected by additional duties, freight, and other factors, such as changes in currency exchange rates.
Associate incentives expense includes all forms of commissions, compensation, and other incentives paid to our Associates. Compensation paid to our China Associates, although under a different compensation plan, is also included in Associate incentives expense. Incentives paid to Associates include bonuses earned, rewards from contests and promotions, and base commissions, which makes up the majority of our Associate incentives expense. Bonuses are paid out to Associates based on certain business growth criteria, total base commission earnings, and leadership level. Contests and promotions are offered as an incentive and reward to our Associates and are typically paid out only after an Associate achieves specific growth and advancement levels. Base commissions are paid out on the sale of products. Associates earn their commissions based on sales volume points that are generated in their down-line organization. Sales volume points are assigned to each commissionable product and comprise a certain percent of the product price. Items such as our starter kits and sales tools have no sales volume point value, and commissions are not paid on the sale of these items. Although insignificant to our financial statements, an Associate may earn commissions on sales volume points that are generated from personal purchases that are not considered to be part of their "Qualifying Purchases." Qualifying Purchases are the amount of product that Associates must purchase each month, which they must either resell to consumers or personally use in order to qualify to earn commissions or bonuses under USANA's Compensation Plan. Commissions paid to Associates on personal purchases are considered a sales discount and are reported as a reduction to our net sales.
Selling, general and administrative expenses include wages and benefits, depreciation and amortization, rents and utilities, Associate event costs, advertising, professional fees, marketing, and research and development expenses. Wages and benefits represent the largest component of selling, general and administrative expenses. Significant depreciation and amortization expense is incurred as a result of investments in physical facilities, computer and telecommunications equipment, and systems to support our international operations.
44
Sales to customers outside the United States are transacted in the respective local currencies and are translated to U.S. dollars at weighted-average currency exchange rates for each monthly accounting period to which they relate. Most of our raw material purchases from suppliers and our product purchases from third-party manufacturers are transacted in U.S. dollars. Consequently, our sales and net earnings are affected by changes in currency exchange rates, with sales and earnings generally increasing with a weakening U.S. dollar and decreasing with a strengthening U.S. dollar. In our net sales discussions that follow, we approximate the impact of currency fluctuations on net sales by translating current year net sales at the average exchange rates in effect during the comparable prior year periods.
The following table summarizes our consolidated operating results as a percent of net sales, respectively, for the periods indicated:
| |
Fiscal Year | |||||||||
|---|---|---|---|---|---|---|---|---|---|---|
| |
2009 | 2010 | 2011 | |||||||
Consolidated Statements of Earnings Data: |
||||||||||
Net sales |
100.0 | % | 100.0 | % | 100.0 | % | ||||
Cost of sales |
20.6 | % | 18.4 | % | 17.5 | % | ||||
Gross profit |
79.4 | % | 81.6 | % | 82.5 | % | ||||
Operating expenses: |
||||||||||
Associate incentives |
44.9 | % | 45.0 | % | 45.7 | % | ||||
Selling, general and administrative |
22.9 | % | 23.3 | % | 23.6 | % | ||||
Total operating expenses |
67.8 | % | 68.3 | % | 69.3 | % | ||||
Earnings from operations |
11.6 | % | 13.3 | % | 13.2 | % | ||||
Other income (expense), net |
0.1 | % | 0.0 | % | 0.0 | % | ||||
Earnings before income taxes |
11.7 | % | 13.3 | % | 13.2 | % | ||||
Income taxes |
4.0 | % | 4.5 | % | 4.6 | % | ||||
Net earnings |
7.7 | % | 8.8 | % | 8.6 | % | ||||
Summary of 2011 Financial Results
Net sales increased 12.4%, or $64.3 million, to $581.9 million in 2011, when compared with 2010. This increase is largely due to strong sales growth in certain markets within our Asia Pacific region and includes a full year of our China operations, compared with only partial results in 2010. Net sales during 2011 also benefited from favorable changes in currency exchange rates by approximately $15.0 million, without which net sales would have increased 9.5%. Notably, all of the benefit we received from favorable changes in currency exchange rates took place over the first three quarters in 2011. Changes in currency exchange rates in 2012 may negatively impact net sales and produce more difficult year-over-year comparables for our operating results.
Net earnings increased 11.2%, or $5.1 million, to $50.8 million in 2011, when compared with 2010. This increase was the result of improved gross profit margins on higher net sales, offset in most part by an increase in Associate incentives and selling, general and administrative expenses.
45
Fiscal Year 2011 compared to Fiscal Year 2010
The following table summarizes the changes in our net sales by geographic region for the fiscal years ended January 1, 2011 and December 31, 2011:
| |
Net Sales by Region (in thousands) Year Ended |
|
|
|
|
||||||||||||||||||||
|---|---|---|---|---|---|---|---|---|---|---|---|---|---|---|---|---|---|---|---|---|---|---|---|---|---|
| |
|
|
Approximate impact of currency exchange |
Change excluding the impact of currency |
|||||||||||||||||||||
| |
Change from prior year |
Percent change |
|||||||||||||||||||||||
| |
2010 | 2011 | |||||||||||||||||||||||
North America: |
|||||||||||||||||||||||||
United States |
$ | 150,893 | 29.2 | % | $ | 148,061 | 25.4 | % | $ | (2,832 | ) | (1.9 | )% | $ | N/A | (1.9 | )% | ||||||||
Canada |
69,411 | 13.4 | % | 67,024 | 11.5 | % | (2,387 | ) | (3.4 | )% | 2,700 | (7.3 | )% | ||||||||||||
Mexico |
21,843 | 4.2 | % | 21,301 | 3.7 | % | (542 | ) | (2.5 | )% | 400 | (4.3 | )% | ||||||||||||
North America Total |
242,147 | 46.8 | % | 236,386 | 40.6 | % | (5,761 | ) | (2.4 | )% | 3,100 | (3.7 | )% | ||||||||||||
Asia Pacific: |
|||||||||||||||||||||||||
Southeast Asia/Pacific |
99,311 | 19.2 | % | 111,447 | 19.2 | % | 12,136 | 12.2 | % | 8,300 | 3.9 | % | |||||||||||||
Greater China |
152,280 | 29.4 | % | 204,822 | 35.2 | % | 52,542 | 34.5 | % | 1,900 | 33.3 | % | |||||||||||||
North Asia |
23,906 | 4.6 | % | 29,284 | 5.0 | % | 5,378 | 22.5 | % | 1,700 | 15.4 | % | |||||||||||||
Asia Pacific Total |
275,497 | 53.2 | % | 345,553 | 59.4 | % | 70,056 | 25.4 | % | 11,900 | 21.1 | % | |||||||||||||
|
$ | 517,644 | 100.0 | % | $ | 581,939 | 100.0 | % | $ | 64,295 | 12.4 | % | $ | 15,000 | 9.5 | % | |||||||||
North America: The decrease in local currency net sales in this region was the result of lower product sales volume due to a decrease in the average number of active Associates in this region throughout the year. We believe that this decrease in Associates is predominantly due to difficult economic conditions in North America, coupled with the changes that we made to the commission qualification requirements under our Compensation Plan in the third quarter of 2010. The intent of these changes was to incent more entrepreneurial Associates to join the Company and build a sales organization at an accelerated pace. While the changes have caused us to enroll more entrepreneurial Associates, they have made it more challenging for us to enroll Associates in general, including those who simply consume our products and are less entrepreneurial, particularly in North America. This decrease in active Associates was partially offset by an increase in average spending per Associate on a year-over-year basis, which is also due to the commission qualification changes for new Associates.
Asia Pacific: The increase in net sales in this region came from Hong Kong and our emerging markets, which included China, the Philippines, and South Korea. Growth in these markets resulted primarily from higher product sales volume, which was due mostly to an increase in the average number of active Associates throughout the year.
Net sales in Hong Kong increased 29.0% to $156.7 million in 2011, compared with 2010. Notably, most of this growth was generated during the first half of the year. In addition to an increase in the average number of Associates purchasing, this sales growth was aided by several other events that took place in Hong Kong during 2011. These events included (i) recognition of deferred revenue in the first quarter due to a promotion that ended on the final day of 2010; (ii) a price increase and a surge in sales related to the anticipation of this increase in the first quarter; (iii) a surge in sales ahead of anticipated policy changes during the second quarter; and (iv) a larger than expected surge in sales in the fourth quarter from a successful promotion that we offered during December. Setting aside some of the events that aided Hong Kong's growth in 2011, and in light of our continued focus on growing our mainland China market, we believe that Hong Kong's performance in 2012 will be more in line with its results for the third quarter of 2011, or approximately $35.0 million in net sales per quarter.
46
Although Hong Kong's net sales increased in 2011, the number of active Associates in Hong Kong began to decrease during the last half of the year. Hong Kong had 61,000 active Associates at December 31, 2011, which is a 12.9% decrease from the same period of the prior year. Similar to North America, however, an increase in average spending per Associate in Hong Kong, resulting primarily from our commission qualification changes in 2010, has helped to offset the effect on sales of the decline in active Associates in this market.
Net sales in China increased 208.9% to $23.5 million in 2011, compared with 2010. This increase is due partially to a comparison of China's full year of operations in 2011 with a partial year of operations in 2010, as we acquired our China operations in August 2010. Net sales in the Philippines increased 138.9% to $22.3 million in 2011, compared with 2010, and net sales in South Korea increased 62.9% to $19.5 million. Growth in these markets resulted from higher product sales volume, which was due primarily to an increase in the average number of active Associates throughout the year.
The increase in gross profit as a percent of net sales can primarily be attributed to currency benefits received from our international subsidiaries, as the majority of our products sold are manufactured at our corporate headquarters in the United States and transferred to our international subsidiaries. Gross profit also benefitted from lower relative freight costs on shipments to our customers, price increases in Hong Kong, and leverage gained on higher net sales. In 2012, we expect gross profit to be modestly reduced from costs increases on certain of our raw materials and strengthening of the U.S. dollar.
The increase in Associate incentives as a percent of net sales can mostly be attributed to an increased payout under our Matching Bonus program. A higher payout of base commissions under our Associate compensation plan and the impact of currency fluctuations also contributed to the increase in Associate incentives as a percent of net sales. Partially offsetting these increases were (i) the inclusion of China in our operating results for a full year, compared with a partial year in 2010, as the relative payout under the China compensation plan is lower than the payout under the USANA Compensation Plan, and (ii) certain initiatives that the Company put in place in the second quarter of 2010 to manage Associate incentives as a percent of net sales. In 2012, we expect Associate incentives to be modestly lower than in 2011 as a result of price increases and commission payout adjustments that we have made in certain markets.
Selling, General and Administrative Expenses
The increase in selling, general and administrative expense as a percent of net sales can primarily be attributed to the inclusion of China in our operating results for a full year, compared with a partial year in 2010 (our China operations currently carry significantly higher selling, general and administrative expense as a percentage of net sales that our other markets), and also to expenses associated with our increased branding efforts. This increase was partially offset by leverage gained on increased sales outside the United States in our markets where selling, general and administrative expenses are lower.
In absolute terms, our selling, general and administrative expenses increased by $16.3 million in 2011, compared with 2010. The most significant components of this increase in absolute terms were as follows:
- •
- Added costs from China's operations of approximately $8.2 million;
- •
- An increase related to our corporate branding efforts of approximately $3.6 million;
47
- •
- An increase in credit card processing and bank fees of approximately $1.6 million; and
- •
- An increase in travel costs of approximately $1.1 million.
Although reflected in some of the above items, changes in currency added approximately $3.0 million to overall selling, general and administrative expenses. These increases were partially offset by the decrease of $2.0 million in BabyCare acquisition costs compared with the prior year.
In 2012, we expect that selling, general and administrative expenses will increase in absolute and relative terms due to increased spending to support our North America growth strategy, as well as to added costs related to our entry into three new markets during fiscal 2012.
Other income decreased by $0.4 million due to lower currency exchange gains on intercompany transactions during the year.
Income taxes were 34.5% of earnings before income taxes in 2011, compared to 33.7% in 2010. The income tax rate for 2010 was lower due to tax benefits related to changes in uncertain income tax positions, larger prior-year tax benefits, and the level of equity award exercises.
While net earnings increased 11.2%, diluted earnings per share increased 14.0% to $3.26. The increase in diluted earnings per share can be attributed to increased net earnings and a lower number of diluted shares outstanding as a result of share repurchases during 2011.
Summary of 2010 Financial Results
Net sales increased $80.7 million to $517.6 million in 2010, which was an 18.5% increase from 2009. The most significant item impacting net sales during 2010 was an increase in product sales volumes, which resulted from an increase in the number of active Associates in Greater China, partially offset by a decrease in the number of active Associates in North America and Southeast Asia Pacific. This increase included the addition of $7.4 million in net sales from our China operations, which were acquired in August 2010. Net sales during 2010 also benefited from favorable changes in currency exchange rates by approximately $21.0 million.
Net earnings increased 36.0% to $45.7 million in 2010 from $33.6 million in 2009. This year-over-year increase was primarily the result of higher net sales, improved gross profit margin, and a lower effective tax rate. These improvements were partially offset by a 10 basis point increase in Associate incentives as a percent of net sales, and a 40 basis point increase in selling, general and administrative expenses. Our acquisition in China reduced net earnings in 2010 by approximately $3.1 million, which includes $2.0 million of acquisition costs.
48
Fiscal Year 2010 compared to Fiscal Year 2009
The tables below summarize the changes in our active customer base by geographic region as of the dates indicated:
| |
Active Associates By Region | |
|
||||||||||||||||
|---|---|---|---|---|---|---|---|---|---|---|---|---|---|---|---|---|---|---|---|
| |
As of January 2, 2010 |
As of January 1, 2011 |
Change from Prior Year |
Percent Change |
|||||||||||||||
North America: |
|||||||||||||||||||
United States |
57,000 | 28.6 | % | 51,000 | 22.4 | % | (6,000 | ) | (10.5 | )% | |||||||||
Canada |
25,000 | 12.6 | % | 24,000 | 10.5 | % | (1,000 | ) | (4.0 | )% | |||||||||
Mexico |
15,000 | 7.5 | % | 11,000 | 4.8 | % | (4,000 | ) | (26.7 | )% | |||||||||
North America Total |
97,000 | 48.7 | % | 86,000 | 37.7 | % | (11,000 | ) | (11.3 | )% | |||||||||
Asia Pacific: |
|||||||||||||||||||
Southeast Asia/Pacific |
46,000 | 23.1 | % | 41,000 | 18.0 | % | (5,000 | ) | (10.9 | )% | |||||||||
Greater China |
48,000 | 24.2 | % | 93,000 | 40.8 | % | 45,000 | 93.8 | % | ||||||||||
North Asia |
8,000 | 4.0 | % | 8,000 | 3.5 | % | — | 0.0 | % | ||||||||||
Asia Pacific Total |
102,000 | 51.3 | % | 142,000 | 62.3 | % | 40,000 | 39.2 | % | ||||||||||
|
199,000 | 100.0 | % | 228,000 | 100.0 | % | 29,000 | 14.6 | % | ||||||||||
| |
Active Preferred Customers By Region | |
|
||||||||||||||||
|---|---|---|---|---|---|---|---|---|---|---|---|---|---|---|---|---|---|---|---|
| |
As of January 2, 2010 |
As of January 1, 2011(1) |
Change from Prior Year |
Percent Change |
|||||||||||||||
North America: |
|||||||||||||||||||
United States |
39,000 | 58.2 | % | 36,000 | 51.4 | % | (3,000 | ) | (7.7 | )% | |||||||||
Canada |
16,000 | 23.9 | % | 14,000 | 20.0 | % | (2,000 | ) | (12.5 | )% | |||||||||
Mexico |
3,000 | 4.5 | % | 4,000 | 5.7 | % | 1,000 | 33.3 | % | ||||||||||
North America Total |
58,000 | 86.6 | % | 54,000 | 77.1 | % | (4,000 | ) | (6.9 | )% | |||||||||
Asia Pacific: |
|||||||||||||||||||
Southeast Asia/Pacific |
7,000 | 10.4 | % | 6,000 | 8.6 | % | (1,000 | ) | (14.3 | )% | |||||||||
Greater China |
1,000 | 1.5 | % | 9,000 | 12.9 | % | 8,000 | 800.0 | % | ||||||||||
North Asia |
1,000 | 1.5 | % | 1,000 | 1.4 | % | — | 0.0 | % | ||||||||||
Asia Pacific Total |
9,000 | 13.4 | % | 16,000 | 22.9 | % | 7,000 | 77.8 | % | ||||||||||
|
67,000 | 100.0 | % | 70,000 | 100.0 | % | 3,000 | 4.5 | % | ||||||||||
- (1)
- The Preferred Customer count as of January 1, 2011 has been updated to correct an inaccuracy reported under Greater China. The Preferred Customer count previously reported for our China operations was 14,000, which brought the Preferred Customer count for Greater China to 16,000. These numbers have been corrected to 7,000 for our China operations, and 9,000 for Greater China. This correction represents a change of 7,000 to total Preferred Customers reported as of January 1, 2011.
49
The following table summarizes the changes in our net sales by geographic region for the fiscal years ended January 2, 2010 and January 1, 2011:
| |
Net Sales by Region (in thousands) Year Ended |
|
|
|
|
||||||||||||||||||||
|---|---|---|---|---|---|---|---|---|---|---|---|---|---|---|---|---|---|---|---|---|---|---|---|---|---|
| |
|
|
Approximate impact of currency exchange |
Change excluding the impact of currency |
|||||||||||||||||||||
| |
Change from prior year |
Percent change |
|||||||||||||||||||||||
| |
2009 | 2010 | |||||||||||||||||||||||
North America: |
|||||||||||||||||||||||||
United States |
$ | 151,663 | 34.7 | % | $ | 150,893 | 29.2 | % | $ | (770 | ) | (0.5 | )% | $ | N/A | (0.5 | )% | ||||||||
Canada |
65,682 | 15.1 | % | 69,411 | 13.4 | % | 3,729 | 5.7 | % | 6,500 | (4.2 | )% | |||||||||||||
Mexico |
22,384 | 5.1 | % | 21,843 | 4.2 | % | (541 | ) | (2.4 | )% | 1,400 | (8.7 | )% | ||||||||||||
North America Total |
239,729 | 54.9 | % | 242,147 | 46.8 | % | 2,418 | 1.0 | % | 7,900 | (2.3 | )% | |||||||||||||
Asia Pacific: |
|||||||||||||||||||||||||
Southeast Asia/Pacific |
95,185 | 21.8 | % | 99,311 | 19.2 | % | 4,126 | 4.3 | % | 10,400 | (6.6 | )% | |||||||||||||
Greater China |
81,455 | 18.6 | % | 152,280 | 29.4 | % | 70,825 | 86.9 | % | 800 | 86.0 | % | |||||||||||||
North Asia |
20,571 | 4.7 | % | 23,906 | 4.6 | % | 3,335 | 16.2 | % | 1,900 | 7.0 | % | |||||||||||||
Asia Pacific Total |
197,211 | 45.1 | % | 275,497 | 53.2 | % | 78,286 | 39.7 | % | 13,100 | 33.1 | % | |||||||||||||
|
$ | 436,940 | 100.0 | % | $ | 517,644 | 100.0 | % | $ | 80,704 | 18.5 | % | $ | 21,000 | 13.7 | % | |||||||||
North America: The decrease in local currency net sales in this region was the result of lower product sales volume due to a decrease in the number of active Associates and Preferred Customers in this region. As a manufacturer of premium products, we believe that continued economic challenges, particularly in the consumer products segment, contributed meaningfully to the decrease in active Associates and Preferred Customers. Part of the decrease in the number of active Associates was also due to an increase in the number of North America-based Associates building their businesses in Asia, which results in growth in sales and Associates in Asia Pacific rather than North America.
The decrease in active Associates throughout 2010 was partially offset by an increase in customer spending, which was a result of two factors. First, in 2010 we changed the structure of our compensation, recognition, and rewards programs in a way that we believed would encourage our Associates to build their businesses more effectively. We believe that these changes were the primary reason for the increase in product sales volume per customer from 2009 to 2010. Second, we implemented certain price increases in the few years leading up to and through 2010, including a price increase of nearly ten percent on our products in Mexico. While our profitability in Mexico improved, we believe that the price increases in this market contributed to the decline in our active Associate count.
Asia Pacific: The increase in net sales in this region was primarily due to higher product sales volume due to an increase in the number of active Associates. This increase came predominantly from Greater China. Growth in Greater China was led by Hong Kong, where the number of active Associates increased 100.0% year-over-year and net sales increased 103.8%. Additionally, our acquisition in China added approximately $7.4 million in net sales, 12,000 active Associates, and 7,000 active Preferred Customers to this region. Excluding our China operations, local currency net sales in this region increased 29.4%, the number of active Associates increased 27.5%, and the number of active Preferred Customers remained unchanged.
Although smaller as a percent of sales, we also experienced double-digit local currency sales growth in the Philippines and South Korea. The increase in total Asia Pacific sales, on a local currency
50
basis, was partially offset by an overall decline in sales and Associates in Southeast Asia Pacific, which we believe, similar to North America, is largely the result of difficult economic conditions.
The increase in gross profit as a percent of net sales from 2009 to 2010 can be attributed to a decrease in overall raw materials cost, currency benefits, lower relative freight costs on shipments to our customers, production and shipping efficiency due to capital investments, and leverage gained on increased net sales. Additionally, we have implemented certain price increases, notably on some of our larger packs and flagship products, and we discontinued several of our lower gross margin product pack offerings, all of which contributed to our improved gross profit.
Associate incentives as a percent of net sales increased slightly from 2009 to 2010. Notably, during the second quarter of 2010, we implemented a strategic initiative to reduce Associate incentives expense as a percent of net sales. Changes implemented under this initiative were the primary reason that Associate incentives as a percentage of net sales only increased 10 basis points for the full year 2010, when compared with 2009.
Selling, General and Administrative Expenses
The increase in selling, general and administrative expenses as a percent of net sales from 2009 to 2010 was primarily due to acquisition costs related to our China subsidiary.
In absolute terms, our selling, general and administrative expenses increased by $20.8 million in 2010, compared with 2009. The most significant components of this increase in absolute terms were as follows:
- •
- An increase in wage-related expenses of approximately $11.7 million, which includes $2.1 million
of expenses related to our China operations;
- •
- Acquisition costs related to our China operations of approximately $2.0 million;
- •
- Expenses related to our Asia Pacific convention of approximately $1.7 million; and
- •
- An increase in credit card fees of approximately $1.9 million related to the increase in sales.
Other income increased nearly $0.5 million due to a $0.5 million reduction in interest expense as a result of a lower average balance on our line of credit during the year.
Income taxes totaled 33.7% of earnings before income taxes in 2010, compared to 34.2% in 2009. This decrease is primarily due to increased tax benefits from the deduction for qualified production activities and tax benefits recognized from stock option exercises in 2010.
Diluted earnings per share increased $0.69, or 31.8%, to $2.86 for the year. This increase is the result of increased net earnings partially offset by a higher average number of diluted shares outstanding.
51
Quarterly Financial Information (Unaudited)
The following tables set forth unaudited quarterly operating results for each of the last eight fiscal quarters, as well as percentages of net sales for certain data for the periods indicated. This information is consistent with the Consolidated Financial Statements herein and includes normally recurring adjustments that management considers to be necessary for a fair presentation of the data. Quarterly results are not necessarily indicative of future results of operations. This information should be read in conjunction with the audited Consolidated Financial Statements and notes thereto that are included elsewhere in this report.
| |
Quarter Ended | ||||||||||||||||||||||||
|---|---|---|---|---|---|---|---|---|---|---|---|---|---|---|---|---|---|---|---|---|---|---|---|---|---|
| |
April 3, 2010 |
July 3, 2010 |
Oct. 2, 2010 |
Jan. 1, 2011 |
April 2, 2011 |
July 2, 2011 |
Oct. 1, 2011 |
Dec. 31 2011 |
|||||||||||||||||
| |
(in thousands, except per share data) |
||||||||||||||||||||||||
Consolidated Statements of Earnings Data: |
|||||||||||||||||||||||||
Net sales |
$ | 119,087 | $ | 126,011 | $ | 135,006 | $ | 137,540 | $ | 143,566 | $ | 148,925 | $ | 143,501 | $ | 145,947 | |||||||||
Cost of sales |
23,020 | 22,735 | 25,157 | 24,570 | 25,662 | 26,208 | 25,202 | 24,620 | |||||||||||||||||
Gross profit |
96,067 | 103,276 | 109,849 | 112,970 | 117,904 | 122,717 | 118,299 | 121,327 | |||||||||||||||||
Operating expenses: |
|||||||||||||||||||||||||
Associate incentives |
54,118 | 57,065 | 60,560 | 61,444 | 64,807 | 67,760 | 66,158 | 67,203 | |||||||||||||||||
Selling, general, and administrative |
27,458 | 29,149 | 30,751 | 33,401 | 35,870 | 33,803 | 33,365 | 34,025 | |||||||||||||||||
Total operating expenses |
81,576 | 86,214 | 91,311 | 94,845 | 100,677 | 101,563 | 99,523 | 101,228 | |||||||||||||||||
Earnings from operations |
14,491 | 17,062 | 18,538 | 18,125 | 17,227 | 21,154 | 18,776 | 20,099 | |||||||||||||||||
Other income (expense), net |
339 | (587 | ) | 551 | 345 | 101 | — | 133 | (12 | ) | |||||||||||||||
Earnings from operations before income taxes |
14,830 | 16,475 | 19,089 | 18,470 | 17,328 | 21,154 | 18,909 | 20,087 | |||||||||||||||||
Income taxes |
5,189 | 5,705 | 6,240 | 6,079 | 5,978 | 7,298 | 6,524 | 6,926 | |||||||||||||||||
Net earnings |
$ | 9,641 | $ | 10,770 | $ | 12,849 | $ | 12,391 | $ | 11,350 | $ | 13,856 | $ | 12,385 | $ | 13,161 | |||||||||
Earnings per common share*: |
|||||||||||||||||||||||||
Basic |
$ | 0.63 | $ | 0.70 | $ | 0.83 | $ | 0.78 | $ | 0.71 | $ | 0.89 | $ | 0.82 | $ | 0.88 | |||||||||
Diluted |
$ | 0.62 | $ | 0.69 | $ | 0.79 | $ | 0.75 | $ | 0.70 | $ | 0.88 | $ | 0.81 | $ | 0.87 | |||||||||
Weighted average shares outstanding: |
|||||||||||||||||||||||||
Basic |
15,311 | 15,318 | 15,562 | 15,920 | 15,911 | 15,530 | 15,043 | 14,958 | |||||||||||||||||
Diluted |
15,513 | 15,697 | 16,247 | 16,479 | 16,217 | 15,752 | 15,205 | 15,177 | |||||||||||||||||
- *
- Earnings per common share is computed independently for each of the quarters presented. Therefore, the sum of the quarterly earnings per share amounts does not necessarily equal the total for the year.
Consolidated Statements of Earnings as a percentage of Net Sales: |
|||||||||||||||||||||||||
Net sales |
100.0 | % | 100.0 | % | 100.0 | % | 100.0 | % | 100.0 | % | 100.0 | % | 100.0 | % | 100.0 | % | |||||||||
Cost of sales |
19.3 | 18.0 | 18.6 | 17.9 | 17.9 | 17.6 | 17.6 | 16.9 | |||||||||||||||||
Gross profit |
80.7 | 82.0 | 81.4 | 82.1 | 82.1 | 82.4 | 82.4 | 83.1 | |||||||||||||||||
Operating expenses: |
|||||||||||||||||||||||||
Associate incentives |
45.4 | 45.3 | 44.9 | 44.7 | 45.1 | 45.5 | 46.1 | 46.0 | |||||||||||||||||
Selling, general and administrative |
23.1 | 23.1 | 22.8 | 24.3 | 25.0 | 22.7 | 23.3 | 23.3 | |||||||||||||||||
Total operating expenses |
68.5 | 68.4 | 67.7 | 69.0 | 70.1 | 68.2 | 69.4 | 69.3 | |||||||||||||||||
Earnings from operations |
12.2 | 13.6 | 13.7 | 13.1 | 12.0 | 14.2 | 13.0 | 13.8 | |||||||||||||||||
Other income (expense), net |
0.3 | (0.5 | ) | 0.4 | 0.3 | 0.1 | — | 0.1 | — | ||||||||||||||||
Earnings from operations before income taxes |
12.5 | 13.1 | 14.1 | 13.4 | 12.1 | 14.2 | 13.1 | 13.8 | |||||||||||||||||
Income taxes |
4.4 | 4.5 | 4.6 | 4.4 | 4.2 | 4.9 | 4.5 | 4.7 | |||||||||||||||||
Net earnings |
8.1 | % | 8.6 | % | 9.5 | % | 9.0 | % | 7.9 | % | 9.3 | % | 8.6 | % | 9.1 | % | |||||||||
52
We may experience variations in the results of operations from quarter to quarter as a result of factors that include the following:
- •
- The recruiting and retention of Associates and Preferred Customers;
- •
- The opening of new markets;
- •
- The timing of Company-sponsored events, contests, and promotions;
- •
- Fluctuations in currency exchange rates;
- •
- New product introductions;
- •
- The timing of holidays, which may reduce the amount of time that our Associates spend selling products or recruiting new
Associates;
- •
- The negative impact of changes in or interpretations of regulations that may limit or restrict the sale of certain
products in some countries;
- •
- The adverse effect of a failure by us or an Associate (or allegations of such failure) to comply with applicable
governmental regulations;
- •
- The integration and operation of new information technology systems;
- •
- The inability to introduce new products or the introduction of new products by competitors;
- •
- Entry into one or more of our markets by competitors;
- •
- Availability of raw materials;
- •
- General conditions in the nutritional supplement, personal care, and weight-management industries or the network marketing
industry; and
- •
- Consumer perceptions of our products and operations.
Because our products are ingested by consumers or applied to their bodies, we are highly dependent upon consumers' perception of the safety, quality, and efficacy of our products and nutritional supplements in general. As a result, substantial negative publicity, whether founded or unfounded, concerning one or more of our products or of other products that are similar to our products could adversely affect our business, financial condition, or results of operations.
As a result of these and other factors, quarterly revenues, expenses, and results of operations could vary significantly in the future, and period-to-period comparisons should not be relied upon as indications of future performance. There can be no assurance that we will be able to increase revenues in future periods or be able to sustain the level of revenue or rate of revenue growth on a quarterly or annual basis that we have sustained in the past. Due to the foregoing factors, future results of operations could be below the expectations of public market analysts and investors. If that occurs, the market price of our common stock would likely decline.
Liquidity and Capital Resources
We have historically met our working capital and capital expenditure requirements by using both net cash flow from operations and by drawing from our line of credit. Our principal source of liquidity is our operating cash flow. There are currently no material restrictions on our ability to transfer and remit funds among our international markets. Repatriation of funds that are related to earnings considered permanently reinvested in certain of our markets would not result in a tax liability that would have a material impact on our liquidity.
53
Operating cash flow
We typically generate positive cash flow due to our strong operating margins. Net cash flow from operating activities totaled $70.1 million in 2011, compared with $66.1 million in 2010. The most significant components of this increase were an improvement to net earnings in 2011 compared with 2010, and a change in prepaid expenses and other current assets from 2010 to 2011, which was the result of: (i) a term deposit from our acquisition of BabyCare in 2010 that matured in 2011; (ii) an increase in federal income taxes receivable in 2010; and (iii) an increase in deferred commissions in 2010 related to an increase in deferred revenue from a successful promotion in Hong Kong that ended the final day of 2010. Partially offsetting the increase in cash flow from operating activities was, on a comparative basis, the change in other liabilities related to 2010 increases in deferred revenue, accrued Associate incentives and employee compensation, as well as a change in deferred income taxes which was primarily due to higher stock option exercises in 2010 and the impact of currency translation in 2011.
As a U.S.-based, multi-national company, reporting in U.S. dollars, our net sales and earnings can be significantly affected by changes in currency exchange rates and it is difficult to estimate the impact that these changes may have on our future operating results. In general, our reported sales and earnings are affected positively by a weakening of the U.S. dollar and negatively by a strengthening of the U.S. dollar relative to the currencies in the countries where we have operations. During 2011, we received a benefit to net sales of approximately $15.0 million related to changes in currency exchange rates. Notably, however, this benefit took place during the first nine months of 2011. In 2012 changes in currency exchange rates may negatively impact net sales and produce more difficult year-over-year comparables for our operating results.
Line of credit
We have a long-standing relationship with Bank of America. For the last few years, we have maintained a $40.0 million credit facility pursuant to a credit agreement with Bank of America. During the second quarter of 2011 we entered into an Amended and Restated Credit Agreement with Bank of America, which, among other things, extends the term of our credit facility through April 2016 and increases the amount that we may borrow under the credit facility to $60.0 million. We have not drawn on this line of credit since it was amended in the second quarter, and, as of December 31, 2011 there was no outstanding balance on this line of credit.
The agreement for this new credit facility contains restrictive covenants, which require us to maintain a consolidated rolling four-quarter adjusted earnings before interest, taxes, depreciation and amortization ("adjusted EBITDA") equal to or greater than $60.0 million, and a ratio of consolidated funded debt to adjusted EBITDA of 2.0 to 1.0 at the end of each quarter. The adjusted EBITDA under this agreement is modified for certain non-cash expenses. As of December 31, 2011, we were in compliance with these covenants. Management is not aware of any issues currently impacting Bank of America's ability to honor their commitment to extend credit under this facility.
Working capital
Cash and cash equivalents increased to $50.4 million at December 31, 2011, from $24.2 million at January 1, 2011. Of the $50.4 million held at December 31, 2011, $34.8 million was held in the United States, and $15.6 million was held by international subsidiaries. Of the $24.2 million held at January 1, 2011, $1.9 million was held in the United States, and $22.3 was held by international subsidiaries.
Net working capital increased to $46.4 million at December 31, 2011, from $22.6 million at January 1, 2011. This increase in net working capital was due mostly to net cash provided by operating activities, which was offset in large part by share repurchases as discussed below, and also purchases of property and equipment. Our purchases of property and equipment in 2011 included: software licensing
54
and maintenance for expanded reporting capabilities and increased production efficiency; build-out at our Corporate Headquarters for the manufacture of our Sensé products; purchase of equipment for expanded and improved production efficiencies; and the purchase and installation of solar panels at our Corporate Headquarters facility. We anticipate capital expenditures between $7.0 million and $10.0 million during 2012, which will include further IT-related investments and purchases of equipment for improved production efficiencies and to support our personalization strategy, as well as investments related to the opening of our new markets in 2012.
Share repurchase
We have a share repurchase plan that has been ongoing since the fourth quarter of 2000. Our Board of Directors has periodically approved additional dollar amounts for share repurchases under that plan. Share repurchases are made from time-to-time, in the open market, through block trades or otherwise, and are based on market conditions, the level of our cash balances, general business opportunities, and other factors. During 2011, we repurchased and retired 1.1 million shares of common stock for a total investment of $33.5 million, at an average market price of $29.88 per share. Also during 2011, our Board of Directors authorized an additional $30.0 million for share repurchases under the plan. As of December 31, 2011, the remaining approved repurchase amount under the plan was $28.2 million and there is no requirement for future share repurchases.
Summary
We believe that current cash balances, future cash provided by operations, and amounts available under our line of credit will be sufficient to cover our operating and capital needs in the ordinary course of business for the foreseeable future. If we experience an adverse operating environment or unusual capital expenditure requirements, additional financing may be required. No assurance can be given, however, that additional financing, if required, would be available or on favorable terms. We might also require or seek additional financing for the purpose of expanding new markets, growing our existing markets, or for other reasons. Such financing may include the use of additional debt or the sale of additional equity securities. Any financing which involves the sale of equity securities or instruments that are convertible into equity securities could result in immediate and possibly significant dilution to our existing shareholders.
Contractual Obligations and Commercial Contingencies
The following table summarizes our expected contractual obligations and commitments subsequent to December 31, 2011:
Payments Due By Period
(in thousands)
Contractual Obligations
|
Total | Less than 1 year |
1 - 3 years | 3 - 5 years | More than 5 years |
|||||||||||
|---|---|---|---|---|---|---|---|---|---|---|---|---|---|---|---|---|
Operating Leases |
$ | 11,537 | $ | 5,375 | $ | 5,475 | $ | 619 | $ | 68 | ||||||
Capital Commitments |
604 | 604 | — | — | — | |||||||||||
Other Commitments |
13,377 | 6,481 | 6,279 | 617 | — | |||||||||||
Purchase Obligations |
459 | 273 | 186 | — | — | |||||||||||
Line of Credit |
520 | 120 | 360 | 40 | ||||||||||||
Total Contractual Obligations |
$ | 26,497 | $ | 12,853 | $ | 12,300 | $ | 1,276 | $ | 68 | ||||||
"Operating Leases" generally provide that property taxes, insurance, and maintenance expenses are the responsibility of the Company. Such expenses are not included in the operating lease amounts that are outlined in the table above.
55
"Other Commitments" include consulting- and IT-related services, corporate and athlete sponsorships, facility maintenance, services related to the events that we hold for our Associates both locally and internationally, and uncertain tax positions. Additionally, throughout the year we will enter into various short-term contracts, mostly for services related to events that we hold for our Associates.
The "Line of Credit" has a maturity date of April 2016. Although we currently have no balance outstanding on this line of credit, fees on the unused portion of this line are due periodically and are reflected in the table above. If we utilize this line of credit prior to its maturity, we will be required to pay it in full at maturity.
We do not believe that inflation has had a material impact on our historical operations or profitability.
Our Consolidated Financial Statements included in this report have been prepared in accordance with accounting principles generally accepted in the United States of America (US GAAP). Our significant accounting policies are described in Note A to the Consolidated Financial Statements herein. The preparation of financial statements in accordance with US GAAP requires management to make estimates and assumptions that affect the amounts reported in the consolidated financial statements and accompanying footnotes. Those estimates and assumptions are derived and are continually evaluated based on our historical experiences, current facts and circumstances, and on changes in the business environment. Actual results, however, may sometimes differ materially from estimates under different conditions. Critical accounting estimates are defined as both those that are material to the portrayal of our financial condition and results of operations and those that require management's most subjective judgments. We believe that our most critical accounting estimates are described in this section.
- •
- Revenue is recognized at the estimated point of delivery of the merchandise, at which point the risks and rewards of
ownership have passed to the customer. Revenue is realizable when the following four criteria are met: persuasive evidence of a sale arrangement exists, delivery of the product has occurred, the price
is fixed or determinable, and payment is reasonably assured. We require cash or credit card payment prior to shipping and do not extend credit to customers.
- •
- Payments received for undelivered products are recorded as deferred revenue and are included in other current liabilities.
- •
- A provision for product returns and allowances is established and is based on our historical experience.
- •
- Amounts billed to customers for shipping and handling are classified as revenue.
- •
- Commissions paid to an Associate on his or her own orders are captured and reported as a reduction to net sales in the
form of a sales discount. Management estimates, based on the structure of USANA's Compensation Plan, that an Associate who places an order with sales volume points in a personal sales position will
eventually be paid commission on that purchase. Such reduction of revenue for Associates outside of the United States is converted to U.S. Dollars at the average currency exchange rate for the
applicable period.
- •
- We collect an annual renewal fee from our Associates that is deferred when it is collected and is recognized as income on a straight-line basis over the subsequent twelve-month period.
Revenue Recognition.
56
Inventory Valuation. Inventories are stated at the lower of cost or market, using the first-in, first-out method. The components of inventory cost include raw materials, labor, and overhead. Inventories are assessed to ensure that they are valued at estimated market value using various assumptions in regard to excess or slow-moving inventories, non-conforming inventories, expiration dates, current and future product demand, production planning, and market conditions. A change in any of these variables could result in an adjustment to inventory.
Impairment of Long-Lived Assets, Goodwill, and Other Intangible Assets. Long-lived assets are reviewed for impairment to determine whether events or changes in circumstances exist that indicate the carrying amount of the assets may not be recoverable. A long-lived asset is considered to be impaired when the carrying amount of an asset exceeds its fair value. Events or changes in circumstances that would indicate the need for impairment testing include, among other factors: operating losses; unused capacity; market value declines; technological developments resulting in obsolescence; changes in demand for products manufactured; changes in competition and competitive practices; uncertainties associated with the world economies; and changes in governmental regulations or actions.
Goodwill represents the excess of purchase price paid over the fair market value of identifiable net assets of companies acquired. Goodwill is not amortized, but rather it is tested at least annually for impairment (or more frequently if triggering events or changes in circumstances indicate impairment). The determination of impairment is made at the reporting unit level and an impairment loss is recognized to the extent that the carrying amount exceeds the reporting unit's fair value.
During the third quarter ended October 1, 2011, the Company early adopted new guidance which simplifies the goodwill impairment test by allowing the option to first assess qualitative factors in order to determine whether it is more likely than not that the fair value of a reporting unit is less than its carrying amount. Some of these qualitative factors may include macroeconomic conditions, industry and market considerations, a change in financial performance, entity-specific events, a sustained decrease in share price, and consideration of the difference between the fair value and carrying amount of a reporting unit as determined in the most recent quantitative assessment. If, through this qualitative assessment, the conclusion is made that it is more likely than not that a reporting unit's fair value is less than its carrying amount, a two-step impairment analysis is performed to estimate the fair value of goodwill, primarily using the discounted cash flow model, known as the income approach. The income approach requires the use of estimates and assumptions in projecting future operating results and related cash flows. The first step involves testing for impairment of goodwill by estimating the fair values of reporting units. If the carrying amount of goodwill exceeds its fair value, the second step of the impairment test is performed to measure the amount of the impairment loss. In the second step, the implied fair value of the goodwill is estimated as the fair value of the reporting unit as determined in step one, less fair values of all other net tangible and intangible assets of the reporting unit. If the carrying amount of the goodwill exceeds its implied fair value, an impairment loss is recognized in an amount equal to that excess, not to exceed the carrying amount of the goodwill. Fair value of each of the reporting units at December 31, 2011 was greater than the carrying amount; therefore, no impairment was recorded.
Other intangible assets represent definite-lived and indefinite-lived intangible assets acquired in connection with the purchase of our China operations on August 16, 2010. These intangible assets have been measured at the acquisition-date fair value using various methodologies applied within the income approach. Definite-lived intangible assets are amortized over their related useful lives and are tested for impairment if events or changes in circumstances indicate impairment. Indefinite-lived intangible assets are not amortized; however, they are tested at least annually for impairment or more frequently if events or changes in circumstances indicate impairment. There have been no events or changes in circumstances that have occurred subsequent to the acquisition of the indefinite-lived assets that would indicate impairment.
57
Determining the fair value of our intangible assets requires significant judgment in estimates and assumptions used under the income approach. A change in any of the estimates or assumptions used could result in an impairment.
Accounting for Income Taxes. Income taxes are calculated in each of the jurisdictions in which we operate. This process involves estimating our current tax exposure, together with assessing temporary differences for items treated differently for tax and financial reporting. Tax benefits are recognized from uncertain tax positions only if it is more likely than not that the tax position will be sustained on examination by the taxing authorities, based on the technical merits of the position. The tax benefits recognized in the financial statements from such a position are measured based on the largest benefit that has a greater than fifty percent likelihood of being realized upon ultimate resolution. Judgment is required in assessing the future tax consequences of events that have been recognized in our financial statements or tax returns. Variations in the actual outcome of these future tax consequences could materially impact our financial position, results of operations, or cash flows. Additional information regarding income taxes is available in Note E to the Consolidated Financial Statements herein.
On an interim basis, an estimate is made of what our effective tax rate will be for the full fiscal year, and a quarterly income tax provision in accordance with this anticipated effective rate is recorded. As the fiscal year progresses, we continually refine our estimate based upon actual events and earnings by jurisdiction during the year. This estimation process periodically results in changes to our expected effective tax rate for the fiscal year. When this occurs, we adjust the income tax provision during the quarter in which the change in estimate occurs so that the year-to-date provision equals the expected annual rate.
Equity-Based Compensation. We record compensation expense in the financial statements for equity-based awards based on the grant date fair value and an estimate of forfeitures derived from historical experience. We use the Black-Scholes option pricing model to estimate the fair value of our equity awards. Equity-based compensation expense is recognized on a straight-line basis over the requisite service period, which is generally the vesting period. For more information regarding the assumptions and estimates used in calculating this equity-based compensation expense, see Note L to the Consolidated Financial Statements herein.
Item 7A. Quantitative and Qualitative Disclosures About Market Risk
Our earnings, cash flows, and financial position are affected by fluctuations in currency exchange rates, interest rates, and other uncertainties that are inherent in doing business and selling product in more than one currency. In addition, our operations are exposed to risks that are associated with changes in social, political, and economic conditions in our international operations. This includes changes in the laws and policies that govern investment in international countries where we have operations, as well as, to a lesser extent, to changes in United States laws and regulations relating to international trade and investment.
Foreign Currency Risks. Net sales outside the United States represented 65.3%, 70.9%, and 74.6% of our net sales in 2009, 2010, and 2011 respectively. Because a significant portion of our sales are generated outside the United States, currency exchange rate fluctuations may have a significant effect on our sales and earnings. This risk is partially mitigated by the fact that our sales are spread across 15 markets, with Hong Kong (where the local currency is tied to the U.S. dollar) being our largest international market, at 26.9% of net sales in 2011, followed by Canada at 11.5%. The local currency of each international subsidiary is considered the functional currency, with all revenue and expenses being translated at weighted-average currency exchange rates for the applicable periods. In general, our reported sales and earnings are affected positively by a weakening of the U.S. dollar and negatively by a strengthening of the U.S. dollar. Changes in currency exchange rates may also affect our product margins, because we manufacture the majority of our products in the U.S. and sell them to our
58
international subsidiaries in their respective functional currencies. We are unable to reasonably estimate the effect that currency fluctuations may have on our future business, results of operations, or financial condition. This is due to the uncertainty in, and the varying degrees and type of exposure that we face from, fluctuation of various currencies.
Currently our strategy for reducing our exposure to currency fluctuation includes the timely and efficient repatriation of earnings from international markets and settlement of intercompany transactions. At times in the past we have sought to reduce exposure to fluctuations in currency exchange rates by creating offsetting positions through the use of currency exchange contracts on cash that we repatriate and we may look to something like this again in the coming year. We do not use derivative financial instruments for trading or speculative purposes. There can be no assurance that our practices will be successful in eliminating all or substantially all of the risks that may be encountered in connection with our currency transactions. As of December 31, 2011, we had no currency exchange contracts in place.
Following are the average exchange rates of currency units to one U.S. dollar for each of the international markets in which we operated as of December 31, 2011 for the quarterly periods indicated:
| |
2010 | 2011 | |||||||||||||||||||||||
|---|---|---|---|---|---|---|---|---|---|---|---|---|---|---|---|---|---|---|---|---|---|---|---|---|---|
| |
First | Second | Third | Fourth | First | Second | Third | Fourth | |||||||||||||||||
Canadian Dollar |
1.04 | 1.03 | 1.04 | 1.01 | 0.99 | 0.97 | 0.98 | 1.02 | |||||||||||||||||
Australian Dollar |
1.10 | 1.14 | 1.10 | 1.01 | 0.99 | 0.94 | 0.95 | 0.99 | |||||||||||||||||
New Zealand Dollar |
1.41 | 1.43 | 1.39 | 1.32 | 1.32 | 1.25 | 1.20 | 1.29 | |||||||||||||||||
Hong Kong Dollar |
7.76 | 7.78 | 7.77 | 7.76 | 7.79 | 7.78 | 7.79 | 7.78 | |||||||||||||||||
Japanese Yen |
90.74 | 91.80 | 85.65 | 82.64 | 81.97 | 81.30 | 77.52 | 77.52 | |||||||||||||||||
New Taiwan Dollar |
31.92 | 31.86 | 31.88 | 30.30 | 29.33 | 28.84 | 29.15 | 30.21 | |||||||||||||||||
Korean Won |
1,142.6 | 1,166.8 | 1,179.7 | 1,111.1 | 1,111.1 | 1,082.6 | 1,111.1 | 1,111.1 | |||||||||||||||||
Singapore Dollar |
1.40 | 1.39 | 1.35 | 1.30 | 1.28 | 1.24 | 1.23 | 1.29 | |||||||||||||||||
Mexican Peso |
12.75 | 12.59 | 12.78 | 12.39 | 12.05 | 11.71 | 12.32 | 13.64 | |||||||||||||||||
Chinese Yuan |
6.83 | 6.82 | 6.77 | 6.65 | 6.58 | 6.50 | 6.41 | 6.36 | |||||||||||||||||
Malaysian Ringitt |
3.36 | 3.24 | 3.15 | 3.11 | 3.05 | 3.02 | 3.02 | 3.15 | |||||||||||||||||
Philippine Peso |
45.92 | 45.55 | 45.10 | 43.67 | 43.67 | 43.29 | 42.74 | 43.48 | |||||||||||||||||
Interest Rate Risks. As of December 31, 2011, we had no outstanding debt, and therefore, we have no direct exposure to interest rate risk. It may become necessary to borrow in the future in order to meet our financing needs. In the event that it becomes necessary to borrow, there can be no assurance that we will be able to borrow, or at favorable rates.
Item 8. Financial Statements and Supplementary Data
The Financial Statements and Supplementary Data required by this Item are set forth at the pages indicated at Item 15 below.
Item 9. Changes in and Disagreements with Accountants on Accounting and Financial Disclosure
None.
Item 9A. Controls and Procedures
Disclosure Controls and Procedures
We maintain disclosure controls and procedures that are designed to ensure that information that is required to be disclosed in our Exchange Act reports is recorded, processed, summarized, and
59
reported within the time periods specified in the SEC's rules and forms and that such information is accumulated and communicated to management, including the Chief Executive Officer and Chief Financial Officer, as appropriate, to allow timely decisions regarding any required disclosure. In designing and evaluating these disclosure controls and procedures, management recognized that any controls and procedures, no matter how well designed and operated, can provide only reasonable assurance of achieving the desired control objectives, and management necessarily was required to apply its judgment in evaluating the cost-benefit relationship of possible disclosure controls and procedures.
As of the end of the period covered by this report, our Chief Executive Officer and Chief Financial Officer evaluated the effectiveness of the design and operation of our disclosure controls and procedures (as defined in Rule 13a- 15(e) under the Exchange Act). Based on this evaluation, the Chief Executive Officer and Chief Financial Officer concluded that the disclosure controls and procedures were effective to provide reasonable assurance as of December 31, 2011.
Management's Report on Internal Control Over Financial Reporting
Our management is responsible for establishing and maintaining adequate internal control over financial reporting, (as defined in Rule 13a- 15(f) under the Exchange Act). The Company's internal control over financial reporting is designed to provide reasonable assurance regarding the reliability of financial reporting and the preparation of the Company's financial statements for external purposes in accordance with generally accepted accounting principles. Internal control over financial reporting includes those policies and procedures that:
- •
- Pertain to the maintenance of records that, in reasonable detail, accurately and fairly reflect the transactions and
dispositions of the assets of the Company;
- •
- Provide reasonable assurance that transactions are recorded, as necessary, to permit preparation of financial statements
in accordance with generally accepted accounting principles and that receipts and expenditures of the Company are being made only in accordance with authorizations of management and directors of the
Company; and
- •
- Provide reasonable assurance regarding the prevention or timely detection of any unauthorized acquisition, use or disposition of the Company's assets that could have a material effect on the financial statements.
Because of its inherent limitations, internal control over financial reporting may not prevent or detect misstatements. Projections of any evaluation of effectiveness to future periods are subject to the risks that controls may become inadequate because of changes in conditions or that the degree of compliance with the policies or procedures may deteriorate.
Our management assessed the effectiveness of the Company's internal control over financial reporting as of December 31, 2011. In making this assessment, management used the criteria that have been set forth by the Committee of Sponsoring Organizations of the Treadway Commission (COSO) in Internal Control-Integrated Framework. Based on its assessment, using those criteria, management concluded that, as of December 31, 2011, the Company's internal control over financial reporting was effective.
The effectiveness of the Company's internal control over financial reporting, as of December 31, 2011, has been audited by PricewaterhouseCoopers LLP, an independent registered public accounting firm, as stated in their report which appears herein.
60
Changes in Internal Control Over Financial Reporting
There were no changes in our internal controls over financial reporting that occurred during the quarter ended December 31, 2011, that have materially affected or that are reasonably likely to materially affect the Company's internal control over financial reporting.
None.
PART III
Item 10. Directors, Executive Officers and Corporate Governance
The information for this Item is incorporated by reference to the definitive proxy statement to be filed pursuant to Regulation 14A under the Exchange Act.
Item 11. Executive Compensation
The information for this Item is incorporated by reference to the definitive proxy statement to be filed pursuant to Regulation 14A under the Exchange Act.
Item 12. Security Ownership of Certain Beneficial Owners and Management and Related Stockholder Matters
The information for this Item is incorporated by reference to the definitive proxy statement to be filed pursuant to Regulation 14A under the Exchange Act.
Item 13. Certain Relationships and Related Transactions, and Director Independence
The information for this Item is incorporated by reference to the definitive proxy statement to be filed pursuant to Regulation 14A under the Exchange Act.
Item 14. Principal Accounting Fees and Services
The information for this Item is incorporated by reference to the definitive proxy statement to be filed pursuant to Regulation 14A under the Exchange Act.
61
PART IV
Item 15. Exhibits, Financial Statement Schedules
(a) The following documents are filed as part of this Form:
2. Financial Statement Schedules.
For
the years ended January 2, 2010, January 1, 2011, and December 31, 2011
Schedule II—Valuation and Qualifying Accounts
3. Exhibits.
| Exhibit Number |
Description | ||
|---|---|---|---|
| 3.1 | Amended and Restated Articles of Incorporation (incorporated by reference to Current Report on Form 8-K, filed April 25, 2006) | ||
3.2 |
Bylaws (incorporated by reference to Current Report on Form 8-K, filed April 25, 2006) |
||
4.1 |
Specimen Stock Certificate for Common Stock (incorporated by reference to Registration Statement on Form 10, File No. 0-21116, effective April 16, 1993) |
||
10.1 |
2002 USANA Health Sciences, Inc. Stock Option Plan (incorporated by reference to Registration Statement on Form S-8, filed July 18, 2002)* |
||
10.2 |
Form of employee or director non-statutory stock option agreement under the 2002 USANA Health Sciences, Inc. Stock Option Plan (incorporated by reference to Annual Report on Form 10-K, filed March 6, 2006)* |
||
10.3 |
Form of employee incentive stock option agreement under the 2002 USANA Health Sciences, Inc. Stock Option Plan (incorporated by reference to Annual Report on Form 10-K, filed March 6, 2006)* |
||
10.4 |
Credit Agreement, dated as of June 16, 2004, by and between Bank of America, N.A. and USANA Health Sciences, Inc. (incorporated by reference to Quarterly Report on Form 10-Q for the period ended July 3, 2004, filed August 5, 2004) |
||
10.5 |
Amendment to Credit Agreement, dated as of May 17, 2006 (incorporated by reference to Quarterly Report on Form 10-Q for the period ended July 1, 2006, filed August 8, 2006) |
||
10.6 |
Amendment to Credit Agreement, dated as of April 24, 2007 (incorporated by reference to Quarterly Report on Form 10-Q for the period ended March 31, 2007, filed May 7, 2007) |
||
10.7 |
USANA Health Sciences, Inc. 2006 Equity Incentive Award Plan (incorporated by reference to Current Report on Form 8-K, filed April 25, 2006)* |
||
10.8 |
Form of Stock Option Agreement for award of non-statutory stock options to employees under the USANA Health Sciences, Inc. 2006 Equity Incentive Award Plan (incorporated by reference to Current Report on Form 8-K, filed April 26, 2006)* |
||
62
| Exhibit Number |
Description | ||
|---|---|---|---|
| 10.9 | Form of Stock Option Agreement for award of non-statutory stock options to directors who are not employees under the USANA Health Sciences, Inc. 2006 Equity Incentive Award Plan (incorporated by reference to Current Report on Form 8-K, filed April 26, 2006)* | ||
10.10 |
Form of Incentive Stock Option Agreement for award of incentive stock options to employees under the USANA Health Sciences, Inc. 2006 Equity Incentive Award Plan (incorporated by reference to Current Report on Form 8-K, filed April 26, 2006)* |
||
10.11 |
Form of Stock-Settled Stock Appreciation Rights Award Agreement for award of stock-settled stock appreciation rights to employees under the USANA Health Sciences, Inc. 2006 Equity Incentive Award Plan (incorporated by reference to Current Report on Form 8-K, filed April 26, 2006)* |
||
10.12 |
Form of Stock-Settled Stock Appreciation Rights Award Agreement for award of stock-settled stock appreciation rights to directors who are not employees under the USANA Health Sciences, Inc. 2006 Equity Incentive Award Plan (incorporated by reference to Current Report on Form 8-K, filed April 26, 2006)* |
||
10.13 |
Form of Deferred Stock Unit Award Agreement for grants of deferred stock units to directors who are not employees under the USANA Health Sciences, Inc. 2006 Equity Incentive Award Plan (incorporated by reference to Current Report on Form 8-K, filed April 26, 2006)* |
||
10.14 |
Form of Indemnification Agreement between the Company and its directors (incorporated by reference to Current Report on Form 8-K, filed May 24, 2006)* |
||
10.15 |
Form of Indemnification Agreement between the Company and certain of its officers (Incorporated by reference to Report on Form 8-K, filed May 24, 2006)* |
||
10.16 |
Share Purchase Agreement, dated as of August 16, 2010, among USANA Health Sciences, Inc., Petlane, Inc., Yaolan Ltd., and BabyCare Holdings Ltd. (Incorporated by Reference to Report on Form 8-K, filed August 16, 2010) |
||
10.17 |
Amended and Restated Credit Agreement, dated as of April 27, 2011 (Incorporated by reference to Report on Form 8-K, filed April 28, 2011) |
||
10.18 |
Form of Executive Confidentiality, Non-Disclosure and Non-Solicitation Agreement (incorporated by reference to Quarterly Report on Form 10-Q for the period ended October 1, 2011, filed November 9, 2011)* |
||
11.1 |
Computation of Net Income per Share (included in Notes to Consolidated Financial Statements) |
||
14 |
Code of Ethics of USANA Health Sciences, Inc. (posted on the Company's Internet web site at www.usanahealthsciences.com) |
||
21 |
Subsidiaries of the Registrant, as of March 2, 2012 (filed herewith) |
||
23.1 |
Consent of Independent Registered Public Accounting Firm (PricewaterhouseCoopers LLP) (filed herewith) |
||
31.1 |
Certification of Chief Executive Officer pursuant to section 302 of the Sarbanes-Oxley Act of 2002 (filed herewith) |
||
31.2 |
Certification of Chief Financial Officer pursuant to section 302 of the Sarbanes-Oxley Act of 2002 (filed herewith) |
||
63
| Exhibit Number |
Description | ||
|---|---|---|---|
| 32.1 | Certification of Chief Executive Officer pursuant to section 906 of the Sarbanes-Oxley Act of 2002, 18 U.S.C. Section 1350 (filed herewith) | ||
32.2 |
Certification of Chief Financial Officer pursuant to section 906 of the Sarbanes-Oxley Act of 2002, 18 U.S.C. Section 1350 (filed herewith) |
||
101 |
The following financial information from the quarterly report on Form 10-K of USANA Health Sciences, Inc. for the year ended December 31, 2011, formatted in eXtensible Reporting Language ("XBRL"): (i) Consolidated Balance Sheets, (ii) Consolidated Statements of Earnings, (iii) Consolidated Statements of Stockholders' Equity and Comprehensive Income, (iv) Consolidated Statements of Cash Flows, and (v) Notes to the Consolidated Financial Statements. |
||
- *
- Denotes a management contract or compensatory plan or arrangement.
64
Pursuant to the requirements of Section 13 or 15(d) of the Securities Exchange Act of 1934, the registrant has duly caused this report to be signed on its behalf by the undersigned, thereunto duly authorized.
| USANA Health Sciences, Inc. | ||||
By: |
/s/ DAVID A. WENTZ David A. Wentz Chief Executive Officer |
|||
Date: March 14, 2012
Pursuant to the requirements of the Securities Exchange Act of 1934, this report has been signed below by the following persons on behalf of the registrant and in the capacities and on the dates indicated.
Signature
|
Title
|
Date
|
||
|---|---|---|---|---|
| /s/ MYRON W. WENTZ Myron W. Wentz, PhD |
Chairman | March 14, 2012 | ||
/s/ DAVID A. WENTZ David A. Wentz |
Chief Executive Officer (Principal Executive Officer) |
March 14, 2012 |
||
/s/ RONALD S. POELMAN Ronald S. Poelman |
Director |
March 14, 2012 |
||
/s/ ROBERT ANCIAUX Robert Anciaux |
Director |
March 14, 2012 |
||
/s/ JERRY G. MCCLAIN Jerry G. McClain |
Director |
March 14, 2012 |
||
/s/ GILBERT A. FULLER Gilbert A. Fuller |
Director |
March 14, 2012 |
||
/s/ G. DOUGLAS HEKKING G. Douglas Hekking |
Chief Financial Officer (Principal Financial and Accounting Officer) |
March 14, 2012 |
65
REPORT OF INDEPENDENT REGISTERED PUBLIC ACCOUNTING FIRM
To
the Board of Directors and Shareholders of
USANA Health Sciences, Inc.:
In our opinion, the accompanying consolidated balance sheets and the related consolidated statements of earnings, stockholders' equity and comprehensive income and cash flows present fairly, in all material respects, the financial position of USANA Health Sciences, Inc. and its subsidiaries at December 31, 2011 and January 1, 2011, and the results of their operations and their cash flows for each of the three years in the period ended December 31, 2011 in conformity with accounting principles generally accepted in the United States of America. In addition, in our opinion, the financial statement schedule listed in the index appearing under Item 15(a)(2) presents fairly, in all material respects, the information set forth therein when read in conjunction with the related consolidated financial statements. Also in our opinion, the Company maintained, in all material respects, effective internal control over financial reporting as of December 31, 2011, based on criteria established in Internal Control—Integrated Framework issued by the Committee of Sponsoring Organizations of the Treadway Commission (COSO). The Company's management is responsible for these financial statements and financial statement schedule, for maintaining effective internal control over financial reporting and for its assessment of the effectiveness of internal control over financial reporting, included in Management's Report on Internal Control over Financial Reporting appearing under Item 9A. Our responsibility is to express opinions on these financial statements, on the financial statement schedule, and on the Company's internal control over financial reporting based on our integrated audits. We conducted our audits in accordance with the standards of the Public Company Accounting Oversight Board (United States). Those standards require that we plan and perform the audits to obtain reasonable assurance about whether the financial statements are free of material misstatement and whether effective internal control over financial reporting was maintained in all material respects. Our audits of the financial statements included examining, on a test basis, evidence supporting the amounts and disclosures in the financial statements, assessing the accounting principles used and significant estimates made by management, and evaluating the overall financial statement presentation. Our audit of internal control over financial reporting included obtaining an understanding of internal control over financial reporting, assessing the risk that a material weakness exists, and testing and evaluating the design and operating effectiveness of internal control based on the assessed risk. Our audits also included performing such other procedures as we considered necessary in the circumstances. We believe that our audits provide a reasonable basis for our opinions.
A company's internal control over financial reporting is a process designed to provide reasonable assurance regarding the reliability of financial reporting and the preparation of financial statements for external purposes in accordance with generally accepted accounting principles. A company's internal control over financial reporting includes those policies and procedures that (i) pertain to the maintenance of records that, in reasonable detail, accurately and fairly reflect the transactions and dispositions of the assets of the company; (ii) provide reasonable assurance that transactions are recorded as necessary to permit preparation of financial statements in accordance with generally accepted accounting principles, and that receipts and expenditures of the company are being made only in accordance with authorizations of management and directors of the company; and (iii) provide reasonable assurance regarding prevention or timely detection of unauthorized acquisition, use, or disposition of the company's assets that could have a material effect on the financial statements.
Because of its inherent limitations, internal control over financial reporting may not prevent or detect misstatements. Also, projections of any evaluation of effectiveness to future periods are subject to the risk that controls may become inadequate because of changes in conditions, or that the degree of compliance with the policies or procedures may deteriorate.
/s/ PricewaterhouseCoopers LLP
Salt
Lake City, Utah
March 14, 2012
F-1
USANA HEALTH SCIENCES, INC. AND SUBSIDIARIES
CONSOLIDATED BALANCE SHEETS
(in thousands)
| |
As of January 1, 2011 |
As of December 31, 2011 |
|||||
|---|---|---|---|---|---|---|---|
ASSETS |
|||||||
Current assets |
|||||||
Cash and cash equivalents |
$ | 24,222 | $ | 50,353 | |||
Inventories |
34,078 | 36,968 | |||||
Prepaid expenses and other current assets |
23,377 | 18,738 | |||||
Total current assets |
81,677 | 106,059 | |||||
Property and equipment, net |
57,568 |
60,754 |
|||||
Goodwill |
17,267 |
17,740 |
|||||
Intangible assets, net |
41,915 | 42,637 | |||||
Deferred tax assets |
12,383 | 11,033 | |||||
Other assets |
5,826 | 6,273 | |||||
|
$ | 216,636 | $ | 244,496 | |||
LIABILITIES AND STOCKHOLDERS' EQUITY |
|||||||
Current liabilities |
|||||||
Accounts payable |
$ | 6,445 | $ | 7,952 | |||
Other current liabilities |
52,584 | 51,744 | |||||
Total current liabilities |
59,029 | 59,696 | |||||
Deferred tax liabilities |
9,793 |
9,948 |
|||||
Other long-term liabilities |
1,012 | 942 | |||||
Stockholders' equity |
|||||||
Common stock, $0.001 par value; Authorized—50,000 shares, issued and outstanding 15,985 as of January 1, 2011 and 14,940 as of December 31, 2011 |
16 | 15 | |||||
Additional paid-in capital |
51,222 | 49,257 | |||||
Retained earnings |
90,207 | 118,799 | |||||
Accumulated other comprehensive income |
5,357 | 5,839 | |||||
Total stockholders' equity |
146,802 | 173,910 | |||||
|
$ | 216,636 | $ | 244,496 | |||
The accompanying notes are an integral part of these statements.
F-2
USANA HEALTH SCIENCES, INC. AND SUBSIDIARIES
CONSOLIDATED STATEMENTS OF EARNINGS
(in thousands, except per share data)
| |
Year ended | |||||||||
|---|---|---|---|---|---|---|---|---|---|---|
| |
2009 | 2010 | 2011 | |||||||
Net sales |
$ | 436,940 | $ | 517,644 | $ | 581,939 | ||||
Cost of sales |
89,803 | 95,482 | 101,692 | |||||||
Gross profit |
347,137 | 422,162 | 480,247 | |||||||
Operating expenses: |
||||||||||
Associate incentives |
196,363 | 233,187 | 265,928 | |||||||
Selling, general and administrative |
99,983 | 120,759 | 137,063 | |||||||
Total operating expenses |
296,346 | 353,946 | 402,991 | |||||||
Earnings from operations |
50,791 | 68,216 | 77,256 | |||||||
Other income (expense): |
||||||||||
Interest income |
82 | 167 | 191 | |||||||
Interest expense |
(609 | ) | (94 | ) | (9 | ) | ||||
Other, net |
714 | 575 | 40 | |||||||
Other income, net |
187 | 648 | 222 | |||||||
Earnings before income taxes |
50,978 | 68,864 | 77,478 | |||||||
Income taxes |
17,422 |
23,213 |
26,726 |
|||||||
Net earnings |
$ | 33,556 | $ | 45,651 | $ | 50,752 | ||||
Earnings per common share |
||||||||||
Basic |
$ | 2.19 | $ | 2.94 | $ | 3.30 | ||||
Diluted |
$ | 2.17 | $ | 2.86 | $ | 3.26 | ||||
Weighted average common shares outstanding |
||||||||||
Basic |
15,340 | 15,528 | 15,361 | |||||||
Diluted |
15,432 | 15,942 | 15,574 | |||||||
The accompanying notes are an integral part of these statements.
F-3
USANA HEALTH SCIENCES, INC. AND SUBSIDIARIES
CONSOLIDATED STATEMENTS OF STOCKHOLDERS' EQUITY AND
COMPREHENSIVE INCOME
Years ended
January 2, 2010; January 1, 2011; and December 31, 2011
(in thousands)
| |
Common Stock | |
|
Accumulated Other Comprehensive Income (Loss) |
|
||||||||||||||
|---|---|---|---|---|---|---|---|---|---|---|---|---|---|---|---|---|---|---|---|
| |
Additional Paid-in Capital | Retained Earnings | |
||||||||||||||||
| |
Shares | Value | Total | ||||||||||||||||
Balance at January 3, 2009 |
15,350 | $ | 15 | $ | 8,089 | $ | 24,107 | $ | (375 | ) | $ | 31,836 | |||||||
Comprehensive Income |
|||||||||||||||||||
Net earnings |
— | — | — | 33,556 | — | 33,556 | |||||||||||||
Foreign currency translation adjustment, net of tax expense of $1,852 |
— | — | — | — | 1,898 | 1,898 | |||||||||||||
Comprehensive income |
— | — | — | — | 35,454 | ||||||||||||||
Equity-based compensation expense |
— | — | 8,925 | — | — | 8,925 | |||||||||||||
Common stock repurchased and retired |
(54 | ) | — | (401 | ) | (1,253 | ) | — | (1,654 | ) | |||||||||
Common stock issued under equity award plans, including tax expense of $319 |
13 | — | (188 | ) | — | — | (188 | ) | |||||||||||
Balance at January 2, 2010 |
15,309 | 15 | 16,425 | 56,410 | 1,523 | 74,373 | |||||||||||||
Comprehensive Income |
|||||||||||||||||||
Net earnings |
— | — | — | 45,651 | — | 45,651 | |||||||||||||
Foreign currency translation adjustment, net of tax expense of $906 |
— | — | — | — | 3,834 | 3,834 | |||||||||||||
Comprehensive income |
— | — | — | — | — | 49,485 | |||||||||||||
Equity-based compensation expense |
— | — | 10,406 | — | — | 10,406 | |||||||||||||
Common stock repurchased and retired |
(387 | ) | (1 | ) | (5,176 | ) | (11,854 | ) | — | (17,031 | ) | ||||||||
Common stock issued in connection with acquisition |
400 | 1 | 17,715 | — | — | 17,716 | |||||||||||||
Common stock issued under equity award plans, including tax expense of $152 |
663 | 1 | 11,852 | — | — | 11,853 | |||||||||||||
Balance at January 1, 2011 |
15,985 | 16 | 51,222 | 90,207 | 5,357 | 146,802 | |||||||||||||
Comprehensive Income |
|||||||||||||||||||
Net earnings |
— | — | — | 50,752 | — | 50,752 | |||||||||||||
Foreign currency translation adjustment, net of tax expense of $1,476 |
— | — | — | — | 482 | 482 | |||||||||||||
Comprehensive income |
— | — | — | — | 51,234 | ||||||||||||||
Equity-based compensation expense |
— | — | 10,549 | — | — | 10,549 | |||||||||||||
Common stock repurchased and retired |
(1,120 | ) | (1 | ) | (11,298 | ) | (22,160 | ) | — | (33,459 | ) | ||||||||
Common stock issued under equity award plans, including tax expense of $317 |
75 | — | (278 | ) | — | — | (278 | ) | |||||||||||
Tax impact of canceled vested equity awards |
— | — | (938 | ) | — | — | (938 | ) | |||||||||||
Balance at December 31, 2011 |
14,940 | $ | 15 | $ | 49,257 | $ | 118,799 | $ | 5,839 | $ | 173,910 | ||||||||
The accompanying notes are an integral part of these statements.
F-4
USANA HEALTH SCIENCES, INC. AND SUBSIDIARIES
CONSOLIDATED STATEMENTS OF CASH FLOWS
(in thousands)
| |
Year ended | |||||||||
|---|---|---|---|---|---|---|---|---|---|---|
| |
2009 | 2010 | 2011 | |||||||
Cash flows from operating activities |
||||||||||
Net earnings |
$ | 33,556 | $ | 45,651 | $ | 50,752 | ||||
Adjustments to reconcile net earnings to net cash provided by operating activities |
||||||||||
Depreciation and amortization |
7,069 | 7,916 | 8,474 | |||||||
(Gain) loss on sale of property and equipment |
(149 | ) | 94 | 45 | ||||||
Equity-based compensation expense |
8,925 | 10,406 | 10,549 | |||||||
Excess tax benefits from equity-based payment arrangements |
(11 | ) | (2,449 | ) | (48 | ) | ||||
Deferred income taxes |
(2,296 | ) | 3,194 | (1,599 | ) | |||||
Changes in operating assets and liabilities: |
||||||||||
Inventories, net |
(299 | ) | (4,982 | ) | (3,209 | ) | ||||
Prepaid expenses and other assets |
1,685 | (5,218 | ) | 4,024 | ||||||
Accounts payable |
(1,138 | ) | (1,981 | ) | 1,502 | |||||
Other liabilities |
(14,873 | ) | 13,477 | (382 | ) | |||||
Total adjustments |
(1,087 | ) | 20,457 | 19,356 | ||||||
Net cash provided by operating activities |
32,469 | 66,108 | 70,108 | |||||||
Cash flows from investing activities |
||||||||||
Acquisitions, net of cash acquired |
$ | — | $ | (42,694 | ) | $ | — | |||
Receipts on notes receivable |
245 | — | — | |||||||
Increase in notes receivable |
(151 | ) | — | — | ||||||
Proceeds from sale of property and equipment |
837 | 33 | 34 | |||||||
Purchases of property and equipment |
(4,128 | ) | (4,192 | ) | (10,643 | ) | ||||
Net cash used in investing activities |
(3,197 | ) | (46,853 | ) | (10,609 | ) | ||||
Cash flows from financing activities |
||||||||||
Proceeds from equity awards exercised |
$ | 131 | $ | 12,005 | $ | 39 | ||||
Excess tax benefits from equity-based payment arrangements |
11 | 2,449 | 48 | |||||||
Repurchase of common stock |
(1,654 | ) | (17,031 | ) | (33,459 | ) | ||||
Borrowings on line of credit |
57,020 | 31,150 | — | |||||||
Payments on line of credit |
(85,010 | ) | (38,150 | ) | — | |||||
Net cash used in financing activities |
(29,502 | ) | (9,577 | ) | (33,372 | ) | ||||
Effect of exchange rate changes on cash and cash equivalents |
607 |
886 |
4 |
|||||||
Net increase in cash and cash equivalents |
377 | 10,564 | 26,131 | |||||||
Cash and cash equivalents, beginning of period |
13,281 |
13,658 |
24,222 |
|||||||
Cash and cash equivalents, end of period |
$ | 13,658 | $ | 24,222 | $ | 50,353 | ||||
Supplemental disclosures of cash flow information |
||||||||||
Cash paid during the period for: |
||||||||||
Interest |
$ | 552 | $ | 99 | $ | 10 | ||||
Income taxes |
22,817 | 21,628 | 24,539 | |||||||
Non-cash financing activities |
||||||||||
Common stock issued in connection with acquisitions |
— | 17,716 | — | |||||||
The accompanying notes are an integral part of these statements.
F-5
USANA HEALTH SCIENCES, INC. AND SUBSIDIARIES
NOTES TO CONSOLIDATED FINANCIAL STATEMENTS
(in thousands, except per share data)
NOTE A—SUMMARY OF SIGNIFICANT ACCOUNTING POLICIES
The Company
USANA Health Sciences, Inc. (the "Company") develops and manufactures high-quality nutritional and personal care products that are sold internationally through a global network marketing system, which is a form of direct selling. The Company operates in a single business segment as a direct selling company and reports operations in two geographic regions: North America and Asia Pacific, which is further divided into three sub-regions; Southeast Asia/Pacific, Greater China, and North Asia. North America includes the United States, Canada, Mexico, and direct sales from the United States to the United Kingdom and the Netherlands. Southeast Asia/Pacific includes Australia, New Zealand, Singapore, Malaysia, and the Philippines; Greater China includes Hong Kong, Taiwan and China; and North Asia includes Japan and South Korea.
Principles of consolidation and basis of presentation
The Consolidated Financial Statements include the accounts and operations of USANA Health Sciences, Inc. and its wholly-owned subsidiaries (collectively, the "Company" or "USANA"). All significant inter-company accounts and transactions have been eliminated in this consolidation. The accounting and reporting policies of the Company conform with accounting principles generally accepted in the United States of America (US GAAP).
Use of estimates
The preparation of financial statements in conformity with US GAAP requires management to make estimates and assumptions that affect the amounts reported in the consolidated financial statements and the related notes. Significant estimates for the Company relate to revenue recognition, inventory obsolescence, goodwill, equity-based compensation, and income taxes. Actual results could differ from those estimates. These estimates may be adjusted as more current information becomes available, and any adjustment could be significant.
Fiscal year
The Company operates on a 52-53 week year, ending on the Saturday closest to December 31. Fiscal years 2009, 2010, and 2011 were 52-week years. Fiscal year 2009 covered the period January 4, 2009 to January 2, 2010 (hereinafter 2009). Fiscal year 2010 covered the period January 3, 2010 to January 1, 2011 (hereinafter 2010). Fiscal year 2011 covered the period January 2, 2011 to December 31, 2011 (hereinafter 2011).
Fair value of financial instruments
The Company's financial instruments include: cash and cash equivalents, accounts receivable, restricted cash, and accounts payable. The recorded values of cash and cash equivalents, accounts receivable, and accounts payable approximate their fair values, based on their short-term nature. The recorded value of restricted cash is determined based on the principal amount and interest accrual.
The valuation hierarchy is based upon the transparency of inputs to the valuation of an asset or liability as of the measurement date.
F-6
USANA HEALTH SCIENCES, INC. AND SUBSIDIARIES
NOTES TO CONSOLIDATED FINANCIAL STATEMENTS (Continued)
(in thousands, except per share data)
NOTE A—SUMMARY OF SIGNIFICANT ACCOUNTING POLICIES (Continued)
The three levels are defined as follows:
- •
- Level 1 inputs are quoted market prices in active markets for identical assets or liabilities that are accessible
at the measurement date.
- •
- Level 2 inputs are from other than quoted market prices included in Level 1 that are observable for the
asset or liability, either directly or indirectly.
- •
- Level 3 inputs are unobservable and are used to measure fair value in situations where there is little, if any, market activity for the asset or liability at the measurement date.
The fair values of term deposits placed with banks are determined based on the pervasive interest rates in the market, which are also the interest rates as stated in the contracts with the banks. The Company classifies the valuation techniques that use the pervasive interest rates input as Level 2. The carrying values of these term deposits approximate their fair values due to their short-term maturities. As of January 1, 2011, and December 31, 2011 the fair value of term deposits in the consolidated balance sheet totaled $3,034, and $0, respectively. These term deposits have been classified within prepaid expenses and other current assets.
Translation of foreign currencies
The functional currency of the Company's foreign subsidiaries is the local currency of their country of domicile. Assets and liabilities of the foreign subsidiaries are translated into U.S. dollar amounts at month-end exchange rates. Revenue and expense accounts are translated at the weighted-average rates for the monthly accounting period to which they relate. Equity accounts are translated at historical rates. Foreign currency translation adjustments are accumulated as a component of other comprehensive income. Foreign currency gains and losses resulting from intercompany transactions are included in the "Other, net" component of Other income (expense) in the Company's consolidated statements of earnings.
Cash and cash equivalents
The Company considers all highly liquid investments with an original maturity of three months or less from the date of purchase to be cash equivalents.
Restricted Cash
The Company is required to maintain cash deposits with banks in certain subsidiary locations for various operating purposes.
The most significant of these cash deposits as of December 31, 2011 was $3,166, which is held at a PRC bank and related to the Company's China operations. This deposit is required by the rules of the Ministry of Commerce and the State of Administration for Industry & Commerce of the PRC for the Company's China operations application for a direct sales license, and will continue to be restricted during the periods while the Company holds this license. Restricted cash is included in other assets.
F-7
USANA HEALTH SCIENCES, INC. AND SUBSIDIARIES
NOTES TO CONSOLIDATED FINANCIAL STATEMENTS (Continued)
(in thousands, except per share data)
NOTE A—SUMMARY OF SIGNIFICANT ACCOUNTING POLICIES (Continued)
Inventories
Inventories are stated at the lower of cost or market, using the first-in, first-out method. The components of inventory cost include raw materials, labor, and overhead. Inventories are assessed to ensure that they are valued at estimated market value using various assumptions in regard to excess or slow-moving inventories, non-conforming inventories, expiration dates, current and future product demand, production planning, and market conditions. A change in any of these variables could result in an adjustment to inventory.
Income taxes
The Company accounts for income taxes using the asset and liability method, which requires recognition of deferred tax assets and liabilities for the expected future tax consequences of the differences between the financial statement assets and liabilities and their respective tax bases. Deferred tax assets and liabilities are measured using enacted tax rates that are expected to apply to taxable income in the year in which those temporary differences are expected to be recovered or settled. The effect on deferred tax assets and liabilities of a change in tax rates is recognized in income in the period that includes the enactment date. Deferred tax expense or benefit is the result of changes in deferred tax assets and liabilities. The Company evaluates the probability of realizing the future benefits of its deferred tax assets and provides a valuation allowance for the portion of any deferred tax assets where the likelihood of realizing an income tax benefit in the future does not meet the "more-likely-than-not" criteria for recognition. The Company recognizes tax benefits from uncertain tax positions only if it is more likely than not that the tax position will be sustained on examination by the taxing authorities, based on the technical merits of the position. The tax benefits recognized in the financial statements from such a position are measured based on the largest benefit that has a greater than fifty percent likelihood of being realized upon ultimate resolution. The Company recognizes interest and penalties related to unrecognized tax benefits in income taxes. Deferred taxes are not provided on the portion of undistributed earnings of subsidiaries outside of the United States when these earnings are considered permanently reinvested. At December 31, 2011, taxes had not been provided on $927 of accumulated undistributed earnings of subsidiaries that has been or is intended to be permanently reinvested.
Property and equipment
Property and equipment are recorded at cost. Maintenance, repairs, and renewals, which neither materially add to the value of the property nor appreciably prolong its life, are charged to expense as incurred. Depreciation is provided in amounts sufficient to relate the cost of depreciable assets to operations over the estimated useful lives of the related assets. The straight-line method of depreciation and amortization is followed for financial statement purposes. Leasehold improvements are amortized over the shorter of the life of the respective lease or the useful life of the improvements. Property and equipment are reviewed for impairment to determine whether events or changes in circumstances exist that indicate the carrying amount of an asset may not be recoverable. When property and equipment are retired or otherwise disposed of, the cost and accumulated depreciation are removed from the accounts and any resulting gain or loss is included in the results of operations for the respective period.
F-8
USANA HEALTH SCIENCES, INC. AND SUBSIDIARIES
NOTES TO CONSOLIDATED FINANCIAL STATEMENTS (Continued)
(in thousands, except per share data)
NOTE A—SUMMARY OF SIGNIFICANT ACCOUNTING POLICIES (Continued)
Goodwill
Goodwill represents the excess of the purchase price over the fair market value of identifiable net assets of acquired companies. Goodwill is not amortized, but rather is tested at least annually for impairment or more frequently if triggering events or changes in circumstances indicate impairment. During the third quarter ended October 1, 2011, the Company early adopted new guidance which simplifies the goodwill impairment test by allowing the option to first assess qualitative factors in order to determine whether it is more likely than not that the fair value of a reporting unit is less than its carrying amount. Some of these qualitative factors may include macroeconomic conditions, industry and market considerations, a change in financial performance, entity-specific events, a sustained decrease in share price, and consideration of the difference between the fair value and carrying amount of a reporting unit as determined in the most recent quantitative assessment. If, through this qualitative assessment, the conclusion is made that it is more likely than not that a reporting unit's fair value is less than its carrying amount, a two-step impairment analysis is performed to estimate the fair value of goodwill. The first step involves comparing the fair value of a reporting unit to its carrying amount. If the carrying amount of the reporting unit exceeds its fair value, the second step of the process involves comparing the implied fair value to the carrying amount of the goodwill of that reporting unit. If the carrying amount of the goodwill of a reporting unit exceeds the implied fair value of that goodwill, an impairment loss is recognized in an amount equal to that excess. Fair value of each reporting unit at December 31, 2011, and January 1, 2011 was greater than the carrying amount; therefore, no impairment was recorded.
Intangible Assets
Intangible assets represent definite-lived and indefinite-lived intangible assets acquired in connection with the purchase of the Company's China subsidiary in 2010. These intangible assets have been measured at the acquisition-date fair value using various methodologies applied within the income approach. Definite-lived intangible assets are amortized over their related useful lives. Indefinite-lived intangible assets are not amortized; however, they are tested at least annually for impairment or more frequently if events or changes in circumstances exist that may indicate impairment. The amount of any impairment is measured as the difference between the carrying amount and the fair value of the impaired asset. There have been no events or changes in circumstances that have occurred subsequent to the acquisition of the indefinite-lived assets that would indicate impairment.
Self insurance
The Company is self-insured, up to certain limits, for employee group health claims. The Company has purchased stop-loss insurance on both an individual and an aggregate basis, which will reimburse the Company for individual claims in excess of $100 and aggregate claims that are greater than 100% of projected claims. A liability is accrued and reflected in the Balance Sheet for all unpaid claims. Total expense under this self insurance program was $3,355, $3,391 and $4,274 in 2009, 2010 and 2011, respectively.
F-9
USANA HEALTH SCIENCES, INC. AND SUBSIDIARIES
NOTES TO CONSOLIDATED FINANCIAL STATEMENTS (Continued)
(in thousands, except per share data)
NOTE A—SUMMARY OF SIGNIFICANT ACCOUNTING POLICIES (Continued)
Common stock and additional paid-in capital
The Company records cash that it receives upon the exercise of equity awards by crediting common stock and additional paid-in capital. The Company received $131, $12,005 and $39 in cash proceeds from the exercise of equity awards in 2009, 2010, and 2011, respectively. The Company also realizes an income tax benefit from the exercise of certain equity awards. For equity awards earned prior to January 1, 2006, this tax benefit resulted in a decrease in current income taxes payable and an increase in additional paid-in capital. For equity awards earned after January 1, 2006, the tax benefits are recorded in accordance with ASC 718-740, "Compensation-Stock Compensation." Under ASC 718-740, the Company establishes deferred tax assets for the value of certain equity awards.
Upon exercise, the deferred tax assets are reversed and the difference between the deferred tax assets and the realized tax benefit creates a tax windfall or shortfall that increases or decreases the additional paid-in capital pool ("APIC Pool"). If the APIC Pool is reduced to zero, additional shortfalls are treated as a current tax expense. The total tax expense recorded in additional paid-in capital was $319, $152, and $317 in 2009, 2010, and 2011, respectively.
The Company has a stock repurchase plan in place that has been authorized by the Board of Directors. As of December 31, 2011, $28,246 was available to repurchase shares under this plan. The Company expended $1,654, $17,031, and $33,459 to repurchase and retire shares during 2009, 2010, and 2011, respectively. The excess of the repurchase price over par value is allocated between additional paid-in capital and retained earnings.
Revenue recognition and deferred revenue
The Company receives payment, primarily via credit card, for the sale of products at the time customers place orders. Sales and related fees such as shipping and handling, net of applicable sales discounts, are recorded as revenue when the product is delivered and when title and the risk of ownership passes to the customer. Payments received for undelivered products are recorded as deferred revenue and are included in other current liabilities. Certain incentives offered on the sale of our products, including sales discounts, are classified as a reduction of revenue. A provision for product returns and allowances is recorded and is founded on historical experience. Additionally, the Company collects an annual account renewal fee from Associates that is deferred on receipt and is recognized as income on a straight-line basis over the subsequent twelve-month period.
Taxes that have been assessed by governmental authorities and that are directly imposed on revenue-producing transactions between the Company and its customers, including sales, use, value-added, and some excise taxes, are presented on a net basis (excluded from net sales).
Product return policy
All products that are returned within the first 30 days following purchase is refunded at 100% of the sales price to retail customers and Preferred Customers. This 30-day return policy is offered to Associates only on their first order. All other returned product that is unused and resalable is refunded up to one year from the date of purchase at 100% of the sales price less a 10% restocking fee. According to the terms of the Associate agreement, return of product where the purchase amount exceeds one hundred dollars and was not damaged at the time of receipt by the Associate may result in
F-10
USANA HEALTH SCIENCES, INC. AND SUBSIDIARIES
NOTES TO CONSOLIDATED FINANCIAL STATEMENTS (Continued)
(in thousands, except per share data)
NOTE A—SUMMARY OF SIGNIFICANT ACCOUNTING POLICIES (Continued)
cancellation of the Associate's distributorship. Depending upon the conditions under which product was returned customers may either receive a refund based on their original form of payment, or credit on account for a product exchange.
This standard policy differs slightly in a few of our international markets due to the regulatory environment in those markets. Product returns totaled approximately 1.6% of net sales in 2009, and 1.1% of net sales during fiscal years 2010, and 2011, respectively.
Shipping and handling costs
The Company's shipping and handling costs are included in cost of sales for all periods presented.
Associate incentives
Associate incentives expenses include all forms of commissions, compensation, and other incentives paid to our Associates.
Selling, general and administrative
Selling, general and administrative expenses include wages and benefits, depreciation and amortization, rents and utilities, Associate event costs, advertising and professional fees, marketing, and research and development expenses.
Equity-based compensation
The Company records compensation expense in the financial statements for equity-based awards based on the grant date fair value and an estimate of forfeitures derived from historical experience. Equity-based compensation expense is recognized under the straight-line method over the period that service is provided, which is generally the vesting term. Further information regarding equity awards can be found in Note L—Equity-Based Compensation.
Advertising
Advertising costs are charged to expense as incurred. Advertising expense totaled $1,575 in 2009, $1,202 in 2010 and $3,893 in 2011.
Research and development
Research and development costs are charged to expense as incurred and are presented as part of selling, general and administrative expense. Research and development expense totaled $3,626 in 2009, $3,842 in 2010 and $4,071 in 2011.
Earnings per share
Basic earnings per common share (EPS) are based on the weighted-average number of common shares that were outstanding during each period. Diluted earnings per common share include the effect of potentially dilutive common shares, which include in-the-money, equity-based awards that have been granted but have not been exercised.
F-11
USANA HEALTH SCIENCES, INC. AND SUBSIDIARIES
NOTES TO CONSOLIDATED FINANCIAL STATEMENTS (Continued)
(in thousands, except per share data)
NOTE A—SUMMARY OF SIGNIFICANT ACCOUNTING POLICIES (Continued)
Revisions
Revisions relating to deferred taxes and intangible assets have been made to the Company's financial statements to reflect adjustments made to correct the presentation of deferred taxes on a gross rather than net basis, and to record the impact of currency translation on intangible assets acquired as part of the 2010 purchase of BabyCare Holdings Ltd. These adjustments revise amounts reported for periods prior to January 2, 2011 in the financial statements and related notes, for deferred taxes, goodwill, intangible assets and accumulated other comprehensive income in the Consolidated Balance Sheet, and the foreign currency translation adjustment component of comprehensive income in the Consolidated Statement of Stockholders' Equity. While the overall net deferred tax amount has not changed, certain deferred tax line items in the Consolidated Balance Sheet have been modified to reflect a gross presentation. Additionally, goodwill and intangible assets have been increased, along with a corresponding increase in accumulated other comprehensive income, to capture the changes on these assets related to foreign currency translation. The Company determined that these revisions were not material to its previously reported consolidated financial statements. These revisions had no effect on our earnings from operations, net earnings, or earnings per share.
The following tables illustrate the effects of the revision on the Company's consolidated financial statements for only those line items that were affected:
Consolidated Balance Sheet Items
(in thousands)
| |
As of January 1, 2011 | |||||||||
|---|---|---|---|---|---|---|---|---|---|---|
| |
As Previously Reported |
Adjustment | As Revised | |||||||
Prepaid expenses and other current assets, including |
||||||||||
current deferred tax assets |
$ | 21,972 | $ | 1,405 | $ | 23,377 | ||||
Total current assets |
80,272 | 1,405 | 81,677 | |||||||
Goodwill |
16,930 | 337 | 17,267 | |||||||
Intangible assets, net |
40,616 | 1,299 | 41,915 | |||||||
Deferred tax assets |
2,590 | 9,793 | 12,383 | |||||||
Other assets |
5,826 | — | 5,826 | |||||||
Total assets |
203,802 | 12,834 | 216,636 | |||||||
Other current liabilities |
51,179 | 1,405 | 52,584 | |||||||
Total current liabilities |
57,624 | 1,405 | 59,029 | |||||||
Long-term deferred tax liabilities |
— | 9,793 | 9,793 | |||||||
Accumulated other comprehensive income |
3,721 | 1,636 | 5,357 | |||||||
Total stockholders' equity |
145,166 | 1,636 | 146,802 | |||||||
Total liabilities and stockholders' equity |
203,802 | 12,834 | 216,636 | |||||||
F-12
USANA HEALTH SCIENCES, INC. AND SUBSIDIARIES
NOTES TO CONSOLIDATED FINANCIAL STATEMENTS (Continued)
(in thousands, except per share data)
NOTE A—SUMMARY OF SIGNIFICANT ACCOUNTING POLICIES (Continued)
Consolidated Statement of Stockholders' Equity and Comprehensive Income Items
(in thousands)
| |
Year ended January 1, 2011 | |||||||||
|---|---|---|---|---|---|---|---|---|---|---|
| |
As Previously Reported |
Adjustment | As Revised | |||||||
Accumulated other comprehensive income (loss), foreign currency translation adjustment |
$ | 2,198 | $ | 1,636 | $ | 3,834 | ||||
Accumulated other comprehensive income (loss), total comprehensive income |
47,849 | 1,636 | 49,485 | |||||||
Accumulated other comprehensive income (loss), balance at January 1, 2011 |
3,721 | 1,636 | 5,357 | |||||||
Total stockholders' equity at January 1, 2011 |
145,166 | 1,636 | 146,802 | |||||||
Recently adopted accounting pronouncements
In December 2010, the Financial Accounting Standards Board (FASB) issued Accounting Standards Update No. 2010-28, Intangibles—Goodwill and Other (Topic 350): When to Perform Step 2 of the Goodwill Impairment Test for Reporting Units with Zero or Negative Carrying Amounts (ASU 2010-28). ASU 2010-28 modifies Step 1 of the goodwill impairment test for reporting units with zero or negative carrying amounts. For those reporting units, an entity is required to perform Step 2 of the goodwill impairment test if it is more likely than not that a goodwill impairment exists. In determining whether it is more likely than not that a goodwill impairment exists, an entity should consider whether there are any adverse qualitative factors indicating that an impairment may exist. ASU 2010-28 is effective for fiscal years, and interim periods within those years, beginning after December 15, 2010. The Company adopted ASU 2010-28 during the first quarter ended April 2, 2011, and its application had no impact on the Company's consolidated financial statements.
In December 2010, the FASB issued Accounting Standards Update No. 2010-29, Business Combinations (Topic 805): Disclosure of Supplementary Pro Forma Information for Business Combinations (ASU 2010-29). ASU 2010-29 has been issued to address diversity in practice about the interpretation of the pro forma revenue and earnings disclosure requirements for business combinations. The amendments in this update specify that, if a public entity presents comparative financial statements, the entity should disclose revenue and earnings of the combined entity as though the business combinations(s) that occurred during the current year had occurred as of the beginning of the comparable prior annual reporting period only. The amendments also expand the supplemental pro forma disclosures under Topic 805 to include a description of the nature and amount of material, nonrecurring, pro forma adjustments directly attributable to the business combination included in the reported pro forma revenue and earnings. ASU 2010-29 is effective prospectively for business combinations for which the acquisition date is on or after the beginning of the first annual reporting period beginning on or after December 15, 2010. The Company adopted ASU 2010-29 during the first quarter ended April 2, 2011, and its application had no impact on the Company's consolidated financial statements.
F-13
USANA HEALTH SCIENCES, INC. AND SUBSIDIARIES
NOTES TO CONSOLIDATED FINANCIAL STATEMENTS (Continued)
(in thousands, except per share data)
NOTE A—SUMMARY OF SIGNIFICANT ACCOUNTING POLICIES (Continued)
In September 2011, the FASB issued Accounting Standards Update No. 2011-08, Intangibles—Goodwill and Other (Topic 350): Testing Goodwill for Impairment (ASU 2011-08). ASU 2011-08 simplifies how entities test goodwill for impairment. The amendments in this update permit an entity to first assess qualitative factors to determine whether it is more likely than not that the fair value of a reporting unit is less than its carrying amount as a basis for determining whether it is necessary to perform the two-step goodwill impairment test. An entity also has the option to bypass the qualitative assessment for any reporting unit in any period and proceed directly to performing the first step of the two-step goodwill impairment test. An entity may resume performing the qualitative assessment in any subsequent period. Additionally, an entity no longer is permitted to carry forward its detailed calculation of a reporting unit's fair value from a prior year as previously permitted by Topic 350. ASU 2011-08 is effective for annual and interim goodwill impairment tests performed for fiscal years beginning after December 15, 2011; however, early adoption is permitted. The Company adopted ASU 2011-08 during the third quarter ended October 1, 2011, and its application had no impact on the Company's consolidated financial statements.
Recently issued accounting pronouncements
In May 2011, the FASB issued Accounting Standards Update No. 2011-04, Fair Value Measurement (Topic 820): Amendments to Achieve Common Fair Value Measurement and Disclosure Requirements in U.S. GAAP and IFRSs (ASU 2011-04). ASU 2011-04 updates existing guidance in Topic 820 to establish common requirements for measuring fair value and for disclosing information about fair value measurements in accordance with U.S. Generally Accepted Accounting Principles (U.S. GAAP) and International Financial Reporting Standards (IFRS). ASU 2011-04 is effective prospectively for fiscal years, and interim periods, beginning after December 15, 2011. Early adoption is not permitted. The Company does not expect adoption of this standard to have a material impact on its consolidated financial statements.
In June 2011, the FASB issued Accounting Standards Update No. 2011-05, Comprehensive Income (Topic 220): Presentation of Comprehensive Income (ASU 2011-05). The objective of ASU 2011-05 is to improve the comparability, consistency, and transparency of financial reporting and to increase the prominence of items reported in other comprehensive income. To increase the prominence of items reported in other comprehensive income and to facilitate the convergence of U.S. GAAP and IFRS, ASU 2011-05 eliminates the option to present components of other comprehensive income as part of the statement of changes in stockholders' equity. Under the amendments in this update, an entity has the option to present the total of comprehensive income, the components of net income, and the components of other comprehensive income either in a single continuous statement of comprehensive income or in two separate but consecutive statements. Regardless of which option is chosen, items that are reclassified from other comprehensive income to net income must be presented on the face of the financial statements. These amendments do not change the items that must be reported in other comprehensive income or when an item of other comprehensive income must be reclassified to net income. Also, the amendments do not change the option for an entity to present components of other comprehensive income either net of related tax effects or before related tax effects, with one amount shown for the aggregate income tax expense or benefit related to the total of other comprehensive income items. ASU 2011-05 is effective for interim and annual periods beginning after December 15, 2011 and will be applied retrospectively. The FASB has deferred the requirement to present
F-14
USANA HEALTH SCIENCES, INC. AND SUBSIDIARIES
NOTES TO CONSOLIDATED FINANCIAL STATEMENTS (Continued)
(in thousands, except per share data)
NOTE A—SUMMARY OF SIGNIFICANT ACCOUNTING POLICIES (Continued)
reclassification adjustments for each component of accumulated other comprehensive income in both net income and other comprehensive income. Companies are required to either present amounts reclassified out of other comprehensive income on the face of the financial statements or disclose those amounts in the notes to the financial statements. During the deferral period, there is no requirement to separately present or disclose the reclassification adjustments into net income. The effective date of this deferral will be consistent with the effective date of ASU 2011-05. The Company does not expect adoption of this standard to have a material impact on its consolidated financial statements as it only affects financial statement presentation.
NOTE B—ACQUISITION
On August 16, 2010, the Company indirectly acquired 100% of BabyCare Ltd., a limited liability company incorporated under the laws of the PRC, for the purchase price of $62,716, which consisted of $45,000 cash paid and $17,716 common stock issued (400,000 shares of USANA common stock at $44.29).
BabyCare is a direct selling company in China that is principally engaged in developing, manufacturing and selling nutritional products for the entire family, with an emphasis on infant nutrition, through both a distributor sales force and a chain of retail centers. This acquisition was accomplished in the following simultaneous transactions. The Company acquired Pet Lane, Inc., a Delaware corporation ("Pet Lane"), which is the record owner of BabyCare in China, for a purchase price of $700. Simultaneously, the Company entered into and closed a share purchase agreement (the "Purchase Agreement") by and among the Company and the following parties: Pet Lane; Yaolan Ltd., an exempted company organized under the laws of the Cayman Islands ("Yaolan"); and BabyCare Holdings, Ltd., an exempted company organized under the laws of the Cayman Islands ("BabyCare Holdings"). Pursuant to the Purchase Agreement, the Company, through its acquisition entity Pet Lane, acquired all of the issued and outstanding shares of BabyCare Holdings (the "Shares") from Yaolan. Goodwill of $700 was recognized in connection with the acquisition of Pet Lane. BabyCare Holdings is the beneficial owner of BabyCare. As a result of its acquisition of Pet Lane and BabyCare Holdings, the Company, indirectly, has acquired both record and beneficial ownership of BabyCare.
The acquisition was accounted for as a business combination and, as such, the results of operations for BabyCare have been included in the consolidated financial statements since the effective date of acquisition. This acquisition contributed $7,384 in net sales and a net loss of $1,154 for the year ended January 1, 2011. Unaudited supplemental pro forma information had the acquisition occurred at the beginning of each period is as follows:
| |
2009 | 2010 | |||||
|---|---|---|---|---|---|---|---|
Net sales |
$ | 451,353 | $ | 527,266 | |||
Net earnings |
28,326 | 43,173 | |||||
F-15
USANA HEALTH SCIENCES, INC. AND SUBSIDIARIES
NOTES TO CONSOLIDATED FINANCIAL STATEMENTS (Continued)
(in thousands, except per share data)
NOTE B—ACQUISITION (Continued)
The assets acquired and liabilities assumed were recorded at estimated fair values as of the date of the acquisition. The purchase price allocation for BabyCare is as follows:
| |
August 16, 2010 |
|||
|---|---|---|---|---|
Assets Acquired and Liabilities Assumed |
||||
Cash and cash equivalents |
$ | 3,006 | ||
Inventories |
1,702 | |||
Prepaid expenses and other current assets |
4,663 | |||
Property and equipment |
1,517 | |||
Goodwill |
10,540 | |||
Intangible assets |
41,000 | |||
Other assets |
3,375 | |||
Accounts payable |
(2,552 | ) | ||
Other current liabilities |
(535 | ) | ||
|
$ | 62,716 | ||
Goodwill of $10,540 was recognized for the excess of consideration transferred over the acquisition-date fair value of net assets acquired. In accordance with accounting standards governing the subsequent measurement of goodwill, goodwill will not be amortized, but will be tested at least annually for impairment. The fair value of intangible assets acquired in the amount of $41,000 was derived using various methodologies applied within the income approach. For further information on intangible assets, see Note G to these consolidated financial statements. For tax purposes, $52,323 of goodwill and other intangible assets will be deducted over a period of 15 years in computing the Company's United States tax obligation. The anticipated benefits associated with the acquired goodwill and other intangibles include facilitating our expansion and growth in China. The most significant intangible asset is a direct selling license held by BabyCare from the Chinese government to engage in direct selling activities in the Municipality of Beijing. This direct selling license allows BabyCare to engage non-employee distributors to sell their products away from fixed retail locations.
The costs related to the acquisition of BabyCare totaled $1,992, which included; advisory, legal, accounting, valuation, and other professional fees. These costs were expensed as incurred in the periods in which services were received and recognized in the consolidated statements of earnings in Selling, General and Administrative expenses.
NOTE C—INVENTORIES
Inventories consist of the following:
| |
January 1, 2011 |
December 31, 2011 |
|||||
|---|---|---|---|---|---|---|---|
Raw materials |
$ | 9,372 | $ | 9,670 | |||
Work in progress |
5,791 | 6,917 | |||||
Finished goods |
18,915 | 20,381 | |||||
|
$ | 34,078 | $ | 36,968 | |||
F-16
USANA HEALTH SCIENCES, INC. AND SUBSIDIARIES
NOTES TO CONSOLIDATED FINANCIAL STATEMENTS (Continued)
(in thousands, except per share data)
NOTE D—PREPAID EXPENSES AND OTHER CURRENT ASSETS
Prepaid expenses and other current assets consist of the following:
| |
January 1, 2011 |
December 31, 2011 |
|||||
|---|---|---|---|---|---|---|---|
Prepaid insurance |
$ | 1,175 | $ | 1,350 | |||
Other prepaid expenses |
2,583 | 3,177 | |||||
Federal income taxes receivable |
3,108 | 2,680 | |||||
Miscellaneous receivables, net |
3,735 | 2,978 | |||||
Deferred commissions |
4,867 | 3,942 | |||||
Term deposits |
3,034 | — | |||||
Deferred tax assets |
3,116 | 3,320 | |||||
Other current assets |
1,759 | 1,291 | |||||
|
$ | 23,377 | $ | 18,738 | |||
NOTE E—INCOME TAXES
Income tax expense (benefit) included in income from net earnings consists of the following:
| |
Year ended | |||||||||
|---|---|---|---|---|---|---|---|---|---|---|
| |
2009 | 2010 | 2011 | |||||||
Current |
||||||||||
Federal |
$ | 15,116 | $ | 18,026 | $ | 22,383 | ||||
State |
1,091 | 1,502 | 1,913 | |||||||
Foreign |
1,800 | 2,956 | 4,442 | |||||||
|
18,007 | 22,484 | 28,738 | |||||||
Deferred |
||||||||||
Federal |
(326 | ) | 1,243 | 1,044 | ||||||
State |
(18 | ) | 113 | (71 | ) | |||||
Foreign |
(241 | ) | (627 | ) | (2,985 | ) | ||||
|
$ | 17,422 | $ | 23,213 | $ | 26,726 | ||||
The income tax provision, as reconciled to the tax computed at the federal statutory rate of 35% for 2009, 2010, and 2011, is as follows:
| |
Year ended | |||||||||
|---|---|---|---|---|---|---|---|---|---|---|
| |
2009 | 2010 | 2011 | |||||||
Federal income taxes at statutory rate |
$ | 17,842 | $ | 24,102 | $ | 27,117 | ||||
State income taxes, net of federal tax benefit |
1,032 | 1,192 | 1,373 | |||||||
Qualified production activities deduction |
(979 | ) | (1,320 | ) | (1,576 | ) | ||||
Research tax credit |
(438 | ) | (285 | ) | (161 | ) | ||||
Equity-based compensation—incentive stock options |
64 | (145 | ) | 38 | ||||||
All other, net |
(99 | ) | (331 | ) | (65 | ) | ||||
|
$ | 17,422 | $ | 23,213 | $ | 26,726 | ||||
F-17
USANA HEALTH SCIENCES, INC. AND SUBSIDIARIES
NOTES TO CONSOLIDATED FINANCIAL STATEMENTS (Continued)
(in thousands, except per share data)
NOTE E—INCOME TAXES (Continued)
The significant categories of deferred taxes are as follows:
| |
January 1, 2011 |
December 31, 2011 |
|||||
|---|---|---|---|---|---|---|---|
Deferred tax assets |
|||||||
Inventory differences |
$ | 2,287 | $ | 2,695 | |||
Accruals not currently deductible |
1,933 | 2,124 | |||||
Equity-based compensation |
5,740 | 7,558 | |||||
Intangible assets |
9,318 | 9,535 | |||||
Net operating losses |
2,626 | 2,654 | |||||
Other |
2,707 | 1,361 | |||||
Gross deferred tax assets |
24,611 | 25,927 | |||||
Valuation allowance |
(1,595 | ) | (1,784 | ) | |||
Net deferred tax assets |
23,016 | 24,143 | |||||
Deferred tax liabilities |
|||||||
Depreciation/amortization |
(1,611 | ) | (3,506 | ) | |||
Accumulated other comprehensive income |
(2,038 | ) | (3,378 | ) | |||
Prepaid expenses |
(2,204 | ) | (1,967 | ) | |||
Intangible assets |
(10,478 | ) | (10,659 | ) | |||
Other |
(2,384 | ) | (1,202 | ) | |||
Gross deferred tax liabilities |
(18,715 | ) | (20,712 | ) | |||
Net deferred taxes |
$ | 4,301 | $ | 3,431 | |||
At December 31, 2011, the Company had foreign operating loss carry forwards of approximately $10,616. If these operating losses are not used, they will expire between 2012 and 2015. A valuation allowance of approximately $7,136 has been placed on these foreign operating loss carry forwards. The valuation allowance is determined using a more likely than not realization criteria and is based upon all available positive and negative evidence, including future reversals of temporary differences. A future increase or decrease in the current valuation allowance is not expected to impact the income tax provision due to the Company's ability to fully utilize foreign tax credits associated with taxable income in these jurisdictions.
F-18
USANA HEALTH SCIENCES, INC. AND SUBSIDIARIES
NOTES TO CONSOLIDATED FINANCIAL STATEMENTS (Continued)
(in thousands, except per share data)
NOTE E—INCOME TAXES (Continued)
The Components of deferred taxes, net on a jurisdiction basis are as follows:
| |
January 1, 2011 |
December 31, 2011 |
|||||
|---|---|---|---|---|---|---|---|
Net current deferred tax assets |
$ | 3,116 | $ | 3,320 | |||
Net noncurrent deferred tax assets |
12,383 | 11,033 | |||||
Total net deferred tax assets |
15,499 | 14,353 | |||||
Net current deferred tax liabilities |
1,405 |
974 |
|||||
Net noncurrent deferred tax assets |
9,793 | 9,948 | |||||
Total net deferred tax liabilities |
11,198 | 10,922 | |||||
Net deferred taxes |
$ | 4,301 | $ | 3,431 | |||
The Company files income tax returns in the U.S. federal jurisdiction and in various states and foreign jurisdictions. With few exceptions, the Company is no longer subject to U.S. federal, state, local, or non-U.S. income tax examinations by tax authorities for years before 2007. A reconciliation of the beginning and ending amount of unrecognized tax benefits included in other long-term liabilities is as follows:
| |
2009 | 2010 | 2011 | |||||||
|---|---|---|---|---|---|---|---|---|---|---|
Beginning balance |
$ | 425 | $ | 545 | $ | 250 | ||||
Additions based on tax positions related to the current year |
111 | — | — | |||||||
Additions for tax positions of prior years |
144 | 9 | 7 | |||||||
Settlements |
— | — | — | |||||||
Lapse of statute |
(135 | ) | (304 | ) | (59 | ) | ||||
Ending balance |
$ | 545 | $ | 250 | $ | 198 | ||||
The Company anticipates that it is reasonably possible that unrecognized tax benefits, including interest and penalties, of up to $78 could be recognized within the next twelve months due to the lapse of the applicable statute of limitations. Recognition of these uncertain tax positions or any uncertain tax position that is included in the December 31, 2011 balance would result in an adjustment to the Company's effective tax rate.
The Company records interest and penalties accrued related to unrecognized tax benefits in income taxes. In 2011, the Company recognized $7 in interest and penalties, compared to $9 in 2010 and $3 in 2009. The Company has accrued $51 and $48 for the payment of interest and penalties at the end of 2010 and 2011, respectively.
F-19
USANA HEALTH SCIENCES, INC. AND SUBSIDIARIES
NOTES TO CONSOLIDATED FINANCIAL STATEMENTS (Continued)
(in thousands, except per share data)
NOTE F—PROPERTY AND EQUIPMENT
Cost of property and equipment and their estimated useful lives is as follows:
| |
Years | January 1, 2011 |
December 31, 2011 |
||||||
|---|---|---|---|---|---|---|---|---|---|
Buildings |
40 | $ | 38,732 | $ | 40,173 | ||||
Laboratory and production equipment |
5 - 7 | 17,723 | 21,083 | ||||||
Sound and video library |
5 | 600 | 600 | ||||||
Computer equipment and software |
3 - 5 | 27,788 | 30,621 | ||||||
Furniture and fixtures |
3 - 5 | 4,953 | 5,117 | ||||||
Automobiles |
3 - 5 | 290 | 294 | ||||||
Leasehold improvements |
3 - 5 | 5,404 | 5,723 | ||||||
Land improvements |
15 | 2,051 | 2,051 | ||||||
|
97,541 | 105,662 | |||||||
Less accumulated depreciation and amortization |
48,298 |
54,437 |
|||||||
|
49,243 | 51,225 | |||||||
Land |
8,107 |
8,109 |
|||||||
Deposits and projects in process |
218 |
1,420 |
|||||||
|
$ | 57,568 | $ | 60,754 | |||||
Depreciation of property and equipment for the years ended 2009, 2010, and 2011 was $7,043, $7,510, and $7,431, respectively
NOTE G—INTANGIBLE ASSETS
Goodwill and intangible assets are tested annually for impairment, or more frequently if impairment indicators are present. Such indicators of impairment include, but are not limited to, changes in business climate, and operating or cash flow losses related to such assets. Goodwill and indefinite lived intangible assets are not amortized. Definite lived intangibles are amortized over their related useful lives.
No events have occurred subsequent to any of our acquisitions that have resulted in an impairment of the original goodwill or intangible asset amounts that were initially recorded from the transactions. Goodwill is as follows:
| |
January 1, 2011 |
Currency translation adjustments |
December 31, 2011 |
|||||||
|---|---|---|---|---|---|---|---|---|---|---|
North America |
$ | 6,390 | $ | — | $ | 6,390 | ||||
Asia Pacific |
10,877 | 473 | 11,350 | |||||||
|
$ | 17,267 | $ | 473 | $ | 17,740 | ||||
F-20
USANA HEALTH SCIENCES, INC. AND SUBSIDIARIES
NOTES TO CONSOLIDATED FINANCIAL STATEMENTS (Continued)
(in thousands, except per share data)
NOTE G—INTANGIBLE ASSETS (Continued)
Intangible assets are as follows:
| |
As of January 1, 2011 | |
|||||||||||
|---|---|---|---|---|---|---|---|---|---|---|---|---|---|
| |
Gross carrying amount |
Accumulated amortization |
Net carrying amount |
Weighted-average amortization period (years) |
|||||||||
Amortized intangible assets |
|||||||||||||
Trade name and trademarks |
$ | 4,025 | $ | (151 | ) | $ | 3,874 | 10 | |||||
Customer relationships |
1,961 | (245 | ) | 1,716 | 3 | ||||||||
|
5,986 | (396 | ) | 5,590 | |||||||||
Unamortized intangible assets |
|||||||||||||
Product formulas |
8,875 | 8,875 | |||||||||||
Direct sales license |
27,450 | 27,450 | |||||||||||
|
36,325 | 36,325 | |||||||||||
|
$ | 42,311 | $ | 41,915 | |||||||||
| |
As of December 31, 2011 | |
|||||||||||
|---|---|---|---|---|---|---|---|---|---|---|---|---|---|
| |
Gross carrying amount |
Accumulated amortization |
Net carrying amount |
Weighted-average amortization period (years) |
|||||||||
Amortized intangible assets |
|||||||||||||
Trade name and trademarks |
$ | 4,200 | $ | (577 | ) | $ | 3,623 | 10 | |||||
Customer relationships |
2,046 | (938 | ) | 1,108 | 3 | ||||||||
|
6,246 | (1,515 | ) | 4,731 | |||||||||
Unamortized intangible assets |
|||||||||||||
Product formulas |
9,261 | 9,261 | |||||||||||
Direct sales license |
28,645 | 28,645 | |||||||||||
|
37,906 | 37,906 | |||||||||||
|
$ | 44,152 | $ | 42,637 | |||||||||
Aggregate amortization expense: |
|||||||||||||
Year ended December 31, 2011 |
$ | 1,515 | |||||||||||
Estimated Amortization Expense: |
|||||||||||||
2012 |
$ | 1,102 | |||||||||||
2013 |
846 | ||||||||||||
2014 |
420 | ||||||||||||
2015 |
420 | ||||||||||||
2016 |
420 | ||||||||||||
Thereafter |
1,523 | ||||||||||||
|
$ | 4,731 | |||||||||||
F-21
USANA HEALTH SCIENCES, INC. AND SUBSIDIARIES
NOTES TO CONSOLIDATED FINANCIAL STATEMENTS (Continued)
(in thousands, except per share data)
NOTE H—OTHER CURRENT LIABILITIES
Other current liabilities consist of the following:
| |
January 1, 2011 |
December 31, 2011 |
|||||
|---|---|---|---|---|---|---|---|
Associate incentives |
$ | 11,379 | $ | 12,423 | |||
Accrued employee compensation |
14,395 | 12,210 | |||||
Income taxes |
1,571 | 4,112 | |||||
Sales taxes |
4,671 | 4,291 | |||||
Deferred tax liabilities |
1,405 | 974 | |||||
Associate promotions |
1,491 | 1,035 | |||||
Deferred revenue |
11,772 | 10,065 | |||||
Provision for returns and allowances |
929 | 1,014 | |||||
All other |
4,971 | 5,620 | |||||
|
$ | 52,584 | $ | 51,744 | |||
NOTE I—LONG-TERM DEBT AND LINE OF CREDIT
The Company has a $60,000 line of credit with Bank of America. Interest is computed at the bank's Prime Rate or LIBOR, adjusted by features specified in the Credit Agreement. The collateral for this line of credit is the pledge of the capital stock of certain subsidiaries of the Company, set forth in a separate pledge agreement with the bank. The Credit Agreement contains restrictive covenants based on adjusted EBITDA and a debt coverage ratio.
At December 31, 2011, there was no outstanding debt on this line of credit. The Company will be required to pay any balance on this line of credit in full at the time of maturity in April 2016 unless the line of credit is replaced or terms are renegotiated.
NOTE J—COMMITMENTS AND CONTINGENCIES
1. Operating leases
With the exception of the Company's headquarters, Australian facility, and Tianjin facility, facilities are generally leased. Each of the facility lease agreements is a non-cancelable operating lease generally structured with renewal options and expires prior to or during 2019. The Company utilizes equipment under non-cancelable operating leases, expiring through 2016. The minimum rental commitments under operating leases at December 31, 2011 are as follows:
Year ending |
||||
2012 |
$ | 5,375 | ||
2013 |
3,541 | |||
2014 |
1,649 | |||
2015 |
285 | |||
2016 |
212 | |||
Thereafter |
475 | |||
|
$ | 11,537 | ||
F-22
USANA HEALTH SCIENCES, INC. AND SUBSIDIARIES
NOTES TO CONSOLIDATED FINANCIAL STATEMENTS (Continued)
(in thousands, except per share data)
NOTE J—COMMITMENTS AND CONTINGENCIES (Continued)
These leases generally provide that property taxes, insurance, and maintenance expenses are the responsibility of the Company. Such expenses are not included in the operating lease amounts outlined in the table above or in the rent expense amounts that follow. The total rent expense for the years ended 2009, 2010, and 2011 was approximately $4,109, $4,442, and $6,410 respectively.
2. Contingencies
The Company is occasionally involved in various lawsuits and disputes arising in the normal course of business. In the opinion of management, based upon advice of counsel, the likelihood of an adverse outcome against the Company is remote. As such, management believes that the ultimate outcome of these lawsuits will not have a material impact on the Company's financial position or results of operations.
3. Employee Benefit Plan
The Company sponsors an employee benefit plan under Section 401(k) of the Internal Revenue Code. This plan covers employees who are at least 18 years of age and have met a one-month service requirement. The Company makes a matching contribution equal to 100 percent of the first one percent of a participant's compensation that is contributed by the participant, and 50 percent of that deferral that exceeds one percent of the participant's compensation, not to exceed six percent of the participant's compensation, subject to the limits of ERISA. In addition, the Company may make a discretionary contribution based on earnings. The Company's matching contributions cliff vest at two years of service. Contributions made by the Company to the plan in the United States for the years ended 2009, 2010, and 2011 were $879, $900, and $979, respectively. The 401(k) match balances for 2009, 2010, and 2011 were decreased by $0, $30, and $25, respectively, due to the application of prior year forfeitures of the unvested balances of terminated employees.
NOTE K—COMPREHENSIVE INCOME
Total comprehensive income, net of tax consisted of the following:
| |
Year Ended | |||||||||
|---|---|---|---|---|---|---|---|---|---|---|
| |
2009 | 2010 | 2011 | |||||||
Net earnings |
$ | 33,556 | $ | 45,651 | $ | 50,752 | ||||
Foreign currency translation adjustment |
1,898 | 3,834 | 482 | |||||||
Comprehensive income |
$ | 35,454 | $ | 49,485 | $ | 51,234 | ||||
NOTE L—EQUITY-BASED COMPENSATION
Equity-based compensation expense for fiscal years 2009, 2010, and 2011 was $8,925, $10,406, and $10,549, respectively. The related tax benefit for these periods was $3,255, $3,992, and $3,852, respectively.
F-23
USANA HEALTH SCIENCES, INC. AND SUBSIDIARIES
NOTES TO CONSOLIDATED FINANCIAL STATEMENTS (Continued)
(in thousands, except per share data)
NOTE L—EQUITY-BASED COMPENSATION (Continued)
The following table shows the remaining unrecognized compensation expense on a pre-tax basis for all types of unvested equity awards outstanding as of December 31, 2011. This table does not include an estimate for future grants that may be issued.
2012 |
$ | 10,225 | ||
2013 |
6,648 | |||
2014 |
4,679 | |||
2015 |
2,630 | |||
2016 |
559 | |||
|
$ | 24,741 | ||
The cost above is expected to be recognized over a weighted-average period of 2.1 years.
The Company's 2006 Equity Incentive Award Plan (the "2006 Plan") is currently the only plan under which equity awards are issued. This plan allows for the grant of various equity awards, including stock-settled stock appreciation rights, stock options, deferred stock units, and other types of equity-based awards, to the Company's officers, key employees, and non-employee directors.
During the year ended December 31, 2011, the Company's shareholders approved a 5,000 share increase in the number of new shares authorized for issuance under the 2006 Plan. This increase brings the total shares authorized under the 2006 Plan to 10,000. As of December 31, 2011, a total of 5,442 awards had been granted under the 2006 Plan, of which 5,320 were stock-settled stock appreciation rights, 8 were stock options, and 114 were deferred stock units. Also, as of December 31, 2011, a total of 836 awards had been canceled and added back to the number of units available for issuance under the 2006 Plan.
The Company's Compensation Committee has initially determined that awards to be granted to officers and key employees under the 2006 Plan will generally vest 20% each year on the anniversary of the grant date and expire five to five and one-half years from the date of grant. Awards of stock options and stock-settled stock appreciation rights to be granted to non-employee directors will generally vest 25% each quarter, commencing on the last day of the fiscal quarter in which the awards are granted, and will expire five years to five and one-half years from the date of grant. Awards of deferred stock units are full-value shares at the date of grant, vesting over the periods of service, and do not have expiration dates.
The Company uses the Black-Scholes option pricing model to estimate the fair value of its equity awards. The weighted-average fair value of stock-settled stock appreciation rights that were granted in 2009, 2010, and 2011, was $10.30, $17.09, and $12.40, respectively. Following is a table that includes the weighted-average assumptions that the Company used to calculate fair value of equity awards that were
F-24
USANA HEALTH SCIENCES, INC. AND SUBSIDIARIES
NOTES TO CONSOLIDATED FINANCIAL STATEMENTS (Continued)
(in thousands, except per share data)
NOTE L—EQUITY-BASED COMPENSATION (Continued)
granted during the periods indicated. Deferred stock units are full-value shares at the date of grant and have been excluded from the table below.
| |
Year Ended | |||||||||
|---|---|---|---|---|---|---|---|---|---|---|
| |
2009 | 2010 | 2011 | |||||||
Expected volatility(1) |
43.5 | % | 54.9 | % | 56.0 | % | ||||
Risk-free interest rate(2) |
1.8 | % | 1.7 | % | 1.1 | % | ||||
Expected life(3) |
4.0 yrs. | 4.2 yrs. | 3.9 yrs. | |||||||
Expected dividend yield(4) |
0.0 | % | 0.0 | % | 0.0 | % | ||||
Weighted-average grant price(5) |
$ | 28.09 | $ | 38.28 | $ | 28.89 | ||||
- (1)
- Expected
volatility is a weighted-average of historical volatility and implied volatility of the Company.
- (2)
- Risk-free
interest rate is based on the U.S. Treasury yield curve with respect to the expected life of the award.
- (3)
- Expected
life is a weighted-average that includes historical settlement data of the Company's equity awards and a hypothetical holding period for
outstanding awards.
- (4)
- The
Company historically has not paid dividends.
- (5)
- Grant price is the closing price of the Company's common stock on the date of grant.
A summary of the Company's stock option and stock-settled stock appreciation right activity is as follows:
| |
Shares | Weighted- average grant price |
Weighted-average remaining contractual term |
Aggregate intrinsic value* |
|||||||||
|---|---|---|---|---|---|---|---|---|---|---|---|---|---|
Outstanding at January 1, 2011 |
4,047 | $ | 32.46 | 3.5 | $ | 45,263 | |||||||
Granted |
495 | 28.89 | |||||||||||
Exercised |
(102 | ) | 27.52 | ||||||||||
Canceled |
(507 | ) | 31.05 | ||||||||||
Expired |
(125 | ) | 38.55 | ||||||||||
Outstanding at December 31, 2011 |
3,808 | $ | 32.12 | 2.9 | $ | 8,603 | |||||||
Exercisable at December 31, 2011 |
1,514 | $ | 32.70 | 2.4 | $ | 3,575 | |||||||
- *
- Aggregate intrinsic value is defined as the difference between the current market value at the reporting date (the closing price of the Company's common stock on the last trading day of the period) and the exercise price of awards that were in-the-money. The closing price of the Company's common stock at January 1, 2011 and December 31, 2011, was $43.45 and $30.37, respectively.
F-25
USANA HEALTH SCIENCES, INC. AND SUBSIDIARIES
NOTES TO CONSOLIDATED FINANCIAL STATEMENTS (Continued)
(in thousands, except per share data)
NOTE L—EQUITY-BASED COMPENSATION (Continued)
The total intrinsic value of stock options and stock-settled stock appreciation rights exercised was $222 in 2009, $16,977 in 2010, and $925 in 2011.
A summary of the Company's deferred stock unit activity for is as follows:
| |
Shares | Weighted- average fair value |
|||||
|---|---|---|---|---|---|---|---|
Nonvested at January 1, 2011 |
100 | $ | 44.29 | ||||
Granted |
— | — | |||||
Vested |
(49 | ) | 44.29 | ||||
Canceled |
(2 | ) | 44.29 | ||||
Expired |
— | — | |||||
Nonvested at December 31, 2011 |
49 | $ | 44.29 | ||||
The total fair value of equity awards that vested during fiscal years 2009, 2010, and 2011 was $10,386, $7,835, and $10,993, respectively. This total fair value includes equity-based awards issued in the form of stock options, stock-settled stock appreciation rights, and deferred stock units.
NOTE M—SEGMENT INFORMATION
USANA operates in a single operating segment as a direct selling company that develops, manufactures, and distributes high-quality nutritional and personal care products that are sold through a global network marketing system of independent distributors ("Associates"). As such, management has determined that the Company operates in one reportable business segment. Performance for a region or market is primarily evaluated based on sales. The Company does not use profitability reports on a regional or market basis for making business decisions. No single Associate accounted for 10% or more of net sales for the periods presented. The table below summarizes the approximate percentage of total product revenue that has been contributed by the Company's nutritional and personal care products for the periods indicated.
| |
Year Ended | |||||||||
|---|---|---|---|---|---|---|---|---|---|---|
| |
2009 | 2010 | 2011 | |||||||
USANA® Nutritionals |
76 | % | 77 | % | 79 | % | ||||
USANA Foods |
12 | % | 12 | % | 11 | % | ||||
Sensé—beautiful science® |
9 | % | 8 | % | 7 | % | ||||
Selected financial information for the Company is presented for two geographic regions: North America and Asia Pacific, with three sub-regions under Asia Pacific. Individual markets are categorized into these regions as follows:
- •
- North America—
- •
- United States (including direct sales from the United States to the United Kingdom and the Netherlands)
- •
- Canada
- •
- Mexico
F-26
USANA HEALTH SCIENCES, INC. AND SUBSIDIARIES
NOTES TO CONSOLIDATED FINANCIAL STATEMENTS (Continued)
(in thousands, except per share data)
NOTE M—SEGMENT INFORMATION (Continued)
- •
- Asia Pacific—
- •
- Southeast Asia/Pacific—Australia, New Zealand, Singapore, Malaysia, and the Philippines
- •
- Greater China—Hong Kong, Taiwan and China*
- •
- North Asia—Japan and South Korea
Selected Financial Information
Financial information, presented by geographic region for the years ended January 2, 2010, January 1, 2011, and December 31, 2011 is listed below:
| |
2009 | 2010 | 2011 | |||||||
|---|---|---|---|---|---|---|---|---|---|---|
Net Sales to External Customers |
||||||||||
North America |
||||||||||
United States |
$ | 151,663 | $ | 150,893 | $ | 148,061 | ||||
Canada |
65,682 | 69,411 | 67,024 | |||||||
Mexico |
22,384 | 21,843 | 21,301 | |||||||
North America Total |
239,729 | 242,147 | 236,386 | |||||||
Asia Pacific |
||||||||||
Southeast Asia/Pacific |
95,185 | 99,311 | 111,447 | |||||||
Greater China |
81,455 | 152,280 | 204,822 | |||||||
North Asia |
20,571 | 23,906 | 29,284 | |||||||
Asia Pacific Total |
197,211 | 275,497 | 345,553 | |||||||
Consolidated Total |
$ | 436,940 | $ | 517,644 | $ | 581,939 | ||||
- *
- The Company's business in China is that of BabyCare, its wholly-owned subsidiary.
F-27
USANA HEALTH SCIENCES, INC. AND SUBSIDIARIES
NOTES TO CONSOLIDATED FINANCIAL STATEMENTS (Continued)
(in thousands, except per share data)
NOTE M—SEGMENT INFORMATION (Continued)
| |
January 1, 2011 |
December 31, 2011 |
|||||
|---|---|---|---|---|---|---|---|
Long-lived Assets |
|||||||
North America |
|||||||
United States |
$ | 44,017 | $ | 46,991 | |||
Canada |
359 | 276 | |||||
Mexico |
229 | 126 | |||||
North America Total |
44,605 | 47,393 | |||||
Asia Pacific |
|||||||
Southeast Asia/Pacific |
16,644 | 16,401 | |||||
Greater China |
59,454 | 61,628 | |||||
North Asia |
1,640 | 1,981 | |||||
Asia Pacific Total |
77,738 | 80,010 | |||||
Consolidated Total |
$ | 122,343 | $ | 127,403 | |||
Total Assets |
|||||||
North America |
|||||||
United States |
$ | 85,028 | $ | 111,242 | |||
Canada |
4,154 | 3,029 | |||||
Mexico |
3,254 | 2,573 | |||||
North America Total |
92,436 | 116,844 | |||||
Asia Pacific |
|||||||
Southeast Asia/Pacific |
28,112 | 26,800 | |||||
Greater China |
88,801 | 93,989 | |||||
North Asia |
7,287 | 6,863 | |||||
Asia Pacific Total |
124,200 | 127,652 | |||||
Consolidated Total |
$ | 216,636 | $ | 244,496 | |||
The following table provides further information on markets representing ten percent or more of consolidated net sales and long-lived assets, respectively:
| |
2009 | 2010 | 2011 | |||||||
|---|---|---|---|---|---|---|---|---|---|---|
Net sales: |
||||||||||
United States |
$ | 151,663 | $ | 150,893 | $ | 148,061 | ||||
Canada |
65,682 | 69,411 | 67,024 | |||||||
Hong Kong |
59,956 | 121,435 | 156,672 | |||||||
Long-lived Assets: |
||||||||||
United States |
$ | 44,017 | $ | 46,991 | ||||||
China |
57,818 | 59,806 | ||||||||
Australia |
15,779 | 15,280 | ||||||||
F-28
USANA HEALTH SCIENCES, INC. AND SUBSIDIARIES
NOTES TO CONSOLIDATED FINANCIAL STATEMENTS (Continued)
(in thousands, except per share data)
NOTE N—QUARTERLY FINANCIAL RESULTS (Unaudited)
The following table summarizes quarterly financial information for fiscal years 2010 and 2011.
2010
|
First | Second | Third | Fourth | |||||||||
|---|---|---|---|---|---|---|---|---|---|---|---|---|---|
Net sales |
$ | 119,087 | $ | 126,011 | $ | 135,006 | $ | 137,540 | |||||
Gross profit |
$ | 96,067 | $ | 103,276 | $ | 109,849 | $ | 112,970 | |||||
Net earnings |
$ | 9,641 | $ | 10,770 | $ | 12,849 | $ | 12,391 | |||||
Earnings per share: |
|||||||||||||
Basic |
$ | 0.63 | $ | 0.70 | $ | 0.83 | $ | 0.78 | |||||
Diluted |
$ | 0.62 | $ | 0.69 | $ | 0.79 | $ | 0.75 | |||||
2011
|
First | Second | Third | Fourth | |||||||||
|---|---|---|---|---|---|---|---|---|---|---|---|---|---|
Net sales |
$ | 143,566 | $ | 148,925 | $ | 143,501 | $ | 145,947 | |||||
Gross profit |
$ | 117,904 | $ | 122,717 | $ | 118,299 | $ | 121,327 | |||||
Net earnings |
$ | 11,350 | $ | 13,856 | $ | 12,385 | $ | 13,161 | |||||
Earnings per share: |
|||||||||||||
Basic |
$ | 0.71 | $ | 0.89 | $ | 0.82 | $ | 0.88 | |||||
Diluted |
$ | 0.70 | $ | 0.88 | $ | 0.81 | $ | 0.87 | |||||
NOTE O—EARNINGS PER SHARE
Basic earnings per share are based on the weighted-average number of shares outstanding for each period. Shares that have been repurchased and retired during the periods specified below have been included in the calculation of the number of weighted-average shares that are outstanding for the calculation of basic earnings per share. Diluted earnings per common share are based on shares that are outstanding (computed under basic EPS) and on potentially dilutive shares. Shares that are
F-29
USANA HEALTH SCIENCES, INC. AND SUBSIDIARIES
NOTES TO CONSOLIDATED FINANCIAL STATEMENTS (Continued)
(in thousands, except per share data)
NOTE O—EARNINGS PER SHARE (Continued)
included in the diluted earnings per share calculations under the treasury stock method include equity awards that are in-the-money but have not yet been exercised.
| |
Year ended | |||||||||
|---|---|---|---|---|---|---|---|---|---|---|
| |
2009 | 2010 | 2011 | |||||||
Net earnings available to common shareholders |
$ | 33,556 | $ | 45,651 | $ | 50,752 | ||||
Basic EPS |
||||||||||
Shares |
||||||||||
Common shares outstanding entire period |
15,350 | 15,309 | 15,985 | |||||||
Weighted average common shares: |
||||||||||
Issued during period |
4 | 311 | 32 | |||||||
Canceled during period |
(14 | ) | (92 | ) | (656 | ) | ||||
Weighted average common shares outstanding during period |
15,340 | 15,528 | 15,361 | |||||||
Earnings per common share from net earnings—basic |
$ | 2.19 | $ | 2.94 | $ | 3.30 | ||||
Diluted EPS |
||||||||||
Shares |
||||||||||
Weighted average common shares outstanding during period—basic |
15,340 | 15,528 | 15,361 | |||||||
Dilutive effect of in-the-money equity awards |
92 | 414 | 213 | |||||||
Weighted average common shares outstanding during period—diluted |
15,432 | 15,942 | 15,574 | |||||||
Earnings per common share from net earnings—diluted |
$ | 2.17 | $ | 2.86 | $ | 3.26 | ||||
Equity awards for 1,541 shares, 1,289 shares, and 1,546 shares of stock were not included in the computation of EPS for the years ended 2009, 2010, and 2011, respectively, due to their exercise prices being greater than the average market price of the shares.
During the years ended January 2, 2010, January 1, 2011, and December 31, 2011, the Company expended $1,654, $17,031, and $33,459 to purchase 54 shares, 387 shares, and 1,120 shares, respectively, under the Company's share repurchase plan. The purchase of shares under this plan reduces the number of shares outstanding in the above calculations.
NOTE P—RELATED-PARTY TRANSACTIONS
The Company's Founder and Chairman of the Board, Myron W. Wentz, PhD is the sole beneficial owner of the largest shareholder of the Company, Gull Holdings, Ltd. As of December 31, 2011, Gull Holdings, Ltd. owned 50.1% of the Company's issued and outstanding shares. Dr. Wentz devotes much of his personal time, expertise, and resources to a number of business and professional activities outside of USANA. The most significant of these is the Sanoviv Medical Institute, which is a unique, fully integrated health and wellness center located near Rosarito, Mexico that Dr. Wentz founded in 1998. Dr. Wentz's private entity, Sanoviv S.A. de C.V. ("Sanoviv"), contracts with Medicis, S.C. ("Medicis"), an entity that is owned and operated independently of Dr. Wentz, to conduct the operations of the Sanoviv Medical Institute. Sanoviv leases the medical building to Medicis and Medicis carries out all of the operations of
F-30
USANA HEALTH SCIENCES, INC. AND SUBSIDIARIES
NOTES TO CONSOLIDATED FINANCIAL STATEMENTS (Continued)
(in thousands, except per share data)
NOTE P—RELATED-PARTY TRANSACTIONS (Continued)
the medical institute, which include employing all of the medical and healthcare professionals who provide services at the medical institute. The Medicis medical and healthcare professionals possess expertise in the fields of human health, digestive health, nutritional medicine, lifestyle medicine and other medical fields that are important to USANA.
In 2011, Medicis performed a variety of contract research services on behalf of USANA, which included (i) short-and long-term clinical testing of nutritional products and dietary ingredients, (ii) research and development of novel product formulations for future development and production by USANA; and (iii) research and development of improvements in existing USANA product formulations. In addition to providing contract research services, Medicis provided physicians and other medical staff to speak at USANA Associate events during 2011. Finally, in 2011, Medicis performed heath assessments and physical examinations for the Company's Executives. In consideration for these services, USANA paid Medicis approximately $22 in 2009, $500 in 2010, and $360 in 2011. The Company's agreements with Medicis were approved by the Audit Committee in advance of the Company's entry into the agreements. USANA's collaboration with Medicis is terminable at will by USANA at anytime, without any continuing commitment by USANA.
F-31
USANA HEALTH SCIENCES, INC. AND SUBSIDIARIES
SCHEDULE II—VALUATION AND QUALIFYING ACCOUNTS
(in thousands)
Description
|
Balance at beginning of period |
Charged to costs and expenses |
Charged to other accounts |
Deductions | Balance at end of period |
|||||||||||
|---|---|---|---|---|---|---|---|---|---|---|---|---|---|---|---|---|
January 2, 2010 |
||||||||||||||||
Deducted from related asset account: |
||||||||||||||||
Allowance for sales returns |
1,101 | 66 | — | 52 | 1,115 | |||||||||||
Allowance for doubtful accounts |
1,698 | 236 | — | 4 | 1,930 | |||||||||||
Valuation allowance—deferred tax assets |
— | — | — | — | — | |||||||||||
January 1, 2011 |
||||||||||||||||
Deducted from related asset account: |
||||||||||||||||
Allowance for sales returns |
1,115 | 94 | — | 280 | 929 | |||||||||||
Allowance for doubtful accounts |
1,930 | 121 | — | 278 | 1,773 | |||||||||||
Valuation allowance—deferred tax assets |
— | 1,595 | — | — | 1,595 | |||||||||||
December 31, 2011 |
||||||||||||||||
Deducted from related asset account: |
||||||||||||||||
Allowance for sales returns |
929 | 149 | — | 64 | 1,014 | |||||||||||
Allowance for doubtful accounts |
1,773 | 48 | — | 241 | 1,580 | |||||||||||
Valuation allowance—deferred tax assets |
1,595 | 189 | — | — | 1,784 | |||||||||||