Attached files
| file | filename |
|---|---|
| 8-K - FORM 8-K - PENSON WORLDWIDE INC | d316101d8k.htm |
| EX-99.1 - COPY OF PRESENTATION - PENSON WORLDWIDE INC | d316101dex991.htm |
Exhibit 99.2
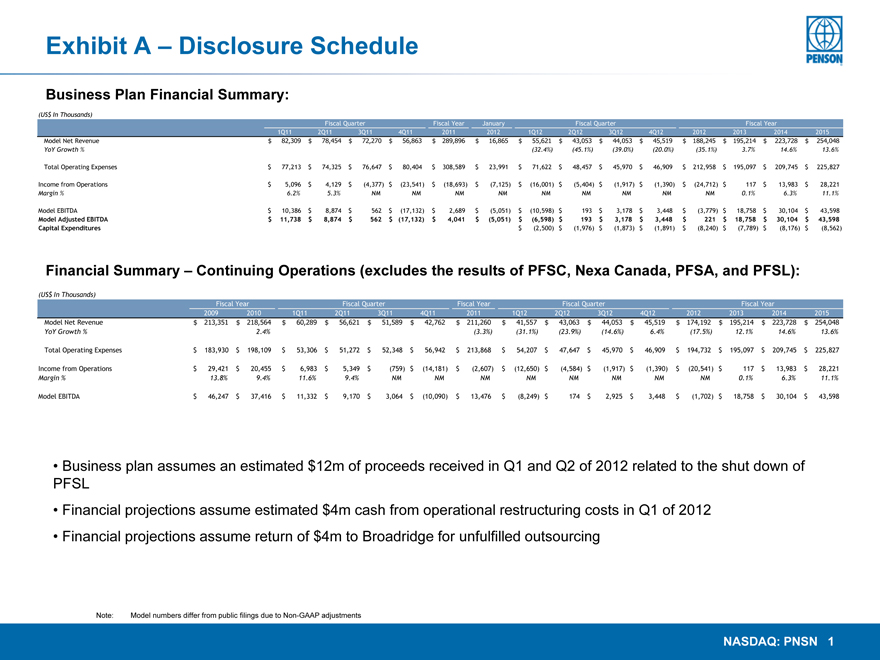
Exhibit A – Disclosure Schedule
Business Plan Financial Summary:
(US$ In Thousands)
Fiscal Quarter Fiscal Year January Fiscal Quarter Fiscal Year
1Q11 2Q11 3Q11 4Q11 2011 2012 1Q12 2Q12 3Q12 4Q12 2012 2013 2014 2015
Model Net Revenue $ 82,309 $ 78,454 $ 72,270 $ 56,863 $ 289,896 $ 16,865 $ 55,621 $ 43,053 $ 44,053 $ 45,519 $ 188,245 $ 195,214 $ 223,728 $ 254,048
YoY Growth %(32.4%)(45.1%)(39.0%)(20.0%)(35.1%) 3.7% 14.6% 13.6%
Total Operating Expenses $ 77,213 $ 74,325 $ 76,647 $ 80,404 $ 308,589 $ 23,991 $ 71,622 $ 48,457 $ 45,970 $ 46,909 $ 212,958 $ 195,097 $ 209,745 $ 225,827
Income from Operations $ 5,096 $ 4,129 $(4,377) $(23,541) $(18,693) $(7,125) $(16,001) $(5,404) $(1,917) $(1,390) $(24,712) $ 117 $ 13,983 $ 28,221
Margin % 6.2% 5.3% NM NM NM NM NM NM NM NM NM 0.1% 6.3% 11.1%
Model EBITDA $ 10,386 $ 8,874 $ 562 $(17,132) $ 2,689 $(5,051) $(10,598) $ 193 $ 3,178 $ 3,448 $(3,779) $ 18,758 $ 30,104 $ 43,598
Model Adjusted EBITDA $ 11,738 $ 8,874 $ 562 $ (17,132) $ 4,041 $(5,051) $(6,598) $ 193 $ 3,178 $ 3,448 $ 221 $ 18,758 $ 30,104 $ 43,598
Capital Expenditures $(2,500) $(1,976) $(1,873) $(1,891) $(8,240) $(7,789) $(8,176) $(8,562)
Financial Summary – Continuing Operations (excludes the results of PFSC, Nexa Canada, PFSA, and PFSL):
(US$ In Thousands)
Fiscal Year Fiscal Quarter Fiscal Year Fiscal Quarter Fiscal Year
2009 2010 1Q11 2Q11 3Q11 4Q11 2011 1Q12 2Q12 3Q12 4Q12 2012 2013 2014 2015
Model Net Revenue $ 213,351 $ 218,564 $ 60,289 $ 56,621 $ 51,589 $ 42,762 $ 211,260 $ 41,557 $ 43,063 $ 44,053 $ 45,519 $ 174,192 $ 195,214 $ 223,728 $ 254,048
YoY Growth % 2.4%(3.3%)(31.1%)(23.9%)(14.6%) 6.4%(17.5%) 12.1% 14.6% 13.6%
Total Operating Expenses $ 183,930 $ 198,109 $ 53,306 $ 51,272 $ 52,348 $ 56,942 $ 213,868 $ 54,207 $ 47,647 $ 45,970 $ 46,909 $ 194,732 $ 195,097 $ 209,745 $ 225,827
Income from Operations $ 29,421 $ 20,455 $ 6,983 $ 5,349 $(759) $(14,181) $(2,607) $(12,650) $(4,584) $(1,917) $(1,390) $(20,541) $ 117 $ 13,983 $ 28,221
Margin % 13.8% 9.4% 11.6% 9.4% NM NM NM NM NM NM NM NM 0.1% 6.3% 11.1%
Model EBITDA $ 46,247 $ 37,416 $ 11,332 $ 9,170 $ 3,064 $(10,090) $ 13,476 $(8,249) $ 174 $ 2,925 $ 3,448 $(1,702) $ 18,758 $ 30,104 $ 43,598
• Business plan assumes an estimated $12m of proceeds received in Q1 and Q2 of 2012 related to the shut down of PFSL
• Financial projections assume estimated $4m cash from operational restructuring costs in Q1 of 2012
• Financial projections assume return of $4m to Broadridge for unfulfilled outsourcing
Note: Model numbers differ from public filings due to Non-GAAP adjustments
NASDAQ: PNSN 1
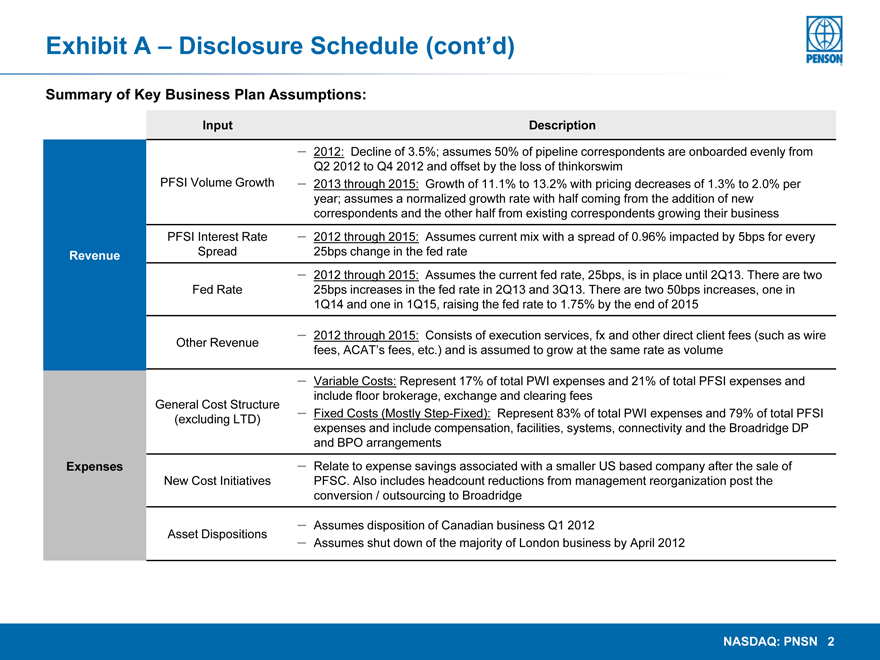
Exhibit A – Disclosure Schedule (cont’d)
Summary of Key Business Plan Assumptions:
Input Description
– 2012: Decline of 3.5%; assumes 50% of pipeline correspondents are onboarded evenly from
Q2 2012 to Q4 2012 and offset by the loss of thinkorswim
PFSI Volume Growth – 2013 through 2015: Growth of 11.1% to 13.2% with pricing decreases of 1.3% to 2.0% per
year; assumes a normalized growth rate with half coming from the addition of new
correspondents and the other half from existing correspondents growing their business
PFSI Interest Rate – 2012 through 2015: Assumes current mix with a spread of 0.96% impacted by 5bps for every
Revenue Spread 25bps change in the fed rate
– 2012 through 2015: Assumes the current fed rate, 25bps, is in place until 2Q13. There are two
Fed Rate 25bps increases in the fed rate in 2Q13 and 3Q13. There are two 50bps increases, one in
1Q14 and one in 1Q15, raising the fed rate to 1.75% by the end of 2015
Other Revenue – 2012 through 2015: Consists of execution services, fx and other direct client fees (such as wire
fees, ACAT’s fees, etc.) and is assumed to grow at the same rate as volume
– Variable Costs: Represent 17% of total PWI expenses and 21% of total PFSI expenses and
include floor brokerage, exchange and clearing fees
General Cost Structure
(excluding LTD) – Fixed Costs (Mostly Step-Fixed): Represent 83% of total PWI expenses and 79% of total PFSI
expenses and include compensation, facilities, systems, connectivity and the Broadridge DP
and BPO arrangements
Expenses – Relate to expense savings associated with a smaller US based company after the sale of
New Cost Initiatives PFSC. Also includes headcount reductions from management reorganization post the
conversion / outsourcing to Broadridge
– Assumes disposition of Canadian business Q1 2012
Asset Dispositions – Assumes shut down of the majority of London business by April 2012
NASDAQ: PNSN 2