Attached files
| file | filename |
|---|---|
| 8-K - FORM 8-K - PENSON WORLDWIDE INC | d316101d8k.htm |
| EX-99.2 - INVESTOR INFORMATION - PENSON WORLDWIDE INC | d316101dex992.htm |
Exhibit 99.1
4Q11 Review
Penson Worldwide, Inc. (NASDAQ: PNSN)
4Q11 Results & Strategic Initiatives Update Conference Call
March 13, 2012
Page 1 of 18
Forward Looking Statements, Non-GAAP Financial Measures & Other
Forward-Looking Statements
Statements contained in this document that are not based on current or historical fact are forward-looking in nature. Such forward-looking statements are based on current plans, goals, estimates and expectations. Forward-looking statements are based on known and unknown risks, assumptions, uncertainties and other factors. Actual results, performance, or achievements may differ materially from those currently anticipated and from any future results, performance, or achievements expressed or implied by such forward-looking statements. Penson undertakes no obligation to update or revise any forward-looking statement.
Non-GAAP Financial Measures
The Company uses certain non-GAAP measures of financial performance to supplement the unaudited financial statements presented in accordance with GAAP. The Company presents non-GAAP measures when we believe that the additional information is useful and meaningful to investors. Non-GAAP measures do not have any standardized meaning and are therefore unlikely to be comparable to similar measures presented by other companies. The presentation of non-GAAP measures is not intended to be a substitute for, and should not be considered in isolation from, the financial measures reported in accordance with GAAP.
EBITDAS (earnings before interest, taxes, depreciation, amortization and stock-based compensation) is considered a non-GAAP financial measure as defined by SEC Regulation G. The Company considers EBITDAS an important measure of our financial performance and of our ability to generate cash flows to service debt, fund capital expenditures and fund other corporate investing and financing activities. EBITDAS eliminates the non-cash effect of tangible asset depreciation and amortization, intangible asset amortization and stock-based compensation.
The Company also considers “Adjusted EBITDA” (another non-GAAP financial measure as defined by SEC Regulation G) an important measure of our financial performance and of our ability to generate cash flows to service debt, fund capital expenditures and fund other corporate investing and financing activities. “Adjusted EBITDA” eliminates the effect in the fourth quarter ended December 31, 2011 of litigation, severance costs, restructuring costs, bad debt, goodwill and intangible asset impairment, and Ridge earnout adjustment and also eliminates the effect in the year ended December 31, 2011 of the CME shares mark to market, non-cash write down of nonaccrual receivables, Pension Asia closure, and other. EBITDAS and “Adjusted EBITDA” should be considered in addition to, rather than as a substitute for, pre-tax income, net income and cash flows from operating activities.
Note
This presentation does not constitute an offer to sell or the solicitation of an offer to buy any securities. The New Senior Secured Notes, the Series A Senior Preferred Stock, the Series B Preferred Stock, the common stock and the exchange offer have not been registered under the Securities Act of 1933, or any applicable state securities laws and may not be offered, sold or exchanged in the United States, absent registration or an applicable exemption from such registration requirements.
Page 2 of 18
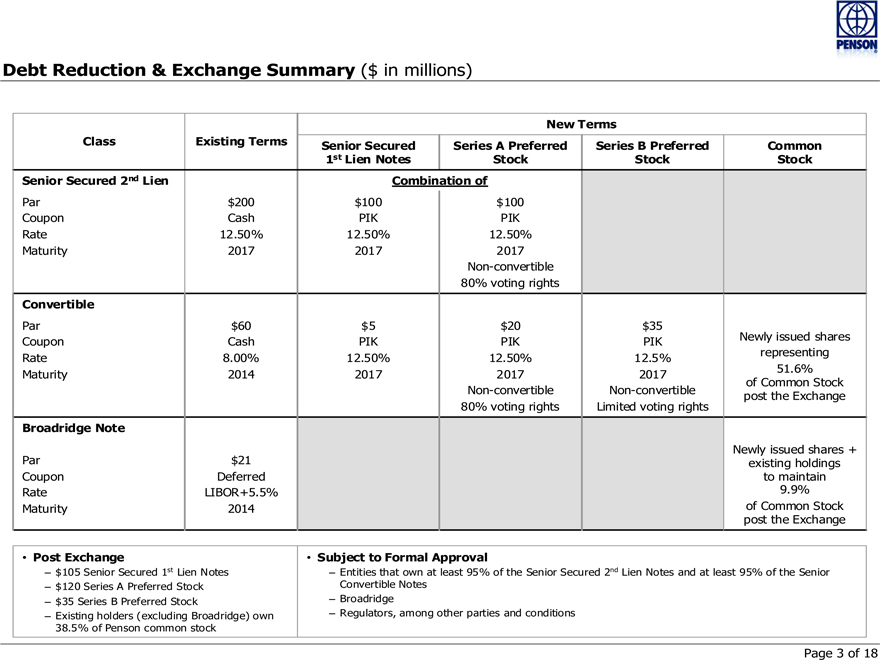
Debt Reduction & Exchange Summary ($ in millions)
New Terms
Class Existing Terms Senior Secured Series A Preferred Series B Preferred Common
1st Lien Notes Stock Stock Stock
Senior Secured 2nd Lien Combination of
Par $200 $100 $100
Coupon Cash PIK PIK
Rate 12.50% 12.50% 12.50%
Maturity 2017 2017 2017
Non-convertible
80% voting rights
Convertible
Par $60 $5 $20 $35
Coupon Cash PIK PIK PIK Newly issued shares
Rate 8.00% 12.50% 12.50% 12.5% representing
Maturity 2014 2017 2017 2017 51.6%
of Common Stock
Non-convertible Non-convertible post the Exchange
80% voting rights Limited voting rights
Broadridge Note
Newly issued shares +
Par $21 existing holdings
Coupon Deferred to maintain
Rate LIBOR+5.5% 9.9%
Maturity 2014 of Common Stock
post the Exchange
• Post Exchange • Subject to Formal Approval
– $105 Senior Secured 1st Lien Notes – Entities that own at least 95% of the Senior Secured 2nd Lien Notes and at least 95% of the Senior
– $120 Series A Preferred Stock Convertible Notes
– $35 Series B Preferred Stock – Broadridge
– Existing holders (excluding Broadridge) own – Regulators, among other parties and conditions
38.5% of Penson common stock
Page 3 of 18
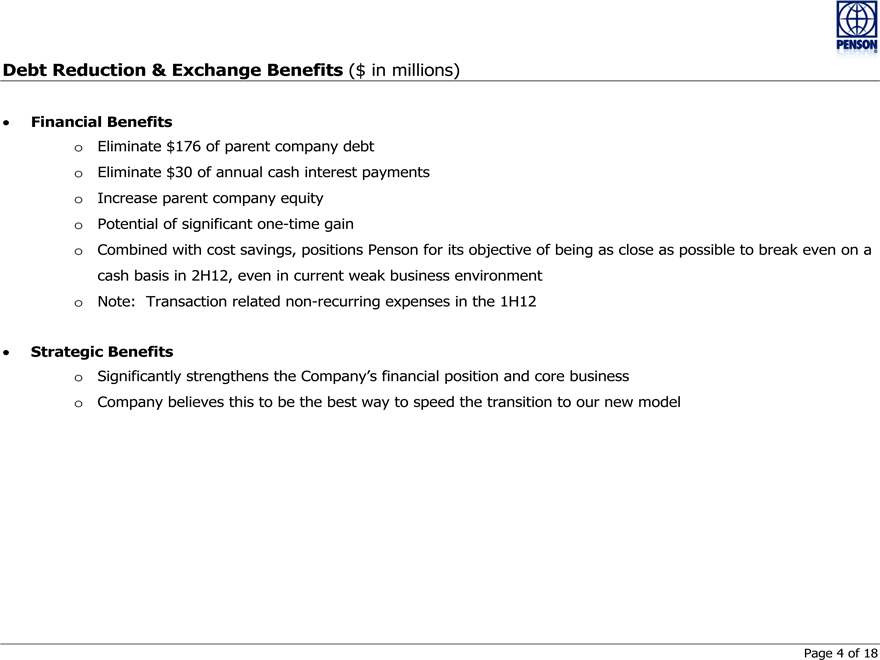
Debt Reduction & Exchange Benefits ($ in millions)
Financial Benefits o Eliminate $176 of parent company debt o Eliminate $30 of annual cash interest payments o Increase parent company equity o Potential of significant one-time gain o Combined with cost savings, positions Penson for its objective of being as close as possible to break even on a cash basis in 2H12, even in current weak business environment o Note: Transaction related non-recurring expenses in the 1H12
Strategic Benefits o Significantly strengthens the Company’s financial position and core business o Company believes this to be the best way to speed the transition to our new model
Page 4 of 18
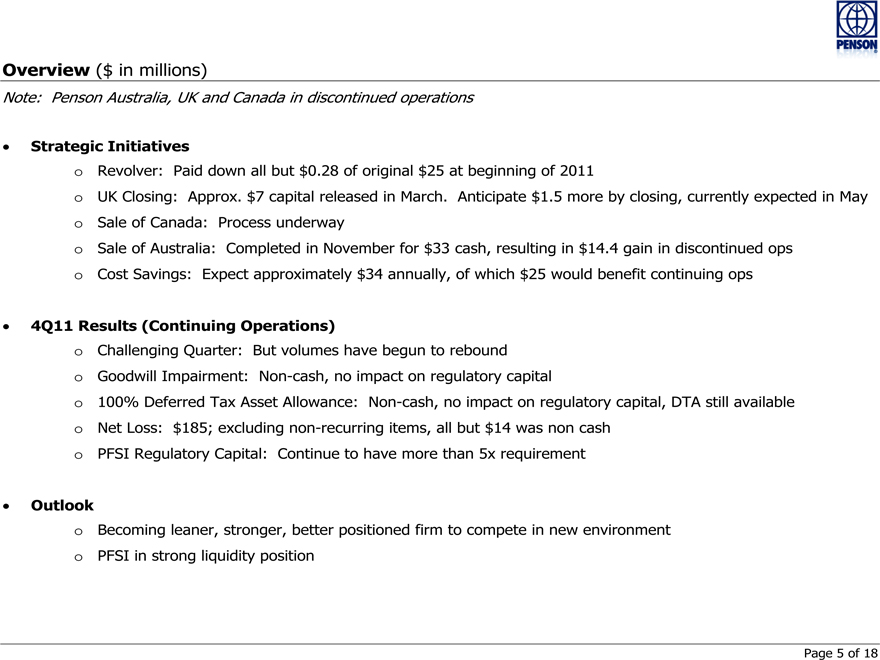
Overview ($ in millions)
Note: Penson Australia, UK and Canada in discontinued operations
Strategic Initiatives o Revolver: Paid down all but $0.28 of original $25 at beginning of 2011 o UK Closing: Approx. $7 capital released in March. Anticipate $1.5 more by closing, currently expected in May o Sale of Canada: Process underway o Sale of Australia: Completed in November for $33 cash, resulting in $14.4 gain in discontinued ops o Cost Savings: Expect approximately $34 annually, of which $25 would benefit continuing ops
4Q11 Results (Continuing Operations) o Challenging Quarter: But volumes have begun to rebound o Goodwill Impairment: Non-cash, no impact on regulatory capital o 100% Deferred Tax Asset Allowance: Non-cash, no impact on regulatory capital, DTA still available o Net Loss: $185; excluding non-recurring items, all but $14 was non cash o PFSI Regulatory Capital: Continue to have more than 5x requirement
Outlook o Becoming leaner, stronger, better positioned firm to compete in new environment o PFSI in strong liquidity position
Page 5 of 18
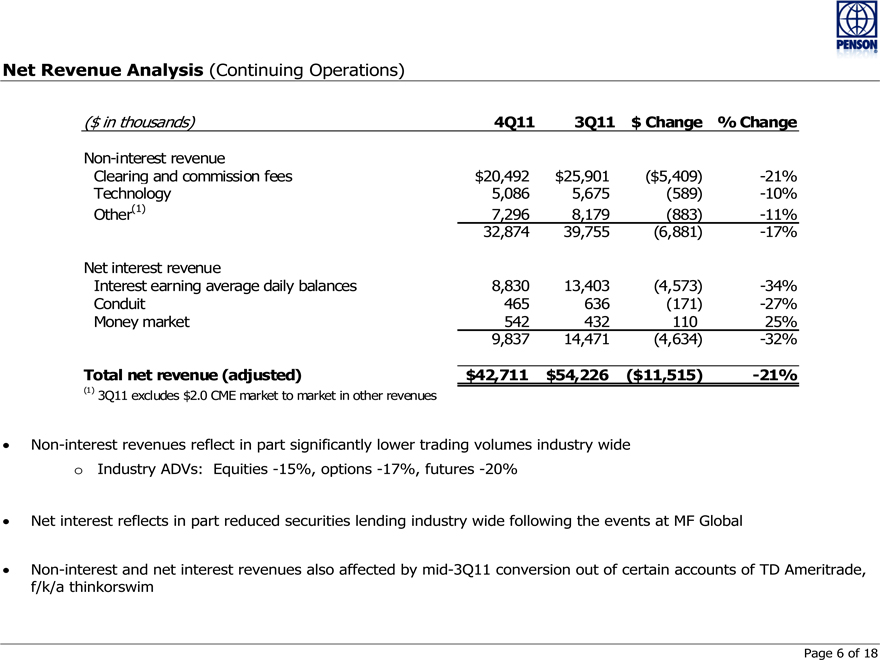
Net Revenue Analysis (Continuing Operations)
($ in thousands) 4Q11 3Q11 $ Change% Change
Non-interest revenue
Clearing and commission fees $20,492 $25,901($5,409) -21%
Technology 5,086 5,675(589) -10%
Other(1) 7,296 8,179(883) -11%
32,874 39,755(6,881) -17%
Net interest revenue
Interest earning average daily balances 8,830 13,403(4,573) -34%
Conduit 465 636(171) -27%
Money market 542 432 110 25%
9,837 14,471(4,634) -32%
Total net revenue (adjusted) $42,711 $54,226($11,515) -21%
(1) 3Q11 excludes $2.0 CME market to market in other revenues
Non-interest revenues reflect in part significantly lower trading volumes industry wide o Industry ADVs: Equities -15%, options -17%, futures -20%
Net interest reflects in part reduced securities lending industry wide following the events at MF Global
Non-interest and net interest revenues also affected by mid-3Q11 conversion out of certain accounts of TD Ameritrade, f/k/a thinkorswim
Page 6 of 18
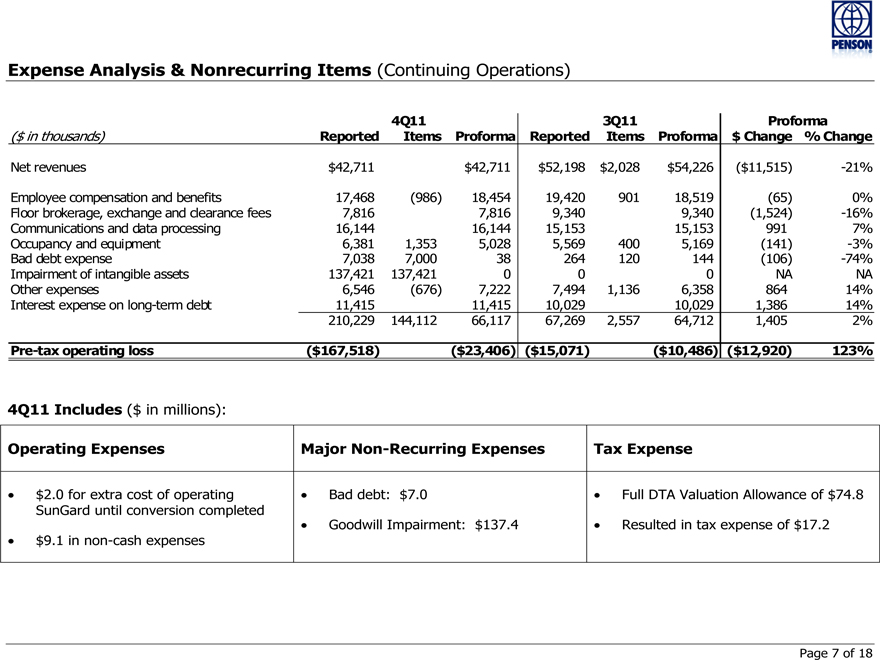
Expense Analysis & Nonrecurring Items (Continuing Operations)
4Q11 3Q11 Proforma
($ in thousands) Reported Items Proforma Reported Items Proforma $ Change% Change
Net revenues $42,711 $42,711 $52,198 $2,028 $54,226($11,515) -21%
Employee compensation and benefits 17,468(986) 18,454 19,420 901 18,519(65) 0%
Floor brokerage, exchange and clearance fees 7,816 7,816 9,340 9,340(1,524) -16%
Communications and data processing 16,144 16,144 15,153 15,153 991 7%
Occupancy and equipment 6,381 1,353 5,028 5,569 400 5,169(141) -3%
Bad debt expense 7,038 7,000 38 264 120 144(106) -74%
Impairment of intangible assets 137,421 137,421 0 0 0 NA NA
Other expenses 6,546(676) 7,222 7,494 1,136 6,358 864 14%
Interest expense on long-term debt 11,415 11,415 10,029 10,029 1,386 14%
210,229 144,112 66,117 67,269 2,557 64,712 1,405 2%
Pre-tax operating loss($167,518)($23,406)($15,071)($10,486)($12,920) 123%
4Q11 Includes ($ in millions):
Operating Expenses Major Non-Recurring Expenses Tax Expense
$2.0 for extra cost of operating Bad debt: $7.0 Full DTA Valuation Allowance of $74.8
SunGard until conversion completed
Goodwill Impairment: $137.4 Resulted in tax expense of $17.2
$9.1 in non-cash expenses
Page 7 of 18
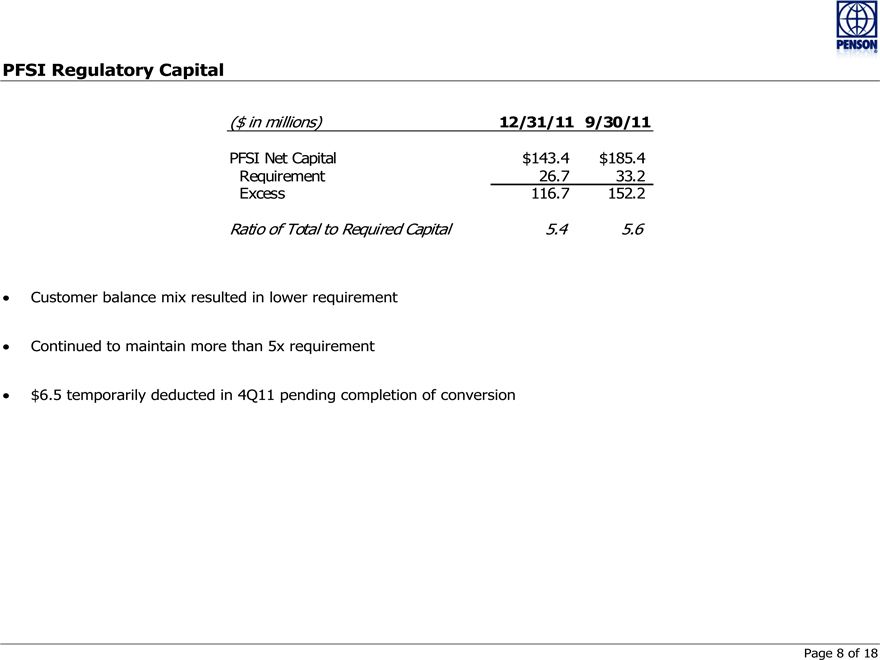
PFSI Regulatory Capital
($ in millions) 12/31/11 9/30/11
PFSI Net Capital $143.4 $185.4
Requirement 26.7 33.2
Excess 116.7 152.2
Ratio of Total to Required Capital 5.4 5.6
Customer balance mix resulted in lower requirement
Continued to maintain more than 5x requirement
$6.5 temporarily deducted in 4Q11 pending completion of conversion
Page 8 of 18
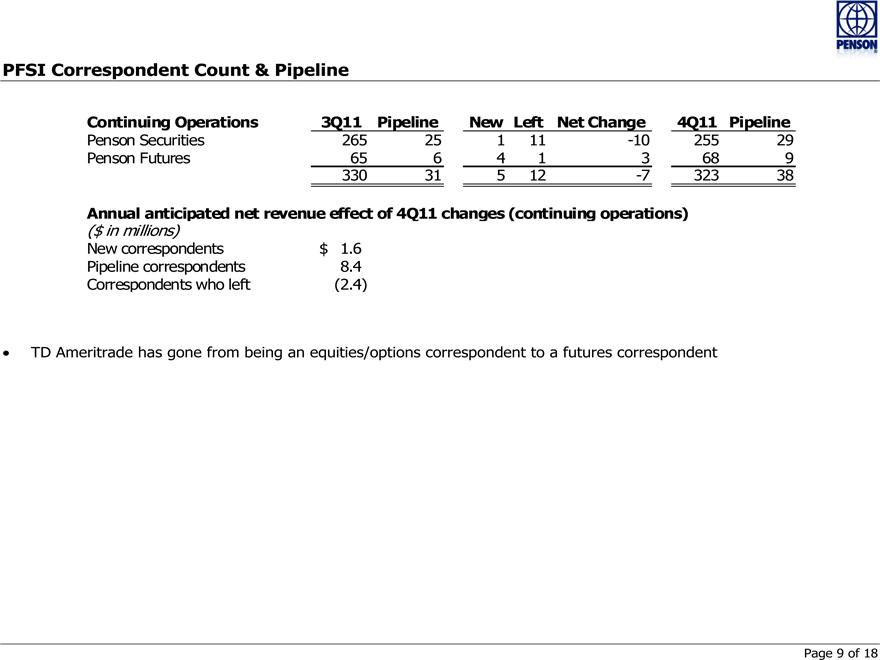
PFSI Correspondent Count & Pipeline
Continuing Operations 3Q11 Pipeline New Left Net Change 4Q11 Pipeline
Penson Securities 265 25 1 11 -10 255 29
Penson Futures 65 6 4 1 3 68 9
330 31 5 12 -7 323 38
Annual anticipated net revenue effect of 4Q11 changes (continuing operations)
($ in millions)
New correspondents $ 1.6
Pipeline correspondents 8.4
Correspondents who left(2.4)
TD Ameritrade has gone from being an equities/options correspondent to a futures correspondent
Page 9 of 18
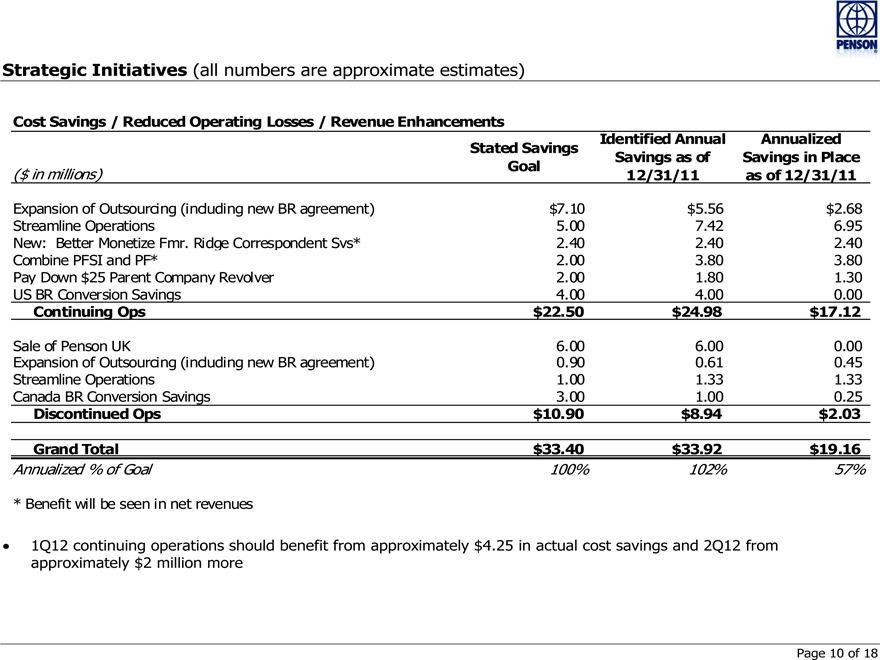
Strategic Initiatives (all numbers are approximate estimates)
Cost Savings / Reduced Operating Losses / Revenue Enhancements
Stated Savings Identified Annual Annualized
Goal Savings as of Savings in Place
($ in millions) 12/31/11 as of 12/31/11
Expansion of Outsourcing (including new BR agreement) $7.10 $5.56 $2.68
Streamline Operations 5.00 7.42 6.95
New: Better Monetize Fmr. Ridge Correspondent Svs* 2.40 2.40 2.40
Combine PFSI and PF* 2.00 3.80 3.80
Pay Down $25 Parent Company Revolver 2.00 1.80 1.30
US BR Conversion Savings 4.00 4.00 0.00
Continuing Ops $22.50 $24.98 $17.12
Sale of Penson UK 6.00 6.00 0.00
Expansion of Outsourcing (including new BR agreement) 0.90 0.61 0.45
Streamline Operations 1.00 1.33 1.33
Canada BR Conversion Savings 3.00 1.00 0.25
Discontinued Ops $10.90 $8.94 $2.03
Grand Total $33.40 $33.92 $19.16
Annualized % of Goal 100% 102% 57%
* Benefit will be seen in net revenues
1Q12 continuing operations should benefit from approximately $4.25 in actual cost savings and 2Q12 from approximately $2 million more
Page 10 of 18
Conclusion ($ in millions)
Goodwill impairment and DTA allowance both non-cash o Will be able to use DTA when results improve or gain o No impact to PFSI regulatory capital
Aggressively addressing quarterly cash loss of $14 (excluding non-recurring items) o Slightly larger cost savings program o Existing strategic initiatives release of more capital o Debt reduction and exchange plan
Continued opportunities to grow PFSI
Outlook o 1Q12: Challenging quarter, but volumes have begun to rebound o 2Q12: Target to fully implement remaining strategic initiatives and finalize debt reduction and exchange o 2H12: Plans is for Penson to be as close as possible to break even on cash basis in current weak environment
Page 11 of 18
Appendix
Page 12 of 18
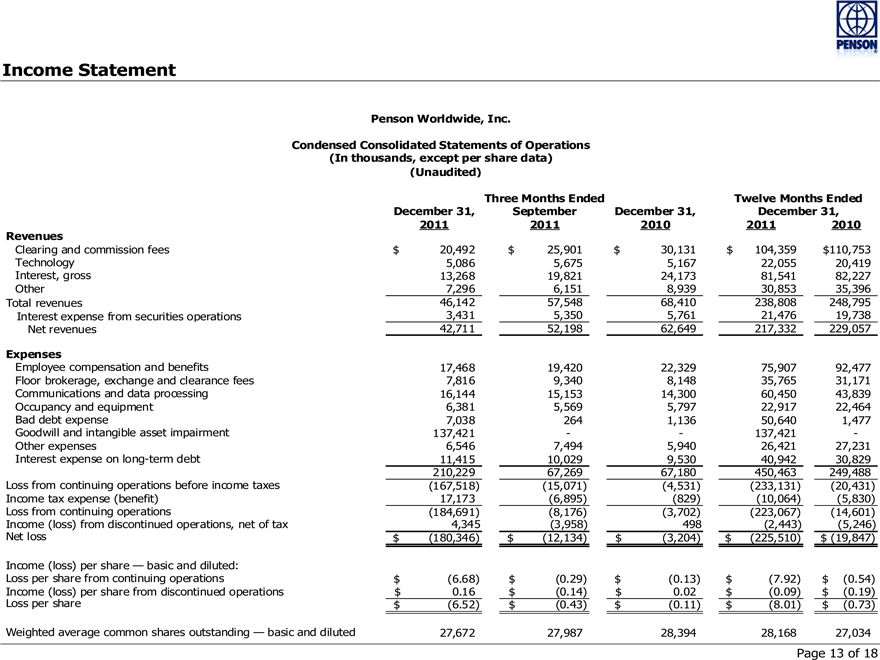
Income Statement
Penson Worldwide, Inc.
Condensed Consolidated Statements of Operations
(In thousands, except per share data)
(Unaudited)
Three Months Ended Twelve Months Ended
December 31, September December 31, December 31,
2011 2011 2010 2011 2010
Revenues
Clearing and commission fees $ 20,492 $ 25,901 $ 30,131 $ 104,359 110,753$
Technology 5,086 5,675 5,167 22,055 20,419
Interest, gross 13,268 19,821 24,173 81,541 82,227
Other 7,296 6,151 8,939 30,853 35,396
Total revenues 46,142 57,548 68,410 238,808 248,795
Interest expense from securities operations 3,431 5,350 5,761 21,476 19,738
Net revenues 42,711 52,198 62,649 217,332 229,057
Expenses
Employee compensation and benefits 17,468 19,420 22,329 75,907 92,477
Floor brokerage, exchange and clearance fees 7,816 9,340 8,148 35,765 31,171
Communications and data processing 16,144 15,153 14,300 60,450 43,839
Occupancy and equipment 6,381 5,569 5,797 22,917 22,464
Bad debt expense 7,038 264 1,136 50,640 1,477
Goodwill and intangible asset impairment 137,421—- 137,421 -
Other expenses 6,546 7,494 5,940 26,421 27,231
Interest expense on long-term debt 11,415 10,029 9,530 40,942 30,829
210,229 67,269 67,180 450,463 249,488
Loss from continuing operations before income taxes(167,518)(15,071)(4,531)(233,131)(20,431)
Income tax expense (benefit) 17,173(6,895)(829)(10,064)(5,830)
Loss from continuing operations(184,691)(8,176)(3,702)(223,067)(14,601)
Income (loss) from discontinued operations, net of tax 4,345(3,958) 498(2,443)(5,246)
Net loss $(180,346) $(12,134) $ (3,204) $ (225,510) $ (19,847)
Income (loss) per share — basic and diluted:
Loss per share from continuing operations $(6.68) $(0.29) $ (0.13) $ (7.92) $(0.54)
Income (loss) per share from discontinued operations $ 0.16 $(0.14) $ 0.02 $ (0.09) $(0.19)
Loss per share $(6.52) $(0.43) $ (0.11) $ (8.01) $(0.73)
Weighted average common shares outstanding — basic and diluted 27,672 27,987 28,394 28,168 27,034
Page 13 of 18
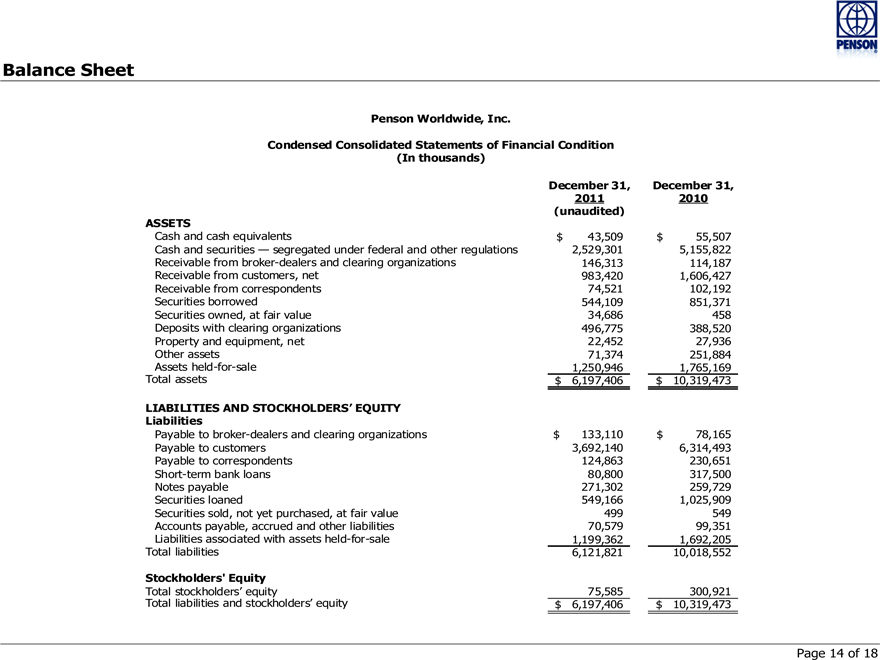
Balance Sheet
Penson Worldwide, Inc.
Condensed Consolidated Statements of Financial Condition
(In thousands)
December 31, December 31,
2011 2010
(unaudited)
ASSETS
Cash and cash equivalents $ 43,509 $ 55,507
Cash and securities — segregated under federal and other regulations 2,529,301 5,155,822
Receivable from broker-dealers and clearing organizations 146,313 114,187
Receivable from customers, net 983,420 1,606,427
Receivable from correspondents 74,521 102,192
Securities borrowed 544,109 851,371
Securities owned, at fair value 34,686 458
Deposits with clearing organizations 496,775 388,520
Property and equipment, net 22,452 27,936
Other assets 71,374 251,884
Assets held-for-sale 1,250,946 1,765,169
Total assets $ 6,197,406 $ 10,319,473
LIABILITIES AND STOCKHOLDERS’ EQUITY
Liabilities
Payable to broker-dealers and clearing organizations $ 133,110 $ 78,165
Payable to customers 3,692,140 6,314,493
Payable to correspondents 124,863 230,651
Short-term bank loans 80,800 317,500
Notes payable 271,302 259,729
Securities loaned 549,166 1,025,909
Securities sold, not yet purchased, at fair value 499 549
Accounts payable, accrued and other liabilities 70,579 99,351
Liabilities associated with assets held-for-sale 1,199,362 1,692,205
Total liabilities 6,121,821 10,018,552
Stockholders’ Equity
Total stockholders’ equity 75,585 300,921
Total liabilities and stockholders’ equity $ 6,197,406 $ 10,319,473
Page 14 of 18
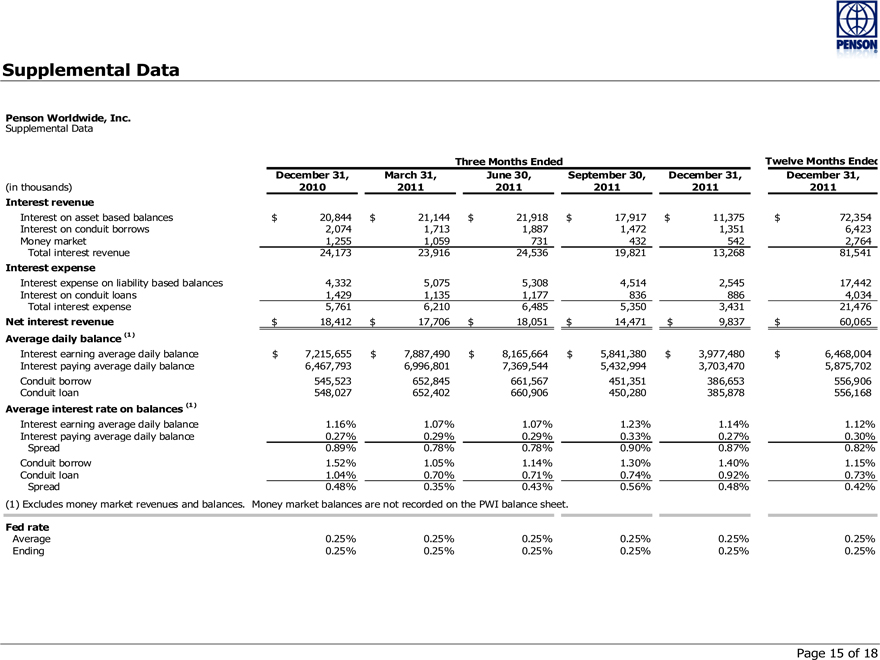
Supplemental Data
Penson Worldwide, Inc.
Supplemental Data
Three Months Ended Twelve Months Ended
December 31, March 31, June 30, September 30, December 31, December 31,
(in thousands) 2010 2011 2011 2011 2011 2011
Interest revenue
Interest on asset based balances $ 20,844 $ 21,144 $ 21,918 $ 17,917 $ 11,375 $ 72,354
Interest on conduit borrows 2,074 1,713 1,887 1,472 1,351 6,423
Money market 1,255 1,059 731 432 542 2,764
Total interest revenue 24,173 23,916 24,536 19,821 13,268 81,541
Interest expense
Interest expense on liability based balances 4,332 5,075 5,308 4,514 2,545 17,442
Interest on conduit loans 1,429 1,135 1,177 836 886 4,034
Total interest expense 5,761 6,210 6,485 5,350 3,431 21,476
Net interest revenue $ 18,412 $ 17,706 $ 18,051 $ 14,471 $ 9,837 $ 60,065
Average daily balance (1)
Interest earning average daily balance $ 7,215,655 $ 7,887,490 $ 8,165,664 $ 5,841,380 $ 3,977,480 $ 6,468,004
Interest paying average daily balance 6,467,793 6,996,801 7,369,544 5,432,994 3,703,470 5,875,702
Conduit borrow 545,523 652,845 661,567 451,351 386,653 556,906
Conduit loan 548,027 652,402 660,906 450,280 385,878 556,168
Average interest rate on balances (1)
Interest earning average daily balance 1.16% 1.07% 1.07% 1.23% 1.14% 1.12%
Interest paying average daily balance 0.27% 0.29% 0.29% 0.33% 0.27% 0.30%
Spread 0.89% 0.78% 0.78% 0.90% 0.87% 0.82%
Conduit borrow 1.52% 1.05% 1.14% 1.30% 1.40% 1.15%
Conduit loan 1.04% 0.70% 0.71% 0.74% 0.92% 0.73%
Spread 0.48% 0.35% 0.43% 0.56% 0.48% 0.42%
(1) Excludes money market revenues and balances. Money market balances are not recorded on the PWI balance sheet.
Fed rate
Average 0.25% 0.25% 0.25% 0.25% 0.25% 0.25%
Ending 0.25% 0.25% 0.25% 0.25% 0.25% 0.25%
Page 15 of 18
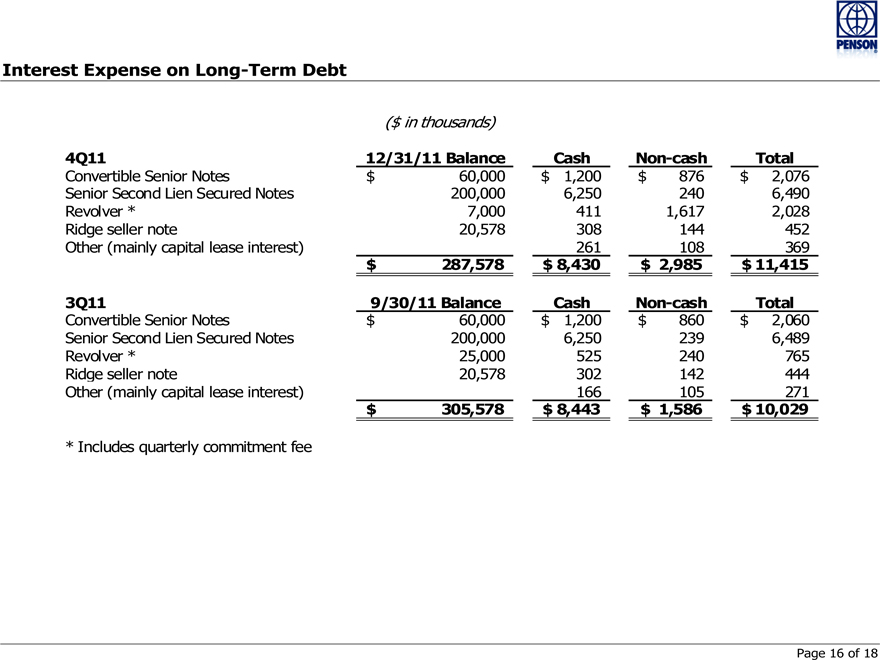
Interest Expense on Long-Term Debt
($ in thousands)
4Q11 12/31/11 Balance Cash Non-cash Total
Convertible Senior Notes $ 60,000 $ 1,200 $ 876 $ 2,076
Senior Second Lien Secured Notes 200,000 6,250 240 6,490
Revolver * 7,000 411 1,617 2,028
Ridge seller note 20,578 308 144 452
Other (mainly capital lease interest) 261 108 369
$ 287,578 $ 8,430 $ 2,985 $ 11,415
3Q11 9/30/11 Balance Cash Non-cash Total
Convertible Senior Notes $ 60,000 $ 1,200 $ 860 $ 2,060
Senior Second Lien Secured Notes 200,000 6,250 239 6,489
Revolver * 25,000 525 240 765
Ridge seller note 20,578 302 142 444
Other (mainly capital lease interest) 166 105 271
$ 305,578 $ 8,443 $ 1,586 $ 10,029
* Includes quarterly commitment fee
Page 16 of 18
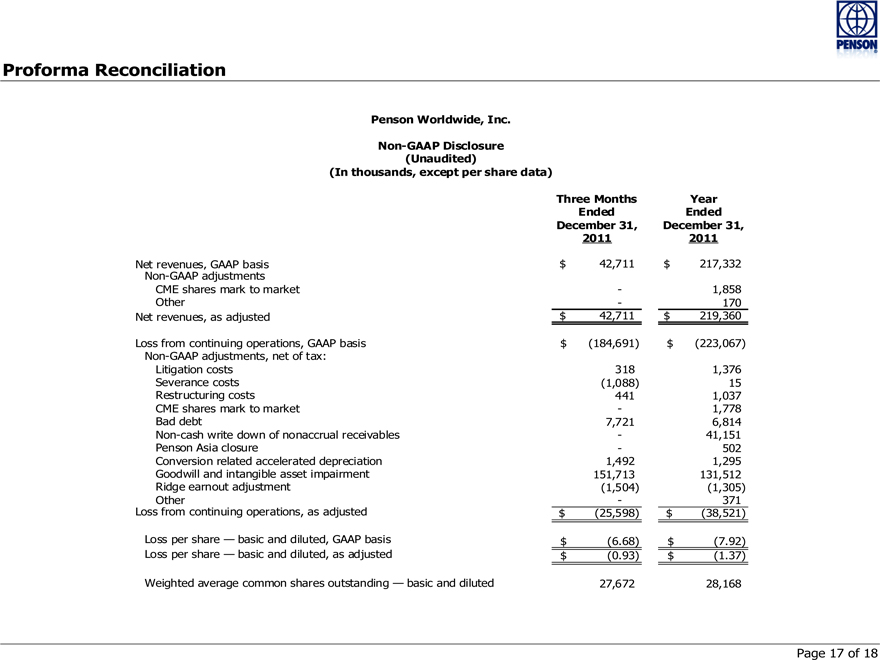
Proforma Reconciliation
Penson Worldwide, Inc.
Non-GAAP Disclosure
(Unaudited)
(In thousands, except per share data)
Three Months Year
Ended Ended
December 31, December 31,
2011 2011
Net revenues, GAAP basis $ 42,711 $ 217,332
Non-GAAP adjustments
CME shares mark to market—1,858
Other—170
Net revenues, as adjusted $ 42,711 $ 219,360
Loss from continuing operations, GAAP basis $(184,691) $(223,067)
Non-GAAP adjustments, net of tax:
Litigation costs 318 1,376
Severance costs(1,088) 15
Restructuring costs 441 1,037
CME shares mark to market—1,778
Bad debt 7,721 6,814
Non-cash write down of nonaccrual receivables—41,151
Penson Asia closure—502
Conversion related accelerated depreciation 1,492 1,295
Goodwill and intangible asset impairment 151,713 131,512
Ridge earnout adjustment(1,504)(1,305)
Other—371
Loss from continuing operations, as adjusted $(25,598) $(38,521)
Loss per share — basic and diluted, GAAP basis $(6.68) $(7.92)
Loss per share — basic and diluted, as adjusted $(0.93) $(1.37)
Weighted average common shares outstanding — basic and diluted 27,672 28,168
Page 17 of 18
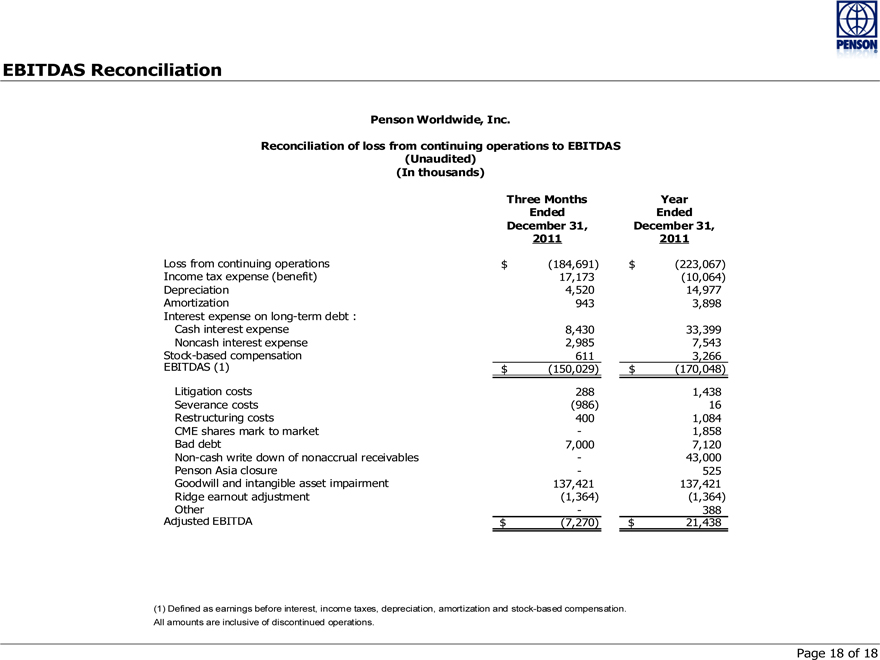
EBITDAS Reconciliation
Penson Worldwide, Inc.
Reconciliation of loss from continuing operations to EBITDAS
(Unaudited)
(In thousands)
Three Months Year
Ended Ended
December 31, December 31,
2011 2011
Loss from continuing operations $(184,691) $(223,067)
Income tax expense (benefit) 17,173(10,064)
Depreciation 4,520 14,977
Amortization 943 3,898
Interest expense on long-term debt :
Cash interest expense 8,430 33,399
Noncash interest expense 2,985 7,543
Stock-based compensation 611 3,266
EBITDAS (1) $(150,029) $(170,048)
Litigation costs 288 1,438
Severance costs(986) 16
Restructuring costs 400 1,084
CME shares mark to market—1,858
Bad debt 7,000 7,120
Non-cash write down of nonaccrual receivables—43,000
Penson Asia closure—525
Goodwill and intangible asset impairment 137,421 137,421
Ridge earnout adjustment(1,364)(1,364)
Other—388
Adjusted EBITDA $(7,270) $ 21,438
(1) Defined as earnings before interest, income taxes, depreciation, amortization and stock-based compensation. All amounts are inclusive of discontinued operations.
Page 18 of 18