Attached files
| file | filename |
|---|---|
| 8-K - CURRENT REPORT ON FORM 8-K - EXAR CORP | d311940d8k.htm |
 24
Annual Roth Conference
Institutional Investor Meetings
Presented by:
Louis DiNardo –
President & CEO
Kevin Bauer –
SVP & CFO
March 12, 2012
Exhibit 99.1
th |
 2
March 12, 2012
24
Annual ROTH Conference
Institutional Investor Meetings
th
Safe Harbor
Forward-Looking Statements: This
presentation contains forward-looking statements within the meaning of the “safe harbor” provisions of the Private Securities Litigation Reform Act of 1995.
These statements are based on management’s current expectations and beliefs and are subject to a
number of factors and uncertainties that could cause actual results to differ materially from
those described in the forward-looking statements. The forward-looking statements contained in this presentation include statements
about future financial and operating results; economic recession, industry and market
conditions, potential synergies and cost savings; the ability to drive growth and expand
customer and partner relationships, changes in gross margins, revenues and operating expenses, manufacturing yields or operations, product development
initiatives, design win conversion and other such statements. These statements are not guarantees of
future performance, involve risks, uncertainties and assumptions that are difficult to predict,
and are based upon assumptions as to future events that may not prove accurate. Therefore, actual outcomes and results
may differ materially from what is expressed herein. In any forward-looking statement in which the
Company expresses an expectation or belief as to future results, such expectation or belief is
expressed in good faith and believed to have a reasonable basis, but there can be no assurance that the statement or expectation or
belief will result or be achieved or accomplished. Information concerning risk factors are
detailed in the Company's SEC reports, including the Annual Report on Form 10-K for the
year ended March 27, 2011 and the Quarterly Report on Form 10-Q for the quarters ended July 3, 2011, October 2, 2011 and January 1, 2012.
Generally Accepted Accounting Principles: The
Company reports its financial results in accordance with GAAP. Additionally, the Company supplements reported GAAP financials with non-GAAP measures
which are included in related press releases and reports furnished to the SEC, copies of which are
available at the Company’s website: http://www.exar.com or the SEC’s website at:
http://www.sec.gov. In this presentation, we are disclosing non-GAAP gross profit, non-GAAP gross margin, non-GAAP research and development
expenses, non-GAAP selling, general and administrative expenses, non-GAAP operating income
(loss), non-GAAP net income (loss), and non-GAAP diluted earnings (loss) per share,
which are adjusted to exclude from our GAAP results all stock-based compensation expense, amortization of acquired intangible assets,
fair value adjustment of acquired inventories, acquisition-related costs, exit costs, separation
costs of executive officers, acceleration of depreciation on abandoned equipment, goodwill and
other intangible asset impairment, impairment charges on investments, and income tax effects. These non-GAAP measures are presented in
part to enhance the understanding of the Company’s historical financial performance and
comparability between reporting periods. The Company believes the non- GAAP presentation,
when shown in conjunction with the corresponding GAAP measures, provide relevant and useful information to analysts, investors, management
and other interested parties. For its internal purposes, the Company uses the foregoing non-GAAP
measures to evaluate performance across reporting periods, determine certain employee benefits
as well as plan for and forecast the Company’s future periods. These non-GAAP measures are not in accordance with, or an
alternative for measures prepared in accordance with GAAP, and may be different from non-GAAP
measures used by other companies. In addition, these non-GAAP measures are not based on any
comprehensive set of accounting rules or principles. The Company believes that non-GAAP measures have limitations in that they do
not reflect all of the amounts associated with the Company’s results of operations as determined
in accordance with GAAP. These measures should only be used to evaluate the Company’s
results of operations in conjunction with the corresponding GAAP measures. |
 Management |
 4
March 12, 2012
24
Annual ROTH Conference
Institutional Investor Meetings
th
Management Team
•
Louis DiNardo CEO
–
30 Years Experience in High Performance Analog Mixed-Signal; CEO, President
and COO, VP/GM •
Todd Smathers SVP Ops
–
30 Years Experience in High Performance Analog Mixed-Signal; SVP Ops,
VP/GM •
Carlos Laber SVP R&D
–
30 Years Experience in High Performance Analog Mixed-Signal; VP R&D, SVP
Technology •
Chris Dingley SVP Sales
•
Kevin Bauer CFO |
 Strategic Vision |
 6
March 12, 2012
24
Annual ROTH Conference
Institutional Investor Meetings
th
•
Exar -
Top Tier High Performance Analog Mixed-Signal
Integrated Circuits and Sub-Systems Provider
–
Networking, Storage and Data Communications
–
Industrial and Embedded Systems
–
Consumer Electronics
–
Computing and Peripherals
•
Exar -
Long Term Differentiation
–
Provide Analog Mixed-Signal Solutions with Embedded Controller,
Computation and Advanced Connectivity
–
Provide Analog Mixed-Signal Solutions with Complete Software and
Firmware Drivers
Exar
-
Strategic
Vision |
 7
March 12, 2012
24
Annual ROTH Conference
Institutional Investor Meetings
th
•
Provide Consistent Profitable Growth
–
Revenue Growth
–
Gross Margin Expansion
–
Operating Expenses Reduction
–
Operating Profit Growth
•
Provide Appreciation in Shareholder Value
–
Alignment of Management Compensation
–
Exceed Peer Group Benchmarks
–
Maintain Stable Management
–
Maintain Consistent Strategy
Exar
-
Strategic
Vision |
 Historical Perspective |
 9
March 12, 2012
24
Annual ROTH Conference
Institutional Investor Meetings
th
Exar
-
Historical
Perspective
•
Timeline
–
Founded in 1972, reorganized in Delaware in 1991
–
IPO -1985
–
History of Analog Mixed-Signal and Communications Products
–
Conversion to fabless model -
1989-91
–
Exar / Sipex Merger –
2007
•
Assets
–
(+) Brand
–
(+) Customers
–
(+) Partners
–
(+) Expertise
–
(+) Balance Sheet |
 10
March 12, 2012
24
Annual ROTH Conference
Institutional Investor Meetings
th
*Note:
Non-GAAP
Gross
Profit
&
Non-GAAP
Gross
Margin
Revenue, Gross Profit*, Gross Margin*
Fiscal Quarters: FYE March
16
16
18
21
21
19
18
16
18
18
14
52%
52%
54%
54%
52%
51%
50%
46%
49%
49%
48%
0%
10%
20%
30%
40%
50%
60%
70%
80%
90%
-
5
10
15
20
25
30
35
40
45
1Q10
2Q10
3Q10
4Q10
1Q11
2Q11
3Q11
4Q11
1Q12
2Q12
3Q12
Gr Profit
Revenue
Gr Margin |
 11
March 12, 2012
24
Annual ROTH Conference
Institutional Investor Meetings
th
Operating Expense*, Operating Income (Loss)*
*Note: Non-GAAP Operating Expense & Non-GAAP Operating Income
(Loss) Fiscal Quarters: FYE March
(5)
-
5
10
15
20
25
1Q10
2Q10
3Q10
4Q10
1Q11
2Q11
3Q11
4Q11
1Q12
2Q12
3Q12
OpEx
OpInc |
 12
March 12, 2012
24
Annual ROTH Conference
Institutional Investor Meetings
th
Restructuring
•
Workforce
–
Reduction
–
Alignment
–
Recruiting
•
Cost of Goods and Operating Expense Reductions
–
Headcount
–
Operating Excellence
–
Facilities Consolidation |
 13
March 12, 2012
24
Annual ROTH Conference
Institutional Investor Meetings
th
Restructuring
•
Workforce Reduction
–
Phase 1 -
January 2012
•
15% of Headcount
•
3 Major Locations
•
5 Secondary Locations
•
$9.7mm Gross Savings
–
Phase 2 -
First Half Fiscal 2013
•
Significant Reduction in Remaining Expenses
•
Primarily S&M and G&A with some R&D
•
Target $10mm Annualized Savings |
 14
March 12, 2012
24
Annual ROTH Conference
Institutional Investor Meetings
th
Restructuring
•
Workforce Alignment and Recruiting
–
Increase Analog Mixed-Signal Product Development
–
Increase Design, Product and Test Engineering Resources
–
Increase Field Applications Engineering Resources
–
Upgrade Key Sales and Marketing Resources |
 15
March 12, 2012
24
Annual ROTH Conference
Institutional Investor Meetings
th
Restructuring
•
COGS and Operating Expense Reductions
–
Headcount: N. America, Malaysia, Shanghai, Hangzhou
–
Test Time Reduction: Existing Products, New Products
–
Supply Chain Management: Fab, Assembly and Test
–
Faculties Consolidation: Fremont
–
Inventory Control: Legacy and New Products
–
Backlog Management: Improve Business Processes |
 16
March 12, 2012
24
Annual ROTH Conference
Institutional Investor Meetings
th
Success Model
•
Long Term Model
–
Growth 150% of Peer Group
–
Gross Margin 55%
–
Operating Expenses 32%
–
Operating Income 23%
•
Demonstrate Consistent Profitable Growth
–
Effective Market Selection
–
Product Differentiation
–
Business Discipline |
 Markets and Products |
 18
March 12, 2012
24
Annual ROTH Conference
Institutional Investor Meetings
th
Exar -
Markets and Products
•
Power Management
–
Programmable Power
–
Analog Power
•
Connectivity
–
Interface
–
UARTS
–
Bridges
•
Data Communications and
Storage
–
Acceleration
–
Encryption
–
Compression/Decompression
•
Communications
–
SONET
–
SDH
–
E1/T1
•
Standard Analog
–
Operational Amplifiers
–
Comparators
–
Voltage References
–
Digital Potentiometers
–
Analog-to-Digital Converters
–
Digital-to-Analog Converters
–
Real-time Clocks |
 19
March 12, 2012
24
Annual ROTH Conference
Institutional Investor Meetings
th
Product
Line
Expansion
–
Power
Management
Required Additions
Design Engineering
Product Engineering
Test Engineering
Applications
Engineering
Process Development
Mask Cost
Wafer Cost
Power
Management
Programmable
Power
DC/DC
Converter
DC
Controller
Charge
Pump
LED
Controllers
TVS |
 20
March 12, 2012
24
Annual ROTH Conference
Institutional Investor Meetings
th
Revenue –
Power Management
Fiscal Quarters: FYE March
-
1
2
3
4
5
6
7
8
9
10
1Q10
2Q10
3Q10
4Q10
1Q11
2Q11
3Q11
4Q11
1Q12
2Q12
3Q12 |
 21
March 12, 2012
24
Annual ROTH Conference
Institutional Investor Meetings
th
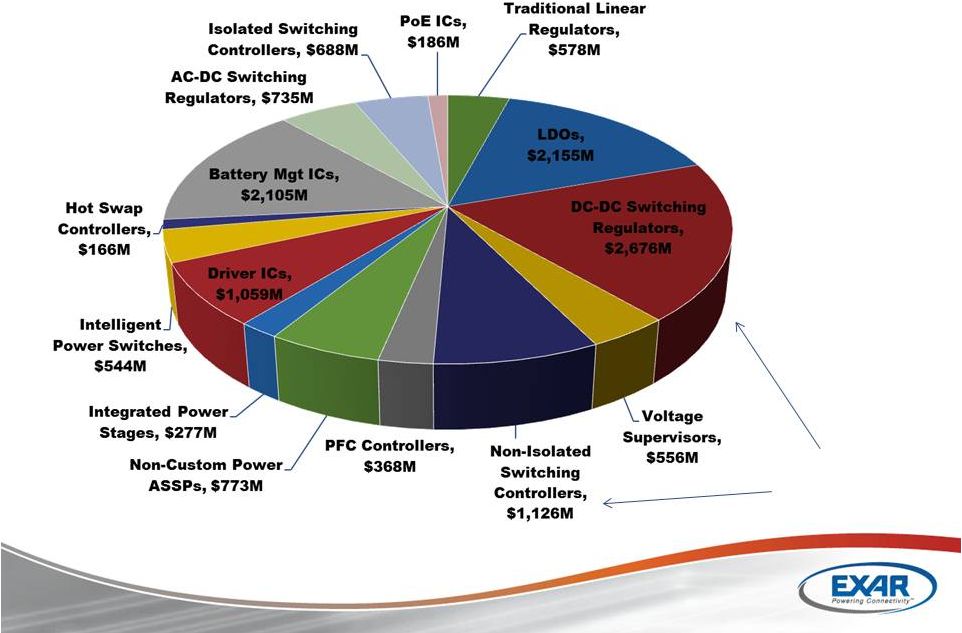
2011 $14B TAM
Market
TAM
&
Segment
SAM
–
Power
Management
IMS Research
(Does not include USB switches –
Analog products)
Digital Power
SAM |
 22
March 12, 2012
24
Annual ROTH Conference
Institutional Investor Meetings
th
Application
Market Sets/yr
Exar
SAM/set
Exar
SAM
Top Customers
STB
150M
$2
$300M
Pace, Motorola, Technicolor
Switches/Routers
20M
$5
$100M
Cisco, HP, Alcatel, Huawei
MFP
10M
$5
$50M
HP, Canon, Konica Minolta
Server
10M
$5
$50M
HP, IBM, Dell
IP Camera
20M
$2
$40M
Siemens, Johnson, Pelco
Patient Monitor
10M
$3
$30M
GE, Honeywell, Mindray
BTS/BSC/RRH
4M
$8
$30M
NSN, Ericsson, ZTE
POS
15M
$2
$30M
Ingenico, Verifone, Hypercom
xPON
10M
$1
$10M
Huawei, ZTE, Fiberhome
Ultrasound
2M
$5
$10M
Seimens, GE, Mindray
Total
$650M
ABI Research, Gartner, Infonetic, IMS, Mobile Experts, Nilson
Focus
Application
SAMs
–
Power
Management |
 23
March 12, 2012
24
Annual ROTH Conference
Institutional Investor Meetings
th
Products
-
Power
Management
•
Integration
•
Four independent programmable step-down DPWM controllers
•
Four Integrated FET drivers
•
Reconfigurable GPIO pins & I
C interface
•
Performance
•
Output currents up to 15A
•
High Efficiency ~95%
•
Single input 4.75V to 25V
•
9mA typical standby current
•
Management
•
Power monitoring
•
Full on-board protection: OTP, UVLO, OCP & OVP
•
Reusable design, PC design environment
2 |
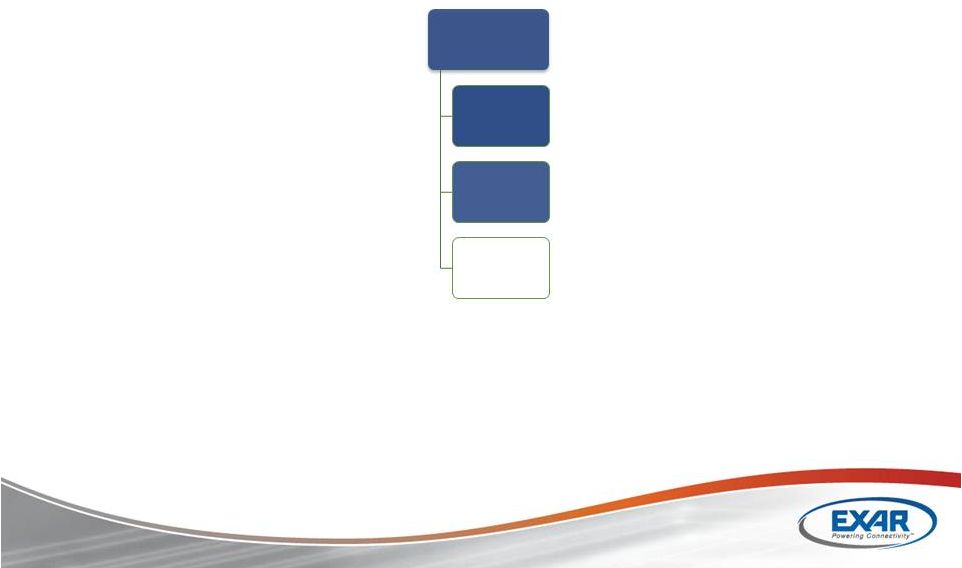
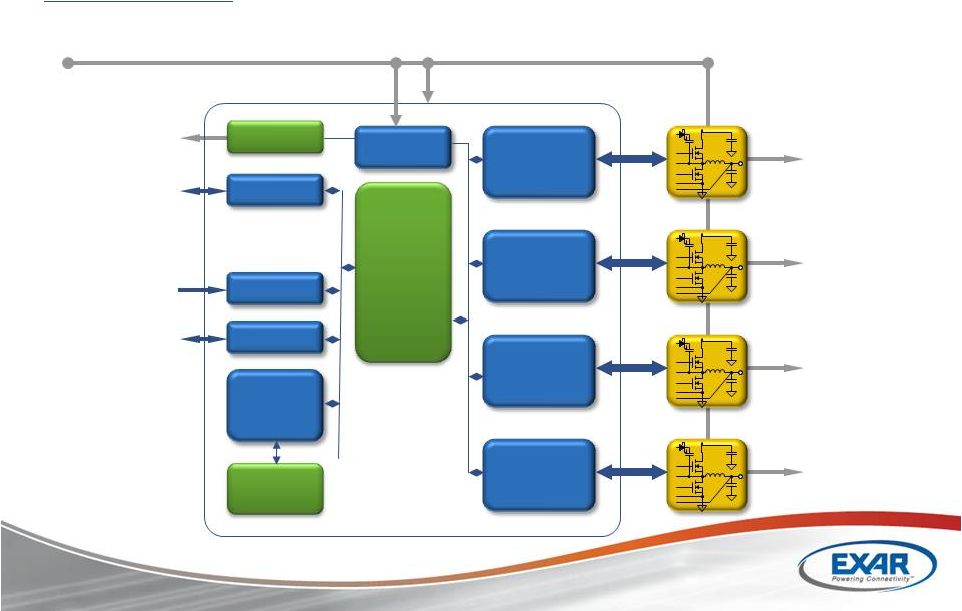 Products
–
Power
Management
XRP 7724 Block Diagram
Vout 1
Vout 2
Vout 3
Vout 4
Vin (4.75 –
25V)
3.3V @ 50mA max
SDA / SCL to Host µC
2 GPIOs
General IC ENABLE
24
March 12, 2012
24
Annual ROTH Conference
Institutional Investor Meetings
StandBy LDO
GPIO
Enable
I²C
Configuration
Register
set
Flash
Memory
Internal LDOs
4 Channel
Digital
PWM &
PFM
Control
Engine
Gate Drivers
Current Sensing
HS Charge Pump
Vout Feedback
Gate Drivers
Current Sensing
HS Charge Pump
Vout Feedback
Gate Drivers
Current Sensing
HS Charge Pump
Vout Feedback
Gate Drivers
Current Sensing
HS Charge Pump
Vout Feedback
th |
 25
March 12, 2012
24
Annual ROTH Conference
Institutional Investor Meetings
th
Set-Top
Box
-
Point
of
Load
Requirements
Functional Block
Products
Exar Part Numbers
Power Supply Unit
(Sequencing, Monitoring)
Programmable Buck controllers
XRP7713, XRP7714
Power Supply Unit (DC/DC POLs)
Buck regulators, LDOs
SPX3819, SPX1117, SPX5205, SP6260, SP7662
XRP7664, XRP7665,
SDRAM Termination
Bus Termination regulators
XRP2997
LEDs
LED drivers
XRP7620, XRP712x
USB 2.0/3.0
USB Power switch
XRP2525, XRP2526, XRP2527
Conditional Access Module
Low voltage buck, LDOs
SP6669, SP6657, SP6260
Front USB
USB Power switch
XRP2525, SP619
RS232
RS232 serial transceiver
SP3232, SP232, SP202
GPIOs Expander
I2C & SPI GPIO expanders
XRA120x, XRA140x |
 26
March 12, 2012
24
Annual ROTH Conference
Institutional Investor Meetings
th
Competition
–
Power
Management
Competitor
Competitor’s Strengths
Exar’s Advantage
•Leader in low current POL
•Captive low cost process
•Differentiated portfolio
•Brand in focus markets
•Strong Asian Presence
•Incumbents in large Asia ODMs
•Differentiated Portfolio
•US Brand
•Low Cost
•Closeness to Asian market
•Differentiated portfolio
•US Brand & Quality
•Analog brand
•Applications support
•Design expertise
•Lower cost solutions
•Lead on digital control
programmable power
•Broad Portfolio (+NSC)
•Brand Recognition
•Customer engagements
•Design expertise
•High volume foundry
•Lead on programmable power |
 27
March 12, 2012
24
Annual ROTH Conference
Institutional Investor Meetings
th
Product
Line
Expansion
-
Communications
Discontinued Development Program Q4 FY’12
Comm
IC’s
SONET
E1/T1
Transport |
 28
March 12, 2012
24
Annual ROTH Conference
Institutional Investor Meetings
th
Revenue
-
Communications
Fiscal Quarters: FYE March
-
1
2
3
4
5
6
7
8
9
10
1Q10
2Q10
3Q10
4Q10
1Q11
2Q11
3Q11
4Q11
1Q12
2Q12
3Q12 |
 29
March 12, 2012
24
Annual ROTH Conference
Institutional Investor Meetings
th
Product
Line
Expansion
–
Data
&
Storage
Data
Storage
ASSP
SoC |
 30
March 12, 2012
24
Annual ROTH Conference
Institutional Investor Meetings
th
Revenue
–
Data & Storage
Fiscal Quarters: FYE March
-
1
2
3
4
5
6
7
8
9
10
1Q10
2Q10
3Q10
4Q10
1Q11
2Q11
3Q11
4Q11
1Q12
2Q12
3Q12 |
 31
March 12, 2012
24
Annual ROTH Conference
Institutional Investor Meetings
th
Application
SAM 2012
Industry Leaders
Enterprise Storage
$77.5M
EMC, Hitachi, IBM, NetApp
Big Data/
Data Warehousing
$79.3M
Teradata, Oracle, HP, IBM
Cloud Storage
$99.8M
Amazon, Microsoft, Rackspace
Cloud Computing
$63.3M
IBM, Google, Salesforce
Network Security
$137.2M
Cisco, Juniper, Huawei, F5
VOIP Security
$26.3M
Acme Packet, Cisco
Total
$483M
Source: IDC, Exar
Focus
Application
SAMs
-
Data
&
Storage |
 32
March 12, 2012
24
Annual ROTH Conference
Institutional Investor Meetings
th
Backup Solution with DX17xx or 18xx Card
HBA
Processor /
Chipset
PCI-E
PCI-E
DX 18xx
DX 17xx
DX 18xx
DX 17xx
Application
Example
-
Data
&
Storage
Disk Interface
SERVER
STORAGE ARRAY |
 33
March 12, 2012
24
Annual ROTH Conference
Institutional Investor Meetings
th
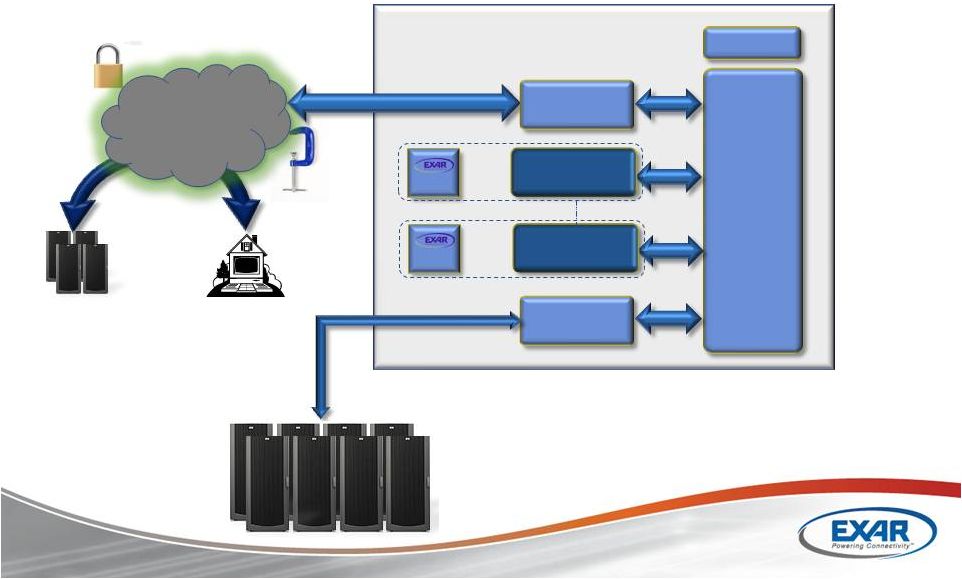
SSL or IPsec VPN Gateway
CPU
Sub-
System
Memory
PCI-E
Secure
Secure
Cloud
Cloud
WAN I/F
1GbE/10GbE
NIC
PCI-E
WAN
Interface
PCI-E
PCI-E
Corporate Data Center
DX 18xx
DX 17xx
DX 18xx
DX 17xx
or
or
Remote
Data Center
Home Office
Application
Example
-
Data
&
Storage
820x
820x |
 34
March 12, 2012
24
Annual ROTH Conference
Institutional Investor Meetings
th
Competition
-
Data
&
Storage
Competitor
Competitor’s Strengths
Exar’s Advantages
X86 Multi-core
Processors
•
Compute capabilities increasing as
number of CPU cores increases
•
Low cost: Riding Moore’s Law
•
Optimizes application
performance
•
Higher security/compression
performance
•
Lower power consumption
•
Reduced TCO
Intel I/O Hubs
•
Next Gen IOH integrates PK,
compression
•
Available on new platforms
•
Higher security/compression
performance
•
Better scalability
•
Lower power
Cavium
•
Compute capabilities increasing as
number of CPU cores increases
•
Next generation Nitrox family sampling
•
Integrated encryption, PK,
compression
•
Good performance
•
Simultaneous processing of
encryption, PK, and
compression without
performance penalty
•
Lower power consumption
Multi-core Network
Processors
(Netlogic, Freescale)
•
Compute capabilities increasing as
number of CPU cores increases
•
Integrated encryption, compression
•
Optimizes application
performance
•
Lower power consumption
•
Low latency |
 35
March 12, 2012
24
Annual ROTH Conference
Institutional Investor Meetings
th
Product
Line
Expansion
-
Connectivity
Connectivity
UART
Interface
Bridges |
 36
March 12, 2012
24
Annual ROTH Conference
Institutional Investor Meetings
th
Revenue
-
Connectivity
Fiscal Quarters: FYE March
-
2
4
6
8
10
12
14
16
18
20
22
1Q10
2Q10
3Q10
4Q10
1Q11
2Q11
3Q11
4Q11
1Q12
2Q12
3Q12 |
 37
March 12, 2012
24
Annual ROTH Conference
Institutional Investor Meetings
th
Market
TAM
&
Segment
SAM
-
Connectivity
Other Analog
Other Analog
TAM: $1.7 Billon
TAM: $1.7 Billon
Other Digital
Other Digital
TAM: $1 Billon
TAM: $1 Billon
Worldwide Interface
TAM: $5.4 Billon
Source: Databeans
Connectivity/Bridges
Connectivity/Bridges
TAM: $2.1B
TAM: $2.1B
SAM: $500M
SAM: $500M
UARTs
UARTs
TAM/SAM: $130M
TAM/SAM: $130M
Serial Transceivers
Serial Transceivers
TAM/SAM: $500M
TAM/SAM: $500M |
 38
March 12, 2012
24
Annual ROTH Conference
Institutional Investor Meetings
th
Application
Examples
-
Connectivity
Servers
Blade Servers
cPCI Servers
Consumer
Set Top
Box
HDTV
MFP
Tablets
Industrial/POS
Communications
Console Servers
KVM Switches
Wireless
Transceiver
GPS/Telematics
Network Routers
Embedded Systems
PC104/104+
ISA
PCI
MB |
 39
March 12, 2012
24
Annual ROTH Conference
Institutional Investor Meetings
th
Competition
-
Connectivity
Competitor
Competitor’s Strengths
Exar Advantages
•Brand recognition
•Broad portfolio
•Customer engagements
•Broader UART portfolio
•Dual/Multi-protocol Serial Xcvrs
•Brand recognition
•Customer engagements
•Broader UART portfolio
•Product Synergy (UARTs & Serial Xcvrs)
•Analog brand recognition
•Broad portfolio
•Design expertise & technical support
•Single-chip Multi-protocol Serial Xcvrs
•UART portfolio
•Product Synergy (UARTs & Serial Xcvrs)
•Broad portfolio of Serial Xcvrs
•UART portfolio
•Product Synergy (UARTs & Serial Xcvrs)
•PCI/PCIe UARTs
•PCIe Switches/Bridges
•Much broader UART portfolio
•Product Synergy (UARTs & Serial Xcvrs)
•Broadest USB UART portfolio
•Worldwide presence in USB UARTs
•Much broader UART portfolio
•Smallest footprint USB UARTs
•Product Synergy (UARTs & Serial Xcvrs)
•Low cost development expertise
•Customer engagements in Asia
•Ethernet controller portfolio
•Much broader UART portfolio
•Customer engagements worldwide
•Product Synergy (UARTs & Serial Xcvrs) |
 40
March 12, 2012
24
Annual ROTH Conference
Institutional Investor Meetings
th
Product
Line
Expansion
–
Standard
Analog
New
Development
Benchmarks
New Product Definition 120 DAYS
New Product Development 180 DAYS
New Product Design Wins 180 DAYS
Analog
Mixed-Signal
RTC
REF
AMP
ADC
DAC
DCP |
 Growth Plans and Financial
Model |
 42
March 12, 2012
24
Annual ROTH Conference
Institutional Investor Meetings
th
Product Line Expansion
Diversified Product Offering with Segments of High Growth and High Margin
Power
Management
Programmable
Power
DC/DC
Converter
DC
Controllers
Charge
Pump
LED
Controllers
TVS
Data
Storage
SoC
ASSP
Connectivity
UART
Interface
Bridges
Analog
Mixed-Signal
DCP
DAC
ADC
AMP
REF
Real Time
RTC
Comm IC’s
SONET
E1/T! |
 43
March 12, 2012
24
Annual ROTH Conference
Institutional Investor Meetings
th
Exar Growth Initiatives
•
Top Tier High Performance Analog Mixed-Signal
Components and Advanced Networking Products
–
Phase I Growth through Market Share Growth
•
Existing Products with Existing Partners
–
Phase II Growth through Product Line Expansion
•
Additional Products through Licensing or Acquisition
–
Phase III Growth through New Product Introduction
•
Differentiation with Embedded Connectivity and Controller
|
 44
March 12, 2012
24
Annual ROTH Conference
Institutional Investor Meetings
th
Revenue by Geography & Channel
Note: represents FY 2011 results
EMEA
16%
China
34%
Asia
(ex-China)
27%
Americas
23%
Direct
21%
POP (sell-in)
21%
POS
(sell through)
58% |
 45
March 12, 2012
24
Annual ROTH Conference
Institutional Investor Meetings
th
P&L
Quarterly
Targets
–
Non-GAAP
3Q FY12
Dec-2011
Current
Breakeven²
Target
Breakeven
Long Term
Operating
Model
Revenue
$29.7M
~$34-35M
~$28M
~$43M
Gross Margin¹
48.4%
47%
50%
55%
R&D¹
27.9%
SG&A¹
28.7%
Operating Expense¹
56.6%
47%
50%
32%
Operating Inc. / (Loss)¹
(8.2)%
Breakeven
Breakeven
23%
EBITDA¹
EBITDA Margin¹
$(0.2)M
-
$2M
6%
$2M
7%
$12M
28%+
1
Non-GAAP measures
2
After February 2012 product alignment (OTN) and reduction actions
|
 Appendix
GAAP to Non-GAAP reconcilliations |
 47
March 12, 2012
24
Annual ROTH Conference
Institutional Investor Meetings
th
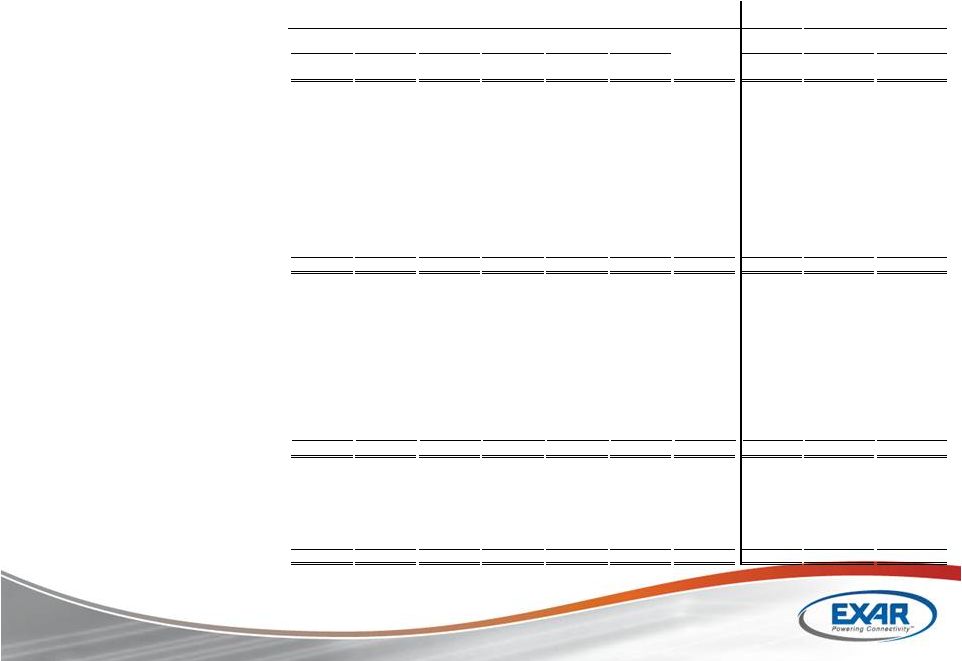
Reconciliation of Unaudited GAAP to Non-GAAP Results (1/2)
(Thousands except per share amounts)
NINE
MONTHS
ENDED
JUN 27,
SEP 26,
DEC 26,
MAR 27,
JULY 3,
OCT 2,
JAN 1,
JAN 1,
MAR 27,
MAR 28,
2010
2010
2010
2011
2011
2011
2012
2012
2011
2010
Net Sales
39,636
$
37,233
$
35,365
$
33,771
$
36,978
$
36,120
$
29,679
$
102,777
$
146,005
$
134,878
$
GAAP gross profit
18,816
$
17,291
$
16,083
$
11,807
$
16,841
$
16,729
$
13,345
$
46,915
$
63,997
$
63,382
$
GAAP gross margin
47.5%
46.4%
45.5%
35.0%
45.5%
46.3%
45.0%
45.6%
43.8%
47.0%
Stock-based compensation
220
98
78
93
59
69
104
232
489
528
Amortization of acquired intangible assets
1,553
1,515
1,533
1,443
905
905
905
2,715
6,044
5,187
Fair value adjustment of acquired inventories
42
-
-
-
-
42
2,398
Acquisition-related costs
-
-
-
-
-
-
24
Exit costs
-
-
2,212
152
-
-
152
2,212
-
Non-GAAP gross profit
20,631
$
18,904
$
17,694
$
15,555
$
17,957
$
17,703
$
14,354
$
50,014
$
72,784
$
71,519
$
Non-GAAP gross margin
52.1%
50.8%
50.0%
46.1%
48.6%
49.0%
48.4%
48.7%
49.9%
53.0%
GAAP research and development expenses
14,443
$
11,840
$
12,071
$
12,744
$
9,395
$
8,838
$
8,871
$
27,104
$
51,098
$
48,511
$
Stock-based compensation
1,556
665
645
375
302
488
576
1,366
3,241
2,325
Amortization of acquired intangible assets
1,074
1,074
72
72
-
-
-
-
2,292
2,785
Acquisition-related costs
-
-
-
-
-
-
-
-
-
887
Exit costs
-
-
-
1,210
115
-
-
115
1,210
-
Non-GAAP research and development expenses
11,813
$
10,101
$
11,354
$
11,087
$
8,978
$
8,350
$
8,295
$
25,623
$
44,355
$
42,514
$
GAAP selling, general and administrative expenses
12,957
$
11,083
$
10,298
$
11,094
$
9,600
$
9,373
$
9,909
$
28,882
$
45,432
$
48,861
$
Stock-based compensation
1,546
751
585
769
523
620
653
1,796
3,651
3,112
Amortization of acquired intangible assets
298
297
294
254
174
174
174
522
1,143
697
Acquisition-related costs
328
-
-
-
-
-
-
-
328
5,385
Exit costs
-
-
-
165
58
-
-
58
165
-
Separation costs of executive officer
-
-
-
-
-
-
575
575
-
162
Accelaration of depreciation on abandoned equipment
-
-
-
-
-
-
-
-
-
50
Non-GAAP selling, general and administrative expenses
10,785
$
10,035
$
9,419
$
9,906
$
8,845
$
8,579
$
8,507
$
25,931
$
40,145
$
39,455
$
GAAP operating expenses
27,400
$
22,923
$
22,369
$
31,323
$
18,995
$
18,211
$
18,780
$
55,986
$
104,015
$
97,372
$
Stock-based compensation
3,102
1,416
1,230
1,144
825
1,108
1,229
3,162
6,892
5,437
Amortization of acquired intangible assets
1,372
1,371
366
326
174
174
174
522
3,435
3,482
Acquisition-related costs
328
-
-
-
-
-
-
-
328
6,272
Exit costs
-
-
-
1,375
173
-
-
173
1,375
-
Separation costs of executive officers
-
-
-
-
-
-
575
575
-
162
Accelaration of depreciation on abandoned equipment
-
-
-
-
-
-
-
-
-
50
Goodwill and intangible assets impairment
-
-
-
7,485
-
-
-
-
7,485
-
Non-GAAP operating expenses
22,598
$
20,136
$
20,773
$
20,993
$
17,823
$
16,929
$
16,802
$
51,554
$
84,500
$
81,969
$
GAAP operating loss
(8,584)
$
(5,632)
$
(6,286)
$
(19,516)
$
(2,154)
$
(1,482)
$
(5,435)
$
(9,071)
$
(40,018)
$
(33,990)
$
Stock-based compensation
3,322
1,514
1,308
1,237
884
1,177
1,333
3,394
7,381
5,965
Amortization of acquired intangible assets
2,925
2,886
1,899
1,769
1,079
1,079
1,079
3,237
9,479
8,669
Fair value adjustment of acquired inventories
42
-
-
-
-
-
-
-
42
2,398
Acquisition-related costs
328
-
-
-
-
-
-
-
328
6,296
Exit costs
-
-
-
3,587
325
-
-
325
3,587
-
Separation costs of executive officers
-
-
-
-
-
-
575
575
-
162
Accelaration of depreciation on abandoned equipment
-
-
-
-
-
-
-
-
-
50
Goodwill and intangible assets impairment
-
-
-
7,485
-
-
-
-
7,485
-
Non-GAAP operating income (loss)
(1,967)
$
(1,232)
$
(3,079)
$
(5,438)
$
134
$
774
$
(2,448)
$
(1,540)
$
(11,716)
$
(10,450)
$
TWELVE MONTHS ENDED
-
-
-
-
-
-
- |
 48
March 12, 2012
24
Annual ROTH Conference
Institutional Investor Meetings
th
Reconciliation of Unaudited GAAP to Non-GAAP Results (2/2)
(Thousands except per share amounts)
NINE
MONTHS
ENDED
JUN 27,
SEP 26,
DEC 26,
MAR 27,
JULY 3,
OCT 2,
JAN 1,
JAN 1,
MAR 27,
MAR 28,
2010
2010
2010
2011
2011
2011
2012
2012
2011
2010
Net Sales
39,636
$
37,233
$
35,365
$
33,771
$
36,978
$
36,120
$
29,679
$
102,777
$
146,005
$
134,878
$
GAAP net loss
(7,414)
$
(4,459)
$
(4,959)
$
(18,836)
$
(1,426)
$
(1,077)
$
(4,733)
$
(7,236)
$
(35,668)
$
(28,110)
$
Stock-based compensation
3,322
1,514
1,308
1,237
884
1,177
1,333
3,394
7,381
5,965
Amortization of acquired intangible assets
2,925
2,886
1,899
1,769
1,079
1,079
1,079
3,237
9,479
8,669
Fair value adjustment of acquired inventories
42
-
-
-
-
-
-
-
42
2,398
Acquisition-related costs
328
-
-
-
-
-
-
-
328
6,296
Exit costs
-
-
-
3,587
325
-
-
325
3,587
-
Separation costs of executive officers
-
-
-
-
-
-
575
575
-
162
Accelaration of depreciation on abandoned equipment
-
-
-
-
-
-
-
-
-
50
Goodwill and intangible assets impairment
-
-
-
7,485
-
-
-
-
7,485
-
Impairment charges on investments
-
62
-
-
-
-
-
-
62
317
Income tax effects
33
32
(118)
129
(142)
221
(194)
(115)
76
(40)
Non-GAAP net income (loss)
(764)
$
35
$
(1,870)
$
(4,629)
$
720
$
1,400
$
(1,940)
$
180
$
(7,228)
$
(4,293)
$
GAAP loss per share
(0.17)
$
(0.10)
$
(0.11)
$
(0.42)
$
(0.03)
$
(0.02)
$
(0.11)
$
(0.16)
$
(0.81)
$
(0.64)
$
Stock-based compensation
0.08
0.03
0.03
0.03
0.02
0.03
0.03
0.08
0.17
0.14
Amortization of acquired intangible assets
0.07
0.07
0.04
0.04
0.02
0.02
0.02
0.07
0.21
0.20
Fair value adjustment of acquired inventories
0.00
-
-
-
-
-
-
-
0.00
0.06
Acquisition-related costs
0.01
-
-
-
-
-
-
-
0.01
0.14
Exit costs
-
-
-
0.08
0.01
-
-
0.01
0.08
-
Separation costs of executive officers
-
-
-
-
-
-
0.01
0.01
-
0.00
Accelaration of depreciation on abandoned equipment
-
-
-
-
-
-
-
-
-
0.00
Goodwill and intangible assets impairment
-
-
-
0.17
-
-
-
-
0.17
-
Impairment charges on investments
-
0.00
-
-
-
-
-
-
0.00
0.01
Income tax effects
0.00
0.00
(0.00)
0.00
(0.00)
0.00
(0)
(0.00)
0.00
(0.00)
Non-GAAP diluted earnings (loss) per share
(0.02)
$
0.00
$
(0.04)
$
(0.10)
$
0.02
$
0.03
$
(0.04)
$
0.00
$
(0.16)
$
(0.10)
$
43,897
44,173
44,300
44,503
44,599
44,759
44,830
44,726
44,218
43,584
The effect of dilutive potential common shares due to
reporting Non-GAAP net income
-
261
-
-
206
99
-
210
-
-
The effect of removing stock-based compensation expense
under SFAS 123R for Non-GAAP presentation purpose
-
(329)
-
-
(183)
(15)
-
(131)
-
-
Shares
used
in
diluted
earnings
per
share
---
Non-GAAP
43,897
44,105
44,300
44,503
44,622
44,843
44,830
44,805
44,218
43,584
Notes: Certain amounts may not total due to rounding.
Certain
amounts
previously
reported
above
have
been
reclassified
to conform to the current period presentation.
TWELVE MONTHS ENDED
Shares
used
in
earnings
(loss)
per
share
---
GAAP |