Attached files
Table of Contents
UNITED STATES
SECURITIES AND EXCHANGE COMMISSION
WASHINGTON, D.C. 20549
FORM 10-K
| x | ANNUAL REPORT PURSUANT TO SECTION 13 OR 15(d) OF THE SECURITIES EXCHANGE ACT OF 1934 |
For the fiscal year ended March 27, 2011
OR
| ¨ | TRANSITION REPORT PURSUANT TO SECTION 13 OR 15(d) OF THE SECURITIES EXCHANGE ACT OF 1934 |
For the transition period from to
Commission File No. 0-14225
EXAR CORPORATION
(Exact Name of Registrant as specified in its charter)
| Delaware | 94-1741481 | |
| (State or other jurisdiction of incorporation or organization) |
(I.R.S. Employer Identification Number) |
48720 Kato Road, Fremont, CA 94538
(Address of principal executive offices, Zip Code)
Registrant’s telephone number, including area code: (510) 668-7000
SECURITIES REGISTERED PURSUANT TO SECTION 12(b) OF THE ACT:
| Title of each class | Name of exchange on which registered | |
| Common Stock, $0.0001 Par Value | The NASDAQ Global Market |
SECURITIES REGISTERED PURSUANT TO SECTION 12(g) OF THE ACT: NONE
Indicate by check mark if the Registrant is a well-known seasoned issuer, as defined in Rule 405 the Securities Act. Yes ¨ No x
Indicate by check mark if the Registrant is not required to file reports pursuant to Section 13 or 15(d) of the Act. Yes ¨ No x
Indicate by check mark whether the Registrant (1) has filed all reports required to be filed by Section 13 or 15(d) of the Securities Exchange Act of 1934 during the preceding 12 months (or for such shorter period that the Registrant was required to file such reports), and (2) has been subject to such filing requirements for the past 90 days. Yes x No ¨
Indicate by check mark whether the registrant has submitted electronically and posted on it corporate Website, if any, every Interactive Data File required to be submitted and posted pursuant to Rule 405 of Regulations S-T (§229.405 of this chapter) during the preceding 12 months (or for such shorter period that the registrant was required to submit and post such files). Yes ¨ No ¨
Indicate by check mark if disclosure of delinquent filers pursuant to Item 405 of Regulation S-K (§229.405 of this chapter) is not contained herein, and will not be contained, to the best of Registrant’s knowledge, in definitive proxy or information statements incorporated by reference in Part III of this Form 10-K or any amendment to this Form 10-K. ¨
Indicate by check mark whether the Registrant is a large accelerated filer, an accelerated filer, a non-accelerated filer or a smaller reporting company. See the definitions of “large accelerated filer,” “accelerated filer” and “smaller reporting company” in Rule 12b-2 of the Exchange Act.
| Large accelerated filer ¨ Accelerated filer x | ||
| Non-accelerated filer ¨ (Do not check if a smaller reporting company) |
Smaller reporting company ¨ | |
Indicate by check mark whether the Registrant is a shell company (as defined in Rule 12b-2 of the Act). Yes ¨ No x
The aggregate market value of the outstanding voting stock held by non-affiliates of the Registrant as of September 26, 2010 was approximately $118.4 million based upon the closing price reported on The NASDAQ Global Market as of the last business day of the Registrant’s most recently completed second fiscal quarter. Approximately 23.7 million shares of common stock held by officers, directors and persons known to the Registrant to hold 5% or more of the Registrant’s outstanding common stock have been excluded in that such persons may be deemed to be affiliates. This determination of affiliate status is not necessarily a conclusive determination for other purposes.
The number of shares outstanding of the Registrant’s Common Stock was 44,590,821 as of May 27, 2011, net of 19,924,369 treasury shares.
DOCUMENTS INCORPORATED BY REFERENCE
Portions of the Registrant’s 2011 Definitive Proxy Statement to be filed not later than 120 days after the close of the 2011 fiscal year are incorporated by reference into Part III, Items 10, 11, 12, 13 and 14 of this Report.
Table of Contents
EXAR CORPORATION AND SUBSIDIARIES
INDEX TO
ANNUAL REPORT ON FORM 10-K
FOR FISCAL YEAR ENDED MARCH 27, 2011
2
Table of Contents
FORWARD-LOOKING STATEMENTS
This Annual Report on Form 10-K (this “Annual Report”) contains forward-looking statements within the meaning of Section 27A of the Securities Act of 1933, as amended, and Section 21E of the Securities Exchange Act of 1934, as amended. Forward-looking statements are generally written in the future tense and/or may generally be identified by words such as “will,” “may,” “should,” “could,” “expect,” “suggest,” “believe,” “anticipate,” “intend,” “plan,” or other similar words. Forward-looking statements contained in this Annual Report include, among others, statements made in Part II, Item 7—“Management’s Discussion and Analysis of Financial Condition and Results of Operations—Executive Summary” and elsewhere regarding (1) our revenue growth, (2) our future gross profits and margins, (3) our future research and development efforts and related expenses, (4) our future selling, general and administrative expenses, (5) our cash and cash equivalents, short-term marketable securities and cash flows from operations being sufficient to satisfy working capital requirements and capital equipment needs for at least the next 12 months, (6) our ability to continue to finance operations with cash flows from operations, existing cash and investment balances, and some combination of long-term debt and/or lease financing and sales of equity securities, (7) the possibility of future acquisitions and investments, (8) our ability to accurately estimate our assumptions used in valuing stock-based compensation, (9) our ability to estimate and reconcile distributors’ reported inventories to their activities, (10) our ability to estimate future cash flows associated with long-lived assets, (11) the volatile global economic and financial market conditions, and (12) anticipated impacts of our exit of the 10 gigabit Ethernet market. Actual results may differ materially from those projected in the forward-looking statements as a result of various factors. Factors that could cause actual results to differ materially from those included herein include, but are not limited to, the factors contained under the captions Part I, Item 1—“Business,” Part I, Item 1A—“Risk Factors” and Part II, Item 7—“Management’s Discussion and Analysis of Financial Condition and Results of Operations.” We disclaim any obligation to update information in any forward-looking statement.
| ITEM 1. | BUSINESS |
OVERVIEW
Exar Corporation and its subsidiaries (“Exar” or “we”) is a fabless semiconductor company that designs, sub-contracts manufacturing and sells highly differentiated silicon, software and subsystem solutions for industrial, telecom, networking and storage applications. Our core expertise in silicon integration, system architecture and software has enabled the development of innovative solutions designed to meet the needs of the evolving connected world. Our product portfolio includes power management and interface components, communications products, storage optimization solutions and network security solutions. Applying both analog and digital technologies, our products are deployed in a wide array of applications such as portable electronic devices, set top boxes, digital video recorders, telecommunication systems, servers, enterprise storage systems and industrial automation equipment. We provide customers with a breadth of component products and subsystem solutions based on advanced silicon integration.
Exar was incorporated in California in 1971 and reincorporated in Delaware in 1991. Our common stock trades on The NASDAQ Global Market (“NASDAQ”) under the symbol “EXAR”. See the information in Part II, Item 8—“Financial Statements and Supplementary Data” for information on our financial position as of March 27, 2011, March 28, 2010 and March 29, 2009, and our results of operations and cash flows for our fiscal years ended March 27, 2011, March 28, 2010 and March 29, 2009.
On March 16, 2010, we completed the acquisition of Neterion, Inc. (“Neterion”), a developer of 10 gigabit Ethernet (“10GbE”) controller silicon and card solutions optimized for virtualized environments located in Sunnyvale, California. During the course of fiscal 2011, we participated in the 10GbE market and established a limited set of customers but fell short of our revenue goals for the product line. After assessing our position in this market and our product development roadmap, we announced on March 4, 2011 that we had decided to exit
3
Table of Contents
the data center virtualization market and, in connection therewith, had decided to discontinue development of these products. We immediately reduced our resources and began a process to sell assets devoted to the development of these products.
On June 17, 2009, we completed the acquisition of Galazar Networks, Inc. (“Galazar”). Galazar, based in Ottawa, Ontario, Canada, was a fabless semiconductor and software supplier focused on carrier grade transport over telecom networks. Galazar’s product portfolio addresses transport of a wide range of networking and telecom services including Ethernet, TDM, Fiber Channel and video over SONET/SDH, PDH and OTN networks.
On April 3, 2009, we completed the acquisition of hi/fn, inc. (“Hifn”), a fabless semiconductor company that was founded in 1996, spun off from Stac, Inc. in 1999 and traded on The NASDAQ Stock Market under the symbol “HIFN” since 1999. The acquisition of Hifn expanded and complemented our product offering in the enterprise storage, networking and telecom markets where we have had a significant base of business for more than 10 years. The Hifn technology added world class compression and data deduplication products used in storage applications to optimize data and speed up data backup and retrieval. Hifn had also been a leading provider in security acceleration technology by providing encryption and compression products to leading networking and telecom system manufacturers. The Hifn products complement our connectivity solutions and provide us with a more significant product offering to our customers.
On August 25, 2007, we acquired Sipex Corporation (“Sipex”), a fabless semiconductor company that designed, manufactured and marketed high performance, analog integrated circuits (“ICs”) used by original equipment manufacturers (“OEMs”) in the computing, consumer electronics, communications and networking infrastructure markets.
Our products are organized into four product lines, which provide product definition based on market opportunities and trends. Product line orientation also allows for the concentration of technical expertise around the common market and strategic customer focus to bond product solutions to the largest users in a given market segment. Our product lines are defined as Interface Products, Power Management Products, Communications Products and Datacom and Storage Products.
We believe our core competencies and key initiatives include:
Leading Analog and Mixed-Signal Design Expertise—We have over 40 years of proven technical competency in developing analog and mixed-signal ICs. As a result, we have developed a deep understanding of the subtleties of analog and mixed-signal design and a comprehensive library of analog core blocks. We leverage this expertise across the broad range of products we develop. From programmable power management chips to advanced telecom products, our products share a heavy concentration of analog and mixed-signal content to achieve high performance, power efficient solutions.
Comprehensive Solutions to Enhance System Integration—The combination of our design expertise, diverse circuit technology and system-level expertise enables us to provide comprehensive solutions that encompass hardware, software and applications support. For example, we have developed many digital blocks and engines that are used in data aggregation, transmission, acceleration and computer offload. We believe that by using our solutions, OEMs can develop higher performance systems, better leverage their development resources and reduce their time-to-market.
Connectivity Solutions—A focus on connectivity remains a key strategic direction that drives our product strategies and serves as a foundation for customer engagements. Expanding the range of connectivity solutions has driven our acquisition activity in the last two years. With the addition of system architecture expertise we have extended our portfolio of products to offer new silicon products, cards and software to support the demand for system solutions in addition to component products. Our connectivity solutions span a range of applications
4
Table of Contents
that serve industrial, networking, storage and telecom applications. Our devices facilitate and optimize the virtual handshake between systems and across networks.
Compelling Performance Solutions—We use our systems expertise and our analog, digital and mixed-signal design techniques to architect high-performance products based on standard Complementary Metal Oxide Semiconductor (“CMOS”) process technologies. The diversity of our technology enables us to develop differentiated solutions for our target markets.
Conscious Preservation Initiative—Environmental concerns have a direct impact on electronic components and products. We are committed to reducing the impact that the end use and manufacturing of our products may have on the environment. We have taken the initiative to offer a portfolio of “green” products by transitioning our manufacturing processes to offer parts that meet or exceed the Restriction of Hazardous Substances Directive (“RoHS”) requirements and are halogen-free.
MARKETS AND PRODUCTS
Datacom and Storage
Our datacom and storage product portfolio provides a range of solutions for OEMs to efficiently optimize, secure, and transport data in next generation data centers. Our value proposition is driven by underlying hardware offload technology. The concept behind hardware offload is to use efficient, dedicated hardware to provide functionality that would otherwise need to be done with power-hungry and costly host processors. General-purpose application processors are very flexible, but inefficient. The advantages of hardware offload are:
| • | High performance and scalability—the hardware is dedicated to a specific task and architected for parallelism |
| • | Low power—dedicated hardware is highly efficient |
| • | Data integrity—results of calculations can be checked in real time without performance degradation |
Our datacom and storage solutions provide hardware offload capabilities that are an ideal complement to the capabilities of costly application processors. Using application processors to perform tasks such as encrypting data or inspecting packets rather than executing application software is very inefficient. The result is higher operating costs and the need for additional, expensive hardware – as well as data center floor space to install it, the capability to cool it, and the headcount to manage it. A dedicated Exar device can perform encryption several times faster than two fully dedicated quad core, multi-threaded server microprocessors at approximately 2% of the power. This is just one example of the value hardware offload can provide in an enterprise environment.
We provide a variety of solutions to help manage the growing requirements placed on the network and storage infrastructure found in many organizations. These solutions provide the capability to minimize the data footprint with compression, secure data with encryption and eliminate redundancy with deduplication. Our product portfolio is targeted at resolving these issues with a range of innovative solutions:
| • | Data Security and Compression—Our line of ASIC and PCI-Express add-in card solutions provide a range of functionality necessary for data encryption/authentication and data compression. These hardware solutions are supported by a comprehensive software suite to enable rapid time-to-market. The flexibility of these products enables high performance, low power solutions for both data-at-rest in storage environments as well as data-in-motion in networking applications. All of these solutions are engineered for end-to-end data integrity critical for protecting user data. |
| • | Data Deduplication—Our BitWackr™ product provides a comprehensive solution for in-line data deduplication for primary and backup storage applications. These solutions offload the computationally intensive tasks necessary from the host processor to allow high performance, power efficient implementations of the data deduplication function as well as enabling data to be simultaneously compressed and encrypted for storage. |
5
Table of Contents
Communications
Our communications products group designs, develops and markets high performance products for the transmission of digital data through global service provider networks. Conforming to international standards for the copper, fiber optic and wireless protocols, our broad portfolio of PDH, SONET, SDH and OTN products enable the delivery of highly reliable, value added communication services.
T/E Carrier
Service providers have a large investment in their existing copper infrastructure. This infrastructure remains a cost effective means of providing high value leased line and data services for enterprises, mobile backhaul and network interconnection. We offer a comprehensive portfolio of T1 and E1 devices for twisted pair copper and DS3 and E3 devices for coaxial copper connections. Our broad range of T1/E1 devices includes short-haul and long-haul Line Interface Units (“LIUs”) and LIU/framer combinations that incorporate reconfigurable, relayless redundancy (Exar R3 Technology™) with integrated termination resistors and jitter attenuation. Used individually or in chip sets, our T1/E1 technologies offer customers key advantages including design flexibility, enhanced system reliability and standards compliance, which are critical components of high-density, low-power system boards and line-cards. In addition, our T1/E1/J1 Framer/LIU combination products simplify the design process by saving board space and by reducing complexity as a result of lowering component count. In addition to T1/E1 solutions, we have developed a diverse portfolio of single- and multi-channel T3/E3 physical interface solutions with integrated LIU logic and jitter attenuation that achieve high performance levels while reducing board space and overall power in multi-port applications.
SONET/SDH
Synchronous Optical NETwork (“SONET”) and Synchronous Digital Hierarchy (“SDH”) protocols are the backbone of today’s high-capacity, long distance communications networks. Our portfolio of SONET/SDH products process data at speeds from 155Mb/s to 40Gb/s for the efficient transport of digital data over fiber optic networks. Products include mixed signal clock and data recovery (“CDR”) circuits, transceivers, protocol framers and service mappers. Our high density, high-integration products enable significant flexibility in line card design coupled with cost, area and power savings.
OTN
With the substantial growth of internet, wireless and broadband traffic, the demands on service providers for faster, high bandwidth and more reliable networks for ubiquitous services resulted in the development of the Optical Transport Networks (“OTN”) protocol. Optimized for long distance transmission of data at speeds starting at 2.5 Gb/s and exceeding 100 Gb/s, OTN has been accepted as the global technology for the next generation of optical networks. We are developing a portfolio of products optimized for the efficient mapping of Ethernet, SONET/SDH, OTN, video, storage and data services over high capacity OTN networks. These multiservice products enable flexible, low power, any service, any port line cards.
Carrier Ethernet Services
The exponential increase of internet traffic within service provider networks has created a need for products to efficiently map internet data onto the existing PDH and SONET/SDH digital networks and evolving OTN network. As the ubiquitous interface for internet and data traffic in general, Ethernet mappers are key components for the transformation of the network from circuit based to packet based transport. Our extensive portfolio of Ethernet over PDH (“EoPDH”), Ethernet over SONET/SDH (“EoS”) and Ethernet over OTN products enable the efficient mapping of Ethernet packets into flexible bandwidth transport networks.
6
Table of Contents
Interface
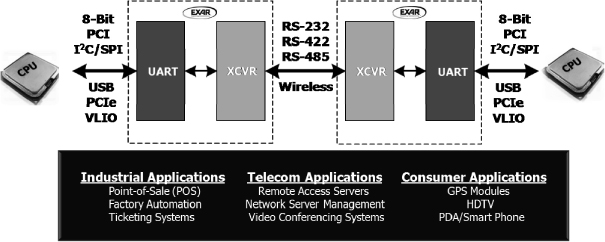
As a market leader, we offer the broadest line of industry-proven Universal Asynchronous Receiver/Transmitter (“UART”) solutions as well as synergistic serial transceiver devices for use in pervasive applications in industrial, telecommunications and consumer markets. Typical applications served by our serial communications products include point-of-sales (“POS”), process control, factory automation as well as servers, embedded systems, routers, network management equipment, remote access servers, wireless base-stations and repeaters. Additionally, our single and multi-channel UARTs are used in portable consumer applications such as multi-media, global positioning system (“GPS”), personal digital assistant (“PDA”) and smart phone devices.
Our UART product portfolio ranges from cost-effective industry-standard devices to high-performance multi-channel UARTs with a broad range of first in, first out (“FIFO”) depths and industry leading performance and features while supporting popular central processing unit (“CPU”) bus interfaces such as 8-bit Industry Standard Architecture (“ISA”), 8-bit VLIO, 2-wire Inter-Integrate Circuit (“I2C”), 4-wire Serial Peripheral Interface (“SPI”), Peripheral Component Interconnect (“PCI”), Peripheral Component Interconnect Express (“PCIe”) and Universal Serial Bus (“USB”). In addition, we were first to market with a wireless UART solution that includes a high-performance UART, controller and Radio Frequency (“RF”) functionality along with our proprietary firmware that enables the application to send and receive data wirelessly over a secure proprietary protocol.
Our serial transceiver solutions consist of Recommended Standard (“RS”)-232, RS-485, RS-422 and multiprotocol devices that ensure reliable connectivity between computing devices. Our RS-232, RS-485 and RS-422 transceivers comply with international standards in delivering multi-channel digital signals between two systems. Our proprietary multiprotocol transceivers enable network equipment to communicate with a large population of peripherals that use a diverse set of serial protocol standards without the added burden of multiple add-on boards and cables.
Our interface product strategy is to continue to enhance the product portfolio with higher speed, lower power and higher functionality devices that meet or exceed the growing demands of the serial communications market. We intend to grow our interface product business by providing increased integration and value through the introduction of additional UART and serial transceiver devices as well as bridging products for popular and growing bus interfaces such as USB, PCIe and Ethernet, among others.
7
Table of Contents
Power Management
The power management market is a large and diverse semiconductor segment that spans a broad range of technologies. We have developed solutions for DC/DC voltage conversion and supervision designed to meet the needs of industrial, communication and computer systems as well as other electronic devices.
PowerXR TM, our line of programmable power management products, provides system designers with the ability to reconfigure the power management sub-system throughout the development cycle and, if required, even in the field. By using PowerXR technology, product development cycles can be reduced from many months to several weeks with the flexibility and configurability of this programmable solution. We are at the forefront of the industry in providing the high performance and cost effective programmable power solutions that make this change in product development methodology possible.
The Power Delivery System
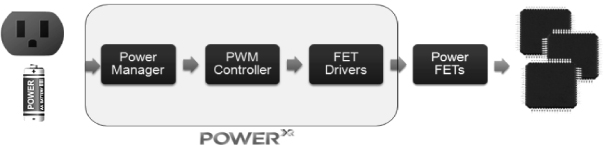
PowerXR products utilize proprietary technology that has evolved from our previous acquisitions of Sipex and FyreStorm, a collaborative development partnership with the University of Toronto and our internal engineering team. PowerXR technology combines digital control and monitoring with our high performance analog circuitry, enabling the system architect to design products that reduce wasted energy by orders of magnitude and are reconfigurable on the fly. This allows the designer to easily manage product changes and perform true what-if analysis. Our proprietary technology enables efficient partitioning of the digital and analog circuitry within the IC, creating the ability to tailor products to match the application requirements in a fraction of the area required by other non-configurable technologies.
Power management products, whether digitally controlled or analog, require world class analog process capability and design tools and methodologies to win in today’s markets. As a fabless semiconductor manufacturer, we have access to the broad range of wafer fabrication facilities that are driving innovation in analog process technology and have developed strong relationships with the world’s leading suppliers of analog and mixed-signal silicon. This access to leading edge process technology coupled with our ongoing investment in analog and mixed-signal design automation tools has made us competitive with the world’s leading manufacturers of analog power management products.
While we believe our programmable power products represent a fundamental change in the capability of power management devices, many of today’s products are better served by traditional analog power components. For these applications, we have a full line of non-programmable power products which utilize the same state-of-the-art analog circuitry and design tools as found in PowerXR products. Our portfolio of power products is focused on a range of solutions that offer power management, voltage conversion and LED control. In each area, we have delivered products that offer differentiating capabilities based on innovative circuit design and integration. We have built upon our strong heritage of analog and mixed-signal capability with the addition of proprietary technology, enabling the creation of world class products that will continue to evolve as our customers’ requirements become ever more complex. This differentiated, proprietary portfolio of power products
8
Table of Contents
has been developed with the goal to make power system design easy. In doing so, we seek to lower the cost and labor burden on our customers so that they do not need to become “power experts.” We enable them to focus on resolving their higher level system related challenges.
Strategy
We strive to be a leading provider of highly differentiated silicon, software and subsystem solutions for industrial, telecom, networking and storage applications. To achieve our long-term business objectives, we employ the following strategies:
Leverage Analog and Mixed-Signal Design Expertise to Provide Integrated System-Level Solutions—Utilizing our analog and mixed-signal design expertise, we integrate mixed-signal physical interface devices for a broad range of silicon solutions. This capability continues to be the backbone of our integration strategy and enables us to offer optimized solutions to the markets we serve. Our customers depend on analog and mixed-signal integration for power reduction, size optimization and signal integrity.
Expand Product Portfolio—We have developed a strong presence in the broad industrial, telecom, networking and storage markets where we have industry leading customers and proven technological capabilities. Our design expertise has enabled us to offer a diverse portfolio of both industry standard and proprietary products serving a range of connectivity and power management needs. Our extensive product portfolio provides the framework for customers to work with many of our products on a single board design. Our ability to serve the various needs of a customer’s system enables us to meet procurement and support needs by providing a single point of contact for applications support and supply chain management while reducing their number of vendors.
Grow Market Share with System Solutions—We create systems solutions by coupling system expertise, software and advanced silicon integration to provide an optimized solution that is designed to be technically compelling and cost effective, resulting in distinctive products like Tethys™, 10G Sonet Multiplexer (“Mux”)/DeMux, DX1700 and DX1800 Cards, Bitwackr data deduplication solutions and PowerXR. These solutions and others provide platform-level engagements that involve software and hardware integration, resulting in a cohesive bond with customers.
Strengthen and Expand Strategic OEM Relationships—To promote the early adoption of our solutions, we actively seek collaborative relationships with strategic OEMs during product development. We believe that OEMs recognize the value of our early involvement because designing their system products in parallel with our development can accelerate time-to-market for their end products. Collaborative relationships also help us to obtain early design wins and to increase the likelihood of market acceptance of our new products, while giving us the advantage of being the incumbent device provider on future generations of our customers’ platforms.
Use Standard CMOS and Bipolar CMOS-DMOS (“BCD”) Process Technologies to Provide Compelling Price/Performance Solutions—We design our products to be manufactured using standard CMOS and BCD processes. We believe that these processes are proven, stable and predictable and benefit from the extensive semiconductor-manufacturing infrastructure devoted to CMOS and BCD processes. In certain specialized cases, we may use other process technologies to take advantage of their performance characteristics.
Employ Fabless Semiconductor Model—We have long-standing relationships with third-party wafer foundries and assembly and test subcontractors to manufacture our ICs. Our fabless approach allows us to avoid substantial capital spending, obtain competitive pricing, minimize the negative effects of industry cycles, reduce time-to-market, reduce technology and product risks, and facilitate the migration of our products to new CMOS and BCD process technologies. By employing the fabless model, we can focus on our core competencies in product design, development and support as well as on sales and marketing.
Broaden Sales Coverage with Channel Partners—We have strong relationships with our distributors, catalog firms and sales representatives throughout the world representing a significant portion of our total
9
Table of Contents
revenue. Through our partners, we have access to large market segments that we cannot directly support. Through these relationships, we extend our expertise and product exposure by enabling our partners to discover new demands for our solutions as well as aid us in defining our next generation solutions.
Expand our Business Through Strategic Commercial Transactions—The markets in which we compete require a wide variety of technologies, products and capabilities. The combination of technological complexity and rapid change within our markets makes it difficult for a single company to develop all the solutions that it desires to offer within its family of products. Through acquisitions, we aim to deliver a broader range of products to customers in target markets. We employ the following strategies to address the need for new or enhanced products: we develop new technologies and products internally; we acquire field proven third-party intellectual property cores to accelerate time to market; and we acquire all or parts of other companies.
Sales and Customers
We market our products globally through both direct and indirect channels. In the United States, we are represented by 19 independent sales representatives and two independent, non-exclusive primary distributors, as well as our own direct sales organization. In addition, we are represented by three catalog distributors. We currently have domestic presences in or near Boston, Massachusetts; Chicago, Illinois; Dallas, Texas; Raleigh, North Carolina and Fremont, California.
Internationally, we are represented in Canada, Europe and Asia by our wholly-owned foreign subsidiaries and international support offices in Canada, China, France, Germany, Italy, Japan, Singapore, South Korea, Taiwan and the United Kingdom. In addition to these offices, approximately 37 independent sales representatives and other independent, non-exclusive distributors represent us. Information regarding the percentage of our net sales represented by certain geographies is as follows:
| Fiscal Years Ended | ||||||||||||
| March 27, 2011 |
March 28, 2010 |
March 29, 2009 |
||||||||||
| United States |
22 | % | 26 | % | 25 | % | ||||||
| China |
34 | % | 35 | % | 24 | % | ||||||
| Singapore |
10 | % | 11 | % | 13 | % | ||||||
| Japan |
6 | % | 5 | % | 6 | % | ||||||
| Germany |
9 | % | 1 | % | 3 | % | ||||||
| Europe (excluding Germany) |
7 | % | 13 | % | 19 | % | ||||||
| Rest of world |
12 | % | 9 | % | 10 | % | ||||||
| Total net sales |
100 | % | 100 | % | 100 | % | ||||||
We expect international sales to continue to be a significant portion of our net sales in the future. All of our sales to foreign entities are denominated in U.S. dollars. For a detailed description of our sales by geographic regions, see Part II, Item 7—“Management’s Discussion and Analysis of Financial Condition and Results of Operations, Net Sales by Geography” and Part II, Item 8—“Notes to Consolidated Financial Statement, Note 19—Segment and Geographic Information.” For a discussion of the risk factors associated with our foreign operations, see Part I, Item 1A—“Risk Factors—‘Our engagement with foreign customers could cause fluctuations in our operating results, which could materially and adversely impact our business, financial condition and results of operations’.”
10
Table of Contents
We sell our products to distributors and OEMs (or their designated subcontract manufacturers) throughout the world. No OEM customer accounted for 10% or more of our net sales in fiscal year 2011, 2010 or 2009. The following distributor accounted for over 10% of our net sales in the fiscal years indicated:
| Fiscal Years Ended | ||||||||||||
| March 27, 2011 |
March 28, 2010 |
March 29, 2009 |
||||||||||
| Future Electronics Inc. (“Future”) |
30 | % | 28 | % | 35 | % | ||||||
No other distributor accounted for 10% or more of our net sales in fiscal year 2011, 2010 or 2009.
We work directly with many key customers including, among others, Alcatel-Lucent, Cisco Systems Inc., Delta, EchoStar Corporation, EMC Corporation, Ericsson Inc., Fujitsu Limited, Hewlett-Packard Company, Huawei Technologies Co., Ltd., IBM Corporation, LG Electronics Inc., NEC Corporation, Nokia Siemens Networks, Pace, Panasonic Corporation, Parrot SA, Samsung Electronics Co. Ltd, Tellabs, Inc., United Telecom, and ZTE Corporation.
Manufacturing
We outsource all of our fabrication and assembly as well as the majority of our testing operations. This fabless manufacturing model allows us to focus on product design, development and support as well as on sales and marketing.
Our products are manufactured using standard CMOS, bipolar, BiCMOS (bipolar CMOS) and BCD process technologies. We use wafer foundries located in the United States and Asia to manufacture our semiconductor wafers.
Most of our semiconductor wafers are shipped directly from our foundries to our subcontractors in Asia for wafer test and assembly, where the wafers are cut into individual die and packaged. Independent contractors in China, Indonesia, Malaysia and Taiwan perform most of our assembly work. Final test and quality assurance are performed at our subcontractors’ facilities in Asia or at our Fremont, California facility. All of our primary manufacturing partners are certified to ISO 9001:2000 and are, or we expect soon will be, automotive specification TL16949 compliant.
We will continue to use the turnkey manufacturing model for our acquired Hifn and Galazar products currently in production, with our suppliers delivering fully assembled and tested products based on our proprietary designs.
Research and Development
We believe that ongoing innovation and introduction of new products in our targeted and adjacent markets is essential to sustaining growth. Our ability to compete depends on our ability to offer technologically innovative products on a timely basis. As performance demands and the complexity of ICs have increased, the design and development process has become a multi-disciplinary effort requiring diverse competencies. Our research and development is focused on developing high-performance analog, digital and mixed-signal solutions addressing the high-bandwidth requirements of communications and storage systems OEMs and the high-current, high-voltage requirements of interface and power management OEMs. We make investments in advanced design tools, design automation and high-performance intellectual property libraries while taking advantage of readily available specialty intellectual property through licensing or purchases. We also augment our skill sets and intellectual property through university collaboration, incorporating talent through acquisition and by accessing needed skills with off-campus design centers. We continue to pursue the development of design methodologies that are optimized for reducing design-cycle time and increasing the likelihood of first-time success. As a result of the Hifn acquisition, we now have a substantive research and development presence in the People’s Republic
11
Table of Contents
of China (“PRC”) and have a research and development presence in Canada resulting from our acquisitions of Galazar and Neterion. We invested an aggregate of $51.1 million, $48.5 million and $31.8 million on research and development in fiscal years 2011, 2010 and 2009, respectively. For further explanation of our increased expenses in research and development, please see Part II, Item 7—“Management’s Discussion and Analysis of Financial Condition and Results of Operations.”
Competition
The semiconductor industry is intensely competitive and is characterized by rapid technological change and a history of price reductions as design improvements and production efficiencies are achieved in successive generations of products. Although the market for analog and mixed-signal ICs is generally characterized by longer product life cycles and less dramatic price reductions than the market for digital ICs, we face substantial competition in each market in which we participate.
We believe that the principal competitive factors in the market segments in which we operate are:
| • | time-to-market; |
| • | product performance, quality, reliability and features; |
| • | customer support and services; |
| • | price; |
| • | rapid technological change; |
| • | number of design wins released to production; |
| • | lowering total system cost; |
| • | product innovation; and |
| • | compliance with and support of industry standards. |
We compete with many other companies and many of our current and potential competitors may have certain advantages over us such as:
| • | longer presence in key markets; |
| • | greater name recognition; |
| • | stronger financial position and liquidity; |
| • | more secure supply chain; |
| • | access to larger customer bases; |
| • | broader product offerings; |
| • | deeper engagement with customers; and |
| • | significantly greater sales, marketing, development, and other resources. |
Because IC markets are highly fragmented, we generally encounter different competitors in our various target markets. Competitors with respect to our communications products include Applied Micro Circuits Corporation, Integrated Device Technology, Inc., Maxim Integrated Products, Inc., Mindspeed Technologies, Inc., PMC-Sierra, Inc., TranSwitch Corporation and Vitesse Semiconductor Corporation. Competitors in the datacom and storage market include Cavium Networks, Netlogic Microsystems, Inc. and Comtech Telecommunications Corp. Competitors in the interface market include NXP B.V., Texas Instruments Incorporated, Analog Devices, Inc., Intersil Corporation, Linear Technology Corporation and Maxim Integrated Products, Inc. Our primary competitors with respect to our power products include Advanced Analogic
12
Table of Contents
Technologies Incorporated, Analog Devices, Inc., Intersil Corporation, Linear Technology Corporation, Maxim Integrated Products, Inc., Micrel Incorporated, National Semiconductor Corporation, On Semiconductor Corporation, Pioneer Corporation, Semtech Corporation, Sharp Electronics Corporation, Sony Corporation and Texas Instruments Incorporated. See Part I, Item 1A—“Risk Factors—‘If we are unable to compete effectively with existing or new competitors, we will experience fewer customer orders, reduced revenues, reduced gross margins and lost market share.’”
Backlog
Our sales are made pursuant to either purchase orders for current delivery of standard items or agreements covering purchases over a period of time, which are frequently subject to revisions and, to a lesser extent, cancellations with little or no penalties. Lead times for the release of purchase orders depend on the scheduling practices of the individual customer, and our rate of bookings varies from month-to-month. Certain distributors’ agreements allow for stock rotations, scrap allowances and volume discounts. Further, we defer recognition of revenue on shipments to certain distributors until the product is resold. For all of these reasons, we believe backlog as of any particular date should not be used as a predictor of future sales.
Intellectual Property Rights
To protect our intellectual property, we rely on a combination of patents, mask work registrations, trademarks, copyrights, trade secrets, and employee and third-party nondisclosure agreements. As of March 27, 2011, we have 211 patents issued and 30 patent applications pending in the United States and 79 patents issued and 162 patent applications pending in various foreign countries. Our existing patents will expire between 2012 and 2030, or sooner if we choose not to pay renewal fees. We may also enter into license agreements or other agreements to gain access to externally developed products or technologies. While our intellectual property is critically important, we do not believe that our current or future success is materially dependent upon any one patent.
Despite our protection efforts, we may fail to adequately protect our intellectual property. Others may gain access to our trade secrets or disclose such trade secrets to third parties without our knowledge. Some or all of our pending and future patent applications may not result in issued patents that provide us with a competitive advantage. Even if issued, such patents, as well as our existing patents, may be challenged and later determined to be invalid or unenforceable. Others may develop similar or superior products without access to or without infringing upon our intellectual property, including intellectual property that is protected by trade secret and patent rights. In addition, the laws of certain territories in which our products are or may be developed, manufactured or sold, including Asia, Europe, the Middle East and Latin America, may not protect our products and intellectual property rights to the same extent as the laws of the United States of America.
We cannot be sure that our products or technologies do not infringe patents that may be granted in the future pursuant to pending patent applications or that our products do not infringe any patents or proprietary rights of third parties. Occasionally, we are informed by third parties of alleged patent infringement. In the event that any relevant claims of third-party patents are found to be valid and enforceable, we may be required to:
| • | stop selling, incorporating or using our products that use the infringed intellectual property; |
| • | obtain a license to make, sell or use the relevant technology from the owner of the infringed intellectual property, although such license may not be available on commercially reasonable terms, if at all; or |
| • | redesign our products so as not to use the infringed intellectual property, which may not be technically or commercially feasible or meet customer requirements. |
If we are required to take any of the actions described above or defend against any claims from third parties, our business, financial condition and results of operations could be harmed. See Part I, Item 1A—“Risk Factors—‘We may be unable to protect our intellectual property rights, which could harm our competitive position’ and ‘We could be required to pay substantial damages or could be subject to various equitable remedies if it were proven that we infringed the intellectual property rights of others.’”
13
Table of Contents
Employees
As of March 27, 2011, we employed 477 full-time employees, with 247 in research and development, 75 in operations, 85 in marketing and sales and 70 in administration. Of the 477 employees, 173 are located in our international offices. See Part I, Item 1A—“Risk Factors—‘We depend in part on the continued service of our key engineering and management personnel and our ability to identify, hire, incentivize and retain qualified personnel. If we lose key employees or fail to identify, hire, incentivize and retain these individuals, our business, financial condition and results of operations could be materially and adversely impacted.’” None of our employees are represented by a collective bargaining agreement, and we have never experienced a work stoppage due to labor issues.
Executive Officers of the Registrant
Our executive officers and their ages as of May 27, 2011, are as follows:
| Name |
Age | Position | ||||
| Pedro (Pete) P. Rodriguez |
49 | Chief Executive Officer, President and Director | ||||
| George Apostol |
46 | Executive Vice President, Engineering and Operations and Chief Technology Officer | ||||
| Kevin Bauer |
51 | Vice President and Chief Financial Officer | ||||
| Chris Dingley |
51 | Executive Vice President of Worldwide Sales | ||||
| Diane Hill |
54 | Vice President, Human Resources | ||||
| Frank Marazita |
55 | Senior Vice President of Worldwide Operations and Reliability & Quality Assurance | ||||
| Thomas R. Melendrez |
57 | General Counsel, Secretary and Executive Vice President of Business Development | ||||
| Paul Pickering |
51 | Executive Vice President of Marketing | ||||
| Trong Vu |
58 | Chief Information Officer and Vice President of Information Technology | ||||
| Jiebing Wang |
43 | Vice President of Central Engineering and General Manager, China Development Center | ||||
Pedro (Pete) P. Rodriguez was appointed our Chief Executive Officer and President in April 2008. He has served as our director since October 2005. Mr. Rodriguez has over 25 years of engineering, sales, marketing and executive management experience in the semiconductor industry. Mr. Rodriguez served, most recently, from June 2007 to April 2008, as Chief Marketing Officer of Virage Logic Corporation, a semiconductor intellectual property supplier for Systems on a Chip (“SoC”). Prior to his appointment at Virage Logic, Mr. Rodriguez served as President, Chief Executive Officer and Director of Xpedion Design Systems, Inc., a private, venture-funded developer of design solutions for Radio Frequency Integrated Circuits (“RFIC”), from May 2000 to August 2006. Mr. Rodriguez held this role for six years until shortly after Xpedion was acquired by Agilent Technologies, Inc. in 2006. Prior to Xpedion, he held various senior management positions in sales and marketing at Escalade Corporation, a provider of software for chip design, and LSI Corporation (formerly LSI Logic Corporation), as well as design engineering, product management and process engineering positions at Aerojet Electronics, Teledyne Microwave and Siliconix Incorporated. Mr. Rodriguez holds an MBA from Pepperdine University, an MSEE from California Polytechnic University and a BS in Chemical Engineering from California Institute of Technology.
George Apostol was appointed our Executive Vice President, Engineering and Operations and Chief Technology Officer in March 2010. Prior to his appointment he was our Chief Technology Officer from May 2008 to February 2010. Mr. Apostol has over 20 years of experience in the systems electronics and semiconductor industries. From May 2005 to May 2008, Mr. Apostol served as Chief Technology Officer and Vice President of Engineering at PLX Technology, Inc., an integrated circuits company. Prior to that, Mr. Apostol was Vice President of Engineering at Audience, Inc., a supplier of audio software and semiconductor systems, from May 2004 to May 2005 and Vice President of Engineering at Brecis
14
Table of Contents
Communications Corporation, the inventor of the popular Multi-service Processor (MSP), from February 2000 to April 2004. Prior to that, he held various senior engineering and management positions at TiVo, Inc., LSI Corporation (formerly LSI Logic Corporation), Silicon Graphics, Inc. and Xerox Corporation. With a strong background designing systems on silicon, he holds several patents in the areas of system bus interface, clocking and buffer management design, and has written and deployed multiple Application-Specification Integrated Circuit (“ASIC”) design productivity tools. Mr. Apostol performed his academic research at the Dana Farber Cancer Institute and Massachusetts Institute of Technology Sloan School of Management and holds a BSEE from Massachusetts Institute of Technology.
Kevin Bauer was appointed our Vice President and Chief Financial Officer in June 2009. Prior to his appointment he was our Corporate Controller from August 2005 to June 2009 and was promoted to Vice President in December 2008. Before that Mr. Bauer was our Operations Controller from February 2001 to August 2005. Previously, Mr. Bauer was Operations Controller at WaferTech LLC (a joint venture semiconductor fabrication plant of Taiwan Semiconductor Manufacturing Company Limited, Altera Corporation, Analog Devices, Inc. and Integrated Silicon Solution, Inc.) from July 1997 to February 2001. Prior to WaferTech, he was at VLSI Technology for ten years where he held a variety of increasingly more senior finance roles culminating in his position as Director, Group Controller-Communications Group. Prior to that he held finance positions at Memorex and Bank of America. Mr. Bauer has over 23 years of finance experience in the semiconductor industry and received an MBA from Santa Clara University and a BS in Business Administration from California Lutheran University.
Chris Dingley was appointed our Executive Vice President of Worldwide Sales in April 2011. Mr. Dingley has over 25 years of semiconductor sales experience. Prior to his appointment at Exar, Mr. Dingley was Vice President of Worldwide Sales at Micrel, Inc., a manufacturer of IC solutions for analog, Ethernet and high bandwidth markets, from July 1997 to April 2011. During his 14 years with Micrel, Mr. Dingley held several additional positions including Director of West Sales and Global Accounts, and Director of Worldwide Channel Sales. Prior to joining Micrel, Mr. Dingley was Distribution Manager for Winbond North America, a supplier of memory ICs, from June 1996 to June 1997. Prior to Winbond, Mr. Dingley held the positions of Area Sales Manager and Distribution Sales Manager with General Instrument from August 1987 to June 1996. Mr. Dingley studied Marketing and Electrical Engineering Technology at Arizona State University.
Diane Hill was appointed our Vice President, Human Resources in April 2010. With over 25 years of human resources experience, including 17 in the semiconductor industry, Ms. Hill is responsible for developing and implementing all global and regional human resources policies and programs at Exar. Since joining us in September 2000, Ms. Hill has held various senior Human Resources positions prior to her current role, including Division Vice President, Director and Senior Manager. Previously, Ms. Hill held various management positions at Daisy Systems Corporation, a manufacturer of computer hardware and software for electronic design automation (EDA), from October 1987 to April 1990 and Teledyne MEC, a subsidiary of Teledyne Technologies, Inc., from August 1979 to October 1987. Ms. Hill holds a BA in Psychology from the University of California at Santa Barbara.
Frank Marazita joined us in March 2010 as our Senior Vice President of Worldwide Operations and Reliability & Quality Assurance. Mr. Marazita has over 30 years of experience in semiconductor manufacturing and his company experience ranges from new startups to well established entities giving him a broad range of skills. Prior to joining us, Mr. Marazita was owner and General Manager for Special-Ops Consulting, a consulting company, from March 2009 to March 2010. Prior to Special-Ops Consulting, Mr. Marazita was Vice President of Worldwide Operations and Finance at Analogix Semiconductor, a privately held fabless semiconductor company, from November 2005 to March 2009. Prior to Analogix, Mr. Marazita held the role of Vice President of Manufacturing and Operations at Brecis Communications Corporation from 2000 to 2005. Prior appointments include Vice President Operations for ATI Technology, HOTRAIL, and Exponential Technology. Additionally Mr. Marazita has held senior Engineering Management Roles at Sun Microsystems, Inc. and National Semiconductor Corporation. Mr. Marazita has been issued seven semiconductor patents and holds a BSEE from Michigan State University.
15
Table of Contents
Thomas R. Melendrez joined us in April 1986 as our Corporate Attorney. He was promoted to Director, Legal Affairs in July 1991, and again to Corporate Vice President, Legal Affairs in March 1993. In March 1996, he was promoted to Corporate Vice President, General Counsel and in June 2001, he was appointed Secretary. In April 2003, he was promoted to General Counsel, Secretary and Vice President of Business Development and in July 2005, he was promoted to Senior Vice President of Business Development. In April 2007, he was promoted to his current position as General Counsel, Secretary and Executive Vice President of Business Development. Mr. Melendrez has over 25 years of legal experience in the semiconductor and related industries and he received a BA from the University of Notre Dame, a JD from University of San Francisco and an MBA from Pepperdine University.
Paul Pickering was appointed our Executive Vice President of Marketing in March 2011. Prior to this appointment, he was our Executive Vice President of Sales and Marketing from March 2010 to March 2011 and our Senior Vice President of Marketing from June 2008 to February 2010. Mr. Pickering has over 28 years of semiconductor marketing and sales experience. Prior to joining us, Mr. Pickering was the Vice President of Field Operations for Innovative Silicon, a venture-capital funded company that developed a pioneering memory—Z-RAM®—technology for stand-alone DRAM and embedded memory applications, from March 2007 to June 2008. Prior to Innovative Silicon, Mr. Pickering was executive vice-president of sales and marketing of Xpedion Design Systems, Inc., a private, venture-funded developer of design solutions for RFIC acquired by Agilent Technologies, Inc. in 2006, from May 2003 to March 2007. Prior to this position, Mr. Pickering worked in senior management sales and marketing roles at Fairchild Semiconductor, Inc., Toshiba America, Inc., LSI Corporation (formerly LSI Logic Corporation), and PMC-Sierra, Inc. Mr. Pickering received a BS in Social Science from the West Chester University of Pennsylvania.
Trong Vu joined us in October 2007 as our Chief Information Officer and Vice President of Information Technology. Mr. Vu has over 25 years of experience with leading semiconductor companies. Prior to joining us, Mr. Vu was founder, CIO and Information Systems consultant of EGIS Systems Inc., a network security company, from April 2002 to October 2007. Prior to EGIS Systems Inc., Mr. Vu held the role of Vice President of Information Technology at Mattson Technology Inc., a designer and manufacturer of semiconductor wafer processing equipment, from 2000 to 2002. Additionally Mr. Vu was Director of IT at LSI Logic and National Semiconductor Corporation from 1981 to 2000. Mr. Vu has a broad background in system integration as well as developing enterprise software. Mr. Vu has also been involved in building computer centers and infrastructure needed for companies to effectively run their worldwide information systems. Mr. Vu received his Bachelor of Information System Management degree from University of San Francisco.
Jiebing Wang was appointed our Vice President of Central Engineering and General Manager, China Development Center in March 2011. Dr. Wang initially joined us in April 2009 as our Vice President of Acceleration Technology and General Manager, China Development Center after the completion of our acquisition of Hifn. Dr. Wang joined Hifn in March 2004 as President of Hifn’s China Operations based in Hangzhou and was promoted to Vice President of Worldwide Engineering and General Manager of Hifn’s China Product Operations in March 2007. Before joining Hifn, Dr. Wang was a founder and CTO of Hangzhou C-Sky Microsystems from 2002 to 2004, where he led the development of a high performance 32-bit embedded CPU. Dr. Wang has held technical positions with Nishan Systems, Philips Semiconductors and Toshiba America from 1998 to 2002. Dr. Wang has extensive technical experiences in the area of networking, security and embedded systems. Dr. Wang earned his Ph.D. in physics from the University of Nevada, and a master’s degree in electrical engineering from Stanford University.
Available Information
We file electronically with the Securities and Exchange Commission (“SEC”) our Annual Reports on Form 10-K, Quarterly Reports on Form 10-Q, current Reports on Form 8-K, and amendments to those Reports pursuant to Section 13 or 15(d) of the Securities Exchange Act of 1934. Those reports and statements: (1) may be read and copied at the SEC’s public reference room at 100 F Street, N.E., Washington, DC 20549, (2) are available at the SEC’s Internet site (http://www.sec.gov), which contains reports, proxy and information
16
Table of Contents
statements and other information regarding issuers that file electronically with the SEC; and (3) are available free of charge through our website (www.exar.com) as soon as reasonably practicable after electronic filing with, or furnishing to, the SEC. Information regarding the operation of the SEC’s public reference room may be obtained by calling the SEC at 1-800-SEC-0330. Copies of such documents may be requested by contacting our Investor Relations Department at (510) 668-7201 or by sending an e-mail through the Investor Relations page on our website. Information on our website is not incorporated by reference into this Report.
| ITEM 1A. | RISK FACTORS |
Global capital, credit market, employment, and general economic conditions, and resulting declines in consumer confidence and spending, could have a material adverse effect on our business, operating results and financial condition.
Periodic declines or fluctuations in the U.S. dollar, corporate results of operations, interest rates, inflation or deflation, the global impact of sovereign debt, economic trends, actual or feared economic recessions, lower spending, the impact of conflicts throughout the world, terrorist acts, natural disasters (such as the recent earthquake and tsunami in Japan), volatile energy costs, the outbreak of communicable diseases and other geopolitical factors, have had, and may continue to have, a negative impact on the U.S. and global economies. Volatility and disruption in the global capital and credit markets have led to a tightening of business credit and liquidity, a contraction of consumer credit, business failures, higher unemployment, and declines in consumer confidence and spending in the U.S. and internationally. If global economic and financial market conditions deteriorate or remain weak for an extended period of time, many related factors could have a material adverse effect on our business, operating results, and financial condition, including the following:
| • | slower spending by consumers and market fluctuations may result in reduced demand for our products, reduced orders for our products, order cancellations, lower revenues, increased inventories, and lower gross margins; |
| • | if we undertake restructuring activities due to economic pressure, we cannot guarantee that any of our restructuring efforts will be successful, or that we will be able to realize the cost savings and other anticipated benefits from our previous or future restructuring plans, in addition, if we reduce our workforce, it may adversely impact our ability to respond rapidly to new growth opportunities; |
| • | we may be unable to predict the strength or duration of market conditions or the effects of consolidation of our customers in their industries, which may result in project delays or cancellations; |
| • | we may be unable to find suitable investments that are safe or liquid, or that provide a reasonable return resulting in lower interest income or longer investment horizons, and disruptions to capital markets or the banking system may also impair the value of investments or bank deposits we currently consider safe or liquid; |
| • | the failure of financial institution counterparties to honor their obligations to us under credit instruments could jeopardize our ability to rely on and benefit from those instruments, and our ability to replace those instruments on the same or similar terms may be limited under poor market conditions; |
| • | continued volatility in the markets and prices for commodities, such as gold, and raw materials we use in our products and in our supply chain could have a material adverse effect on our costs, gross margins, and profitability; |
| • | if distributors of our products experience declining revenues, or experience difficulty obtaining financing in the capital and credit markets to purchase our products, or experience severe financial difficulty, it could result in insolvency, reduced orders for our products, order cancellations, inability to timely meet payment obligations to us, extended payment terms, higher accounts receivable, reduced cash flows, greater expenses associated with collection efforts, and increased bad debt expenses; |
| • | if contract manufacturers or foundries of our products or other participants in our supply chain experience difficulty obtaining financing in the capital and credit markets to purchase raw materials or to finance general working capital needs, it may result in delays or non-delivery of shipments of our products; |
17
Table of Contents
| • | potential shutdowns or over capacity constraints by our third-party foundries or assembly and test subcontractors could result in longer lead-times, higher buffer inventory levels and degraded on-time delivery performance; and |
| • | the current macroeconomic environment also limits our visibility into future purchases by our customers and renewals of existing agreements, which may necessitate changes to our business model. |
Our financial results may fluctuate significantly because of a number of factors, many of which are beyond our control.
Our financial results may fluctuate significantly as a result of a number of factors, many of which are difficult or impossible to control or predict, which include:
| • | the continuing effects of the recent economic downturn; |
| • | the cyclical nature of the semiconductor industry; |
| • | difficulty in predicting revenues and ordering the correct mix of products from suppliers due to limited visibility provided by customers and channel partners; |
| • | changes in the mix of product sales as our margins vary by product; |
| • | fluctuations in the capitalization of unabsorbed fixed manufacturing costs; |
| • | the impact of our revenue recognition policies on reported results; and |
| • | the reduction, rescheduling, cancellation or timing of orders by our customers, distributors and channel partners due to, among others, the following factors: |
| • | management of customer, subcontractor and/or channel inventory; |
| • | delays in shipments from our subcontractors causing supply shortages; |
| • | inability of our subcontractors to provide quality products, in adequate quantities and in a timely manner; |
| • | dependency on a single product with a single customer and/or distributor; |
| • | volatility of demand for equipment sold by our large customers, which in turn, introduces demand volatility for our products; |
| • | disruption in customer demand as customers change or modify their complex subcontract manufacturing supply chain; |
| • | disruption in customer demand due to technical or quality issues with our devices or components in their system; |
| • | the inability of our customers to obtain components from their other suppliers; |
| • | disruption in sales or distribution channels; |
| • | our ability to maintain and expand distributor relationships; |
| • | changes in sales and implementation cycles for our products; |
| • | the ability of our suppliers and customers to remain solvent, obtain financing or fund capital expenditures as a result of the recent global economic slowdown; |
| • | risks associated with entering new markets; |
| • | the announcement or introduction of products by our existing competitors or new competitors; |
| • | loss of market share by our customers; |
| • | competitive pressures on selling prices or product availability; |
18
Table of Contents
| • | pressures on selling prices overseas due to foreign currency exchange fluctuations; |
| • | erosion of average selling prices coupled with the inability to sell newer products with higher average selling prices, resulting in lower overall revenue and margins; |
| • | delays in product design releases; |
| • | market and/or customer acceptance of our products; |
| • | consolidation among our competitors, our customers and/or our customers’ customers; |
| • | changes in our customers’ end user concentration or requirements; |
| • | loss of one or more major customers; |
| • | significant changes in ordering pattern by major customers; |
| • | our or our channel partners’ ability to maintain and manage appropriate inventory levels; |
| • | the availability and cost of materials and services, including foundry, assembly and test capacity, needed by us from our foundries and other manufacturing suppliers; |
| • | disruptions in our or our customers’ supply chain due to natural disasters, fire, outbreak of communicable diseases, labor disputes, civil unrest or other reasons; |
| • | delays in successful transfer of manufacturing processes to our subcontractors; |
| • | fluctuations in the manufacturing output, yields, and capacity of our suppliers; |
| • | fluctuation in suppliers’ capacity due to reorganization, relocation or shift in business focus, financial constraints, or other reasons; |
| • | problems, costs, or delays that we may face in shifting our products to smaller geometry process technologies and in achieving higher levels of design and device integration; |
| • | our ability to successfully introduce and transfer into production new products and/or integrate new technologies; |
| • | increased manufacturing costs; |
| • | higher mask tooling costs associated with advanced technologies; and |
| • | the amount and timing of our investment in research and development; |
| • | costs and business disruptions associated with stockholder or regulatory issues; |
| • | the timing and amount of employer payroll tax to be paid on our employees’ gains on exercise of stock options; |
| • | an inability to generate profits to utilize net operating losses; |
| • | increased costs and time associated with compliance with new accounting rules or new regulatory requirements; |
| • | changes in accounting or other regulatory rules, such as the requirement to record assets and liabilities at fair value; |
| • | write-offs of some or all of our goodwill and other intangible assets; |
| • | fluctuations in interest rates and/or market values of our marketable securities; |
| • | litigation costs associated with the defense of suits brought or complaints made against us; and |
| • | changes in or continuation of certain tax provisions. |
19
Table of Contents
Our expense levels are based, in part, on expectations of future revenues and are, to a large extent, fixed in the short-term. Our revenues are difficult to predict and at times we have failed to achieve revenue expectations. We may be unable to adjust spending in a timely manner to compensate for any unexpected revenue shortfall. If revenue levels are below expectations for any reason, our business, financial condition and results of operations could be materially and adversely impacted.
As of March 27, 2011, Soros Fund Management LLC, as principal investment manager for Quantum Partners LP (“Soros”), beneficially owned approximately 15% of our common stock, and affiliates of Future, Alonim Investments Inc. and two of its affiliates (collectively “Alonim”), beneficially owned approximately 17% of our common stock. As such, Alonim and Soros are our largest stockholders. These substantial ownership positions enable Alonim and Soros to significantly influence matters requiring stockholder approval, which may or may not be in our best interests or the interest of our other stockholders. In addition, Alonim is an affiliate of Future and an executive officer of Future is on our board of directors, which could lead to actual or perceived influence from Future.
Alonim and Soros each own a significant percentage of our outstanding shares. Due to such ownership, Alonim and Soros, acting independently or jointly, may be able to exert strong influence over actions requiring the approval of our stockholders, including the election of directors, many types of change of control transactions and amendments to our charter documents. Further, if one of these stockholders were to sell or even propose to sell a large number of their shares, the market price of our common stock could decline significantly.
Although we have no reason to believe it to be the case, the interests of these significant stockholders could conflict with our best interests or the interests of the other stockholders. For example, the significant ownership percentages of these two stockholders could have the effect of delaying or preventing a change of control or otherwise discouraging a potential acquirer from obtaining control of us, regardless of whether the change of control is supported by us and our other stockholders. Conversely, by virtue of their percentage ownership of our stock, Alonim and/or Soros could facilitate a takeover transaction that our board of directors and/or a significant portion of our other stockholders did not approve.
Further, Alonim is an affiliate of Future, our largest distributor, and Pierre Guilbault, the chief financial officer of Future, is a member of our board of directors. These relationships could also result in actual or perceived attempts to influence management to take actions beneficial to Future which may or may not be beneficial to us or in our best interests. Future could attempt to obtain terms and conditions more favorable than those we would typically provide our distributors because of its relationship with us. Any such actual or perceived preferential treatment could materially and adversely affect our business, financial condition and results of operations.
Our fixed operating expenses and practice of ordering materials in anticipation of projected customer demand could make it difficult for us to respond effectively to sudden swings in demand and result in higher than expected costs and excess inventory. Such sudden swings in demand could therefore have a material adverse impact on our business, financial condition and results of operations.
Our operating expenses are relatively fixed in the short to medium term, and therefore, we have limited ability to reduce expenses quickly and sufficiently in response to any revenue shortfall. In addition, we typically plan our production and inventory levels based on forecasts of customer demand, which is highly unpredictable and can fluctuate substantially. From time to time, in response to anticipated long lead times to obtain inventory and materials from our outside suppliers and foundries, we may order materials in advance of anticipated customer demand. This advance ordering may result in excess inventory levels or unanticipated inventory write-downs if expected orders fail to materialize. This incremental cost could have a materially adverse impact on our business, financial condition and results of operations.
20
Table of Contents
If we fail to develop, introduce or enhance products that meet evolving market needs or which are necessitated by technological advances, or we are unable to grow revenues, then our business, financial condition and results of operations could be materially and adversely impacted.
The markets for our products are characterized by a number of factors, some of which are listed below:
| • | changing or disruptive technologies; |
| • | evolving and competing industry standards; |
| • | changing customer requirements; |
| • | increasing price pressure; |
| • | increasing product development costs; |
| • | long design-to-production cycles; |
| • | competitive solutions; |
| • | fluctuations in capital equipment spending levels and/or deployment; |
| • | rapid adjustments in customer demand and inventory; |
| • | increasing functional integration; |
| • | moderate to slow growth; |
| • | frequent product introductions and enhancements; |
| • | changing competitive landscape (consolidation, financial viability); and |
| • | finite market windows for product introductions. |
Our growth depends in part on our successful continued development and customer acceptance of new products for our core markets. We must: (i) anticipate customer and market requirements and changes in technology and industry standards; (ii) properly define and develop new products on a timely basis; (iii) gain access to and use technologies in a cost-effective manner; (iv) have suppliers produce quality products; (v) continue to expand our technical and design expertise; (vi) introduce and cost-effectively manufacture new products on a timely basis; (vii) differentiate our products from our competitors’ offerings; and (viii) gain customer acceptance of our products. In addition, we must continue to have our products designed into our customers’ future products and maintain close working relationships with key customers to define and develop new products that meet their evolving needs. Moreover, we must respond in a rapid and cost-effective manner to shifts in market demands, to increased functional integration and other changes. Migration from older products to newer products may result in volatility of earnings as revenues from older products decline and revenues from newer products begin to grow.
Products for our customers’ applications are subject to continually evolving industry standards and new technologies. Our ability to compete will depend in part on our ability to identify and ensure compliance with these industry standards. The emergence of new standards could render our products incompatible. We could be required to invest significant time, effort and expense to develop and qualify new products to ensure compliance with industry standards.
The process of developing and supporting new products is complex, expensive and uncertain, and if we fail to accurately predict and understand our customers’ changing needs and emerging technological trends, our business, financial condition and results of operations may be harmed. In addition, we may make significant investments to modify new products according to input from our customers who may choose a competitor’s or an internal solution, or cancel their projects. We may not be able to identify new product opportunities successfully, develop and bring to market new products, achieve design wins, ensure when and which design wins actually get
21
Table of Contents
released to production, or respond effectively to technological changes or product announcements by our competitors. In addition, we may not be successful in developing or using new technologies or may incorrectly anticipate market demand and develop products that achieve little or no market acceptance. Our pursuit of technological advances may require substantial time and expense and may ultimately prove unsuccessful. Failure in any of these areas may materially and adversely harm our business, financial condition and results of operations.
We have made and in the future may make acquisitions and significant strategic equity investments, which may involve a number of risks. If we are unable to address these risks successfully, such acquisitions and investments could have a materially adverse effect on our business, financial condition and results of operations.
We have recently undertaken a number of strategic acquisitions, have made strategic investments in the past, and may make further strategic acquisitions and investments from time to time in the future. The risks involved with these acquisitions and investments include:
| • | the possibility that we may not receive a favorable return on our investment or incur losses from our investment or the original investment may become impaired; |
| • | revenues or synergies could fall below projections or fail to materialize as assumed; |
| • | failure to satisfy or set effective strategic objectives; |
| • | the opportunity cost associated with committing capital in such transactions; |
| • | the possibility of litigation arising from these transactions; |
| • | our assumption of known or unknown liabilities or other unanticipated events or circumstances; and |
| • | the diversion of management’s attention from day-to-day operations of the business and the resulting potential disruptions to the ongoing business. |
Additional risks involved with acquisitions include:
| • | difficulties in integrating and managing various functional areas such as sales, engineering, marketing, and operations; |
| • | difficulties in incorporating or leveraging acquired technologies and intellectual property rights in new products; |
| • | difficulties or delays in the transfer of manufacturing flows and supply chains of products of acquired businesses; |
| • | failure to retain and integrate key personnel; |
| • | failure to retain and maintain relationships with existing customers, distributors, channel partners and other parties; |
| • | failure to manage and operate multiple geographic locations both effectively and efficiently; |
| • | failure to coordinate research and development activities to enhance and develop new products and services in a timely manner that optimize the assets and resources of the combined company; |
| • | difficulties in creating uniform standards, controls (including internal control over financial reporting), procedures, policies and information systems; |
| • | unexpected capital equipment outlays and continuing expenses related to technical and operational integration; |
| • | difficulties in entering markets or retaining current markets in which we have limited or no direct prior experience and where competitors in such markets may have stronger market positions; |
22
Table of Contents
| • | insufficient revenues to offset increased expenses associated with acquisitions; |
| • | under-performance problems with an acquired company; |
| • | issuance of common stock that would dilute our current stockholders’ percentage ownership; |
| • | reduction in liquidity and interest income on lower cash balances; |
| • | recording of goodwill and intangible assets that will be subject to periodic impairment testing and potential impairment charges against our future earnings; |
| • | incurring amortization expenses related to certain intangible assets; and |
| • | incurring large and immediate write-offs of assets. |
Strategic equity investments also involve risks associated with third parties managing the funds and the risk of poor strategic choices or execution of strategic and operating plans.
We may not address these risks successfully without substantial expense, delay or other operational or financial problems, or at all. Any delays or other such operations or financial problems could materially and adversely impact our business, financial condition and results of operations.
If we are unable to convert a significant portion of our design wins into revenue, our business, financial condition and results of operations could be materially and adversely impacted.
We continue to secure design wins for new and existing products. Such design wins are necessary for revenue growth. However, many of our design wins may never generate revenues if their end-customer projects are unsuccessful in the market place or the end-customer terminates the project, which may occur for a variety of reasons. Mergers, consolidations or cost reduction activities among our customers may lead to termination of certain projects before the associated design win generates revenue. If design wins do generate revenue, the time lag between the design win and meaningful revenue is typically between six months to greater than eighteen months. If we fail to convert a significant portion of our design wins into substantial revenue, our business, financial condition and results of operations could be materially and adversely impacted. Under recent deteriorating global economic conditions, our design wins could be delayed even longer than the typical lag period and our eventual revenue could be less than anticipated from products that were introduced within the last eighteen to thirty-six months, which would likely materially and adversely affect our business, financial condition and results of operations.
The complexity of our products may lead to errors, defects and bugs, which could subject us to significant costs or damages and adversely affect market acceptance of our products.
Although we, our customers and our suppliers rigorously test our products, they may contain undetected errors, performance weaknesses, defects or bugs when first introduced or as new versions are released. If any of our products contain production defects or reliability, quality or compatibility problems that are significant to our customers, our reputation may be damaged and customers may be reluctant to continue to buy our products, which could adversely affect our ability to retain and attract new customers. In addition, these defects or bugs could interrupt or delay sales of affected products, which could materially and adversely affect our business, financial condition and results of operations.
If defects or bugs are discovered after commencement of commercial production, we may be required to make significant expenditures of capital and other resources to resolve the problems. This could result in significant additional development costs and the diversion of technical and other resources from our other development efforts. We could also incur significant costs to repair or replace defective products or may agree to be liable for certain damages incurred. These costs or damages could have a material adverse effect on our business, financial condition and results of operations.
23
Table of Contents
We derive a substantial portion of our revenues from distributors, especially from our two primary distributors, Future Electronics Inc. (“Future”), a related party, and Nu Horizons Electronics Corp. (“Nu Horizons”). Our revenues would likely decline significantly if our primary distributors elected not to promote or sell our products or if they elected to cancel, reduce or defer purchases of our products.
Future and Nu Horizons have historically accounted for a significant portion of our revenues, and they are our two primary distributors worldwide. We anticipate that sales of our products to these distributors will continue to account for a significant portion of our revenues. The loss of either Future or Nu Horizons as a distributor, for any reason, or a significant reduction in orders from either of them would materially and adversely affect our business, financial condition and results of operations.
Sales to Future and Nu Horizons are made under agreements that provide protection against price reduction for their inventory of our products. As such, we could be exposed to significant liability if the inventory value of the products held by Future and Nu Horizons declined dramatically. Our distributor agreements with Future and Nu Horizons do not contain minimum purchase commitments. As a result, Future and Nu Horizons could cease purchasing our products with short notice or cease distributing these products. In addition, they may defer or cancel orders without penalty, which would likely cause our revenues to decline and materially and adversely impact our business, financial condition and results of operations.
In January 2011 Arrow Electronics, Inc. acquired Nu Horizons. It is uncertain at this point what effect, if any, the acquisition may have on our relationship with the combined company going forward. As Nu Horizons is currently one of our two primary distributors, if the relationship were to be terminated or altered in an unfavorable fashion, it could result in a material and adverse effect on our business, financial condition and/or results of operations.
If we are unable to accurately forecast demand for our products, we may be unable to efficiently manage our inventory.
Due to the absence of substantial non-cancelable backlog, we typically plan our production and inventory levels based on customer forecasts, internal evaluation of customer demand and current backlog, which can fluctuate substantially. As a consequence of inaccuracies inherent in forecasting, inventory imbalances periodically occur that result in surplus amounts of some of our products and shortages of others. Such shortages can adversely impact customer relations and surpluses can result in larger-than-desired inventory levels, either of which can materially and adversely impact our business, financial condition and results of operations. Due to the unpredictability of global economic conditions and increased difficulty in forecasting demand for our products, we could experience an increase in inventory levels.
In instances where we have hub agreements with certain vendors, the inability of our partners to provide accurate and timely information regarding inventory and related shipments of the inventory may impact our ability to maintain the proper amount of inventory at the hubs, forecast usage of the inventory and record accurate revenue recognition which could materially and adversely impact our business, financial conditions and the results of operations.
If our distributors or sales representatives stop selling or fail to successfully promote our products, our business, financial condition and results of operations could be materially and adversely impacted.
We sell many of our products through sales representatives and distributors, many of which sell directly to OEMs, contract manufacturers and end customers. Our non-exclusive distributors and sales representatives may carry our competitors’ products, which could adversely impact or limit sales of our products. Additionally, they could reduce or discontinue sales of our products or may not devote the resources necessary to sell our products in the volumes and within the time frames that we expect. Our agreements with distributors contain limited provisions for return of our products, including stock rotations whereby distributors may return a percentage of
24
Table of Contents
their purchases from us based upon a percentage of their most recent three or six months of shipments. In addition, in certain circumstances upon termination of the distributor relationship, distributors may return some portion of their prior purchases. The loss of business from any of our significant distributors or the delay of significant orders from any of them, even if only temporary, could materially and adversely impact our business, financial conditions and results of operations.
Moreover, we depend on the continued viability and financial resources of these distributors and sales representatives, some of which are small organizations with limited working capital. In turn, these distributors and sales representatives are subject to general economic and semiconductor industry conditions. We believe that our success will continue to depend on these distributors and sales representatives. If some or all of our distributors and sales representatives experience financial difficulties, or otherwise become unable or unwilling to promote and sell our products, our business, financial condition and results of operations could be materially and adversely impacted.
Our distributors rely heavily on the availability of short-term capital at reasonable rates to fund their ongoing operations. If this capital is not available, or is only available on onerous terms, certain distributors may not be able to pay for inventory received or we may experience a reduction in orders from these distributors, which would likely cause our revenue to decline and materially and adversely impact our business, financial condition and results of operations.
We depend in part on the continued service of our key engineering and management personnel and our ability to identify, hire, incentivize and retain qualified personnel. If we lose key employees or fail to identify, hire, incentivize and retain these individuals, our business, financial condition and results of operations could be materially and adversely impacted.
Our future success depends, in part, on the continued service of our key design engineering, technical, sales, marketing and executive personnel and our ability to identify, hire, motivate and retain other qualified personnel.
Under certain circumstances, including a company acquisition or business downturn, current and prospective employees may experience uncertainty about their future roles with us. Volatility or lack of positive performance in our stock price and the ability to offer equity compensation to as many key employees or in amounts consistent with market practices, as a result of regulations regarding the expensing of equity awards, may also adversely affect our ability to retain key employees, all of whom have been granted equity awards. In addition, competitors may recruit our employees, as is common in the high tech sector. If we are unable to retain personnel that are critical to our future operations, we could face disruptions in operations, loss of existing customers, loss of key information, expertise or know-how, and unanticipated additional recruiting and training costs.
Competition for skilled employees having specialized technical capabilities and industry-specific expertise is intense and continues to be a considerable risk inherent in the markets in which we compete. At times, competition for such employees has been particularly notable in California, Canada and the People’s Republic of China (“PRC”). Further, the PRC historically has different managing principles from Western style management and financial reporting concepts and practices, as well as different banking, computer and other control systems, making the successful identification and employment of qualified personnel particularly important, and hiring and retaining a sufficient number of such qualified employees may be difficult. As a result of these factors, we may experience difficulty in establishing management, legal and financial controls, collecting financial data, books of account and records and instituting business practices that meet Western standards, which could materially and adversely impact our business, financial condition and results of operations.
Our employees are employed at-will, which means that they can terminate their employment at any time. Our international locations are subject to local labor laws, which are often significantly different from U.S. labor laws and which may under certain conditions result in large separation costs upon termination. The failure to
25
Table of Contents
recruit and retain, as necessary, key design engineers and technical, sales, marketing and executive personnel could materially and adversely impact our business, financial condition and results of operations.
Stock-based awards are critical to our ability to recruit, retain and motivate highly skilled talent. In making employment decisions, particularly in the semiconductor industry and the geographies where our employees are located, a key consideration of current and potential employees is the value of the equity awards they receive in connection with their employment. If we are unable to offer employment packages with a competitive equity award component, our ability to attract highly skilled employees would be harmed. In addition, volatility in our stock price could result in a stock option’s exercise price exceeding the market value of our common stock or a deterioration in the value of restricted stock units granted, thus lessening the effectiveness of stock-based awards for retaining and motivating employees. Similarly, decreases in the number of unvested in-the-money stock options held by existing employees, whether because our stock price has declined, options have vested, or because the size of follow-on option grants has declined, may make it more difficult to retain and motivate employees. Consequently, we may not continue to successfully attract and retain key employees, which could have an adverse effect on our business, financial condition and results of operations.
Occasionally, we enter into agreements that expose us to potential damages that exceed the value of the agreement.
We have given certain customers increased indemnification for product deficiencies or intellectual property infringement that is in excess of our standard limited warranty and indemnification provision and could possibly result in greater costs, in excess of the original contract value. In an attempt to limit this liability, we have purchased an errors and omissions insurance policy to partially offset these potential additional costs; however, our insurance coverage could be insufficient in terms of amount and/or coverage to prevent us from suffering material losses if the indemnification amounts are large enough or if there are coverage issues.
We may be exposed to additional credit risk as a result of the addition of significant direct customers through recent acquisitions.
From time to time one of our customers has contributed more than 10% of our quarterly net sales. A number of our customers are OEMs, or the manufacturing subcontractors of OEMs, which might result in an increase in concentrated credit risk with respect to our trade receivables and therefore, if a large customer were to be unable to pay, it could materially and adversely impact our business, financial condition and results of operations.
Any error in our sell-through revenue recognition judgment or estimates could lead to inaccurate reporting of our net sales, gross profit, deferred income and allowances on sales to distributors and net income.
Sell-through revenue recognition is highly dependent on receiving pertinent and accurate data from our distributors in a timely fashion. Distributors provide us periodic data regarding the product, price, quantity, and end customer when products are resold as well as the quantities of our products they still have in stock. We must use estimates and apply judgment to reconcile distributors’ reported inventories to their activities. Any error in our judgment could lead to inaccurate reporting of our net sales, gross profit, deferred income and allowances on sales to distributors and net income, which could have an adverse effect on our business, financial condition and results of operations.
Because a significant portion of our total assets were, and may again be with future potential acquisitions, represented by goodwill and other intangible assets, which are subject to mandatory annual impairment evaluations, we could be required to write-off some or all of our goodwill and other intangible assets, which may materially and adversely impact our business, financial condition and results of operations.
A significant portion of the purchase price for any business combination may be allocated to identifiable tangible and intangible assets and assumed liabilities based on estimated fair values at the date of consummation. As required by U.S Generally Accepted Accounting Principles (“GAAP”), the excess purchase price, if any, over
26
Table of Contents
the fair value of these assets less liabilities typically would be allocated to goodwill. We evaluate goodwill for impairment on an annual basis or whenever events and changes in circumstances suggest that the carrying amount may not be recoverable. We typically conduct our annual analysis of our goodwill in the fourth quarter of our fiscal year. An in-process research and development (“IPR&D”) asset is considered an indefinite-lived intangible asset and is not subject to amortization until the conclusion of development. IPR&D assets must be tested for impairment annually or more frequently if events or changes in circumstances indicate that the asset might be impaired. The impairment test consists of a comparison of the fair value of the IPR&D asset with its carrying amount. If the carrying amount of the IPR&D asset exceeds its fair value, an impairment loss must be recognized in an amount equal to that excess. After an impairment loss is recognized, the adjusted carrying amount of the IPR&D asset will be its new accounting basis. If the fair value of the IPR&D asset exceeds the carrying amount, no adjustment is recorded. Subsequent reversal of a previously recognized impairment loss is prohibited. Once the IPR&D projects have been completed, the useful life of the IPR&D asset is determined and amortized accordingly. If the IPR&D project is abandoned, the carrying amount of the IPR&D project is written off. Intangible assets that are subject to amortization are reviewed for impairment on an annual basis or whenever events and changes in circumstances suggest that the carrying amount may not be recoverable.
The assessment of goodwill and other intangible assets impairment is a subjective process. Estimations and assumptions regarding future performance, results of our operations and comparability of our market capitalization and its net book value will be used. Changes in estimates and assumptions could impact fair value resulting in an impairment, which could materially and adversely impact our business, financial condition and results of operations.
Our business may be materially and adversely impacted if we fail to effectively utilize and incorporate acquired technology.
We have acquired and may in the future acquire intellectual property in order to accelerate our time to market for new products. Acquisitions of intellectual property may involve risks relating to, among other things, successful technical integration into new products, market acceptance of new products and achievement of planned return on investment. Successful technical integration in particular requires a variety of resources which we may not currently have, such as available technical staff with sufficient time to devote to integration, the requisite skill sets to understand the acquired technology and the necessary support tools to effectively utilize the technology. The timely and efficient integration of acquired technology may be adversely impacted by inherent design deficiencies or application requirements. The potential failure of or delay in product introduction utilizing acquired intellectual property could lead to an impairment of capitalized intellectual property acquisition costs, which could materially and adversely impact our business, financial condition and results of operations.
If we are unable to compete effectively with existing or new competitors, we will experience fewer customer orders, reduced revenues, reduced gross margins and lost market share.
We compete in markets that are intensely competitive, and which are subject to both rapid technological change, continued price erosion and changing business terms with regard to risk allocation. Our competitors include many large domestic and foreign companies that have substantially greater financial, technical and management resources, name recognition and leverage than we have. As a result, they may be able to adapt more quickly to new or emerging technologies and changes in customer requirements or to devote greater resources to promote the sale of their products.
We have experienced increased competition at the design stage, where customers evaluate alternative solutions based on a number of factors, including price, performance, product features, technologies, and availability of long-term product supply and/or roadmap guarantee. Additionally, we experience, in some cases, severe pressure on pricing from some of our competitors or on-going cost reduction expectations from customers. Such circumstances may make some of our products unattractive due to price or performance measures and result in losing our design opportunities or causing a decrease in our revenue and margins. Also, competition from new companies in emerging economy countries with significantly lower costs could affect our selling price and gross
27
Table of Contents
margins. In addition, if competitors in Asia reduce prices on commodity products, it would adversely affect our ability to compete effectively in that region. Specifically, we have licensed rights to Hangzhou Silan Microelectronics Co. Ltd. and Hangzhou Silan Integrated Circuit Co. Ltd. (collectively “Silan”) in China to market our commodity interface products that could reduce our sales in the future should they become a meaningful competitor. Loss of competitive position could result in price reductions, fewer customer orders, reduced revenues, reduced gross margins and loss of market share, any of which would adversely affect our operating results and financial condition. To the extent that our competitors offer distributors or sales representatives more favorable terms, these distributors and sales representatives may decline to carry, or discontinue carrying, our products. Our business, financial condition and results of operations could be harmed by any failure to maintain and expand our distribution network. Furthermore, many of our existing and potential customers internally develop solutions which attempt to perform all or a portion of the functions performed by our products. To remain competitive, we continue to evaluate our manufacturing operations for opportunities for additional cost savings and technological improvements. If we or our contract partners are unable to successfully implement new process technologies and to achieve volume production of new products at acceptable yields, our business, financial condition and results of operations may be materially and adversely affected. Our future competitive performance depends on a number of factors, including our ability to:
| • | increase device performance and improve manufacturing yields; |
| • | accurately identify emerging technological trends and demand for product features and performance characteristics; |
| • | develop and maintain competitive and reliable products; |
| • | enhance our products by adding innovative features that differentiate our products from those of our competitors; |
| • | bring products to market on a timely basis at competitive prices; |
| • | respond effectively to new technological changes or new product announcements by others; |
| • | adapt products and processes to technological changes; |
| • | adopt or set emerging industry standards; |
| • | meet changing customer requirements; and |
| • | provide adequate technical service and support. |
Our design, development and introduction schedules for new products or enhancements to our existing and future products may not be met. In addition, these products or enhancements may not achieve market acceptance, or we may not be able to sell these products at prices that are favorable, which could materially and adversely affect on our business, financial condition and results of operations.
We depend on third-party subcontractors to manufacture our products. We utilize wafer foundries for processing our wafers and assembly and test subcontractors for manufacturing and testing our packaged products. Any disruption in or loss of foundries or subcontractors’ capacity to manufacture and test our products subjects us to a number of risks, including the potential for an inadequate supply of products and higher materials costs. These risks may lead to delayed product delivery or increased costs, which could materially and adversely impact our business, financial condition and results of operations.
We do not own or operate a semiconductor fabrication facility or a foundry. We utilize various foundries for different processes. Our products are based on Complementary Metal Oxide Semiconductor (“CMOS”) processes, bipolar processes and bipolar-CMOS (“BiCMOS”) processes. Globalfoundries Singapore Pte. Ltd. (f.k.a. Chartered Semiconductor Manufacturing Ltd.) (“Globalfoundries”) manufactures the majority of the CMOS wafers from which the majority of our communications and UART products are produced. Episil Technologies, Inc. (“Episil”), located in Taiwan, and Silan, located in China, manufacture the majority of the CMOS and bipolar wafers from which our power and serial products are produced. High Voltage BiCMOS
28
Table of Contents
power products are supplied by Jazz Semiconductor (CA, USA). All of these foundries produce semiconductors for many other companies (many of which have greater requirements than us), and therefore, we may not have access on a timely basis to sufficient capacity or certain process technologies and we do, from time to time, experience extended lead times on some products. In addition, we rely on our foundries’ continued financial health and ability to continue to invest in smaller geometry manufacturing processes and additional wafer processing capacity.
Many of our new products are designed to take advantage of smaller geometry manufacturing processes. Due to the complexity and increased cost of migrating to smaller geometries as well as process changes, we could experience interruptions in production or significantly reduced yields causing product introduction or delivery delays. If such delays occur, our products may have delayed market acceptance or customers may select our competitors’ products during the design process.
New process technologies or new products can be subject to especially wide variations in manufacturing yields and efficiency. There can be no assurance that our foundries or the foundries of our suppliers will not experience unfavorable yield variances or other manufacturing problems that result in delayed product introduction or delivery delays.
Our foundries manufacture our products on a purchase order basis. We provide our foundries with rolling forecasts of our production requirements; however, the ability of our foundries to provide wafers is limited by the foundries’ available capacity. There can be no assurance that our third-party foundries will allocate sufficient capacity to satisfy our requirements. In addition, we may not continue to do business with our foundries on terms as favorable as our current terms.
Furthermore, any sudden reduction or elimination of any primary source or sources of fully processed wafers could result in a material delay in the shipment of our products. Any delays or shortages will materially and adversely impact our business, financial condition and results of operations. In particular, the products produced from the wafers manufactured by Episil and Silan currently constitute a significant part of our total revenue, and so any delay, reduction or elimination of our ability to obtain wafers from either foundry could materially and adversely impact our business, financial condition and results of operations.
Our reliance on our wafer foundries and assembly and test subcontractors involves the following risks:
| • | a manufacturing disruption or sudden reduction or elimination of any existing source or sources of semiconductor manufacturing materials or processes, which might include the potential closure, change of ownership, change in business conditions or relationships, change of management or consolidation by one of our foundries; |
| • | disruption of manufacturing or assembly or test services due to relocation or limited capacity of the foundries or subcontractors; |
| • | inability to obtain or develop technologies needed to manufacture our products; |
| • | extended time required to identify, qualify and transfer to alternative manufacturing sources for existing or new products or the possible inability to obtain an adequate alternative; |
| • | failure of our foundries or subcontractors to obtain raw materials and equipment; |
| • | increasing cost of commodities, such as gold, raw materials and energy resulting in higher wafer or package costs; |
| • | long-term financial and operating stability of the foundries, or their suppliers or subcontractors, and their ability to invest in new capabilities and expand capacity to meet increasing demand, to remain solvent, or to obtain financing in tight credit markets; |
| • | continuing measures taken by our suppliers such as reductions in force, pay reductions, forced time off or shut down of production for extended periods of time to reduce and/or control operating expenses in response to weakened customer demand; |
29
Table of Contents
| • | subcontractors’ inability to transition to smaller package types or new package compositions; |
| • | a sudden, sharp increase in demand for semiconductor devices, which could strain the foundries’ or subcontractors’ manufacturing resources and cause delays in manufacturing and shipment of our products; |
| • | manufacturing quality control or process control issues, including reduced control over manufacturing yields, production schedules and costs and product quality; |
| • | potential misappropriation of our intellectual property; |
| • | disruption of transportation to and from Asia where most of our foundries and subcontractors are located; |
| • | political, civil, labor and economic instability; |
| • | embargoes or other regulatory limitations affecting the availability of raw materials, equipment or changes in tax laws, tariffs, services and freight rates; and |
| • | compliance with local or international regulatory requirements. |
Additional risks associated with subcontractors include:
| • | subcontractors imposing higher minimum order quantities for substrates; |
| • | potential increase in assembly and test costs; |
| • | our board level product volume may not be attractive to preferred manufacturing partners, which could result in higher pricing or having to qualify an alternative vendor; |
| • | difficulties in selecting, qualifying and integrating new subcontractors; |
| • | entry into “take-or-pay” agreements; and |
| • | limited warranties from our subcontractors for products assembled and tested for us. |
Our stock price is volatile.
The market price of our common stock has fluctuated significantly to date. In the future, the market price of our common stock could be subject to significant fluctuations due to, among other reasons:
| • | our anticipated or actual operating results; |
| • | announcements or introductions of new products by us or our competitors; |
| • | technological innovations by us or our competitors; |
| • | investor’s perception of the semiconductor sector; |
| • | loss of or changes to key executives; |
| • | product delays or setbacks by us, our customers or our competitors; |
| • | potential supply disruptions; |
| • | sales channel interruptions; |
| • | concentration of sales among a small number of customers; |
| • | conditions in our customers’ markets and the semiconductor markets; |
| • | the commencement and/or results of litigation; |
| • | changes in estimates of our performance by securities analysts; |
| • | decreases in the value of our investments or long-lived assets, thereby requiring an asset impairment charge against earnings; |
30
Table of Contents
| • | repurchasing shares of our common stock; |
| • | announcements of merger or acquisition transactions; and/or |
| • | general global economic and capital market conditions. |
In the past, securities and class action litigation has been brought against companies following periods of volatility in the market prices of their securities. We may be the target of one or more of these class action suits, which could result in significant costs and divert management’s attention, thereby materially and adversely impact our business, financial condition and results of operations.
In addition, at times the stock market has experienced and is currently experiencing extreme price, volume and value fluctuations that affect the market prices of the stock of many high technology companies, including semiconductor companies, and that are unrelated or disproportionate to the operating performance of those companies. Any such fluctuations may harm the market price of our common stock.
Our results of operations could vary as a result of the methods, estimations and judgments we use in applying our accounting policies.
The methods, estimates and judgments we use in applying our accounting policies have a significant impact on our results of operations. Such methods, estimates and judgments are, by their nature, subject to substantial risks, uncertainties, assumptions and changes in rulemaking by the regulatory bodies; and factors may arise over time that lead us to change our methods, estimates, and judgments. Changes in those methods, estimates and judgments could materially and adversely impact our business, financial condition and results of operations. Our revenue reporting is highly dependent on receiving pertinent and accurate data from our distributors in a timely fashion. Distributors provide us periodic data regarding the product, price, quantity and end customer when products are resold as well as the quantities of our products they still have in stock. We must use estimates and apply judgment to reconcile distributors’ reported inventories to their activities. Any error in our judgment could lead to inaccurate reporting of our revenues, deferred income and allowances on sales to distributors and net income.
The final determination of our income tax liability may be materially different from our income tax provision, which could have an adverse effect on our business, financial condition and results of operations.
Our future effective tax rates may be adversely affected by a number of factors including:
| • | the jurisdictions in which profits are determined to be earned and taxed; |
| • | the resolution of issues arising from tax audits with various tax authorities; |
| • | changes in the valuation of our deferred tax assets and liabilities; |
| • | adjustments to estimated taxes upon finalization of various tax returns; |
| • | increases in expenses not deductible for tax purposes, including write-offs of acquired in-process research and development and impairment of goodwill in connection with acquisitions; |
| • | changes in available tax credits; |
| • | changes in stock-based compensation expense; |
| • | changes in tax laws or the interpretation of such tax laws and changes in generally accepted accounting principles; and/or |
| • | the repatriation of non-U.S. earnings for which we have not previously provided for U.S. taxes. |
Any significant increase in our future effective tax rates could adversely impact net income for future periods. In addition, the U.S. Internal Revenue Service (“IRS”) and other tax authorities regularly examine our
31
Table of Contents
income tax returns. Our business, financial condition and results of operations could be materially and adversely impacted if these assessments or any other assessments resulting from the examination of our income tax returns by the IRS or other taxing authorities are not resolved in our favor.
We have acquired significant Net Operating Loss (“NOL”) carryforwards as a result of our acquisitions. The utilization of acquired NOL carryforwards is subject to the IRS’s complex limitation rules that carry significant burdens of proof. Limitations include certain levels of a change in ownership. As a publicly traded company, such change in ownership by shareholders, such as Future and Soros, may be out of our control. Our eventual ability to utilize our estimated NOL carryforwards is subject to IRS scrutiny and our future results may not benefit as a result of potential unfavorable IRS rulings.
Our engagement with foreign customers could cause fluctuations in our operating results, which could materially and adversely impact our business, financial condition and results of operations.
International sales have accounted for, and will likely continue to account for a significant portion of our revenues, which subjects us to the following risks, among others:
| • | changes in regulatory requirements; |
| • | tariffs and other barriers; |
| • | timing and availability of export or import licenses; |
| • | disruption of services due to political, civil, labor, and economic instability; |
| • | disruption of services due to natural disasters outside the United States; |
| • | disruptions to customer operations outside the United States due to the outbreak of communicable diseases; |
| • | difficulties in accounts receivable collections; |
| • | difficulties in staffing and managing foreign subsidiary and branch operations; |
| • | difficulties in managing sales channel partners; |
| • | difficulties in obtaining governmental approvals for communications and other products; |
| • | limited intellectual property protection; |
| • | foreign currency exchange fluctuations; |
| • | the burden of complying with foreign laws and treaties; |
| • | contractual or indemnity issues that are materially different from our standard sales terms; and |
| • | potentially adverse tax consequences. |
In addition, because sales of our products have been denominated primarily in U.S. dollars, increases in the value of the U.S. dollar as compared with local currencies could make our products more expensive to customers in the local currency of a particular country resulting in pricing pressures on our products. Increased international activity in the future may result in foreign currency denominated sales. Furthermore, because some of our customers’ purchase orders and agreements are governed by foreign laws, we may be limited in our ability, or it may be too costly for us, to enforce our rights under these agreements and to collect damages, if awarded.
Because some of our IC products have lengthy sales cycles, we may experience substantial delays between incurring expenses related to product development and the revenue derived from these products.
A portion of our revenue is derived from selling ICs to communications equipment vendors. Due to their product development cycle, we have typically experienced at least an eighteen-month time lapse between our initial contact with a customer and realizing volume shipments. We first work with customers to achieve a design
32
Table of Contents
win, which may take nine months or longer. Our customers then complete their design, test and evaluation process and begin to ramp-up production, a period which typically lasts an additional nine months. The customers of communications equipment manufacturers may also require a period of time for testing and evaluation, which may cause further delays. As a result, a significant period of time may elapse between our research and development efforts and our realization of revenue, if any, from volume purchasing of our communications products by our customers. Due to the length of the communications equipment vendors’ product development cycle, the risks of project cancellation by our customers, price erosion or volume reduction are common aspects of such engagements.
Our backlog may not result in revenue.
Due to the possibility of customer changes in delivery schedules and quantities actually purchased, cancellation of orders, distributor returns or price reductions, our backlog at any particular date is not necessarily indicative of actual sales for any succeeding period. The still unsettled and weakened economy increases the risk of purchase order cancellations or delays, product returns and price reductions. We may not be able to meet our expected revenue levels or results of operations if there is a reduction in our order backlog for any particular period and we are unable to replace those sales during the same period.
Earthquakes and other natural disasters, such as the recent earthquake and tsunami in Japan, may damage our facilities or those of our suppliers and customers.
The occurrence of natural disasters in certain regions, such as the recent earthquake and tsunami in Japan, could adversely impact our manufacturing and supply chain, our ability to deliver products on a timely basis (or at all) to our customers and the cost of or demand for our products. Our corporate headquarters in Fremont, California is located near major earthquake faults that have experienced seismic activity. In addition, some of our other offices, customers and suppliers are in locations which may be subject to similar natural disasters. In the event of a major earthquake or other natural disaster near our offices, our operations could be disrupted. Similarly, a major earthquake or other natural disaster affecting one or more of our major customers or suppliers could adversely impact the operations of those affected, which could disrupt the supply or sales of our products and harm our business, financial condition and results of operations.
We may be unable to protect our intellectual property rights, which could harm our competitive position.
Our ability to compete is affected by our ability to protect our intellectual property rights. We rely on a combination of patents, trademarks, copyrights, mask work registrations, trade secrets, confidentiality procedures and non-disclosure and licensing arrangements to protect our intellectual property rights. Despite these efforts, we may be unable to protect our proprietary information. Such intellectual property rights may not be recognized or if recognized, may not be commercially feasible to enforce. Moreover, our competitors may independently develop technology that is substantially similar or superior to our technology.
More specifically, our pending patent applications or any future applications may not be approved, and any issued patents may not provide us with competitive advantages or may be challenged by third parties. If challenged, our patents may be found to be invalid or unenforceable, and the patents of others may have an adverse effect on our ability to do business. Furthermore, others may independently develop similar products or processes, duplicate our products or processes or design around any patents that may be issued to us.
We could be required to pay substantial damages or could be subject to various equitable remedies if it were proven that we infringed the intellectual property rights of others.
As a general matter, the semiconductor industry is characterized by ongoing litigation regarding patents and other intellectual property rights. If a third party were to prove that our technology infringed its intellectual property rights, we could be required to pay substantial damages for past infringement and could be required to
33
Table of Contents
pay license fees or royalties on future sales of our products. If we were required to pay such license fees whenever we sold our products, such fees could exceed our revenue. In addition, if it was proven that we willfully infringed a third party’s proprietary rights, we could be held liable for three times the amount of the damages that we would otherwise have to pay. Such intellectual property litigation could also require us to:
| • | stop selling, incorporating or using our products that use the infringed intellectual property; |
| • | obtain a license to make, sell or use the relevant technology from the owner of the infringed intellectual property, which license may not be available on commercially reasonable terms, if at all; and/or |
| • | redesign our products so as not to use the infringed intellectual property, which may not be technically or commercially feasible. |
The defense of infringement claims and lawsuits, regardless of their outcome, would likely be expensive and could require a significant portion of management’s time. In addition, rather than litigating an infringement matter, we may determine that it is in our best interests to settle the matter. Terms of a settlement may include the payment of damages and our agreement to license technology in exchange for a license fee and ongoing royalties. These fees could be substantial. If we were required to pay damages or otherwise became subject to such equitable remedies, our business, financial condition and results of operations would suffer. Similarly, if we were required to pay license fees to third parties based on a successful infringement claim brought against us, such fees could exceed our revenue.
| ITEM 1B. | UNRESOLVED STAFF COMMENTS |
None.
| ITEM 2. | PROPERTIES |
Our executive offices and our marketing and sales, research and development, manufacturing, test and engineering operations are located in Fremont, California in two adjacent buildings that we own, which consist of approximately 151,000 square feet. Additionally, we own approximately 4.5 acres of partially developed property adjacent to our headquarters, which is presently being held for future office expansion.
We also lease smaller facilities in Belgium, Canada, China, Japan, Korea, Malaysia, Taiwan and the United States, which are occupied by administrative offices, sales offices, design centers and field application engineers.
Based upon our estimates of future hiring, we believe that our current facilities will be adequate to meet our requirements at least through the next fiscal year.
During fiscal years 2011, 2010 and 2009, we also leased one additional building in California, totaling approximately 95,700 square feet, which was subleased to a tenant. The sublease began on April 15, 2008 and expired March 31, 2011. In accordance with the lease agreement, the leased building was returned to the lessor on March 31, 2011. For further discussion of this facility and its effect on our financial condition and results of operations, see Part II, Item 7—“Management’s Discussion and Analysis of Financial Condition and Results of Operations” and in Part II, Item 8 —“Financial Statements and Supplementary Data” and “Notes to Consolidated Financial Statements, Note 15—Lease Financing Obligation.”
| ITEM 3. | LEGAL PROCEEDINGS |
Information required by this item is set forth in Part II, Item 8—“Financial Statements and Supplementary Data” and “Notes to Consolidated Financial Statements, Note 17—Legal Proceedings” of this Annual Report and is incorporated by reference herein.
| ITEM 4. | (REMOVED AND RESERVED) |
34
Table of Contents
| ITEM 5. | MARKET FOR REGISTRANT’S COMMON EQUITY, RELATED STOCKHOLDER MATTERS AND ISSUER PURCHASES OF EQUITY SECURITIES |
Market Information
Our common stock is traded on The NASDAQ Global Market under the symbol “EXAR.” The following table set forth the range of high and low sales prices of our common stock for the periods indicated, as reported by The NASDAQ Global Market.
| Common Stock Price |
||||||||
| High | Low | |||||||
| Fiscal year 2011 |
||||||||
| Fourth quarter ended March 27, 2011 |
$ | 7.25 | $ | 5.72 | ||||
| Third quarter ended December 26, 2010 |
7.19 | 5.73 | ||||||
| Second quarter ended September 26, 2010 |
7.23 | 5.40 | ||||||
| First quarter ended June 27, 2010 |
7.74 | 6.69 | ||||||
| Fiscal year 2010 |
||||||||
| Fourth quarter ended March 28, 2010 |
$ | 7.78 | $ | 6.66 | ||||
| Third quarter ended December 27, 2009 |
7.95 | 6.30 | ||||||
| Second quarter ended September 27, 2009 |
7.98 | 6.77 | ||||||
| First quarter ended June 28, 2009 |
7.43 | 5.70 | ||||||
The closing sales price for our common stock on May 27, 2011, was $6.34 per share. As of May 27, 2011, the approximate number of record holders of our common stock was 269 (not including beneficial owners of stock held in street name).
Dividend Policy
We have never declared or paid any cash dividends on our capital stock and we do not currently intend to pay any cash dividends on our common stock. We expect to retain future earnings, if any, to fund the development and growth of our business. Any future determination to pay dividends on our common stock will be, subject to applicable law, at the discretion of our board of directors and will depend upon, among other factors, our results of operations, financial condition, capital requirements and contractual restrictions.
35
Table of Contents
Stock Price Performance
The following table and graph shows a five-year comparison of cumulative total stockholder returns for Exar, The NASDAQ Composite Index, and The NASDAQ Electronic Components Index (SIC code 3670-3679). The table and graph assumed the investment of $100 in stock or index on March 31, 2006 and that all dividends, if any, were reinvested. We have never paid cash dividends on our common stock. The performance shown is not necessarily indicative of future performance.
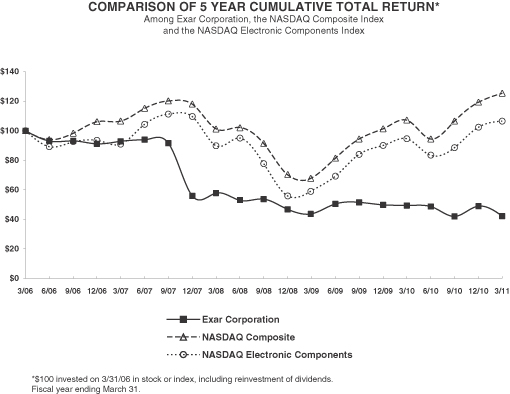
| Cumulative Total Return as of | ||||||||||||||||||||||||
| March 31, 2006 |
March 31, 2007 |
March 30, 2008 |
March 29, 2009 |
March 28, 2010 |
March 27, 2011 |
|||||||||||||||||||
| Exar Corporation Stock |
$ | 100.00 | $ | 92.72 | $ | 57.63 | $ | 43.70 | $ | 49.37 | $ | 42.16 | ||||||||||||
| NASDAQ Composite Index |
100.00 | 106.44 | 101.14 | 67.88 | 107.06 | 125.30 | ||||||||||||||||||
| NASDAQ Electronic Components Index |
100.00 | 90.78 | 89.71 | 59.15 | 94.48 | 106.53 | ||||||||||||||||||
36
Table of Contents
| ITEM 6. | SELECTED FINANCIAL DATA |
On March 16, 2010, June 17, 2009, April 3, 2009 and August 25, 2007, we acquired Neterion, Galazar, Hifn and Sipex, respectively. Accordingly, the results of operations of Neterion, Galazar, Hifn and Sipex have been included in our consolidated financial statements since March 17, 2010, June 18, 2009, April 4, 2009 and August 26, 2007, respectively. See Part II, Item 8—“Financial Statements and Supplementary Data” and “Notes to Consolidated Financial Statements, Note 3—Business Combinations.”
The following selected financial data should be read in conjunction with the consolidated financial statements and notes thereto and “Management’s Discussion and Analysis of Financial Condition and Results of Operations” included in Part II, Item 7 of this Annual Report.
| As of and For the Years Ended | ||||||||||||||||||||
| March 27, 2011(5) |
March 28, 2010(4) |
March 29, 2009(3) |
March 30, 2008(2) |
March 31, 2007(1) |
||||||||||||||||
| Consolidated statements of operations data: |
||||||||||||||||||||
| Net sales |
$ | 146,005 | $ | 134,878 | $ | 115,118 | $ | 89,743 | $ | 68,502 | ||||||||||
| Gross profit |
63,997 | 63,382 | 50,245 | 40,112 | 46,534 | |||||||||||||||
| Loss from operations |
(40,018 | ) | (33,990 | ) | (80,222 | ) | (202,438 | ) | (4,229 | ) | ||||||||||
| Net income (loss) |
(35,668 | ) | (28,110 | ) | (73,036 | ) | (195,879 | ) | 8,024 | |||||||||||
| Net income (loss) per share |
||||||||||||||||||||
| Basic |
$ | (0.81 | ) | $ | (0.64 | ) | $ | (1.70 | ) | $ | (4.55 | ) | $ | 0.22 | ||||||
| Diluted |
$ | (0.81 | ) | $ | (0.64 | ) | $ | (1.70 | ) | $ | (4.55 | ) | $ | 0.22 | ||||||
| Shares used in computation of net income (loss) per share: |
||||||||||||||||||||
| Basic |
44,218 | 43,584 | 42,887 | 43,090 | 36,255 | |||||||||||||||
| Diluted |
44,218 | 43,584 | 42,887 | 43,090 | 36,480 | |||||||||||||||
| Consolidated balance sheets data: |
||||||||||||||||||||
| Cash, cash equivalents and short-term investments |
$ | 200,999 | $ | 212,084 | $ | 256,343 | $ | 268,860 | $ | 356,079 | ||||||||||
| Working capital |
202,256 | 208,052 | 257,179 | 266,060 | 357,068 | |||||||||||||||
| Total assets |
298,215 | 333,314 | 336,389 | 424,220 | 421,174 | |||||||||||||||
| Long-term obligations |
16,399 | 17,260 | 16,869 | 18,091 | 191 | |||||||||||||||
| Retained earnings (accumulated deficit) |
(234,294 | ) | (198,626 | ) | (170,516 | ) | (97,480 | ) | 98,164 | |||||||||||
| Stockholders’ equity |
244,579 | 274,132 | 292,094 | 371,077 | 406,756 | |||||||||||||||
| (1) | Fiscal year 2007 includes an impairment charge of $1.0 million related to our non-marketable securities; and separation costs of $1.6 million related to the resignations of two former executives. |
| (2) | Fiscal year 2008 includes $5.4 million of amortization of intangible assets acquired in connection with the Sipex acquisition; $8.8 million of IPR&D written off in connection with the Sipex acquisition; $165.2 million impairment charge on goodwill and other intangible assets; separation expenses of $0.5 million related to our former chief executive officer; and $0.6 million impairment loss related to our non-marketable securities. |
| (3) | Fiscal year 2009 includes $59.7 million impairment charge on goodwill and other intangible assets; $2.7 million of amortization of intangible assets acquired in connection with the Sipex acquisition; $1.2 million charge for accelerated depreciation on abandoned equipment; and $1.8 million impairment loss related to our investment in marketable and non-marketable securities. |
| (4) | Fiscal year 2010 includes $7.4 million amortization of intangible assets acquired in connection with the Hifn, Sipex, Galazar and Neterion acquisitions; $2.3 million fair value adjustments of inventories in connection with Hifn and Galazar acquisitions; $6.2 million acquisition related expenses; $0.1 million separation expense related to an executive officer; and $0.3 million impairment loss related to the investment in marketable and non-marketable securities. |
| (5) | Fiscal year 2011 includes $9.5 million amortization of intangible assets acquired in connection with the Hifn, Sipex, Galazar and Neterion acquisitions; $7.5 million impairment of intangible assets; $3.6 million exit costs related to the decision to exit the 10 Gigabit Ethernet market; and $0.3 million acquisition related costs. |
37
Table of Contents
| ITEM 7. | MANAGEMENT’S DISCUSSION AND ANALYSIS OF FINANCIAL CONDITION AND RESULTS OF OPERATIONS |
The following Management’s Discussion and Analysis of Financial Condition and Results of Operations, as well as information contained in “Risk Factors” above and elsewhere in this Annual Report on Form 10-K contains “forward-looking statements” within the meaning of Section 27A of the Securities Act of 1933, as amended, and Section 21E of the Securities Exchange Act of 1934, as amended, that involve risks and uncertainties. Please see “Forward Looking Statements” in Part I above. Actual results may differ materially from those projected in the forward-looking statements as a result of various factors, including, among others, those identified above under Part I, Item 1A—“Risk Factors.”
COMPANY OVERVIEW
Exar Corporation and its subsidiaries (“Exar” or “we”) is a fabless semiconductor company that designs, sub-contracts manufacturing and sells highly differentiated silicon, software and subsystem solutions for industrial, telecom, networking and storage applications. Our core expertise in silicon integration, system architecture and software has enabled the development of innovative solutions designed to meet the needs of the evolving connected world. Our product portfolio includes power management and interface components, communications products, storage optimization solutions, network security and applied service processors. Applying both analog and digital technologies, our products are deployed in a wide array of applications such as portable electronic devices, set top boxes, digital video recorders, telecommunication systems, servers, enterprise storage systems and industrial automation equipment. We provide customers with a breadth of component products and subsystem solutions based on advanced silicon integration.
We market our products worldwide with sales offices and personnel located throughout the Americas, Europe, and Asia. Our products are sold in the United States through a number of manufacturers’ representatives and distributors. Internationally, our products are sold through various regional and country specific distributors with locations around the globe. In addition to our sales offices, we also employ a worldwide team of field application engineers to work directly with our customers.
Our international sales consist of sales that are denominated in U.S. dollars. Our international related operations expenses expose us to fluctuations in currency exchange rates because our foreign operating expenses are denominated in foreign currency while our sales are denominated in U.S. dollars. Our operating results are subject to quarterly and annual fluctuations as a result of a variety of factors that could materially and adversely affect our future profitability as described in “Part I, Item 1A. Risk Factors—Our Financial Results May Fluctuate Significantly Because Of A Number Of Factors, Many Of Which Are Beyond Our Control.”
On March 16, 2010, we completed the acquisition of Neterion, Inc. (“Neterion”), a developer of 10 gigabit Ethernet (10GbE) controller silicon and card solutions optimized for virtualized environments located in Sunnyvale, California. During the course of fiscal 2011, Exar participated in the 10GbE market and established a limited set of customers but fell short of customer expansion and revenue growth goals for the product line. After assessing our market position, degree of target customer adoption and development roadmap, we announced on March 4, 2011 that we had decided to exit the data center virtualization market and, in connection therewith, had decided to discontinue development of these products. We immediately reduced our resources and began a process to sell assets devoted to the development of these products.
On June 17, 2009, we completed the acquisition of Galazar Networks, Inc. (“Galazar”), a fabless semiconductor company focused on carrier grade transport over telecom networks based in Ottawa, Ontario, Canada. Galazar’s product portfolio addressed transport of a wide range of datacom and telecom services including Ethernet, SAN, TDM and video over SONET/SDH, PDH and OTN networks.
On April 3, 2009, we completed the acquisition of hi/fn, inc. (“Hifn”), a provider of network- and storage-security and data reduction products located in Los Gatos, California.
38
Table of Contents
Our fiscal years consist of 52 or 53 weeks. In a 52-week year, each fiscal quarter consists of 13 weeks. The three fiscal years 2011, 2010 and 2009 are each comprised of 52-week periods. Fiscal year 2012 will consist of 53 weeks. Fiscal years ended March 27, 2011, March 28, 2010 and March 29, 2009 are also referred to as “2011,” “2010” and “2009” unless otherwise indicated.
EXECUTIVE SUMMARY
During fiscal year 2011 net sales increased eight percent as compared to fiscal 2010. The increase reflects significant growth of our interface and power product lines in the first half of the year followed by significant declines in all product lines in the second half of the year as we, like the semiconductor industry at large, experienced an inventory correction by both distributors and end customers. We expanded our sales channel relationships in 2011 by adding key partners Arrow Electronics, who acquired our second largest distributor Nu Horizons, and Digi-Key Electronics. We introduced 19 new products to our target markets.
During fiscal year 2011 our business was affected by the industry’s inventory correction, and we had to make some difficult strategic decisions. As announced in March 2011, we decided to exit the data center virtualization market and, in connection therewith, to discontinue development of our 10GbE network adapter cards. We entered this market in March 2010 with our acquisition of Neterion and experienced slower market adoption and higher development costs than initially expected. We determined that the current economic and market environment did not provide the potential to deliver acceptable returns on the required investments in these products.
With the start of fiscal year 2012, we are excited about the interest generated by PowerXR, our programmable power management product family, and our new DX family of data security and compression products. We expect to provide samples of our dual channel 10 Gb OTN product, MXP2, this fiscal year. We believe there is significant interest from top tier optical telecom suppliers for MXP2 as it allows them to replace solutions with multiple expensive and power hungry FPGAs. Although our industry can be cyclical and macroeconomics conditions can be uncertain, we believe we are positioned to grow our revenue, gross margins and have significantly reduced operating expenses.
CRITICAL ACCOUNTING POLICIES AND ESTIMATES
The preparation of our financial statements and accompanying disclosures in conformity with U.S. generally accepted accounting principles (“GAAP”) requires estimates and assumptions that affect the reported amounts of assets, liabilities, revenues and expenses, and related disclosures of contingent assets and liabilities in the consolidated financial statements and the accompanying notes. The U.S. Securities and Exchange Commission (“SEC”) has defined a company’s critical accounting policies as policies that are most important to the portrayal of a company’s financial condition and results of operations, and which require a company to make its most difficult and subjective judgments, often as a result of the need to make estimates of matters that are inherently uncertain. Based on this definition, we have identified our most critical accounting policies and estimates to be as follows: (1) revenue recognition; (2) valuation of inventories; (3) income taxes; (4) stock-based compensation; (5) goodwill; (6) long-lived assets; and (7) valuation of business combinations; each of which is addressed below. We also have other key accounting policies that involve the use of estimates, judgments and assumptions that are significant to understanding our results. For additional information, see Part II, Item 8—“Financial Statements and Supplementary Data” and “Notes to Consolidated Financial Statements, Note 2—Accounting Policies.” Although we believe that our estimates, assumptions and judgments are reasonable, they are based upon information presently available. Actual results may differ significantly from these estimates if the assumptions, judgments and conditions upon which they are based turn out to be inaccurate.
39
Table of Contents
Revenue Recognition
We recognize revenue in accordance with Financial Accounting Standards Board (“FASB”) authoritative guidance for Revenue Recognition. Four basic criteria must be met before revenue can be recognized:(1) persuasive evidence of an arrangement exists; (2) delivery has occurred or services have been rendered; (3) the price is fixed or determinable; and (4) collectability is reasonably assured.
We derive revenue principally from the sale of our products to distributors and to OEMs or their contract manufacturers. Our delivery terms are primarily FOB shipping point, at which time title and all risks of ownership are transferred to the customer.
Software became an element of our revenue upon the acquisition of Hifn in April 2009. To date, software revenue has been an immaterial portion of our net sales.
Non-distributors
For non-distributors, revenue is recognized when title to the product is transferred to the customer, which occurs upon shipment or delivery, depending upon the terms of the customer order, provided that persuasive evidence of a sales arrangement exists, the price is fixed or determinable, collection of the resulting receivables is reasonably assured, there are no customer acceptance requirements and there are no remaining significant obligations. Provisions for returns and allowances for non-distributor customers are provided at the time product sales are recognized. Allowances for sales returns and other reserves are recorded based on historical experience or specific identification of an event necessitating an allowance.
Our history of actual returns from our non-distributors has not been material and, therefore, the allowance for sales returns for non-distributor customers is not significant.
Distributors
Agreements with our two primary distributors permit the return of 3% to 5% of their purchases during the preceding quarter for purposes of stock rotation. For one of these distributors, a scrap allowance of 2% of the preceding quarter’s purchases is permitted. We also provide discounts to certain distributors based on volume of product they sell for a specific product with a specific volume range for a given customer over a period not to exceed one year.
We recognize revenue from each of our distributors using either the sell-in basis or sell-through basis, each as described below. Once adopted, the basis for revenue recognition for a distributor is maintained unless there is a change in circumstances indicating the basis for revenue recognition for that distributor is no longer appropriate.
| • | Sell-in Basis—Revenue is recognized upon shipment if we conclude we meet the same criteria as for non-distributors discussed above and we can reasonably estimate the credits for returns, pricing allowances and/or other concessions. We record an estimated allowance, at the time of shipment, based upon historical patterns of returns, pricing allowances and other concessions (i.e., “sell-in” basis). |
| • | Sell-through Basis—Revenue and the related costs of sales are deferred until the resale to the end customer if we grant more than limited rights of return, pricing allowances and/or other concessions or if we cannot reasonably estimate the level of returns and credits issuable (i.e., “sell-through” basis). Under the sell-through basis, accounts receivable are recognized and inventory is relieved upon shipment to the distributor as title to the inventory is transferred upon shipment, at which point we have a legally enforceable right to collection under normal terms. The associated sales and cost of sales are deferred and are included in deferred income and allowances on sales to distributors in the consolidated balance sheet. When the related product is sold by our distributors to their end customers, at which time the ultimate price we receive is known, we recognize previously deferred income as sales and cost of sales. |
40
Table of Contents
Sell-through revenue recognition is highly dependent on receiving pertinent and accurate data from our distributors in a timely fashion. Distributors provide us periodic data regarding the product, price, quantity, and end customer when products are resold as well as the quantities of our products they still have in stock. We must use estimates and apply judgments to reconcile distributors’ reported inventories to their activities. Any error in our judgment could lead to inaccurate reporting of our net sales, gross profit, deferred income and allowances on sales to distributors and net income.
Valuation of Inventories
Our policy is to establish a provision for excess inventories, based on the nature of the specific product, that is greater than twelve months of forecasted demand unless there are other factors indicating that the inventories will be sold at a profit after such periods. Among other factors, management considers known backlog of orders, projected sales and marketing forecasts, shipment activity, inventory-on-hand at our primary distributors, past and current market conditions, anticipated demand for our products, changing lead times in the manufacturing process and other business conditions when determining if a provision for excess inventory is required. Should the assumptions used by management in estimating the provision for excess inventory differ from actual future demand or should market conditions become less favorable than those projected by management, additional inventory write-downs may be required, which would have a negative impact on our gross margins. See Part I, Item 1A. “Risk Factors—‘Our Financial Results May Fluctuate Significantly Because Of A Number Of Factors, Many Of Which Are Beyond Our Control’.”
Income Taxes
We determine our deferred tax assets and liabilities based upon the difference between the financial statement and tax bases of our assets and liabilities. We make certain estimates and judgments in determining income tax expense for financial statement purposes. These estimates and judgments occur in the calculation of certain deferred tax assets and liabilities, which arise from timing differences in the recognition of revenue and expense for tax and financial statement purposes. Such deferred income tax assets and liabilities are recognized for the future tax consequences attributable to differences between the financial statement carrying amounts of existing assets and liabilities and their respective tax base, operating losses and tax credit carryforwards. Changes in tax rates affect the deferred income tax assets and liabilities and are recognized in the period in which the tax rates or benefits are enacted.
We must determine the probability that we will be able to utilize our deferred tax assets. A valuation allowance is provided when it is more likely than not that some portion or all of a deferred tax asset will not be realized. We measure and recognize uncertain tax positions in accordance with GAAP, whereby we only recognize the tax benefit from an uncertain tax position if it is more likely than not that the tax position will be sustained on examination by the taxing authorities, based on the merits of the position. See Part II, Item 8—“Financial Statements and Supplementary Data” and “Notes to Consolidated Financial Statements, Note 18—Income Taxes” for more details about our deferred tax assets and liabilities
Stock-Based Compensation
We compute the fair value of stock options utilizing the Black-Scholes model. Calculating stock-based compensation expense requires the input of highly subjective assumptions. The assumptions used in calculating the fair value of stock-based compensation represent our estimates, which involve inherent uncertainties and the application of management judgment. As a result, if factors change and we use different assumptions, our stock-based compensation expense could be materially different in the future. In addition, we are required to estimate the expected forfeiture rate and only recognize expense for those shares expected to vest. If our actual forfeiture rate is materially different from our estimate, the stock-based compensation expense could be significantly different from what we have recorded in the current period. See Part II, Item 8—“Financial Statements and Supplementary Data” and “Notes to the Consolidated Financial Statements, Note 13—Stock-Based Compensation” for more details about our assumptions used in calculating the stock-based compensation expenses and equity related transactions during the fiscal year.
41
Table of Contents
Goodwill
Goodwill represents the excess of the purchase price over the fair value of the net tangible and identifiable intangible assets acquired in a business combination. We evaluate goodwill for impairment on an annual basis or whenever events and changes in circumstances suggest that the carrying amount may not be recoverable. We conduct our annual impairment analysis in the fourth quarter of each fiscal year. Impairment of goodwill is tested at the reporting unit level by comparing the reporting unit’s carrying amount, including goodwill, to the fair value of the reporting unit. The fair value of the reporting unit is estimated using a combination of the income approach that uses discounted cash flows and the market approach that utilizes comparable companies’ data. If the carrying amount of the reporting unit exceeds its fair value, goodwill is considered impaired and a second step is performed to measure the amount of impairment loss. Because we have one reporting unit, we utilize an entity-wide approach to assess goodwill for impairment.
Long-Lived Assets
We assess the impairment of long-lived assets when events or changes in circumstances indicate that the carrying value of the assets or the asset grouping may not be recoverable. Factors that we consider in deciding when to perform an impairment review include significant negative industry or economic trends and significant changes or planned changes in our use of the assets. These factors can also be referred to as triggering events. We measure the recoverability of assets that will continue to be used in our operations by comparing the carrying value of the asset grouping to our estimate of the related total future undiscounted net cash flows. If an asset grouping’s carrying value is not recoverable through the related undiscounted cash flows, the asset grouping is considered to be impaired. The impairment is measured by comparing the difference between the asset grouping’s carrying value and its fair value. Long-lived assets such as goodwill; intangible assets; and property, plant and equipment are considered non-financial assets, and are recorded at fair value only if an impairment charge is recognized.
Impairments of long-lived assets are determined for groups of assets related to the lowest level of identifiable independent cash flows. We operate with one asset group on an enterprise basis. As a result, we believe the lowest identifiable cash flows reside at the enterprise level.
When we determine that the useful lives of assets are shorter than we had originally estimated, we accelerate the rate of depreciation and/or amortization over the assets’ new, shorter useful lives. See “Goodwill and Other Intangible Asset Impairment” in this Management’s Discussion and Analysis of Financial Condition and Results of Operations below for more details regarding charges associated with the shortening of useful lives of certain intangible assets.
Valuation of Business Combinations
We periodically evaluate potential strategic acquisitions to build upon our existing library of intellectual property, human capital and engineering talent, in order to expand our capabilities in the areas in which we operate or to acquire complementary businesses.
We account for each business combination by applying the acquisition method, which requires (i) identifying the acquiree; (ii) determining the acquisition date; (iii) recognizing and measuring the identifiable assets acquired, the liabilities assumed, and any non-controlling interest of Exar in the acquiree at their acquisition date fair value; and (iv) recognizing and measuring goodwill or a gain from a bargain purchase.
Assets acquired and liabilities assumed in a business combination that arise from contingencies are recognized at fair value on the acquisition date if fair value can be determined during the measurement period. If fair value cannot be determined, we typically account for the acquired contingencies using existing guidance for a reasonable estimate.
42
Table of Contents
To establish fair value, we measure the price that would be received to sell an asset or paid to transfer a liability in an ordinary transaction between market participants. The measurement assumes the highest and best use of the asset by the market participants that would maximize the value of the asset or the group of assets within which the asset would be used at the measurement date, even if the intended use of the asset is different.
Goodwill is measured and recorded as the amount, by which the consideration transferred, generally at the acquisition date fair value, exceeds the acquisition date fair value of identifiable assets acquired, the liabilities assumed, and any non-controlling interest of Exar in the acquiree. To the contrary, if the acquisition date fair value of identifiable assets acquired, the liabilities assumed, and any non-controlling interest of Exar in the acquiree exceeds the consideration transferred, it is considered a bargain purchase and we would recognize the resulting gain in earnings on the acquisition date.
In-process research and development (“IPR&D”) assets are considered an indefinite-lived intangible asset and are not subject to amortization until its useful life is determined to be no longer indefinite. IPR&D assets must be tested for impairment annually or more frequently if events or changes in circumstances indicate that the asset might be impaired. The impairment test consists of a comparison of the fair value of the IPR&D asset with its carrying amount. If the carrying amount of the IPR&D asset exceeds its fair value, an impairment loss must be recognized in an amount equal to that excess. After an impairment loss is recognized, the adjusted carrying amount of the IPR&D asset will be its new accounting basis. Subsequent reversal of a previously recognized impairment loss is prohibited. The initial determination and subsequent evaluation for impairment of the IPR&D asset requires management to make significant judgments and estimates. Once the IPR&D projects have been completed, the useful life of the IPR&D asset is determined and amortized accordingly. If the IPR&D asset is abandoned, the remaining carrying value is written off.
Acquisition-related costs, including finder’s fees, advisory, legal, accounting, valuation and other professional or consulting fees are accounted for as expenses in the periods in which the costs are incurred and the services are received, with the exception that the costs to issue debt or equity securities are recognized in accordance with other applicable GAAP.
RESULTS OF OPERATIONS
On April 3, 2009, June 17, 2009 and March 16, 2010, we acquired Hifn, Galazar and Neterion, respectively. Accordingly, the results of operations of Hifn, Galazar and Neterion have been included in our consolidated financial statements since April 4, 2009, June 18, 2009 and March 17, 2010, respectively.
Net Sales by Product Line
The following table shows net sales by product line in dollars and as a percentage of net sales for the periods indicated (in thousands except percentages):
| March 27, 2011 |
March 28, 2010 |
March 29, 2009 |
2011 vs. 2010 Change |
2010 vs. 2009 Change |
||||||||||||||||||||||||||||
| Net sales: |
||||||||||||||||||||||||||||||||
| Communication |
$ | 23,159 | 16 | % | $ | 24,094 | 18 | % | $ | 27,833 | 24 | % | (4 | %) | (13 | %) | ||||||||||||||||
| Datacom and storage |
16,876 | 11 | % | 25,259 | 19 | % | — | — | (33 | %) | 100 | % | ||||||||||||||||||||
| Interface |
76,937 | 53 | % | 61,908 | 46 | % | 63,036 | 55 | % | 24 | % | (2 | %) | |||||||||||||||||||
| Power Management |
29,033 | 20 | % | 23,617 | 17 | % | 24,249 | 21 | % | 23 | % | (3 | %) | |||||||||||||||||||
| Total |
$ | 146,005 | 100 | % | $ | 134,878 | 100 | % | $ | 115,118 | 100 | % | ||||||||||||||||||||
Net sales from Hifn, Galazar and Neterion have been included in our consolidated financial statements since April 4, 2009, June 18, 2009 and March 17, 2010, respectively. Software revenues have been an immaterial portion of our net sales.
43
Table of Contents
Fiscal Year 2011 versus Fiscal Year 2010
Communication
Net sales of communication products, including network access, transmission and network transport products, for fiscal year 2011 decreased $0.9 million as compared to fiscal year 2010 primarily due to lower shipments of our network transport products.
Datacom and Storage
Net sales of datacom and storage products include network access and storage products, encryption, data reduction, packet processing products as well as 10GbE controller silicon and card solutions from the Neterion acquisition. The $16.9 million in net sales in fiscal year 2011 includes $2.7 million in sales of 10GbE controller products. Excluding the sales of 10GbE products, net sales of datacom and storage products for fiscal year 2011 decreased $10.8 million as compared to fiscal year 2010 primarily due to slower demand with an inventory correction at certain OEM customers and discontinued programs at a certain customer.
Interface
Net sales of interface products, including UARTs and serial transceiver products, for fiscal year 2011 increased $15.0 million as compared to fiscal year 2010 primarily due to higher sales of serial transceivers through our Asian distributor channel partners.
Power Management
Net sales of power management products, including DC-DC regulators and LED drivers, for fiscal year 2011 increased $5.4 million as compared to fiscal year 2010 primarily due to higher sales through our Asian distributor channel partners.
Fiscal Year 2010 versus Fiscal Year 2009
Communication
Net sales of communication products, including network access and transmission products and optical products as well as network transport products from the Galazar acquisition, for fiscal year 2010 decreased $3.7 million as compared to fiscal year 2009 and included $2.4 million of additional sales of Galazar products.
Excluding the additional Galazar sales, network access and transmission products for fiscal year 2010 decreased $6.2 million primarily due to decreased customer demand for our SONET products, and a decrease in customer demand for our optical products related to end of life purchase in fiscal year 2009 with a resulting decrease in units sold.
Datacom and Storage
Net sales of datacom and storage products include network access and storage products, encryption, data reduction and packet processing products from the Hifn acquisition as well as 10GbE controller silicon and card solutions from the Neterion acquisition. The $25.3 million in net sales in fiscal year 2010 includes $25.1 million in sales of Hifn products and $0.2 million in sales of Neterion products.
Interface
Net sales of interface products, including UARTs, video, imaging, transceivers and other products for fiscal year 2010 decreased $1.1 million as compared to fiscal year 2009 primarily due to price erosion on certain products.
44
Table of Contents
Power Management
Net sales of power management products, including DC-DC regulators and LED drivers, for fiscal year 2010 decreased $0.6 million as compared to fiscal year 2009 primarily due to decreased customer demand with a resulting decrease in units sold in fiscal year 2010 and price erosion on a limited number of products.
Net Sales by Channel
For fiscal years 2011, 2010 and 2009, approximately 40%, 35% and 44%, respectively, of our net sales were derived from product sales to our two primary distributors, Future Electronics Inc. (“Future”) and Nu Horizons Electronic Corp. (“Nu Horizons”); and approximately 60%; 65% and 56%, respectively, of our net sales were derived from sales to other distributors, OEM customers and other non-distributors.
The following table shows net sales by channel in dollars and as a percentage of net sales for the periods indicated (in thousands, except percentages):
| March 27, 2011 | March 28, 2010 | March 29, 2009 | 2011 vs. 2010 Change |
2010 vs. 2009 Change |
||||||||||||||||||||||||||||
| Net sales: |
||||||||||||||||||||||||||||||||
| Sell-through distributors |
$ | 85,201 | 58 | % | $ | 67,565 | 50 | % | $ | 68,762 | 60 | % | 26 | % | (2 | %) | ||||||||||||||||
| Direct and others |
60,804 | 42 | % | 67,313 | 50 | % | 46,356 | 40 | % | (10 | %) | 45 | % | |||||||||||||||||||
| Total |
$ | 146,005 | 100 | % | $ | 134,878 | 100 | % | $ | 115,118 | 100 | % | ||||||||||||||||||||
Net sales from Hifn, Galazar and Neterion have been included in our consolidated financial statements since April 4, 2009, June 18, 2009 and March 17, 2010, respectively.
Fiscal Year 2011 versus Fiscal Year 2010
Net sales to our distributors, for which we recognize revenue on the sell-through basis, for fiscal year 2011 increased by $17.6 million. The increase in sales to these distributors was primarily due to higher sales of our interface and power products.
Net sales to direct customers and other distributors for fiscal year 2011 decreased by $6.5 million from fiscal year 2010. This decrease was primarily attributable to the decrease in net sales in our datacom and storage products.
Fiscal Year 2010 versus Fiscal Year 2009
Net sales to our distributors, for which we recognize revenue on the sell-through basis, for fiscal year 2010 decreased by $1.2 million from fiscal year 2009. Net sales to these distributors included $1.1 million in sales of Hifn products. The decrease in sales to these distributors was primarily due to lower sales of our legacy communications and interface products.
Net sales to direct customers and other distributors for fiscal year 2010 increased by $21.0 million from fiscal year 2009 and included $26.6 million in sales of Hifn, Galazar and Neterion products. Net of the acquired products, net sales decreased $5.6 million during the period primarily due to lower sales of our legacy communications products.
45
Table of Contents
Net Sales by Geography
The following table shows net sales by geography in dollars and as a percentage of net sales for the periods indicated (in thousands, except percentages):
| March 27, 2011 | March 28, 2010 | March 29, 2009 | 2011 vs. 2010 Change |
2010 vs. 2009 Change |
||||||||||||||||||||||||||||
| Net sales: |
||||||||||||||||||||||||||||||||
| Americas |
$ | 33,760 | 23 | % | $ | 35,223 | 26 | % | $ | 28,996 | 25 | % | (4 | %) | 21 | % | ||||||||||||||||
| Asia |
89,140 | 61 | % | 80,268 | 60 | % | 61,029 | 53 | % | 11 | % | 32 | % | |||||||||||||||||||
| Europe |
23,105 | 16 | % | 19,387 | 14 | % | 25,093 | 22 | % | 19 | % | (23 | %) | |||||||||||||||||||
| Total |
$ | 146,005 | 100 | % | $ | 134,878 | 100 | % | $ | 115,118 | 100 | % | ||||||||||||||||||||
Net sales from Hifn, Galazar and Neterion have been included in our consolidated financial statements since April 4, 2009, June 18, 2009 and March 17, 2010, respectively.
Fiscal Year 2011 versus Fiscal Year 2010
Net sales in Asia in fiscal year 2011 increased $8.9 million as compared to fiscal year 2010 primarily due to higher shipments of our interface and power products.
Net sales in Europe in fiscal year 2011 increased $3.7 million as compared to fiscal year 2010 primarily due to higher shipments of our interface products.
Fiscal Year 2010 versus Fiscal Year 2009
Net sales in the Americas for fiscal year 2010 included $10.7 million, $1.1 million, and $0.2 million in sales of products acquired in the Hifn, Galazar and Neterion acquisitions, respectively.
Net sales in Asia for fiscal year 2010 included $12.6 million and $1.0 million in sales of products acquired in the Hifn and Galazar acquisitions, respectively.
Net sales in Europe for fiscal year 2010 included $1.7 million and $0.3 million in sales of products acquired in the Hifn and Galazar acquisitions, respectively.
Gross Profit
The following table shows gross profit and cost of sales in dollars and as a percentage of net sales for the periods indicated (in thousands, except percentages):
| March 27, 2011 | March 28, 2010 | March 29, 2009 | 2011 vs. 2010 Change |
2010 vs. 2009 Change |
||||||||||||||||||||||||||||
| Net sales |
$ | 146,005 | $ | 134,878 | $ | 115,118 | ||||||||||||||||||||||||||
| Cost of Sales |
||||||||||||||||||||||||||||||||
| Cost of Sales |
75,922 | 52 | % | 63,911 | 47 | % | 61,744 | 53 | % | 19 | % | 4 | % | |||||||||||||||||||
| Fair value adjustment of acquired inventories |
42 | — | 2,398 | 2 | % | — | — | — | 100 | % | ||||||||||||||||||||||
| Amortization of acquired intangible assets |
6,044 | 4 | % | 5,187 | 4 | % | 3,129 | 3 | % | 17 | % | 66 | % | |||||||||||||||||||
| Gross profit |
$ | 63,997 | 44 | % | $ | 63,382 | 47 | % | $ | 50,245 | 44 | % | 1 | % | 26 | % | ||||||||||||||||
46
Table of Contents
Incremental net sales and gross profit from Hifn, Galazar and Neterion have been included in our consolidated financial statements since April 4, 2009, June 18, 2009 and March 17, 2010, respectively.
Gross profit represents net sales less cost of sales. Cost of sales includes:
| • | the cost of purchasing finished silicon wafers manufactured by independent foundries; |
| • | the costs associated with assembly, packaging, test, quality assurance and product yields; |
| • | the cost of personnel and equipment associated with manufacturing support and engineering; |
| • | the cost of stock-based compensation associated with manufacturing engineering and support personnel; |
| • | the amortization of purchased intangible assets and acquired intellectual property; |
| • | the fair value adjustment of acquired inventories; |
| • | the provision for excess and obsolete inventory; and |
| • | the sale of previously reserved inventory. |
We believe that gross margin will fluctuate as a percentage of sales and in absolute dollars due to, among other factors, sales mix, manufacturing costs, our ability to leverage fixed operational costs across increased shipment volumes and competitive pricing pressure on our products.
Fiscal Year 2011 versus Fiscal Year 2010
Gross profit as a percentage of net sales for fiscal year 2011 decreased 3 percentage points as compared to fiscal year 2010. The decrease in gross profit as a percentage of sales was primarily due to the write-off of inventory as a result of exiting the 10GbE network interface card market, additional charges for other excess and obsolescence inventory, higher gold costs and product mix.
Stock-based compensation expense recorded in cost of sales was $0.5 million for both fiscal year 2011 and 2010.
Fiscal Year 2010 versus Fiscal Year 2009
Gross profit as a percentage of net sales for fiscal year 2010 increased $13.1 million, or three percentage points, as compared to fiscal year 2009. The increase in gross profit as a percentage of sales was primarily due to sales of the Hifn and Galazar products that typically have higher margins and improved manufacturing efficiency.
Stock-based compensation expense recorded in cost of sales was $0.5 million and $0.6 million for fiscal year 2010 and 2009, respectively.
47
Table of Contents
Other Costs and Expenses
The following table shows other costs and expenses in dollars and as a percentage of net sales for the periods indicated (in thousands, except percentages):
| March 27, 2011 | March 28, 2010 | March 29, 2009 | 2011 vs. 2010 Change |
2010 vs. 2009 Change |
||||||||||||||||||||||||||||
| Net sales |
$ | 146,005 | $ | 134,878 | $ | 115,118 | ||||||||||||||||||||||||||
| R&D expense: |
||||||||||||||||||||||||||||||||
| R&D—base |
44,355 | 30 | % | 42,514 | 31 | % | 28,980 | 25 | % | 4 | % | 47 | % | |||||||||||||||||||
| Stock-based compensation |
3,241 | 2 | % | 2,324 | 2 | % | 1,614 | 1 | % | 39 | % | 44 | % | |||||||||||||||||||
| Amortization expense—acquired intangibles |
2,292 | 2 | % | 2,785 | 2 | % | 798 | 1 | % | (18 | %) | 249 | % | |||||||||||||||||||
| Accelerated depreciation and other |
1,210 | 1 | % | 888 | 1 | % | 437 | 1 | % | 36 | % | 103 | % | |||||||||||||||||||
| Total R&D expense |
$ | 51,098 | 35 | % | $ | 48,511 | 36 | % | $ | 31,829 | 28 | % | 5 | % | 52 | % | ||||||||||||||||
| SG&A expense: |
||||||||||||||||||||||||||||||||
| SG&A—base |
40,145 | 27 | % | 39,454 | 29 | % | 33,991 | 30 | % | 2 | % | 16 | % | |||||||||||||||||||
| Stock-based compensation |
3,651 | 3 | % | 3,113 | 2 | % | 2,725 | 2 | % | 17 | % | 14 | % | |||||||||||||||||||
| Amortization expense—acquired intangibles |
1,143 | 1 | % | 697 | 1 | % | 490 | — | 64 | % | 42 | % | ||||||||||||||||||||
| Acquisition related costs and other |
493 | — | 5,597 | 4 | % | 1,756 | 2 | % | (91 | %) | 219 | % | ||||||||||||||||||||
| Total SG&A expense |
$ | 45,432 | 31 | % | $ | 48,861 | 36 | % | $ | 38,962 | 34 | % | (7 | %) | 25 | % | ||||||||||||||||
| Goodwill and other intangible asset impairment |
7,485 | 5 | % | — | — | 59,676 | 52 | % | (100 | )% | (100 | %) | ||||||||||||||||||||
Incremental net sales and operating expenses from Hifn, Galazar and Neterion have been included in our consolidated financial statements since April 4, 2009, June 18, 2009 and March 17, 2010, respectively.
Research and Development (“R&D”)
Our research and development costs consist primarily of:
| • | the salaries, stock-based compensation, and related expenses of employees engaged in product research, design and development activities; |
| • | costs related to engineering design tools, mask tooling costs, software amortization, test hardware, and engineering supplies and services; |
| • | amortization of acquired intangible assets such as existing technology and patents/core technology; and |
| • | facilities expenses. |
We believe that research and development expenses will fluctuate as a percentage of sales and increase in absolute dollars due to, among other factors, higher mask costs in connection with advanced process geometries, increased investment in software development, incentives, annual merit increases and fluctuations in reimbursements under a research and development contract.
We anticipate that salary related costs associated with the IPR&D project acquired in business combinations will be resourced through our existing workforce.
48
Table of Contents
Fiscal Year 2011 versus Fiscal Year 2010
R&D-base expenses increased $1.8 million, or 4%, as compared to fiscal year 2010. The increase was primarily due to increased labor expenses, software amortization and equipment depreciation associated with the acquisition of Neterion, partially offset by lower mask sets costs and outside services.
In connection with the Hifn acquisition, we assumed a contractual agreement under which certain of our research and development costs are eligible for reimbursement. Amounts collected under this arrangement are offset against research and development expense. During fiscal year 2011, we received $5.0 million for work performed, which was recorded as an offset to research and development expenses. This was a $0.4 million increase as compared to fiscal year 2010.
The increase in stock-based compensation expense as compared to the same period a year ago was primarily due to award based incentives to certain individuals.
The decrease in amortization expense—acquired intangibles as compared to fiscal year 2011 was result of the completion of the amortization period of an underlying intangible asset recorded in the Hifn acquisition.
Accelerated depreciation and other costs for fiscal year 2011 primarily reflect severance payments associated with the exiting of the 10GbE network interface cards market.
Fiscal Year 2010 versus Fiscal Year 2009
R&D-base expenses increased $13.5 million, or 47%, as compared to fiscal year 2009. The increase was primarily due to increased labor expenses, higher mask tooling costs and software amortization and equipment depreciation due to the growth of our company as a result of the acquisition of Hifn and Galazar.
As noted above, in connection with the Hifn acquisition, we assumed a contractual agreement under which certain of our research and development costs are eligible for reimbursement. During fiscal year 2010, Exar received $4.6 million for work performed, which was recorded as an offset to research and development expenses.
The increase in stock-based compensation expense as compared to the same period a year ago was primarily due to new stock option and restricted stock unit grants made to Hifn and Galazar employees joining our company and the incremental costs associated with the employee stock option exchange in November 2008.
The growth in amortization expense—acquired intangibles as compared to fiscal year 2009 primarily relates to the amortization of intangible assets associated with the Hifn and Galazar acquisitions.
Accelerated depreciation and other costs for fiscal year 2010 are primarily associated with acquired equipment and employee severance costs in connection with our acquisitions.
Selling, General and Administrative (“SG&A”)
Selling, general and administrative expenses consist primarily of:
| • | salaries, stock-based compensation and related expenses; |
| • | sales commissions; |
| • | professional and legal fees; |
| • | amortization of acquired intangible assets such as distributor relationships, tradenames/trademarks and customer relationships; and |
| • | acquisition related costs. |
49
Table of Contents
We believe that SG&A expenses will fluctuate as a percentage of sales and in absolute dollars due to, among other factors, variable commissions, legal costs, incentives and annual merit increases.
Fiscal Year 2011 versus Fiscal Year 2010
SG&A-base expenses increased $0.7 million, or 2%, as compared to fiscal year 2010. The increase was primarily a result of an accrual for a proposed amount to resolve a lease remediation claim and higher commissions and incentives.
The increase in stock-based compensation expense as compared to the same period a year ago was primarily due to award based incentives to certain individuals and performance-based restricted stock units to our executive staff.
The increase in amortization expense-acquired intangibles relates to intangibles assets recorded in connection with the Neterion acquisition.
Acquisition related costs and other primarily reflect remaining payments on a Neterion facility located in Sunnyvale, California, which was vacated in the first quarter of fiscal 2011.
Fiscal Year 2010 versus Fiscal Year 2009
SG&A-base expenses increased $5.5 million, or 16%, in fiscal year 2010 as compared to fiscal year 2009. The increase was primarily due to increased labor expenses and equipment depreciation due to the growth of our company as a result of the acquisition of Hifn, and to a lesser extent, Galazar.
The increase in stock-based compensation expense as compared to the same period a year ago was primarily due to new stock option and restricted stock unit grants made to Hifn and Galazar employees joining our company and the incremental costs associated with the employee stock option exchange in November 2008.
Acquisition related costs and other increased $3.8 million as compared to fiscal year 2009. The increase was primarily due to higher professional fees that are recorded as expenses related to business combinations and the accelerated depreciation of $0.8 million relating to shortened remaining lives of equipment acquired from Hifn, employee separation costs of $0.8 million, and building exit and moving costs of $0.3 million related to the Hifn Los Gatos facility.
Goodwill and Other Intangible Asset Impairment
Fiscal Year 2011
In the fourth quarter of fiscal year 2011, we conducted our annual impairment review comparing the fair value of our single reporting unit with its carrying value. As of the test date and as of year-end, and before consideration of a control premium, the fair value, which was estimated as our market capitalization, exceeded the carrying value of our net assets. As a result, no impairment was recorded for fiscal year 2011.
During the fourth quarter of fiscal year 2011, we decided to exit the data center virtualization market, and, in connection therewith, to discontinue development of our 10GbE network interface cards. We determined that the current economic and market environment did not provide the potential to deliver acceptable returns on the required investments in these products. As a result, in the fourth quarter of fiscal year 2011, we abandoned all related in-process research and development. In addition, we began to actively market for sale the related assets of our 10GbE technology, consisting primarily of underlying existing and core technology intangible assets. Charges related to this decision in the fourth quarter of fiscal year 2011 included $7.5 million for the impairment of intangible assets, which is included within the impairment of intangible assets and goodwill line in our consolidated statements of operations.
50
Table of Contents
The intangible asset impairment charge of $7.5 million consists of $0.8 million to write-off abandoned IPR&D and $6.7 million to write-down the carrying value of intangible assets that are held for sale to $0.2 million at March 27, 2011, which represents their estimated fair value less cost to sell based on third party bids received to date. In June 2011, we completed the asset sale process and received $0.2 million, net of selling costs.
Fiscal Year 2010
In the fourth quarter of fiscal year 2010, we conducted our annual impairment review comparing the fair value of our single reporting unit with its carrying value. As of the test date and as of year-end, and before consideration of a control premium, the fair value, which was estimated as our market capitalization, exceeded the carrying value of our net assets. As a result, no additional measurement was needed and no impairment was recorded for fiscal year 2010.
Fiscal Year 2009
During fiscal year 2009, a rapid and severe deterioration of worldwide economic conditions affected our industry and led customers to scale down their levels of production. As a result of third quarter fiscal year 2009 impairment indicators, we considered the potential impairment of goodwill and other long-lived assets including intangible assets. Indicators that required us to perform an interim impairment review consisted of further weakening in new orders from our customers throughout the third quarter and into the fourth quarter of fiscal year 2009, as well as the uncertainty of the magnitude and duration of the recession and expectations of industry analysts that demand for semiconductors would remain weak until economic conditions improved. In addition, we experienced a significant decline in our stock price that reduced our market capitalization below our net asset carrying value for an extended period of time. As a result of the goodwill and long-lived asset impairment assessments, we recorded a charge totaling $59.7 million in the third quarter of fiscal year 2009. This charge is comprised of $46.2 million related to goodwill and $13.5 million related to intangible assets, which is included in the impairment of intangible assets and goodwill line in the consolidated statements of operations.
Given the impairment indicators discussed above, we performed an interim goodwill impairment analysis during the third quarter of fiscal year 2009 using a combination of the income approach and the market approach. The analysis performed compared the implied fair value of goodwill to the carrying amount of goodwill on our balance sheet. Our estimate of the implied fair value of the goodwill was based on the quoted market price of our common stock and the discounted value of estimated future cash flows over a seven-year period with residual value. The analysis resulted in an impairment charge of approximately $46.2 million, which is included in the impairment of intangible assets and goodwill line in the consolidated statements of operations, that reduced our carrying value of goodwill to zero.
Solely for the purposes of establishing inputs for the fair value calculations described above related to goodwill impairment testing, we made the following assumptions. We assumed that the current economic recession would continue through fiscal year 2010, followed by a recovery period in fiscal years 2011 through 2013 and long-term industry growth past fiscal year 2013. In addition, we applied gross margin assumptions consistent with our historical trends and used a 3% growth factor to calculate the terminal value of the company, which was consistent with the rate used in the prior year’s annual impairment test. We used a 14% discount rate to calculate the present value of cash flows and the terminal value, which is slightly higher than the 12.5% discount rate we used in the prior year’s annual impairment test, primarily due to increases to the required market risk and small stock premiums.
Given the impairment indicators discussed above, we also performed a test of purchased intangible assets for recoverability. The assessment of recoverability was based upon the assumptions and underlying cash flow projections prepared for the concurrent interim goodwill impairment test. Our estimate of the implied fair value of the intangible assets was based on the discounted value of estimated future cash flows over a five-year period using a discount rate of 14%.
51
Table of Contents
The analysis determined that the carrying amount of the intangible assets exceeded the implied fair value and the difference was allocated to the intangible assets of the impacted asset group on a pro-rata basis using the relative carrying amounts of the assets. We recorded an impairment charge of approximately $13.5 million, which is included in the impairment of intangible assets and goodwill line in the consolidated statements of operations, of which $9.8 million related to existing technology, $1.4 million to patents/core technology, $1.3 million to distributor relationships, $0.9 million to customer relationships and $0.1 million to tradenames/trademarks.
Other Income and Expenses
The following table shows other income and expenses in dollars and as a percentage of net sales for the periods indicated (in thousands, except percentages):
| March 27, 2011 | March 28, 2010 | March 29, 2009 | 2011 vs. 2010 Change |
2010 vs. 2009 Change |
||||||||||||||||||||||||||||
| Net sales |
$ | 146,005 | $ | 134,878 | $ | 115,118 | ||||||||||||||||||||||||||
| Interest income and other, net |
5,925 | 4% | 7,030 | 5% | 9,693 | 8 | % | (16 | %) | (27 | %) | |||||||||||||||||||||
| Interest expense |
(1,258 | ) | (1% | ) | (1,296 | ) | (1% | ) | (1,253 | ) | (1 | %) | (3 | %) | 3 | % | ||||||||||||||||
| Impairment charges on investments |
(62 | ) | — | (317 | ) | — | (1,789 | ) | (2 | %) | (80 | %) | (82 | %) | ||||||||||||||||||
Interest Income and Other, Net
Interest income and other, net primarily consists of:
| • | interest income; |
| • | sublease income; |
| • | foreign exchange gains or losses; and |
| • | realized gains or losses on marketable securities. |
Fiscal Year 2011 versus Fiscal Year 2010
The $1.1 million, or 16%, decrease in interest income and other, net during fiscal year 2011 as compared to fiscal year 2010 was primarily attributable to a decrease in interest income as a result of lower invested cash balances and lower yield of the investments.
Our sublease income for fiscal 2011 was $1.3 million and was related to the sublet of our Hillview facility located in Milpitas, California (the “Hillview Facility”) that was assumed in connection with the acquisition of Sipex Corporation (“Sipex”) in August 2007. The sublease agreement terminated on March 31, 2011 and, as a result, we anticipate interest income and other, net to decrease by $1.3 million in the future.
Fiscal Year 2010 versus Fiscal Year 2009
The $2.7 million, or 27%, decrease in interest income and other, net during fiscal year 2010 as compared to fiscal year 2009 was primarily attributable to a decrease in interest income as a result of lower invested cash balances and lower yield of the investments.
Interest Expense
In connection with the Sipex acquisition, we assumed a lease financing obligation related to the Hillview Facility. The fair value of the Hillview Facility was estimated at $13.4 million at the time of the acquisition and was included in the property, plant and equipment, net line on the consolidated balance sheet. In accordance with
52
Table of Contents
purchase accounting, we have accounted for this sale and leaseback transaction as a financing transaction which was included in the long-term lease financing obligations line on our consolidated balance sheet. The effective interest rate is 8.2%. At the end of the lease term, March 31, 2011, the lease obligation was settled by returning the Hillview Facility to the lessor. In fiscal year 2011, we recorded $1.0 million in interest expense related to the Hillview Facility, and with the return of the building to the lessor, we expect that interest expense will decrease by the same amount in the future.
Impairment Charges on Investments
We periodically review and determine whether our investments with unrealized loss positions are other-than-temporarily impaired. This evaluation includes, but is not limited to, significant quantitative and qualitative assessments and estimates regarding credit ratings, collateralized support, the length of time and significance of a security’s loss position, our intent to not sell the security, and whether it is more likely than not that we will not have to sell the security before recovery of its cost basis. Realized gains or losses on the sale of marketable securities are determined by the specific identification method and are reflected in the interest income and other, net line on the consolidated statements of operations. Other-than-temporary declines in value of our investments both marketable and non-marketable, judged to be other-than-temporary, are reported in the impairment charges on investments line in the consolidated statements of operations.
In fiscal year 2010, an investment in GSAA Home Equity with a cost of $425,000 was downgraded from an AAA rating to a CCC rating. As a result of the reduction in the rating, quantitative analysis showing an increase in the default rate and decrease in prepayment rate of the investment, we recorded an other-than-temporary impairment charge of $91,000 during the second quarter of fiscal year 2010. In the three months ended September 26, 2010, due to further decline in the investment, we recorded an additional other-than-temporary impairment charge of $62,000. In the three months ended December 26, 2010, we sold this investment resulting in an immaterial loss from its adjusted basis.
In September 2008, Lehman Brothers Holdings Inc. (“Lehman”) filed a petition under Chapter 11 of the U.S. Bankruptcy Code with the U.S. Bankruptcy Court for the Southern District of New York. As a result of Lehman’s bankruptcy filing, we recorded an other-than-temporary impairment charge of $0.6 million during fiscal year 2009. In the three months ended March 27, 2011, we sold this investment resulting in an immaterial gain from its adjusted basis.
Our long-term investment consists of our investment in Skypoint Telecom Fund II (US), L.P. (“Skypoint Fund”). Skypoint Fund is a venture capital fund that invests primarily in private companies in the telecommunications and/or networking industries. We account for this non-marketable equity investment under the cost method. We periodically review and determine whether the investment is other-than-temporarily impaired, in which case the investment is written down to its impaired value. Any decline in the value of our non-marketable investments is reported in the impairment charges on investments line in the consolidated statements of operations.
We also have a long-term investment in TechFarm Ventures L.P. (“TechFarm Fund”), another venture capital fund that invests primarily in private companies in the telecommunications and/or networking industries, to which we had contributed our total commitment to the fund of $4.0 million in capital since we became a limited partner in May 2001. However, this investment had a carrying amount of zero as of March 27, 2011 and March 28, 2010, reflecting the net of the capital contribution and the cumulative impairment charges.
TechFarm Fund
In fiscal year 2009, we analyzed the fair value of the underlying investment in TechFarm Fund and concluded that the remaining carrying value in TechFarm Fund was other-than-temporarily impaired and recorded an impairment charge of $0.5 million. As such, we reduced the carrying value of our investment in TechFarm Fund to zero.
53
Table of Contents
Skypoint Fund
In fiscal year 2011, we analyzed the fair value of the underlying investments of Skypoint Fund and concluded that there was no impairment of the carrying value of our investment in the fund.
In fiscal year 2010, we analyzed the fair value of the underlying investments of Skypoint Fund and concluded a portion of the carrying value was other-than-temporarily impaired and recorded an impairment charge of $0.2 million.
In fiscal year 2009, we analyzed the fair value of the underlying investments of Skypoint Fund and concluded a portion of the carrying value was other-than-temporarily impaired and recorded an impairment charge of $0.7 million.
Provision for Income Taxes
Fiscal Year 2011
Our effective tax rate for fiscal year 2011 was (0.7%). The provision for fiscal year 2011 differs from the amount computed by applying the statutory federal rate of 35%. This difference is principally due to our not benefitting from deferred tax assets as a result of increases in valuation allowances during fiscal year 2011.
Fiscal Year 2010
Our effective tax rate for fiscal year 2010 was 1.6%. The provision for fiscal year 2010 differs from the amount computed by applying the statutory federal rate of 35%. This difference is principally due to changes in valuation allowance, federal refundable tax credit benefits, foreign rate differential, true-up adjustment of prior year tax expense and net operating loss benefits during fiscal year 2010.
Fiscal Year 2009
Our effective tax rate for fiscal year 2009 was 0.7%. The provision for fiscal year 2009 differs from the amount computed by applying the statutory federal rate of 35%. This difference is principally due to changes in valuation allowance and net operating loss benefits during fiscal year 2009.
LIQUIDITY AND CAPITAL RESOURCES
| Fiscal Years Ended | ||||||||||||
| March 27, 2011 |
March 28, 2010 |
March 29, 2009 |
||||||||||
| (dollars in thousands) | ||||||||||||
| Cash and cash equivalents |
$ | 15,039 | $ | 25,486 | $ | 89,002 | ||||||
| Short-term investments |
185,960 | 186,598 | 167,341 | |||||||||
| Total cash, cash equivalents, and short-term investments |
$ | 200,999 | $ | 212,084 | $ | 256,343 | ||||||
| Percentage of total assets |
67 | % | 64 | % | 76 | % | ||||||
| Net cash (used in) provided by operating activities |
$ | (2,962 | ) | $ | 3,641 | $ | 3,268 | |||||
| Net cash used in investing activities |
(4,731 | ) | (64,594 | ) | (25,038 | ) | ||||||
| Net cash used in financing activities |
(2,754 | ) | (2,563 | ) | (11,244 | ) | ||||||
| Net decrease in cash and cash equivalents |
$ | (10,447 | ) | $ | (63,516 | ) | $ | (33,014 | ) | |||
Fiscal Year 2011
Operating Activities—Our net loss was $35.7 million in fiscal year 2011. After adjustments for non-cash items and changes in working capital, we used $3.0 million of cash from operating activities.
54
Table of Contents
Significant non-cash charges included:
| • | Depreciation and amortization expenses of $19.4 million; |
| • | Intangible assets and goodwill impairment of $7.5 million; and |
| • | Stock-based compensation expense of $7.4 million. |
Working capital changes included:
| • | a $4.8 million decrease in accounts receivable primarily due to lower shipments and improved collections; |
| • | a $7.0 million increase in inventory primarily due to higher material receipts for our datacom and storage and power products in anticipation of higher future shipments of our new products and the impact of the semiconductor industry’s inventory correction; and |
| • | a $2.8 million decrease in other current and non-current assets primarily as a result of a tax refund. |
Investment Activities—In fiscal year 2011, net cash used in investing activities includes net purchases of short-term marketable securities of $0.9 million and $3.7 million in purchases of property, plant and equipment and intellectual property.
Financing Activities—In fiscal year 2011, net cash used in financing activities reflects the $4.0 million repayment of lease financing partially offset by $1.2 million of proceeds associated with our employee stock plans.
From time to time, we acquire outstanding common stock in the open market to partially offset dilution from our equity award programs, to increase our return on our invested capital and to bring our cash to a more appropriate level for our company.
On August 28, 2007, we announced the approval of a share repurchase plan (“2007 SRP”) and authorized the repurchase of up to $100 million of our common stock.
During fiscal years 2011 and 2010, we did not repurchase any shares of our common stock.
As of March 27, 2011, the remaining authorized amount for share repurchases under the 2007 SRP was $11.8 million. The 2007 SRP does not have a termination date. We may continue to utilize our share repurchase plan, which would reduce our cash, cash equivalents and/or short-term marketable securities available to fund future operations and to meet other liquidity requirements.
To date, inflation has not had a significant impact on our operating results.
We anticipate that we will finance our operations with expected cash flows from operations, existing cash and investment balances, and some combination of long-term debt and/or lease financing and additional sales of equity securities. The combination and sources of capital will be determined by management based on our needs and prevailing market conditions.
Fiscal Year 2010
Operating Activities—Our net loss was $28.1 million. After adjustments for non-cash items and changes in working capital, we generated $3.6 million of cash from operating activities.
Significant non-cash charges included:
| • | Depreciation and amortization expenses of $20.8 million; |
| • | Stock-based compensation expense of $6.0 million; and |
| • | Losses on investments of $0.3 million. |
55
Table of Contents
Working capital changes included:
| • | a $5.1 million increase in accounts receivable primarily due to higher shipments; |
| • | a $2.5 million increase in accounts payable primarily due to the increased number of vendors and related activity due to acquisitions; and |
| • | a $4.2 million increase in deferred income and allowances on sales to distributors as our distributors have increased their inventory in response to improving end customer demand. |
Investment Activities—In fiscal year 2010, net cash used in investing activities includes acquisitions of Hifn, Galazar and Neterion for $53.3 million, net purchases of short-term marketable securities of $5.4 million and $5.8 million in purchases of property, plant and equipment and intellectual property.
Financing Activities—In fiscal year 2010, net cash used in financing activities reflects the $3.1 million repayment of lease financing partially offset by $0.5 million of proceeds associated with our employee stock plans.
Fiscal Year 2009
Operating Activities—Our net loss was $73.0 million. After adjustments for non-cash items and changes in working capital, we generated $3.3 million of cash from operating activities.
Significant non-cash charges included:
| • | Goodwill and other intangible assets impairment charge of $59.7 million; |
| • | Depreciation and amortization expenses of $14.4 million; |
| • | Stock-based compensation expense of $4.9 million; and |
| • | Losses on investments of $1.8 million. |
Working capital changes included:
| • | a $4.4 million decrease in accounts receivable primarily due to lower shipments in the period; |
| • | a $3.4 million decrease in accounts payable primarily due to reduced purchases of inventory; and |
| • | a $1.7 million decrease in deferred income and allowances on sales to distributors as our distributors have reduced their inventory in response to reduced end customer demand. |
Investment Activities—In fiscal year 2009, net cash used in investing activities includes net purchases of short-term marketable securities of $22.6 million and $2.3 million in purchases of property, plant and equipment and intellectual property.
Financing Activities—In fiscal year 2009, net cash used in financing activities reflects the repurchase of 1.6 million shares of our common stock in fiscal year 2009 for $13.4 million and the $1.3 million repayment of lease financing partially offset by $3.5 million of proceeds associated with our employee stock plans.
OFF-BALANCE SHEET ARRANGEMENTS
As of March 27, 2011, we had not utilized special purpose entities to facilitate off-balance sheet financing arrangements. However, we have, in the normal course of business, entered into agreements which impose warranty obligations with respect to our products or which obligate us to provide indemnification of varying scope and terms to customers, vendors, lessors and business partners, our directors and executive officers, purchasers of assets or subsidiaries, and other parties with respect to certain matters. These arrangements may
56
Table of Contents
constitute “off-balance sheet transactions” as defined in Section 303(a)(4) of Regulation S-K. Please see “Notes to the Consolidated Financial Statements, Note 16—Commitments and Contingencies” for further discussion of our product warranty liabilities and indemnification obligations.
As discussed in “Notes to the Consolidated Financial Statements, Note 16—Commitments and Contingencies”, during the normal course of business, we make certain indemnities and commitments under which we may be required to make payments in relation to certain transactions. These indemnities include non-infringement of patents and intellectual property, indemnities to our customers in connection with the delivery, design, manufacture and sale of our products, indemnities to our directors and officers in connection with legal proceedings, indemnities to various lessors in connection with facility leases for certain claims arising from such facility or lease, and indemnities to other parties to certain acquisition agreements. The duration of these indemnities and commitments varies, and in certain cases, is indefinite. We believe that substantially all of our indemnities and commitments provide for limitations on the maximum potential future payments we could be obligated to make. However, we are unable to estimate the maximum amount of liability related to our indemnities and commitments because such liabilities are contingent upon the occurrence of events which are not reasonably determinable. We believe that any liability for these indemnities and commitments would not be material to our accompanying consolidated financial statements.
CONTRACTUAL OBLIGATIONS AND COMMITMENTS
Our contractual obligations and commitments at March 27, 2011 were as follows (in thousands):
| Payments due by period | ||||||||||||||||||||
| Contractual Obligations |
Total | Less than 1 year |
1-3 years |
3-5 years |
More than 5 years |
|||||||||||||||
| Purchase commitments(1) |
$ | 16,093 | $ | 16,093 | $ | — | $ | — | $ | — | ||||||||||
| Long-term lease financing obligation(2) |
2,071 | 1,681 | 390 | — | — | |||||||||||||||
| Lease obligations(3) |
7,187 | 2,614 | 3,156 | 1,417 | — | |||||||||||||||
| Long-term investment commitments (Skypoint Fund)(4) |
286 | 286 | — | — | — | |||||||||||||||
| Remediation commitment(5) |
113 | 63 | 10 | 40 | — | |||||||||||||||
| Total |
$ | 25,750 | $ | 20,737 | $ | 3,556 | $ | 1,457 | $ | — | ||||||||||
| Note: | The table above excludes the liability for unrecognized income tax benefits of approximately $3.7 million, which includes accrued interest and penalties of approximately $0.3 million as of March 27, 2011, since we cannot predict with reasonable reliability the timing of cash settlements with the respective taxing authorities. |
| (1) | We place purchase orders with wafer foundries and other vendors as part of our normal course of business. We expect to receive and pay for wafers, capital equipment and various service contracts over the next 12 months from our existing cash balances. |
| (2) | Includes $2.1 million related to engineering design software licenses purchased under capital leases but excludes approximately $12.2 million final obligation related to settling the Hillview lease by returning the facility to lessor on March 31, 2011. |
| (3) | Includes $5.7 million related to leased engineering design software licenses and $1.5 million related to office space leased around the world. |
| (4) | The commitment related to the Skypoint Fund does not have a set payment schedule and thus will become payable upon request from the Fund’s General Partner up through June 30, 2011. |
| (5) | The commitment relates to the environmental monitoring and remediation activities of Micro Power Systems, Inc. |
RECENT ACCOUNTING PRONOUNCEMENTS
Please refer to Part II, Item 8—“Financial Statements and Supplementary Data” and “Notes to Consolidated Financial Statements, Note 2—Accounting Policies.”
57
Table of Contents
| ITEM 7A. | QUANTITATIVE AND QUALITATIVE DISCLOSURES ABOUT MARKET RISK |
Foreign Currency Fluctuations. We are exposed to foreign currency fluctuations primarily through our foreign operations. This exposure is the result of foreign operating expenses being denominated in foreign currency. Operational currency requirements are typically forecasted for a one-month period. If there is a need to hedge this risk, we may enter into transactions to purchase currency in the open market or enter into forward currency exchange contracts.
If our foreign operations forecasts are overstated or understated during periods of currency volatility, we could experience unanticipated currency gains or losses. For fiscal years 2011 and 2010, we did not have significant foreign currency denominated net assets or net liabilities positions, and had no foreign currency contracts outstanding.
Investment Risk and Interest Rate Sensitivity. We maintain investment portfolio holdings of various issuers, types, and maturity dates with various banks and investment banking institutions. The market value of these investments on any given day during the investment term may vary as a result of market interest rate fluctuations. Our investment portfolio consisted of cash equivalents, money market funds and fixed income securities of $193.4 million as of March 27, 2011 and $206.2 million as of March 28, 2010. These securities, like all fixed income instruments, are subject to interest rate risk and will vary in value as market interest rates fluctuate. If market interest rates were to increase or decline immediately and uniformly by less than 10% from levels as of March 27, 2011, the increase or decline in the fair value of the portfolio would not be material. At March 27, 2011, the difference between the fair value and the underlying cost of the investments portfolio was a net unrealized gain of $0.5 million.
Our short-term investments are classified as “available-for-sale” securities and the cost of securities sold is based on the specific identification method. At March 27, 2011, short-term investments consisted of asset and mortgage-backed securities, corporate bonds and government agency securities totaling $186.0 million.
58
Table of Contents
| ITEM 8. | FINANCIAL STATEMENTS AND SUPPLEMENTARY DATA |
INDEX TO CONSOLIDATED FINANCIAL STATEMENTS
| Page | ||||
| 60 | ||||
| 61 | ||||
| 62 | ||||
| Consolidated Statements of Stockholders’ Equity and Comprehensive Income (Loss) |
63 | |||
| 64 | ||||
| 65 | ||||
59
Table of Contents
Report of Independent Registered Public Accounting Firm
To the Board of Directors and Stockholders of Exar Corporation:
In our opinion, the accompanying consolidated balance sheets and the related consolidated statements of operations, stockholders’ equity and comprehensive income (loss), and of cash flows present fairly, in all material respects, the financial position of Exar Corporation and its subsidiaries at March 27, 2011 and March 28, 2010, and the results of their operations and their cash flows for each of the three years in the period ended March 27, 2011 in conformity with accounting principles generally accepted in the United States of America. Also in our opinion, the Company maintained, in all material respects, effective internal control over financial reporting as of March 27, 2011, based on criteria established in Internal Control—Integrated Framework issued by the Committee of Sponsoring Organizations of the Treadway Commission (COSO). The Company’s management is responsible for these financial statements, for maintaining effective internal control over financial reporting and for its assessment of the effectiveness of internal control over financial reporting, included in Management’s Annual Report on Internal Control over Financial Reporting appearing under Item 9A. Our responsibility is to express opinions on these financial statements and on the Company’s internal control over financial reporting based on our integrated audits. We conducted our audits in accordance with the standards of the Public Company Accounting Oversight Board (United States). Those standards require that we plan and perform the audits to obtain reasonable assurance about whether the financial statements are free of material misstatement and whether effective internal control over financial reporting was maintained in all material respects. Our audits of the financial statements included examining, on a test basis, evidence supporting the amounts and disclosures in the financial statements, assessing the accounting principles used and significant estimates made by management, and evaluating the overall financial statement presentation. Our audit of internal control over financial reporting included obtaining an understanding of internal control over financial reporting, assessing the risk that a material weakness exists, and testing and evaluating the design and operating effectiveness of internal control based on the assessed risk. Our audits also included performing such other procedures as we considered necessary in the circumstances. We believe that our audits provide a reasonable basis for our opinions.
A company’s internal control over financial reporting is a process designed to provide reasonable assurance regarding the reliability of financial reporting and the preparation of financial statements for external purposes in accordance with generally accepted accounting principles. A company’s internal control over financial reporting includes those policies and procedures that (i) pertain to the maintenance of records that, in reasonable detail, accurately and fairly reflect the transactions and dispositions of the assets of the company; (ii) provide reasonable assurance that transactions are recorded as necessary to permit preparation of financial statements in accordance with generally accepted accounting principles, and that receipts and expenditures of the company are being made only in accordance with authorizations of management and directors of the company; and (iii) provide reasonable assurance regarding prevention or timely detection of unauthorized acquisition, use, or disposition of the company’s assets that could have a material effect on the financial statements.
Because of its inherent limitations, internal control over financial reporting may not prevent or detect misstatements. Also, projections of any evaluation of effectiveness to future periods are subject to the risk that controls may become inadequate because of changes in conditions, or that the degree of compliance with the policies or procedures may deteriorate.
San Jose, California
June 10, 2011
60
Table of Contents
EXAR CORPORATION AND SUBSIDIARIES
CONSOLIDATED BALANCE SHEETS
(In thousands, except share amounts)
| March 27, 2011 |
March 28, 2010 |
|||||||
| ASSETS | ||||||||
| Current assets: |
||||||||
| Cash and cash equivalents |
$ | 15,039 | $ | 25,486 | ||||
| Short-term marketable securities |
185,960 | 186,598 | ||||||
| Accounts receivable (net of allowances of $1,165 and $831) |
9,776 | 13,461 | ||||||
| Accounts receivable, related party (net of allowances of $358 and $605) |
3,194 | 4,323 | ||||||
| Inventories |
21,962 | 15,000 | ||||||
| Other current assets |
3,562 | 5,106 | ||||||
| Total current assets |
239,493 | 249,974 | ||||||
| Property, plant and equipment, net |
38,009 | 42,941 | ||||||
| Goodwill |
3,184 | 3,085 | ||||||
| Intangible assets, net |
15,390 | 31,957 | ||||||
| Other non-current assets |
2,139 | 5,357 | ||||||
| Total assets |
$ | 298,215 | $ | 333,314 | ||||
| LIABILITIES AND STOCKHOLDERS’ EQUITY | ||||||||
| Current liabilities: |
||||||||
| Accounts payable |
$ | 8,794 | $ | 9,828 | ||||
| Accrued compensation and related benefits |
6,069 | 6,619 | ||||||
| Deferred income and allowances on sales to distributors |
4,632 | 4,227 | ||||||
| Deferred income and allowances on sales to distributor, related party |
10,680 | 10,650 | ||||||
| Short-term lease financing obligations |
1,681 | 3,540 | ||||||
| Other accrued expenses |
5,381 | 7,058 | ||||||
| Total current liabilities |
37,237 | 41,922 | ||||||
| Long-term lease financing obligations |
12,558 | 13,454 | ||||||
| Other non-current obligations |
3,841 | 3,806 | ||||||
| Total liabilities |
53,636 | 59,182 | ||||||
| Commitments and contingencies (Notes 16 and 17) |
||||||||
| Stockholders’ equity: |
||||||||
| Preferred stock, $.0001 par value; 2,250,000 shares authorized; no shares outstanding |
— | — | ||||||
| Common stock, $.0001 par value; 100,000,000 shares authorized; 44,519,663 and 43,839,514 shares outstanding at March 27, 2011 and March 28, 2010, respectively |
4 | 4 | ||||||
| Additional paid-in capital |
728,139 | 720,455 | ||||||
| Accumulated other comprehensive income (loss) |
(287 | ) | 1,282 | |||||
| Treasury stock at cost, 19,924,369 shares at March 27, 2011 and March 28, 2010 |
(248,983 | ) | (248,983 | ) | ||||
| Accumulated deficit |
(234,294 | ) | (198,626 | ) | ||||
| Total stockholders’ equity |
244,579 | 274,132 | ||||||
| Total liabilities and stockholders’ equity |
$ | 298,215 | $ | 333,314 | ||||
See accompanying notes to consolidated financial statements.
61
Table of Contents
EXAR CORPORATION AND SUBSIDIARIES
CONSOLIDATED STATEMENTS OF OPERATIONS
(In thousands, except per share amounts)
| Fiscal Years Ended | ||||||||||||
| March 27, 2011 |
March 28, 2010 |
March 29, 2009 |
||||||||||
| Sales: |
||||||||||||
| Net sales |
$ | 101,721 | $ | 97,676 | $ | 74,620 | ||||||
| Net sales, related party |
44,284 | 37,202 | 40,498 | |||||||||
| Total net sales |
146,005 | 134,878 | 115,118 | |||||||||
| Cost of sales: |
||||||||||||
| Cost of sales |
54,992 | 48,728 | 41,811 | |||||||||
| Cost of sales, related party |
20,972 | 17,581 | 19,933 | |||||||||
| Amortization of purchased intangible assets |
6,044 | 5,187 | 3,129 | |||||||||
| Total cost of sales |
82,008 | 71,496 | 64,873 | |||||||||
| Gross profit |
63,997 | 63,382 | 50,245 | |||||||||
| Operating expenses: |
||||||||||||
| Research and development |
51,098 | 48,511 | 31,829 | |||||||||
| Selling, general and administrative |
45,432 | 48,861 | 38,962 | |||||||||
| Impairment of intangible assets and goodwill |
7,485 | — | 59,676 | |||||||||
| Total operating expenses |
104,015 | 97,372 | 130,467 | |||||||||
| Loss from operations |
(40,018 | ) | (33,990 | ) | (80,222 | ) | ||||||
| Other income and expense, net: |
||||||||||||
| Interest income and other, net |
5,925 | 7,030 | 9,693 | |||||||||
| Interest expense |
(1,258 | ) | (1,296 | ) | (1,253 | ) | ||||||
| Impairment charges on investments |
(62 | ) | (317 | ) | (1,789 | ) | ||||||
| Total other income and expense, net |
4,605 | 5,417 | 6,651 | |||||||||
| Loss before income taxes |
(35,413 | ) | (28,573 | ) | (73,571 | ) | ||||||
| Provision for (benefit from) income taxes |
255 | (463 | ) | (535 | ) | |||||||
| Net loss |
$ | (35,668 | ) | $ | (28,110 | ) | $ | (73,036 | ) | |||
| Loss per share: |
||||||||||||
| Basic and diluted loss per share |
$ | (0.81 | ) | $ | (0.64 | ) | $ | (1.70 | ) | |||
| Shares used in the computation of loss per share: |
||||||||||||
| Basic and diluted |
44,218 | 43,584 | 42,887 | |||||||||
See accompanying notes to consolidated financial statements.
62
Table of Contents
EXAR CORPORATION AND SUBSIDIARIES
CONSOLIDATED STATEMENTS OF STOCKHOLDERS’ EQUITY AND COMPREHENSIVE INCOME (LOSS)
(In thousands, except share amounts)
| Common Stock | Treasury Stock | Additional Paid–in- Capital |
Accumulated Deficit |
Accumulated Other Compre- hensive Income (Loss) |
Total Stockholders’ Equity |
|||||||||||||||||||||||||||
| Shares | Amount | Shares | Amount | |||||||||||||||||||||||||||||
| Balance, March 30, 2008 |
62,216,783 | $ | 4 | (18,288,021 | ) | $ | (235,538 | ) | $ | 702,218 | $ | (97,480 | ) | $ | 1,873 | $ | 371,077 | |||||||||||||||
| Comprehensive loss: |
||||||||||||||||||||||||||||||||
| Net loss |
(73,036 | ) | (73,036 | ) | ||||||||||||||||||||||||||||
| Other comprehensive income: |
||||||||||||||||||||||||||||||||
| Change in unrealized gains on marketable securities, including tax of $485 |
(1,071 | ) | (1,071 | ) | ||||||||||||||||||||||||||||
| Total comprehensive loss |
$ | (74,107 | ) | |||||||||||||||||||||||||||||
| Reclassification of deferred compensation liability |
210 | 210 | ||||||||||||||||||||||||||||||
| Issuance of common stock through employee stock plans |
635,959 | 3,518 | 3,518 | |||||||||||||||||||||||||||||
| Issuance of common stock for vested restricted stock units |
117,437 | |||||||||||||||||||||||||||||||
| Withholding of common shares for tax obligations on vested restricted stock units |
(9,539 | ) | (60 | ) | (60 | ) | ||||||||||||||||||||||||||
| Stock-based compensation |
4,901 | 4,901 | ||||||||||||||||||||||||||||||
| Acquisition of treasury stock |
(1,636,348 | ) | (13,445 | ) | (13,445 | ) | ||||||||||||||||||||||||||
| Balance, March 29, 2009 |
62,960,640 | $ | 4 | (19,924,369 | ) | $ | (248,983 | ) | $ | 710,787 | $ | (170,516 | ) | $ | 802 | $ | 292,094 | |||||||||||||||
| Comprehensive loss: |
||||||||||||||||||||||||||||||||
| Net loss |
(28,110 | ) | (28,110 | ) | ||||||||||||||||||||||||||||
| Other comprehensive income: |
||||||||||||||||||||||||||||||||
| Change in unrealized gains on marketable securities, including tax of $289 |
480 | 480 | ||||||||||||||||||||||||||||||
| Total comprehensive loss |
$ | (27,630 | ) | |||||||||||||||||||||||||||||
| Issuance of common stock through employee stock plans |
83,553 | 538 | 538 | |||||||||||||||||||||||||||||
| Issuance of common stock in connection with Hifn acquisition |
418,026 | 2,709 | 2,709 | |||||||||||||||||||||||||||||
| Deferred salary option adjustment, net |
1,325 | 20 | 20 | |||||||||||||||||||||||||||||
| Issuance of common stock for vested restricted stock units |
349,409 | 3 | 3 | |||||||||||||||||||||||||||||
| Withholding of common shares for tax obligations on vested restricted stock units |
(49,070 | ) | (347 | ) | (347 | ) | ||||||||||||||||||||||||||
| Tax benefit from stock plans |
780 | 780 | ||||||||||||||||||||||||||||||
| Stock-based compensation |
5,965 | 5,965 | ||||||||||||||||||||||||||||||
| Balance, March 28, 2010 |
63,763,883 | $ | 4 | (19,924,369 | ) | $ | (248,983 | ) | $ | 720,455 | $ | (198,626 | ) | $ | 1,282 | $ | 274,132 | |||||||||||||||
| Comprehensive loss: |
||||||||||||||||||||||||||||||||
| Net loss |
(35,668 | ) | (35,668 | ) | ||||||||||||||||||||||||||||
| Other comprehensive loss: |
||||||||||||||||||||||||||||||||
| Change in unrealized gains on marketable securities, including tax of $0 |
(1,569 | ) | (1,569 | ) | ||||||||||||||||||||||||||||
| Total comprehensive loss |
$ | (37,237 | ) | |||||||||||||||||||||||||||||
| Issuance of common stock through employee stock plans |
195,087 | 1,208 | 1,208 | |||||||||||||||||||||||||||||
| Issuance of common stock in connection with Hifn acquisition |
4,196 | 27 | 27 | |||||||||||||||||||||||||||||
| Issuance of common stock for vested restricted stock units |
619,561 | |||||||||||||||||||||||||||||||
| Withholding of common shares for tax obligations on vested restricted stock units |
(138,695 | ) | (969 | ) | (969 | ) | ||||||||||||||||||||||||||
| Tax benefit from stock plans |
37 | 37 | ||||||||||||||||||||||||||||||
| Stock-based compensation |
7,381 | 7,381 | ||||||||||||||||||||||||||||||
| Balance, March 27, 2011 |
64,444,032 | $ | 4 | (19,924,369 | ) | $ | (248,983 | ) | $ | 728,139 | $ | (234,294 | ) | $ | (287 | ) | $ | 244,579 | ||||||||||||||
See accompanying notes to consolidated financial statements.
63
Table of Contents
EXAR CORPORATION AND SUBSIDIARIES
CONSOLIDATED STATEMENTS OF CASH FLOWS
(In thousands)
| Fiscal Years Ended | ||||||||||||
| March 27, 2011 |
March 28, 2010 |
March 29, 2009 |
||||||||||
| Cash flows from operating activities: |
||||||||||||
| Net loss |
$ | (35,668 | ) | $ | (28,110 | ) | $ | (73,036 | ) | |||
| Reconciliation of net loss to net cash provided by (used in) operating activities: |
||||||||||||
| Intangible assets impairment and goodwill |
7,485 | — | 59,676 | |||||||||
| Depreciation and amortization |
19,414 | 20,825 | 14,446 | |||||||||
| Stock-based compensation expense |
7,381 | 5,965 | 4,934 | |||||||||
| Other than temporary loss on investments |
62 | 317 | 1,789 | |||||||||
| Changes in operating assets and liabilities, net of effects of acquisitions: |
||||||||||||
| Accounts receivable and accounts receivable, related party |
4,814 | (5,121 | ) | 4,407 | ||||||||
| Inventories |
(6,962 | ) | 6,256 | (1,510 | ) | |||||||
| Other current and non-current assets |
2,756 | (204 | ) | 819 | ||||||||
| Accounts payable |
(1,202 | ) | 2,473 | (3,410 | ) | |||||||
| Accrued compensation and related benefits |
(1,495 | ) | (925 | ) | (1,032 | ) | ||||||
| Other accrued expenses |
(245 | ) | (2,030 | ) | (2,205 | ) | ||||||
| Income taxes payable |
263 | — | 94 | |||||||||
| Deferred income and allowance on sales to distributors and related party distributor |
435 | 4,195 | (1,704 | ) | ||||||||
| Net cash (used in) provided by operating activities |
(2,962 | ) | 3,641 | 3,268 | ||||||||
| Cash flows from investing activities: |
||||||||||||
| Purchases of property, plant and equipment and intellectual property, net |
(3,656 | ) | (5,830 | ) | (2,255 | ) | ||||||
| Purchases of short-term marketable securities |
(157,609 | ) | (166,229 | ) | (264,087 | ) | ||||||
| Proceeds from maturities of short-term marketable securities |
74,459 | 114,414 | 199,064 | |||||||||
| Proceeds from sales of short-term marketable securities |
82,294 | 46,426 | 42,467 | |||||||||
| Other investment activities |
(219 | ) | (42 | ) | (227 | ) | ||||||
| Acquisition of Neterion, net of cash acquired |
— | (8,544 | ) | — | ||||||||
| Acquisition of Galazar, net of cash acquired |
— | (4,445 | ) | — | ||||||||
| Acquisition of Hifn, net of cash acquired |
— | (40,344 | ) | — | ||||||||
| Net cash used in investing activities |
(4,731 | ) | (64,594 | ) | (25,038 | ) | ||||||
| Cash flows from financing activities: |
||||||||||||
| Repurchase of common stock |
— | — | (13,445 | ) | ||||||||
| Proceeds from issuance of common stock |
1,208 | 541 | 3,518 | |||||||||
| Repayment of lease financing obligations |
(3,962 | ) | (3,104 | ) | (1,317 | ) | ||||||
| Net cash used in financing activities |
(2,754 | ) | (2,563 | ) | (11,244 | ) | ||||||
| Net decrease in cash and cash equivalents |
(10,447 | ) | (63,516 | ) | (33,014 | ) | ||||||
| Cash and cash equivalents at the beginning of period |
25,486 | 89,002 | 122,016 | |||||||||
| Cash and cash equivalents at the end of period |
$ | 15,039 | $ | 25,486 | $ | 89,002 | ||||||
| Supplemental disclosure of non-cash investing and financing activities: |
||||||||||||
| Issuance of common stock in connection with Hifn acquisition |
27 | 2,709 | — | |||||||||
| Cash paid for income taxes |
179 | 185 | 164 | |||||||||
| Cash received from income taxes refund |
3,078 | — | — | |||||||||
| Cash paid for interest |
1,289 | 1,327 | 1,200 | |||||||||
| Property, plant and equipment acquired under capital lease |
1,808 | 2,012 | 2,571 | |||||||||
See accompanying notes to consolidated financial statements.
64
Table of Contents
EXAR CORPORATION AND SUBSIDIARIES
NOTES TO CONSOLIDATED FINANCIAL STATEMENTS
FISCAL YEARS ENDED MARCH 27, 2011, MARCH 28, 2010 AND MARCH 29, 2009
NOTE 1. DESCRIPTION OF BUSINESS
Exar Corporation was incorporated in California in 1971 and reincorporated in Delaware in 1991. Exar Corporation and its subsidiaries (“Exar” or “we”) is a fabless semiconductor company that designs, sub-contracts manufacturing and sells highly differentiated silicon, software and subsystem solutions for industrial, telecom, networking and storage applications.
On March 16, 2010, we completed the acquisition of Neterion, Inc. (“Neterion”), a supplier of 10 Gigabit Ethernet (“GbE”) controller silicon and card solutions optimized for virtualized data centers located in Sunnyvale, California.
On June 17, 2009, we completed the acquisition of Galazar Networks, Inc. (“Galazar”), a fabless semiconductor company focused on carrier grade transport over telecom networks based in Ottawa, Ontario, Canada. Galazar’s product portfolio addressed transport of a wide range of datacom and telecom services including Ethernet, SAN, TDM and video over SONET/SDH, PDH and OTN networks.
On April 3, 2009, we completed the acquisition of hi/fn, inc. (“Hifn”), a provider of network-and storage-security and data reduction products located in Los Gatos, California.
Certain reclassifications have been made to the prior year consolidated financial statements to conform to the current year’s presentation. Such reclassification had no effect on previously reported results of operations or stockholders’ equity.
NOTE 2. ACCOUNTING POLICIES
Basis of Presentation—Our fiscal years consist of 52 or 53 weeks. In a 52-week year, each fiscal quarter consists of 13 weeks. The three fiscal years 2011, 2010 and 2009 are each comprised of 52-weeks. Fiscal year 2012 will consist of 53 weeks.
Principles of Consolidation—The consolidated financial statements include the accounts of Exar Corporation and its wholly-owned subsidiaries. All intercompany accounts and transactions have been eliminated.
Use of Management Estimates—The preparation of consolidated financial statements in conformity with generally accepted accounting principles in the United States requires management to make estimates, judgments and assumptions that affect the reported amounts of assets, liabilities, revenues and expenses and related disclosure of contingent assets and liabilities. On an on-going basis, we evaluate our estimates, including (1) revenue recognition; (2) valuation of inventories; (3) income taxes; (4) stock-based compensation; (5) goodwill; and (6) long-lived assets. Actual results could differ from these estimates and material effects on operating results and financial position may result.
Business Combinations—The estimated fair value of acquired assets and assumed liabilities and the results of operations of acquired businesses are included in our consolidated financial statements from the effective date of the purchase. The total purchase price is allocated to the estimated fair value of assets acquired and liabilities assumed. (See Note 3—“Business Combinations.”)
Cash and Cash Equivalents—We consider all highly liquid debt securities and investments with maturities of 90 days or less from the date of purchase to be cash and cash equivalents. Cash and cash equivalents also consist of cash on deposit with banks and money market funds.
65
Table of Contents
EXAR CORPORATION AND SUBSIDIARIES
NOTES TO CONSOLIDATED FINANCIAL STATEMENTS—(CONTINUED)
FISCAL YEARS ENDED MARCH 27, 2011, MARCH 28, 2010, AND MARCH 29, 2009
Inventories—Inventories are recorded at the lower of cost or market, determined on a first-in, first-out basis. Cost is computed using the standard cost, which approximates average actual cost. Inventory is written down when conditions indicate that the selling price could be less than cost due to physical deterioration, obsolescence, changes in price levels, or other causes. The write-down of excess inventories is generally based on inventory levels in excess of twelve months of demand, as judged by management, for each specific product.
Property, Plant and Equipment—Property, plant and equipment, including assets held under capital leases and leasehold improvements, are stated at cost less accumulated depreciation and amortization. Depreciation for machinery and equipment is computed using the straight-line method over the estimated useful lives of the assets, which ranges from three to ten years. Buildings are depreciated using the straight-line method over an estimated useful life of 30 years. Assets held under capital leases and leasehold improvements are amortized over the shorter of the terms of the leases or their estimated useful lives. Land is not depreciated.
Non-Marketable Equity Securities—Non-marketable equity investments are accounted for at historical cost and are presented on our consolidated balance sheets within other non-current assets.
Other-Than-Temporary Impairment—All of our marketable and non-marketable investments are subject to periodic impairment reviews. Investments are considered to be impaired when a decline in fair value is judged to be other-than-temporary, as follows:
Marketable investments—When the resulting fair value is significantly below cost basis and/or the significant decline has lasted for an extended period of time, we perform an evaluation to determine whether the marketable equity security is other than temporarily impaired. The evaluation that we use to determine whether a marketable equity security is other than temporarily impaired is based on the specific facts and circumstances present at the time of assessment, which include significant quantitative and qualitative assessments and estimates regarding credit ratings, collateralized support, the length of time and significance of a security’s loss position and intent and ability to hold a security to maturity or forecasted recovery. Other-than-temporary declines in value of our investments are reported in the impairment charges on investments line in the consolidated statements of operations.
Non-marketable equity investments—When events or circumstances are identified that would likely have a significant adverse effect on the fair value of the investment and the fair value is significantly below cost basis and/or the significant decline has lasted for an extended period of time, we perform an impairment analysis. The indicators that we use to identify those events and circumstances include:
| • | the investment manager’s evaluation; |
| • | the investee’s revenue and earnings trends relative to predefined milestones and overall business prospects; |
| • | the technological feasibility of the investee’s products and technologies; |
| • | the general market conditions in the investee’s industry; and |
| • | the investee’s liquidity, debt ratios and the rate at which the investee is using cash. |
Investments identified as having an indicator of impairment are subject to further analysis to determine if the investment is other than temporarily impaired, and if so, the investment is written down to its impaired value. When an investee is not considered viable from a financial or technological point of view, the entire investment is written down. Impairment of non-marketable equity investments is recorded in the impairment charges on investments line in the consolidated statements of operations.
66
Table of Contents
EXAR CORPORATION AND SUBSIDIARIES
NOTES TO CONSOLIDATED FINANCIAL STATEMENTS—(CONTINUED)
FISCAL YEARS ENDED MARCH 27, 2011, MARCH 28, 2010, AND MARCH 29, 2009
Goodwill—Goodwill represents the excess of the purchase price over the fair value of the net tangible and identifiable intangible assets acquired in a business combination. We evaluate goodwill for impairment on an annual basis or whenever events and changes in circumstances suggest that the carrying amount may not be recoverable. Impairment of goodwill is tested at the reporting unit level by comparing the reporting unit’s carrying amount, including goodwill, to the fair value of the reporting unit. The fair values of the reporting units are estimated using a combination of the income, or discounted cash flows, approach and the market approach, which utilize comparable companies’ data. If the carrying amount of the reporting unit exceeds its fair value, goodwill is considered impaired and a second step is performed to measure the amount of impairment loss, if any. Because we have one reporting unit, we utilize the entity-wide approach to assess goodwill for impairment. During our annual goodwill impairment analysis in the fourth quarters of fiscal year 2011 and fiscal year 2010, fair value exceeded carrying value and no impairment was recorded.
In the third quarter of fiscal year 2009, the rapid and severe deterioration of worldwide economic conditions affected our industry and led customers to scale down their levels of production. As a result of these impairment indicators, we considered the potential impairment of goodwill. Indicators that required us to perform an interim impairment review consisted of further weakening in new orders from our customers throughout the third quarter and into the fourth quarter of fiscal year 2009, as well as the uncertainty of the magnitude and duration of the recession as evidenced by industry analysts expectations that demand for semiconductors would remain weak until economic conditions improve. In addition, we experienced a significant decline in our stock price that reduced our market capitalization below our net asset carrying value for an extended period of time. We performed an interim goodwill impairment analysis and recorded a $46.2 million impairment loss that was included in the impairment of intangible assets and goodwill line in the consolidated statements of operations. (See “Note 9—Goodwill and Intangible Assets”).
Long-Lived Assets—We assess the impairment of long-lived assets when events or changes in circumstances indicate that the carrying value of the assets or the asset grouping may not be recoverable. Factors that we consider in deciding when to perform an impairment review include significant negative industry or economic trends, and significant changes or planned changes in our use of the assets. These factors can also be referred to as triggering events. We measure the recoverability of assets that will continue to be used in our operations by comparing the carrying value of the asset grouping to our estimate of the related total future undiscounted net cash flows. If an asset grouping’s carrying value is not recoverable through the related undiscounted cash flows, the asset grouping is considered to be impaired. The impairment is measured by comparing the difference between the asset grouping’s carrying value and its fair value. Long-lived assets such as goodwill; intangible assets; and property, plant and equipment are considered non-financial assets, and are recorded at fair value only if an impairment charge is recognized.
Impairments of long-lived assets are determined for groups of assets related to the lowest level of identifiable independent cash flows. We operate with one asset group on an enterprise basis. As a result, we believe the lowest identifiable cash flows reside at the enterprise level.
When we determine that the useful lives of assets are shorter than we had originally estimated, we accelerate the rate of depreciation and/or amortization over the assets’ new, shorter useful lives.
Substantially all of our property, plant and equipment and other long-lived assets are located in the United States.
In-process research and development—In-process research and development (“IPR&D”) assets are considered indefinite-lived intangible assets and are not subject to amortization until their useful life is
67
Table of Contents
EXAR CORPORATION AND SUBSIDIARIES
NOTES TO CONSOLIDATED FINANCIAL STATEMENTS—(CONTINUED)
FISCAL YEARS ENDED MARCH 27, 2011, MARCH 28, 2010, AND MARCH 29, 2009
determined. IPR&D assets must be tested for impairment annually or more frequently if events or changes in circumstances indicate that the asset might be impaired. The impairment test consists of a comparison of the fair value of the IPR&D assets with their carrying values. If the carrying amount of the IPR&D asset exceeds its fair value, an impairment loss must be recognized in an amount equal to that excess. After an impairment loss is recognized, the adjusted carrying amount of the IPR&D assets will be their new accounting basis. Subsequent reversal of a previously recognized impairment loss is prohibited. The initial determination and subsequent evaluation for impairment of the IPR&D asset requires management to make significant judgments and estimates. Once an IPR&D project has been completed, the useful life of the IPR&D asset is determined and amortized accordingly. If the IPR&D asset is abandoned, the remaining carrying value is written off.
Income Taxes—Deferred taxes are recognized using the asset and liability method, whereby deferred tax assets and liabilities are recognized for the future tax consequences attributable to differences between the financial statement carrying amounts of existing assets and liabilities and their respective tax bases, operating losses and tax credit carryforwards. Valuation allowances are provided if it is more likely than not that some or all of the deferred tax assets will not be realized.
Revenue Recognition—We recognize revenue in accordance with Financial Accounting Standards Board (“FASB”) authoritative guidance for Revenue Recognition. Four basic criteria must be met before revenue can be recognized: (1) persuasive evidence of an arrangement exists; (2) delivery has occurred or services have been rendered; (3) the price is fixed or determinable; and (4) collectability is reasonably assured.
We derive revenue principally from the sale of our products to distributors and to OEMs or their contract manufacturers. Our delivery terms are primarily FOB shipping point, at which time title and all risks of ownership are transferred to the customer.
Non-distributors—For non-distributors, revenue is recognized when title to the product is transferred to the customer, which occurs upon shipment or delivery, depending upon the terms of the customer order, provided that persuasive evidence of a sales arrangement exists, the price is fixed or determinable, collection of the resulting receivables is reasonably assured, there are no customer acceptance requirements and there are no remaining significant obligations. Provisions for returns and allowances for non-distributor customers are provided at the time product sales are recognized. An allowance for sales returns and allowances for non-distributor customers are recorded based on historical experience or specific identification of an event necessitating an allowance.
Distributors—Agreements with our two primary distributors permit the return of 3% to 5% of their purchases during the preceding quarter for purposes of stock rotation. For one of these distributors, a scrap allowance of 2% of the preceding quarter’s purchases is permitted. We also provide discounts to certain distributors based on volume of product they sell for a specific product with a specific volume range for a given customer over a period not to exceed one year.
We recognize revenue from each of our distributors using either of the following bases. Once adopted, the basis for revenue recognition for a distributor is maintained unless there is a change in circumstances indicating the basis for revenue recognition for that distributor is no longer appropriate.
| • | Sell-in Basis—Revenue is recognized upon shipment if we conclude we meet the same criteria as for non-distributors and we can reasonably estimate the credits for returns, pricing allowances and/or other concessions. We record an estimated allowance, at the time of shipment, based upon historical patterns of returns, pricing allowances and other concessions (i.e., “sell-in” basis). |
68
Table of Contents
EXAR CORPORATION AND SUBSIDIARIES
NOTES TO CONSOLIDATED FINANCIAL STATEMENTS—(CONTINUED)
FISCAL YEARS ENDED MARCH 27, 2011, MARCH 28, 2010, AND MARCH 29, 2009
| • | Sell-through Basis—Revenue and the related costs of sales are deferred until the resale to the end customer if we grant more than limited rights of return, pricing allowances and/or other concessions or if we cannot reasonably estimate the level of returns and credits issuable (i.e., “sell-through” basis). Under the sell-through basis, accounts receivable are recognized and inventory is relieved upon shipment to the distributor as title to the inventory is transferred upon shipment, at which point we have a legally enforceable right to collection under normal terms. The associated sales and cost of sales are deferred and are included in deferred income and allowance on sales to distributors in the consolidated balance sheet. When the related product is sold by our distributors to their end customers, at which time the ultimate price we receive is known, we recognize previously deferred income as sales and cost of sales. |
Sell-through revenue recognition is highly dependent on receiving pertinent and accurate data from our distributors in a timely fashion. Distributors provide us periodic data regarding the product, price, quantity, and end customer when products are resold as well as the quantities of our products they still have in stock. We must use estimates and apply judgments to reconcile distributors’ reported inventories to their activities. Any error in our judgment could lead to inaccurate reporting of our net sales, gross profit, deferred income and allowances on sales to distributors and net income.
Software became an element of our revenue upon the acquisition of Hifn in April 2009. To date, software revenue has been an immaterial portion of our net sales.
Research and Development Expenses—Research and development costs consist primarily of salaries, employee benefits, mask tooling costs, depreciation, amortization, overhead, outside contractors, facility expenses, and non-recurring engineering fees. Expenditures for research and development are charged to expense as incurred. In accordance with FASB authoritative guidance for the costs of computer software to be sold, leased or otherwise marketed, certain software development costs are capitalized after technological feasibility has been established. The period from achievement of technological feasibility, which we define as the establishment of a working model, until the general availability of such software to customers, has been short, and therefore software development costs qualifying for capitalization have been insignificant. Accordingly, we have not capitalized any software development costs in fiscal years 2011, 2010 and 2009.
In connection with the Hifn acquisition in April 2009, we assumed a contractual agreement under which certain research and development costs are eligible for reimbursement. Amounts collected under this arrangement are offset against research and development expense. During fiscal year 2011 and fiscal year 2010, we received $5.0 million and $4.6 million, respectively, for work performed, which was recorded as an offset to research and development expenses.
Advertising Expenses—We expense advertising costs as incurred. Advertising expenses for fiscal years 2011, 2010 and 2009 were not material.
Comprehensive Income (Loss)—Comprehensive income (loss) includes charges or credits to equity related to changes in unrealized gains or losses on marketable securities, net of taxes. Comprehensive income (loss) for fiscal years 2011, 2010 and 2009 has been disclosed within the consolidated statements of stockholders’ equity and comprehensive income (loss).
Foreign Currency—The accounts of foreign subsidiaries are remeasured to U.S. dollars for financial reporting purposes by using the U.S. dollar as the functional currency and exchange gains and losses are reported in income and expenses. These currency gains or losses are reported in interest income and other, net in the consolidated statements of operations. Monetary balance sheet accounts are remeasured using the current
69
Table of Contents
EXAR CORPORATION AND SUBSIDIARIES
NOTES TO CONSOLIDATED FINANCIAL STATEMENTS—(CONTINUED)
FISCAL YEARS ENDED MARCH 27, 2011, MARCH 28, 2010, AND MARCH 29, 2009
exchange rate in effect at the balance sheet date. For non-monetary items, the accounts are measured at the historical exchange rate. Revenues and expenses are remeasured at the average exchange rates for the period. Foreign currency transaction losses were not material for fiscal years 2011, 2010 and 2009.
Concentration of Credit Risk and Significant Customers—Financial instruments potentially subjecting us to concentrations of credit risk consist primarily of cash, cash equivalents, short-term marketable securities, accounts receivable and long-term investments. The majority of our sales are derived from distributors and manufacturers in the communications, industrial, storage and computer industries. We perform ongoing credit evaluations of our customers and generally do not require collateral for sales on credit. We maintain allowances for potential credit losses, and such losses have been within management’s expectations. Charges to bad debt expense were insignificant for fiscal years 2011, 2010 and 2009. Our policy is to invest our cash, cash equivalents and short-term marketable securities with high credit quality financial institutions and limit the amounts invested with any one financial institution or in any type of financial instrument. We do not hold or issue financial instruments for trading purposes.
We sell our products to distributors and OEMs throughout the world. Future Electronics, Inc. (“Future”), a related party, was and continues to be our largest distributor. Future, on a worldwide basis, represented 30%, 28% and 35% of net sales in fiscal years 2011, 2010 and 2009, respectively. No other OEM customer or distributor accounted for 10% or more of our net sales in fiscal year 2011, 2010 or 2009.
Concentration of Other Risks—The majority of our products are currently fabricated at Globalfoundries Singapore Pte. Ltd. (f.k.a. Chartered Semiconductor Manufacturing Ltd.), Episil Technologies Inc. (“Episil”) in Taiwan, and Hangzhou Silan Microelectronics Co. Ltd. and Hangzhou Silan Integrated Circuit Co. Ltd. (collectively “Silan”) in the People’s Republic of China (“PRC”), and are assembled and tested by other third-party subcontractors located in Asia. A significant disruption in the operations of one or more of these subcontractors would impact the production of our products for a substantial period of time which could have a material adverse effect on our business, financial condition and results of operations.
Fair Value of Financial Instruments—We estimate the fair value of our financial instruments by using available market information and valuation methodologies considered to be appropriate. However, considerable judgment is required in interpreting market data to develop the estimates of fair value. The use of different market assumptions and/or estimation methodologies could have a material effect on estimated fair value amounts. The estimated fair value of our carrying values of cash and cash equivalents, short-term marketable securities, accounts receivable, accounts payable and accrued liabilities at March 27, 2011, March 28, 2010 and March 29, 2009 was not materially different from the carrying values presented in the consolidated balance sheets due to the relatively short periods to maturity of the instruments.
Stock-Based Compensation—The estimated fair value of the equity-based awards, less expected forfeitures, is amortized over the awards’ vesting period on a straight-line basis. Determining the fair value of stock-based awards at the grant date requires considerable judgment, including estimating expected volatility, forfeiture rate, expected term and risk-free interest rate. If factors change and we employ different assumptions, stock-based compensation expense may differ significantly from what we have recorded in the prior years. In addition, we follow the “with-and-without” intra-period allocation approach in our tax attribute calculations.
70
Table of Contents
EXAR CORPORATION AND SUBSIDIARIES
NOTES TO CONSOLIDATED FINANCIAL STATEMENTS—(CONTINUED)
FISCAL YEARS ENDED MARCH 27, 2011, MARCH 28, 2010, AND MARCH 29, 2009
Recent Accounting Pronouncements
In December 2010, the FASB issued an update to its existing guidance on goodwill and other intangible assets. This guidance modifies Step 1 of the goodwill impairment test for reporting units with zero or negative carrying amounts. For those reporting units, an entity is required to perform Step 2 of the goodwill impairment test if there are qualitative factors indicating that it is more likely than not that a goodwill impairment exists. The qualitative factors are consistent with the existing guidance which requires goodwill of a reporting unit to be tested for impairment between annual tests if an event occurs or circumstances change that would more likely than not reduce the fair value of a reporting unit below its carrying amount. This guidance is effective for fiscal years, and interim periods within those years, beginning after December 15, 2010, which is beginning March 28, 2011 for us. We are currently evaluating the impact of implementing this guidance on our business, financial condition and results of operations.
In January 2010, the FASB Emerging Issues Task Force issued new authoritative guidance addressing certain measurements and disclosures about purchases, sales, issuances, and settlements in Level 3 fair value measurements. We are currently evaluating the impact of implementing the disclosures about purchases, sales, issuances, and settlements in Level 3 fair value measurements on our financial position and result of operations, which are effective for fiscal years beginning after December 15, 2010 and for interim periods within those fiscal years. Historically, we have not held investments with Level 3 fair value measurements.
NOTE 3. BUSINESS COMBINATIONS
We periodically evaluate potential strategic acquisitions to build upon our existing library of intellectual property, human capital and engineering talent, in order to expand our capabilities in the areas in which we operate or to acquire complementary businesses.
We account for each business combination by applying the acquisition method, which requires (i) identifying the acquiree; (ii) determining the acquisition date; (iii) recognizing and measuring the identifiable assets acquired, the liabilities assumed, and any noncontrolling interest of Exar in the acquiree at their acquisition date fair value; and (iv) recognizing and measuring goodwill or a gain from a bargain purchase.
Assets acquired and liabilities assumed in a business combination that arise from contingencies are recognized at fair value on the acquisition date if fair value can be determined during the measurement period. If fair value cannot be determined, we typically account for the acquired contingencies using existing guidance for a reasonable estimate.
To establish fair value, we measure the price that would be received to sell an asset or paid to transfer a liability in an ordinary transaction between market participants. The measurement assumes the highest and best use of the asset by the market participants that would maximize the value of the asset or the group of assets within which the asset would be used at the measurement date, even if the intended use of the asset is different.
Goodwill is measured and recorded as the amount by which the consideration transferred, generally at the acquisition date fair value, exceeds the acquisition date fair value of identifiable assets acquired, the liabilities assumed, and any non-controlling interest of Exar in the acquiree. To the contrary, if the acquisition date fair value of identifiable assets acquired, the liabilities assumed, and any non-controlling interest of Exar in the acquiree exceeds the consideration transferred, it is considered a bargain purchase and we would recognize the resulting gain in earnings on the acquisition date.
71
Table of Contents
EXAR CORPORATION AND SUBSIDIARIES
NOTES TO CONSOLIDATED FINANCIAL STATEMENTS—(CONTINUED)
FISCAL YEARS ENDED MARCH 27, 2011, MARCH 28, 2010, AND MARCH 29, 2009
IPR&D assets are considered an indefinite-lived intangible asset and are not subject to amortization until its useful life is determined to be no longer indefinite. IPR&D assets must be tested for impairment annually or more frequently if events or changes in circumstances indicate that the asset might be impaired. The impairment test consists of a comparison of the fair value of the IPR&D asset with its carrying amount. If the carrying amount of the IPR&D asset exceeds its fair value, an impairment loss must be recognized in an amount equal to that excess. After an impairment loss is recognized, the adjusted carrying amount of the IPR&D assets will be its new accounting basis. Subsequent reversal of a previously recognized impairment loss is prohibited. The initial determination and subsequent evaluation for impairment of the IPR&D asset requires management to make significant judgments and estimates. Once the IPR&D projects have been completed, the useful life of the IPR&D asset is determined and amortized accordingly. If the IPR&D asset is abandoned, the remaining carrying value is written off.
Acquisition-related costs, including finder’s fees, advisory, legal, accounting, valuation and other professional or consulting fees are accounted for as expenses in the periods in which the costs are incurred and the services are received, with the exception that the costs to issue debt or equity securities are recognized in accordance with other applicable GAAP.
Acquisition of Neterion
On March 16, 2010, we completed the acquisition of Neterion, Inc. (“Neterion”), a supplier of 10 GbE controller silicon and card solutions optimized for virtualized data centers based in Sunnyvale, California. Neterion’s results of operations and estimated fair value of assets acquired and liabilities assumed were included in our consolidated financial statements beginning March 17, 2010.
Consideration
We paid approximately $2.3 million in cash for Neterion, representing the fair value of total consideration transferred.
Acquisition-Related Costs
Acquisition-related costs relating to Neterion, which are included in the selling, general and administrative line on the consolidated statement of operations, were not material in fiscal year 2011. In fiscal year 2010, we recorded $0.5 million in acquisition-related costs relating to Neterion.
Restructuring Costs
For disclosure regarding restructuring costs, see “Note 7—Restructuring & Other” contained herein.
Purchase Price Allocation
The allocation of the purchase price to Neterion’s tangible and identifiable intangible assets acquired and liabilities assumed was based on their estimated fair values at the date of acquisition.
The excess of the purchase price over the tangible and identifiable intangible assets acquired and liabilities assumed has been allocated to goodwill. The $464,000 in goodwill resulted primarily from our expected synergies from the integration of Neterion’s technology into our product offerings. Goodwill is not deductible for tax purposes.
72
Table of Contents
EXAR CORPORATION AND SUBSIDIARIES
NOTES TO CONSOLIDATED FINANCIAL STATEMENTS—(CONTINUED)
FISCAL YEARS ENDED MARCH 27, 2011, MARCH 28, 2010, AND MARCH 29, 2009
The fair value allocated to each of the major classes of tangible and identifiable intangible assets acquired and liabilities assumed in the Neterion acquisition was as follows (in thousands):
| As of March 16, 2010 |
||||
| Identifiable tangible assets |
||||
| Cash and cash equivalents |
$ | 747 | ||
| Accounts receivable |
313 | |||
| Inventories |
617 | |||
| Other current assets |
311 | |||
| Other assets |
651 | |||
| Accounts payable and accruals |
(592 | ) | ||
| Other liabilities |
(2,920 | ) | ||
| Debt |
(6,963 | ) | ||
| Total identifiable tangible assets, net |
(7,836 | ) | ||
| Identifiable intangible assets |
9,700 | |||
| Total identifiable assets, net |
1,864 | |||
| Goodwill |
464 | |||
| Fair value of total consideration transferred |
$ | 2,328 | ||
Subsequent to the Neterion acquisition, there were no adjustments to the fair value allocated to each of the major classes of tangible and identifiable intangible assets acquired and liabilities assumed on March 16, 2010.
Identifiable Intangible Assets
The following table sets forth the components of the identifiable intangible assets acquired in the Neterion acquisition, which are being amortized over their estimated useful lives, with a maximum amortization period of six years, on a straight-line basis with no residual value:
| Fair Value | Useful Life | |||||||
| (in thousands) | (in years) | |||||||
| Existing technology |
$ | 5,600 | 4.0 | |||||
| Patents/Core technology |
900 | 6.0 | ||||||
| In-process research and development |
800 | — | ||||||
| Customer relationships |
2,100 | 6.0 | ||||||
| Tradenames/Trademarks |
100 | 2.0 | ||||||
| Non-Compete Agreements |
100 | 1.3 | ||||||
| Order backlog |
100 | 0.2 | ||||||
| Total acquired identifiable intangible assets |
$ | 9,700 | ||||||
We allocated the purchase price using the established valuation techniques described below.
Inventories—The value allocated to inventories reflects the estimated fair value of the acquired inventory based on the expected sales price of the inventory, less reasonable selling margin. The estimated fair value of raw materials is generally equal to their book value, due to the fact that raw materials have not been used to develop any finished goods or work-in-progress and therefore, there is no value added to the raw materials.
73
Table of Contents
EXAR CORPORATION AND SUBSIDIARIES
NOTES TO CONSOLIDATED FINANCIAL STATEMENTS—(CONTINUED)
FISCAL YEARS ENDED MARCH 27, 2011, MARCH 28, 2010, AND MARCH 29, 2009
Intangible assets—The fair values of existing technology, patents/core technology, in-process research and development, customer relationships, tradenames/trademarks, non-compete agreements and order backlog were determined using the income approach, which discounted expected future cash flows to present value, taking into account multiple factors including, but not limited to, the stage of completion, estimated costs to complete, utilization of patents/core technology, the risks related to successful completion, and the markets served. The cash flows were discounted at rates ranging from 4% to 33%. The discount rate used to value the existing intangible assets was 20%.
Acquired In-Process Research and Development—The IPR&D project underway at Neterion at the acquisition date related to the X3500 product series and as of such acquisition date had incurred approximately $2.9 million in expense. This project was abandoned in March 2011 when we exited the 10 GbE market, resulting in a charge of $0.8 million in fiscal year 2011. (See “Note 9—Goodwill and Intangible Assets”).
Acquisition of Galazar
On June 17, 2009, we completed the acquisition of Galazar Networks, Inc. (“Galazar”), a fabless semiconductor company focused on carrier grade transport over telecom networks based in Ottawa, Ontario, Canada. Galazar’s product portfolio addressed transport of a wide range of datacom and telecom services including Ethernet, SAN, TDM and video over SONET/SDH, PDH and OTN networks. Galazar’s results of operations and estimated fair value of assets acquired and liabilities assumed were included in our consolidated financial statements beginning June 18, 2009.
Consideration
We paid approximately $5.0 million in cash for Galazar, representing the fair value of total consideration transferred. This amount included approximately $1.0 million contingent consideration that, for the purposes of valuation, was assigned a 95% probability or a fair value of $0.95 million. This payment was contingent on Galazar achieving a project milestone within a twelve-month period following the close of the transaction. This milestone was met during the three months ended December 27, 2009 and $1.0 million was paid in cash. The additional $50,000 was expensed and included in the research and development line on the consolidated statement of operations for fiscal year 2010.
Acquisition-Related Costs
Acquisition-related costs, or deal costs, relating to Galazar are included in the selling, general and administrative line on the consolidated statement of operations. No acquisition-related costs relating to Galazar were incurred during fiscal year 2011. In fiscal year 2010, we recorded $0.9 million in acquisition-related costs relating to Galazar.
Purchase Price Allocation
The allocation of the purchase price to Galazar’s tangible and identifiable intangible assets acquired and liabilities assumed was based on their estimated fair values at the date of acquisition.
The excess of the purchase price over the tangible and identifiable intangible assets acquired and liabilities assumed has been allocated to goodwill. The $372,000 in goodwill resulted primarily from our expected synergies from the integration of Galazar’s technology into our product offerings. Goodwill is not deductible for tax purposes.
74
Table of Contents
EXAR CORPORATION AND SUBSIDIARIES
NOTES TO CONSOLIDATED FINANCIAL STATEMENTS—(CONTINUED)
FISCAL YEARS ENDED MARCH 27, 2011, MARCH 28, 2010, AND MARCH 29, 2009
The fair value allocated to each of the major classes of tangible and identifiable intangible assets acquired and liabilities assumed in the Galazar acquisition was as follows (in thousands):
| As of June 17, 2009 |
||||
| Identifiable tangible assets |
||||
| Cash and cash equivalents |
$ | 506 | ||
| Other current assets |
909 | |||
| Other assets |
250 | |||
| Accounts payable and accruals |
(93 | ) | ||
| Accrued compensation and related benefits |
(230 | ) | ||
| Other obligations |
(224 | ) | ||
| Total identifiable tangible assets, net |
1,118 | |||
| Identifiable intangible assets |
3,460 | |||
| Total identifiable assets, net |
4,578 | |||
| Goodwill |
372 | |||
| Fair value of total consideration transferred |
$ | 4,950 | ||
Subsequent to the Galazar acquisition, there were no adjustments to the fair value allocated to each of the major classes of tangible and identifiable intangible assets acquired and liabilities assumed on June 17, 2009.
Identifiable Intangible Assets
The following table sets forth the components of the identifiable intangible assets acquired in the Galazar acquisition, which are being amortized over their estimated useful lives, with a maximum amortization period of six years, on a straight-line basis with no residual value:
| Fair Value | Useful Life | |||||||
| (in thousands) | (in years) | |||||||
| Existing technology |
$ | 2,100 | 6.0 | |||||
| Patents/Core technology |
400 | 6.0 | ||||||
| In-process research and development |
300 | — | ||||||
| Customer relationships |
500 | 6.0 | ||||||
| Tradenames/Trademarks |
100 | 3.0 | ||||||
| Order backlog |
60 | 0.3 | ||||||
| Total acquired identifiable intangible assets |
$ | 3,460 | ||||||
We allocated the purchase price using the established valuation techniques described below.
Intangible assets—The fair value of existing technology, patents/core technology, in-process research and development, customer relationships, tradenames/trademarks and order backlog were determined using the income approach, which discounted expected future cash flows to present value, taking into account multiple factors including, but not limited to, the stage of completion, estimated costs to complete, utilization of patents and core technology, the risks related to successful completion, and the markets served. The cash flows were discounted at rates ranging from 5% to 35%. The discount rate used to value the existing intangible assets was 28%.
75
Table of Contents
EXAR CORPORATION AND SUBSIDIARIES
NOTES TO CONSOLIDATED FINANCIAL STATEMENTS—(CONTINUED)
FISCAL YEARS ENDED MARCH 27, 2011, MARCH 28, 2010, AND MARCH 29, 2009
Acquired In-Process Research and Development—The IPR&D project underway at Galazar at the acquisition date relates to the MXP2 product and as of such acquisition date had incurred approximately $2.3 million in expense. The total research and development expense expected to be incurred to complete the project is estimated at $12.0 million, based on the project development timeline and resource requirements, and is expected to be completed by February 2012. The percentage of completion for the project was estimated at 51% at the acquisition date.
Acquisition of Hifn
On April 3, 2009, we completed the acquisition of hi/fn, inc. (“Hifn”), a provider of network-and storage-security and data reduction products located in Los Gatos, California. Hifn’s results of operations and estimated fair value of assets acquired and liabilities assumed were included in our consolidated financial statements beginning April 4, 2009.
Consideration
The following table summarizes the consideration paid for Hifn, representing the fair value of total consideration transferred (in thousands):
| Amounts | ||||
| Cash |
$ | 56,825 | ||
| Equity instruments |
2,784 | |||
| Total consideration paid |
$ | 59,609 | ||
The $2.8 million estimated fair value for equity instruments represented approximately 429,600 shares of Exar’s common stock, valued at $6.48 per share, the closing price reported on The NASDAQ Global Market on April 3, 2009 (the acquisition date).
Acquisition-Related Costs
Acquisition-related costs, or deal costs, relating to Hifn are included in the selling, general and administrative line on the consolidated statement of operations. Acquisition-related costs incurred in fiscal year 2011 relating to Hifn were not material. In fiscal year 2010, we incurred $3.8 million of acquisition-related costs relating to Hifn.
Purchase Price Allocation
The allocation of the purchase price to Hifn’s tangible and identifiable intangible assets acquired and liabilities assumed was based on their estimated fair values at the date of acquisition. Subsequent to the acquisition, we recorded $1.0 million in restructuring expenses relating to Hifn for fiscal year 2010, relating to severance and a building lease obligation in Los Gatos, California. Severance costs relating to Hifn incurred during fiscal year 2011 were immaterial.
The excess of the purchase price over the tangible and identifiable intangible assets acquired and liabilities assumed has been allocated to goodwill. The $2.2 million in goodwill resulted primarily from our expected future product sales synergies from combining Hifn’s products with our product offerings. Goodwill is not deductible for tax purposes.
76
Table of Contents
EXAR CORPORATION AND SUBSIDIARIES
NOTES TO CONSOLIDATED FINANCIAL STATEMENTS—(CONTINUED)
FISCAL YEARS ENDED MARCH 27, 2011, MARCH 28, 2010, AND MARCH 29, 2009
The fair value allocated to each of the major classes of tangible and identifiable intangible assets acquired and liabilities assumed on April 3, 2009 in the Hifn acquisition was as follows (in thousands):
| As of April 3, 2009 |
||||
| Identifiable tangible assets |
||||
| Cash and cash equivalents |
$ | 16,468 | ||
| Short-term marketable securities |
14,133 | |||
| Accounts receivable |
2,982 | |||
| Inventories |
4,269 | |||
| Other current assets |
1,683 | |||
| Property, plant and equipment |
2,013 | |||
| Other assets |
1,721 | |||
| Accounts payable and accruals |
(586 | ) | ||
| Accrued compensation and related benefits |
(1,860 | ) | ||
| Other current liabilities |
(2,963 | ) | ||
| Total identifiable tangible assets, net |
37,860 | |||
| Identifiable intangible assets |
19,500 | |||
| Total identifiable assets, net |
57,360 | |||
| Goodwill |
2,249 | |||
| Fair value of total consideration transferred |
$ | 59,609 | ||
Subsequent to the Hifn acquisition, there were no adjustments to the fair value allocated to each of the major classes of tangible and identifiable intangible assets acquired and liabilities assumed on April 3, 2009.
Identifiable Intangible Assets
The following table sets forth the components of the identifiable intangible assets acquired in the Hifn acquisition, which are being amortized over their estimated useful lives, with a maximum amortization period of seven years, on a straight-line basis with no residual value:
| Fair Value | Useful Life | |||||||
| (in thousands) | (in years) | |||||||
| Existing technology |
$ | 9,000 | 5.0 | |||||
| Patents/Core technology |
1,500 | 5.0 | ||||||
| In-process research and development |
1,600 | — | ||||||
| Customer relationships |
1,300 | 7.0 | ||||||
| Tradenames/Trademarks |
700 | 3.0 | ||||||
| Order backlog |
900 | 0.5 | ||||||
| Research and development reimbursement contract |
4,500 | 1.5 | ||||||
| Total acquired identifiable intangible assets |
$ | 19,500 | ||||||
77
Table of Contents
EXAR CORPORATION AND SUBSIDIARIES
NOTES TO CONSOLIDATED FINANCIAL STATEMENTS—(CONTINUED)
FISCAL YEARS ENDED MARCH 27, 2011, MARCH 28, 2010, AND MARCH 29, 2009
We allocated the purchase price using the established valuation techniques as described below.
Inventories—Inventories acquired in connection with the Hifn acquisition were finished goods. The value allocated to inventories reflects the estimated fair value of the acquired inventory based on the expected sales price of the inventory, less reasonable selling margin.
Property, plant and equipment—The basis used for our analysis is the fair value in continued use, which is expressed in terms of the price a willing and informed buyer would pay contemplating continued use as part of the assets in place for the purpose for which they were designed, engineered, installed, fabricated and erected.
Intangible assets—The fair value of existing technology, patents/core technology, in-process research and development, customer relationships, tradenames/trademarks, order backlog and research and development reimbursement contract were determined using the income approach, which discounted expected future cash flows to present value, taking into account multiple factors including, but not limited to, the stage of completion, estimated costs to complete, utilization of patents and core technology, the risks related to successful completion, and the markets served. The cash flows were discounted at rates ranging from 5% to 30%. The discount rate used to value the existing intangible assets was 14%.
Acquired In-Process Research and Development—The IPR&D projects underway at Hifn at the acquisition date were in the security processors and flow through product families, each consisting of one project, and as of such acquisition date Hifn had incurred approximately $2.6 million and $1.1 million in costs related to those projects, respectively. The percentage of completion for these projects, at the date of acquisition, was 90% and 30%, respectively. The total research and development expenditures expected to be incurred to complete the security processors and flow through projects were approximately $2.1 million and $0.7 million, respectively, based on project development timelines and resource requirements. The IPR&D projects for flow through and security processors were completed in January 2010 and July 2010, respectively, and are in production. The fair value, at date of acquisition, for both IPR&D projects, is being amortized over an estimated useful life of five years.
NOTE 4. BALANCE SHEET DETAILS
Our property, plant and equipment consisted of the following (in thousands) as of the dates indicated:
| March 27, 2011 |
March 28, 2010 |
|||||||
| Land |
$ | 11,960 | $ | 11,960 | ||||
| Building |
24,398 | 24,022 | ||||||
| Machinery and equipment |
46,863 | 46,040 | ||||||
| Software and licenses |
37,785 | 35,543 | ||||||
| Property, plant and equipment, total |
121,006 | 117,565 | ||||||
| Accumulated depreciation and amortization |
(82,997 | ) | (74,624 | ) | ||||
| Total property, plant and equipment, net |
$ | 38,009 | $ | 42,941 | ||||
Depreciation and amortization expense for fiscal years 2011, 2010 and 2009 was $9.1 million, $9.5 million and $8.4 million, respectively.
78
Table of Contents
EXAR CORPORATION AND SUBSIDIARIES
NOTES TO CONSOLIDATED FINANCIAL STATEMENTS—(CONTINUED)
FISCAL YEARS ENDED MARCH 27, 2011, MARCH 28, 2010, AND MARCH 29, 2009
Our inventories consisted of the following (in thousands) as of the dates indicated:
| March 27, 2011 |
March 28, 2010 |
|||||||
| Work-in-progress and raw materials |
$ | 12,068 | $ | 9,318 | ||||
| Finished goods |
9,894 | 5,682 | ||||||
| Total inventories |
$ | 21,962 | $ | 15,000 | ||||
Our other accrued expenses consisted of the following (in thousands) as of the dates indicated:
| March 27, 2011 |
March 28, 2010 |
|||||||
| Accrued legal and professional services |
$ | 1,630 | $ | 4,063 | ||||
| Accrued sales and marketing expenses |
1,036 | 878 | ||||||
| Accrued manufacturing expenses, royalties and licenses |
1,873 | 1,584 | ||||||
| Accrued restructuring expenses |
288 | 239 | ||||||
| Other |
554 | 294 | ||||||
| Total other accrued expenses |
$ | 5,381 | $ | 7,058 | ||||
NOTE 5. CASH, CASH EQUIVALENTS AND SHORT-TERM MARKETABLE SECURITIES
Fair Value of Financial Instruments
Fair value is defined as the exchange price that would be received for an asset or paid to transfer a liability in the principal or most advantageous market for the asset or liability in an orderly transaction between market participants on the measurement date. Valuation techniques used to measure fair value must maximize the use of observable inputs and minimize the use of unobservable inputs. GAAP describes a fair value hierarchy based on three levels of inputs, of which the first two are considered observable and the last unobservable, that may be used to measure fair value as follows:
Level 1—Quoted prices in active markets for identical assets or liabilities.
Level 2—Inputs other than Level 1 that are observable, either directly or indirectly, such as quoted prices for similar assets or liabilities; quoted prices in markets that are not active; or other inputs that are observable or can be corroborated by observable market data for substantially the full term of the assets or liabilities.
Level 3—Unobservable inputs that are supported by little or no market activity and that are significant to the fair value of the assets or liabilities.
79
Table of Contents
EXAR CORPORATION AND SUBSIDIARIES
NOTES TO CONSOLIDATED FINANCIAL STATEMENTS—(CONTINUED)
FISCAL YEARS ENDED MARCH 27, 2011, MARCH 28, 2010, AND MARCH 29, 2009
Our investment assets, measured at fair value on a recurring basis, as of March 27, 2011 were as follows (in thousands, except for percentages):
| Level 1 | Level 2 | Total | ||||||||||||||
| Assets: |
||||||||||||||||
| Money market funds |
$ | 7,403 | $ | — | $ | 7,403 | 4 | % | ||||||||
| U.S. Treasury securities |
20,726 | — | 20,726 | 10 | % | |||||||||||
| Asset-backed securities |
— | 24,242 | 24,242 | 13 | % | |||||||||||
| Agency mortgage-backed securities |
— | 35,565 | 35,565 | 18 | % | |||||||||||
| Agency pool mortgage-backed securities |
— | 3,522 | 3,522 | 2 | % | |||||||||||
| Corporate bonds and notes |
— | 78,588 | 78,588 | 41 | % | |||||||||||
| Government and agency bonds |
— | 23,317 | 23,317 | 12 | % | |||||||||||
| Total investment assets |
$ | 28,129 | $ | 165,234 | $ | 193,363 | 100 | % | ||||||||
Our investment assets, measured at fair value on a recurring basis, as of March 28, 2010 were as follows (in thousands, except for percentages):
| Level 1 | Level 2 | Total | ||||||||||||||
| Assets: |
||||||||||||||||
| Money market funds |
$ | 19,616 | $ | — | $ | 19,616 | 9 | % | ||||||||
| U.S. Treasury securities |
15,839 | — | 15,839 | 8 | % | |||||||||||
| Asset-backed securities |
— | 17,801 | 17,801 | 9 | % | |||||||||||
| Agency mortgage-backed securities |
— | 42,514 | 42,514 | 21 | % | |||||||||||
| Agency pool mortgage-backed securities |
— | 4,413 | 4,413 | 2 | % | |||||||||||
| Corporate bonds and notes |
— | 62,122 | 62,122 | 30 | % | |||||||||||
| Government and agency bonds |
— | 43,909 | 43,909 | 21 | % | |||||||||||
| Total investment assets |
$ | 35,455 | $ | 170,759 | $ | 206,214 | 100 | % | ||||||||
Our cash, cash equivalents and short-term marketable securities as of March 27, 2011 and March 28, 2010 were as follows (in thousands):
| March 27, 2011 |
March 28, 2010 |
|||||||
| Cash and cash equivalents |
||||||||
| Cash in financial institutions |
$ | 7,636 | $ | 5,870 | ||||
| Cash equivalents |
||||||||
| Money market funds |
7,403 | 19,616 | ||||||
| Total cash and cash equivalents |
$ | 15,039 | $ | 25,486 | ||||
| Short-term marketable securities |
||||||||
| U.S. government and agency securities |
$ | 44,043 | $ | 59,747 | ||||
| Corporate bonds and commercial paper |
78,588 | 62,122 | ||||||
| Asset-backed securities |
24,242 | 17,801 | ||||||
| Mortgage-backed securities |
39,087 | 46,928 | ||||||
| Total short-term marketable securities |
$ | 185,960 | $ | 186,598 | ||||
80
Table of Contents
EXAR CORPORATION AND SUBSIDIARIES
NOTES TO CONSOLIDATED FINANCIAL STATEMENTS—(CONTINUED)
FISCAL YEARS ENDED MARCH 27, 2011, MARCH 28, 2010, AND MARCH 29, 2009
Our marketable securities include municipal securities, commercial paper, asset-backed and mortgage-backed securities, corporate bonds and U.S. government securities. We classify investments as available-for-sale at the time of purchase and re-evaluate such designation as of each balance sheet date. We amortize premiums and accrete discounts to interest income over the life of the investment. Our available-for-sale securities, which we intend to sell as necessary to meet our liquidity requirements, are classified as cash equivalents if the maturity date is 90 days or less from the date of purchase and as short-term marketable securities if the maturity date is greater than 90 days from the date of purchase.
All marketable securities are reported at fair value based on the estimated or quoted market prices as of each balance sheet date, with unrealized gains or losses, net of tax effect, recorded in accumulated other comprehensive income (loss) within stockholders’ equity except those unrealized losses that are deemed to be other than temporary which are reflected in the impairment charges on investments line on the consolidated statements of operations.
Realized gains or losses on the sale of marketable securities are determined by the specific identification method and are reflected in the interest income and other, net line on the consolidated statements of operations.
Our net realized gains (losses) on marketable securities were as follows for the periods indicated (in thousands):
| Fiscal Years Ended | ||||||||||||
| March 27, 2011 |
March 28, 2010 |
March 29, 2009 |
||||||||||
| Gross realized gains |
1,271 | 599 | 783 | |||||||||
| Gross realized losses |
(1,173 | ) | (550 | ) | (205 | ) | ||||||
| Net realized gains |
$ | 98 | $ | 49 | $ | 578 | ||||||
The following table summarizes our investments in cash equivalents and marketable securities as of March 27, 2011 and March 28, 2010 (in thousands):
| March 27, 2011 | ||||||||||||||||||||
| Amortized Cost |
Unrealized | Fair Value | ||||||||||||||||||
| Gross Gains(1) |
Gross Losses(1) |
Net Gain (Loss)(1) |
||||||||||||||||||
| Money market funds |
$ | 7,403 | $ | — | $ | — | $ | — | $ | 7,403 | ||||||||||
| U.S. government and agency securities |
44,117 | 145 | (219 | ) | (74 | ) | 44,043 | |||||||||||||
| Corporate bonds and commercial paper |
77,957 | 694 | (63 | ) | 631 | 78,588 | ||||||||||||||
| Asset and mortgage-backed securities |
63,370 | 172 | (213 | ) | (41 | ) | 63,329 | |||||||||||||
| Total investments |
$ | 192,847 | $ | 1,011 | $ | (495 | ) | $ | 516 | $ | 193,363 | |||||||||
81
Table of Contents
EXAR CORPORATION AND SUBSIDIARIES
NOTES TO CONSOLIDATED FINANCIAL STATEMENTS—(CONTINUED)
FISCAL YEARS ENDED MARCH 27, 2011, MARCH 28, 2010, AND MARCH 29, 2009
| March 28, 2010 | ||||||||||||||||||||
| Amortized Cost |
Unrealized | Fair Value | ||||||||||||||||||
| Gross Gains(1) |
Gross Losses(1) |
Net Gain (Loss)(1) |
||||||||||||||||||
| Money market funds |
$ | 19,616 | $ | — | $ | — | $ | — | $ | 19,616 | ||||||||||
| U.S. government and agency securities |
58,943 | 835 | (31 | ) | 804 | 59,747 | ||||||||||||||
| Corporate bonds and commercial paper |
61,240 | 900 | (18 | ) | 882 | 62,122 | ||||||||||||||
| Asset and mortgage-backed securities |
64,329 | 496 | (96 | ) | 400 | 64,729 | ||||||||||||||
| Total investments |
$ | 204,128 | $ | 2,231 | $ | (145 | ) | $ | 2,086 | $ | 206,214 | |||||||||
| (1) | Gross of tax impact |
The asset-backed securities are comprised primarily of premium tranches of auto loans and credit card receivables, while our mortgage-backed securities are primarily from Federal agencies. We do not own auction rate securities nor do we own securities that are classified as subprime. As of the date of this Annual Report, we have sufficient liquidity and do not intend to sell these securities to fund normal operations nor realize any significant losses in the short term; however, these securities are available for use, if needed, for current operations.
Management determines the appropriate classification of cash equivalents or short-term marketable securities at the time of purchase and reevaluates such classification as of each balance sheet date. The investments are adjusted for amortization of premiums and accretion of discounts to maturity and such accretion/amortization is included in the interest income and other, net line in the consolidated statement of operations. Cash equivalents and short-term marketable securities are reported at fair value with the related unrealized gains and losses included in the accumulated other comprehensive income (loss) line in the consolidated balance sheets. As of March 27, 2011, there was approximately $0.3 million of net unrealized losses including tax expense from our level 1 and level 2 investments.
We periodically review our investments in unrealized loss positions for other-than-temporary impairments. This evaluation includes, but is not limited to, significant quantitative and qualitative assessments and estimates regarding credit ratings, collateralized support, the length of time and significance of a security’s loss position, our intent to not sell the security, and whether it is more likely than not that we will not have to sell the security before recovery of its cost basis. Other-than-temporary declines in value of our investments are reported in the impairment charges on investments line in the consolidated statements of operations.
In fiscal year 2010, an investment in GSAA Home Equity with a cost of $425,000 was downgraded from a AAA rating to a CCC rating. As a result of the reduction in the rating, quantitative analysis showing an increase in the default rate and decrease in prepayment rate of the investment, we recorded an other-than-temporary impairment charge of $91,000 during the second quarter of fiscal year 2010. In the three months ended September 26, 2010, due to further decline in the investment, we recorded an additional other-than-temporary impairment charge of $62,000. In the three months ended December 26, 2010, we sold this investment resulting in an immaterial loss from its adjusted basis.
In September 2008, Lehman Brothers Holdings Inc. (“Lehman”) filed a petition under Chapter 11 of the U.S. Bankruptcy Code with the U.S. Bankruptcy Court for the Southern District of New York. As a result of Lehman’s bankruptcy filing, we recorded an other-than-temporary impairment charge of $0.6 million during fiscal year 2009. In the three months ended March 27, 2011, we sold this investment resulting in an immaterial gain from its adjusted basis.
82
Table of Contents
EXAR CORPORATION AND SUBSIDIARIES
NOTES TO CONSOLIDATED FINANCIAL STATEMENTS—(CONTINUED)
FISCAL YEARS ENDED MARCH 27, 2011, MARCH 28, 2010, AND MARCH 29, 2009
The amortized cost and estimated fair value of cash equivalents and marketable securities classified as available-for-sale at March 27, 2011 and March 28, 2010 by expected maturity were as follows (in thousands):
| March 27, 2011 | March 28, 2010 | |||||||||||||||
| Amortized Cost |
Fair Value | Amortized Cost |
Fair Value | |||||||||||||
| Less than 1 year |
$ | 78,378 | $ | 78,684 | $ | 108,812 | $ | 109,562 | ||||||||
| Due in 1 to 5 years |
114,469 | 114,679 | 95,316 | 96,652 | ||||||||||||
| Total |
$ | 192,847 | $ | 193,363 | $ | 204,128 | $ | 206,214 | ||||||||
The following table summarizes the gross unrealized losses and fair values of our investments in an unrealized loss position as of March 27, 2011 and March 28, 2010, aggregated by investment category and length of time that individual securities have been in a continuous unrealized loss position (in thousands):
| March 27, 2011 | ||||||||||||||||||||||||
| Less than 12 months | 12 months or greater | Total | ||||||||||||||||||||||
| Fair Value |
Gross Unrealized Losses |
Fair Value |
Gross Unrealized Losses |
Fair Value |
Gross Unrealized Losses |
|||||||||||||||||||
| U.S. government and agency securities |
$ | 25,936 | $ | (219 | ) | $ | 325 | $ | (4 | ) | $ | 26,261 | $ | (223 | ) | |||||||||
| Corporate bonds and commercial paper |
16,516 | (63 | ) | 1,948 | (9 | ) | 18,464 | (72 | ) | |||||||||||||||
| Asset and mortgage-backed securities |
34,143 | (200 | ) | — | — | 34,143 | (200 | ) | ||||||||||||||||
| Total |
$ | 76,595 | $ | (482 | ) | $ | 2,273 | $ | (13 | ) | $ | 78,868 | $ | (495 | ) | |||||||||
| March 28, 2010 | ||||||||||||||||||||||||
| Less than 12 months | 12 months or greater | Total | ||||||||||||||||||||||
| Fair Value |
Gross Unrealized Losses |
Fair Value |
Gross Unrealized Losses |
Fair Value |
Gross Unrealized Losses |
|||||||||||||||||||
| U.S. government and agency securities |
$ | 5,399 | $ | (31 | ) | $ | — | $ | — | $ | 5,399 | $ | (31 | ) | ||||||||||
| Corporate bonds and commercial paper |
8,851 | (18 | ) | — | — | 8,851 | (18 | ) | ||||||||||||||||
| Asset and mortgage-backed securities |
23,802 | (69 | ) | 353 | (27 | ) | 24,155 | (96 | ) | |||||||||||||||
| Total |
$ | 38,052 | $ | (118 | ) | $ | 353 | $ | (27 | ) | $ | 38,405 | $ | (145 | ) | |||||||||
NOTE 6. RELATED PARTY TRANSACTION
Affiliates of Future, Alonim Investments Inc. and two of its affiliates (collectively “Alonim”), own approximately 7.6 million shares, or approximately 17%, of our outstanding common stock as of March 27, 2011. As such, Alonim is our largest stockholder.
Our sales to Future are made under a distribution agreement that provides protection against price reduction for its inventory of our products and other sales allowances. We recognize revenue on sales to Future when Future sells the products to its end customers. Future has historically accounted for a significant portion of our net sales.
83
Table of Contents
EXAR CORPORATION AND SUBSIDIARIES
NOTES TO CONSOLIDATED FINANCIAL STATEMENTS—(CONTINUED)
FISCAL YEARS ENDED MARCH 27, 2011, MARCH 28, 2010, AND MARCH 29, 2009
Future’s contribution to our total net sales were as follows for the periods indicated:
| Fiscal Years Ended | ||||||||||||
| March 27, 2011 |
March 28, 2010 |
March 29, 2009 |
||||||||||
| Future |
30 | % | 28 | % | 35 | % | ||||||
Future’s expenses for marketing promotional materials reimbursed were as follows for the periods indicated (in thousands):
| Fiscal Years Ended | ||||||||||||
| March 27, 2011 |
March 28, 2010 |
March 29, 2009 |
||||||||||
| Future |
$ | 28 | $ | 8 | $ | 52 | ||||||
NOTE 7. RESTRUCTURING & OTHER
During the fourth quarter of fiscal year 2011, we decided to exit the data center virtualization market, and, in connection therewith, to stop development of our 10GbE network interface cards. We determined that the current economic and market environment did not provide the potential to deliver acceptable returns on the required investments in these products. As a result, in the fourth quarter of fiscal year 2011 we abandoned all related in-process research and development. In addition, we began to actively market for sale the related assets of our 10GbE technology, consisting primarily of underlying existing and core technology intangible assets. Charges related to this decision in the fourth quarter of fiscal year 2011 totaled approximately $11.1 million and included $7.5 million for the impairment of intangible assets, which is included within the impairment of intangible assets and goodwill line in our consolidated statements of operations, $2.1 million for the write-off of inventory, which is included within the cost of sales line in our consolidated statements of operations, and $1.2 million in severance related costs, which is included primarily within the research and development line in our consolidated statements of operations. The majority of the severance related costs were paid out in fiscal year 2011.
The intangible asset impairment charge of $7.5 million consists of $0.8 million to the write-off abandoned IPR&D acquired in the Neterion acquisition and $6.7 million to write-down the carrying value of intangible assets that are held for sale to $0.2 million at March 27, 2011, which represents their estimated fair value less costs to sell based on third-party bids received to date.
During the quarter ended December 26, 2010, we vacated our facility in Framingham, Massachusetts and recorded a restructuring reserve of $134,000 for the remaining payments owed on this site. We expect this balance to be paid by November 2011 when the lease expires.
In connection with the Neterion acquisition in March 2010, we assumed a lease obligation for a facility in Sunnyvale, California. We vacated the facility in May 2010 and recorded a restructuring reserve of approximately $234,000, during the quarter ended June 27, 2010, for the remaining payments due on this site. This balance is expected to be paid by August 2011 when the lease expires.
In connection with the acquisition of Sipex Corporation (“Sipex”) in August 2007, our management approved and initiated plans to restructure the operations of the combined company to eliminate certain duplicative activities, reduce costs and better align product and operating expenses with then current economic
84
Table of Contents
EXAR CORPORATION AND SUBSIDIARIES
NOTES TO CONSOLIDATED FINANCIAL STATEMENTS—(CONTINUED)
FISCAL YEARS ENDED MARCH 27, 2011, MARCH 28, 2010, AND MARCH 29, 2009
conditions. These costs were accounted for as liabilities assumed as part of the business combination. The costs remaining as of March 27, 2011 and March 28, 2010 relate to office space in Belgium that has been vacated but is under lease until March 2012 and were $81,000 and $209,000, respectively.
Our restructuring liabilities were included in the other accrued expenses line in our consolidated balance sheets, and the activities affecting the liabilities for fiscal year 2011 are summarized as follows (in thousands):
| Facility Costs |
||||
| Balance at March 28, 2010 |
$ | 239 | ||
| Payments |
(318 | ) | ||
| Additional accruals |
367 | |||
| Balance at March 27, 2011 |
$ | 288 | ||
NOTE 8. LONG-TERM INVESTMENT
Our long-term investment consists of our investment in Skypoint Telecom Fund II (US), L.P. (“Skypoint Fund”). Skypoint Fund is a venture capital fund that invests primarily in private companies in the telecommunications and/or networking industries. We account for this non-marketable equity investment under the cost method. We periodically review and determine whether the investment is other-than-temporarily impaired, in which case the investment is written down to its impaired value.
Our investment in TechFarm Ventures L.P. (“TechFarm Fund”), to which we contributed our total commitment to the fund of $4.0 million in capital since we became a limited partner in May 2001, had a carrying amount of zero as of March 27, 2011 and March 28, 2010, reflecting the net of the capital contribution and the cumulative impairment charges.
As of March 27, 2011 and March 28, 2010, our long-term investments balances, which are included in the other non-current assets line on the consolidated balance sheet, were as follows (in thousands):
| March 27, 2011 |
March 28, 2010 |
|||||||
| Skypoint Fund |
$ | 1,563 | $ | 1,440 | ||||
We have made $4.7 million in capital contributions to Skypoint Fund since we became a limited partner in July 2001. We contributed $186,000 and $41,000 to the fund during fiscal years of 2011 and 2010, respectively. As of March 27, 2011, we have a remaining potential capital commitment of approximately $0.3 million should the general partner decide to request it up to June 30, 2011.
The carrying amount of $1.6 million reflects the net of the capital contributions, cumulative impairment charges and capital distributions. We received capital distributions of $63,000 and $36,000, respectively, during fiscal year 2011 and fiscal year 2010.
85
Table of Contents
EXAR CORPORATION AND SUBSIDIARIES
NOTES TO CONSOLIDATED FINANCIAL STATEMENTS—(CONTINUED)
FISCAL YEARS ENDED MARCH 27, 2011, MARCH 28, 2010, AND MARCH 29, 2009
Impairment
We analyzed the fair value of the underlying investments of Skypoint Fund and TechFarm Fund and concluded portions of the carrying value were other-than-temporarily impaired and recorded impairments for fiscal years ended March 27, 2011, March 28, 2010 and March 29, 2009 as follows (in thousands):
| Fiscal Years Ended | ||||||||||||
| March 27, 2011 |
March 28, 2010 |
March 29, 2009 |
||||||||||
| Skypoint Fund |
$ | — | $ | 226 | $ | 737 | ||||||
| TechFarm Fund(1) |
— | — | 466 | |||||||||
| (1) | TechFarm Fund has had a carrying amount of zero since March 29, 2009. |
NOTE 9. GOODWILL AND INTANGIBLE ASSETS
Goodwill
Goodwill represents the excess of the purchase price over the fair value of the net tangible and identifiable intangible assets acquired in a business combination. We evaluate goodwill for impairment on an annual basis or whenever events and changes in circumstances suggest that the carrying amount may not be recoverable. We conduct our annual impairment analysis in the fourth quarter of each fiscal year. Impairment of goodwill is tested at the reporting unit level by comparing the reporting unit’s carrying amount, including goodwill, to the fair value of the reporting unit. The fair value of the reporting unit is estimated using a combination of the income approach that uses discounted cash flows and the market approach that utilizes comparable companies’ data. If the carrying amount of the reporting unit exceeds its fair value, goodwill is considered impaired and a second step is performed to measure the amount of impairment loss. Because we have one reporting unit, we utilize an entity-wide approach to assess goodwill for impairment.
In the fourth quarter of fiscal year 2011, we conducted our annual impairment review comparing the fair value of our one reporting unit with its carrying value. As of the test date and as of year-end, and before consideration of a control premium, the fair value, which was estimated as our market capitalization, exceeded the carrying value of our net assets. As a result, no impairment was recorded for fiscal year 2011.
In the fourth quarter of fiscal year 2010, we conducted our annual impairment review comparing the fair value of our one reporting unit with the carrying value. Based on the results at the time of our analysis, the fair value, which was estimated as our market capitalization, exceeded the carrying value of our net assets. As a result, no impairment was recorded for fiscal year 2010.
In the third quarter of fiscal year 2009, the rapid and severe deterioration of worldwide economic conditions affected our industry and led customers to scale down their levels of production. As a result of these impairment indicators, we considered the potential impairment of goodwill. Indicators that required us to perform an interim impairment review consisted of further weakening in new orders from our customers throughout the third quarter and into the fourth quarter of fiscal year 2009, as well as the uncertainty of the magnitude and duration of the recession as evidenced by industry analysts expectations that demand for semiconductors would remain weak until economic conditions improve. In addition, we experienced a significant decline in our stock price that reduced our market capitalization below our net asset carrying value for an extended period of time. We performed an interim goodwill impairment analysis and recorded a $46.2 million impairment loss that was included in the impairment of intangible assets and goodwill line in the consolidated statements of operations.
86
Table of Contents
EXAR CORPORATION AND SUBSIDIARIES
NOTES TO CONSOLIDATED FINANCIAL STATEMENTS—(CONTINUED)
FISCAL YEARS ENDED MARCH 27, 2011, MARCH 28, 2010, AND MARCH 29, 2009
The changes in the carrying amount of goodwill for fiscal years 2011 and 2010 were as follows (in thousands):
| Amount | ||||
| Balance as of March 29, 2009 |
$ | — | ||
| Goodwill addition in connection with the Hifn acquisition |
2,249 | |||
| Goodwill addition in connection with the Galazar acquisition |
372 | |||
| Goodwill addition in connection with the Neterion acquisition |
464 | |||
| Balance as of March 28, 2010 |
$ | 3,085 | ||
| Goodwill additions, impairments and adjustments |
99 | |||
| Balance as of March 27, 2011 |
3,184 | |||
Intangible Assets
Our purchased intangible assets at March 27, 2011 and March 28, 2010 were as follows (in thousands):
| March 27, 2011 | March 28, 2010 | |||||||||||||||||||||||
| Carrying Amount(1) |
Accumulated Amortization |
Net Carrying Amount |
Carrying Amount |
Accumulated Amortization |
Net Carrying Amount |
|||||||||||||||||||
| Existing technology |
$ | 33,613 | $ | (22,095 | ) | $ | 11,518 | $ | 35,621 | $ | (15,734 | ) | $ | 19,887 | ||||||||||
| Patents/Core technology |
3,906 | (2,340 | ) | 1,566 | 4,492 | (1,688 | ) | 2,804 | ||||||||||||||||
| In-process research and development |
300 | — | 300 | 2,200 | — | 2,200 | ||||||||||||||||||
| Research and development reimbursement contract |
4,500 | (4,500 | ) | — | 4,500 | (2,496 | ) | 2,004 | ||||||||||||||||
| Customer backlog |
1,400 | (1,400 | ) | — | 1,400 | (1,325 | ) | 75 | ||||||||||||||||
| Distributor relationships |
1,264 | (1,019 | ) | 245 | 1,264 | (919 | ) | 345 | ||||||||||||||||
| Customer relationships |
2,905 | (1,424 | ) | 1,481 | 4,670 | (777 | ) | 3,893 | ||||||||||||||||
| Non-compete agreement |
77 | (77 | ) | — | 100 | (3 | ) | 97 | ||||||||||||||||
| Tradenames/Trademarks |
1,025 | (745 | ) | 280 | 1,077 | (425 | ) | 652 | ||||||||||||||||
| Total |
$ | 48,990 | $ | (33,600 | ) | $ | 15,390 | $ | 55,324 | $ | (23,367 | ) | $ | 31,957 | ||||||||||
| (1) | The carrying amount as of March 27, 2011 is presented net of intangible asset impairment charges of approximately $7.5 million and $13.5 million recorded during fiscal year 2011 and fiscal year 2009, respectively. |
Long-lived assets are amortized on a straight-line basis over their respective estimated useful lives. We evaluate the remaining useful life of our long-lived assets that are being amortized each reporting period to determine whether events and circumstances warrant a revision to the remaining period of amortization. If the estimate of an intangible asset’s remaining useful life is changed, the remaining carrying amount of the long-lived asset is amortized prospectively over the remaining useful life. Long-lived assets are evaluated for impairment whenever events or changes in circumstances indicate that the carrying amount of an asset may not be recoverable. We compare the carrying value of long-lived assets to our projection of future undiscounted cash flows attributable to such assets and, in the event that the carrying value exceeds the future undiscounted cash flows, we record an impairment charge equal to the excess of the carrying value over the asset’s fair value.
87
Table of Contents
EXAR CORPORATION AND SUBSIDIARIES
NOTES TO CONSOLIDATED FINANCIAL STATEMENTS—(CONTINUED)
FISCAL YEARS ENDED MARCH 27, 2011, MARCH 28, 2010, AND MARCH 29, 2009
Although the assumptions used in projecting future revenues and gross margins are consistent with those used in our annual strategic planning process, intangible asset impairment charges might be required in future periods if our assumptions are not achieved.
IPR&D assets are considered indefinite-lived intangible assets and are not subject to amortization until their useful life is determined. IPR&D assets are evaluated for impairment annually or more frequently if events or changes in circumstances indicate that the asset might be impaired.
During the fourth quarter of fiscal year 2011, we decided to exit the data center virtualization market, and, in connection therewith, to stop development of our 10GbE network interface cards. We determined that the current economic and market environment did not provide the potential to deliver acceptable returns on the required investments in these products. As a result, in the fourth quarter of fiscal year 2011 we abandoned all related in-process research and development. In addition, we began to actively market for sale the related assets of our 10GbE technology, consisting primarily of underlying existing and core technology intangible assets. Charges related to this decision in the fourth quarter of fiscal year 2011 included $7.5 million for the impairment of intangible assets, which is included within the impairment of intangible assets and goodwill line in our consolidated statements of operations.
The intangible asset impairment charge of $7.5 million consists of $0.8 million to the write-off abandoned IPR&D acquired in the Neterion acquisition and $6.7 million to write-down the carrying value of intangible assets that are held for sale to $0.2 million at March 27, 2011, which represents their estimated fair value less costs to sell based on third-party bids received to date. In June 2011, we completed the asset sale process and received $0.2 million, net of selling costs.
As noted in the Goodwill discussion above, in the third quarter of fiscal year 2009, there were certain events that gave rise to impairment indicators and as a result we analyzed our long-lived assets for impairment. The analysis determined that the carrying amount of the intangible assets exceeded the implied fair value under the test for impairment and the difference was allocated to the intangible assets of the impacted asset group on a pro-rata basis using the relative carrying amounts of the assets. We recorded an impairment charge of approximately $13.5 million, which is included in the impairment of intangible assets and goodwill line in the consolidated statements of operations of which $9.8 million related to existing technology, $1.4 million to patents/core technology, $1.3 million to distributor relationships, $0.9 million to customer relationships and $0.1 million to tradenames/trademarks.
The aggregate amortization expenses for our purchased intangible assets for fiscal years ended March 27, 2011, March 28, 2010 and March 29, 2009 were as follows (in thousands, except weighted average lives):
| Weighted Average Lives |
March 27, 2011 |
March 28, 2010 |
March 29, 2009 |
|||||||||||||
| (in months) | (in thousands) | |||||||||||||||
| Existing technology |
65 | $ | 6,361 | $ | 4,936 | $ | 4,281 | |||||||||
| Patents/Core technology |
61 | 652 | 499 | 408 | ||||||||||||
| In-process research and development |
63 | — | — | — | ||||||||||||
| Research and development reimbursement contracts |
24 | 2,004 | 2,496 | — | ||||||||||||
| Customer backlog |
6 | 75 | 985 | — | ||||||||||||
| Distributor relationships |
72 | 100 | 102 | 280 | ||||||||||||
| Customer relationships |
80 | 647 | 317 | 159 | ||||||||||||
| Non-compete agreement |
15 | 74 | 3 | — | ||||||||||||
| Tradenames/Trademarks |
35 | 320 | 275 | 52 | ||||||||||||
| Total |
$ | 10,233 | $ | 9,613 | $ | 5,180 | ||||||||||
88
Table of Contents
EXAR CORPORATION AND SUBSIDIARIES
NOTES TO CONSOLIDATED FINANCIAL STATEMENTS—(CONTINUED)
FISCAL YEARS ENDED MARCH 27, 2011, MARCH 28, 2010, AND MARCH 29, 2009
The estimated future amortization expenses for our purchased intangible assets are summarized below (in thousands):
| Fiscal Year |
Amount | |||
| 2012 |
$ | 5,152 | ||
| 2013 |
4,468 | |||
| 2014 |
3,886 | |||
| 2015 |
1,362 | |||
| 2016 |
426 | |||
| 2017 and thereafter |
96 | |||
| Total estimated amortization |
$ | 15,390 | ||
NOTE 10. EARNINGS (LOSS) PER SHARE
Basic earnings (loss) per share excludes dilution and is computed by dividing net income (loss) by the weighted average number of common shares outstanding for the periods. Diluted earnings per share (“EPS”) reflects the potential dilution that would occur if outstanding stock options or warrants to purchase common stock were exercised for common stock, using the treasury stock method, and the common stock underlying outstanding restricted stock units (“RSUs”) was issued.
A summary of our loss per share for the three fiscal years of 2011, 2010 and 2009 was as follows (in thousands, except per share amounts):
| March 27, 2011 |
March 28, 2010 |
March 29, 2009 |
||||||||||
| Net loss |
$ | (35,668 | ) | $ | (28,110 | ) | $ | (73,036 | ) | |||
| Shares used in computation: |
||||||||||||
| Weighted average shares of common stock outstanding used in computation of basic loss per share |
44,218 | 43,584 | 42,887 | |||||||||
| Dilutive effect of stock options and restricted stock units |
— | — | — | |||||||||
| Shares used in computation of diluted loss per share |
44,218 | 43,584 | 42,887 | |||||||||
| Loss per share—basic and diluted |
$ | (0.81 | ) | $ | (0.64 | ) | $ | (1.70 | ) | |||
Options to purchase shares of common stock and unvested restricted stock units for shares of common stock were excluded from our loss per share calculation under the treasury stock method for the periods presented and were as follows (in thousands):
| March 27, 2011(1) |
March 28, 2010(1) |
March 29, 2009(1) |
||||||||||
| Options and RSUs |
316 | 337 | 214 | |||||||||
| (1) | As we incurred a net loss, we did not consider the impact of potentially dilutive instruments in the weighted average number of shares calculation as their inclusion would have been anti-dilutive. Had we had income for these periods, our diluted shares would have increased by the aforementioned amount. |
89
Table of Contents
EXAR CORPORATION AND SUBSIDIARIES
NOTES TO CONSOLIDATED FINANCIAL STATEMENTS—(CONTINUED)
FISCAL YEARS ENDED MARCH 27, 2011, MARCH 28, 2010, AND MARCH 29, 2009
The following shares were not included in the computation of diluted shares outstanding because they were anti-dilutive under the treasury stock method (in thousands, except per share amounts):
| March 27, 2011 |
March 28, 2010 |
March 29, 2009 | ||||||||||||||||
| Shares | Prices | Shares | Prices | Shares | Prices | |||||||||||||
| Options |
6,187 | $5.44 - $86.10 | 4,800 | $7.08 - $86.10 | 4,500 | $5.44 - $86.10 | ||||||||||||
| Warrants |
280 | 9.63 | 280 | 9.63 | 280 | 9.63 | ||||||||||||
| RSUs |
— | — | 3 | 7.03 | 56 | 7.12 | ||||||||||||
| Total |
6,467 | 5,083 | 4,836 | |||||||||||||||
Our application of the treasury stock method in determining the dilutive effect of stock options and RSUs includes assumed cash proceeds from option exercises, the average unamortized stock-based compensation expense for the period, and the estimated deferred tax benefit or detriment associated with stock-based compensation expense.
NOTE 11. COMMON STOCK REPURCHASES
From time to time, we acquire outstanding common stock in the open market to partially offset dilution from our equity award programs, to increase our return on our invested capital and to bring our cash to a more appropriate level for our company.
On August 28, 2007, we announced the approval of a share repurchase plan (“2007 SRP”) and authorized the repurchase of up to $100 million of our common stock.
During fiscal years 2011 and 2010, we did not repurchase any shares of our common stock.
As of March 27, 2011, the remaining authorized amount for share repurchases under the 2007 SRP was $11.8 million. The 2007 SRP does not have a termination date. We may continue to utilize our share repurchase plan, which would reduce our cash, cash equivalents and/or short-term marketable securities available to fund future operations and to meet other liquidity requirements.
NOTE 12. EMPLOYEE BENEFIT PLANS
Exar Savings Plan
The Exar Savings Plan, as amended and restated, covers our eligible U.S. employees. The Exar Savings Plan provides for voluntary salary reduction contributions in accordance with Section 401(k) of the Internal Revenue Code as well as matching contributions from the company based on the achievement of specified operating results.
Our matching contributions to the plan for the three fiscal years of 2011, 2010 and 2009 were as follows (in thousands):
| March 27, 2011 |
March 28, 2010 |
March 29, 2009 |
||||||||||
| Matching contributions |
$ | 404 | $ | 442 | $ | 336 | ||||||
90
Table of Contents
EXAR CORPORATION AND SUBSIDIARIES
NOTES TO CONSOLIDATED FINANCIAL STATEMENTS—(CONTINUED)
FISCAL YEARS ENDED MARCH 27, 2011, MARCH 28, 2010, AND MARCH 29, 2009
Executive and Employee Incentive Compensation Programs
Our incentive compensation programs provide for incentive awards for substantially all employees based on the achievement of personal objectives and our operating performance results. Our incentive compensation programs may be amended or discontinued at the discretion of our board of directors.
Our paid and unpaid incentive compensation for the three fiscal years of 2011, 2010 and 2009 were as follows (in thousands):
| March 27, 2011 |
March 28, 2010 |
March 29, 2009 |
||||||||||
| Paid incentive compensation |
$ | — | $ | 118 | $ | 468 | ||||||
| Unpaid incentive compensation |
— | 118 | 300 | |||||||||
NOTE 13. STOCK-BASED COMPENSATION
Employee Stock Participation Plan (“ESPP”)
Our ESPP permits employees to purchase common stock through payroll deductions at a purchase price that is equal to 95% of our common stock price on the last trading day of each three-calendar-month offering period. Our ESPP is non-compensatory.
The following table summarizes our ESPP transactions during the fiscal periods presented (in thousands, except per share amounts):
| Shares of Common Stock |
Weighted Average Price |
|||||||
| Authorized to issue: |
4,500 | — | ||||||
| Reserved for future issuance: |
||||||||
| Fiscal year ending March 27, 2011 |
1,480 | — | ||||||
| Fiscal year ending March 28, 2010 |
1,549 | — | ||||||
| Issued: |
||||||||
| Fiscal year ending March 27, 2011 |
69 | $ | 6.41 | |||||
| Fiscal year ending March 28, 2010 |
59 | 6.64 | ||||||
| Fiscal year ending March 29, 2009 |
56 | 7.08 | ||||||
Equity Incentive Plans
We currently have three equity incentive plans including the Exar Corporation 2006 Equity Incentive Plan (the “2006 Plan”) and two other equity plans assumed upon our August 2007 acquisition of Sipex: the Sipex Corporation Amended and Restated 2002 Non-Statutory Stock Option Plan and the Sipex Corporation 2006 Equity Incentive Plan (collectively, the “Sipex Plans”). The Sipex Corporation 2000 Non-Qualified Stock Option Plan expired October 31, 2010.
The 2006 Plan authorizes the issuance of stock options, stock appreciation rights, restricted stock, stock bonuses and other forms of awards granted or denominated in common stock or units of common stock, as well as cash bonus awards. RSUs granted under the 2006 Plan are counted against authorized shares available for future issuance on a basis of two shares for every RSU issued. The 2006 Plan allows for performance-based
91
Table of Contents
EXAR CORPORATION AND SUBSIDIARIES
NOTES TO CONSOLIDATED FINANCIAL STATEMENTS—(CONTINUED)
FISCAL YEARS ENDED MARCH 27, 2011, MARCH 28, 2010, AND MARCH 29, 2009
vesting and partial vesting based upon level of performance. Grants under the Sipex Plans are only available to former Sipex employees or employees of Exar hired after the Sipex acquisition. At our annual meeting on September 15, 2010, our stockholders approved an amendment to the 2006 Plan to increase the aggregate share limit under the 2006 Plan by an additional 5.5 million shares to 8.3 million shares. At March 27, 2011, there were 6.0 million shares available for future grant under all our equity incentive plans.
The following table summarizes information about our stock options outstanding at March 27, 2011:
| Options Outstanding | Options Exercisable | |||||||||||||||||||
| Range of |
Number Outstanding As of March 27, 2011 |
Weighted Average Remaining Contractual Terms (in years) |
Weighted Average Exercise Price |
Number Exercisable As of March 27, 2011 |
Weighted Average Exercise Price |
|||||||||||||||
| $ 3.60 - $6.16 |
1,224,948 | 5.40 | $ | 5.98 | 171,108 | $ | 5.81 | |||||||||||||
| 6.22 - 6.97 |
1,194,542 | 4.86 | 6.60 | 367,666 | 6.55 | |||||||||||||||
| 7.00 - 7.48 |
1,281,850 | 5.37 | 7.27 | 252,997 | 7.33 | |||||||||||||||
| 7.56 - 8.57 |
1,502,177 | 4.24 | 8.25 | 862,936 | 8.31 | |||||||||||||||
| 8.81 - 18.00 |
525,947 | 2.84 | 12.70 | 502,962 | 12.69 | |||||||||||||||
| 5,729,464 | 4.74 | $ | 7.61 | 2,157,669 | $ | 8.72 | ||||||||||||||
Valuation Assumptions
The assumptions used in calculating the fair value of stock-based compensation represent our estimates, but these estimates involve inherent uncertainties and the application of management judgments which include the expected term of the share-based awards, stock price volatility and forfeiture rates. As a result, if factors change and we use different assumptions, our stock-based compensation expense could be materially different in the future.
Valuation Method—we compute the fair value of stock options utilizing the Black-Scholes option pricing model.
Expected Term—we estimate the expected life of options granted based on historical exercise and post-vest cancellation patterns, which we believe are representative of future behavior.
Volatility—our expected volatility is based on historical data of the market closing price for our common stock as reported by The NASDAQ Global Market under the symbol “EXAR” and the expected term of our stock options.
Risk-Free Interest Rate—the risk-free interest rate assumption is based on the observed interest rate of the U.S. Treasury appropriate for the expected term of the option to be valued.
Dividend Yield—we do not currently pay dividends and have no plans to do so in the future. Therefore, we have assumed a dividend yield of zero.
92
Table of Contents
EXAR CORPORATION AND SUBSIDIARIES
NOTES TO CONSOLIDATED FINANCIAL STATEMENTS—(CONTINUED)
FISCAL YEARS ENDED MARCH 27, 2011, MARCH 28, 2010, AND MARCH 29, 2009
We have used the following weighted average assumptions to calculate the fair values of options granted during the years presented:
| March 27, 2011 |
March 28, 2010 |
March 29, 2009 |
||||||||||
| Expected term of options (years) |
4.4 | 4.7 – 4.9 | 4.6 – 4.8 | |||||||||
| Risk-free interest rate |
1.3 – 2.0 | % | 2.1 – 2.5 | % | 1.7 – 3.2 | % | ||||||
| Expected volatility |
39 – 40 | % | 37 – 38 | % | 30 – 38 | % | ||||||
| Expected dividend yield |
— | — | — | |||||||||
| Weighted average estimated fair value |
$ | 2.28 | $ | 2.43 | $ | 2.56 | ||||||
Stock Option Activities
A summary of stock option transactions during the periods indicated for all stock option plans was as follows:
| Outstanding Options / Quantity |
Weighted Average Exercise Price |
Weighted Average Remaining Contractual Term (in years) |
Aggregate Intrinsic Value(1) (in thousands) |
In-the-money Options Vested and Exercisable (in millions) |
||||||||||||||||
| Balance at March 30, 2008 |
5,086,297 | $ | 13.23 | 3.85 | $ | 2,383 | 0.7 | |||||||||||||
| Granted |
2,152,475 | 7.92 | ||||||||||||||||||
| Exercised |
(579,142 | ) | 5.38 | |||||||||||||||||
| Cancelled |
(2,526,228 | ) | 16.18 | |||||||||||||||||
| Forfeited |
(727,311 | ) | 11.07 | |||||||||||||||||
| Balance at March 29, 2009 |
3,406,091 | $ | 9.48 | 5.37 | $ | 129 | 0.2 | |||||||||||||
| Granted |
2,687,450 | 6.81 | ||||||||||||||||||
| Exercised |
(26,343 | ) | 5.63 | |||||||||||||||||
| Cancelled |
(262,629 | ) | 14.22 | |||||||||||||||||
| Forfeited |
(459,065 | ) | 8.49 | |||||||||||||||||
| Balance at March 28, 2010 |
5,345,504 | $ | 8.01 | 5.38 | $ | 1,882 | 0.2 | |||||||||||||
| Granted |
2,113,190 | 6.60 | ||||||||||||||||||
| Exercised |
(125,920 | ) | 6.07 | |||||||||||||||||
| Cancelled |
(308,595 | ) | 11.02 | |||||||||||||||||
| Forfeited |
(1,294,715 | ) | 6.93 | |||||||||||||||||
| Balance at March 27, 2011 |
5,729,464 | $ | 7.61 | 4.74 | $ | 147 | 0.1 | |||||||||||||
| Vested and expected to vest at March 27, 2011 |
5,482,432 | $ | 7.65 | 4.70 | $ | 138 | ||||||||||||||
| Vested and exercisable at March 27, 2011 |
2,157,669 | $ | 8.72 | 3.79 | $ | 51 | ||||||||||||||
| (1) | The aggregate intrinsic values in the table above represent the total pre-tax intrinsic value, which is based on the closing price of our common stock of $6.08, $7.32 and $6.17 as of March 27, 2011, March 28, 2010 and March 29, 2009, respectively. These were the amounts which would have been received by option holders if all option holders exercised their options as of that date. |
93
Table of Contents
EXAR CORPORATION AND SUBSIDIARIES
NOTES TO CONSOLIDATED FINANCIAL STATEMENTS—(CONTINUED)
FISCAL YEARS ENDED MARCH 27, 2011, MARCH 28, 2010, AND MARCH 29, 2009
Options exercised for the three fiscal years of 2011, 2010 and 2009 were as follows (in thousands):
| March 27, 2011 |
March 28, 2010 |
March 29, 2009 |
||||||||||
| Intrinsic value of options exercised |
$ | 100 | $ | 29 | $ | 1,302 | ||||||
| Cash received related to option exercises |
765 | 148 | 3,116 | |||||||||
| Tax benefit recorded |
2,300 | 2,503 | 1,307 | |||||||||
RSUs
We issue RSUs to employees and non-employee directors. RSUs generally vest on the first or third anniversary date from the grant date, although the RSUs issued in exchange for options tendered in our option exchange program in the third quarter of fiscal year 2009 vested in two equal annual installments. Prior to vesting, RSUs do not have dividend equivalent rights, do not have voting rights and the shares underlying the RSUs are not considered issued and outstanding. Shares are issued on the date the RSUs vest.
A summary of RSU transactions during the periods indicated for all stock option plans is as follows:
| Shares | Weighted Average Grant-Date Fair Value |
Weighted Average Remaining Contractual Term in Years |
Aggregate Intrinsic Value(1) (in thousands) |
Unrecognized Stock-based Compensation Cost(2) (in millions) |
||||||||||||||||
| Unvested at March 30, 2008 |
304,933 | $ | 12.20 | 1.41 | $ | 2,497 | $ | 2.5 | ||||||||||||
| Granted |
598,409 | 7.18 | ||||||||||||||||||
| Issued and released |
(117,437 | ) | 6.90 | |||||||||||||||||
| Cancelled |
(55,668 | ) | 9.16 | |||||||||||||||||
| Unvested at March 29, 2009 |
730,237 | $ | 8.36 | 1.14 | $ | 4,506 | $ | 2.0 | ||||||||||||
| Granted |
557,784 | 7.24 | ||||||||||||||||||
| Issued and released |
(349,409 | ) | 6.90 | |||||||||||||||||
| Cancelled |
(104,408 | ) | 8.54 | |||||||||||||||||
| Unvested at March 28, 2010 |
834,204 | $ | 8.20 | 1.04 | $ | 6,106 | $ | 4.2 | ||||||||||||
| Granted |
399,183 | 6.76 | ||||||||||||||||||
| Issued and released |
(618,411 | ) | 6.90 | |||||||||||||||||
| Cancelled |
(57,878 | ) | 7.52 | |||||||||||||||||
| Unvested at March 27, 2011 |
557,098 | $ | 7.17 | 1.09 | $ | 3,387 | $ | 2.3 | ||||||||||||
| Vested and expected to vest at March 27, 2011 |
531,942 | $ | 7.17 | 1.06 | $ | 3,234 | ||||||||||||||
| (1) | The aggregate intrinsic value of RSUs represents the closing price per share of our common stock at the end of the periods presented, multiplied by the number of unvested RSUs or the number of vested and expected to vest RSUs, as applicable, at the end of each period. |
| (2) | For RSUs, stock-based compensation expense was calculated based on our stock price on the date of grant, multiplied by the number of RSUs granted. The grant date fair value of RSUs, less estimated forfeitures, was recognized on a straight-line basis, over the vesting period. |
94
Table of Contents
EXAR CORPORATION AND SUBSIDIARIES
NOTES TO CONSOLIDATED FINANCIAL STATEMENTS—(CONTINUED)
FISCAL YEARS ENDED MARCH 27, 2011, MARCH 28, 2010, AND MARCH 29, 2009
In July 2009, we granted performance-based RSUs covering 99,000 shares to certain executives, issuable upon meeting certain performance targets in fiscal year 2010 and vesting annually over a three year period beginning July 1, 2010. The annual vesting requires continued service through each annual vesting date. During fiscal year 2011 and fiscal year 2010, $216,000 and $368,000, respectively, of compensation expense was recorded to reflect the achievement of these performance targets.
In April 2010, we granted performance-based RSUs covering 56,000 shares to our CEO, issuable upon meeting certain performance targets in our fiscal year 2011 and vesting annually over a three year period beginning May 3, 2010. The annual vesting requires continued service through each annual vesting date. During fiscal year 2011, $239,000 of compensation expense was recorded for these awards.
Stock-Based Compensation Expenses
The following table summarizes stock-based compensation expense related to stock options and RSUs for fiscal years 2011, 2010 and 2009 (in thousands):
| March 27, 2011 |
March 28, 2010 |
March 29, 2009 |
||||||||||
| Cost of sales |
$ | 489 | $ | 528 | $ | 595 | ||||||
| Research and development |
3,241 | 2,324 | 1,614 | |||||||||
| Selling, general and administrative |
3,651 | 3,113 | 2,725 | |||||||||
| Total stock-based compensation expense |
$ | 7,381 | $ | 5,965 | $ | 4,934 | ||||||
The amount of stock-based compensation cost capitalized in inventory was not material at each of the fiscal year ends presented.
Unrecognized Stock-based Compensation Expense
The following table summarizes unrecognized stock-based compensation expense related to stock options and RSUs for the periods indicated below as follows:
| March 27, 2011 | March 28, 2010 | March 29, 2009 | ||||||||||||||||||||||
| Amount (in thousands) |
Weighted Average Expected Remaining Period (in years) |
Amount (in thousands) |
Weighted Average Expected Remaining Period (in years) |
Amount (in thousands) |
Weighted Average Expected Remaining Period (in years) |
|||||||||||||||||||
| Options |
$ | 7,290 | 2.4 | $ | 8,139 | 2.9 | $ | 5,998 | 3.0 | |||||||||||||||
| RSUs(1) |
2,336 | 1.8 | 4,168 | 1.0 | 2,004 | 1.1 | ||||||||||||||||||
| Total Stock-based compensation expense |
$ | 9,626 | $ | 12,307 | $ | 8,002 | ||||||||||||||||||
| (1) | For RSUs, stock-based compensation expense was calculated based on our stock price on the date of grant, multiplied by the number of RSUs granted. The grant date fair value of RSUs, less estimated forfeitures, is recognized on a straight-line basis over the vesting period. |
95
Table of Contents
EXAR CORPORATION AND SUBSIDIARIES
NOTES TO CONSOLIDATED FINANCIAL STATEMENTS—(CONTINUED)
FISCAL YEARS ENDED MARCH 27, 2011, MARCH 28, 2010, AND MARCH 29, 2009
Option Exchange Program
On October 23, 2008, we commenced a tender offer (the “Offer”) and filed a Schedule TO with the SEC pursuant to which holders of options with exercise prices equal to or greater than $11.00 per share and an expiration date after March 31, 2009 could tender their options in exchange for RSUs awards. The exchange ratio of shares subject to such eligible options to shares subject to new awards issued was 4-to-1, 5-to-1 or 6-to-1, depending on the exercise price of the option being exchanged. New awards received in exchange for eligible options are subject to a two-year vesting schedule with 50% vesting at each anniversary of the grant date.
Pursuant to the Offer, 242 eligible participants tendered, and we accepted for exchange, options to purchase an aggregate of 1,650,231 shares of our common stock, representing approximately 94% of the 1,755,691 shares subject to options that were eligible to be exchanged in the Offer as of the commencement of the Offer on October 23, 2008. On November 24, 2008, upon the terms and subject to the conditions set forth in the Offer to Exchange Certain Outstanding Options for Restricted Stock Units, filed as an exhibit to the Schedule TO, we issued RSU awards covering an aggregate of 344,020 shares of our common stock in exchange for the options surrendered pursuant to the Offer.
The new awards were granted with a price of $6.51 per share, the closing price of our common stock on November 24, 2008 as reported on The NASDAQ Global Select Market. The fair value of the options exchanged was measured as the total of the unrecognized compensation cost of the original options tendered and the incremental compensation cost of the RSUs awarded on November 24, 2008, the date of exchange. The incremental compensation cost of $1.2 million, was measured as the excess of the fair value of the RSUs over the fair value of the options immediately before cancellation based on the share price and other pertinent factors at that date. The amount was amortized over the two years service period. During fiscal years 2011, 2010 and 2009, we recorded approximately $327,000, $530,000 and $208,000, respectively, of such incremental stock-based compensation expense.
NOTE 14. WARRANTS
In connection with the Sipex acquisition, we assumed warrants with a fair value of $1.5 million on the date of acquisition, which enable the holders, to purchase a total of approximately 280,000 shares of our common stock. The warrants were exercisable at any time for shares of our common stock at an initial exercise price of $9.63 per share, subject to adjustment upon certain events. The warrants expired unexercised on May 18, 2011.
NOTE 15. LEASE FINANCING OBLIGATION
In connection with the Sipex acquisition, we assumed a lease financing obligation related to the Hillview facility located in Milpitas, California (the “Hillview Facility”). The lease term expired March 31, 2011 and had average lease payments of approximately $1.4 million per year.
The fair value of the Hillview Facility was estimated at $13.4 million at the time of the acquisition and was included in the property, plant and equipment, net line on the consolidated balance sheet. In accordance with purchase accounting, we have accounted for this sale and leaseback transaction as a financing transaction which was included in the long-term lease financing obligations line on our consolidated balance sheet. The effective interest rate is 8.2%.
96
Table of Contents
EXAR CORPORATION AND SUBSIDIARIES
NOTES TO CONSOLIDATED FINANCIAL STATEMENTS—(CONTINUED)
FISCAL YEARS ENDED MARCH 27, 2011, MARCH 28, 2010, AND MARCH 29, 2009
Depreciation for the Hillview Facility recorded over the straight-line method for the remaining useful life for the periods indicated below was as follows (in thousands):
| Fiscal Years Ended | ||||||||||||
| March 27, 2011 |
March 28, 2010 |
March 29, 2009 |
||||||||||
| Depreciation expense |
$ | 323 | $ | 352 | $ | 352 | ||||||
The sublease income recorded in the interest income and other, net line in our consolidated statements of operations for the periods indicated below was as follows (in thousands):
| Fiscal Years Ended | ||||||||||||
| March 27, 2011 |
March 28, 2010 |
March 29, 2009 |
||||||||||
| Sublease income |
$ | 1,427 | $ | 1,396 | $ | 1,396 | ||||||
We have also acquired engineering design tools (“design tools”) under capital leases. We acquired $5.2 million of design tools in December 2007 under a four-year license, $3.7 million of design tools in November 2008 under a three-year license, $1.1 million in July 2009 under a 3-year license, $1.3 million in December 2009 under a 28-month license, and $1.0 million in June 2010 under a 3-year license which were accounted for as capital leases and recorded in the property, plant and equipment, net line on the consolidated balance sheets. The related design tool obligations were included in the lease financing obligations line in our consolidated balance sheets.
Amortization of the design tools recorded using the straight-line method over the remaining useful life for the periods indicated below was as follows (in thousands):
| Fiscal Years Ended | ||||||||||||
| March 27, 2011 |
March 28, 2010 |
March 29, 2009 |
||||||||||
| Amortization expense |
$ | 3,526 | $ | 2,541 | $ | 1,574 | ||||||
Future minimum lease payments for the lease financing obligations as of March 27, 2011 were as follows (in thousands):
| Fiscal Years |
Hillview Facility(1) |
Design Tools |
Total | |||||||||
| 2012 |
$ | 12,168 | $ | 1,838 | $ | 14,006 | ||||||
| 2013 |
— | 390 | 390 | |||||||||
| Total minimum lease payments |
12,168 | 2,228 | 14,396 | |||||||||
| Less: amount representing interest |
— | (157 | ) | (157 | ) | |||||||
| Less: amount representing maintenance |
— | — | — | |||||||||
| Present value of minimum lease payments |
12,168 | 2,071 | 14,239 | |||||||||
| Less: current portion of lease financing obligation |
— | (1,681 | ) | (1,681 | ) | |||||||
| Long-term lease financing obligations |
$ | 12,168 | $ | 390 | $ | 12,558 | ||||||
97
Table of Contents
EXAR CORPORATION AND SUBSIDIARIES
NOTES TO CONSOLIDATED FINANCIAL STATEMENTS—(CONTINUED)
FISCAL YEARS ENDED MARCH 27, 2011, MARCH 28, 2010, AND MARCH 29, 2009
| (1) | At the end of the lease term, March 31, 2011, the estimated final lease obligation was approximately $12.2 million, which we settled in a noncash transaction by returning the Hillview Facility to the lessor. As a result, during the first quarter of fiscal year 2012, the property, plant and equipment balance and the long-term lease financing obligations balance on our consolidated balance sheet and will both decline by approximately $12.2 million. |
Interest expense for the Hillview Facility lease financing obligation and design tools for the periods indicated below was as follows (in thousands):
| Fiscal Years Ended | ||||||||||||
| March 27, 2011 |
March 28, 2010 |
March 29, 2009 |
||||||||||
| Interest expense |
$ | 1,252 | $ | 1,285 | $ | 1,311 | ||||||
In the course of our business, we enter into arrangements accounted for as operating leases. Our current arrangements relate to engineering design software licenses and office space. As of March 27, 2011, our future obligations under these arrangements were $5.7 million and $1.5 million, respectively.
In fiscal year 2011, the lessor for the Hillview Facility made a remediation claim for damages related to our lease. Based on such claim, we submitted a proposal to the lessor to settle the claim and recorded an accrual of $0.4 million in fiscal year 2011.
NOTE 16. COMMITMENTS AND CONTINGENCIES
In 1986, Micro Power Systems Inc. (“MPSI”), a subsidiary that we acquired in June 1994, identified low-level groundwater contamination at its principal manufacturing site. The area and extent of the contamination appear to have been defined. MPSI previously reached an agreement with a prior tenant to share in the cost of ongoing site investigations and the operation of remedial systems to remove subsurface chemicals. The frequency and number of wells monitored at the site was reduced with prior regulatory approval for a plume stability analysis as an initial step towards site closure. No significant rebound concentrations have been observed. The groundwater treatment system remains shut down. In July 2008, we evaluated the effectiveness of the plume stability and decided to initiate an alternative treatment program to pursue a no further action order for the site. The program was approved by the state and implementation started in October 2009. As of March 27, 2011 and March 28, 2010, the outstanding liabilities for remediation options and future monitoring were $113,000 and $137,000, respectively.
Generally, we warrant all custom products and application specific products, including cards and boards, against defects in materials and workmanship for a period of 12 months and occasionally we may provide an extended warranty of up to three years from the delivery date. We warrant all of our standard products against defects in materials and workmanship for a period of 90 days from the date of delivery. Reserve requirements are recorded in the period of sale and are based on an assessment of the products sold with warranty and historical warranty costs incurred. Our liability is generally limited to replacing, repairing or issuing credit, at our option, for the product if it has been paid for. The warranty does not cover damage which results from accident, misuse, abuse, improper line voltage, fire, flood, lightning or other damage resulting from modifications, repairs or alterations performed other than by us, or resulting from failure to comply with our written operating and maintenance instructions. Warranty expense has historically been immaterial for our products. The warranty liabilities related to our products as of March 27, 2011 and March 28, 2010 were immaterial.
98
Table of Contents
EXAR CORPORATION AND SUBSIDIARIES
NOTES TO CONSOLIDATED FINANCIAL STATEMENTS—(CONTINUED)
FISCAL YEARS ENDED MARCH 27, 2011, MARCH 28, 2010, AND MARCH 29, 2009
In the ordinary course of business, we may provide for indemnification of varying scope and terms to customers, vendors, lessors, business partners, purchasers of assets or subsidiaries, and other parties with respect to certain matters, including, but not limited to, losses arising out of our breach of agreements or representations and warranties made by us, services to be provided by us, intellectual property infringement claims made by third parties or, with respect to the sale of assets or a subsidiary, matters related to our conduct of the business and tax matters prior to the sale. In addition, we have entered into indemnification agreements with our directors and certain of our executive officers that will require us, among other things, to indemnify them against certain liabilities that may arise by reason of their status or service as directors or executive officers. We maintain director and officer liability insurance, which may cover certain liabilities arising from our obligation to indemnify our directors and officers, and former directors and officers of acquired companies, in certain circumstances. It is not possible to determine the aggregate maximum potential loss under these indemnification agreements due to the limited history of prior indemnification claims and the unique facts and circumstances involved in each particular agreement. Such indemnification agreements might not be subject to maximum loss clauses. Historically, we have not incurred material costs as a result of obligations under these agreements and we have not accrued any liabilities related to such indemnification obligations in our consolidated financial statements.
NOTE 17. LEGAL PROCEEDINGS
From time to time, we are involved in various claims, legal actions and complaints arising in the normal course of business. We are not a named party to any currently ongoing lawsuit or formal proceeding that, in the opinion of our management, is likely to have a material adverse effect on our financial position, results of operations or cash flows.
NOTE 18. INCOME TAXES
The components of the provision for (benefit from) income taxes are as follows (in thousands) as of the dates indicated:
| March 27, 2011 |
March 28, 2010 |
March 29, 2009 |
||||||||||
| Current: |
||||||||||||
| Federal |
$ | (37 | ) | $ | (181 | ) | $ | (8 | ) | |||
| State |
(106 | ) | (240 | ) | (234 | ) | ||||||
| Foreign |
388 | 250 | 192 | |||||||||
| Total current |
$ | 245 | $ | (171 | ) | $ | (50 | ) | ||||
| Deferred: |
||||||||||||
| Federal |
$ | 9 | $ | (270 | ) | $ | (450 | ) | ||||
| State |
1 | (22 | ) | (35 | ) | |||||||
| Total deferred |
$ | 10 | $ | (292 | ) | $ | (485 | ) | ||||
| Total provision for (benefit from) income taxes |
$ | 255 | $ | (463 | ) | $ | (535 | ) | ||||
Consolidated pre-tax income included foreign income of $1.0 million, $2.4 million and $0.2 million for fiscal years 2011, 2010 and 2009, respectively. Undistributed earnings of $7.0 million of our foreign subsidiaries are considered to be indefinitely reinvested and, accordingly, no provision for federal and state income taxes
99
Table of Contents
EXAR CORPORATION AND SUBSIDIARIES
NOTES TO CONSOLIDATED FINANCIAL STATEMENTS—(CONTINUED)
FISCAL YEARS ENDED MARCH 27, 2011, MARCH 28, 2010, AND MARCH 29, 2009
have been provided thereon. Upon distribution of those earnings in the form of a dividend or otherwise, we would be subject to both United States income taxes (subject to an adjustment for foreign tax credits) and withholding taxes payable to various foreign countries.
Significant components of our net deferred taxes are as follows (in thousands) as of the dates indicated:
| March 27, 2011 |
March 28, 2010 |
March 29, 2009 |
||||||||||
| Deferred tax assets: |
||||||||||||
| Reserves and expenses not currently deductible |
$ | 9,596 | $ | 8,119 | $ | 7,701 | ||||||
| Net operating loss carryforwards |
110,763 | 101,691 | 84,528 | |||||||||
| Tax credits |
25,464 | 20,641 | 15,960 | |||||||||
| Losses on investments |
2,259 | 2,251 | 16,995 | |||||||||
| Capitalized R&D expenses |
13,159 | 12,521 | 4,048 | |||||||||
| Deferred margin |
5,693 | 5,570 | 3,846 | |||||||||
| Depreciation |
3,756 | 2,259 | 197 | |||||||||
| Total deferred tax assets |
170,690 | 153,052 | 133,275 | |||||||||
| Deferred tax liabilities: |
||||||||||||
| Non-goodwill intangibles |
(4,026 | ) | (9,941 | ) | (1,547 | ) | ||||||
| Total deferred tax liabilities |
(4,026 | ) | (9,941 | ) | (1,547 | ) | ||||||
| Valuation allowance |
(166,684 | ) | (143,122 | ) | (131,728 | ) | ||||||
| Net deferred tax liabilities |
$ | (20 | ) | $ | (11 | ) | $ | — | ||||
Reconciliations of the income tax provision at the statutory rate to our provision for (benefit from) income tax are as follows (in thousands) as of the dates indicated:
| March 27, 2011 |
March 28, 2010 |
March 29, 2009 |
||||||||||
| Income tax provision at statutory rate |
$ | (12,395 | ) | $ | (9,830 | ) | $ | (25,750 | ) | |||
| State income taxes, net of federal tax benefit |
(997 | ) | (763 | ) | (1,970 | ) | ||||||
| Deferred tax assets not benefited |
14,599 | 9,910 | 12,867 | |||||||||
| Tax credits |
(1,605 | ) | (1,499 | ) | (1,315 | ) | ||||||
| Stock-based compensation |
751 | 570 | 498 | |||||||||
| Goodwill impairment |
— | — | 15,491 | |||||||||
| Acquisition cost |
— | 2,348 | — | |||||||||
| Foreign rate differential |
(61 | ) | (730 | ) | 56 | |||||||
| Prior year tax expense true-up |
(24 | ) | (150 | ) | (96 | ) | ||||||
| Other, net |
(13 | ) | (319 | ) | (316 | ) | ||||||
| Provision for (benefit from) income taxes |
$ | 255 | $ | (463 | ) | $ | (535 | ) | ||||
As of March 27, 2011, our federal and state net operating loss carryforwards for income tax purposes were approximately $285.0 million and $139.0 million, respectively. If not utilized, some of the federal net operating loss carryovers will begin expiring in fiscal year 2019, while the state net operating losses will begin to expire in 2012. As of March 27, 2011, our Canadian net operating loss carryforward for income tax purposes is approximately $3.0 million. If not utilized, some of the Canadian net operating loss carryovers will begin expiring in fiscal year 2012.
100
Table of Contents
EXAR CORPORATION AND SUBSIDIARIES
NOTES TO CONSOLIDATED FINANCIAL STATEMENTS—(CONTINUED)
FISCAL YEARS ENDED MARCH 27, 2011, MARCH 28, 2010, AND MARCH 29, 2009
As of March 27, 2011, our federal and state tax credit carryforwards were $9.0 million and $11.0 million, respectively. Federal credits will begin to expire in fiscal year 2016. Canadian credits will begin to expire in fiscal year 2015.
Utilization of these federal and state net operating loss and tax credit carryforwards may be subject to a substantial annual limitation due to the ownership change limitations provided by the Internal Revenue Code of 1986, as amended, and similar state provisions.
We have evaluated our deferred tax assets and concluded that a valuation allowance is required for that portion of the total deferred tax assets that are not considered more likely than not to be realized in future periods. To the extent that the deferred tax assets with a valuation allowance become realizable in future periods, we will have the ability, subject to carryforward limitations, to benefit from these amounts. Approximately $13.0 million of these deferred tax assets pertain to certain net operating loss and credit carryforwards that resulted from the exercise of employee stock options. When recognized, the tax benefit of these carryforwards is accounted for as a credit to additional paid-in capital rather than a reduction of the income tax provision.
Uncertain Income Tax Benefits
A reconciliation of the beginning and ending amount of the unrecognized tax benefits during the tax year ended March 27, 2011 is as follows (in thousands):
| Amount | ||||
| Unrecognized tax benefits as of March 30, 2008 |
$ | 9,410 | ||
| Gross increase related to prior year tax positions |
— | |||
| Gross increase related to current year tax positions |
592 | |||
| Lapses in statute of limitation |
(70 | ) | ||
| Unrecognized tax benefits as of March 29, 2009 |
9,932 | |||
| Gross increase related to prior year tax positions |
1,975 | |||
| Gross increase related to current year tax positions |
4,050 | |||
| Lapses in statute of limitation |
(94 | ) | ||
| Unrecognized tax benefits as of March 28, 2010 |
15,863 | |||
| Gross increase related to prior year tax positions |
179 | |||
| Gross increase related to current year tax positions |
857 | |||
| Lapses in statute of limitation |
(185 | ) | ||
| Unrecognized tax benefits as of March 27, 2011 |
$ | 16,714 | ||
Of the total unrecognized gross tax benefit of $16.7 million, $3.7 million is presented within income taxes payable, non-current, and $13.0 million is presented as a reduction to deferred tax assets. We do not anticipate a significant increase or decrease to our unrecognized tax benefits within the next twelve months.
Estimated interest and penalties related to the underpayment of income taxes are classified as a component of the provision for income taxes in the consolidated statement of operations. Accrued interest and penalties were $0.3 million and $0.4 million as of March 27, 2011 and March 28, 2010, respectively.
Our only major tax jurisdictions are the United States federal and various states. The fiscal years 2001 through 2010 remain open and subject to examinations by the appropriate governmental agencies in the United States and certain of our state jurisdictions.
101
Table of Contents
EXAR CORPORATION AND SUBSIDIARIES
NOTES TO CONSOLIDATED FINANCIAL STATEMENTS—(CONTINUED)
FISCAL YEARS ENDED MARCH 27, 2011, MARCH 28, 2010, AND MARCH 29, 2009
NOTE 19. SEGMENT AND GEOGRAPHIC INFORMATION
We operate in one reportable segment, which is comprised of one operating segment. We design, develop and market high- performance, analog and mixed-signal silicon solutions and software and subsystem solutions for a variety of markets including communications, datacom and storage, interface and power management. The nature of our products and production processes and the type of customers and distribution methods are consistent among all of our products.
Our net sales by product lines are summarized as follows (in thousands):
| Fiscal Years Ended | ||||||||||||
| March 27, 2011 |
March 28, 2010 |
March 29, 2009 |
||||||||||
| Communications |
$ | 23,159 | $ | 24,094 | $ | 27,833 | ||||||
| Datacom and storage |
16,876 | 25,259 | — | |||||||||
| Interface |
76,937 | 61,908 | 63,036 | |||||||||
| Power Management |
29,033 | 23,617 | 24,249 | |||||||||
| Total net sales |
$ | 146,005 | $ | 134,878 | $ | 115,118 | ||||||
| * | Incremental revenues from Hifn, Galazar and Neterion have been included in our consolidated financial statements since April 4, 2009, June 18, 2009 and March 17, 2010, respectively. |
Our foreign operations are conducted primarily through our wholly-owned subsidiaries in Canada, China, France, Germany, Italy, Japan, Malaysia, Singapore, South Korea, Taiwan and the United Kingdom. Our principal markets include North America, Europe and the Asia Pacific region. Net sales by geographic areas represent sales to unaffiliated customers.
Our net sales by geographic areas are summarized as follows (in thousands):
| Fiscal Years Ended | ||||||||||||
| March 27, 2011 |
March 28, 2010 |
March 29, 2009 |
||||||||||
| United States |
$ | 31,678 | $ | 34,291 | $ | 28,517 | ||||||
| China |
49,738 | 47,192 | 27,384 | |||||||||
| Singapore |
14,445 | 14,393 | 14,894 | |||||||||
| Japan |
9,098 | 7,240 | 7,170 | |||||||||
| Germany |
13,619 | 1,982 | 3,535 | |||||||||
| Europe (excluding Germany) |
9,486 | 17,405 | 21,558 | |||||||||
| Rest of world |
17,941 | 12,375 | 12,060 | |||||||||
| Total net sales |
$ | 146,005 | $ | 134,878 | $ | 115,118 | ||||||
| * | Incremental revenues from Hifn, Galazar and Neterion have been included in our consolidated financial statements since April 4, 2009, June 18, 2009 and March 17, 2010, respectively. |
Substantially all of our long-lived assets at March 27, 2011 and March 28, 2010 were located in the United States.
102
Table of Contents
EXAR CORPORATION AND SUBSIDIARIES
NOTES TO CONSOLIDATED FINANCIAL STATEMENTS—(CONTINUED)
FISCAL YEARS ENDED MARCH 27, 2011, MARCH 28, 2010, AND MARCH 29, 2009
NOTE 20. ALLOWANCES FOR SALES RETURNS AND DOUBTFUL ACCOUNTS
We had the following activities for the allowance for sales returns and allowance and for doubtful accounts (in thousands):
| Classification |
Balance at Beginning of Year |
Additions | Write-offs And Recoveries(1) |
Balance at End of Year |
||||||||||||
| Allowance for sales returns: |
||||||||||||||||
| Year ended March 27, 2011 |
$ | 1,250 | $ | 14,790 | $ | 14,795 | $ | 1,245 | ||||||||
| Year ended March 28, 2010 |
1,213 | 12,011 | 11,974 | 1,250 | ||||||||||||
| Year ended March 29, 2009 |
1,992 | 7,871 | 8,650 | 1,213 | ||||||||||||
| Allowance for doubtful accounts: |
||||||||||||||||
| Year ended March 27, 2011 |
186 | 145 | 53 | 278 | ||||||||||||
| Year ended March 28, 2010 |
95 | 85 | (6 | ) | 186 | |||||||||||
| Year ended March 29, 2009 |
143 | (47 | ) | 1 | 95 | |||||||||||
| (1) | Write-off and recovery amounts within allowance for sales returns reflect credits issued to distributors for stock rotations and volume discounts. |
NOTE 21. SUPPLEMENTARY QUARTERLY FINANCIAL DATA (UNAUDITED)
The following table contains selected unaudited quarterly financial data for fiscal years 2011 and 2010. In the opinion of management, this unaudited information has been prepared on the same basis as the audited information and includes all adjustments, consisting only of normal and recurring adjustments necessary to state fairly the information set forth therein. Results for a given quarter are not necessarily indicative of results for any subsequent quarter (in thousands, except per share data. Net loss per share for the four quarters of each fiscal year may not sum to the total for the fiscal year, because of the different number of shares outstanding during each period).
| Fiscal Year 2011 | Fiscal Year 2010 | |||||||||||||||||||||||||||||||
| Classification |
March 27, 2011(1) |
December 26, 2010(2) |
September 26, 2010(3) |
June 27, 2010(4) |
March 28, 2010(5) |
December 27, 2009(6) |
September 27, 2009(7) |
June 28, 2009(8) |
||||||||||||||||||||||||
| Consolidated Statement of Operations Data: |
||||||||||||||||||||||||||||||||
| Net revenues |
$ | 33,771 | $ | 35,365 | $ | 37,233 | $ | 39,636 | $ | 38,497 | $ | 33,931 | $ | 31,588 | $ | 30,862 | ||||||||||||||||
| Gross profit |
11,807 | 16,083 | 17,291 | 18,816 | 19,402 | 17,045 | 14,090 | 12,845 | ||||||||||||||||||||||||
| Loss from operations |
(19,516 | ) | (6,286 | ) | (5,632 | ) | (8,584 | ) | (4,539 | ) | (5,317 | ) | (9,573 | ) | (14,561 | ) | ||||||||||||||||
| Net loss |
(18,836 | ) | (4,959 | ) | (4,459 | ) | (7,414 | ) | (3,310 | ) | (3,762 | ) | (8,163 | ) | (12,875 | ) | ||||||||||||||||
| Net loss per share: |
||||||||||||||||||||||||||||||||
| Basic and Diluted |
$ | (0.42 | ) | $ | (0.11 | ) | $ | (0.10 | ) | $ | (0.17 | ) | $ | (0.08 | ) | $ | (0.09 | ) | $ | (0.19 | ) | $ | (0.30 | ) | ||||||||
| Shares used in the computation of net loss per shares: |
||||||||||||||||||||||||||||||||
| Basic and Diluted |
44,503 | 44,300 | 44,173 | 43,897 | 43,822 | 43,648 | 43,550 | 43,314 | ||||||||||||||||||||||||
103
Table of Contents
EXAR CORPORATION AND SUBSIDIARIES
NOTES TO CONSOLIDATED FINANCIAL STATEMENTS—(CONTINUED)
FISCAL YEARS ENDED MARCH 27, 2011, MARCH 28, 2010, AND MARCH 29, 2009
| (1) | Includes $1.8 million amortization expenses related to purchased assets in connection with the Neterion, Galazar, Hifn and Sipex acquisitions; $7.5 million impairment charges to intangible assets related to the decision to exit the 10 GbE market; and $3.6 million of exit costs related to the decision to exit the 10 GbE market. |
| (2) | Includes $1.9 million amortization expenses related to purchased assets in connection with the Neterion, Galazar, Hifn and Sipex acquisitions. |
| (3) | Includes $2.9 million amortization expenses related to purchased assets in connection with the Neterion, Galazar, Hifn and Sipex acquisitions. |
| (4) | Includes $2.9 million amortization expenses related to purchased assets in connection with the Neterion, Galazar, Hifn and Sipex acquisitions; and $0.3 million in acquisition related costs. |
| (5) | Includes $2.3 million amortization expenses related to purchased assets in connection with the Neterion, Galazar, Hifn and Sipex acquisitions; $0.6 million in acquisition related costs; and $0.1 million fair value adjustment of inventories in connection with Galazar acquisition. |
| (6) | Includes $1.9 million amortization expenses related to purchased assets in connection with the Galazar, Hifn and Sipex acquisitions; $0.4 million in acquisition related costs; and $0.1 million fair value adjustment of inventories in connection with Galazar acquisition. |
| (7) | Includes $2.4 million amortization expenses related to purchased assets in connection with the Galazar, Hifn and Sipex acquisitions; $0.8 million in acquisition related costs; $0.4 million fair value adjustment of inventories in connection with Galazar acquisition; and $0.2 million impairment loss related to the investment in marketable and non-marketable securities. |
| (8) | Includes $2.1 million amortization expenses related to purchased assets in connection with the Galazar, Hifn and Sipex acquisitions; $4.5 million in acquisition related costs; $1.8 million fair value adjustment of inventories in connection with the Hifn and Galazar acquisition; $0.1 million separation expense related to an executive officer; and $0.1 million impairment loss related to the investment in marketable and non-marketable securities. |
104
Table of Contents
| ITEM 9. | CHANGES IN AND DISAGREEMENTS WITH ACCOUNTANTS ON ACCOUNTING AND FINANCIAL DISCLOSURE |
None.
| ITEM 9A. | CONTROLS AND PROCEDURES |
Disclosure Controls and Procedures
Evaluation of Disclosure Controls and Procedures (“Disclosure Controls”)
Disclosure Controls, as defined in Rule 13a-15(e) and 15d-15(e) of the Securities Exchange Act of 1934, as amended (the “Exchange Act”), are controls and procedures designed to ensure that information required to be disclosed in reports filed or submitted under the Exchange Act is recorded, processed, summarized and reported within the time periods as specified in the SEC’s rules and forms. In addition, Disclosure Controls are designed to ensure the accumulation and communication of information required to be disclosed in reports filed or submitted under the Exchange Act to our management, including the Chief Executive Officer (our principal executive officer) (the “CEO”) and Chief Financial Officer (our principal financial officer) (the “CFO”), to allow timely decisions regarding required disclosure.
We evaluated the effectiveness of the design and operation of our Disclosure Controls, as defined by the rules and regulations of the SEC (the “Evaluation”), as of the end of the period covered by this Annual Report. This Evaluation was performed under the supervision and with the participation of management, including our CEO, as principal executive officer, and CFO, as principal financial officer.
Attached as Exhibits 31.1 and 31.2 of this Annual Report are the certifications of the CEO and the CFO, respectively, pursuant to Section 302 of the Sarbanes-Oxley Act of 2002 (the “Certifications”). This section of the Annual Report provides information concerning the Evaluation referred to in the Certifications and should be read in conjunction with the Certifications.
Based on the Evaluation, our CEO and CFO have concluded that our Disclosure Controls are effective as of the end of fiscal year 2011.
Inherent Limitations on the Effectiveness of Disclosure Controls
Our management, including the CEO and CFO, does not expect that our Disclosure Controls will prevent all errors and all fraud. Disclosure Controls, no matter how well conceived, managed, utilized and monitored, can provide only reasonable assurance that the objectives of such controls are met. Therefore, because of the inherent limitation of Disclosure Controls, no evaluation of such controls can provide absolute assurance that all control issues and instances of fraud, if any, within us have been detected.
Management’s Annual Report on Internal Control over Financial Reporting
Management is responsible for establishing and maintaining adequate internal control over financial reporting. Management conducted an assessment of our internal control over financial reporting as of March 27, 2011 based on the framework established by the Committee of Sponsoring Organizations of the Treadway Commission in Internal Control—Integrated Framework . Based on this assessment, management concluded that, as of March 27, 2011, our internal control over financial reporting was effective.
Internal control over financial reporting cannot provide absolute assurance of achieving financial reporting objectives because of its inherent limitations. Internal control over financial reporting is a process that involves human diligence and compliance, and is subject to lapses in judgment and breakdowns resulting from human failures. Internal control over financial reporting also can be circumvented by collusion or improper management
105
Table of Contents
override. Because of such limitations, there is a risk that material misstatements may not be prevented or detected on a timely basis by internal control over financial reporting. However, these inherent limitations are known features of the financial reporting process. Therefore it is possible to design into the process safeguards to reduce, though not eliminate, this risk.
The effectiveness of our internal control over financial reporting as of March 27, 2011 has been audited by PricewaterhouseCoopers LLP, an independent registered public accounting firm, as stated in their report included in this Annual Report.
Changes in Internal Control over Financial Reporting
There was no change in our internal control over financial reporting that occurred during the fourth quarter of fiscal year 2011 that has materially affected, or is reasonably likely to materially affect, our internal control over financial reporting.
| ITEM 9B. | OTHER INFORMATION |
None.
106
Table of Contents
| ITEM 10. | DIRECTORS, EXECUTIVE OFFICERS AND CORPORATE GOVERNANCE |
The information required by this item is incorporated by reference from the information set forth under the captions “Election of Directors,” “Corporate Governance and Board Matters,” “Executive Compensation Matters” and “Section 16(a) Beneficial Ownership Reporting Compliance” in our Definitive Proxy Statement in connection with our 2011 Annual Meeting of Stockholders (“2011 Definitive Proxy Statement”) which will be filed with the Securities and Exchange Commission no later than 120 days after March 27, 2011.
Executive Officers
A listing of Executive Officers of Exar and certain other information required by Item 10 with respect to our executive officers is set forth under the caption “Executive Officers of the Registrant” in Part I, Item 1 of this Report and is incorporated herein by reference.
Code of Ethics
We have adopted a Code of Ethics for Principal Executives, Executive Management and Senior Financial Officers, a Code of Business Conduct and Ethics and a Financial Integrity Compliance Policy. These documents can be found on our website: www.exar.com. We will post any amendments to the codes and policy, as well as any waivers that are required to be disclosed by the rules of either the SEC or the NASDAQ on our website, or by filing a Form 8-K. Hard copies can be obtained free of charge by submitting a written request to:
Exar Corporation
48720 Kato Road
Fremont, California 94538
Attn: Investor Relations, M/S 210
| ITEM 11. | EXECUTIVE COMPENSATION |
The information required by this item is set forth under the captions “Executive Compensation” and “Compensation Committee Report on Executive Compensation” in our 2011 Definitive Proxy Statement and is incorporated herein by reference.
| ITEM 12. | SECURITY OWNERSHIP OF CERTAIN BENEFICIAL OWNERS AND MANAGEMENT AND RELATED STOCKHOLDER MATTERS |
The information required by this Item is set forth under the captions “Security Ownership of Certain Beneficial Owners and Management” and “Equity Compensation Plan Information” in our 2011 Definitive Proxy Statement and is hereby incorporated by reference.
| ITEM 13. | CERTAIN RELATIONSHIPS AND RELATED TRANSACTIONS, AND DIRECTOR INDEPENDENCE |
The information required by this Item is set forth under the captions “Certain Relationships and Related Transactions” and “Corporate Governance and Board Matters” in our 2011 Definitive Proxy Statement and is hereby incorporated by reference.
| ITEM 14. | PRINCIPAL ACCOUNTING FEES AND SERVICES |
The information required by this Item is set forth under the caption “Ratification of Appointment of Independent Registered Public Accounting Firm” in our 2011 Definitive Proxy Statement and is hereby incorporated by reference.
107
Table of Contents
| ITEM 15. | EXHIBITS, FINANCIAL STATEMENT SCHEDULES |
(a) The following documents are filed as part of this Form 10-K:
(1) All Financial Statements. The financial statements of the Company are included herein as required in Part II, Item 8—“Financial Statements and Supplementary Data” of this Annual Report. See Index to Financial Statements on page 51.
(2) Financial Statement Schedules. See “Notes to Consolidated Financial Statements, Note 20—Allowance for Sales Returns and Doubtful Accounts.” Schedules not listed have been omitted because information required to be set forth therein is not applicable or is shown in the financial statements or notes thereto.
(3) Exhibits. See Part IV, Item 15(b) below.
(b) The exhibits listed in the Exhibit Index, which follows the signature page to this Annual Report, are filed or incorporated by reference into this Annual Report.
108
Table of Contents
Pursuant to the requirements of Section 13 or 15(d) of the Securities Exchange Act of 1934, the Registrant has duly caused this Report to be signed on its behalf by the undersigned, thereunto duly authorized.
| EXAR CORPORATION | ||
| By: | /s/ PEDRO (PETE) P. RODRIGUEZ | |
| Pedro (Pete) P. Rodriguez | ||
| Chief Executive Officer and President (Principal Executive Officer) | ||
Date: June 10, 2011
KNOW ALL PERSONS BY THESE PRESENTS, that each person whose signature appears below constitutes and appoints Pedro (Pete) P. Rodriguez and Kevin Bauer, and each of them, as his true and lawful attorneys-in-fact and agents, with full power of substitution and re-substitution, for him and in his name, place, and stead, in any and all capacities, to sign any and all amendments to this Report, and to file the same, with all exhibits thereto, and other documents in connection therewith, with the Securities and Exchange Commission, granting unto said attorneys-in-fact and agents, and each of them, full power and authority to do and perform each and every act and thing requisite and necessary to be done in connection therewith, as fully to all intents and purposes as he might or could do in person, hereby ratifying and confirming that all said attorneys-in-fact and agents, or any of them or their or his substitute or substituted, may lawfully do or cause to be done by virtue hereof.
Pursuant to the requirements of the Securities Exchange Act of 1934, this Report has been signed below by the following persons on behalf of the Registrant and in the capacities and on the dates indicated.
| Signature |
Title |
Date | ||
| /s/ PEDRO (PETE) P. RODRIGUEZ (Pedro (Pete) P. Rodriguez) |
Chief Executive Officer, President and Director (Principal Executive Officer) |
June 10, 2011 | ||
| /S/ KEVIN BAUER (Kevin Bauer) |
Vice President and Chief Financial Officer (Principal Financial and Accounting Officer) |
June 10, 2011 | ||
| /S/ DR. IZAK BENCUYA (Dr. Izak Bencuya) |
Director |
June 10, 2011 | ||
| /S/ PIERRE GUILBAULT (Pierre Guilbault) |
Director |
June 10, 2011 | ||
| /S/ BRIAN HILTON (Brian Hilton) |
Director |
June 10, 2011 | ||
| /s/ RICHARD L. LEZA (Richard L. Leza) |
Chairman of the Board |
June 10, 2011 | ||
| /S/ GARY MEYERS (Gary Meyers) |
Director |
June 10, 2011 | ||
|
(J. Oscar Rodriguez) |
Director |
|||
109
Table of Contents
EXHIBIT INDEX
| Exhibit Number |
Incorporated by Reference | |||||||||
| Exhibit |
Form |
File No. |
Exhibit |
Filing Date | ||||||
| 2.1 | Agreement and Plan of Merger by and among Exar Corporation, Sipex Corporation and Side Acquisition Corp., dated as of May 7, 2007 |
8-K | 0-14225 | 2.1 | 5/8/2007 | |||||
| 2.2 | Agreement and Plan of Merger, dated as of February 23, 2009, among Exar Corporation, Hybrid Acquisition Corp. and hi/fn, inc. |
8-K | 0-14225 | 2.1 | 2/27/2009 | |||||
| 3.1 | Restated Certificate of Incorporation of Exar Corporation |
8-K | 0-14225 | 3.3 | 9/17/2010 | |||||
| 3.2 | Bylaws of Exar Corporation |
8-K | 0-14225 | 3.1 | 9/17/2010 | |||||
| 10.1*+ | 1989 Employee Stock Participation Plan, as amended, and related Offering documents |
10-K | 0-14225 | 10.1 | 6/12/2006 | |||||
| 10.2*+ | 1996 Non-Employee Directors’ Stock Option Plan, as amended, and related forms of stock option grant and exercise |
10-K | 0-14225 | 10.6 | 6/12/2006 | |||||
| 10.3* | 1997 Equity Incentive Plan, as amended, and related forms of stock option grant and exercise |
10-K | 0-14225 | 10.7 | 6/14/2005 | |||||
| 10.4* | 2000 Equity Incentive Plan, as amended, and related forms of stock option grant and exercise |
10-K | 0-14225 | 10.9 | 6/14/2005 | |||||
| 10.5*++ | 2006 Equity Incentive Plan, as amended |
8-K | 0-14225 | 10.1 | 9/17/2010 | |||||
| 10.6* | Sipex Corporation 2006 Equity Incentive Plan |
S-8 | 333-145751 | 4.1 | 8/28/2007 | |||||
| 10.7* | Sipex Corporation Amended and Restated 2002 Nonstatutory Stock Option Plan |
S-8 | 333-145751 | 4.2 | 8/28/2007 | |||||
| 10.8* | Sipex Corporation 2000 Non-Qualified Stock Option Plan |
S-8 | 333-145751 | 4.3 | 8/28/2007 | |||||
| 10.9* | Sipex Corporation 1999 Stock Plan |
S-8 | 333-145751 | 4.4 | 8/28/2007 | |||||
| 10.10* | Sipex Corporation 1997 Stock Option Plan |
S-8 | 333-145751 | 4.5 | 8/28/2007 | |||||
| 10.11* | Fiscal Year 2010 Executive Incentive Program |
10-Q | 0-14225 | 10.4 | 8/7/2009 | |||||
| 10.12* | Fiscal Year 2011 Executive Incentive Program |
10-K | 0-14225 | 10.14 | 6/10/2010 | |||||
| 10.13* | Form of Indemnity Agreement between the Company and each of the company’s directors and certain of the executive officers |
10-Q | 0-14225 | 10.12 | 11/13/2002 | |||||
| 10.14* | Separation Agreement between Exar Corporation and J. Scott Kamsler, dated as of June 23, 2009 |
8-K | 0-14225 | 10.1 | 6/29/2009 | |||||
| 10.15* | Second Amended and Restated Employment Agreement between the Company and Pedro (Pete) P. Rodriguez |
8-K | 0-14225 | 10.1 | 3/25/2010 | |||||
| 10.16* | Letter Agreement between Exar Corporation and Bentley Long |
10-Q | 0-14225 | 10.3 | 8/7/2009 | |||||
| 10.17* | VP Worldwide Sales – FY10 Sales Incentive Plan |
10-Q | 0-14225 | 10.2 | 8/7/2009 | |||||
110
Table of Contents
| Exhibit Number |
Incorporated by Reference | |||||||||
| Exhibit |
Form |
File No. |
Exhibit |
Filing Date | ||||||
| 10.18* | Letter Agreement Regarding Change of Control for Thomas R. Melendrez |
10-K | 0-14225 | 10.11 | 6/27/2001 | |||||
| 10.19* | Executive Officers’ Group II Change of Control Severance Benefit Plan |
10-Q | 0-14225 | 10.1 | 2/6/2009 | |||||
| 10.20* | Letter Agreement Regarding Change of Control for Paul Pickering |
10-Q | 0-14225 | 10.1 | 8/5/2010 | |||||
| 10.21* | Letter Agreement Regarding Change of Control for George Apostol |
10-Q | 0-14225 | 10.2 | 8/5/2010 | |||||
| 10.22* | Letter Agreement Regarding Change of Control for Kevin Bauer |
8-K | 0-14225 | 10.2 | 9/17/2010 | |||||
| 10.23 | Amendment No. 3, entered October 29, 2007, to that certain Distributor Agreement, dated July 1, 1997, by and between Exar Corporation and Future Electronics Incorporated. |
10-Q | 0-14225 | 10.1 | 2/8/2008 | |||||
| 10.24 | Amendment No. 4, entered October 29, 2007, to that certain Domestic Distributor Agreement, dated December 1, 2001, by and between Exar Corporation and NuHorizons, Inc. |
10-Q | 0-14225 | 10.2 | 2/8/2008 | |||||
| 21.1** | Subsidiaries of the Company |
|||||||||
| 23.1** | Consent of Independent Registered Public Accounting Firm, PricewaterhouseCoopers LLP |
|||||||||
| 24.1** | Power of Attorney. Reference is made to the signature page in this Form 10-K. |
|||||||||
| 31.1** | Principal Executive Officer Certification pursuant to Section 302 of the Sarbanes-Oxley Act of 2002 |
|||||||||
| 31.2** | Principal Financial Officer Certification pursuant to Section 302 of the Sarbanes-Oxley Act of 2002 |
|||||||||
| 32.1*** | Certification of Chief Executive Officer Pursuant to 18 U.S.C. Section 1350, as Adopted Pursuant to Section 906 of the Sarbanes-Oxley Act of 2002 |
|||||||||
| 32.2*** | Certification of Chief Financial Officer Pursuant to 18 U.S.C. Section 1350, as Adopted Pursuant to Section 906 of the Sarbanes-Oxley Act of 2002 |
|||||||||
| * | Indicates management contracts or compensatory plans or arrangements filed pursuant to Item 601(b)(10) of Regulation S-K. |
| ** | Filed herewith. |
| *** | Furnished herewith. |
| + | Related forms of Stock Option Grant and Exercise filed as part of an exhibit to Exar’s Annual Report on Form 10-K for fiscal year ended March 31, 2005, and incorporated herein by reference. |
| ++ | Related forms of Notice of Grant and Terms and Conditions of Stock Options filed as Exhibits 10.2, 10.3 and 10.6 to Exar’s Report on Form 8-K filed with the SEC on September 13, 2006. Related form of Stock Unit Award Agreement filed as Exhibit 10.2 to Exar’s Quarterly Report on Form 10-Q filed with the SEC on February 6, 2009. Related form of Performance Stock Unit Award Agreement filed as Exhibit 10.1 to Exar’s Quarterly Report on Form 10-Q filed with the SEC on November 5, 2009. Related form of Director Restricted Stock Unit Award Agreement filed as Exhibit 10.7 to Exar’s Quarterly Report on Form 10-Q filed with the SEC on November 4, 2010. All such forms are incorporated herein by reference. |
111