Attached files
| file | filename |
|---|---|
| 8-K - 8-K - DITECH HOLDING Corp | d312105d8k.htm |
| EX-99.1 - EX-99.1 - DITECH HOLDING Corp | d312105dex991.htm |
Exhibit 99.2
| Fourth Quarter 2011 Earnings Presentation March 7, 2012 |
| 1 Important Disclosures Safe Harbor Statement Certain statements in this report, including matters discussed under Item 7, "Management's Discussion and Analysis of Financial Condition and Results of Operations," should be read in conjunction with the financial statements, related notes, and other detailed information included elsewhere in this Annual Report on Form 10-K. We are including this cautionary statement to make applicable and take advantage of the safe harbor provisions of the Private Securities Litigation Reform Act of 1995. Statements that are not historical fact are forward-looking statements. Certain of these forward-looking statements can be identified by the use of words such as "believes," "anticipates," "expects," "intends," "plans," "projects," "estimates," "assumes," "may," "should," "will," or other similar expressions. Such forward-looking statements involve known and unknown risks, uncertainties and other important factors, which could cause actual results, performance or achievements to differ materially from future results, performance or achievements. These forward-looking statements are based on our current beliefs, intentions and expectations. These statements are not guarantees or indicative of future performance. Important assumptions and other important factors that could cause actual results to differ materially from those forward-looking statements include, but are not limited to, those factors, risks and uncertainties described in our Current Report on Form 10-Q filed with the Securities and Exchange Commission on August 8, 2011 under the caption "Risk Factors," and in our other securities filings with the Securities and Exchange Commission. In particular (but not by way of limitation), the following important factors and assumptions could affect our future results and could cause actual results to differ materially from those expressed in the forward-looking statements: local, regional, national and global economic trends and developments in general, and local, regional and national real estate and residential mortgage market trends in particular; conditions or otherwise; fluctuations in interest rates and levels of mortgage prepayments; our ability to successfully integrate the Green Tree business into our historical business and to achieve expected synergies; risks related to the financing incurred in connection with the acquisition of Green Tree, including our ability to achieve cash flows sufficient to carry our debt and otherwise to meet the covenants of our debt; the occurrence of anticipated growth of the specialty servicing sector; the effects of competition on our existing and potential future business, including the impact of competitors with greater financial resources and broader scopes of operation; our ability to raise capital to make suitable investments to offset run-off in the portfolios we service and to grow our business; changes in federal, state and local policies, laws and regulations affecting our business, including mortgage financing or servicing, and changes to our licensing requirements; changes caused by the Dodd-Frank Wall Street Reform and Consumer Protection Act; uncertainties related to regulatory pressures on large banks related to their mortgage servicing, as well as regulatory pressure on the rest of the mortgage servicing sector, including increased performance standards and reporting obligations; changes in regards to the rights and obligations of property owners, mortgagors and tenants; our ability to remain qualified as a government-sponsored entity approved servicer or component servicer, including the ability to continue to comply with the government-sponsored entities' respective servicing guides; uncertainty relating to the status of government-sponsored entities; uncertainty related to inquiries from government agencies into past servicing, foreclosure, loss mitigation, and lender-placed insurance practices; uncertainties related to the processes for judicial and non-judicial foreclosure proceedings, including potential additional costs, delays or moratoria in the future or claims pertaining to past practices; unexpected losses resulting from pending, threatened or unforeseen litigation or other third-party claims against the Company; the effects of any changes to the servicing compensation structure for mortgage servicers pursuant to programs of government-sponsored entities or various regulatory authorities; changes to our insurance agency business, including increased scrutiny by government regulators on lender-placed insurance practices; the effect of Company risk management strategies, including the management and protection of the personal and private information of our customers and mortgage holders and the protection of our information systems from third-party interference (cyber security); changes in accounting standards; our continued listing on the NYSE Amex; the ability or willingness of Walter Energy, Inc. and other counterparties to satisfy material obligations under agreements with us; and other presently unidentified factors. All forward looking statements set forth herein are qualified by these cautionary statements and are made only as of the date hereof. We undertake no obligation to update or revise the information contained herein, including any forward-looking statements whether as a result of new information, subsequent events or circumstances, or otherwise, unless otherwise required by law. Basis of Presentation Unless noted otherwise in this presentation, all reported financial data is being presented as of the period ended December 31, 2011. |
| 2 Use of Non-GAAP Measures Generally Accepted Accounting Principles ("GAAP") is the term used to refer to the standard framework of guidelines for financial accounting. GAAP includes the standards, conventions, and rules accountants follow in recording and summarizing transactions and in the preparation of financial statements. In addition to reporting financial results in accordance with GAAP, the Company has provided non-GAAP financial measures, which it believes are useful to help investors better understand its financial performance, competitive position and prospects for the future. Core earnings (pre-tax and after-tax) ,core earnings per share and Pro Forma Adjusted EBITDA are financial measures that are not in accordance with GAAP. See the Non-GAAP Reconciliations above for a reconciliation of these measures to the most directly comparable GAAP financial measures. Core earnings (pre-tax and after-tax) and core earnings per share measure the Company's financial performance excluding depreciation and amortization costs related to business combination transactions, transaction and merger integration-related costs, certain other non-cash adjustments, and the net impact of the consolidated Non-Residual Trust VIEs. Pro Forma adjusted EBITDA measures the Company's financial performance excluding depreciation and amortization costs, corporate and MSR facility interest expense, transaction and merger integration-related costs, certain other non-cash adjustments, the net impact of the consolidated Non-Residual Trust VIEs and certain other items as defined by our first and second lien credit agreements, including, but not limited to pro-forma synergies. Core earnings (pre-tax and after-tax) and core earnings per share may also include other adjustments, as applicable based upon facts and circumstances, consistent with the intent of providing investors a means of evaluating our core operating performance. The Company believes that these Non-GAAP Financial Measures can be useful to investors because they provide a means by which investors can evaluate the Company's underlying key drivers and operating performance of the business, exclusive of certain adjustments and activities that investors may consider to be unrelated to the underlying economic performance of the business for a given period. Use of Core Earnings and Pro Forma Adjusted EBITDA by Management The Company manages the business based upon the achievement of core earnings, Pro Forma Adjusted EBITDA and similar targets and has designed certain management incentives based upon the achievement of Pro Forma Adjusted EBITDA in order to assess the underlying operational performance of the continuing operations of the business for the year and to have a basis to compare underlying operating results to prior and future periods. Limitations on the Use of Core Earnings and Pro Forma Adjusted EBITDA Since core earnings (pre-tax and after-tax) and core earnings per share measure the Company's financial performance excluding depreciation and amortization costs related to acquisitions, transaction and merger integration-related costs, certain other non-cash adjustments, and the net impact of the consolidated Non-Residual Trust VIEs, they may not reflect all amounts associated with our results as determined in accordance with GAAP. Pro Forma Adjusted EBITDA measures the Company's financial performance excluding depreciation and amortization costs, corporate and MSR facility interest expense, transaction and merger integration-related costs, certain other non-cash adjustments, the net impact of the consolidated Non-Residual Trust VIEs and certain other items as defined by our first and second lien credit agreements, including, but not limited to pro-forma synergies, they may not reflect all amounts associated with our results as determined in accordance with GAAP Core earnings (pre-tax and after-tax), core earnings per share and Pro Forma Adjusted EBITDA involve differences from segment profit (loss), income (loss) before income taxes, net income (loss), basic earnings (loss) per share and diluted earnings (loss) per share computed in accordance with GAAP. Core earnings (pre-tax and after-tax) ,core earnings per share and Pro Forma Adjusted EBITDA should be considered as supplementary to, and not as a substitute for, segment profit (loss), income (loss) before income taxes, net income (loss), basic earnings (loss) per share and diluted earnings (loss) per share computed in accordance with GAAP as a measure of the Company's financial performance. Any non-GAAP measures should be considered in context with the GAAP financial presentation and should not be considered in isolation or as a substitute for GAAP earnings. Further, the non-GAAP measures presented by Walter Investment may be defined or calculated differently from similarly titled measures of other companies. . . |
| 3 Walter Investment 2011 Highlights Transformational acquisition of Green Tree Highly favorable market conditions Capitalized on growth opportunities Added over 430,000 accounts with a UPB of over $57 billion on a subserviced, capital-light basis in 2011 Concluded the year with 1,042,000 accounts with a UPB of more than $86 billion Solid core earnings and Pro Forma Adjusted EBITDA in 2011 New business expected to contribute solidly to 2012 results Layering of successive years of anticipated new business will drive strong earnings growth in 2013 and beyond Strong, robust pipeline for 2012 |
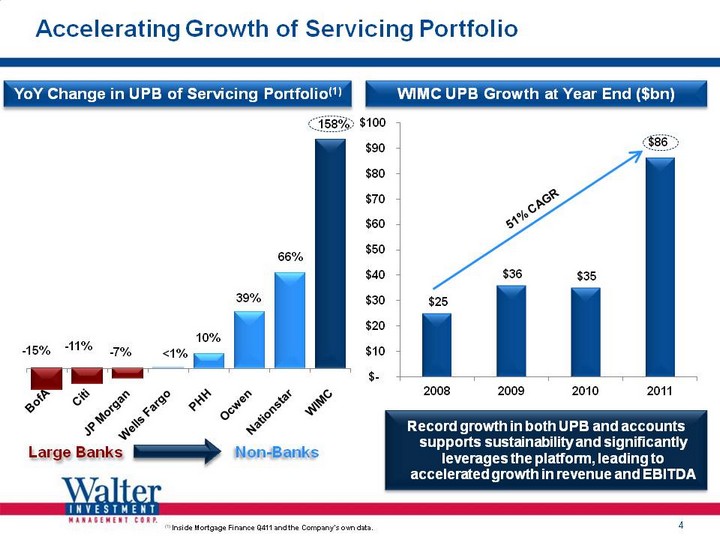
| Accelerating Growth of Servicing Portfolio 4 (CHART) (CHART) WIMC UPB Growth at Year End ($bn) YoY Change in UPB of Servicing Portfolio(1) Non-Banks Large Banks (1) Inside Mortgage Finance Q411 and the Company's own data. Record growth in both UPB and accounts supports sustainability and significantly leverages the platform, leading to accelerated growth in revenue and EBITDA |
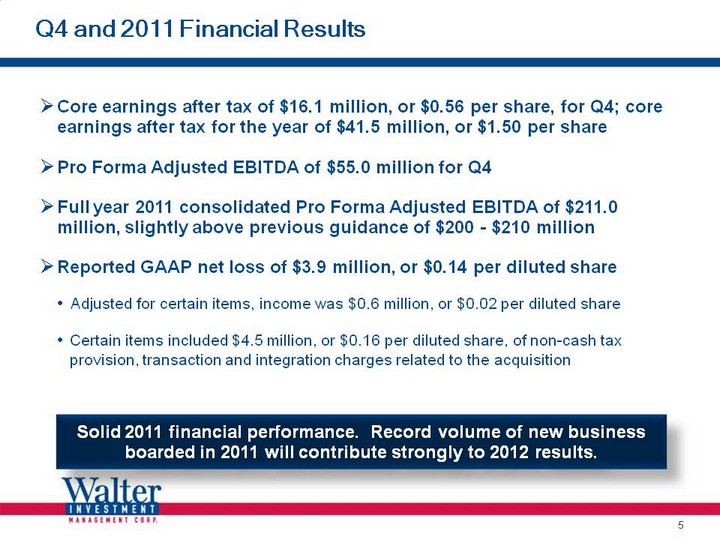
| 5 Q4 and 2011 Financial Results Core earnings after tax of $16.1 million, or $0.56 per share, for Q4; core earnings after tax for the year of $41.5 million, or $1.50 per share Pro Forma Adjusted EBITDA of $55.0 million for Q4 Full year 2011 consolidated Pro Forma Adjusted EBITDA of $211.0 million, slightly above previous guidance of $200 - $210 million Reported GAAP net loss of $3.9 million, or $0.14 per diluted share Adjusted for certain items, income was $0.6 million, or $0.02 per diluted share Certain items included $4.5 million, or $0.16 per diluted share, of non-cash tax provision, transaction and integration charges related to the acquisition Solid 2011 financial performance. Record volume of new business boarded in 2011 will contribute strongly to 2012 results. |
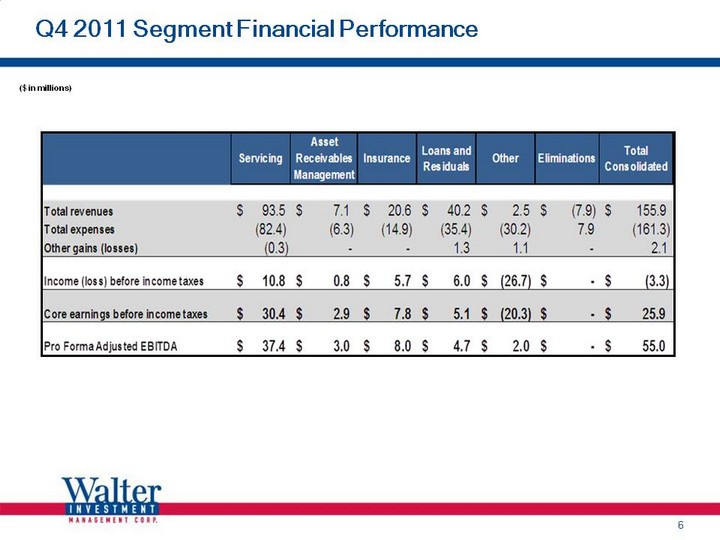
| 6 Q4 2011 Segment Financial Performance ($ in millions) |
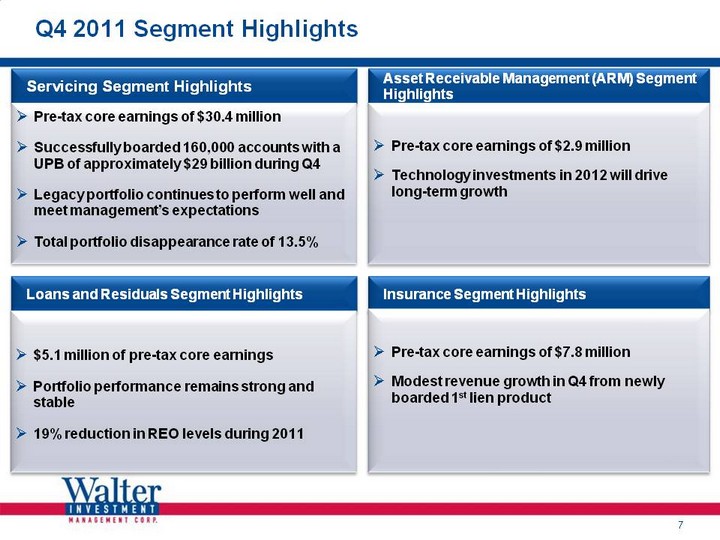
| Q4 2011 Segment Highlights 7 Loans and Residuals Segment Highlights $5.1 million of pre-tax core earnings Portfolio performance remains strong and stable 19% reduction in REO levels during 2011 Servicing Segment Highlights Pre-tax core earnings of $30.4 million Successfully boarded 160,000 accounts with a UPB of approximately $29 billion during Q4 Legacy portfolio continues to perform well and meet management's expectations Total portfolio disappearance rate of 13.5% Asset Receivable Management (ARM) Segment Highlights Pre-tax core earnings of $2.9 million Technology investments in 2012 will drive long-term growth Insurance Segment Highlights Pre-tax core earnings of $7.8 million Modest revenue growth in Q4 from newly boarded 1st lien product |
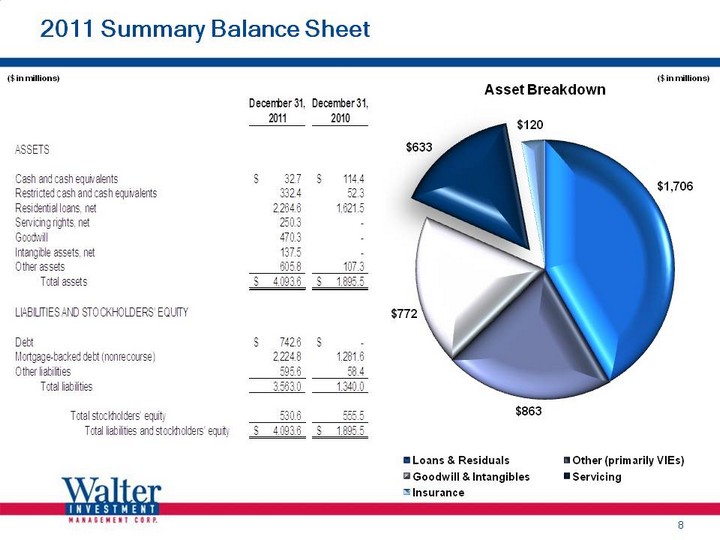
| 8 2011 Summary Balance Sheet ($ in millions) (CHART) ($ in millions) |
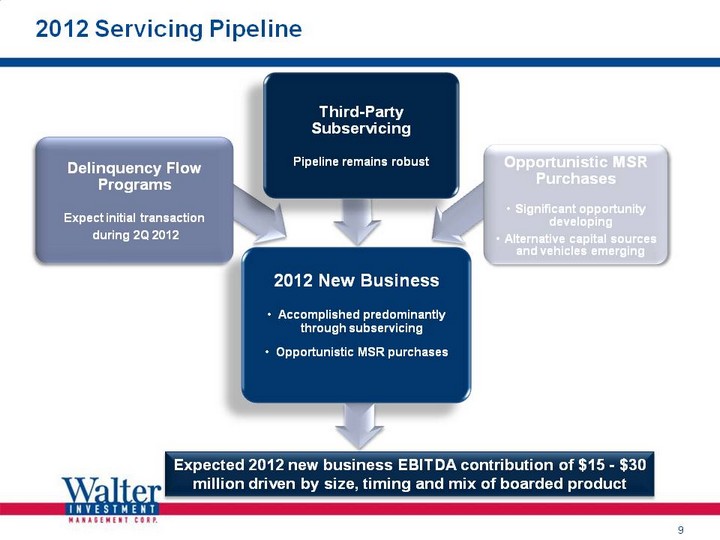
| 2012 Servicing Pipeline 2012 Servicing Pipeline 9 2012 New Business Accomplished predominantly through subservicing Opportunistic MSR purchases Expected 2012 new business EBITDA contribution of $15 - $30 million driven by size, timing and mix of boarded product |
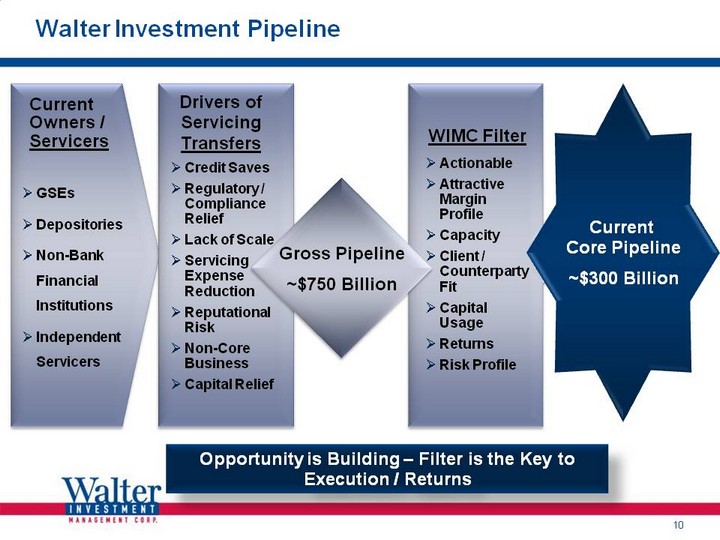
| 10 Walter Investment Pipeline GSEs Depositories Non-Bank Financial Institutions Independent Servicers Current Owners / Servicers Credit Saves Regulatory / Compliance Relief Lack of Scale Servicing Expense Reduction Reputational Risk Non-Core Business Capital Relief Drivers of Servicing Transfers WIMC Filter Actionable Attractive Margin Profile Capacity Client / Counterparty Fit Capital Usage Returns Risk Profile Gross Pipeline ~$750 Billion Current Core Pipeline ~$300 Billion Opportunity is Building - Filter is the Key to Execution / Returns |
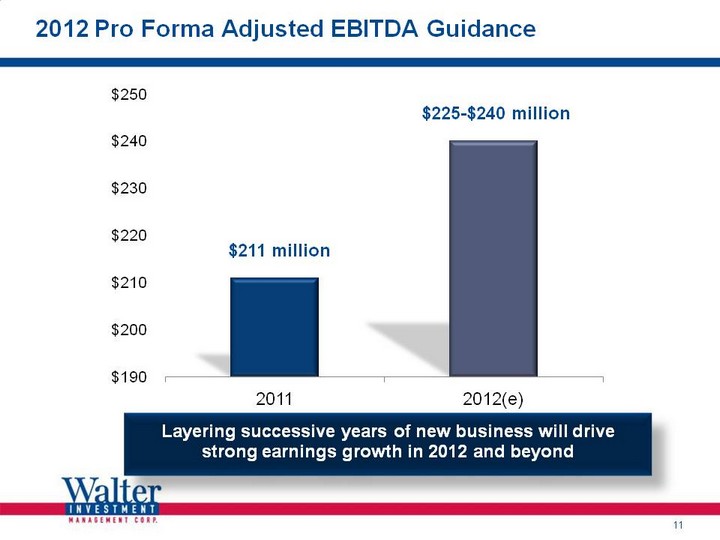
| 2012 Pro Forma Adjusted EBITDA Guidance 11 $211 million $225-$240 million (CHART) Layering successive years of new business will drive strong earnings growth in 2012 and beyond |
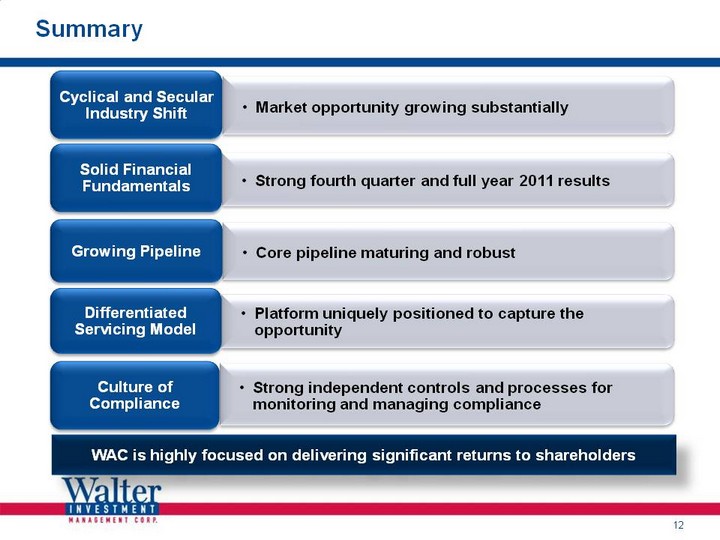
| Summary 12 WAC is highly focused on delivering significant returns to shareholders |
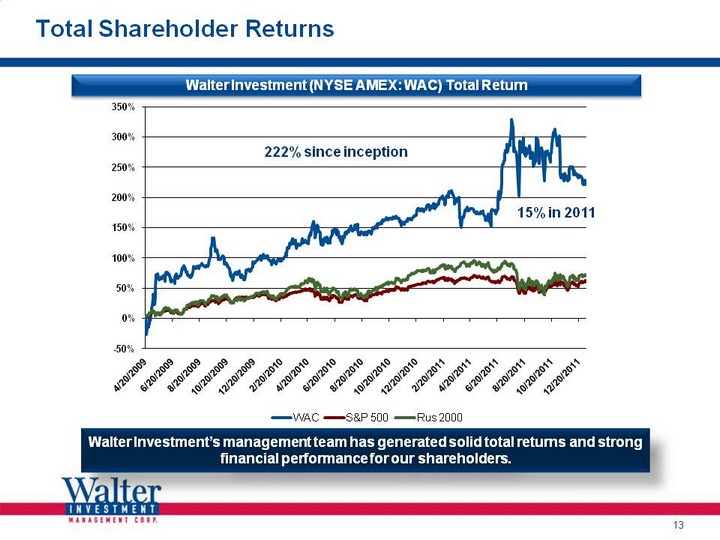
| 13 Total Shareholder Returns Walter Investment's management team has generated solid total returns and strong financial performance for our shareholders. (CHART) Walter Investment (NYSE AMEX: WAC) Total Return 222% since inception 15% in 2011 |
| 14 Appendix |

| 15 Core Earnings |

| Pro Forma Adjusted EBITDA 16 Pro Forma Adjusted EBITDA is presented in accordance with its definition in the Company's credit agreements and represents income before income taxes, depreciation and amortization, interest expense on corporate debt, transaction and integration related costs, the net effect of the non-residual VIEs and certain other non-cash income and expense items. Pro Forma Adjusted EBITDA also includes an adjustment to reflect pro-forma synergies and, for periods prior to the acquisition, adjustments to reflect Green Tree as having been acquired at the beginning of the year. Includes adjustment to reflect Green Tree results on a pro forma basis for the full year. |