Attached files
| file | filename |
|---|---|
| 8-K - FORM 8-K - FMC CORP | form8-k03072012.htm |
| EX-99.3 - PRESENTATION 2 - FMC CORP | exhibit99303072012.htm |
| EX-99.1 - PRESS RELEASE - FMC CORP | exhibit99103072012.htm |
Exhibit 99.2
FMC Corporation
Pierre Brondeau
President, CEO and Chairman
Disclaimer
Safe Harbor Statement
These slides and the accompanying presentation contain “forward-looking statements” that represent management's best judgment as of the date hereof based on information currently available. Actual results of the Company may differ materially from those contained in the forward-looking statements.
Additional information concerning factors that may cause results to differ materially from those in the forward-looking statements is contained in the Company's periodic reports filed under the Securities Exchange Act of 1934, as amended.
The Company undertakes no obligation to update or revise these forward-looking statements to reflect new events or uncertainties.
Non-GAAP Financial Terms
These slides contain certain “non-GAAP financial terms” which are defined on our website at www.fmc.com. In addition, we have also provided on our website at www.fmc.com reconciliations of non-GAAP terms to the closest GAAP term.
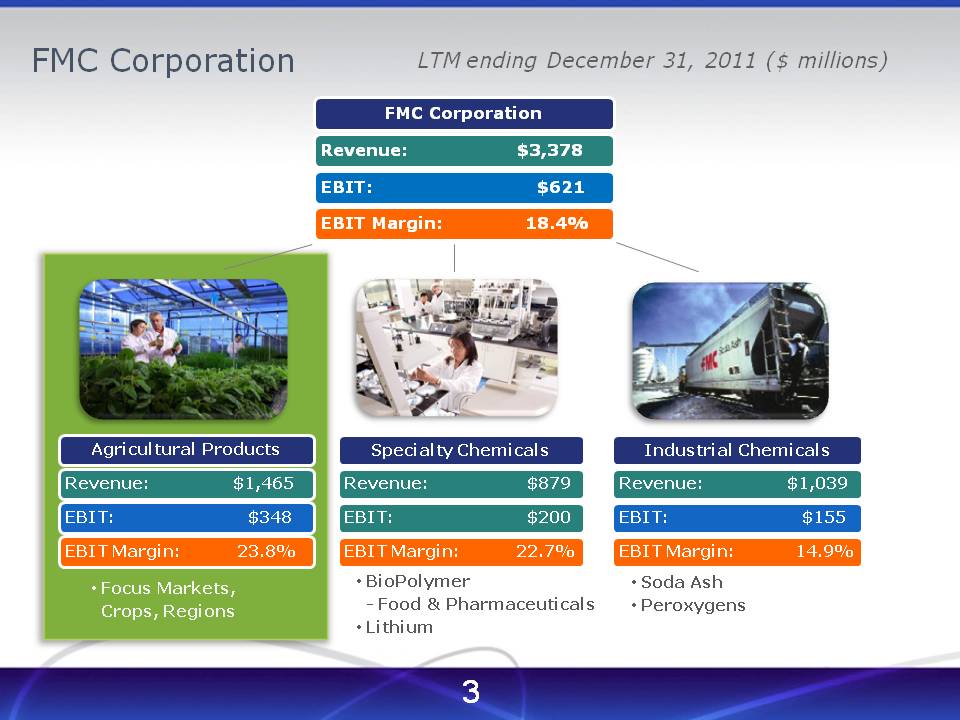
FMC Corporation LTM ending December 31, 2011 ($ millions)
FMC Corporation
Revenue: $3,378, EBIT: $621, EBIT Margin: 18.4%
Agricultural Products
Revenue: $1,465, EBIT: $348, EBIT Margin: 23.8%
• | Focus markets, crops, regions |
Specialty Chemicals
Revenue: $879, EBIT: $200, EBIT Margin: 22.7%
• | BioPolymer |
◦ | Food & Pharmaceuticals |
• | Lithium |
Industrial Chemicals
Revenue: $1,039, EBIT: $155, EBIT Margin: 14.9%
• | Soda Ash |
• | Peroxygens |
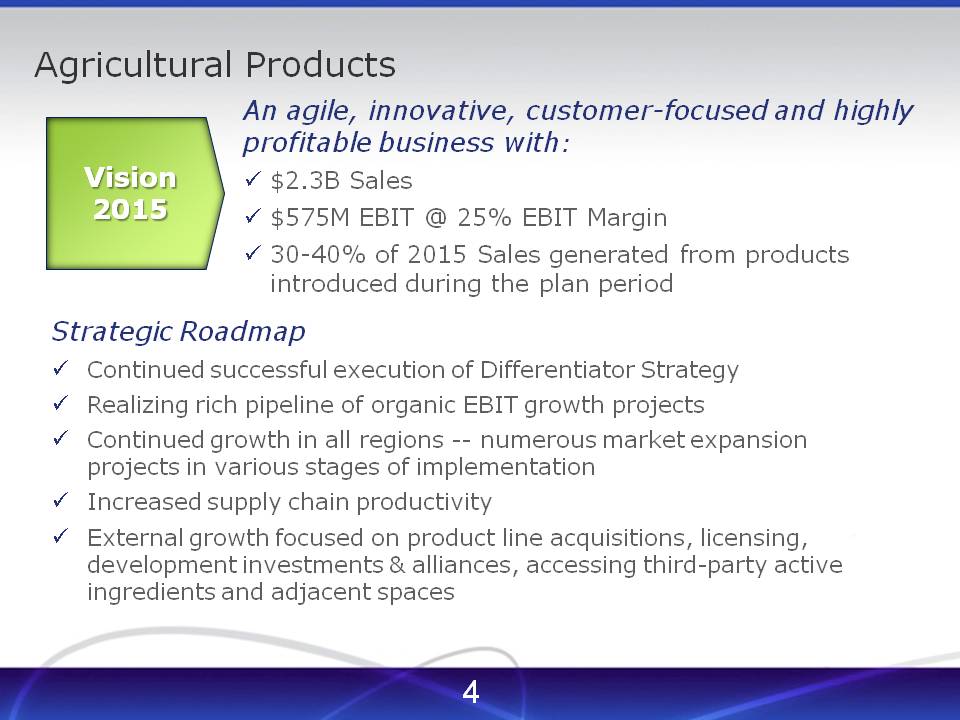
Agricultural Products
Vision 2015: An agile, innovative, customer-focused and highly profitable business with:
• | $2.3B Sales |
• | $575M EBIT @ 25% EBIT Margin |
• | 30-40% of 2015 Sales generated from products introduced during the plan period |
Strategic Roadmap
• | Continued successful execution of Differentiator Strategy |
• | Realizing rich pipeline of organic EBIT growth projects |
• | Continued growth in all regions -- numerous market expansion projects in various stages of implementation |
• | Increased supply chain productivity |
• | External growth focused on product line acquisitions, licensing, development investments & alliances, accessing third-party active ingredients and adjacent spaces |
Key Elements of Differentiator Strategy
• | Innovation through aggregating technologies |
• | Market Innovation |
• | Product Innovation |
• | Virtual manufacturing - globally competitive cost structure |
• | Disciplined focus on crops and applications were we have sustainable competitive advantage |
• | High customer intimacy |
• | Flat, agile and empowered organization |
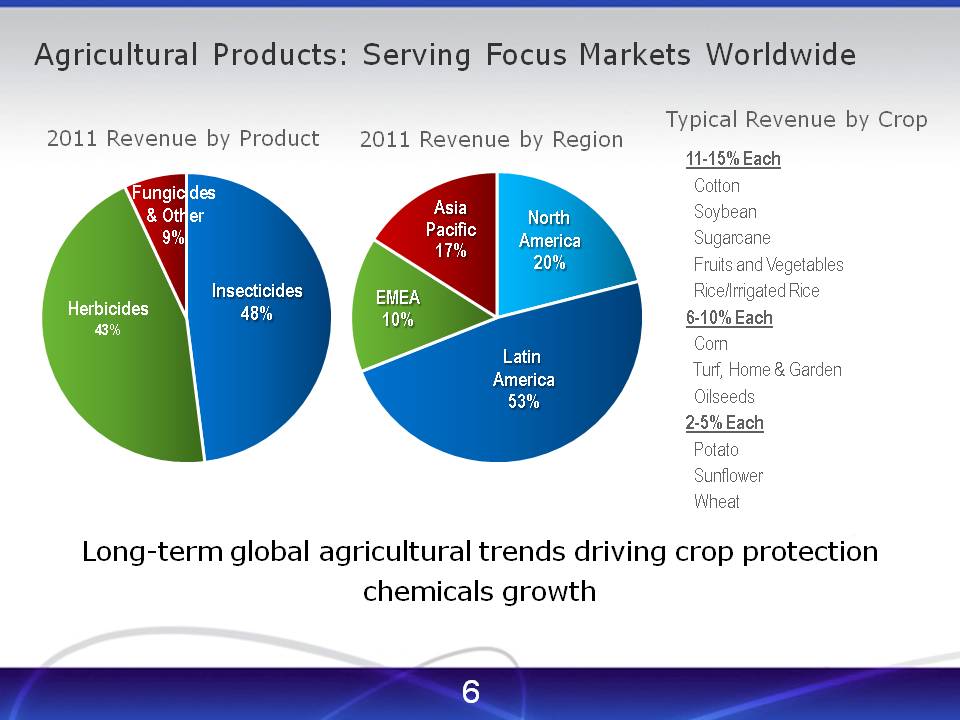
Agricultural Products: Serving Focus Markets Worldwide
Typical Revenue by Crop:
11-15% Each: Cotton, Soybean, Sugarcane, Fruits and Vegetables, Rice/Irrigated Rice
6-10% Each: Corn, Turf, Home & Garden, and Oilseeds
2-5% Each: Potato, Sunflower, and Wheat
Long-term global agricultural trends driving crop protection chemicals growth
2011 Revenue by Product
• | Fungicides & Other: 9%, Herbicides: 43%, Insecticides: 48% |
2011 Revenue By Region
• | Asia Pacific: 17%, EMEA 10%, North America: 20%, Latin America 53% |
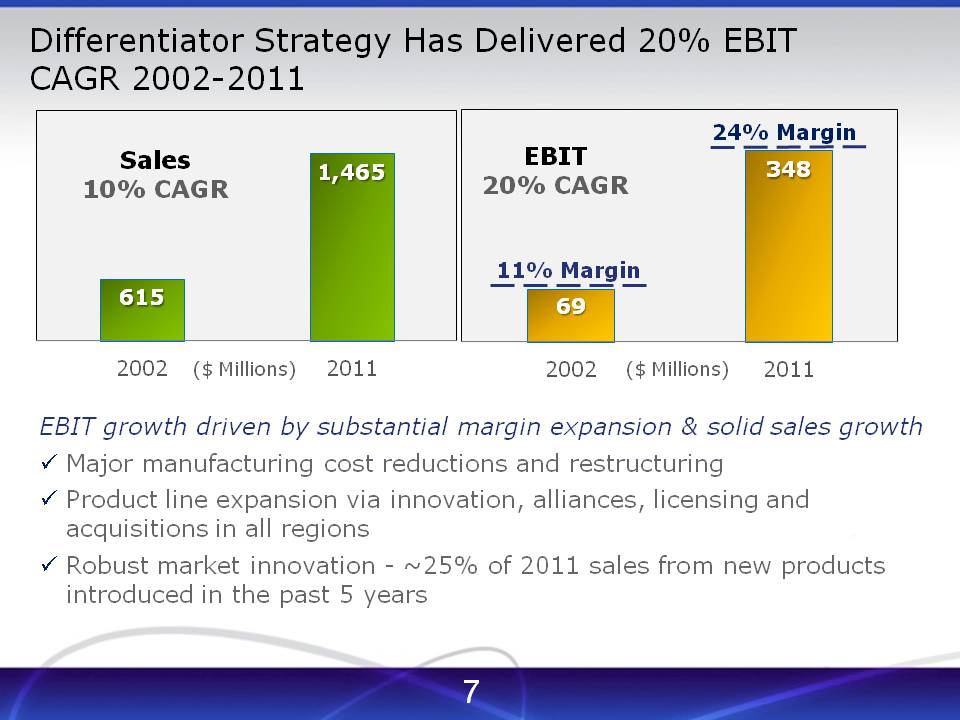
Differentiator Strategy Has Delivered 20% EBIT CAGR 2002-2011
Sales 10% CAGR= 615 (2002), 1,465 (2011), ($ Millions)
EBIT 20% CAGR= 11% Margin 69 (2002), 24% Margin 348 (2011)
EBIT growth driven by substantial margin expansion & solid sales growth
• | Major manufacturing cost reductions and restructuring |
• | Product line expansion via innovation, alliances, licensing and acquisitions in all regions |
• | Robust market innovation - ~25% of 2011 sales from new products introduced in the past 5 years |
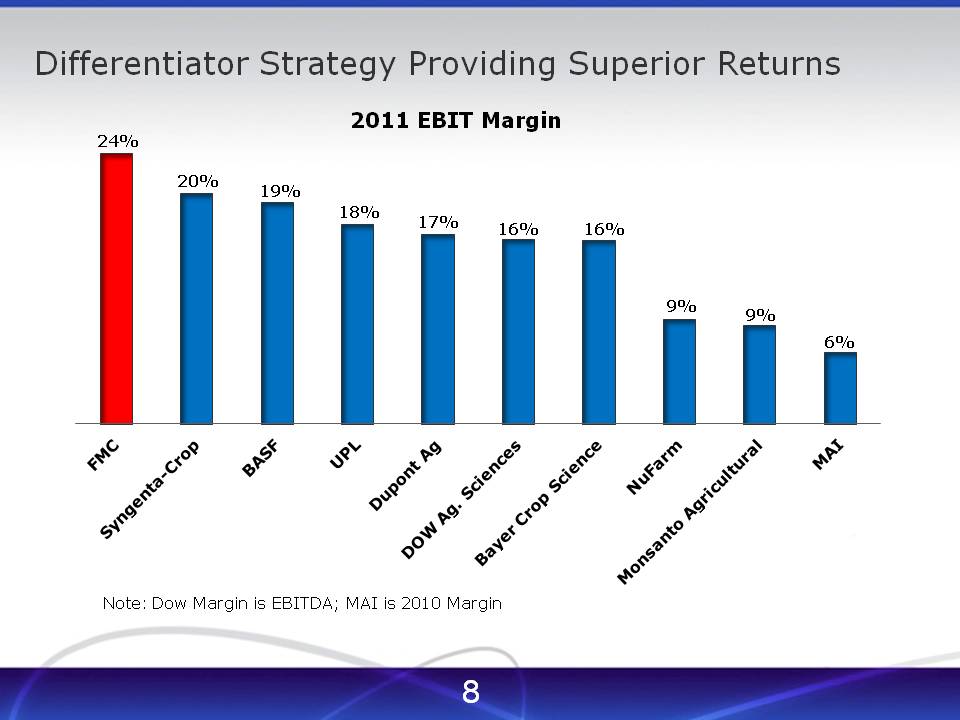
Differentiator Strategy Providing Superior Returns
2011 EBIT Margin:
FMC 24%, Syngenta-Crop 20%, BASF 19%, UPL 18%, Dupont Ag 17%, Dow Ag. Sciences 16%, Bayer Crop Science 16%, NuFarm 9%, Monsanto Agricultural 9%, MAI 6%
Note: Dow Margin is EBITDA; MAI is 2010 Margin
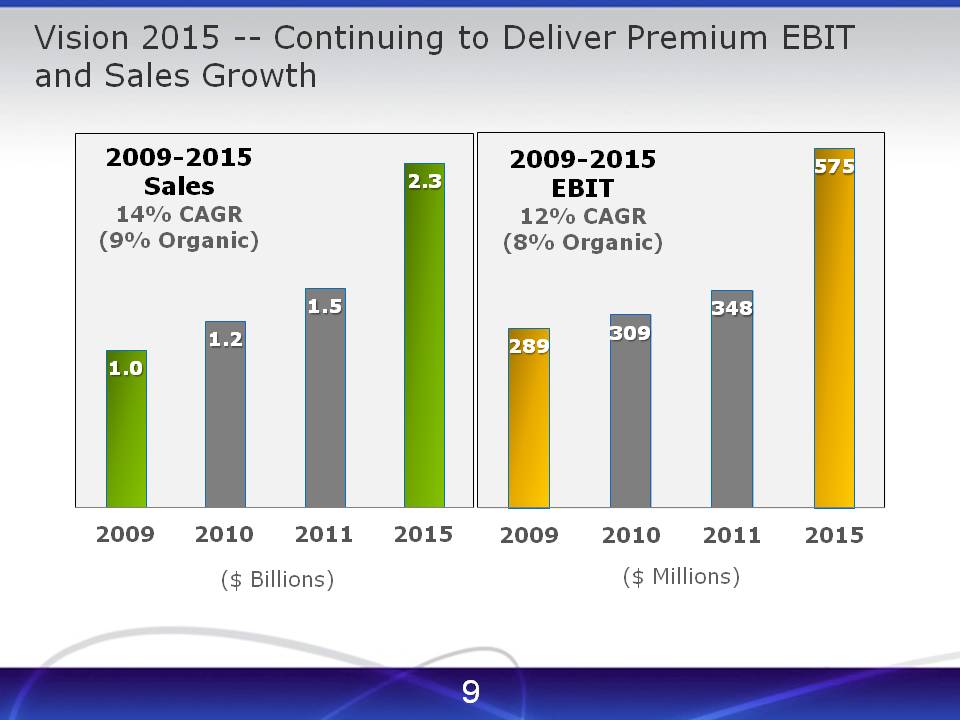
Vision 2015 -- Continuing to Deliver Premium EBIT and Sales Growth
2009-2015 Sales 14% CAGR (9% Organic)
2009: 1.0, 2010: 1.2, 2011: 1.5, 2015: 2.3
($ Billions)
2009-2015 EBIT 12% CAGR (8% Organic)
2009: 289, 2010: 309, 2011: 348, 2015: 575
($ Millions)
Strategic Imperatives
• | Successful execution of Differentiator Strategy |
• | Realizing rich pipeline of Organic EBIT Growth projects |
• | Continued growth in all regions -- numerous market expansion projects in various stages of implementation |
• | Increased supply chain productivity |
• | External Growth focused on product line acquisitions, licensing, development investments/alliances, accessing third-party active ingredients and adjacent spaces |
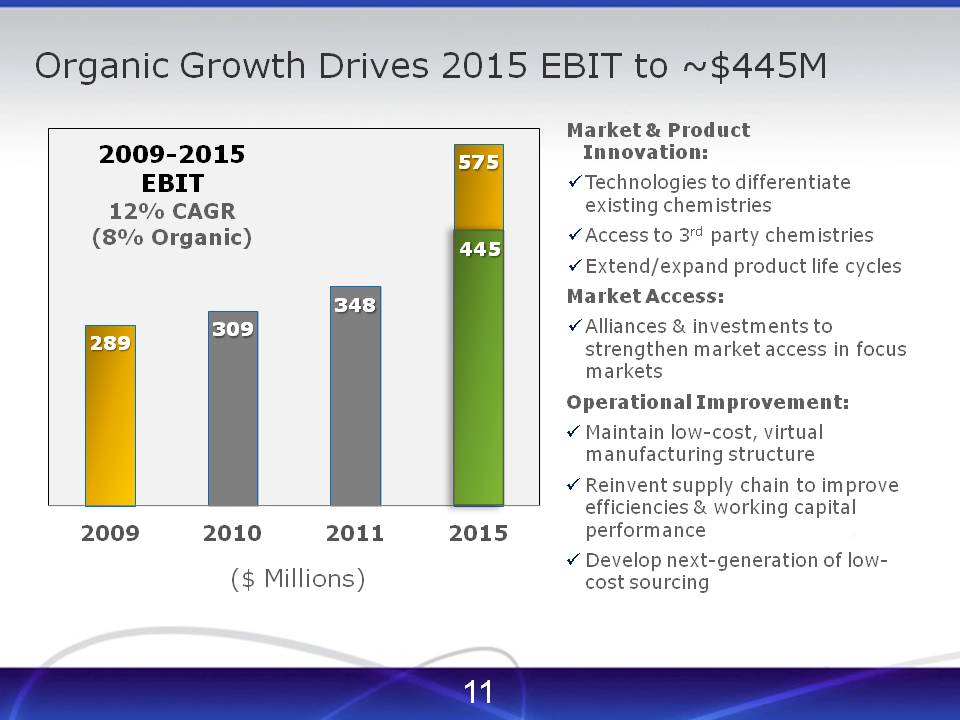
Organic Growth Drives 2015 EBIT to ~$445M
Market & Product Innovation:
• | Technologies to differentiate existing chemistries |
• | Access to 3rd party chemistries |
• | Extend/expand product life cycles |
Market Access:
• | Alliances & investments to strengthen market access in focus markets |
Operational Improvement:
• | Maintain low-cost, virtual manufacturing structure |
• | Reinvent supply chain to improve efficiencies & working capital performance |
• | Develop next-generation of low-cost sourcing |
2009-2015 EBIT 12% CAGR (8% Organic)
2009: $289, 2010: $309, 2011: $348, 2015: $445; $575
($ Millions)
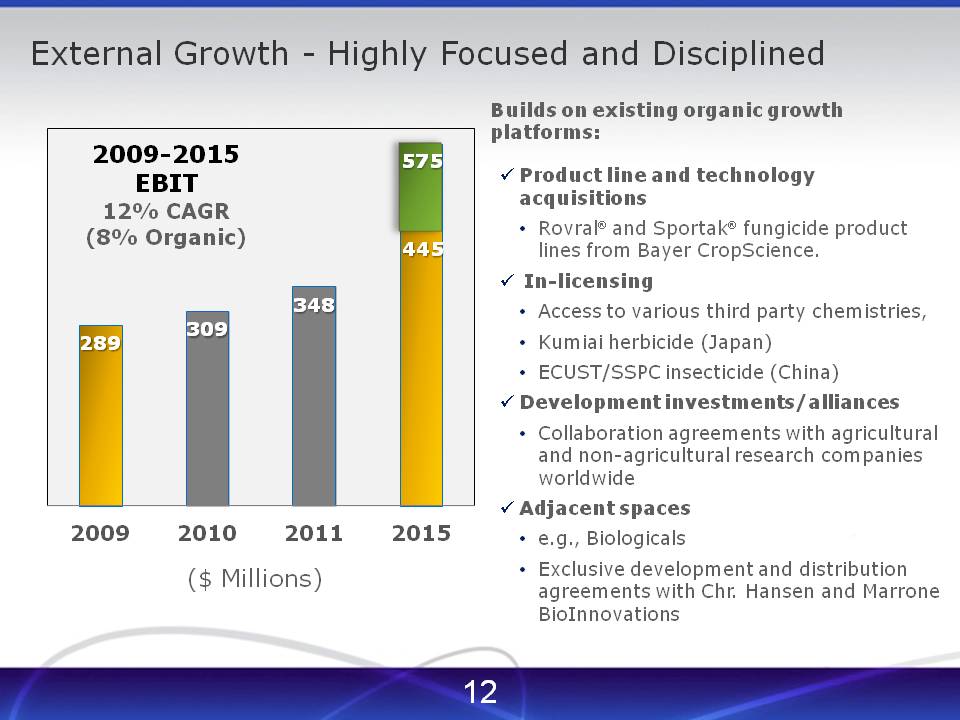
External Growth - Highly Focused and Disciplined
Builds on existing organic growth platforms:
• | Product line and technology |
• | acquisitions |
• | Rovral and Sportak fungicide product lines from Bayer CropScience. |
• | In-licensing |
• | Access to various third party chemistries, |
• | Kumiai herbicide (Japan) |
• | ECUST/SSPC insecticide (China) |
• | Development investments/alliances |
• | Collaboration agreements with agricultural and non-agricultural research companies worldwide |
• | Adjacent spaces |
• | e.g., Biologicals |
• | Exclusive development and distribution agreements with Chr. Hansen and Marrone BioInnovations |
2009: $289, 2010: $309, 2011: $348, 2015: $445; $575
($ Millions)
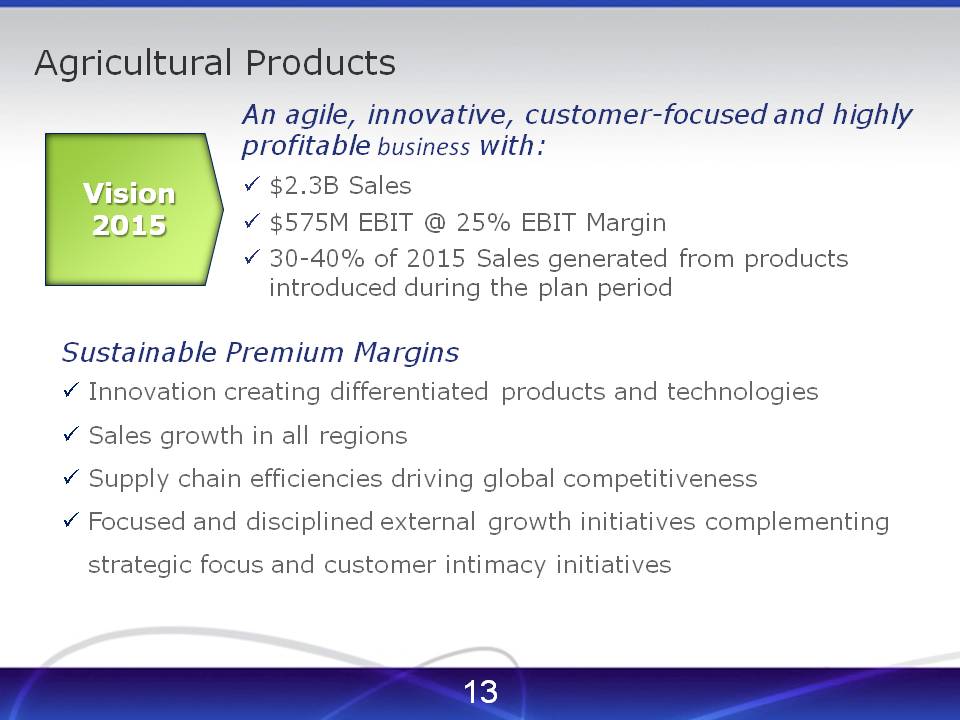
Agricultural Products
Vision 2015:
An agile, innovative, customer-focused and highly profitable business with:
• | $2.3B Sales |
• | $575M EBIT @ 25% EBIT Margin |
• | 30-40% of 2015 Sales generated from products introduced during the plan period |
Sustainable Premium Margins
• | Innovation creating differentiated products and technologies |
• | Sales growth in all regions |
• | Supply chain efficiencies driving global competitiveness |
• | Focused and disciplined external growth initiatives complementing strategic focus and customer intimacy initiatives |

FMC
Vision 2015
The right chemistry