Attached files
| file | filename |
|---|---|
| 8-K - FORM 8-K - FMC CORP | form8-k03072012.htm |
| EX-99.2 - PRESENTATION 1 - FMC CORP | exhibit99203072012.htm |
| EX-99.1 - PRESS RELEASE - FMC CORP | exhibit99103072012.htm |
Exhibit 99.3
FMC Corporation
Longbow Research Basic Materials Conference
W. Kim Foster
Executive Vice President and CFO
Mark Douglas
President, Industrial Chemicals
Disclaimer
Safe Harbor Statement
These slides and the accompanying presentation contain “forward-looking statements” that represent management's best judgment as of the date hereof based on information currently available. Actual results of the Company may differ materially from those contained in the forward-looking statements.
Additional information concerning factors that may cause results to differ materially from those in the forward-looking statements is contained in the Company's periodic reports filed under the Securities Exchange Act of 1934, as amended.
The Company undertakes no obligation to update or revise these forward-looking statements to reflect new events or uncertainties.
Non-GAAP Financial Terms
These slides contain certain “non-GAAP financial terms” which are defined on our website at www.fmc.com. In addition, we have also provided on our website at www.fmc.com reconciliations of non-GAAP terms to the closest GAAP term.
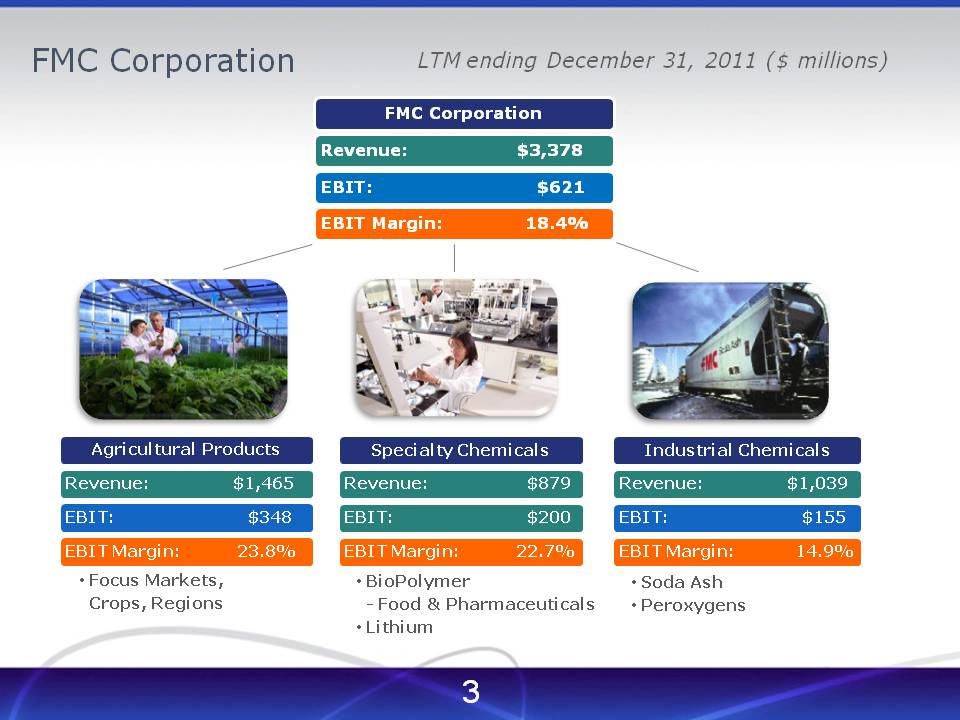
LTM ending December 31, 2011 ($ millions) FMC Corporation
Revenue: $3,378, EBIT: $621, EBIT Margin: 18.4%
Agricultural Products
Revenue: $1,465, EBIT: $348, EBIT Margin: 23.8%
• | Focus markets, crops, regions |
Specialty Chemicals
Revenue: $879, EBIT: $200, EBIT Margin: 22.7%
• | BioPolymer |
◦ | Food & Pharmaceuticals |
• | Lithium |
Industrial Chemicals
Revenue: $1,039, EBIT: $155, EBIT Margin: 14.9%
• | Soda Ash |
• | Peroxygens |
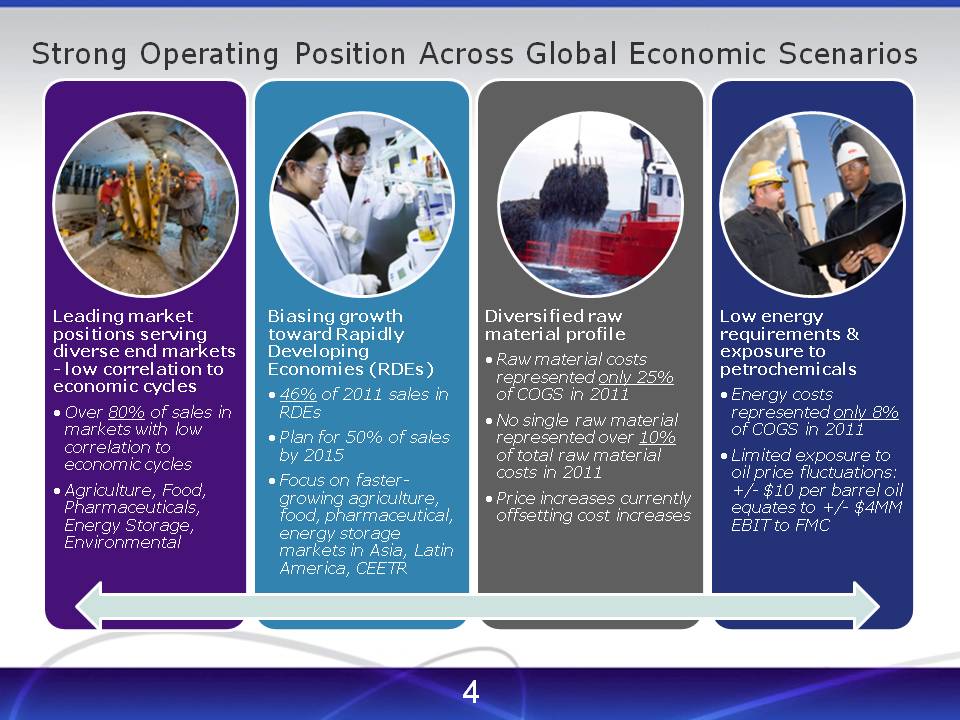
Strong Operating Position Across Global Economic Scenarios
Leading market positions serving diverse end markets - low correlation to economic cycles
• | Over 80% of sales in markets with low correlation to economic cycles |
• | Agriculture, Food, Pharmaceuticals, Energy Storage, Environmental |
Biasing growth toward Rapidly Developing Economies (RDEs)
• | 46% of 2011 sales in RDEs |
• | Plan for 50% of sales by 2015 |
• | Focus on faster-growing agriculture, food, pharmaceutical, energy storage markets in Asia, Latin America, CEETR |
Diversified raw material profile
• | Raw material costs represented only 25% of COGS in 2011 |
• | No single raw material represented over 10% of total raw material costs in 2011 |
• | Price increases currently offsetting cost increases |
Low energy requirements & exposure to petrochemicals
• | Energy costs represented only 8% of COGS in 2011 |
• | Limited exposure to oil price fluctuations: +/- $10 per barrel oil equates to +/- $4MM EBIT to FMC |
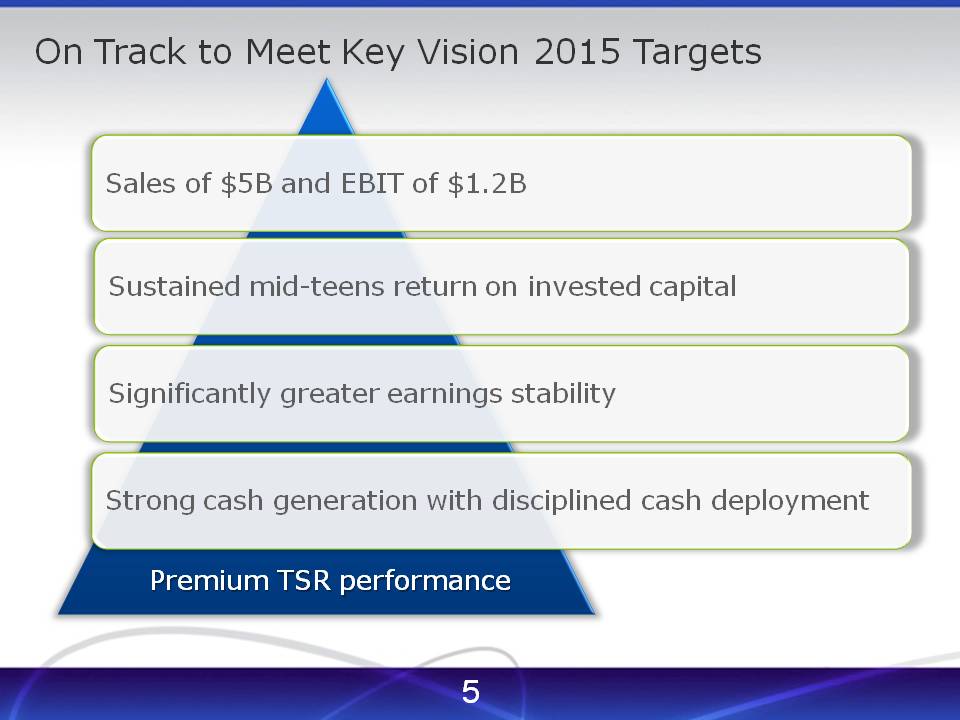
On Track to Meet Key Vision 2015 Targets
• | Sales of $5B and EBIT of $1.2B |
• | Sustained mid-teens return on invested capital |
• | Significantly greater earnings stability |
• | Strong cash generation with disciplined cash deployment |
Premium TSR performance
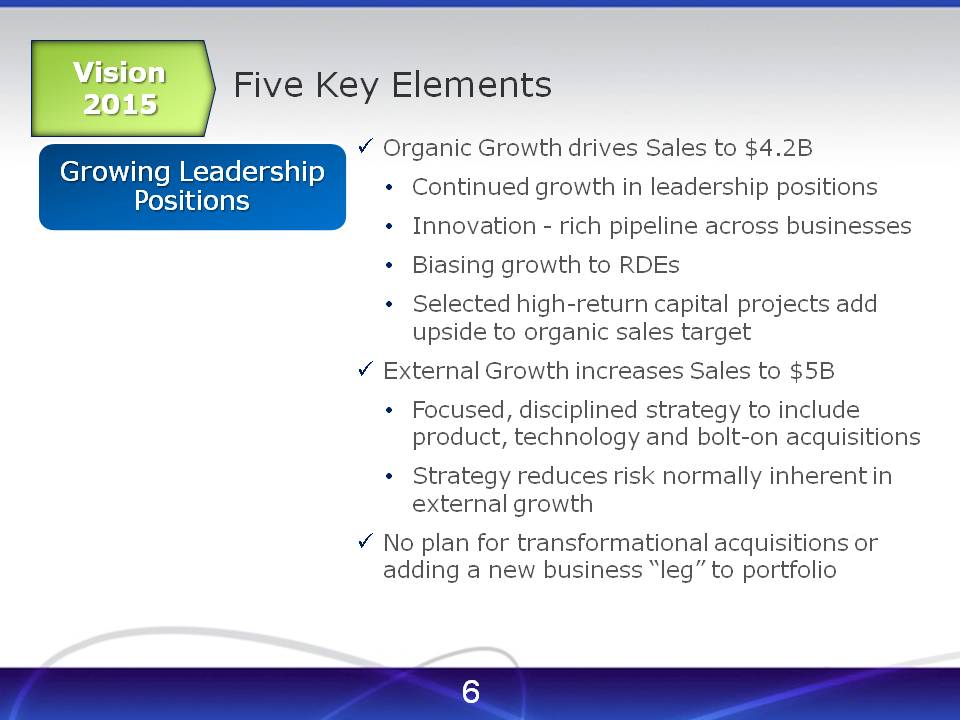
Five Key Elements
Vision 2015
Growing Leadership Positions
• | Organic Growth drives Sales to $4.2B |
• | Continued growth in leadership positions |
• | Innovation - rich pipeline across businesses |
• | Biasing growth to RDEs |
• | Selected high-return capital projects add upside to organic sales target |
• | External Growth increases Sales to $5B |
• | Focused, disciplined strategy to include product, technology and bolt-on acquisitions |
• | Strategy reduces risk normally inherent in external growth |
• | No plan for transformational acquisitions or adding a new business “leg” to portfolio |
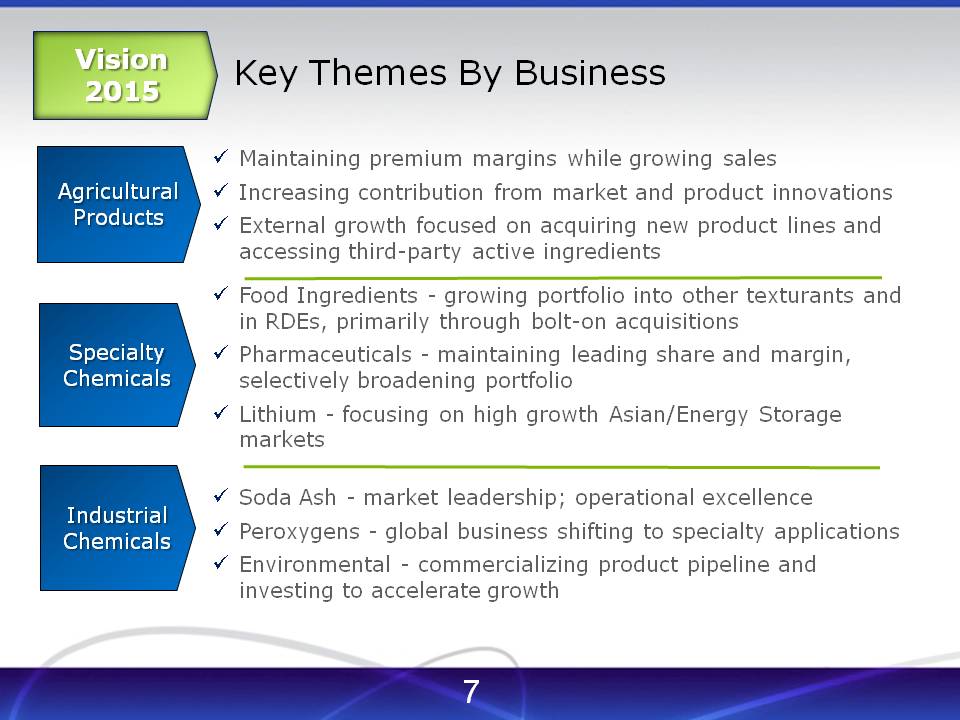
Key Themes By Business
Vision 2015
Agricultural products
• | Maintaining premium margins while growing sales |
• | Increasing contribution from market and product innovations |
• | External growth focused on acquiring new product lines and accessing third-party active ingredients |
Specialty Chemicals
• | Food Ingredients - growing portfolio into other texturants and in RDEs, primarily through bolt-on acquisitions |
• | Pharmaceuticals - maintaining leading share and margin, selectively broadening portfolio |
• | Lithium - focusing on high growth Asian/Energy Storage markets |
Industrial Chemicals
• | Soda Ash - market leadership; operational excellence |
• | Peroxygens - global business shifting to specialty applications |
• | Environmental - commercializing product pipeline and investing to accelerate growth |
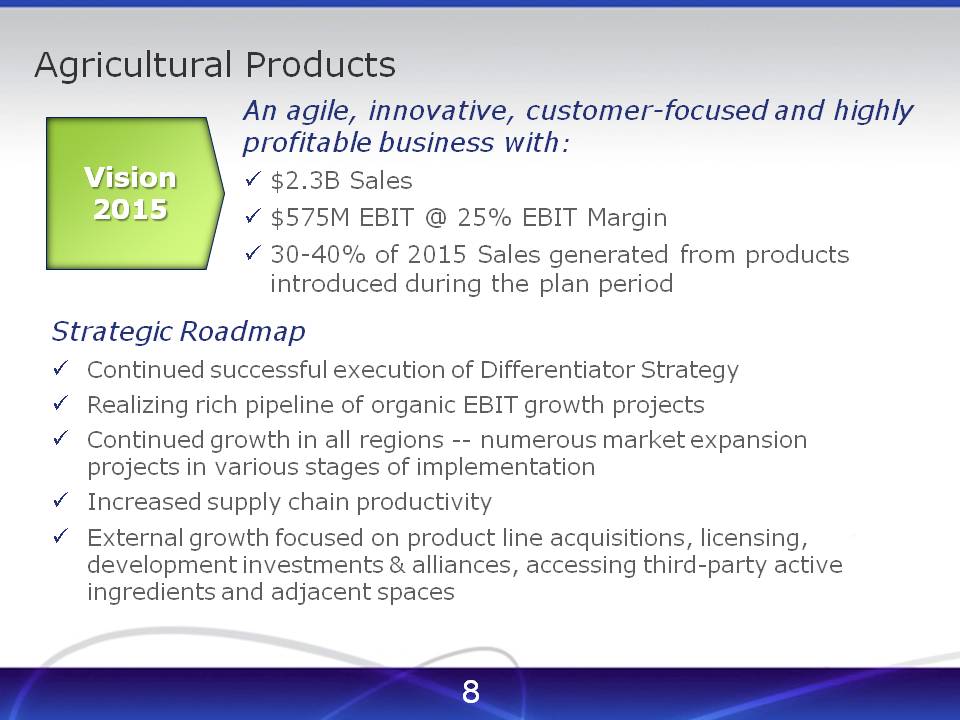
Agricultural Products
Vision 2015
An agile, innovative, customer-focused and highly profitable business with:
• | $2.3B Sales |
• | $575M EBIT @ 25% EBIT Margin |
• | 30-40% of 2015 Sales generated from products introduced during the plan period |
Strategic Roadmap
• | Continued successful execution of Differentiator Strategy |
• | Realizing rich pipeline of organic EBIT growth projects |
• | Continued growth in all regions -- numerous market expansion projects in various stages of implementation |
• | Increased supply chain productivity |
• | External growth focused on product line acquisitions, licensing, development investments & alliances, accessing third-party active ingredients and adjacent spaces |
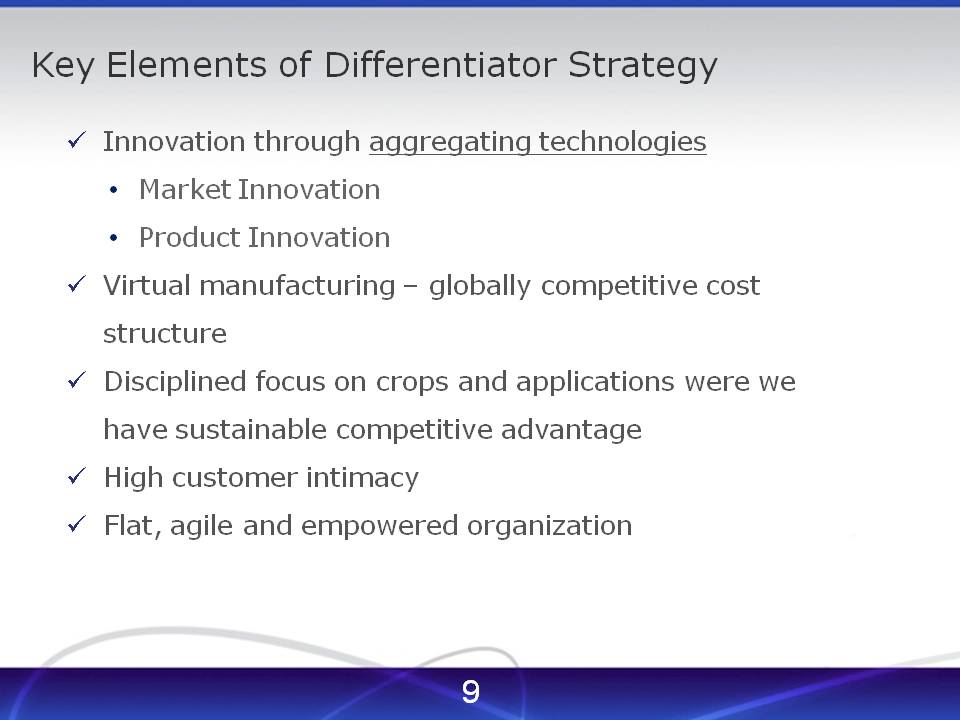
Key Elements of Differentiator Strategy
• | Innovation through aggregating technologies |
• | Market Innovation |
• | Product Innovation |
• | Virtual manufacturing - globally competitive cost structure |
• | Disciplined focus on crops and applications were we have sustainable competitive advantage |
• | High customer intimacy |
• | Flat, agile and empowered organization |
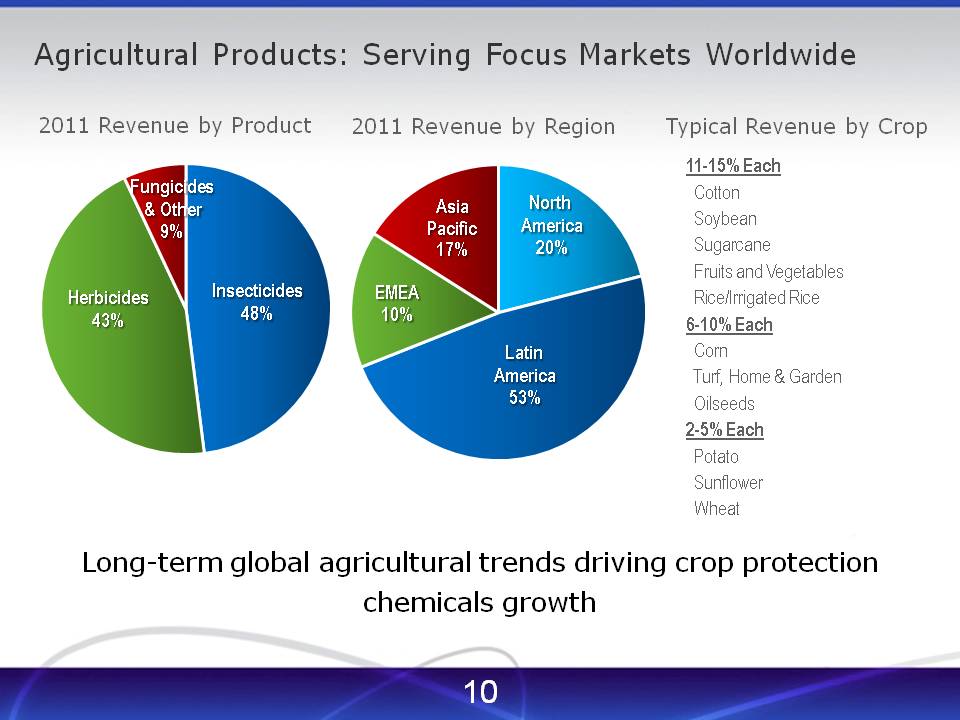
Agricultural Products: Serving Focus Markets Worldwide
2011 Revenue by Product
• | Fungicides & Others: 9%, Herbicides 43%, Insecticides 48% |
2011 Revenue by Region
• | EMEA: 10%, Asia Pacific 17%, North America 20%, Latin America 53% |
Typical Revenue by Crop
11-15% Each: Cotton, Soybean, Sugarcane, Fruits and Vegetables, Rice/Irrigated Rice
6-10% Each: Corn, Turf, Home & Garden, Oilseeds
2-5% Each Potato, Sunflower, Wheat
Long-term global agricultural trends driving crop protection chemicals growth
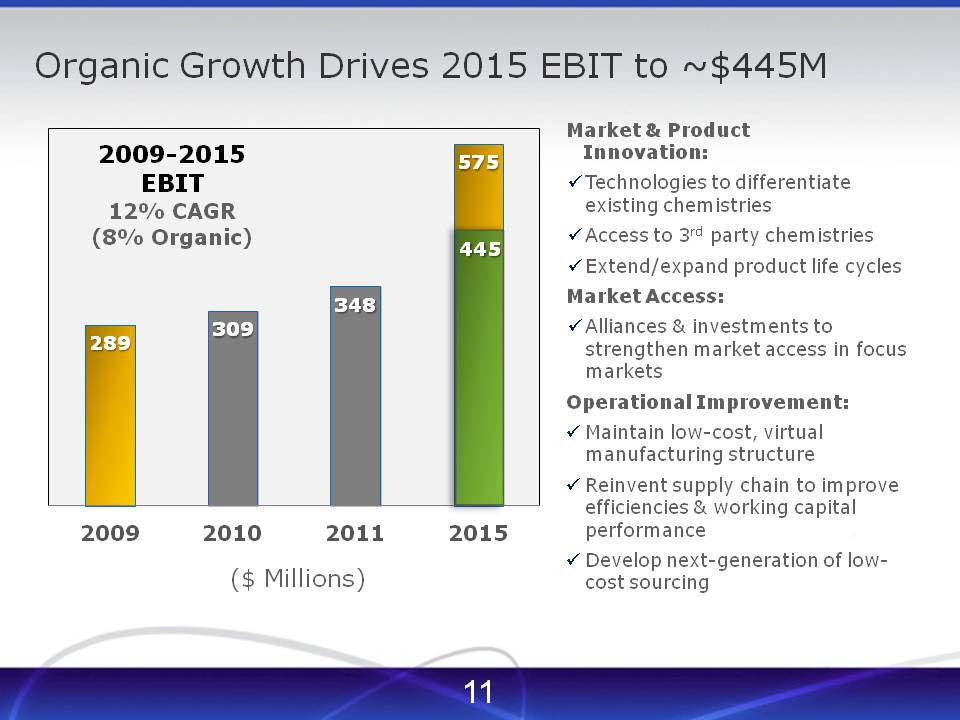
Organic Growth Drives 2015 EBIT to ~$445M
Market & Product Innovation:
• | Technologies to differentiate existing chemistries |
• | Access to 3rd party chemistries |
• | Extend/expand product life cycles |
Market Access:
• | Alliances & investments to strengthen market access in focus markets |
Operational Improvement:
• | Maintain low-cost, virtual manufacturing structure |
• | Reinvent supply chain to improve efficiencies & working capital performance |
• | Develop next-generation of low-cost sourcing |
2009-2015 EBIT 12% CAGR (8% Organic)
($ Millions)
2009: 289, 2010: 309, 2011: 248, 2015: 445 & 575
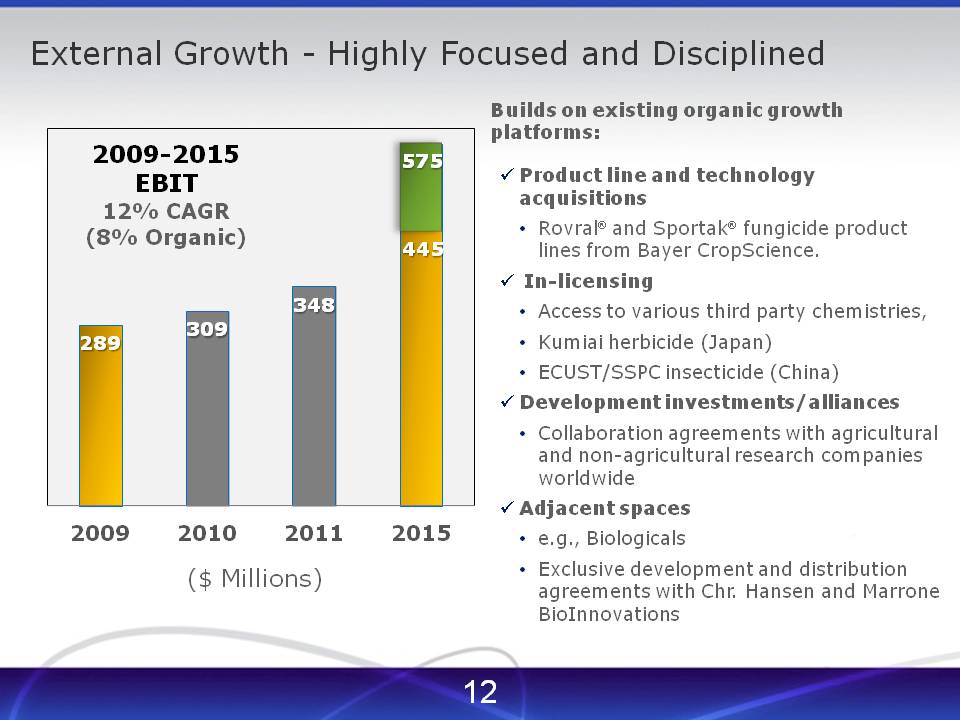
External Growth - Highly Focused and Disciplined
Builds on existing organic growth platforms:
• | Product line and technology |
• | acquisitions |
• | Rovral and Sportak fungicide product lines from Bayer CropScience. |
• | In-licensing |
• | Access to various third party chemistries, |
• | Kumiai herbicide (Japan) |
• | ECUST/SSPC insecticide (China) |
• | Development investments/alliances |
• | Collaboration agreements with agricultural and non-agricultural research companies worldwide |
• | Adjacent spaces |
• | e.g., Biologicals |
• | Exclusive development and distribution agreements with Chr. Hansen and Marrone BioInnovations |
2009-2015 EBIT 12% CAGR (8% Organic)
($ Millions)
2009: 289, 2010: 309, 2011: 248, 2015: 445 & 575
Specialty Chemicals
Vision 2015
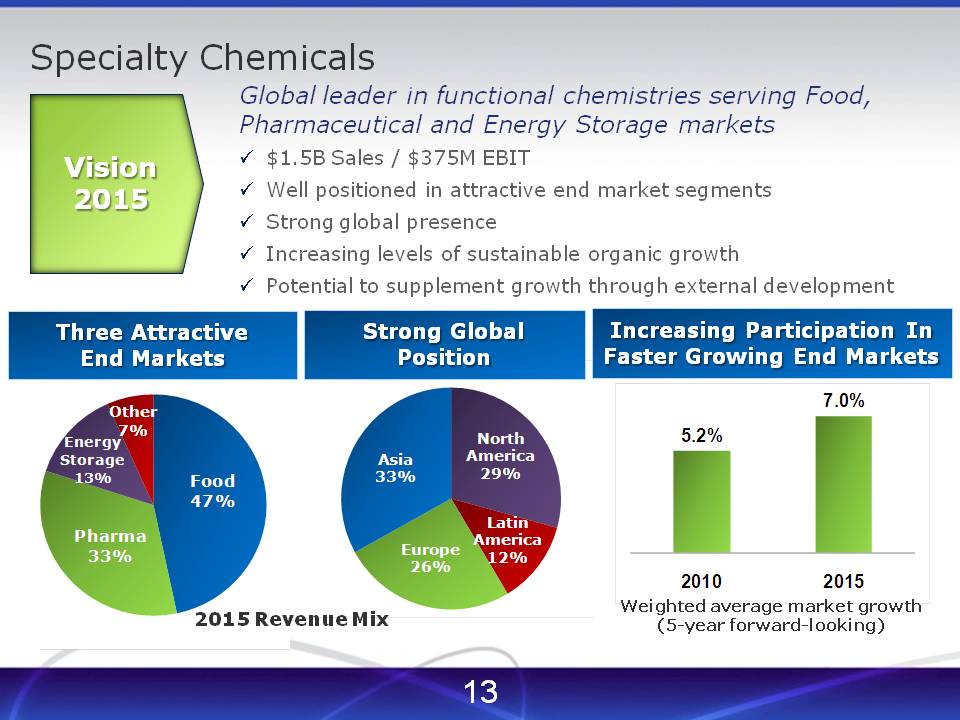
Global leader in functional chemistries serving Food, Pharmaceutical and Energy Storage markets
• | $1.5B Sales / $375M EBIT |
• | Well positioned in attractive end market segments |
• | Strong global presence |
• | Increasing levels of sustainable organic growth |
• | Potential to supplement growth through external development |
2015 Revenue Mix
Three Attractive End Markets
• | Other: 7%, Energy Storage: 13%, Pharma: 33%, Food: 47% |
Strong Global Position
• | Asia 33%, North America: 29%, Europe: 26%, Latin America: 12% |
Increasing Participation In Faster Growing End Markets
Weighted average market growth (5-year forward-looking)
◦ | 2010: 5.2%, 2015: 7.0% |
Food Ingredients
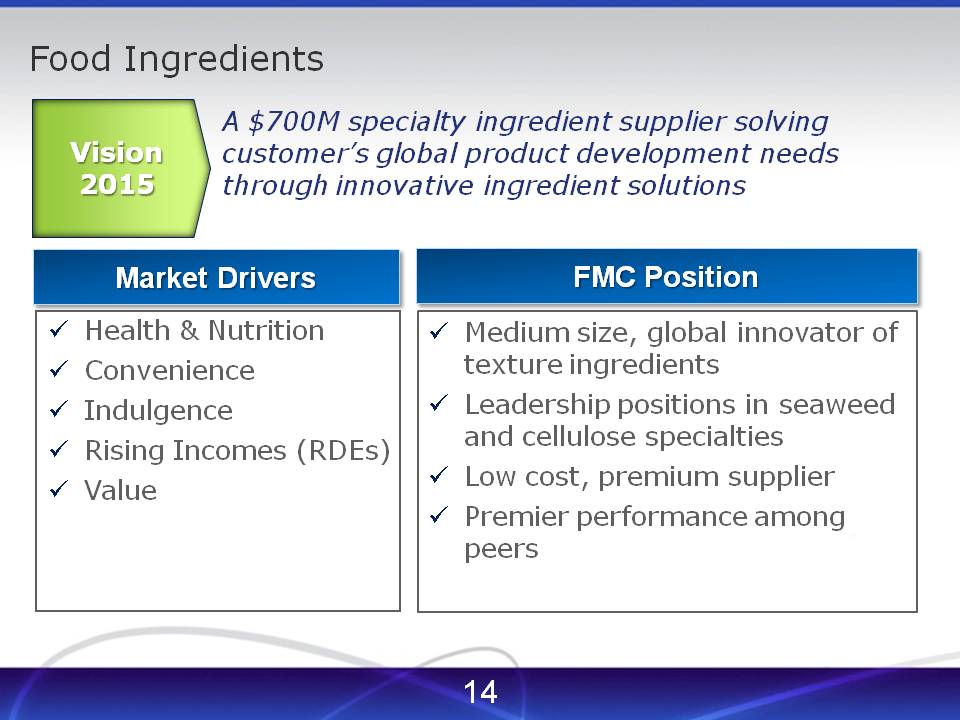
Vision 2015
• | A $700M specialty ingredient supplier solving customer's global product development needs through innovative ingredient solutions |
Market Drivers
• | Health & Nutrition |
• | Convenience |
• | Indulgence |
• | Rising Incomes (RDEs) |
• | Value |
FMC Position
• | Medium size, global innovator of texture ingredients |
• | Leadership positions in seaweed and cellulose specialties |
• | Low cost, premium supplier |
• | Premier performance among peers |
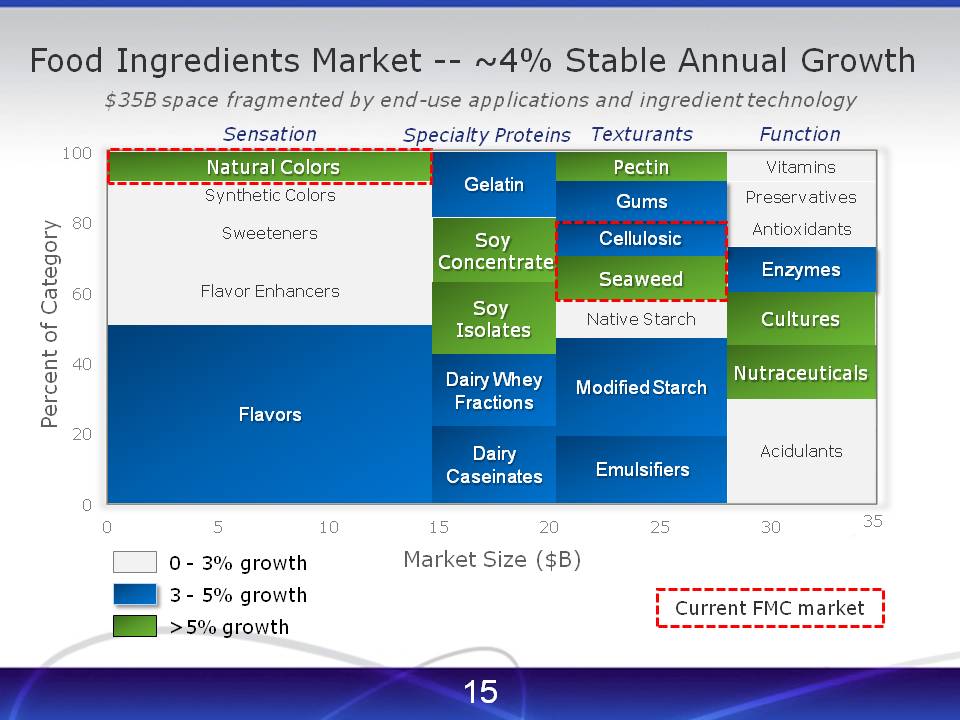
Food Ingredients Market -- ~4% Stable Annual Growth
$35B space fragmented by end-use applications and ingredient technology
Market Size ($B)
Sensation
• | Natural Colors, Synthetic Colors, Sweeteners, Flavor Enhancers, Flavors |
Specialty Proteins
• | Gelatin, Soy Concentrate, Soy Isolates, Dairy Whey Fractions, Dairy Caseinates |
Textures
• | Pectin, Gums, Cellulosic & Seaweed = Current FMC Market, Native Starch, Modified Starch, Emulsifiers |
Function
• | Vitamins, Preservatives, Antioxidants, Enzymes, Cultures, Nutraceuticals, Acidulants |
White = 0-3% growth, Blue = 3-5% growth, Green= >5% growth
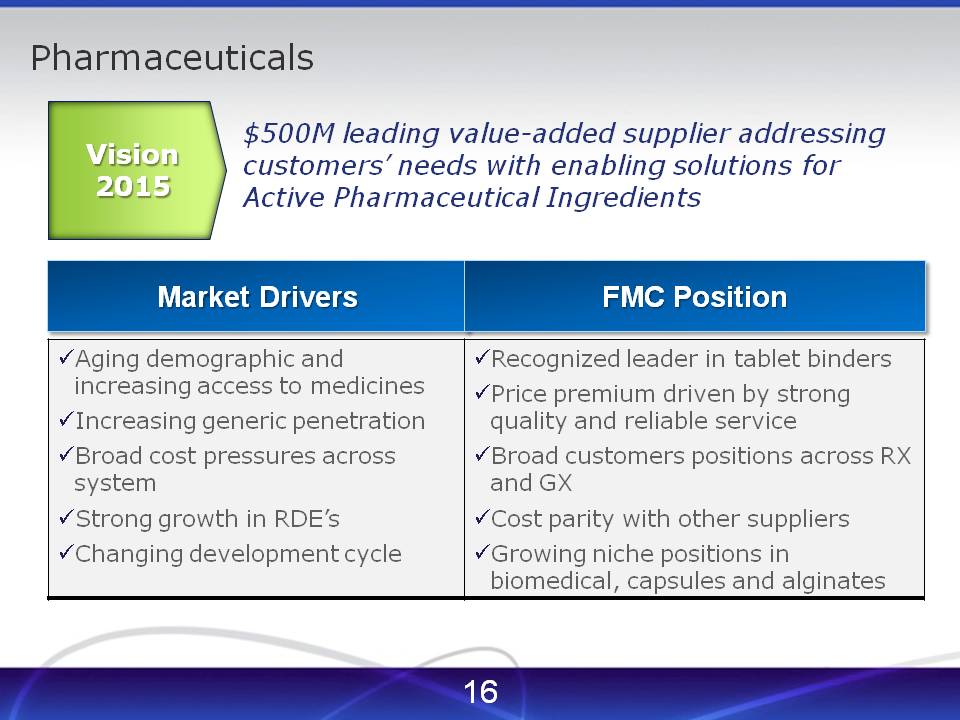
Pharmaceuticals
Vision 2015 - $500M leading value-added supplier addressing customers' needs with enabling solutions for Active Pharmaceutical Ingredients
Market Drivers
• | Aging demographic and increasing access to medicines |
• | Increasing generic penetration |
• | Broad cost pressures across system |
• | Strong growth in RDE's |
• | Changing development cycle |
FMC Position
• | Recognized leader in tablet binders |
• | Price premium driven by strong quality and reliable service |
• | Broad customers positions across RX and GX |
• | Cost parity with other suppliers |
• | Growing niche positions in biomedical, capsules and alginates |

Lithium
Vision 2015 = $350M supplier of lithium chemistries profitably serving a broad base of customers in the Energy Storage, Polymers, Synthesis and Industrial markets
Market Drivers
• | Portable electronics growth |
• | Energy diversification |
• | Energy/environmental policies |
• | Long term supply availability |
• | RDE growth in downstream markets |
FMC Starting Position
• | Well positioned in early stages of energy market growth |
• | Attractive cost position |
• | Recognized leader in several high value market niches |
• | Well positioned in Asia vs. major competition |
• | Manufacturing footprint transitioned toward future growth platforms |
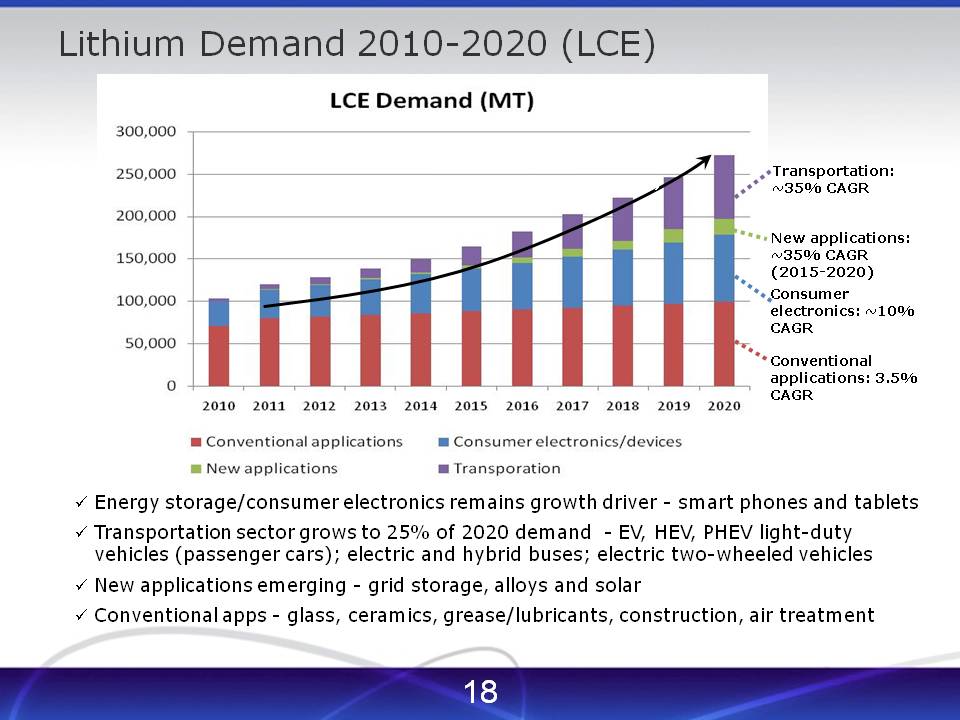
Lithium Demand 2010-2020 (LCE)
• | Energy storage/consumer electronics remains growth driver - smart phones and tablets |
• | Transportation sector grows to 25% of 2020 demand - EV, HEV, PHEV light-duty vehicles (passenger cars); electric and hybrid buses; electric two-wheeled vehicles |
• | New applications emerging - grid storage, alloys and solar |
• | Conventional apps - glass, ceramics, grease/lubricants, construction, air treatment |
Conventional applications: 3.5% CAGR, Consumer electronics: ~10% CAGR, New applications: ~35% CAGR (2015-2020), Transportation: ~35% CAGR
Conventional Applications, New Applications, Transportation, Consumer electronics/devices
Industrial Chemicals
Vision 2015 & Key Elements
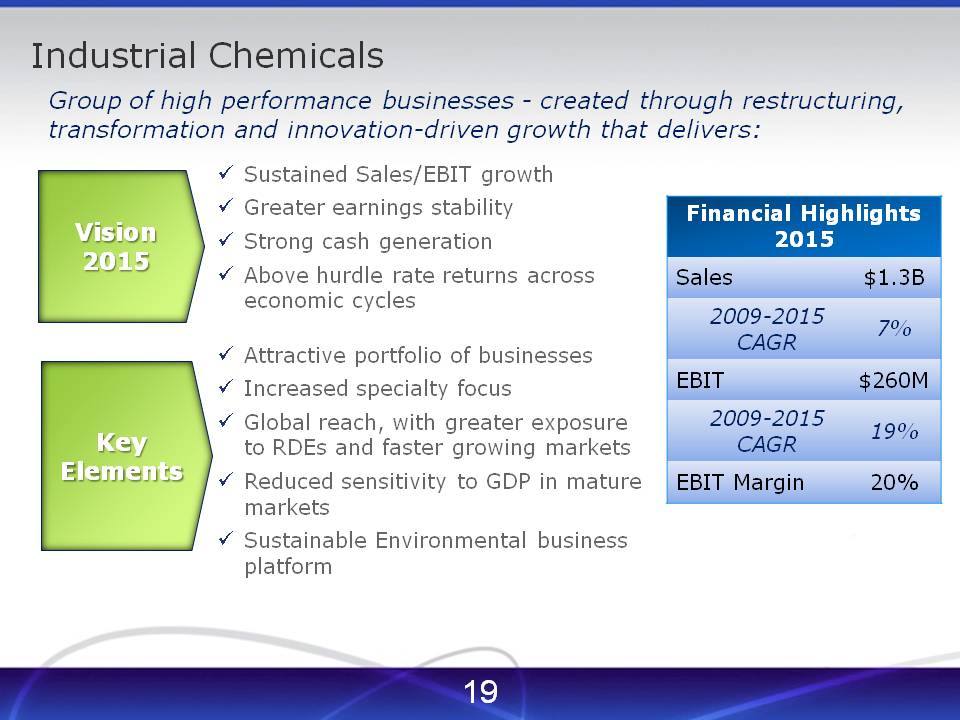
Group of high performance businesses - created through restructuring, transformation and innovation-driven growth that delivers:
• | Sustained Sales/EBIT growth |
• | Greater earnings stability |
• | Strong cash generation |
• | Above hurdle rate returns across economic cycles |
• | Attractive portfolio of businesses |
• | Increased specialty focus |
• | Global reach, with greater exposure to RDEs and faster growing markets |
• | Reduced sensitivity to GDP in mature markets |
• | Sustainable Environmental business platform |
Financial Highlights 2015: Sales $1.3B, 2009-2015 CAGR 7%, EBIT $260M, 2009-2015 CAGR 19%, EBIT Margin 20%
Soda Ash
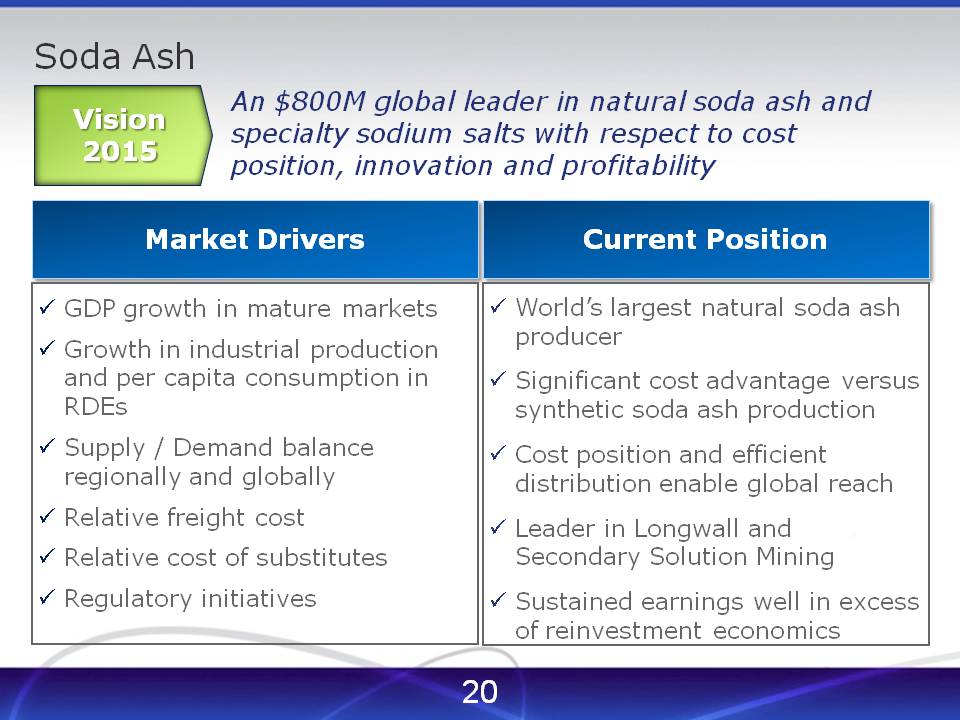
Vision 2015= An $800M global leader in natural soda ash and specialty sodium salts with respect to cost position, innovation and profitability
Market Drivers
• | GDP growth in mature markets |
• | Growth in industrial production and per capita consumption in RDEs |
• | Supply / Demand balance regionally and globally |
• | Relative freight cost |
• | Relative cost of substitutes |
• | Regulatory initiatives |
Current Position
• | World's largest natural soda ash producer |
• | Significant cost advantage versus synthetic soda ash production |
• | Cost position and efficient distribution enable global reach |
• | Leader in Longwall and Secondary Solution Mining |
• | Sustained earnings well in excess of reinvestment economics |
Global Peroxygens
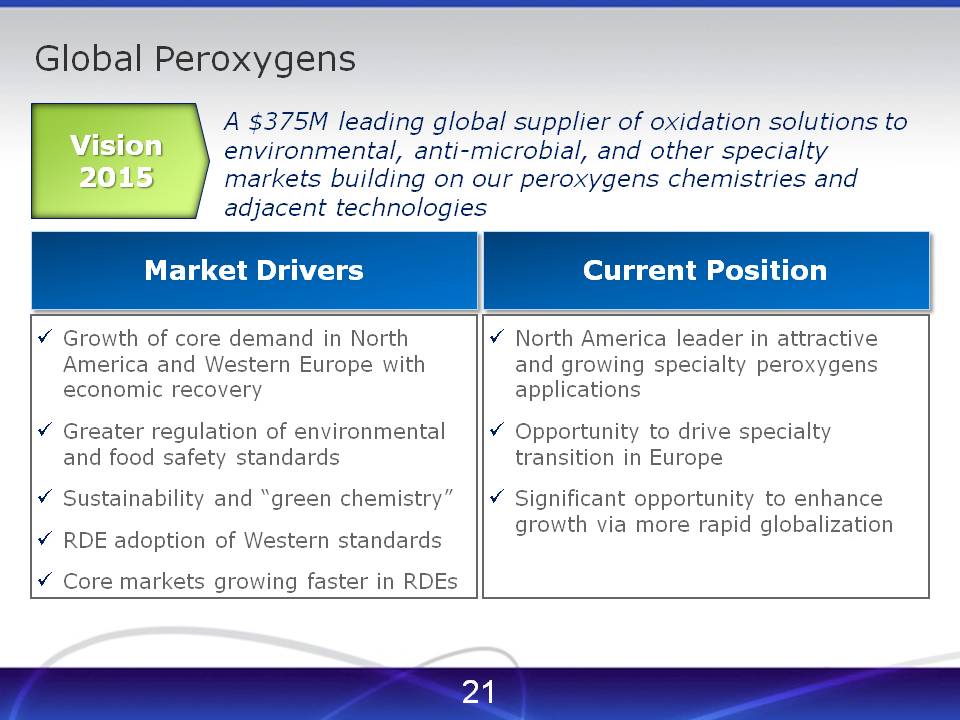
Vision 2015 = A $375M leading global supplier of oxidation solutions to environmental, anti-microbial, and other specialty markets building on our peroxygens chemistries and adjacent technologies
Market Drivers
• | Growth of core demand in North America and Western Europe with economic recovery |
• | Greater regulation of environmental and food safety standards |
• | Sustainability and “green chemistry” |
• | RDE adoption of Western standards |
• | Core markets growing faster in RDEs |
Current Position
• | North America leader in attractive and growing specialty peroxygens applications |
• | Opportunity to drive specialty transition in Europe |
• | Significant opportunity to enhance growth via more rapid globalization |
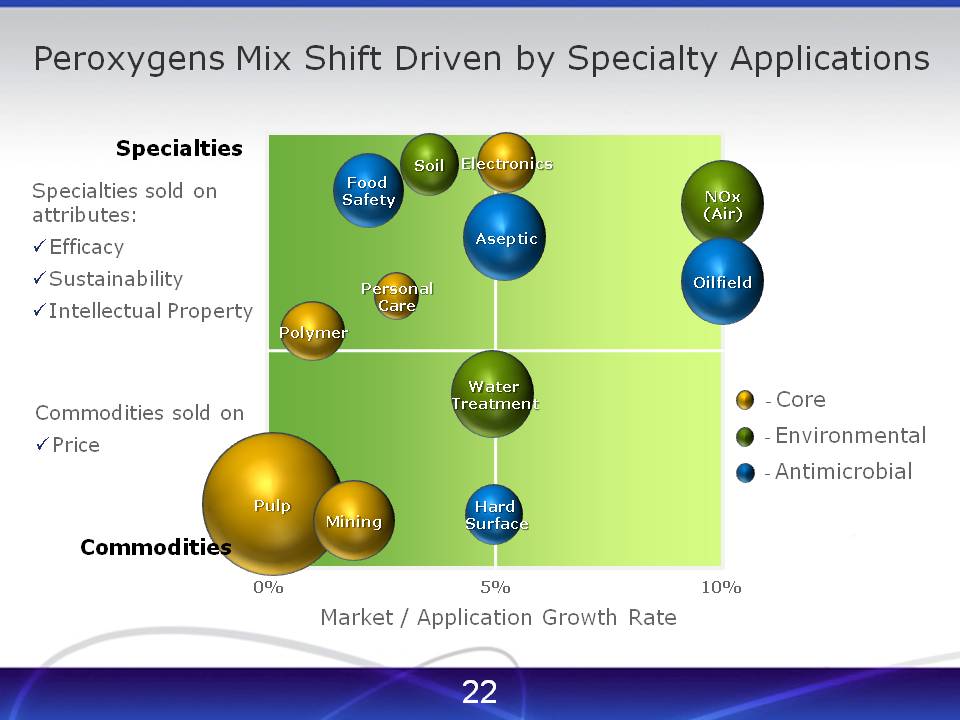
Peroxygens Mix Shift Driven by Specialty Applications
Specialties
Specialties sold on
attributes:
• | Efficacy |
• | Sustainability |
• | Intellectual Property |
Commodities sold on
• | Price |
Market / Application Growth Rate
Yellow= Core
• | Pulp, Mining, Polymer, Personal Care, Electronics, |
Green= Environmental
• | Soil, Water Treatment, NOx (Air) |
Blue= Antimicrobial
• | Hard Surface, Oilfield, Aseptic, Food Safety |
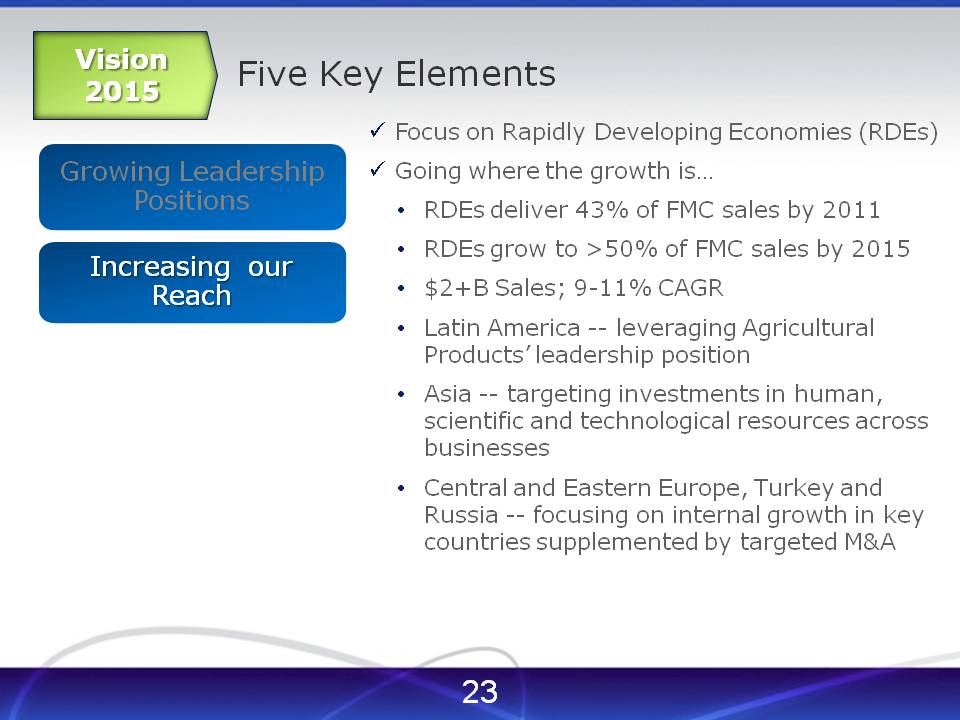
Five Key Elements (Vision 2015)
Growing Leadership Positions, Increasing our reach
• | Focus on Rapidly Developing Economies (RDEs) |
• | Going where the growth is… |
• | RDEs deliver 43% of FMC sales by 2011 |
• | RDEs grow to >50% of FMC sales by 2015 |
• | $2+B Sales; 9-11% CAGR |
• | Latin America -- leveraging Agricultural Products' leadership position |
• | Asia -- targeting investments in human, scientific and technological resources across businesses |
• | Central and Eastern Europe, Turkey and Russia -- focusing on internal growth in key countries supplemented by targeted M&A |
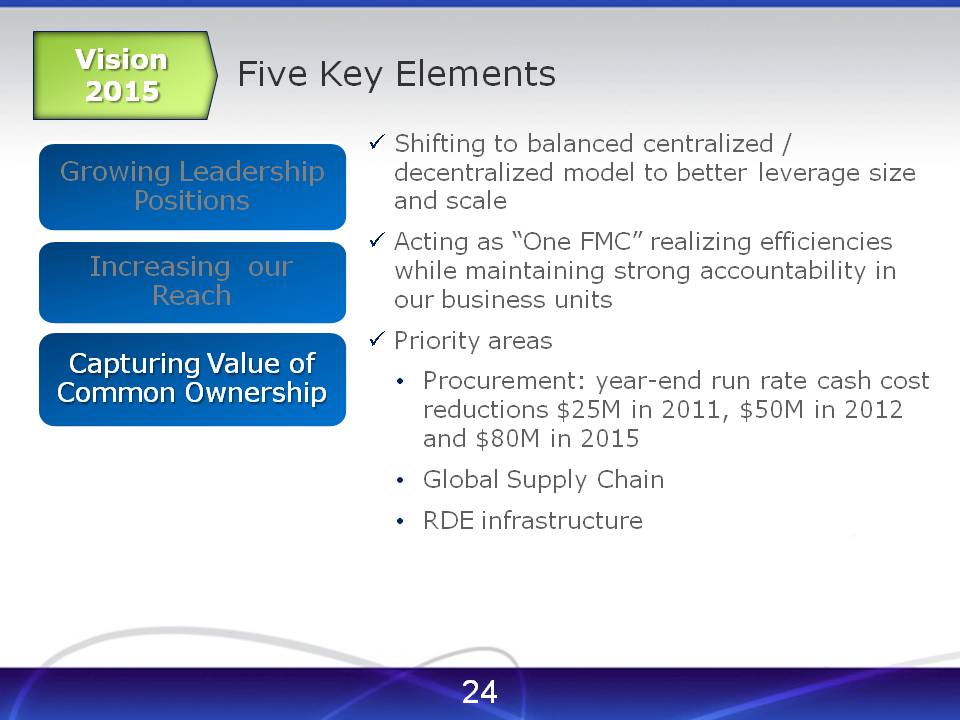
Five Key Elements (Vision 2015)
Growing Leadership Positions, Increasing our reach, Capturing Value of Common Ownership
• | Shifting to balanced centralized / decentralized model to better leverage size and scale |
• | Acting as “One FMC” realizing efficiencies while maintaining strong accountability in our business units |
• | Priority areas |
• | Procurement: year-end run rate cash cost reductions $25M in 2011, $50M in 2012 and $80M in 2015 |
• | Global Supply Chain |
• | RDE infrastructure |
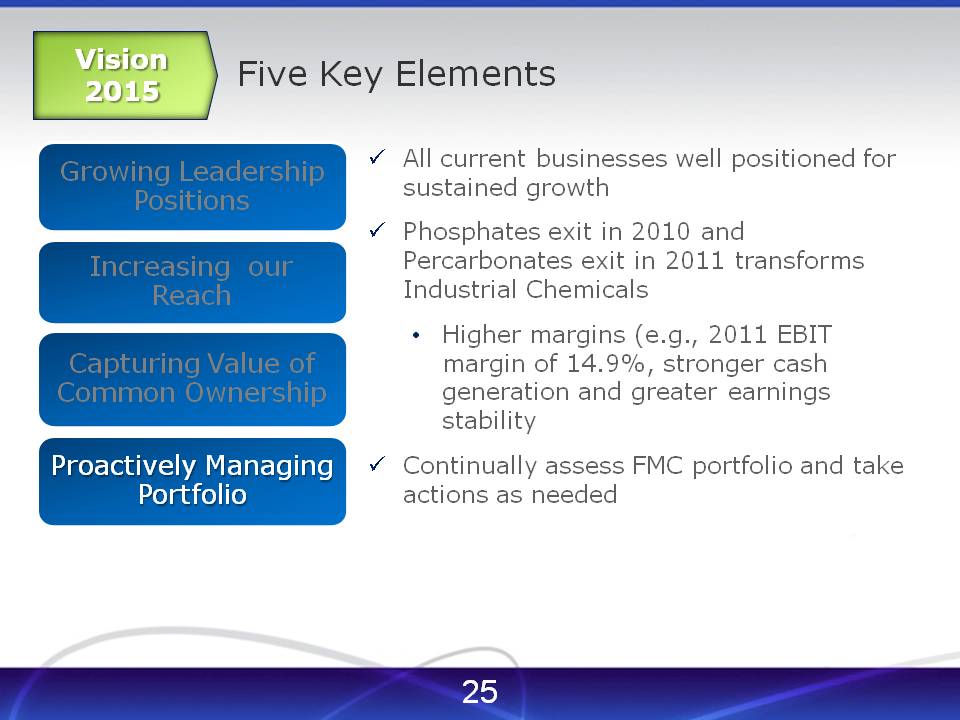
Five Key Elements (Vision 2015)
Growing Leadership Positions, Increasing our reach, Capturing Value of Common Ownership, Proactively Managing Portfolio
• | All current businesses well positioned for sustained growth |
• | Phosphates exit in 2010 and Percarbonates exit in 2011 transforms Industrial Chemicals |
• | Higher margins (e.g., 2011 EBIT margin of 14.9%, stronger cash generation and greater earnings stability |
• | Continually assess FMC portfolio and take actions as needed |
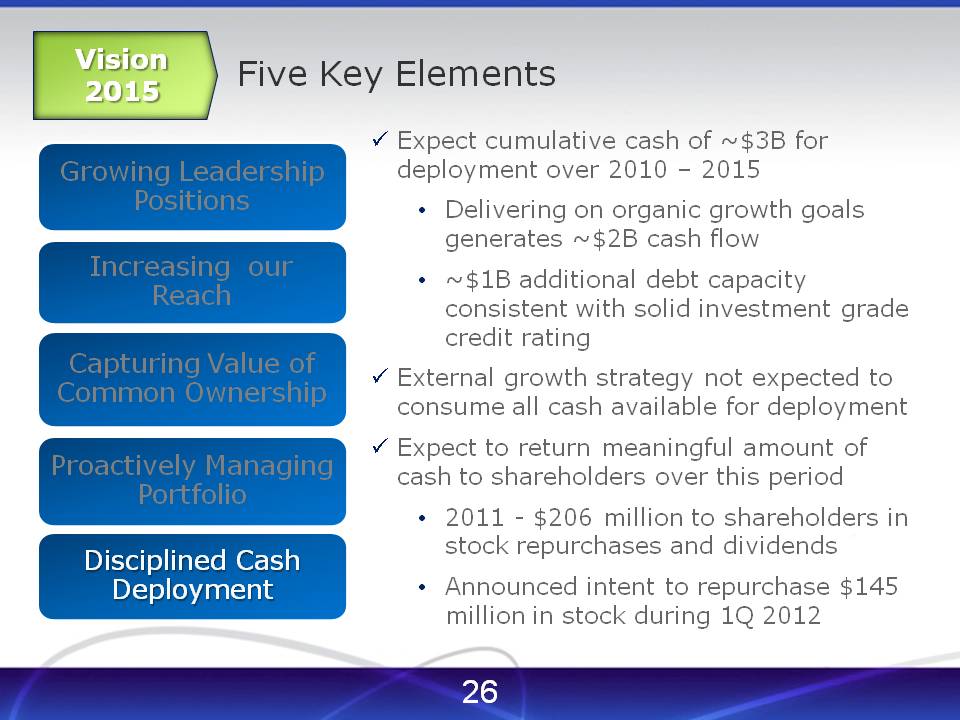
Five Key Elements (Vision 2015)
Growing Leadership Positions, Increasing our reach, Capturing Value of Common Ownership, Proactively Managing Portfolio, Disciplined Cash Deployment
• | Expect cumulative cash of ~$3B for deployment over 2010 - 2015 |
• | Delivering on organic growth goals generates ~$2B cash flow |
• | ~$1B additional debt capacity consistent with solid investment grade credit rating |
• | External growth strategy not expected to consume all cash available for deployment |
• | Expect to return meaningful amount of cash to shareholders over this period |
• | 2011 - $206 million to shareholders in stock repurchases and dividends |
• | Announced intent to repurchase $145 million in stock during 1Q 2012 |

Vision 2015 FMC
• | The Right Chemistry |