Attached files
| file | filename |
|---|---|
| 8-K - 8-K - Dine Brands Global, Inc. | a12-6439_18k.htm |
Exhibit 99.1
|
|
Investor Presentation March 2012 |
|
|
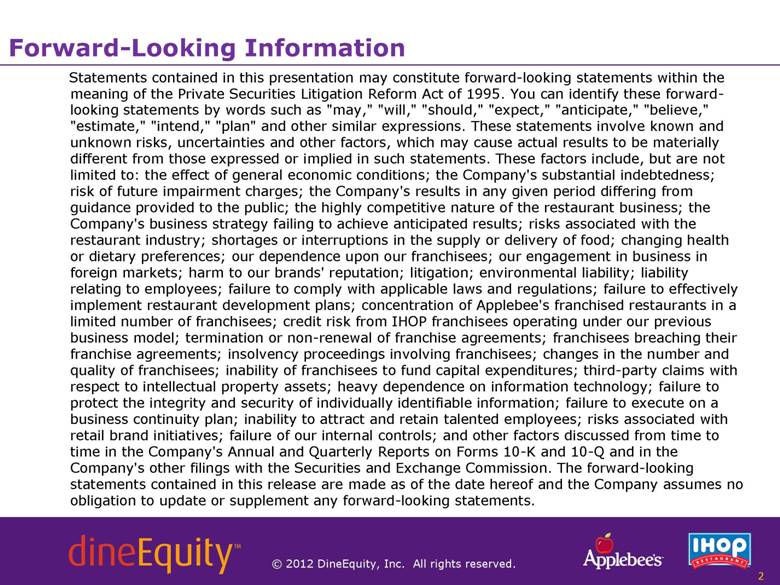
Statements contained in this presentation may constitute forward-looking statements within the meaning of the Private Securities Litigation Reform Act of 1995. You can identify these forward-looking statements by words such as "may," "will," "should," "expect," "anticipate," "believe," "estimate," "intend," "plan" and other similar expressions. These statements involve known and unknown risks, uncertainties and other factors, which may cause actual results to be materially different from those expressed or implied in such statements. These factors include, but are not limited to: the effect of general economic conditions; the Company's substantial indebtedness; risk of future impairment charges; the Company's results in any given period differing from guidance provided to the public; the highly competitive nature of the restaurant business; the Company's business strategy failing to achieve anticipated results; risks associated with the restaurant industry; shortages or interruptions in the supply or delivery of food; changing health or dietary preferences; our dependence upon our franchisees; our engagement in business in foreign markets; harm to our brands' reputation; litigation; environmental liability; liability relating to employees; failure to comply with applicable laws and regulations; failure to effectively implement restaurant development plans; concentration of Applebee's franchised restaurants in a limited number of franchisees; credit risk from IHOP franchisees operating under our previous business model; termination or non-renewal of franchise agreements; franchisees breaching their franchise agreements; insolvency proceedings involving franchisees; changes in the number and quality of franchisees; inability of franchisees to fund capital expenditures; third-party claims with respect to intellectual property assets; heavy dependence on information technology; failure to protect the integrity and security of individually identifiable information; failure to execute on a business continuity plan; inability to attract and retain talented employees; risks associated with retail brand initiatives; failure of our internal controls; and other factors discussed from time to time in the Company's Annual and Quarterly Reports on Forms 10-K and 10-Q and in the Company's other filings with the Securities and Exchange Commission. The forward-looking statements contained in this release are made as of the date hereof and the Company assumes no obligation to update or supplement any forward-looking statements. 2 Forward-Looking Information |
|
|
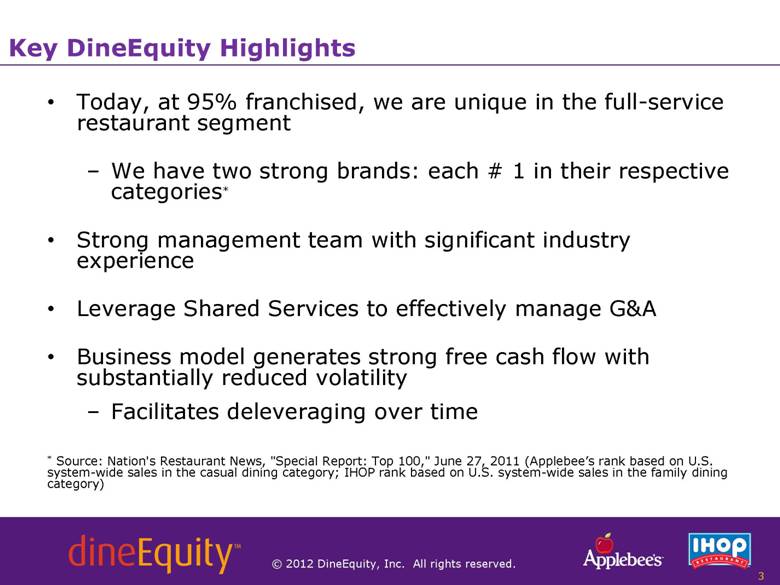
Today, at 95% franchised, we are unique in the full-service restaurant segment We have two strong brands: each # 1 in their respective categories* Strong management team with significant industry experience Leverage Shared Services to effectively manage G&A Business model generates strong free cash flow with substantially reduced volatility Facilitates deleveraging over time * Source: Nation's Restaurant News, "Special Report: Top 100," June 27, 2011 (Applebee’s rank based on U.S. system-wide sales in the casual dining category; IHOP rank based on U.S. system-wide sales in the family dining category) 3 Key DineEquity Highlights |
|
|
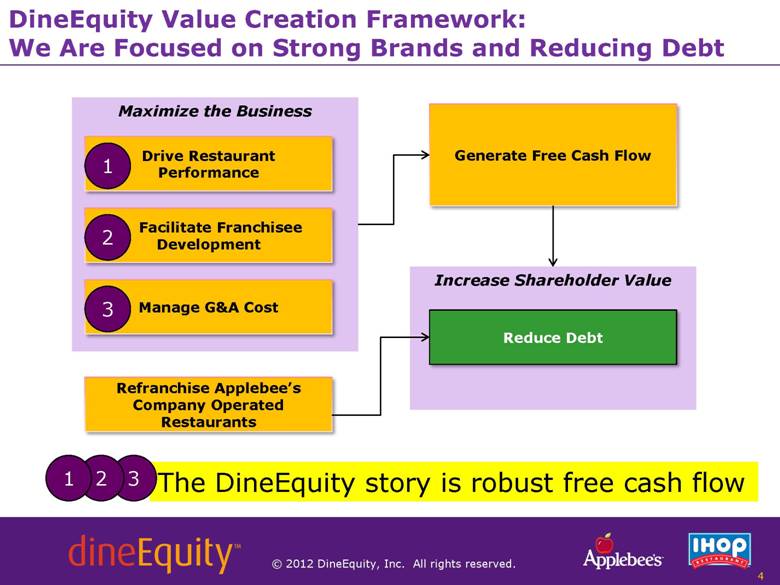
4 Increase Shareholder Value Maximize the Business Drive Restaurant Performance Facilitate Franchisee Development Manage G&A Cost Generate Free Cash Flow Refranchise Applebee’s Company Operated Restaurants Reduce Debt DineEquity Value Creation Framework: We Are Focused on Strong Brands and Reducing Debt 1 3 2 The DineEquity story is robust free cash flow 3 2 1 |
|
|
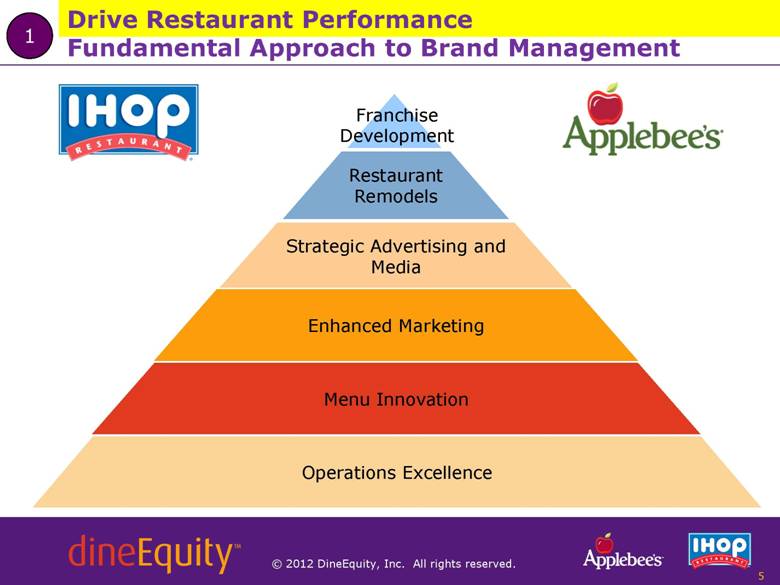
5 Menu Innovation Strategic Advertising and Media Enhanced Marketing Restaurant Remodels Operations Excellence Franchise Development Fundamental Approach to Brand Management Drive Restaurant Performance 1 |
|
|
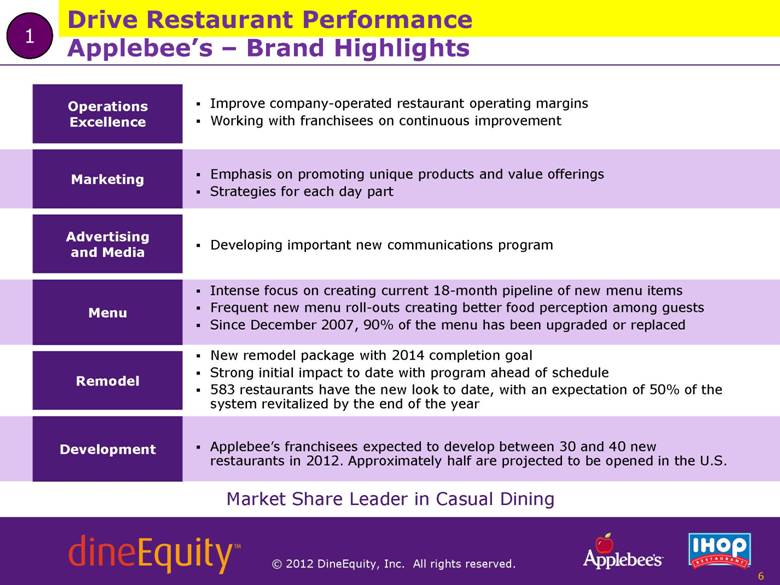
Marketing Advertising and Media Menu Operations Excellence Development Emphasis on promoting unique products and value offerings Strategies for each day part Developing important new communications program Intense focus on creating current 18-month pipeline of new menu items Frequent new menu roll-outs creating better food perception among guests Since December 2007, 90% of the menu has been upgraded or replaced Remodel New remodel package with 2014 completion goal Strong initial impact to date with program ahead of schedule 583 restaurants have the new look to date, with an expectation of 50% of the system revitalized by the end of the year Improve company-operated restaurant operating margins Working with franchisees on continuous improvement Applebee’s franchisees expected to develop between 30 and 40 new restaurants in 2012. Approximately half are projected to be opened in the U.S. 6 Applebee’s – Brand Highlights Drive Restaurant Performance 1 Market Share Leader in Casual Dining |
|
|
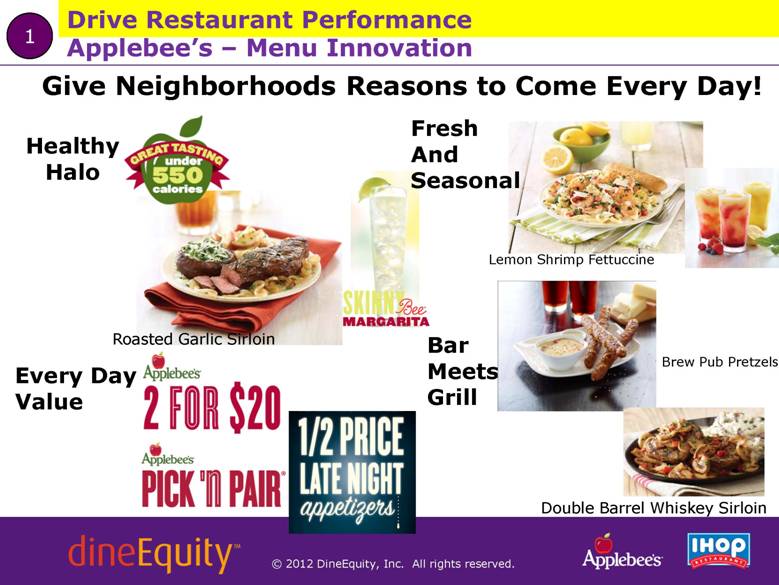
Give Neighborhoods Reasons to Come Every Day! Healthy Halo Every Day Value Bar Meets Grill Double Barrel Whiskey Sirloin Lemon Shrimp Fettuccine Brew Pub Pretzels Roasted Garlic Sirloin Applebee’s – Menu Innovation Drive Restaurant Performance 1 Fresh And Seasonal |
|
|
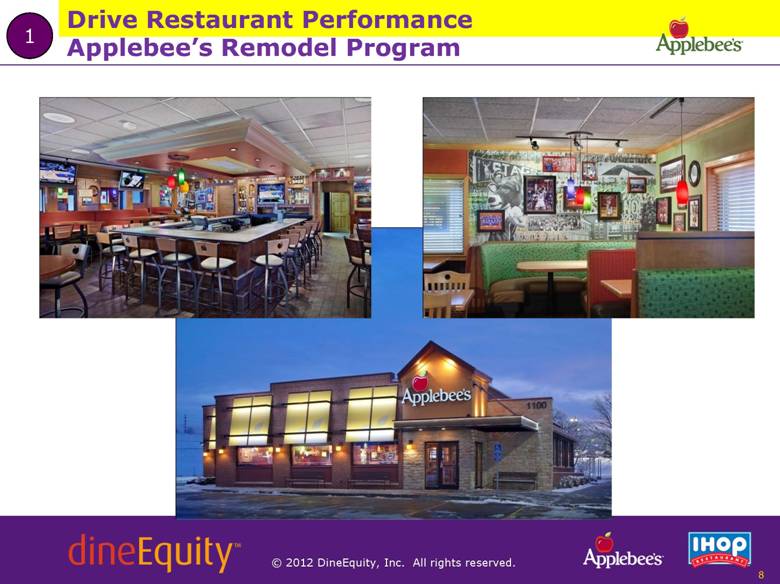
Drive Restaurant Performance 8 Applebee’s Remodel Program 1 |
|
|
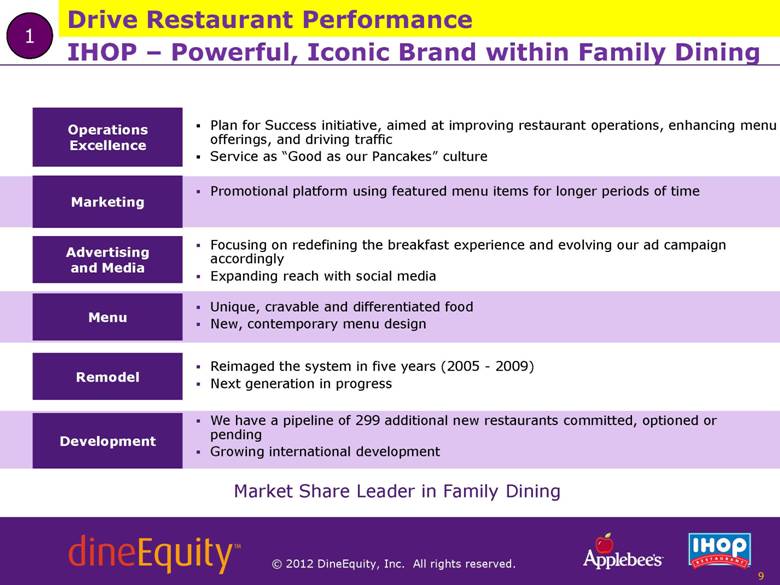
Marketing Advertising and Media Menu Operations Excellence Development Promotional platform using featured menu items for longer periods of time Focusing on redefining the breakfast experience and evolving our ad campaign accordingly Expanding reach with social media Unique, cravable and differentiated food New, contemporary menu design Remodel Reimaged the system in five years (2005 - 2009) Next generation in progress Plan for Success initiative, aimed at improving restaurant operations, enhancing menu offerings, and driving traffic Service as “Good as our Pancakes” culture We have a pipeline of 299 additional new restaurants committed, optioned or pending Growing international development Market Share Leader in Family Dining 9 IHOP – Powerful, Iconic Brand within Family Dining Drive Restaurant Performance 1 |
|
|
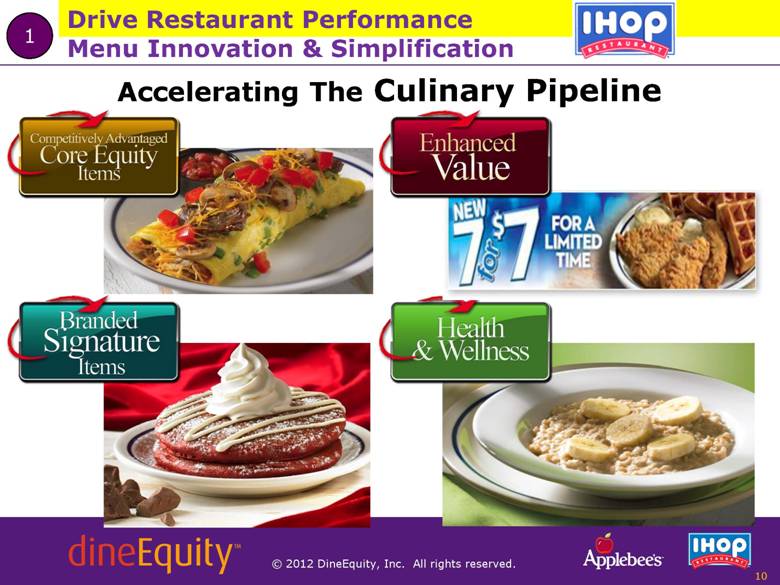
Menu Innovation & Simplification Accelerating The Culinary Pipeline 10 Drive Restaurant Performance 1 |
|
|
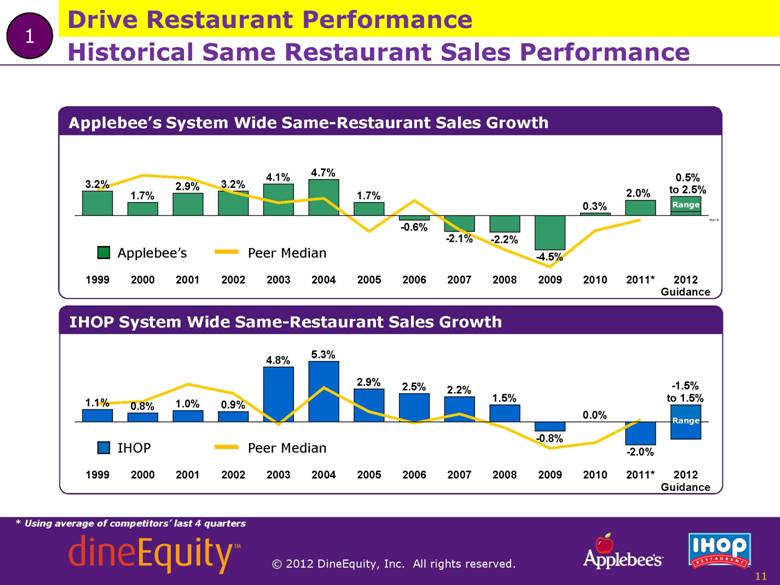
Applebee’s System Wide Same-Restaurant Sales Growth IHOP System Wide Same-Restaurant Sales Growth IHOP Peer Median Applebee’s Peer Median * Using average of competitors’ last 4 quarters 11 Historical Same Restaurant Sales Performance Drive Restaurant Performance 1 1999 1.1% 2000 0.8% 2001 1.0% 2002 0.9% 2003 4.8% 2004 5.3% 2005 2.9% 2006 2.5% 2007 2.2% 2008 1.5% 2009 -0.8% 2010 0.0% 2011* -2.0% 2012 Guidance Range -1.5% to 1.5% 1999 3.2% 2000 1.7% 2001 2.9% 2002 3.2% 2003 4.1% 2004 4.7% 2005 1.7% 2006 -0.6% 2007 -2.1% 2008 -2.2% 2009 -4.5% 2010 0.3% 2011* 2012 Guidance 2.0% Range 0.5% to 2.5% |
|
|
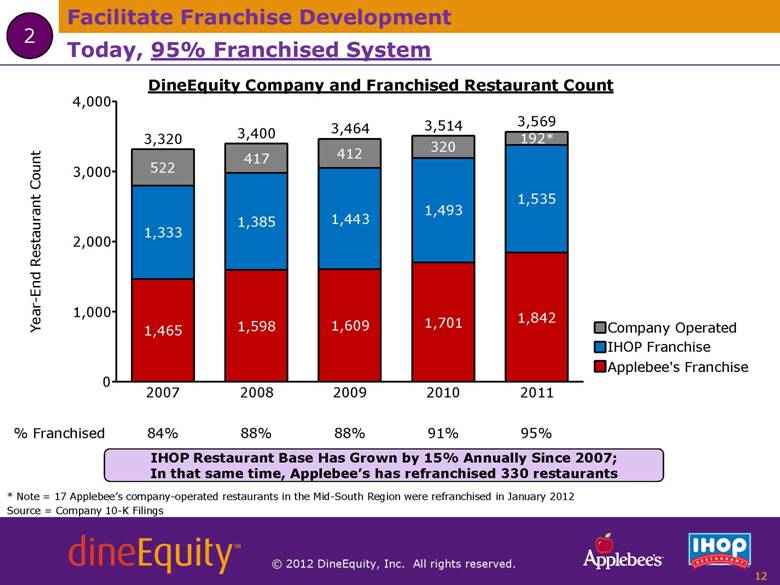
12 Source = Company 10-K Filings DineEquity Company and Franchised Restaurant Count * Note = 17 Applebee’s company-operated restaurants in the Mid-South Region were refranchised in January 2012 IHOP Restaurant Base Has Grown by 15% Annually Since 2007; In that same time, Applebee’s has refranchised 330 restaurants Facilitate Franchise Development Today, 95% Franchised System 2 0 1,000 2,000 3,000 4,000 2007 522 1,333 1,465 3,320 2008 417 1,385 1,598 3,400 2009 412 1,443 1,609 3,464 2010 320 1,493 1,701 3,514 2011 192* 1,535 1,842 3,569 Year-End Restaurant Count 84% 88% 88% 91% 95% % Franchised Applebee's Franchise IHOP Franchise Company Operated |
|
|
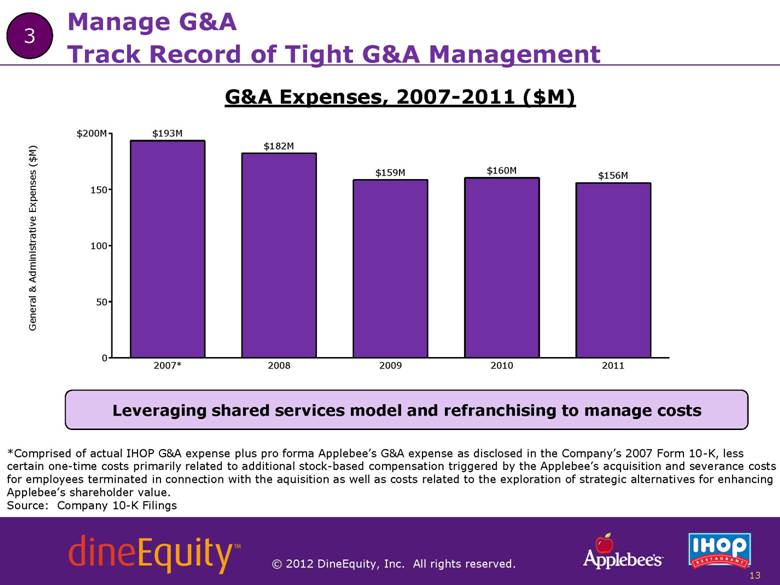
Track Record of Tight G&A Management 13 G&A Expenses, 2007-2011 ($M) *Comprised of actual IHOP G&A expense plus pro forma Applebee’s G&A expense as disclosed in the Company’s 2007 Form 10-K, less certain one-time costs primarily related to additional stock-based compensation triggered by the Applebee’s acquisition and severance costs for employees terminated in connection with the aquisition as well as costs related to the exploration of strategic alternatives for enhancing Applebee’s shareholder value. Source: Company 10-K Filings Manage G&A 3 Leveraging shared services model and refranchising to manage costs 0 50 100 150 $200M 2007* $193M 2008 $182M 2009 $159M 2010 $160M 2011 $156M General & Administrative Expenses ($M) |
|
|
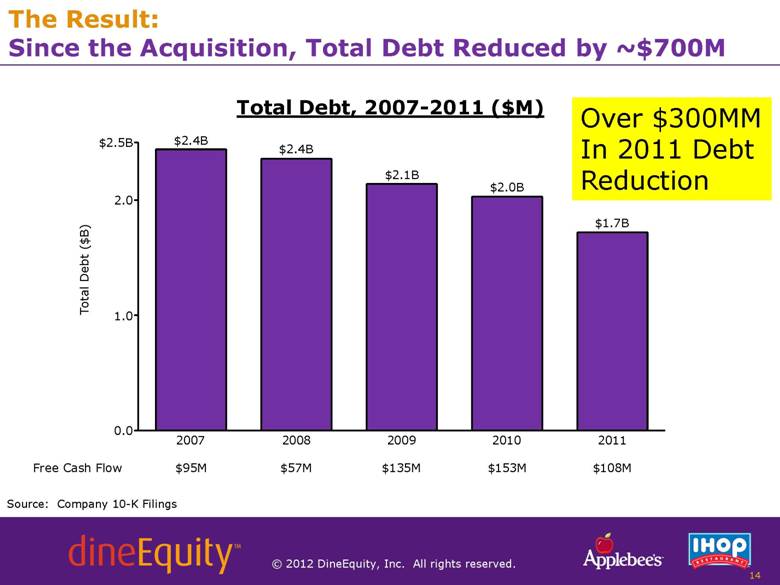
The Result: Since the Acquisition, Total Debt Reduced by ~$700M 14 Total Debt, 2007-2011 ($M) Source: Company 10-K Filings Over $300MM In 2011 Debt Reduction 0.0 1.0 2.0 $2.5B 2007 $2.4B 2008 $2.4B 2009 $2.1B 2010 $2.0B 2011 $1.7B Total Debt ($B) $95M $57M $135M $153M $108M Free Cash Flow |
|
|
Practical Benefit of Highly Franchised Business Model: Low Volatility 15 At high levels of refranchising, variations in same restaurant sales and margin have a comparatively minor impact on the bottom line Mitigates the pressures from commodity inflation When refranchising is complete, Company operations will be largely immaterial |
|
|
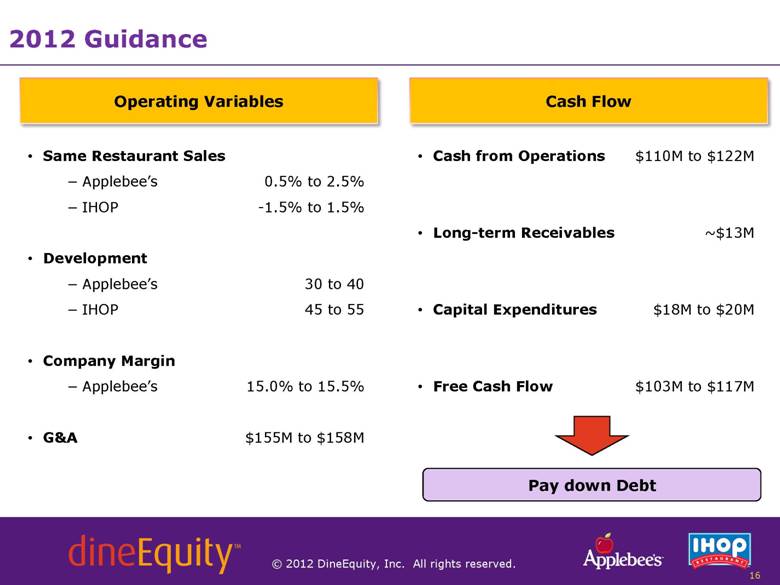
2012 Guidance 16 Operating Variables Cash Flow Same Restaurant Sales Applebee’s 0.5% to 2.5% IHOP -1.5% to 1.5% Development Applebee’s 30 to 40 IHOP 45 to 55 Company Margin Applebee’s 15.0% to 15.5% G&A $155M to $158M Cash from Operations $110M to $122M Long-term Receivables ~$13M Capital Expenditures $18M to $20M Free Cash Flow $103M to $117M Pay down Debt |
|
|
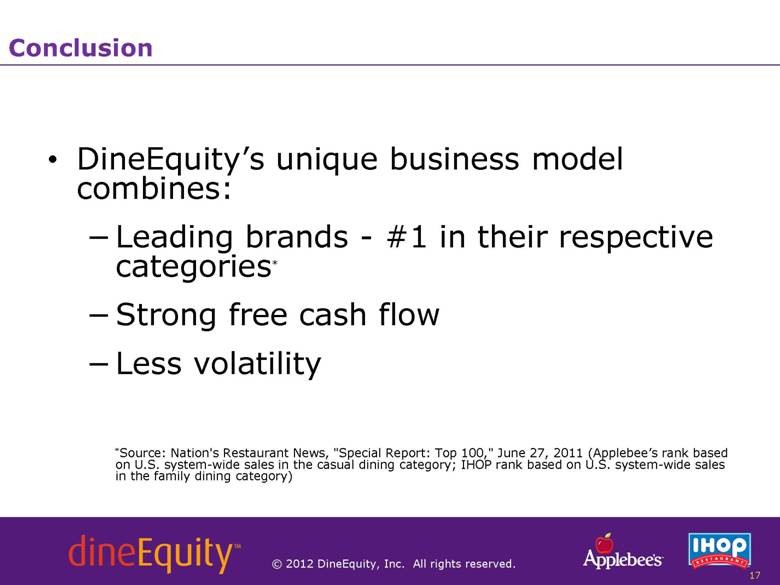
Conclusion 17 DineEquity’s unique business model combines: Leading brands - #1 in their respective categories* Strong free cash flow Less volatility *Source: Nation's Restaurant News, "Special Report: Top 100," June 27, 2011 (Applebee’s rank based on U.S. system-wide sales in the casual dining category; IHOP rank based on U.S. system-wide sales in the family dining category) |