Attached files
| file | filename |
|---|---|
| EX-3.5 - FORM OF CERTIFICATE - Demandware Inc | d199710dex35.htm |
| EX-23.1 - CONSENT OF DELOITTE & TOUCHE LLP - Demandware Inc | d199710dex231.htm |
| EX-10.17 - INDEMNIFICATION AGREEMENT - Demandware Inc | d199710dex1017.htm |
| EX-10.23 - 2012 EXECUTIVE INCENTIVE COMPENSATION PROGRAM - Demandware Inc | d199710dex1023.htm |
| EX-5.1 - OPINION OF WILMER CUTLER PICKERING HALE AND DORR LLP - Demandware Inc | d199710dex51.htm |
Table of Contents
As filed with the Securities and Exchange Commission on March 1, 2012
Registration No. 333-175595
UNITED STATES
SECURITIES AND EXCHANGE COMMISSION
Washington, D.C. 20549
Amendment No. 6
to
FORM S-1
REGISTRATION STATEMENT
UNDER
THE SECURITIES ACT OF 1933
DEMANDWARE, INC.
(Exact name of registrant as specified in its charter)
| Delaware | 7372 | 20-0982939 | ||
| (State or other jurisdiction of incorporation or organization) |
(Primary Standard Industrial Classification Code Number) |
(I.R.S. Employer Identification No.) |
5 Wall Street
Burlington, Massachusetts 01803
(888) 553-9216
(Address, including zip code, and telephone number, including area code, of registrant’s principal executive offices)
Thomas D. Ebling
President and Chief Executive Officer
Demandware, Inc.
5 Wall Street
Burlington, Massachusetts 01803
(888) 553-9216
(Name, address, including zip code, and telephone number, including area code, of agent for service)
Copies to:
| Mark G. Borden, Esq. Wilmer Cutler Pickering Hale and Dorr LLP 60 State Street Boston, Massachusetts 02109 Telephone: (617) 526-6000 Telecopy: (617) 526-5000 |
William J. Schnoor, Esq. Christopher J. Austin, Esq. Goodwin Procter LLP Exchange Place 53 State Street Boston, Massachusetts 02109 Telephone: (617) 570-1000 Telecopy: (617) 523-1231 |
Approximate date of commencement of proposed sale to the public: As soon as practicable after this Registration Statement is declared effective.
If any of the securities being registered on this form are to be offered on a delayed or continuous basis pursuant to Rule 415 under the Securities Act of 1933, check the following box. ¨
If this form is filed to register additional securities for an offering pursuant to Rule 462(b) under the Securities Act, check the following box and list the Securities Act registration statement number of the earlier effective registration statement for the same offering. ¨
If this form is a post-effective amendment filed pursuant to Rule 462(c) under the Securities Act, check the following box and list the Securities Act registration statement number of the earlier effective registration statement for the same offering. ¨
If this form is a post-effective amendment filed pursuant to Rule 462(d) under the Securities Act, check the following box and list the Securities Act registration statement number of the earlier effective registration statement for the same offering. ¨
Indicate by check mark whether the registrant is a large accelerated filer, an accelerated filer, a non-accelerated filer, or a smaller reporting company. See the definitions of “large accelerated filer,” “accelerated filer” and “smaller reporting company” in Rule 12b-2 of the Exchange Act.
| Large accelerated filer | ¨ | Accelerated filer | ¨ | |||
| Non-accelerated filer | þ (Do not check if a smaller reporting company) | Smaller reporting company | ¨ | |||
CALCULATION OF REGISTRATION FEE
| Title of Each Class of Securities To Be Registered |
Amount To Be Registered(1) |
Estimated Maximum Offering Price Per Share(2) |
Estimated Maximum Aggregate Offering Price(2) |
Amount of Registration Fee(3)(4) |
||||||||||||
| Common Stock, $0.01 par value per share |
6,325,000 | $ | 14.50 | $ | 91,712,500 | $ | 10,511 | |||||||||
| (1) | Includes 825,000 shares of common stock the underwriters have the option to purchase. |
| (2) | Estimated solely for the purpose of calculating the registration fee pursuant to Rule 457(a) under the Securities Act of 1933, as amended. |
| (3) | Calculated pursuant to Rule 457(a) based on a bona fide estimate of the maximum aggregate offering price. |
| (4) | A registration fee of $11,610 was previously paid in connection with the Registration Statement. Accordingly, no additional registration fee is due. |
The Registrant hereby amends this Registration Statement on such date or dates as may be necessary to delay its effective date until the Registrant shall file a further amendment which specifically states that this Registration Statement shall thereafter become effective in accordance with Section 8(a) of the Securities Act of 1933 or until the Registration Statement shall become effective on such date as the Commission, acting pursuant to said Section 8(a), may determine.
Table of Contents
The information in this preliminary prospectus is not complete and may be changed. We may not sell these securities until the registration statement filed with the Securities and Exchange Commission is effective. This prospectus is not an offer to sell these securities and it is not soliciting an offer to buy these securities in any jurisdiction where the offer or sale is not permitted.
PRELIMINARY PROSPECTUS
Subject to Completion. Dated March 1, 2012.
5,500,000 SHARES

DEMANDWARE, INC.
Common Stock
This is the initial public offering of Demandware, Inc. We are offering 5,500,000 shares of our common stock. Prior to this offering, there has been no public market for our common stock. We anticipate that the initial public offering price will be between $12.50 and $14.50 per share.
Our common stock has been approved for listing on the New York Stock Exchange under the symbol “DWRE”.
See “Risk Factors” beginning on page 9 to read about factors you should consider before buying shares of our common stock.
Neither the Securities and Exchange Commission nor any other regulatory body has approved or disapproved of these securities or passed upon the accuracy or adequacy of this prospectus. Any representation to the contrary is a criminal offense.
| Per Share | Total | |||||||
| Initial Public Offering Price |
$ | $ | ||||||
| Underwriting Discount |
$ | $ | ||||||
| Proceeds, before expenses, to Demandware, Inc. |
$ | $ | ||||||
To the extent that the underwriters sell more than 5,500,000 shares of common stock, the underwriters have the option to purchase from us up to an additional 825,000 shares at the initial public offering price less the underwriting discount.
The underwriters expect to deliver the shares against payment in New York, New York on or about , 2012.
| Goldman, Sachs & Co. |
Deutsche Bank Securities |
| William Blair & Company | Oppenheimer & Co. | Canaccord Genuity |
First Analysis Securities Corp.
Prospectus dated , 2012.
Table of Contents

Table of Contents
| Page | ||||
| 1 | ||||
| 9 | ||||
| 29 | ||||
| 30 | ||||
| 31 | ||||
| 31 | ||||
| 32 | ||||
| 34 | ||||
| 36 | ||||
| Management’s Discussion and Analysis of Financial Condition and Results of Operations |
37 | |||
| 65 | ||||
| 80 | ||||
| 87 | ||||
| 111 | ||||
| 115 | ||||
| 118 | ||||
| 121 | ||||
| Material U.S. Tax Considerations for Non-U.S. Holders of Common Stock |
124 | |||
| 128 | ||||
| 132 | ||||
| 132 | ||||
| 132 | ||||
| F-1 | ||||
We have not authorized anyone to provide any information or to make any representations other than those contained in this prospectus or in any free writing prospectuses we have prepared. We take no responsibility for, and can provide no assurance as to the reliability of, any other information that others may give you. This prospectus is an offer to sell only the shares offered hereby, but only under circumstances and in jurisdictions where it is lawful to do so. The information contained in this prospectus is current only as of its date regardless of the time of delivery of this prospectus or of any sale of our common stock.
This prospectus contains registered and unregistered trademarks and service marks of us and our subsidiaries, as well as trademarks and service marks of third parties. All brand names, trademarks and service marks appearing in this prospectus are the property of their respective holders.
For investors outside the United States: we have not and the underwriters have not done anything that would permit this offering or possession or distribution of this prospectus in any jurisdiction where action for that purpose is required, other than in the United States. Persons outside the United States who come into possession of this prospectus must inform themselves about, and observe any restrictions relating to, the offering of the shares of common stock and the distribution of this prospectus outside the United States.
Table of Contents
This summary highlights information contained elsewhere in this prospectus. This summary does not contain all of the information you should consider before investing in our common stock. You should read the following summary together with the more detailed information appearing in this prospectus, especially the “Risk Factors” section beginning on page 9 and our consolidated financial statements and related notes, before deciding whether to purchase shares of our common stock.
As used in this prospectus, unless the context otherwise requires, references to “we,” “us,” “our” and “Demandware” refer to the consolidated operations of Demandware, Inc. and its consolidated subsidiaries taken as a whole.
Demandware, Inc.
Overview
Demandware is a leading provider of software-as-a-service e-commerce solutions that enable companies to easily design, implement and manage their own customized e-commerce sites, including websites, mobile applications and other digital storefronts. Our customers use our highly scalable and integrated Demandware Commerce platform to create a seamless brand experience for consumers across all digital touch points worldwide. By simplifying access to the complex e-commerce functionality required for an effective and engaging consumer experience, we enable our customers to more easily launch and manage multiple e-commerce sites, initiate marketing campaigns more quickly and improve e-commerce site traffic, all of which can lead to increased revenue.
Through our on-demand software-as-a-service, or SaaS, platform, our customers run the latest version of our software and have access to a steady stream of new and innovative e-commerce functionality as soon as it becomes available. By using our platform, our customers avoid the need for a large upfront investment in on-premise hardware infrastructure and in customized software that is difficult and expensive to implement, upgrade and maintain. They also avoid the limitations of generic vendor-created e-commerce solutions that typically do not offer the flexibility and functionality necessary for merchants and retailers to create, manage and control their own customized online brand presence. Through our network of data centers, we continually monitor the environment in which our customers’ e-commerce sites operate for performance, availability and accuracy of content delivery.
From December 31, 2007 to December 31, 2011, the number of customers using our Demandware Commerce platform increased from 10 to 101, a 78.3% compound annual growth rate, or CAGR, and the number of e-commerce sites operating on our platform increased from 19 to 361, a 108.8% CAGR. Our customers include multinational corporations, large retailers and branded consumer product manufacturers, such as Barneys New York, Burton, Columbia Sportswear, Crocs, House of Fraser, Jewelry Television, Jones Apparel Group, Lifetime Brands, L’Oreal and neckermann.de. We have structured our customer contracts to align our interests with those of our customers by participating in a share of our customers’ gross revenue processed on our platform. We derive our subscription revenue from fees paid to us by our customers for their access to our e-commerce solutions during the term of our subscription contracts, which is typically three years and ranges from one year to seven years.
We generated revenue of $21.4 million, $36.7 million and $56.5 million in 2009, 2010 and 2011, respectively. We had a net loss of $10.4 million, net income of $0.3 million and a net loss of $1.4 million in 2009, 2010 and 2011, respectively.
1
Table of Contents
The Market
We believe our total addressable market is at the center of three large and growing industries: retail, e-commerce and SaaS. According to Euromonitor, the global retail industry in 2010 was $11.6 trillion, of which only 2.7% was conducted online. The overall global retail industry grew at a 4.8% CAGR from 2005 to 2010, while the global e-commerce market grew at a 17.3% CAGR over the same period to reach $316.5 billion in 2010 and is expected to grow to $653.0 billion in 2015, demonstrating the significant service shift from offline to online retail during this period and the increasing importance of e-commerce within the retail industry. In addition, the adoption of SaaS solutions has grown significantly, and, according to Gartner, estimated worldwide total software revenue for SaaS delivery within the enterprise application software markets is expected to grow at a CAGR of 17.9% from $10.0 billion in 2010 to $22.7 billion in 2015, and the adoption of cloud-enabled e-commerce platform services is expected to grow at a CAGR of 21.3% from $4.3 billion in 2010 to $11.3 billion in 2015.
While the e-commerce market is expanding, it is also becoming more complex, particularly for global multi-channel retailers and brands trying to reach consumers with consistent storefronts across multiple channels, geographies and digital touchpoints. Several trends are driving this increased complexity:
| Ÿ | Need to Maintain Scale and Global Presence. Companies that are unable to maintain the quality and functionality of their e-commerce sites as they expand and grow risk losing both existing and prospective consumers, domestically and internationally. |
| Ÿ | Increasing Consumer Demand for Compelling Content and Commerce. As the speed, functionality and sophistication of internet applications continue to improve, consumers increasingly expect a rich, interactive and personalized e-commerce experience, such as active merchandising, social commerce, dynamic product imaging and ratings and reviews. |
| Ÿ | Proliferation of Retail Channels. E-commerce is expanding beyond traditional web storefronts viewed on a personal computer due to the rapid proliferation of internet-enabled devices, including in-store kiosks, smart phones, tablets, and other devices, allowing consumers to access information and shop through an increasing number of digital retail channels. |
| Ÿ | Integration of Systems and Business Processes. Businesses have dramatically recast their online presence from static e-commerce sites focused mainly on presentation of basic product information or simple purchasing to dynamic, interactive hubs for consumer marketing, transactions, communications and services. Businesses require robust, scalable and global e-commerce solutions that can integrate with other enterprise solutions, such as enterprise resource planning, customer relationship management, order management, call centers, supply chain management and business intelligence systems. |
| Ÿ | Rapid Pace of Innovation. As the switching costs for consumers adopting the newest technologies remain low and new shopping models evolve, the pressure for companies to keep up with the pace of e-commerce innovation increases. |
Traditionally, there have been two common solutions for the creation and management of an e-commerce business: on-premise enterprise software, which is built, customized and maintained by the merchant itself; and outsourcing, where the entire e-commerce platform for a retailer or brand is outsourced to a third-party provider. While traditional on-premise enterprise software solutions offer the benefits of in-house control and differentiation through custom development, they typically have relatively high upfront costs and are difficult to maintain, upgrade and scale. While outsourcing an e-commerce site offers the benefits of minimal required resources for internal infrastructure management and ongoing support, it typically offers limited customization and flexibility and may not tightly integrate with the customer’s other business processes.
2
Table of Contents
A SaaS delivery model can combine the lower costs, speed of implementation and other operational benefits of outsourcing with the functionality, flexibility and customization capabilities of on-premise enterprise software solutions. As a result, the adoption of SaaS solutions across industries has grown significantly. We believe there is a significant opportunity in the e-commerce market for a company that can offer a comprehensive SaaS solution designed to address the increasingly complex requirements of retailers and brands seeking to attract and satisfy consumers in the digital world.
The Demandware Solution
Demandware Commerce combines enterprise-class e-commerce capabilities and functionality with a SaaS multi-tenant delivery model. We believe that our on-demand solutions provide the following benefits to our customers:
| Ÿ | Broad Merchandising Functionality. Our platform uses a web-based interface to provide one central location for our customers to control and manage their e-commerce sites—from products to pricing to placement to content. |
| Ÿ | High Reliability, Safety and Security. We provide high uptime, robust security and built-in disaster recovery through our network of state-of-the-art data centers. We have provided 99.98% average site availability (excluding planned downtime) since 2005. |
| Ÿ | Ease of Deployment and Reduced Time To Market. Using our Demandware Commerce platform, customers can easily deploy new e-commerce sites without the need to install or integrate their own hardware and software infrastructure. Through Demandware LINK, our online community of technology partners, customers can access an extensive library of integrations to third-party applications to expand the capabilities and functionality of their e-commerce sites. These features enable our existing customers to accelerate their time-to-market for new e-commerce sites and quickly implement new functionality. In addition, we believe that our typical four to six month platform implementation cycle for new customers is shorter than the period generally required for the development and deployment of comparable on-premise e-commerce software solutions. |
| Ÿ | Customizable E-Commerce Sites. Demandware Commerce allows our customers to quickly and easily customize and deliver a highly flexible digital storefront, using our powerful and intuitive tools based on procedural programming languages such as JavaScript. |
| Ÿ | Continuous Innovation. Through our SaaS platform, we are able to provide a steady stream of new and innovative e-commerce functionality through multiple product upgrades each year, which our customers can deploy with minimal or no effort to access the latest technologies on their e-commerce sites. |
Our Strategy
Our mission is to extend our position as a leading provider of SaaS e-commerce solutions and become the global backbone for digital commerce between retailers or branded consumer product manufacturers and their consumers. Key elements of our strategy include:
Retaining and Expanding Business with Existing Customers
| Ÿ | Increasing Customers’ Gross Revenue. We will continue to work with our customers to help grow their online revenue and optimize the effectiveness, engagement and performance of their e-commerce sites by taking full advantage of the functionality of our Demandware Commerce platform. |
3
Table of Contents
| Ÿ | Increasing the Number of Customers’ E-Commerce Sites. We will continue to assist our customers’ efforts to expand their e-commerce presence by launching additional distinct revenue-generating e-commerce sites for different geographies, brands and channels. |
| Ÿ | Extending the Platform Across Channels. We will continue to extend our Demandware Commerce platform to support established and emerging channels where consumers want to shop, including smart phones, social networks, call centers and in-store kiosks. |
Growing Our Customer Base
| Ÿ | Investing in Direct Sales. We plan to grow our enterprise direct sales team to win more customers domestically and internationally. |
| Ÿ | Significantly Growing Our European Operations. We intend to continue to grow our European operations by further investing in direct sales, strategic alliances, services and support in the region. |
| Ÿ | Expanding and Strengthening Our Strategic Alliances. We intend to continue to grow our distribution channels through key existing and new alliances. |
Targeting New Markets
| Ÿ | Small- and Medium-Sized Businesses. We are building a sales team to target small- and medium-sized retailers and emerging brands that are just starting to implement their e-commerce strategies and want to quickly scale their online business. |
| Ÿ | Asia Pacific. We expect to build sales and service operations in the Asia Pacific region. |
Continuing to Innovate and Add New Functionality to Our Platform
| Ÿ | Develop New Features. We plan to use our expertise in e-commerce to develop new applications, features and functionality that will enhance our platform and expand our addressable market. |
| Ÿ | Add Functionality Through Acquisitions or Partnerships. We also plan to add incremental functionality to our platform opportunistically through acquisitions and to invest in our Demandware LINK program by adding new partners and expanding our relationship with current partners so that our customers have access to a growing library of integrations to third-party applications. |
Risks That We Face
Our business is subject to a number of risks that you should consider carefully before deciding whether to invest in our common stock. These risks are described more fully in the “Risk Factors” section beginning on page 9 and elsewhere in this prospectus and include the following:
| Ÿ | we have had a history of losses, and we may be unable to achieve or sustain profitability; |
| Ÿ | we depend on a limited number of customers for a substantial portion of our revenue, and the loss of a key customer or the significant reduction of business from our largest customer could significantly reduce our revenue; |
| Ÿ | our customers are retailers and branded consumer product manufacturers that typically realize a significant portion of their online sales in the fourth quarter of each year, specifically during the holiday season. The seasonality of our business could create significant fluctuations in our quarterly revenue; |
4
Table of Contents
| Ÿ | we recognize revenue from customer subscriptions over the term of the subscription agreement and, therefore, a significant downturn in our business may not be immediately reflected in our operating results; |
| Ÿ | our business is substantially dependent upon the continued growth of the market for on-demand software solutions; and |
| Ÿ | if we fail to manage our SaaS hosting network infrastructure capacity, our existing customers may experience service outages and our new customers may experience delays in the deployment of our e-commerce solutions. |
Ownership of our Capital Stock
Upon the closing of this offering, our directors and executive officers and their affiliates will beneficially own, in the aggregate, approximately 12,717,891 shares of our common stock, or approximately 45.4% of our outstanding capital stock, assuming no exercise of the underwriters’ option to purchase additional shares of our common stock in this offering, and after giving effect to the 1-for-3 reverse split of our common stock effected on March 1, 2012 and the automatic conversion of all outstanding shares of our preferred stock into 18,028,763 shares of common stock upon the closing of this offering.
Our Corporate Information
We were incorporated in Delaware in February 2004 as SSE Holdings, Inc., and changed our name to Demandware, Inc. in August 2004. Our executive offices are located at 5 Wall Street, Burlington, Massachusetts 01803 and our telephone number is (888) 553-9216. Our website address is www.demandware.com. The information on, or that can be accessed through, our website does not constitute part of this prospectus, and you should not rely on any such information in making the decision whether to purchase our common stock.
5
Table of Contents
THE OFFERING
| Common stock offered by Demandware, Inc. |
5,500,000 shares |
| Common stock to be outstanding after this offering |
27,997,970 shares |
| Option to purchase additional shares offered to underwriters |
The underwriters have an option to purchase a maximum of 825,000 additional shares from us. The underwriters can exercise this option at any time within 30 days from the date of this prospectus. |
| Use of proceeds |
We intend to use the net proceeds to us from this offering for financing our growth, working capital and other general corporate purposes. See “Use of Proceeds” for more information. |
| Risk Factors |
You should read carefully the section entitled “Risk Factors” for a discussion of factors that you should consider before deciding to invest in shares of our common stock. |
| New York Stock Exchange symbol |
“DWRE” |
The number of shares of our common stock to be outstanding after this offering is based on the number of shares of our common stock outstanding as of December 31, 2011 and excludes:
| Ÿ | 4,024,477 shares of common stock issuable upon exercise of stock options outstanding as of December 31, 2011, at a weighted average exercise price of $1.92 per share; |
| Ÿ | 220,968 shares of common stock reserved as of December 31, 2011 for future issuance under our equity incentive plans; and |
| Ÿ | 23,092 shares of common stock issuable upon exercise of a warrant outstanding as of December 31, 2011, at an exercise price of $3.90 per share. |
On February 9, 2012, our board of directors approved a 1-for-3 reverse split of our common stock. The reverse stock split became effective on March 1, 2012. Upon the effectiveness of the reverse stock split (i) every three shares of outstanding common stock was decreased to one share of common stock, (ii) the number of shares of common stock into which each outstanding option to purchase common stock is exercisable was proportionally decreased, (iii) the exercise price of each outstanding option to purchase common stock was proportionately increased, and (iv) the conversion ratio for each share of preferred stock outstanding was proportionately reduced. Unless otherwise indicated, all share numbers, share prices and exercise prices in this prospectus have been adjusted, on a retroactive basis, to reflect this 1-for-3 reverse stock split.
Unless otherwise indicated, this prospectus reflects and assumes the following:
| Ÿ | the conversion of all outstanding shares of our preferred stock into 18,028,763 shares of our common stock, which will occur automatically upon the closing of the offering; |
| Ÿ | the filing of our amended and restated certificate of incorporation and the adoption of our amended and restated by-laws upon the closing of this offering; |
| Ÿ | no exercise by the underwriters of their option to purchase additional shares; and |
| Ÿ | no exercise of outstanding stock options or warrants. |
6
Table of Contents
SUMMARY CONSOLIDATED FINANCIAL DATA
The following table presents our summary consolidated financials and other data for our business for the periods indicated. The summary consolidated statements of operations data presented below for the years ended December 31, 2009, 2010 and 2011 has been derived from our audited financial statements appearing elsewhere in this prospectus. Our historical results are not necessarily indicative of the results to be expected in the future. You should read this summary consolidated financial data in conjunction with “Management’s Discussion and Analysis of Financial Condition and Results of Operations” and our consolidated financial statements and related notes, all included elsewhere in this prospectus.
| Year Ended December 31, | ||||||||||||
| 2009 | 2010 | 2011 | ||||||||||
| (in thousands, except per share data) |
||||||||||||
| Consolidated Statements of Operations Data: |
||||||||||||
| Revenue: |
||||||||||||
| Subscription |
$ | 16,085 | $ | 28,714 | $ | 47,219 | ||||||
| Services |
5,312 | 7,976 | 9,328 | |||||||||
|
|
|
|
|
|
|
|||||||
| Total revenue |
21,397 | 36,690 | 56,547 | |||||||||
| Cost of revenue: |
||||||||||||
| Subscription |
3,964 | 6,222 | 9,511 | |||||||||
| Services |
11,533 | 8,282 | 10,196 | |||||||||
|
|
|
|
|
|
|
|||||||
| Total cost of revenue |
15,497 | 14,504 | 19,707 | |||||||||
|
|
|
|
|
|
|
|||||||
| Gross profit |
5,900 | 22,186 | 36,840 | |||||||||
| Operating expenses: |
||||||||||||
| Sales and marketing |
7,304 | 10,883 | 19,847 | |||||||||
| Research and development |
4,950 | 6,091 | 11,182 | |||||||||
| General and administrative |
3,729 | 4,179 | 6,567 | |||||||||
|
|
|
|
|
|
|
|||||||
| Total operating expenses |
15,983 | 21,153 | 37,596 | |||||||||
|
|
|
|
|
|
|
|||||||
| (Loss) income from operations |
(10,083 | ) | 1,033 | (756 | ) | |||||||
| Other (expense) income, net |
(239 | ) | (582 | ) | (443 | ) | ||||||
|
|
|
|
|
|
|
|||||||
| (Loss) income before income taxes |
(10,322 | ) | 451 | (1,199 | ) | |||||||
| Income tax expense |
55 | 142 | 212 | |||||||||
|
|
|
|
|
|
|
|||||||
| Net (loss) income |
(10,377 | ) | 309 | (1,411 | ) | |||||||
| Accretion of redeemable preferred stock |
(4,322 | ) | (5,106 | ) | (5,274 | ) | ||||||
|
|
|
|
|
|
|
|||||||
| Net loss attributable to common stockholders |
$ | (14,699 | ) | $ | (4,797 | ) | $ | (6,685 | ) | |||
|
|
|
|
|
|
|
|||||||
| Net loss per share attributable to common stockholders, basic and diluted |
$ | (7.83 | ) | $ | (2.44 | ) | $ | (1.75 | ) | |||
|
|
|
|
|
|
|
|||||||
| Weighted average common shares outstanding, basic and diluted |
1,878 | 1,967 | 3,823 | |||||||||
|
|
|
|
|
|
|
|||||||
| Pro forma net loss per share attributable to common stockholders, basic and diluted |
$ | (0.06 | ) | |||||||||
|
|
|
|||||||||||
| Pro forma weighted average common shares outstanding, basic and diluted |
21,851 | |||||||||||
|
|
|
|||||||||||
7
Table of Contents
| As of December 31, 2011 | ||||||||||||
| Actual | Pro Forma(1) | Pro Forma As Adjusted(2) |
||||||||||
| (unaudited) | ||||||||||||
| (in thousands) | ||||||||||||
| Consolidated Balance Sheet Data: |
||||||||||||
| Cash and cash equivalents |
$ | 14,939 | $ | 14,939 | $ | 80,459 | ||||||
| Working capital |
8,725 | 8,725 | 74,245 | |||||||||
| Total assets |
42,886 | 42,886 | 108,406 | |||||||||
| Notes payable |
1,882 | 1,882 | 1,882 | |||||||||
| Total preferred stock |
87,603 | — | — | |||||||||
| Total stockholders’ (deficit) equity |
(84,620 | ) | 2,983 | 68,503 | ||||||||
| (1) | The pro forma balance sheet data give effect to the conversion of all outstanding shares of our preferred stock into an aggregate of 18,028,763 shares of common stock upon the closing of this offering. |
| (2) | The pro forma as adjusted balance sheet data also give effect to our issuance and sale of 5,500,000 shares of common stock in this offering at an assumed initial public offering price of $13.50 per share, the midpoint of the price range listed on the cover page of this prospectus, after deducting the estimated underwriting discounts and commissions and estimated offering expenses payable by us. |
A $1.00 increase (decrease) in the assumed initial public offering price of $13.50 per share, which is the midpoint of the range listed on the cover page of this prospectus, would increase (decrease) the pro forma as adjusted amount of each of cash and cash equivalents, working capital, total assets and total stockholders’ equity by approximately $5.1 million, assuming that the number of shares offered by us, as set forth on the cover page of this prospectus, remains the same and after deducting estimated underwriting discounts and commissions and estimated offering expenses payable by us.
8
Table of Contents
Investing in our common stock involves a high degree of risk. You should carefully consider the risks and uncertainties described below, together with all of the other information included in this prospectus, including our financial statements and the related notes appearing at the end of this prospectus, before deciding to invest in our common stock. Our business, financial condition, results of operations and future growth prospects could be materially and adversely affected by any of these risks or uncertainties. In that case, the trading price of our common stock could decline, and you may lose all or part of your investment.
Risks Related to Our Business and Our Industry
We have had a history of losses, and we may be unable to achieve or sustain profitability.
We have experienced net losses in each year since our inception, except for the year ended December 31, 2010. We experienced a net loss of $10.4 million for the year ended December 31, 2009, net income of $0.3 million for the year ended December 31, 2010 and a net loss of $1.4 million for the year ended December 31, 2011. We cannot predict if we will achieve sustained profitability in the near future or at all. We expect to make significant future expenditures to develop and expand our business. In addition, as a public company we will incur significant legal, accounting and other expenses that we did not incur as a private company. These increased expenditures will make it harder for us to achieve and maintain future profitability. Our recent growth in revenue and number of customers may not be sustainable, and we may not achieve sufficient revenue to achieve or maintain profitability. We may incur significant losses in the future for a number of reasons, including the other risks described in this prospectus, and we may encounter unforeseen expenses, difficulties, complications and delays and other unknown events. Accordingly, we may not be able to achieve or maintain profitability and we may incur significant losses for the foreseeable future.
Our limited operating history makes it difficult to evaluate our current business and future prospects.
We have been in existence since 2004, and much of our growth has occurred in recent periods. Our limited operating history may make it difficult for you to evaluate our current business and our future prospects. We have encountered and will continue to encounter risks and difficulties frequently experienced by growing companies in rapidly changing industries, including increasing and unforeseen expenses as we continue to grow our business. If we do not manage these risks successfully, our business will be harmed.
We depend on a limited number of customers for a substantial portion of our revenue. The loss of a key customer or the significant reduction of business from our largest customer could significantly reduce our revenue.
We have derived, and we believe that we will continue to derive, a substantial portion of our revenue from a limited number of customers. For example, for the year ended December 31, 2011, our largest ten customers by revenue accounted for an aggregate of approximately 40% of our revenue, and our largest customer by revenue, neckermann.de, accounted for 16% of our revenue. While the percentage of our revenue from neckermann.de is trending down, if we were to lose neckermann.de or one or more of our other key customers, there is no assurance that we would be able to replace such customers with new customers that generate comparable revenue, which would adversely affect our financial condition and results of operations. Our operating results for the foreseeable future will continue to depend on our ability to sell our e-commerce solutions to a small number of customers. Any revenue growth will depend on our success in growing our customers’ online revenue processed on our platform and expanding our customer base to include additional customers.
9
Table of Contents
The seasonality of our business creates significant variance in our quarterly revenue.
Our customers are retailers and branded consumer product manufacturers that typically realize a significant portion of their online sales in the fourth quarter of each year, specifically during the holiday season. As a result of this seasonal variation, our subscription revenue fluctuates, with additional fees in excess of committed annual levels, called overage fees, being higher in the fourth quarter than in other quarters and with revenue generally declining in the first quarter sequentially from the fourth quarter.
We recognize revenue from customer subscriptions over the term of the subscription agreement and, therefore, a significant downturn in our business may not be immediately reflected in our operating results.
We recognize revenue from subscription agreements monthly over the terms of these agreements, which is typically three years. As a result, a significant portion of the revenue we report in each quarter is generated from customer agreements entered into during previous periods. Consequently, a decline in new or renewed subscriptions in any one quarter may not impact our financial performance in that quarter, but might negatively affect our revenue in future quarters. If a number of contracts expire and are not renewed in the same quarter, our revenue may decline significantly in that quarter and subsequent quarters. In addition, we may be unable to adjust our fixed costs in response to reduced revenue. Accordingly, the effect of significant declines in sales and market acceptance of our solutions may not be reflected in our short-term results of operations.
Our business is substantially dependent upon the continued growth of the market for on-demand software solutions.
We derive, and expect to continue to derive, substantially all of our revenue from the sale of our on-demand e-commerce solutions. As a result, widespread acceptance and use of the on-demand business model is critical to our future growth and success. Under the perpetual or periodic license model for software procurement, users of the software would typically run the applications on their hardware. Because many companies are generally predisposed to maintaining control of their information technology, or IT, systems and infrastructure, there may be resistance to the concept of accessing software functionality as a service provided by a third party. In addition, the market for on-demand software solutions is still evolving, and competitive dynamics may cause pricing levels to change, as the market matures and as existing and new market participants introduce new types of solutions and different approaches to enable organizations to address their e-commerce needs. As a result, we may be forced to reduce the prices we charge for our solutions and may be unable to renew existing customer agreements or enter into new customer agreements at the same prices and upon the same terms that we have historically. If the market for on-demand software solutions fails to grow, grows more slowly than we currently anticipate or evolves and forces us to reduce the prices we charge for our solutions, demand for our solutions and our revenue, gross margin and other operating results could be materially adversely affected.
We rely on a variable pricing model and any change in that model could adversely affect our financial results.
We have adopted a variable pricing model whereby we participate in a share of our customers’ gross revenue processed on our platform. This pricing model aligns our interests with those of our customers and reflects the need for us to expand our own processing and support infrastructure as activity on our customers’ e-commerce sites increases. All of our customer contracts are based on a variable pricing model. If customers were to demand a fixed pricing model that did not provide for variability based on their level of usage of our platform, our financial results could be adversely affected.
10
Table of Contents
Our lengthy sales and implementation cycles make it difficult to predict our future revenue and causes variability in our operating results.
Our sales cycle can vary substantially from customer to customer, but typically requires six to nine months depending on the size and complexity of the opportunity. From the time a new contract is signed, four to six months are typically required to implement and launch an e-commerce site for a new customer. A number of factors influence the length and variability of our sales and implementation cycles, including, for example:
| Ÿ | the need to educate potential customers about the uses and benefits of our solutions; |
| Ÿ | the relatively long duration of the commitment customers make in their agreements with us; |
| Ÿ | the discretionary nature of potential customers’ purchasing and budget cycles and decisions; |
| Ÿ | the competitive nature of potential customers’ evaluation and purchasing processes; |
| Ÿ | evolving e-commerce needs and functionality demands of potential customers; |
| Ÿ | announcements or planned introductions of new products by us or our competitors; and |
| Ÿ | lengthy purchasing approval processes of potential customers. |
Lengthy sales and implementation cycles make it difficult to predict the quarter in which revenue from a new customer may first be recognized. We may incur significant sales and marketing expenses in anticipation of selling our products, and if we do not achieve the level of revenue we expected, our operating results will suffer and our stock price may decline. Further, our potential customers frequently need to obtain approvals from multiple decision makers before making purchase decisions. Delays in our sales or implementation cycles could cause significant variability in our revenue and operating results for any particular period.
If we are unable to retain our existing customers, our revenue and results of operations would be adversely affected.
We sell our solutions pursuant to agreements that are generally three years in duration. Our customers have no obligation to renew their subscriptions after their subscription period expires, and these subscriptions may not be renewed on the same or on more profitable terms. As a result, our ability to grow depends in part on subscription renewals. We may not be able to accurately predict future trends in customer renewals, and our customers’ renewal rates may decline or fluctuate because of several factors, including their satisfaction or dissatisfaction with our services, the cost of our services and the cost of services offered by our competitors or reductions in our customers’ spending levels. If our customers do not renew their subscriptions for our services, renew on less favorable terms or do not purchase additional functionality or subscriptions, our revenue may grow more slowly than expected or decline, and our profitability and gross margins may be harmed.
Security and privacy breaches may hurt our business.
Any security breaches, unauthorized access, unauthorized usage, virus or similar breach or disruption could result in loss of confidential information, damage to our reputation, early termination of our contracts, litigation, regulatory investigations or other liabilities. If our, our customers’ or our partners’ security measures are breached as a result of third-party action, employee error, malfeasance or otherwise and, as a result, someone obtains unauthorized access to customer data, our reputation will be damaged, our business may suffer and we could incur significant liability.
Techniques used to obtain unauthorized access or to sabotage systems change frequently and generally are not recognized until launched against a target. As a result, we may be unable to anticipate these techniques or to implement adequate preventative measures. If an actual or perceived
11
Table of Contents
security breach occurs, the market perception of our security measures could be harmed and we could lose sales and customers. Any significant violations of data privacy could result in the loss of business, litigation and regulatory investigations and penalties that could damage our reputation and adversely impact our results of operations and financial condition. Moreover, if a high profile security breach occurs with respect to another software-as-a-service, or SaaS, provider, our customers and potential customers may lose trust in the security of the SaaS business model generally, which could adversely impact our ability to retain existing customers or attract new ones.
Our business and operations have experienced rapid growth and organizational change in recent periods, which has placed, and may continue to place, significant demands on our management and infrastructure. If we fail to manage our growth effectively, we may be unable to execute our business plan, maintain high levels of service or address competitive challenges adequately.
We increased our number of full-time employees from 104 as of December 31, 2009, to 150 as of December 31, 2010 and to 215 as of December 31, 2011, and our revenue grew from $21.4 million in 2009 to $36.7 million in 2010 and to $56.5 million in 2011. Our growth has placed, and may continue to place, a significant strain on our managerial, administrative, operational, financial and other resources. We intend to further expand our overall business, customer base, headcount and operations both domestically and internationally, with no assurance that our business or revenue will continue to grow. Creating a global organization and managing a geographically dispersed workforce will require substantial management effort, the allocation of valuable management resources and significant additional investment in our infrastructure. We will be required to continue to improve our operational, financial and management controls and our reporting procedures and we may not be able to do so effectively. As such, we may be unable to manage our expenses effectively in the future, which may negatively impact our gross margins or operating expenses in any particular quarter. If we fail to manage our anticipated growth and change in a manner that preserves the key aspects of our corporate culture, the quality of our solutions may suffer, which could negatively affect our brand and reputation and harm our ability to retain and attract customers.
Failure to effectively maintain and expand our direct sales teams and develop and expand our indirect sales channel will impede our growth.
We will need to continue to expand our sales and marketing infrastructure in order to grow our customer base and our business. Identifying, recruiting and training these sales and marketing personnel will require significant time, expense and attention. Our business will be seriously harmed and our financial resources will be wasted if our efforts to expand our direct and indirect sales channels do not generate a corresponding increase in revenue. In particular, if we are unable to hire, develop and retain talented sales personnel or if our new direct sales personnel are unable to achieve expected productivity levels in a reasonable period of time, we may not be able to significantly increase our revenue and grow our business.
The global recession and related credit crisis may continue to adversely affect our business and results of operations.
The U.S. and other global economies have experienced a recession that has affected all sectors of the economy, resulting in declines in economic growth and consumer confidence, increases in unemployment rates and uncertainty about economic stability. Global credit and financial markets have also experienced extreme disruptions, including diminished liquidity and credit availability and rapid fluctuations in market valuations. Our business has been affected by these conditions, and there is no certainty that economic conditions will not deteriorate further. These uncertainties may affect our business in a number of ways, making it difficult to accurately forecast and plan our future business
12
Table of Contents
activities. Weak economic conditions may lead consumers and retailers to postpone spending, which may cause our customers to decrease or delay their purchases of our solutions. In addition, the inability of consumers to obtain credit could negatively affect our revenue. Financial difficulties experienced by third parties with whom we have entered relationships and upon whom we depend in order to grow our business could detract from the quality or timeliness of the products or professional services they provide to us, which could adversely affect our reputation and relationships with our customers.
If the current uncertain economic conditions continue or further deteriorate, we could be required to record charges relating to restructuring costs or the impairment of assets, and our business and results of operations could be materially adversely affected.
We are dependent upon consumers’ willingness to use the internet for commerce.
Our success depends upon the general public’s continued willingness to use the internet as a means to purchase goods, communicate, and conduct and research commercial transactions. If consumers became unwilling or less willing to use the internet for commerce for any reason, including lack of access to high-speed communications equipment, congestion of traffic on the internet, internet outages or delays, disruptions or other damage to users’ computers, increases in the cost of accessing the internet and security and privacy risks or the perception of such risks, our business could be materially adversely affected.
Even if demand for e-commerce products and services increases generally, there is no guarantee that demand for SaaS solutions like ours will increase to a corresponding degree.
For our customers and potential customers to be willing to invest in our e-commerce solutions, the internet must continue to be accepted and widely used for commerce and communication. If e-commerce does not grow or grows more slowly than expected, then our future revenue and profits may not meet our expectations or those of analysts. The widespread adoption of our solutions depends not only on strong demand for e-commerce products and services generally, but also for products and services delivered via a SaaS business model in particular. Many companies continue to rely primarily or exclusively on traditional means of commerce that are not internet-based and may be reluctant to change their patterns of commerce. Even if such companies do adopt e-commerce solutions, it is unclear whether they will desire e-commerce solutions like ours. As a result, we cannot assure you that our SaaS e-commerce solutions will achieve and sustain the high level of market acceptance that is critical for the future success of our business.
If we fail to manage our SaaS hosting network infrastructure capacity, our existing customers may experience service outages and our new customers may experience delays in the deployment of our e-commerce solutions.
We have experienced significant growth in the number of users, transactions and data that our hosting infrastructure supports. We seek to maintain sufficient excess capacity in our SaaS hosting network infrastructure to meet the needs of all of our customers. We also seek to maintain excess capacity to facilitate the rapid provision of new customer deployments and the expansion of existing customer deployments. However, the provision of new hosting infrastructure requires significant lead time. If we do not accurately predict our infrastructure capacity requirements, particularly in the fourth quarter when we might experience significant increases in traffic on our customers’ e-commerce sites, our customers could experience service outages that may subject us to financial penalties and financial liabilities and result in customer losses. If our hosting infrastructure capacity fails to keep pace with increased sales, customers may experience delays as we seek to obtain additional capacity, which could harm our reputation and adversely affect our revenue growth.
13
Table of Contents
If we fail to develop our brand cost-effectively, our business may suffer.
We believe that developing and maintaining awareness of our brand in a cost-effective manner is critical to achieving widespread acceptance of our existing and future solutions and is an important element in attracting new customers. Furthermore, we believe that the importance of brand recognition will increase as competition in our market increases. Successful promotion of our brand will depend largely on the effectiveness of our marketing efforts and on our ability to provide reliable and useful services at competitive prices. In the past, our efforts to build our brand have involved significant expenses. Brand promotion activities may not yield increased revenue, and even if they do, any increased revenue may not offset the expenses we incurred in building our brand. If we fail to successfully promote and maintain our brand, or incur substantial expenses in an unsuccessful attempt to promote and maintain our brand, we may fail to attract enough new customers or retain our existing customers to the extent necessary to realize a sufficient return on our brand-building efforts, and our business could suffer.
We may not be able to compete successfully against current and future competitors.
We face intense competition in the market for e-commerce applications and services, and we expect competition to intensify in the future. We have competitors with longer operating histories, larger customer bases and greater financial, technical, marketing and other resources than we do. Increased competition may result in reduced pricing for our solutions, longer sales cycles or a decrease of our market share, any of which could negatively affect our revenue and future operating results and our ability to grow our business.
A number of competitive factors could cause us to lose potential sales or to sell our solutions at lower prices or at reduced margins, including, among others:
| Ÿ | Potential customers may choose to develop e-commerce applications in-house, rather than paying for our solutions; |
| Ÿ | Some of our current and potential competitors have greater financial, marketing and technical resources than we do, allowing them to leverage a larger installed customer base and distribution network, adopt more aggressive pricing policies and offer more attractive sales terms, adapt more quickly to new technologies and changes in customer requirements, and devote greater resources to the promotion and sale of their products and services than we can; |
| Ÿ | Current and potential competitors have established or may establish cooperative relationships among themselves or with third parties to enhance their products and expand their markets, and consolidation in our industry is likely to intensify. Accordingly, new competitors or alliances among competitors may emerge and rapidly acquire significant market share; |
| Ÿ | Current and potential competitors may offer software that addresses one, or a limited number, of e-commerce functions at a lower price point or with greater depth than our solutions; and |
| Ÿ | Software vendors could bundle e-commerce solutions or offer such products at a lower price as part of a larger product sale. |
We cannot assure you that we will be able to compete successfully against current and future competitors. In addition, competition may intensify as our competitors enter into business combinations or alliances or raise additional capital and established companies in other market segments or geographic markets expand into our market segments or geographic markets. If we cannot compete successfully against our competitors, our business, results of operations and financial condition could be negatively impacted.
14
Table of Contents
Mergers of or other strategic transactions by our competitors or our customers could weaken our competitive position or reduce our revenue.
If one or more of our competitors were to merge or partner with another of our competitors, the change in the competitive landscape could adversely affect our ability to compete effectively. Our competitors may also establish or strengthen cooperative relationships with our current or future strategic distributors, systems integrators, third-party consulting firms or other parties with whom we have relationships, thereby limiting our ability to promote our solutions and limiting the number of consultants available to implement our solutions. In addition, we may lose customers that merge with or are acquired by companies using a competitor’s or an internally developed solution. Disruptions in our business caused by these events could reduce our revenue.
Our growth depends in part on the success of our strategic relationships with third parties.
We anticipate that we will continue to depend on various third-party relationships in order to grow our business. In addition to growing our indirect sales channels, we intend to pursue additional relationships with other third parties, such as technology and content providers and implementation consultants. Identifying, negotiating and documenting relationships with third parties require significant time and resources as does integrating third-party content and technology. Some of the third parties that sell our solutions have the direct contractual relationships with our ultimate end-user customers, and therefore we risk the loss of such customers if the third parties fail to perform their obligations. Our agreements with distributors and providers of technology, content and consulting services are typically non-exclusive, do not prohibit them from working with our competitors or from offering competing services and may not have minimum purchase commitments. Our competitors may be effective in providing incentives to third parties to favor their products or services or to prevent or reduce subscriptions to our solutions. In addition, these distributors and providers may not perform as expected under our agreements, and we have had, and may in the future have, disagreements or disputes with such distributors and providers, which could negatively affect our brand and reputation. A global economic slowdown could also adversely affect the businesses of our distributors, and it is possible that they may not be able to devote the resources we expect to the relationship.
If we are unsuccessful in establishing or maintaining our relationships with these third parties, specifically with eCommera, NETRADA and PFSweb, our ability to compete in the marketplace or to grow our revenue could be impaired and our operating results would suffer. Even if we are successful, we cannot assure you that these relationships will result in improved operating results.
We could incur substantial costs as a result of any claim of infringement of another party’s intellectual property rights.
In recent years, there has been significant litigation in the United States involving patents and other intellectual property rights. Companies providing internet-related products and services are increasingly bringing and becoming subject to suits alleging infringement of proprietary rights, particularly patent rights. These risks have been amplified by the increase in third parties, which we refer to as non-practicing entities, whose sole primary business is to assert such claims. We could incur substantial costs in prosecuting or defending any intellectual property litigation. If we sue to enforce our rights or are sued by a third party that claims that our technology infringes its rights, the litigation could be expensive and could divert our management resources.
In addition, in most instances, we have agreed to indemnify our customers against certain claims that our products infringe the intellectual property rights of third parties. We have received indemnification requests from many customers that have received letters from, or been sued by, non-practicing entities claiming infringement of patents owned by them. Most of those underlying claims, and the extent, if any, of our indemnification obligations, have not yet been resolved. Some of these patents are the subject of pending legal proceedings between the patent owners and one or more
15
Table of Contents
major companies engaged in e-commerce, and the outcome of those proceedings could affect the extent to which the patent owners seek to prosecute claims against us or our customers. Also, because the patent owners have asserted the same patents against multiple customers, an adverse resolution in the case of one customer could lead to adverse resolutions in the cases of other customers and such claims could potentially lead to greater exposure for us than for any single customer. Our business could be adversely affected by any significant disputes between us and our customers as to the applicability or scope of our indemnification obligations to them. The results of any intellectual property litigation to which we might become a party, or for which we are required to provide indemnification, may require us to do one or more of the following:
| Ÿ | cease selling or using products or services that incorporate the challenged intellectual property; |
| Ÿ | make substantial payments for legal fees, settlement payments or other costs or damages; |
| Ÿ | obtain a license, which may not be available on reasonable terms, to sell or use the relevant technology; or |
| Ÿ | redesign those products or services to avoid infringement. |
If we are required to make substantial payments or undertake any of the other actions noted above as a result of any intellectual property infringement claims against us or any obligation to indemnify our customers for such claims, such payments or costs could have a material adverse effect upon our business and financial results.
We could incur substantial costs in protecting our intellectual property from infringement, and any failure to protect our intellectual property could impair our business.
We seek to protect the source code for our proprietary software under a combination of patent, copyright and trade secrets law. However, because we make some of the source code available to some customers, third parties may be more likely to misappropriate it. Our policy is to enter into confidentiality agreements with our employees, consultants, vendors and customers and to control access to our software, documentation and other proprietary information. Despite these precautions, it may be possible for someone to copy our software or other proprietary information without authorization or to develop similar software independently.
Despite our efforts to protect our proprietary rights, unauthorized parties may attempt to copy aspects of our products or to obtain and use information that we regard as proprietary. Policing unauthorized use of our products is difficult, and while we are unable to determine the extent to which piracy of our software exists, we expect software piracy to be a persistent problem. Litigation may be necessary in the future to enforce our intellectual property rights, to protect our trade secrets, to determine the validity and scope of the proprietary rights of others or to defend against claims of infringement or invalidity. Such litigation could be costly, time-consuming and distracting to management, result in a diversion of resources, the impairment or loss of portions of our intellectual property and have a material adverse effect on our business, operating results and financial condition. Furthermore, our efforts to enforce our intellectual property rights may be met with defenses, counterclaims and countersuits attacking the validity and enforceability of our intellectual property rights. These steps may be inadequate to protect our intellectual property. We will not be able to protect our intellectual property if we are unable to enforce our rights or if we do not detect unauthorized use of our intellectual property. Despite our precautions, it may be possible for unauthorized third parties to copy our products and use information that we regard as proprietary to create products and services that compete with ours. Some license provisions protecting against unauthorized use, copying, transfer and disclosure of our licensed products may be unenforceable under the laws of certain jurisdictions and foreign countries. Further, the laws of some countries do not protect proprietary rights to the same extent as the laws of the United States. To the extent we expand our international activities, our exposure to unauthorized copying and use of our products and proprietary information may increase.
16
Table of Contents
There can be no assurance that our means of protecting our proprietary rights will be adequate or that our competitors will not independently develop similar technology. If we fail to meaningfully protect our intellectual property, then our business, brand, operating results and financial condition could be materially harmed.
If our software products contain serious errors or defects, then we may lose revenue and market acceptance and may incur costs to defend or settle product liability claims.
Complex software applications such as ours often contain errors or defects, particularly when first introduced or when new versions or enhancements are released. Despite internal testing and testing by our customers, our current and future products may contain serious defects, which could result in lost revenue or a delay in market acceptance.
Since our customers use our products for critical business applications, such as e-commerce, errors, defects or other performance problems could result in damage to our customers. They could seek significant compensation from us for the losses they suffer. Although our customer agreements typically contain provisions designed to limit our exposure to product liability claims, existing or future laws or unfavorable judicial decisions could negate these limitations. Even if not successful, a product liability claim brought against us would likely be time-consuming and costly and could seriously damage our reputation in the marketplace, making it harder for us to sell our products.
Government and industry regulation of the internet is evolving and could directly restrict our business or indirectly affect our business by limiting the growth of e-commerce. Unfavorable changes in government regulation or our failure to comply with regulations could harm our business and operating results.
As e-commerce evolves, federal, state and foreign agencies have adopted and could in the future adopt regulations covering issues such as user privacy, content, and taxation of products and services. Government regulations could limit the market for our products and services or impose burdensome requirements that render our business unprofitable. Our e-commerce solutions enable our customers to collect, manage and store a wide range of consumer data. The United States and various state governments have adopted or proposed limitations on the collection, distribution and use of personal information. Several foreign jurisdictions, including the European Union and the United Kingdom, have adopted legislation (including directives or regulations) that increase or change the requirements governing data collection and storage in these jurisdictions. If our privacy or data security measures fail to comply with current or future laws and regulations, we may be subject to litigation, regulatory investigations or other liabilities, or our customers may terminate their relationships with us.
In addition, although many regulations might not apply to our business directly, we expect that laws regulating the solicitation, collection or processing of personal and consumer information could affect our customers’ ability to use and share data, potentially reducing demand for our services. The Telecommunications Act of 1996 prohibits certain types of information and content from being transmitted over the internet. The prohibition’s scope and the liability associated with a violation are currently unsettled. In addition, although substantial portions of the Communications Decency Act were held to be unconstitutional, we cannot be certain that similar legislation will not be enacted and upheld in the future. It is possible that legislation could expose companies involved in e-commerce to liability, which could limit the growth of e-commerce generally. Legislation like the Telecommunications Act and the Communications Decency Act could dampen the growth in web usage and decrease its acceptance as a medium of communications and commerce. Moreover, if future laws and regulations limit our customers’ ability to use and share consumer data or our ability to store, process and share data with our customers over the internet, demand for our solutions could decrease, our costs could increase, and our results of operations and financial condition could be harmed.
17
Table of Contents
In addition, taxation of services provided over the internet or other charges imposed by government agencies or by private organizations for accessing the internet may also be imposed. Any regulation imposing greater fees for internet use or restricting information exchange over the internet could result in a decline in the use of the internet and the viability of internet-based services, which could harm our business and operating results.
We use a limited number of data centers to deliver our services. Any disruption of service at these facilities could harm our business.
We manage our services and serve all of our customers from a limited number of third-party data center facilities. While we engineer and architect the actual computer and storage systems upon which our platform runs, which we call our grid computing points of delivery, or PODs, and deploy them to the data center facilities, we do not control the operation of these facilities.
The owners of our data facilities have no obligation to renew their agreements with us on commercially reasonable terms, or at all. If we are unable to renew these agreements on commercially reasonable terms, we may be required to transfer to new data center facilities, and we may incur significant costs and possible service interruption in connection with doing so.
Any changes in third-party service levels at our data centers or any errors, defects, disruptions or other performance problems with our services could harm our reputation and may damage our customers’ businesses. Interruptions in our services might reduce our revenue, cause us to issue credits to customers, subject us to potential liability, and cause customers to terminate their subscriptions or harm our renewal rates.
Our data centers are vulnerable to damage or interruption from human error, intentional bad acts, earthquakes, hurricanes, floods, fires, war, terrorist attacks, power losses, hardware failures, systems failures, telecommunications failures and similar events. At least one of our data facilities is located in an area known for seismic activity, increasing our susceptibility to the risk that an earthquake could significantly harm the operations of these facilities. The occurrence of a natural disaster or an act of terrorism, or vandalism or other misconduct, a decision to close the facilities without adequate notice or other unanticipated problems could result in lengthy interruptions in our services.
We may not be able to respond to rapid technological changes with new solutions, which could have a material adverse effect on our sales and profitability.
The on-demand e-commerce market is characterized by rapid technological change, frequent new product and service introductions and evolving industry standards. Our ability to attract new customers and increase revenue from existing customers will depend in large part on our ability to enhance and improve our existing solutions, introduce new solutions and sell into new industry markets. To achieve market acceptance for our solutions, we must effectively anticipate and offer solutions that meet changing customer demands in a timely manner. Customers may require features and capabilities that our current solutions do not have. If we fail to develop solutions that satisfy customer preferences in a timely and cost-effective manner, our ability to renew our contracts with existing customers and our ability to create or increase demand for our solutions will be harmed.
We may experience difficulties with software development, industry standards, design, manufacturing or marketing that could delay or prevent our development, introduction or implementation of new solutions and enhancements. The introduction of new solutions by competitors, the emergence of new industry standards or the development of entirely new technologies to replace existing offerings could render our existing or future solutions obsolete.
If we are unable to successfully develop or acquire new e-commerce capabilities and functionality, enhance our existing solutions to anticipate and meet customer preferences or sell our solutions into new markets, our revenue and results of operations would be adversely affected.
18
Table of Contents
Our quarterly operating results may fluctuate in the future. As a result, we may fail to meet or exceed the expectations of research analysts or investors, which could cause our stock price to decline.
Our quarterly operating results may fluctuate as a result of a variety of factors, many of which are outside of our control. If our quarterly operating results or guidance fall below the expectations of research analysts or investors, the price of our common stock could decline substantially. Fluctuations in our quarterly operating results or guidance may be due to a number of factors, including, but not limited to, those listed below:
| Ÿ | factors affecting our existing customers’ gross revenue processed on our platform; |
| Ÿ | the extent to which our existing customers renew their subscriptions for our solutions and the timing and terms of those renewals; |
| Ÿ | the extent to which existing customers deploy or discontinue use of additional e-commerce sites on our platform; |
| Ÿ | the extent to which new customers are attracted to our solutions to satisfy their e-commerce needs; |
| Ÿ | the timing, committed subscription levels and revenue share rates at which we enter into agreements for our solutions with new customers; |
| Ÿ | the addition or loss of large customers, including through acquisitions or consolidations; |
| Ÿ | the number and size of new customers and the number and size of renewal customers in a particular period; |
| Ÿ | the mix of customers across small, mid-sized and large organizations; |
| Ÿ | changes in our pricing policies or those of our competitors; |
| Ÿ | the financial condition and creditworthiness of our customers; |
| Ÿ | the amount and timing of operating expenses, including those related to the maintenance and expansion of our business, operations and infrastructure; |
| Ÿ | the timing and success of new solutions introduced by us; |
| Ÿ | the timing and success of current and new products and services introduced by our competitors; |
| Ÿ | other changes in the competitive dynamics of our industry, including consolidation among competitors, customers or strategic partners; |
| Ÿ | the timing of expenses related to the development of new products and technologies, including enhancements to our solutions; |
| Ÿ | our ability to manage our existing business and future growth, including increases in the number of customers on our platform, additional customer e-commerce sites and new geographic regions; |
| Ÿ | expenses related to our data centers and the expansion of such data centers; |
| Ÿ | various factors related to disruptions in our SaaS hosting network infrastructure, defects in our solutions, privacy and data security and exchange rate fluctuations, each of which is described elsewhere in these risk factors; |
| Ÿ | our ability to efficiently and cost effectively deploy new customer e-commerce sites on our platform; and |
| Ÿ | general economic, industry and market conditions. |
19
Table of Contents
We believe that our quarterly revenue and operating results may vary significantly in the future and that period-to-period comparisons of our operating results may not be meaningful. You should not rely on the results of one quarter as an indication of future performance.
Our long-term success depends, in part, on our ability to expand the sales of our e-commerce solutions to customers located outside of the United States, and thus our business is susceptible to risks associated with international sales and operations.
We currently maintain offices and/or have sales personnel in Germany, France, the Netherlands, the United Kingdom, Canada and China, and we intend to build out our international operations. Any international expansion efforts that we may undertake may not be successful. In addition, conducting international operations in new markets subjects us to new risks that we have not generally faced in the United States. These risks include:
| Ÿ | localization of our solutions, including translation into foreign languages and adaptation for local practices and regulatory requirements; |
| Ÿ | lack of familiarity and burdens of complying with foreign laws, legal standards, regulatory requirements, tariffs, and other barriers; |
| Ÿ | unexpected changes in regulatory requirements, taxes, trade laws, tariffs, export quotas, custom duties or other trade restrictions; |
| Ÿ | difficulties in managing systems integrators and technology partners; |
| Ÿ | differing technology standards; |
| Ÿ | longer accounts receivable payment cycles and difficulties in collecting accounts receivable; |
| Ÿ | difficulties in managing and staffing international operations and differing employer/employee relationships; |
| Ÿ | fluctuations in exchange rates that may increase the volatility of our foreign based revenue; |
| Ÿ | potentially adverse tax consequences, including the complexities of foreign value added tax (or other tax) systems and restrictions on the repatriation of earnings; |
| Ÿ | uncertain political and economic climates; and |
| Ÿ | reduced or varied protection for intellectual property rights in some countries. |
These factors may cause our international costs of doing business to exceed our comparable domestic costs. Operating in international markets also requires significant management attention and financial resources. Any negative impact from our international business efforts could negatively impact our business, results of operations and financial condition as a whole.
Fluctuations in the exchange rate of foreign currencies could result in currency transactions losses.
We currently have foreign sales denominated in Euros and British pound sterling and, may in the future, have sales denominated in the currencies of additional countries in which we establish or have established sales offices. In addition, we incur a portion of our operating expenses in Euros and, to a lesser extent, other foreign currencies. Any fluctuation in the exchange rate of these foreign currencies may negatively impact our business, financial condition and operating results. We have not previously engaged in foreign currency hedging. If we decide to hedge our foreign currency exposure, we may not be able to hedge effectively due to lack of experience, unreasonable costs or illiquid markets.
20
Table of Contents
We are subject to governmental export and import controls that could impair our ability to compete in international markets due to licensing requirements and subject us to liability if we are not in full compliance with applicable laws.
Our solutions are subject to export controls, including the Commerce Department’s Export Administration Regulations and various economic and trade sanctions regulations established by the Treasury Department’s Office of Foreign Assets Controls, and exports of our solutions must be made in compliance with these laws. If we fail to comply with these U.S. export control laws and import laws, including U.S. Customs regulations, we and certain of our employees could be subject to substantial civil or criminal penalties, including the possible loss of export or import privileges; fines, which may be imposed on us and responsible employees or managers; and, in extreme cases, the incarceration of responsible employees or managers. In addition, if our distributors fail to obtain appropriate import, export or re-export licenses or authorizations, we may also be adversely affected through reputational harm and penalties. Obtaining the necessary authorizations, including any required license, for a particular sale may be time-consuming, is not guaranteed and may result in the delay or loss of sales opportunities. Furthermore, the U.S. export control laws and economic sanctions laws prohibit the shipment of certain products and services to U.S. embargoed or sanctioned countries, governments and persons. Even though we take precautions to prevent our solutions from being shipped or provided to U.S. sanctions targets, our solutions and services could be shipped to those targets or provided by our distributors despite such precautions. Any such shipment could have negative consequences, including government investigations, penalties and reputational harm. In addition, various countries regulate the import of certain encryption technology, including through import permitting/licensing requirements, and have enacted laws that could limit our ability to distribute our solutions or could limit our customers’ ability to implement our solutions in those countries. Changes in our solutions or changes in export and import regulations may create delays in the introduction and sale of our solutions in international markets, prevent our customers with international operations from deploying our solutions or, in some cases, prevent the export or import of our solutions to certain countries, governments or persons altogether. Any change in export or import regulations, economic sanctions or related laws, shift in the enforcement or scope of existing regulations, or change in the countries, governments, persons or technologies targeted by such regulations, could result in decreased use of our solutions, or in our decreased ability to export or sell our solutions to existing or potential customers with international operations. Any decreased use of our solutions or limitation on our ability to export or sell our solutions would likely adversely affect our business, financial condition and results of operations.
Our use of “open source” software could negatively affect our ability to sell our services and subject us to possible litigation.
A portion of the technologies licensed by us incorporate so-called “open source” software, and we may incorporate open source software in the future. Such open source software is generally licensed by its authors or other third parties under open source licenses. If we fail to comply with these licenses, we may be subject to certain conditions, including requirements that we offer our solutions that incorporate the open source software for no cost, that we make available source code for modifications or derivative works we create based upon, incorporating or using the open source software and/or that we license such modifications or derivative works under the terms of the particular open source license. If an author or other third party that distributes such open source software were to allege that we had not complied with the conditions of one or more of these licenses, we could be required to incur significant legal expenses defending against such allegations and could be subject to significant damages, enjoined from the sale of our solutions that contained the open source software and required to comply with the foregoing conditions, which could disrupt the distribution and sale of some of our solutions. In addition, there have been claims challenging the ownership of open source software against companies that incorporate open source software into their products. As a result, we could be
21
Table of Contents
subject to suits by parties claiming ownership of what we believe to be open source software. Litigation could be costly for us to defend, have a negative effect on our operating results and financial condition or require us to devote additional research and development resources to change our products.
We rely on third-party software, including server software and licenses from third parties to use patented intellectual property that is required for the development of our solutions, which may be difficult to obtain or which could cause errors or failures of our solutions.
We rely on software licensed from or hosted by third parties to offer our solutions. In addition, we may need to obtain future licenses from third parties to use intellectual property associated with the development of our solutions, which might not be available to us on acceptable terms, or at all. Any loss of the right to use any software required for the development and maintenance of our solutions could result in delays in the provision of our solutions until equivalent technology is either developed by us, or, if available, is identified, obtained and integrated, which could harm our business. Any errors or defects in third-party software could result in errors or a failure of our solutions which could harm our business.
If we fail to maintain proper and effective internal controls, our ability to produce accurate and timely financial statements could be impaired, which could harm our operating results, our ability to operate our business and investors’ views of us.
Ensuring that we have adequate internal financial and accounting controls and procedures in place so that we can produce accurate financial statements on a timely basis is a costly and time-consuming effort that needs to be re-evaluated frequently. Our internal control over financial reporting is a process designed to provide reasonable assurance regarding the reliability of financial reporting and the preparation of financial statements in accordance with generally accepted accounting principles. In connection with this offering, we intend to begin the process of documenting, reviewing and improving our internal controls and procedures for compliance with Section 404 of the Sarbanes-Oxley Act of 2002, or the Sarbanes-Oxley Act, which will require annual management assessment of the effectiveness of our internal control over financial reporting. We will be testing our internal controls in connection with management’s certification related to internal controls for the year ending December 31, 2013 and, as part of that documentation and testing, identifying areas for further attention and improvement. We have begun recruiting additional finance and accounting personnel with certain skill sets that we will need as a public company.
Implementing any appropriate changes to our internal controls may distract our officers and employees, entail substantial costs to modify our existing processes and take significant time to complete. These changes may not, however, be effective in maintaining the adequacy of our internal controls, and any failure to maintain that adequacy, or consequent inability to produce accurate financial statements on a timely basis, could increase our operating costs and harm our business. In addition, investors’ perceptions that our internal controls are inadequate or that we are unable to produce accurate financial statements on a timely basis may harm our stock price and make it more difficult for us to effectively market and sell our service to new and existing customers.
We may expand by acquiring or investing in other companies, which may divert our management’s attention, result in additional dilution to our stockholders and consume resources that are necessary to sustain our business.
Although we have no ongoing negotiations or current agreements or commitments for any acquisitions, our business strategy may include acquiring complementary services, technologies or businesses. We also may enter into relationships with other businesses to expand our service offerings
22
Table of Contents
or our ability to provide service in foreign jurisdictions, which could involve preferred or exclusive licenses, additional channels of distribution, discount pricing or investments in other companies. Negotiating these transactions can be time-consuming, difficult and expensive, and our ability to close these transactions may often be subject to conditions or approvals that are beyond our control. Consequently, these transactions, even if undertaken and announced, may not close.
An acquisition, investment or new business relationship may result in unforeseen operating difficulties and expenditures. In particular, we may encounter difficulties assimilating or integrating the businesses, technologies, products, personnel or operations of the acquired companies, particularly if the key personnel of the acquired company choose not to work for us, the company’s software is not easily adapted to work with ours or we have difficulty retaining the customers of any acquired business due to changes in management or otherwise. Acquisitions may also disrupt our business, divert our resources and require significant management attention that would otherwise be available for development of our business. Moreover, the anticipated benefits of any acquisition, investment or business relationship may not be realized or we may be exposed to unknown liabilities. For one or more of those transactions, we may:
| Ÿ | issue additional equity securities that would dilute our stockholders; |
| Ÿ | use cash that we may need in the future to operate our business; |
| Ÿ | incur debt on terms unfavorable to us or that we are unable to repay; |
| Ÿ | incur large charges or substantial liabilities; |
| Ÿ | encounter difficulties retaining key employees of the acquired company or integrating diverse software codes or business cultures; and |
| Ÿ | become subject to adverse tax consequences, substantial depreciation or deferred compensation charges. |
Any of these risks could harm our business and operating results.
The loss of key personnel or an inability to attract and retain highly skilled personnel may impair our ability to grow our business.
We are highly dependent upon the continued service and performance of our senior management team and key technical and sales personnel, such as our president and chief executive officer, our chief financial officer, our executive vice president, field operations and our chief technology officer. These key employees may terminate employment with us at any time with no advance notice. The replacement of these officers likely would involve significant time and costs, and the loss of these officers may significantly delay or prevent the achievement of our business objectives.
We face intense competition for qualified individuals from numerous technology, software and manufacturing companies. For example, our competitors may be able to attract and retain a more qualified engineering team by offering more competitive compensation packages. If we are unable to attract new engineers and retain our current engineers, we may not be able to develop and maintain our services at the same levels as our competitors and we may, therefore, lose potential customers and sales penetration in certain markets. Our failure to attract and retain suitably qualified individuals could have an adverse effect on our ability to implement our business plan and, as a result, our ability to compete would decrease, our operating results would suffer and our revenue would decrease. In addition, if any of our key employees joins a competitor or decides to otherwise compete with us, we may experience a material disruption of our operations and development plans, which may cause us to lose customers or increase operating expenses as the attention of our remaining senior managers is diverted to recruit replacements for the departed key employees.
23
Table of Contents
Because we recognize costs of services as they are incurred and we recognize related services revenue for subscriptions and services sold in a single arrangement ratably, our gross margins may not be indicative of trends in our services business, which increases the difficulty of evaluating our future financial results.
When we sell subscriptions and services in a single arrangement, which is sometimes referred to as a multiple-element arrangement, we recognize the services revenue ratably over the longer of the related subscription term or the estimated expected life of the customer relationship. The current estimated expected life of our customer relationships ranges from three to six years. We continue to evaluate the length of the estimated expected life of our customer relationships as we gain more experience with customer renewals. A change in the estimated expected life of our customer relationship periods could result in the recognition of services revenue over a longer or shorter period of time than previously planned, making it difficult to forecast future results. Costs associated with providing these services are recognized as incurred, resulting in variability in our gross margins when costs and revenue are recorded in different periods.
During 2010 and prior years, when we sold services in a separate arrangement after a customer’s initial use of our e-commerce solution, we recognized revenue from those services as one unit of accounting together with the related subscription revenue ratably over the remaining term of the subscription agreement. Costs associated with providing these services were recognized as incurred, resulting in variability in our gross margins as costs and revenue were recorded in different periods. Under new revenue recognition guidance that we adopted on January 1, 2011, we recognize revenue from services sold, or materially modified, together with the costs associated with providing the services, as the services are provided. This will result in our future services revenue being recognized over differing periods, which may make our operating results more difficult to understand and less indicative of trends in our services business.
Risks Related to This Offering and Ownership of Our Common Stock
An active trading market for our common stock may not develop, and you may not be able to resell your shares of our common stock at or above the initial offering prices.
Before this offering, there was no public trading market for our common stock. If a market for our common stock does not develop or is not sustained, it may be difficult for you to sell your shares of common stock at an attractive price or at all. The initial public offering price of our common stock will be determined through negotiations between us and the underwriters. This initial public offering price may not be indicative of the market price of our common stock after the offering. In the absence of an active trading market for our common stock, investors may not be able to sell their common stock at or above the initial public offering price or at the time that they would like to sell. We cannot predict the prices at which our common stock will trade. It is possible that in one or more future periods our results of operations may be below the expectations of public market analysts and investors and, as a result of these and other factors, the price of our common stock may fall.
The market price of our common stock may be volatile, which could result in substantial losses for investors purchasing shares in this offering.
The market price of our common stock could be subject to significant fluctuations after this offering, and it may decline below the initial public offering price. Some of the factors that may cause the market price of our common stock to fluctuate include:
| Ÿ | price and volume fluctuations in the overall stock market from time to time; |
| Ÿ | significant volatility in the market price and trading volume of comparable companies; |
24
Table of Contents
| Ÿ | actual or anticipated changes in our earnings or fluctuations in our operating results or in the expectations of securities analysts; |
| Ÿ | announcements of technological innovations, new products, strategic alliances or significant agreements by us or by our competitors; |
| Ÿ | litigation involving us; |
| Ÿ | investors’ general perception of us; |
| Ÿ | changes in general economic, industry and market conditions and trends; and |
| Ÿ | recruitment or departure of key personnel. |
In the past, following periods of volatility in the market price of a company’s securities, securities class action litigation has often been brought against that company. Because of the potential volatility of our stock price, we may become the target of securities litigation in the future. Securities litigation could result in substantial costs and divert management’s attention and resources from our business.
We may need financing in the future, and any additional financing may result in restrictions on our operations or substantial dilution to our stockholders.
We may need to raise funds in the future, for example, to develop new technologies, expand our business, respond to competitive pressures, acquire complementary businesses, or respond to unanticipated situations. We may try to raise additional funds through public or private financings, strategic relationships, or other arrangements. Our ability to obtain debt or equity funding will depend on a number of factors, including market conditions, our operating performance, and investor interest. Additional funding may not be available to us on acceptable terms or at all. If adequate funds are not available, we may be required to reduce expenditures, including curtailing our growth strategies, foregoing acquisitions, or reducing our product development efforts. If we succeed in raising additional funds through the issuance of equity or convertible securities, then the issuance could result in substantial dilution to existing stockholders. If we raise additional funds through the issuance of debt securities or preferred stock, these new securities would have rights, preferences, and privileges senior to those of the holders of our common stock. The terms of these securities, as well as any borrowings under our credit agreement, could impose restrictions on our operations.
If securities or industry analysts do not publish, or cease publishing, research or reports about us, our business or our market, or if they publish negative evaluations of our stock, the price of our stock and trading volume could decline.
The trading market for our common stock will be influenced by the research and reports that industry or securities analysts may publish about us, our business, our market or our competitors. We do not currently have and may never obtain research coverage by financial analysts. If no or few analysts commence coverage of us, the trading price of our stock would likely decrease. Even if we do obtain analyst coverage, if one or more of the analysts covering our business downgrade their evaluations of our stock, the price of our stock could decline. If one or more of these analysts cease to cover our stock, we could lose visibility in the market for our stock, which in turn could cause our stock price to decline.
A significant portion of our total outstanding shares may be sold into the public market in the near future, which could cause the market price of our common stock to drop significantly, even if our business is doing well.
Sales of a substantial number of shares of our common stock in the public market could occur at any time after the expiration of the lock-up agreements described in the “Underwriting” section of this prospectus. These sales, or the market perception that the holders of a large number of shares intend
25
Table of Contents
to sell shares, could reduce the market price of our common stock. After the closing of this offering, we will have 28,032,595 shares of common stock outstanding based on the number of shares outstanding as of January 31, 2012. This includes the 5,500,000 shares that we are selling in this offering, which may be resold in the public market immediately. The remaining 22,532,595 shares, or 80.4% of our outstanding shares after this offering, are currently, and will be following the closing of this offering, restricted as a result of securities laws or lock-up agreements but will be able to be sold, subject to any applicable volume limitations under federal securities laws with respect to affiliate sales, in the near future as set forth below.
| Number of Shares and Percentage |
Date Available for Sale Into Public Market | |
| 0 shares, or 0% |
On the date of this prospectus | |
| 0 shares, or 0% |
90 days after the date of this prospectus | |
| 22,532,595 shares, or 80.4% |
180 days after the date of this prospectus, subject to extension in specified instances, due to lock-up agreements between the holders of these shares and the underwriters. However, Goldman, Sachs & Co. and Deutsche Bank Securities Inc. can waive the provisions of these lock-up agreements and allow these stockholders to sell their shares at any time | |
In addition, as of January 31, 2012, there were 23,092 shares subject to an outstanding warrant, 3,989,852 shares subject to outstanding options and an additional 220,968 shares reserved for future issuance under our equity incentive plans that will become eligible for sale in the public market to the extent permitted by any applicable vesting requirements, lock-up agreements and Rules 144 and 701 under the Securities Act of 1933, as amended, or the Securities Act. Moreover, after this offering, holders of an aggregate of approximately 18,028,763 shares of our common stock as of January 31, 2012, will have rights, subject to some conditions, to require us to file registration statements covering their shares or to include their shares in registration statements that we may file for ourselves or other stockholders. We also intend to register all shares of common stock that we may issue under our employee benefit plans. Once we register these shares, they can be freely sold in the public market upon issuance, subject to the lock-up agreements and the restrictions imposed on our affiliates under Rule 144.
Purchasers in this offering will incur immediate and substantial dilution in the book value of their investment as a result of this offering.
If you purchase common stock in this offering, you will incur immediate and substantial dilution of $11.05 per share, representing the difference between the assumed initial public offering price of $13.50 per share and our pro forma net tangible book value per share after giving effect to this offering and the automatic conversion of all outstanding shares of our preferred stock upon the closing of this offering. Moreover, we issued warrants and options in the past to acquire common stock at prices significantly below the assumed initial public offering price. As of December 31, 2011, there were 23,092 shares subject to an outstanding warrant with an exercise price of $3.90 per share and 4,024,477 shares subject to outstanding options with a weighted average exercise price of $1.92 per share. To the extent that these outstanding warrants or options are ultimately exercised, you will incur further dilution.
Insiders will continue to have substantial control over us after this offering, which could limit your ability to influence the outcome of key transactions, including a change of control.
After this offering, our directors and executive officers and their affiliates will beneficially own, in the aggregate, approximately 45.4% of our outstanding common stock, assuming no exercise of the underwriters’ option to purchase additional shares of our common stock in this offering. As a result,
26
Table of Contents
these stockholders, if they act together, could have significant influence over the outcome of matters submitted to our stockholders for approval, including the election of directors and any merger, consolidation or sale of all or substantially all of our assets, and over the management and affairs of our company. This concentration of ownership may have the effect of delaying or preventing a change in control of our company and might affect the market price of our common stock.
Some of these persons or entities may have interests different than yours. For example, because many of these stockholders purchased their shares at prices substantially below the price at which shares are being sold in this offering and have held their shares for a longer period, they may be more interested in selling our company to an acquiror than other investors or may want us to pursue strategies that deviate from the interests of other stockholders.
After this offering, if insiders holding an aggregate of more than 50% of the voting power of our outstanding common stock determine to act as a group, we could avail ourselves of the “controlled company” exemption under Section 303A of the New York Stock Exchange corporate governance listing standards, pursuant to which we would not be required to have a majority of independent directors on our board of directors or a compensation committee and nominating and corporate governance committee composed entirely of independent directors. The independence standards are intended to ensure that directors who meet those standards are free of any conflicting interest that could influence their actions as directors. Accordingly, if we elect to become a controlled company, you will not have the same protections afforded to stockholders of companies that are subject to all of the corporate governance requirements of the New York Stock Exchange. We currently do not intend to rely on this exception even if we qualify to do so.
We will incur increased costs as a result of being a public company.
As a public company, we will incur increased legal, accounting and other costs not incurred as a private company. The Sarbanes-Oxley Act and related rules and regulations of the Securities and Exchange Commission, or the SEC, and the New York Stock Exchange regulate the corporate governance practices of public companies. We expect that compliance with these requirements will increase our expenses and make some activities more time-consuming than they have been in the past when we were a private company. Such additional costs going forward could negatively affect our financial results.
Because we do not expect to pay any dividends on our common stock for the foreseeable future, investors in this offering may never receive a return on their investment.
You should not rely on an investment in our common stock to provide dividend income. We do not anticipate that we will pay any cash dividends to holders of our common stock in the foreseeable future. Instead, we plan to retain any earnings to maintain and expand our existing operations. In addition, our ability to pay cash dividends is currently limited by the terms of our credit facility, which prohibits our payment of dividends on our capital stock without prior consent, and any future credit facility may contain terms prohibiting or limiting the amount of dividends that may be declared or paid on our common stock. Accordingly, investors must rely on sales of their common stock after price appreciation, which may never occur, as the only way to realize any return on their investment. As a result, investors seeking cash dividends should not purchase our common stock.
Our management will have broad discretion over the use of the proceeds we receive from this offering and might not apply the proceeds in ways that increase the value of your investment.
Our management will have broad discretion to use our net proceeds from this offering, and you will be relying on the judgment of our management regarding the application of these proceeds. Our management might not apply our net proceeds of this offering in ways that increase the value of your investment. We expect to use the net proceeds to us from this offering for financing our growth, working capital and other general corporate purposes, which may in the future include investments in,
27
Table of Contents
or acquisitions of, complementary businesses, joint ventures, partnerships, services or technologies. Our management might not be able to yield a significant return, if any, on any investment of these net proceeds. You will not have the opportunity to influence our decisions on how to use our net proceeds from this offering.
Anti-takeover provisions in our amended and restated certificate of incorporation and our amended and restated by-laws, as well as provisions of Delaware law, might discourage, delay or prevent a change in control of our company or changes in our management and, therefore, depress the trading price of our common stock.
Our amended and restated certificate of incorporation and amended and restated by-laws and Delaware law contain provisions that may discourage, delay or prevent a merger, acquisition or other change in control that stockholders may consider favorable, including transactions in which you might otherwise receive a premium for your shares of our common stock. These provisions may also prevent or frustrate attempts by our stockholders to replace or remove our management. Our corporate governance documents include provisions:
| Ÿ | establishing a classified board of directors with staggered three-year terms so that not all members of our board are elected at one time; |
| Ÿ | providing that directors may be removed by stockholders only for cause; |
| Ÿ | limiting the ability of our stockholders to call and bring business before special meetings and to take action by written consent in lieu of a meeting; |
| Ÿ | requiring advance notice of stockholder proposals for business to be conducted at meetings of our stockholders and for nominations of candidates for election to our board of directors; |
| Ÿ | authorizing blank check preferred stock, which could be issued with voting, liquidation, dividend and other rights superior to our common stock; and |
| Ÿ | limiting the liability of, and providing indemnification to, our directors and officers. |
As a Delaware corporation, we are also subject to provisions of Delaware law, including Section 203 of the Delaware General Corporation Law, which prevents some stockholders holding more than 15% of our outstanding common stock from engaging in certain business combinations without approval of the holders of substantially all of our outstanding common stock. Any provision of our amended and restated certificate of incorporation or amended and restated by-laws or Delaware law that has the effect of delaying or deterring a change in control could limit the opportunity for our stockholders to receive a premium for their shares of our common stock, and could also affect the price that some investors are willing to pay for our common stock.
The existence of the foregoing provisions and anti-takeover measures could limit the price that investors might be willing to pay in the future for shares of our common stock. They could also deter potential acquirers of our company, thereby reducing the likelihood that you could receive a premium for your common stock in an acquisition.
28
Table of Contents
SPECIAL NOTE REGARDING FORWARD-LOOKING STATEMENTS
This prospectus contains forward-looking statements. All statements other than statements of historical facts contained in this prospectus, including statements regarding our future results of operations and financial position, business strategy and plans and objectives of management for future operations, are forward-looking statements. These statements involve known and unknown risks, uncertainties and other important factors that may cause our actual results, performance or achievements to be materially different from any future results, performance or achievements expressed or implied by the forward-looking statements.
In some cases, you can identify forward-looking statements by terms such as “may,” “should,” “expects,” “plans,” “anticipates,” “could,” “intends,” “target,” “projects,” “contemplates,” “believes,” “estimates,” “predicts,” “potential” or “continue” or the negative of these terms or other similar expressions. The forward-looking statements in this prospectus are only predictions. We have based these forward-looking statements largely on our current expectations and projections about future events and financial trends that we believe may affect our business, financial condition and results of operations. These forward-looking statements speak only as of the date of this prospectus and are subject to a number of risks, uncertainties and assumptions described in the “Risk Factors” section and elsewhere in this prospectus. Because forward-looking statements are inherently subject to risks and uncertainties, some of which cannot be predicted or quantified, you should not rely on these forward-looking statements as predictions of future events. The events and circumstances reflected in our forward-looking statements may not be achieved or occur and actual results could differ materially from those projected in the forward-looking statements. Some of the key factors that could cause actual results to differ from our expectations include:
| Ÿ | our inability to achieve or sustain profitability; |
| Ÿ | our limited operating history, which makes it difficult to evaluate our current business and future prospects; |
| Ÿ | our dependence on a limited number of customers for a substantial portion of our revenue; |
| Ÿ | the seasonality of our business; |
| Ÿ | our recognition of revenue from customer subscriptions over the term of the customer agreements; and |
| Ÿ | our substantial dependence on the continued growth of the market for on-demand software solutions. |
Except as required by applicable law, we do not plan to publicly update or revise any forward-looking statements contained herein until after we distribute this prospectus, whether as a result of any new information, future events or otherwise.
29
Table of Contents
We obtained the industry, market and competitive position data in this prospectus from our own internal estimates and research as well as from industry and general publications and research, surveys and studies conducted by third parties, including Euromonitor International Limited, or Euromonitor, and Gartner, Inc., or Gartner. Industry publications, studies and surveys generally state that they have been obtained from sources believed to be reliable. We believe and act as if the third-party data contained herein, and the underlying economic assumptions relied upon therein, are generally reliable.
The Gartner reports referenced herein, “Forecast: Public Cloud Services, Worldwide and Regions, Industry Sectors, 2010-2015, 2011 Update,” Ben Pring, Robert H. Brown, Lydia Leong, Fabrizio Biscotti, Laurie F. Wurster, Susan Cournoyer, Jeffrey Roster, Venecia K. Liu, Andrew Frank, Michele C. Caminos, June 29, 2011, and “Forecast: Software as a Service, Worldwide, 2010-2015, 2H11 Update,” Sharon A. Mertz, Chad Eschinger, Laurie F. Wurster, Tom Eid, Chris Pang, Yanna Dharmasthira, Hai Hong Swinehart, Fabrizio Biscotti, November 11, 2011, which we refer to together as the Gartner Reports, represent data, research opinions or viewpoints published, as part of a syndicated subscription service, by Gartner, which are not representations of fact. The Gartner Reports speak as of their original publication dates and not as of the date of this prospectus, and the opinions expressed in the Gartner Reports are subject to change without notice.
We do not know what assumptions regarding general economic growth were used in preparing the forecasts and projections we cite. Statements as to our market position are based on recently available data. While we are not aware of any misstatements regarding industry data presented herein, our estimates involve risks and uncertainties and are subject to change based on various factors, including those discussed under “Risk Factors” in this prospectus.
30
Table of Contents
We estimate that our net proceeds from the sale of our common stock in this offering will be approximately $65.5 million, assuming an initial public offering price of $13.50 per share, which is the midpoint of the range listed on the cover page of this prospectus, and after deducting the estimated underwriting discounts and commissions and estimated offering expenses payable by us. A $1.00 increase (decrease) in the assumed initial public offering price of $13.50 per share would increase (decrease) the net proceeds to us from this offering by approximately $5.1 million, assuming the number of shares offered by us, as set forth on the cover page of this prospectus, remains the same and after deducting estimated underwriting discounts and commissions and estimated offering expenses payable by us. If the underwriters exercise their over-allotment option in full, we estimate that our net proceeds will be approximately $75.9 million.
The principal purposes of this offering are to obtain additional capital, to create a public market for our common stock and to facilitate our future access to the public capital markets.
We have not yet determined with any certainty the manner in which we will allocate the net proceeds of this offering. We intend to use the net proceeds to us from this offering for financing our growth, working capital and other general corporate purposes. In addition we believe that opportunities may exist from time to time to expand our current business through acquisitions of or investments in complementary companies, products or technologies. While we have no current agreements, commitments or understandings for any specific acquisitions at this time, we may use a portion of the net proceeds for these purposes. See “Risk Factors—Our management will have broad discretion over the use of the proceeds we receive from this offering and might not apply the proceeds in ways that increase the value of your investment.”
Pending use of the proceeds as described above, we intend to invest the proceeds in short-term, interest-bearing, investment-grade securities.
We have not declared or paid any cash dividends on our capital stock since our inception. We intend to retain future earnings, if any, to finance the operation and expansion of our business and do not anticipate paying any cash dividends in the foreseeable future. Any future determination to declare dividends will be subject to the discretion of our board of directors and will depend on various factors, including applicable laws, our results of operations, financial condition, future prospects and any other factors deemed relevant by our board of directors.
31
Table of Contents
The following table sets forth our cash and cash equivalents and capitalization as of December 31, 2011, as follows:
| Ÿ | on an actual basis; |
| Ÿ | on a pro forma basis to reflect (1) the automatic conversion of all outstanding shares of our preferred stock into 18,028,763 shares of common stock upon the closing of this offering and (2) the filing of our amended and restated certificate of incorporation as of the closing date of this offering; and |
| Ÿ | on a pro forma as adjusted basis to give further effect to our issuance and sale of 5,500,000 shares of common stock in this offering at an assumed initial public offering price of $13.50 per share, the midpoint of the price range listed on the cover page of this prospectus, after deducting the estimated underwriting discounts and commissions and estimated offering expenses payable by us. |
You should read this information in conjunction with our consolidated financial statements and the related notes appearing at the end of this prospectus and the “Management’s Discussion and Analysis of Financial Condition and Results of Operations” section and other financial information contained in this prospectus.
| As of December 31, 2011 | ||||||||||||
| Actual | Pro Forma | Pro Forma As Adjusted |
||||||||||
| (unaudited) |
||||||||||||
| (in thousands, except share and per share data) |
||||||||||||
| Cash and cash equivalents |
$ | 14,939 | $ | 14,939 | $ | 80,459 | ||||||
|
|
|
|
|
|
|
|||||||
| Long-term notes payable, net of current portion |
$ | 1,882 | $ | 1,882 | $ | 1,882 | ||||||
| Series A convertible preferred stock, par value $0.01 per share; 9,564,000 shares authorized, 9,513,162 issued and outstanding, actual; no shares authorized, issued or outstanding, pro forma and pro forma as adjusted |
14,976 | — | ||||||||||
| Series B convertible preferred stock, par value $0.01 per share; 11,165,557 shares authorized, issued and outstanding, actual; no shares authorized, issued or outstanding, pro forma and pro forma as adjusted |
18,158 | — | ||||||||||
| Series C convertible preferred stock, par value $0.01 per share; 16,234,236 shares authorized, 16,164,958 issued and outstanding, actual; no shares authorized, issued or outstanding, pro forma and pro forma as adjusted |
27,884 | — | ||||||||||
| Series D convertible preferred stock, par value $0.01 per share; 17,242,628 shares authorized, issued and outstanding, actual; no shares authorized, issued or outstanding, pro forma and pro forma as adjusted |
26,585 | — | ||||||||||
| Common stock, par value $0.01 per share; 27,333,333 shares authorized, 4,469,207 shares issued and outstanding, actual; 240,000,000 shares authorized, 22,497,970 shares issued and outstanding, pro forma; and 240,000,000 shares authorized, 27,997,970 shares issued and outstanding, pro forma as adjusted |
45 | 225 | 280 | |||||||||
| Accumulated other comprehensive loss |
(53 | ) | (53 | ) | (53 | ) | ||||||
| Additional paid-in capital |
— | 87,423 | 152,888 | |||||||||
| Accumulated deficit |
(84,612 | ) | (84,612 | ) | (84,612 | ) | ||||||
|
|
|
|
|
|
|
|||||||
| Total stockholders’ (deficit) equity |
(84,620 | ) | 2,983 | 68,503 | ||||||||
|
|
|
|
|
|
|
|||||||
| Total capitalization |
$ | 4,865 | $ | 4,865 | $ | 70,385 | ||||||
|
|
|
|
|
|
|
|||||||
32
Table of Contents
A $1.00 increase (decrease) in the assumed initial public offering price of $13.50 per share, which is the midpoint of the range listed on the cover page of this prospectus, would increase (decrease) the pro forma as adjusted amount of each of cash and cash equivalents, additional paid-in capital, total stockholders’ equity and total capitalization by approximately $5.1 million, assuming that the number of shares offered by us, as set forth on the cover page of this prospectus, remains the same and after deducting estimated underwriting discounts and commissions and estimated offering expenses payable by us. We may also increase or decrease the number of shares we are offering. Each increase (decrease) of one million shares in the number of shares offered by us would increase (decrease) each of additional paid-in-capital, total stockholders’ equity and total capitalization by approximately $12.6 million, assuming that the assumed initial offering price remains the same and after deducting the estimated underwriting discounts and commissions and estimated offering expenses paid by us.
The adjusted information discussed above is illustrative only and will adjust based on the actual initial offering price and other terms on this offering determined at pricing.
The table above does not include:
| Ÿ | 4,024,477 shares of common stock issuable upon exercise of stock options outstanding as of December 31, 2011, at a weighted average exercise price of $1.92 per share; |
| Ÿ | 220,968 shares of common stock reserved as of December 31, 2011, for future issuance under our equity incentive plans; and |
| Ÿ | 23,092 shares of common stock issuable upon exercise of a warrant outstanding as of December 31, 2011, at an exercise price of $3.90 per share. |
33
Table of Contents
If you invest in our common stock in this offering, you will experience immediate and substantial dilution in the pro forma net tangible book value of your shares. Dilution in pro forma net tangible book value represents the difference between the public offering price per share of our common stock in this offering and the pro forma as adjusted net tangible book value per share of our common stock immediately after the offering. The historical net tangible book value at December 31, 2011 was $(84.6) million, or $(18.93) per share, based on 4,469,207 shares of common stock outstanding at such date. Historical net tangible book value per share represents our total tangible assets (total assets less intangible assets) less our total liabilities, divided by the number of outstanding shares of our common stock.
After giving effect to the automatic conversion of all our outstanding preferred stock into an aggregate of 18,028,763 shares of common stock immediately prior to the completion of this offering and the sale of 5,500,000 shares of common stock that we are offering at an assumed initial public offering price of $13.50 per share, which is the midpoint of the range listed on the cover page of this prospectus, and after deducting the estimated underwriting discounts and commissions and estimated offering expenses payable by us, our pro forma as adjusted net tangible book value at December 31, 2011 would have been approximately $68.5 million, or approximately $2.45 per share. This amount represents an immediate increase in pro forma as adjusted net tangible book value of $2.32 per share to our existing stockholders and an immediate dilution of approximately $11.05 per share to new investors purchasing shares of common stock in this offering. We determine dilution by subtracting the pro forma as adjusted net tangible book value per share after this offering from the amount of cash that a new investor paid for a share of common stock. The following table illustrates this dilution:
| Assumed initial public offering price per share |
$ | 13.50 | ||||||
| Net tangible book value per share as of December 31, 2011 |
$ | (18.93 | ) | |||||
| Increase per share attributable to conversion of preferred stock |
19.06 | |||||||
|
|
|
|||||||
| Pro forma net tangible value per share before this offering |
0.13 | |||||||
| Increase per share attributable to this offering |
2.32 | |||||||
|
|
|
|||||||
| Pro forma as adjusted net tangible book value per share after this offering |
$ | 2.45 | ||||||
|
|
|
|||||||
| Dilution per share to new investors |
$ | 11.05 | ||||||
|
|
|
A $1.00 increase (decrease) in the assumed initial public offering price of $13.50 per share, which is the midpoint of the range listed on the cover page of this prospectus, would increase (decrease) the pro forma as adjusted net tangible book value per share after this offering by approximately $0.18, and dilution in pro forma net tangible book value per share to new investors by approximately $0.82, assuming that the number of shares offered by us, as set forth on the cover page of this prospectus, remains the same and after deducting estimated underwriting discounts and commissions and estimated offering expenses payable by us.
If the underwriters exercise their option to purchase additional shares of our common stock in full in this offering, the pro forma as adjusted net tangible book value after the offering would be $2.74 per share, the increase in pro forma net tangible book value per share to existing stockholders would be $2.61 and the dilution per share to new investors would be $10.76 per share, in each case assuming an initial public offering price of $13.50 per share, which is the midpoint of the range listed on the cover page of this prospectus.
34
Table of Contents
The following table summarizes, as of December 31, 2011, the differences between the number of shares purchased from us, the total consideration paid to us in cash and the average price per share that existing stockholders and new investors paid. The calculation below is based on an assumed initial public offering price of $13.50 per share, which is the midpoint of the range listed on the cover page of this prospectus, before deducting the estimated underwriting discounts and commissions and estimated offering expenses payable by us.
| Shares Purchased | Total Consideration | Average Price Per Share |
||||||||||||||||||
| Number | Percent | Amount | Percent | |||||||||||||||||
| Existing stockholders |
22,497,970 | 80.4 | % | $ | 65,347,233 | 46,8 | % | $ | 2.90 | |||||||||||
| New investors |
5,500,000 | 19.6 | % | 74,250,000 | 53.2 | % | $ | 13.50 | ||||||||||||
|
|
|
|
|
|
|
|
|
|||||||||||||
| Total |
27,997,970 | 100 | % | $ | 139,597,233 | 100 | % | |||||||||||||
|
|
|
|
|
|
|
|
|
|||||||||||||
The foregoing tables and calculations are based on the number of shares of our common stock outstanding as of December 31, 2011 after giving effect to the automatic conversion of all outstanding shares of our preferred stock upon the closing of this offering, and excludes:
| Ÿ | 4,024,477 shares of common stock issuable upon exercise of stock options outstanding as of December 31, 2011, at a weighted-average exercise price of $1.92 per share; |
| Ÿ | 220,968 shares of common stock reserved as of December 31, 2011 for future issuance under our equity incentive plans; and |
| Ÿ | 23,092 shares of common stock issuable upon exercise of a warrant outstanding as of December 31, 2011, at an exercise price of $3.90 per share. |
To the extent any of these outstanding options or warrants is exercised, there will be further dilution to new investors. To the extent all of such outstanding options and warrants were exercised as of December 31, 2011, the pro forma as adjusted net tangible book value per share after this offering would be $2.38, and total dilution per share to new investors would be $11.12.
If the underwriters exercise their over-allotment option in full:
| Ÿ | the percentage of shares of common stock held by existing stockholders will decrease to approximately 78.1% of the total number of shares of our common stock outstanding after this offering; and |
| Ÿ | the number of shares held by new investors will increase to 6,325,000, or approximately 21.9% of the total number of shares of our common stock outstanding after this offering. |
We may choose to raise additional capital due to market conditions or strategic considerations even if we believe we have sufficient funds for our current or future operating plans. To the extent that additional capital is raised through the sale of equity or securities convertible into equity, the issuance of these securities may result in further dilution to our stockholders.
35
Table of Contents
SELECTED CONSOLIDATED FINANCIAL DATA
You should read the following selected consolidated financial data in conjunction with “Management’s Discussion and Analysis of Financial Condition and Results of Operations” and our consolidated financial statements and the related notes appearing elsewhere in this prospectus.
The consolidated statements of operations data for the years ended December 31, 2009, 2010 and 2011 and the consolidated balance sheet data at December 31, 2010 and 2011 are derived from our audited consolidated financial statements appearing elsewhere in this prospectus. The consolidated statements of operations data for the years ended December 31, 2007 and 2008 and the consolidated balance sheet data at December 31, 2007, 2008 and 2009 are derived from our audited consolidated financial statements that are not included in this prospectus.
| Year Ended December 31, | ||||||||||||||||||||
| 2007 | 2008 | 2009 | 2010 | 2011 | ||||||||||||||||
| (in thousands) |
||||||||||||||||||||
| Consolidated Statements of Operations Data: |
||||||||||||||||||||
| Revenue: |
||||||||||||||||||||
| Subscription |
$ | 4,899 | $ | 4,688 | $ | 16,085 | $ | 28,714 | $ | 47,219 | ||||||||||
| Services |
3,300 | 2,783 | 5,312 | 7,976 | 9,328 | |||||||||||||||
|
|
|
|
|
|
|
|
|
|
|
|||||||||||
| Total revenue |
8,199 | 7,471 | 21,397 | 36,690 | 56,547 | |||||||||||||||
| Cost of revenue: |
||||||||||||||||||||
| Subscription |
3,917 | 3,188 | 3,964 | 6,222 | 9,511 | |||||||||||||||
| Services |
7,402 | 12,435 | 11,533 | 8,282 | 10,196 | |||||||||||||||
|
|
|
|
|
|
|
|
|
|
|
|||||||||||
| Total cost of revenue |
11,319 | 15,623 | 15,497 | 14,504 | 19,707 | |||||||||||||||
|
|
|
|
|
|
|
|
|
|
|
|||||||||||
| Gross (loss) profit |
(3,120 | ) | (8,152 | ) | 5,900 | 22,186 | 36,840 | |||||||||||||
| Operating expenses: |
||||||||||||||||||||
| Sales and marketing |
5,525 | 8,458 | 7,304 | 10,883 | 19,847 | |||||||||||||||
| Research and development |
3,665 | 5,173 | 4,950 | 6,091 | 11,182 | |||||||||||||||
| General and administrative |
2,065 | 3,025 | 3,729 | 4,179 | 6,567 | |||||||||||||||
|
|
|
|
|
|
|
|
|
|
|
|||||||||||
| Total operating expenses |
11,255 | 16,656 | 15,983 | 21,153 | 37,596 | |||||||||||||||
|
|
|
|
|
|
|
|
|
|
|
|||||||||||
| (Loss) income from operations |
(14,375 | ) | (24,808 | ) | (10,083 | ) | 1,033 | (756 | ) | |||||||||||
| Other income (expense), net |
20 | (223 | ) | (239 | ) | (582 | ) | (443 | ) | |||||||||||
|
|
|
|
|
|
|
|
|
|
|
|||||||||||
| (Loss) income before income taxes |
(14,355 | ) | (25,031 | ) | (10,322 | ) | 451 | (1,199 | ) | |||||||||||
| Income tax expense |
23 | 27 | 55 | 142 | 212 | |||||||||||||||
|
|
|
|
|
|
|
|
|
|
|
|||||||||||
| Net (loss) income |
$ | (14,378 | ) | $ | (25,058 | ) | $ | (10,377 | ) | $ | 309 | $ | (1,411 | ) | ||||||
|
|
|
|
|
|
|
|
|
|
|
|||||||||||
| As of December 31, | ||||||||||||||||||||
| 2007 | 2008 | 2009 | 2010 | 2011 | ||||||||||||||||
| (in thousands) | ||||||||||||||||||||
| Consolidated Balance Sheet Data: |
||||||||||||||||||||
| Cash and cash equivalents |
$ | 5,186 | $ | 1,398 | $ | 7,181 | $ | 17,148 | $ | 14,939 | ||||||||||
| Working capital |
2,073 | (7,896 | ) | 82 | 7,516 | 8,725 | ||||||||||||||
| Total assets |
8,743 | 10,401 | 20,066 | 37,028 | 42,886 | |||||||||||||||
| Notes payable |
— | — | 767 | 1,821 | 1,882 | |||||||||||||||
| Total preferred stock |
38,303 | 50,675 | 69,844 | 82,329 | 87,603 | |||||||||||||||
| Total stockholders’ deficit |
(36,407 | ) | (64,144 | ) | (78,344 | ) | (81,114 | ) | (84,620 | ) | ||||||||||
36
Table of Contents
MANAGEMENT’S DISCUSSION AND ANALYSIS OF
FINANCIAL CONDITION AND RESULTS OF OPERATIONS
You should read the following discussion and analysis of our financial condition and results of operations together with our consolidated financial statements and the related notes and other financial information included elsewhere in this prospectus. Some of the information contained in this discussion and analysis or set forth elsewhere in this prospectus, including information with respect to our plans and strategy for our business, includes forward-looking statements that involve risks and uncertainties. You should review the “Risk Factors” section of this prospectus for a discussion of important factors that could cause actual results to differ materially from the results described in or implied by the forward-looking statements contained in the following discussion and analysis.
Overview
We are a leading provider of software-as-a-service e-commerce solutions that enable companies to easily design, implement and manage their own customized e-commerce sites, including websites, mobile applications and other digital storefronts. Our customers use our highly scalable and integrated Demandware Commerce platform to create a seamless brand experience for consumers across all digital touch points worldwide.
We sell subscriptions to our on-demand software and related services through both a direct sales force and indirect channels. Our current customers consist of retailers and branded consumer product manufacturers that operate principally in the following vertical markets: apparel, general merchandise, health & beauty, home & garden, sporting goods and other vertical categories.
We were formed in 2004, and initially focused on building our cloud-based architecture and merchandising applications to allow us to service our customers. Sales were initially constrained due in part to the reluctance of some large companies to purchase software-as-a-service, or SaaS, solutions because of concerns around security, reliability and control of their e-commerce solutions. However, the market opportunity for our solutions has increased significantly in the last several years, due both to increased acceptance of SaaS solutions across large enterprises and to greater recognition of the benefits of our e-commerce solutions, which include enhanced merchandising functionality, high reliability, safety and security, ease of deployment, reduced time-to-market, flexible site customization and immediate availability of continuous software innovation. From December 31, 2007 to December 31, 2011, the number of customers using our Demandware Commerce platform increased from 10 to 101, a 78.3% compound annual growth rate, or CAGR, and the number of e-commerce sites operating on our platform increased from 19 to 361, a 108.8% CAGR.
We derive most of our revenue from subscriptions to our on-demand platform and related services. Subscription fees are based on a variable revenue share pricing model, whereby our customers pay us a percentage of their total gross revenue that is processed on our platform. As part of their subscription fee, our customers commit to a minimum level of gross revenue to be processed on our platform, from which a minimum monthly, quarterly or annual, non-refundable subscription fee is derived. If a customer processes more gross revenue than their committed minimum level, then the customer is required to pay us additional fees, called overage fees, which are calculated as a percentage of the incremental revenue generated above the committed revenue. While we typically record overage fees each quarter, a significant portion is recorded in the fourth quarter. No refunds or credits are given if a customer processes less gross revenue than the contracted level. Customer contracts are generally non-cancellable for a minimum period that is typically three years and ranges from one year to seven years.
Subscription revenue accounted for 75.2%, 78.3% and 83.5% of our total revenue during the years ended December 31, 2009, 2010 and 2011, respectively. Subscription revenue is driven primarily by the number of customers we have, the number of e-commerce sites they operate on our
37
Table of Contents
platform, the contracted minimum value of our subscription agreements and the gross revenue generated from our customers in excess of their committed minimum levels. To date, revenue generated by our customers’ traditional web e-commerce sites has been the primary driver of our subscription revenue. However, we believe that our cross-channel capabilities, including mobile, social and other web channels, have been and will continue to be important factors in our new customers’ purchasing decisions.
We derive our services revenue from the implementation of our customers’ e-commerce sites, which includes the integration of complementary technologies and adaptation to back-end systems and/or business processes and the configuration and deployment of the site. We also provide training services for individuals who are part of the implementation, maintenance and optimization teams of our customers. In general, it takes from four to six months to implement a new customer e-commerce site on our platform. Incremental e-commerce sites for a customer, including for additional brands or geographies, can be implemented in less than one month.
Deferred revenue primarily consists of the unearned portion of billed services fees and fees for our on-demand software. As we invoice nearly all our customers on a monthly or quarterly basis, our deferred revenue balance does not serve as a reliable indicator of our future subscription revenue.
Our revenue growth has been driven by an increased number of customers, as well as an increase in our average subscription revenue per customer. We have increased the number of customers operating on our platform from 10 as of December 31, 2007 to 101 as of December 31, 2011. In addition, our average revenue per customer has continued to increase as our customers grow their online revenue processed on our platform through organic revenue growth of existing e-commerce sites and the launching of new sites in new geographies or for new brands. The number of e-commerce sites that our customers operate on our platform increased from 19 as of December 31, 2007 to 361 as of December 31, 2011. Our revenue from outside the United States as a percentage of total revenue was 55.9%, 51.3% and 49.7% for the years ended December 31, 2009, 2010 and 2011, respectively.
Our subscription revenue fluctuates as a result of seasonal variations in our business, principally due to our customers’ revenue peaks during the holiday season, which correspondingly result in higher overage fees in the fourth quarter than in other quarters. As a result, revenue in the first quarter generally declines sequentially from the fourth quarter. For the quarter ended March 31, 2011, subscription revenue was 8.3% lower than subscription revenue for the quarter ended December 31, 2010.
Our cost of revenue and operating expenses have increased in absolute dollars over the last year due to our need to increase bandwidth and capacity to support customer revenue growth on our platform. We expect that our cost of revenue and operating expenses will continue to increase in absolute dollars as we continue to invest in our growth and incur additional costs as a public company.
We believe the large and growing market for SaaS e-commerce solutions will provide us with significant growth opportunities. As e-commerce transactions continue to account for a greater proportion of all retail sales, we believe that retailers and branded consumer product manufacturers will continue to enhance the performance and functionality of their e-commerce sites, increase their number of e-commerce sites and expand their online presence to encompass multiple digital channels. Just as companies have increasingly chosen SaaS solutions as an attractive alternative to costly and inflexible on-premise solutions for their enterprise-wide applications, we believe that retailers and branded consumer product manufacturers will increasingly adopt SaaS solutions for their e-commerce needs.
We are focused on growing our business by pursuing the significant market opportunity for SaaS e-commerce solutions. We plan to grow our revenue by adding new customers and helping our existing customers increase their revenue processed on our platform by taking full advantage of the
38
Table of Contents
functionality of Demandware Commerce, by increasing the number of e-commerce sites deployed by them and by extending their online presence across multiple channels, including mobile phones, social networks, call centers and in-store kiosks. We also plan to expand our customer base to include industry sectors, customer segments and geographic regions beyond those which we currently serve, including small- and medium-size businesses.
Key Metrics
We regularly review a number of metrics to evaluate growth trends, measure our performance, formulate financial projections and make strategic decisions. We discuss revenue, gross margin, and the components of operating income and margin below under “Basis of Presentation,” and we discuss other key metrics below.
Number of Customers
We believe that our ability to expand our customer base is an indicator of our market penetration and growth of our business as we continue to invest in our direct sales force, our indirect sales channels and marketing initiatives. We define our number of customers at the end of a particular quarter as the number of customers generating subscription revenue during the period, and who have a committed minimum level of gross revenue to be processed on our platform, from which a minimum monthly, quarterly or annual, non-refundable subscription fee is derived. As of December 31, 2011, we had 101 customers. For more information about our customers, see “Business—Customers.”
Number of Customer E-commerce Sites
Since our customers generally operate more than one e-commerce site across various geographies and brands and pay us fees based on the total gross revenue they process on our platform, we believe the total number of customer e-commerce sites using our solutions in a given quarter is an indicator of the growth of our business. As of December 31, 2011, our customers were operating 361 e-commerce sites on our platform.
Subscription Dollar Retention Rate
We believe that our ability to retain our customers and expand their e-commerce revenue growth on our software platform over time is an indicator of the stability of our revenue base and the long-term value of our customer relationships. We assess our performance in this area using a metric we refer to as our subscription dollar retention rate. We calculate the subscription dollar retention rate by dividing the retained average contract value of subscription revenue by the previous average contract value of subscription revenue. We define retained average contract value of subscription revenue as the average annual contract value from committed subscription fees for all contracts that renew in a given period. We define previous average contract value of subscription revenue as the average annual contract value from committed subscription fees for all contracts that expire in that same period. Since our customer contracts are typically three years, we have a limited history of quantifying our subscription dollar retention rate. However, although we have lost individual customers from time to time, our customers that have renewed their subscriptions have tended to increase their subscription commitment level to align with their increasing gross revenue volumes. As a result, our subscription dollar retention rate has been above 100% in 2009, 2010 and 2011.
Total Contract Value Backlog
As of December 31, 2011, we had contract backlog, which consists of total committed minimum subscription fees plus our deferred revenue, of approximately $141.8 million compared with backlog of approximately $83.7 million as of December 31, 2010, due largely to the increased number of new
39
Table of Contents
customers. Backlog does not include any anticipated overage fees. Because revenue for any period is a function of revenue recognized from deferred revenue and backlog under contracts in existence at the beginning of the period as well as contract renewals and new customer contracts during the period, backlog at the beginning of any period is not necessarily indicative of future performance. Our presentation of backlog may differ from other companies in our industry.
Basis of Presentation
Revenue
Subscription Revenue
We derive our subscription revenue from fees paid to us by our customers for their access to our on-demand e-commerce solutions for a specified period of time. Fees are based on a revenue share of the total gross revenue our customers process through their e-commerce sites operating on our platform, and include a committed level of gross revenue from which a minimum monthly, quarterly or annual, subscription fee is derived. Customer contracts are generally non-cancellable for a minimum period that is typically three years and ranges in length from one year to seven years. If customers process more than their committed gross revenue, then we bill overage fees for the difference between the resulting revenue share and their committed minimum fee at the rates applicable in their contracts for the actual volume of revenue achieved. Overage fees represented 28.8%, 29.4% and 33.9% of subscription revenue for the years ended December 31, 2009, 2010 and 2011, respectively. If customers process less than their committed gross revenue, no credits or refunds are given.
We recognize the minimum subscription fee ratably on a straight-line basis over the subscription term, provided that an enforceable contract has been signed by both parties, access to our software has been granted to the customer, the fee for the subscription is fixed or determinable and collection is reasonably assured. Revenue from overage fees is recognized in the period in which that volume is processed and earned. We also derive revenue from annual solution support fees when the services are first activated. The annual solution support fees are recorded as deferred revenue and recognized as revenue ratably on a straight-line basis over the related subscription term. Set up fees paid by customers in connection with subscription services are deferred and recognized ratably over the longer of the term of the subscription agreement or the estimated expected life of the customer relationship, which generally ranges from three to six years. We continue to evaluate the length of the amortization period of the set up fees as we gain more experience with customer contract renewals.
For a discussion of how we expect seasonal factors to affect our subscription revenue, see “—Quarterly Results of Operations” below.
Services Revenue
Services revenue consists primarily of fees associated with application configuration, integration and training services. Our service arrangements are billed on a fixed fee or time and materials basis. From time to time, certain of our services projects are subcontracted to third parties. Our customers may also elect to use unrelated third parties to perform these services. Our typical service arrangement provides for payment to us within 30 to 60 days of invoice.
Cost of Revenue
Cost of Subscription Revenue
Cost of subscription revenue primarily consists of hosting costs, data communications expenses, depreciation expenses associated with computer equipment, personnel and related costs, including salaries, bonuses, payroll taxes, recruiting fees and stock compensation, software license fees and
40
Table of Contents
amortization expenses associated with capitalized software. In addition, we allocate a portion of overhead, such as rent, information technology, or IT, costs, depreciation and amortization and employee benefits costs, to cost of revenue based on headcount. Expenses related to the depreciation associated with computer equipment, hosting and data communications are affected by the number of customers using our on-demand software, the complexity of their e-commerce sites and the volume of transactions processed. We plan to continue to significantly expand our capacity to support our growth, which will result in higher cost of subscription revenue in absolute dollars.
Cost of Services Revenue
Cost of services revenue primarily consists of personnel and related costs, third-party contractors and allocated overhead. Our cost of services revenue is expensed as the costs are incurred. However, the related revenue from fees we receive for our services performed before a customer is operating on our platform is deferred until the commencement of a subscription and recognized as revenue ratably over the longer of the related subscription term or the estimated expected life of the customer relationship. Therefore, the cost incurred in providing these services is not expensed in the same periods as the revenue is recognized. Our cost associated with providing services has been significantly higher as a percentage of revenue than our cost of subscription revenue.
When we perform our services, we often supplement our internal resources with third-party contractors. We also work with a variety of system integrators who sometimes lead implementation efforts. Finally, we have strategic relationships with companies who provide a full-service, comprehensive, end-to-end e-commerce solution by combining our Demandware Commerce platform with a host of complementary services and technologies, such as logistics and warehousing, and who also lead implementation efforts as part of this comprehensive service. The cost of these services will fluctuate from quarter to quarter based on the number of customers that are in the process of implementation, and also based on the extent to which the services are implemented by us or a third party. We expect gross margins from services to decline over time as we grow our customer acquisition efforts, which we expect to result in increased services costs in absolute dollars.
Operating Expenses
Sales and Marketing
Sales and marketing expenses consist primarily of personnel and related expenses for our sales and marketing staff, including salaries, benefits, bonuses, stock-based compensation and commissions; costs of marketing and promotional events, corporate communications, online marketing, product marketing and other brand-building activities; and allocated overhead. We expense sales commissions when the customer contract is signed because our obligation to pay a sales commission arises at that time.
We intend to continue to invest in sales and marketing and expect spending in these areas to increase in absolute dollars and as a percentage of revenue as we continue to expand our business both domestically and internationally. We expect sales and marketing expenses to continue to be among the most significant components of our operating expenses.
Research and Development
Research and development expenses consist primarily of personnel and related expenses for our research and development staff, including salaries, benefits, bonuses and stock-based compensation; the cost of certain third-party contractors; and allocated overhead. Research and development costs, other than software development expenses qualifying for capitalization, are expensed as incurred.
41
Table of Contents
We have focused our research and development efforts on continuously improving our platform, including feature innovation as well as platform extension. We believe that our research and development activities are efficient, because we benefit from maintaining a single software code base. We expect research and development expenses to increase in absolute dollars as we add new functionality on the platform and expand our network infrastructure.
General and Administrative
General and administrative expenses consist primarily of personnel and related expenses for administrative, finance, IT, legal and human resource staffs, including salaries, benefits, bonuses and stock-based compensation; professional fees; insurance premiums; other corporate expenses; and allocated overhead.
We expect our general and administrative expenses to increase as we continue to expand our operations, hire additional personnel and transition from being a private company to a public company. In transitioning to a public company, we expect to incur additional expenses related to increased outside legal counsel assistance, accounting and auditing activities, compliance with Securities and Exchange Commission, or SEC, requirements and enhancing our internal control environment through the adoption and administration of new corporate policies.
Other (Expense) Income
Other (expense) income primarily consists of interest income, interest expense and foreign exchange gains (losses). Interest income represents interest received on our cash and cash equivalents. Interest expense is associated with our outstanding equipment term loans. Foreign exchange gains (losses) relate to expenses and transactions denominated in currencies other than our functional currency.
Critical Accounting Policies and Estimates
Our financial statements and the related notes included elsewhere in this prospectus are prepared in accordance with generally accepted accounting principles in the United States. The preparation of these financial statements requires us to make estimates and assumptions that affect the reported amounts of assets, liabilities, revenue, cost of revenue, operating expenses, other income and expenses, provision for income taxes and related disclosures. We base our estimates on historical experience and on various other assumptions that we believe to be reasonable under the circumstances. Changes in accounting estimates are reasonably likely to occur from period to period. Accordingly, actual results could differ significantly from our estimates. We evaluate our estimates and assumptions on an ongoing basis. To the extent that there are material differences between our estimates and our actual results, our future financial statement presentation, financial condition, results of operations and cash flows will be affected.
We believe the assumptions and estimates associated with the following accounting policies have the greatest potential impact on our financial statements: revenue recognition and deferred revenue; accounting for stock based compensation; and income taxes.
Revenue Recognition and Deferred Revenue
Our revenue is derived from sales of subscriptions to our on-demand e-commerce solutions and related services. We recognize revenue when: (i) persuasive evidence of an arrangement for the sale of our e-commerce solutions or services exists, (ii) our e-commerce solutions have been made available or delivered, (iii) the sales price is fixed or determinable, and (iv) collectability is reasonably assured. Evidence of an arrangement consists of a signed customer contract. We consider delivery of
42
Table of Contents
our e-commerce solutions to have commenced once a customer launches an initial e-commerce site, or at the commencement of a subscription term, whichever is sooner, but in either case, not until our e-commerce solutions are made available to our customers for their use. Our fees are fixed based on stated revenue share rates specified in the customer contract. We assess collectability based in part on an analysis of the creditworthiness of each customer, as well as other relevant economic or financial factors. If we do not consider collection reasonably assured, we defer the revenue until the fees are actually collected.
Subscription fees are based on a variable revenue share pricing model, whereby our customers pay us a percentage of their total gross revenue that is processed on our platform. Subscription revenue primarily consists of fees derived from contractually committed minimum levels of gross revenue processed on our platform and fees derived from our customers’ gross revenue processed above minimum contracted levels. Customers do not have the contractual right to take possession of our on-demand software. Accordingly, we recognize the minimum subscription fee on a straight-line basis over the subscription term, provided that an enforceable contract has been signed by both parties, access to our software has been granted to the customer, the fee for the subscription is fixed or determinable and collection is reasonably assured. Should a customer exceed the specified contractual gross revenue volume, the customer is required to pay us additional fees, or overage fees, for the difference between the resulting revenue share and their committed minimum fee. We recognize revenue for overage fees in the period in which the revenue is processed and earned. We do not recognize revenue in excess of the amount we have a right to invoice within an annual subscription year. Set up fees are deferred and recognized ratably over the longer of the term of the subscription agreement or the estimated expected life of the customer relationship, which generally ranges from three to six years.
We also derive revenue from services related to the subscription to our e-commerce solutions. Services revenue consists primarily of fees associated with application configuration, integration and training. Our services are performed by us directly, or by third party service providers, distributors or customers themselves without our involvement. Services that are sold with the subscription prior to the customer’s use of our e-commerce platform are recognized ratably over the longer of the term of the subscription agreement or estimated expected life of the customer relationship, which generally ranges from three to six years. We continue to evaluate the length of the estimated expected life of our customer relationships as we gain more experience with customer contract renewals.
In the first quarter of 2011 we adopted, on a prospective basis, Accounting Standards Update 2009-13 ‘‘Revenue Recognition (Topic 605)—Multiple-Deliverable Revenue Arrangements — a Consensus of the Emerging Issues Task Force,’’ or ASU 2009-13, formerly known as EITF 08-1, ‘‘Revenue Arrangements with Multiple Deliverables,’’ which amended the accounting guidance for multiple-deliverable revenue arrangements to:
| Ÿ | provide updated guidance on whether multiple deliverables exist, how the deliverables in an arrangement should be separated, and how the consideration should be allocated; |
| Ÿ | require an entity to allocate revenue in an arrangement using estimated selling prices, or ESP of each deliverable if a vendor does not have vendor-specific objective evidence of selling price, or VSOE, or third-party evidence of selling price, or TPE; and |
| Ÿ | eliminate the use of the residual method and require a vendor to allocate revenue using the relative selling price method. |
Our services that are sold after a customer launches its initial e-commerce site, which are to assist customers with the configuration and integration of our solution, have standalone value because our customers who purchase these services are already operating on our platform. Beginning on January 1, 2011, services that are sold after a customer launches an initial e-commerce site are billed
43
Table of Contents
and recognized as revenue as the services are provided. Prior to the adoption of ASU 2009-13, we did not have VSOE or TPE for the minimum subscription fees earned for the use of our on-demand e-commerce platform and such fees were considered to be an undelivered element for which fair value had not been established in accordance with FASB ASC 605-25-25 Revenue Recognition—Multiple Element Arrangements. In addition, we were not able to establish VSOE or TPE for our services that were sold after the initial contract. As a result, we recognized these services ratably over the remaining contract period. Our e-commerce solution has standalone value because once a customer launches an e-commerce site our solution is fully functional and does not require any additional development, modification or customization.
We are not able to determine VSOE or TPE for our deliverables because we have determined that there are no third-party offerings reasonably comparable to our solution. Accordingly, we determine the selling prices of subscriptions to our solution and services based on ESP. In determining ESP for subscriptions to our solution, we consider the size of customer arrangements, as measured by the volume of gross revenues processed by our customers, whether the sales were made by our direct sales team or distributors and whether the sales are to domestic or international customers. We group sales of our solution into multiple different categories based on these criteria. We then compute an average selling price for each group. This average selling price represents our ESP for that type of customer arrangement. In determining ESP for services, we analyze standalone purchases of services made subsequent to the original subscription. For these services arrangements, we then examine the actual rate per hour we charge or, for fixed fee arrangements, the implied average rate per hour based on the fixed fee divided by the estimated hours to complete the service. The ESP is the product of this average rate per hour and our estimate of the hours needed to complete the services. In evaluating and arriving at ESP for services, we also consider the reasonableness of the implied gross margins, as indicated by our internal costs to deliver such services, as well as comparisons to rates per hour for information technology consulting services in our industry generally.
The determination of ESP for our deliverables as described above requires us to make significant estimates and judgments, including the comparability of different subscription arrangements and services and estimates of the hours required to complete various types of services. In addition, we consider other factors including the following:
| Ÿ | Size and nature of the deliverables. In categorizing our subscriptions into meaningful groupings for determining ESP, we consider the size of the customer’s e-commerce business, the number of sites launched and the committed minimum subscription fee. For services, we consider the extent of the services provided and the estimated hours required to complete the service based on our historical experience. |
| Ÿ | Customer location. Our pricing is different for domestic and international customers, and therefore in determining ESP of subscriptions to our solution, we evaluate domestic arrangements separately from international arrangements. |
| Ÿ | Market conditions and competitive landscape for the sale. Our pricing and discounting varies based on the economic environment and competition. We consider these factors in determining the grouping of comparable services and the periods over which we compare arrangements to compute the ESP. |
| Ÿ | Internal costs. Our pricing for our e-commerce solution and services considers our internal costs to provide the services. |
After we determine the fair value of revenue allocable to each deliverable based on the relative selling price method for bundled arrangements, we recognize the revenue for each deliverable based on the type of deliverable. For subscriptions to our solution, we recognize the revenue on a straight-line basis over the term of the client agreement, which is typically three years. For services sold after a customer launches its initial e-commerce site, we generally recognize revenue using the proportional performance method over the period the services are performed.
44
Table of Contents
Deferred revenue represents amounts billed to customers for which revenue has not been recognized. Deferred revenue consists of the unearned portion of services fees or the unearned portion of fees from subscriptions to our on-demand e-commerce solutions.
Accounting for Stock-Based Compensation
We account for stock-based awards granted to employees and directors by recording compensation expense based on the awards’ estimated fair values. We expect that our expense related to stock-based compensation will increase over time.
We estimate the fair value of our stock-based awards as of the date of grant using the Black-Scholes option-pricing model. Determining the fair value of stock-based awards under this model requires judgment, including estimating the value per share of our common stock adjusted for our status as a private company, estimated volatility, expected term of the awards, estimated dividend yield and the risk-free interest rate. The assumptions used in calculating the fair value of stock-based awards represent our best estimates, based on management’s judgment and subjective future expectations. These estimates involve inherent uncertainties. If any of the assumptions used in the model change significantly, stock-based compensation recorded for future awards may differ materially from that recorded for awards granted previously.
In determining the fair value of our stock-based awards, we use the average volatility of similar publicly traded companies to determine our estimated volatility. For purposes of determining the expected term of the awards in the absence of sufficient historical data relating to stock option exercises for our company, we apply a simplified approach in which the expected term of an award is presumed to be the remaining contractual term as of the measurement date. The risk-free interest rate for periods within the expected life of an award, as applicable, is based on the United States Treasury yield curve in effect during the period the award granted. Our estimated dividend yield is zero, as we have not and do not currently intend to declare dividends in the foreseeable future.
Once we have determined the estimated fair value of our stock-based awards, we recognize the portion of that value that corresponds to the portion of the award that is ultimately expected to vest, taking estimated forfeitures into account. This amount is recognized as an expense over the vesting period of the award using the straight-line method. We estimate forfeitures based upon our historical experience and, at each period, review the estimated forfeiture rate and make changes as factors affecting the forfeiture rate calculations and assumptions change.
Significant Factors, Assumptions and Methodologies Used in Determining Fair Value of Common Stock
Given the absence of an active market for our common stock, our board of directors is required to estimate the fair value of our common stock at the time of each grant of stock-based awards. Since 2007, our management has regularly commissioned an independent third-party valuation firm to prepare contemporaneous valuation analyses near the time of each grant to assist our board of directors in this determination. The board of directors was informed of the most recent available valuation analysis prior to each grant date and considered that valuation along with other relevant objective and subjective factors it deemed important in each valuation, exercising significant judgment and reflecting the board of director’s best estimates at the time. These factors included:
| Ÿ | independent third-party valuations performed contemporaneously or shortly before the grant date, as applicable; |
| Ÿ | the nature and history of our business; |
45
Table of Contents
| Ÿ | our operating and financial performance; |
| Ÿ | general economic conditions and the specific outlook for our industry; |
| Ÿ | significant new customer wins by us and by our competitors and our competitive position in general; |
| Ÿ | the lack of liquidity for our non-publicly traded common stock; |
| Ÿ | the market price of companies engaged in the same or similar lines of business whose equity securities are publicly traded in active trading markets; |
| Ÿ | the differences between our preferred and common stock in terms of liquidation preferences, conversion rights, voting rights and other features; and |
| Ÿ | the likelihood of achieving different liquidity events or remaining a private company. |
We performed the valuations of our common stock in accordance with the guidelines outlined in the American Institute of Certified Public Accountants Practice Aid, “Valuation of Privately-Held-Company Equity Securities Issued as Compensation.” We first determined our enterprise value and then allocated this enterprise value to each part of our capital structure, both preferred stock and common stock. We determined enterprise value using a combination of two generally accepted approaches, the market-based approach and the income approach.
The market-based approach measures the value of an asset or business through an analysis of recent sales or offerings of comparable investments or assets. In our case, we focused on comparing our company to publicly traded comparable companies, or our benchmarked companies.
The income approach estimates value based on the expectation of future net cash flows, which are then discounted back to the present using a rate of return derived from alternative companies of similar type and risk profile. Our use of the market-based approach and income approach methods resulted in fair values for our common stock that were generally consistent with each other at each valuation date.
Given our significant focus on investing in and growing our business, we weighted the market-based approach more heavily than the income approach, generally applying between 70% and 75% weight to the market-based approach. Because we are incurring operating losses and negative operating cash flows as we grow and invest in our business, we believe that the market-based approach, which utilizes a revenue multiple, is the most useful metric for estimating our value as compared to other companies. After estimating our enterprise value, we allocated the equity between the preferred and common stock using the probability-weighted expected return method, which considers the likelihood of an initial public offering and other scenarios, such as a sale of our company.
When considering which companies to include in our benchmarked companies, we focused on two sets of companies based in the United States: publicly traded software companies that primarily deliver software using the SaaS business model similar to ours, and competitors that deliver e-commerce applications and solutions. As the benchmarked companies have either a similar business model to ours, delivering SaaS, or compete for similar customers, we believe our cost structures are similar. The selection of benchmarked companies requires us to make judgments as to the comparability of these companies to us. While the benchmarked companies are generally larger than us in terms of total revenue and assets, several of the companies, like us, are in the investment and growth stage and have experienced operating losses while they have been growing their businesses. Also, several of the comparable companies completed initial public offerings in recent years. The selection of benchmarked companies changes over time based on whether we believe the selected companies remain comparable to us. Based on these considerations, we believe that the companies we selected are a representative group for purposes of performing valuations.
46
Table of Contents
The following table summarizes all option grants from January 1, 2009 through the date of this prospectus:
| Number of Options Granted |
Per Share Exercise Price |
Common Stock Fair Value Per Share at Grant Date |
||||||||||
| Grant date |
||||||||||||
| September 29, 2009 |
835,266 | $ | 1.29 | $ | 1.29 | |||||||
| December 4, 2009 |
61,997 | $ | 1.29 | $ | 1.29 | |||||||
| February 11, 2010 |
1,601,672 | $ | 1.29 | $ | 1.29 | |||||||
| June 3, 2010 |
807,943 | $ | 1.47 | $ | 1.47 | |||||||
| July 29, 2010 |
91,302 | $ | 1.47 | $ | 1.47 | |||||||
| December 9, 2010 |
65,824 | $ | 2.34 | $ | 2.34 | |||||||
| February 21, 2011 |
122,161 | $ | 3.39 | $ | 3.39 | |||||||
| April 4, 2011 |
196,616 | $ | 5.25 | $ | 5.25 | |||||||
| April 15, 2011 |
84,166 | $ | 5.25 | $ | 5.25 | |||||||
| April 26, 2011 |
3,333 | $ | 5.25 | $ | 5.25 | |||||||
| September 20, 2011 |
184,964 | $ | 8.43 | $ | 8.43 | |||||||
Significant factors contributing to changes in common stock fair value at the date of each grant beginning in fiscal year 2009 were as follows:
September and December 2009. Our board of directors granted options to purchase 835,266 shares of common stock with an exercise price per share of $1.29 on September 29, 2009. In estimating the fair value of our common stock to set the exercise price of such options as of September 29, 2009, the board of directors reviewed and considered a final draft of an independent valuation report for our common stock as of April 30, 2009. The independent valuation report was finalized on June 23, 2009 and reflected a fair value for our common stock of $1.29 as of April 30, 2009. Our board of directors determined that there were no significant factors affecting the value of our common stock that occurred between April 30, 2009 and September 29, 2009. In addition, at the time of the September 29, 2009 grants, management had determined that we would likely meet our revised revenue goals for 2009, which was reduced from our board approved plan for 2009 and which was considered and incorporated into the April 30, 2009 independent valuation report. Though we were executing well to our revised revenue goals, new customer acquisition was slower than we planned and we eliminated certain billable service positions in August 2009 as a result of fewer customer implementation opportunities.
Two months later, on December 4, 2009, when our results were similar to prior months, our board of directors granted options to purchase 61,997 shares of common stock with an exercise price per share of $1.29. There had been no meaningful change in our performance since the last stock option grant date and therefore our board and management believed that the estimated fair value of common stock had not changed since the September 29, 2009 grant.
The primary valuation considerations were:
| Ÿ | An enterprise value of $60.9 million as of the independent valuation report date, which was determined based on a combination of the market-based and income approaches using the probability-weighted expected return method. |
| Ÿ | A discount rate of 30%, based on our estimated cost of capital. |
| Ÿ | A lack of marketability discount of 20%. |
| Ÿ | Liquidity event scenario probabilities of 15% for an initial public offering, 35% for a sale or merger and 50% for no value to the common shareholders either due to dissolution or continuing as a private company. Our board of directors determined that our operating |
47
Table of Contents
| performance, stock market conditions in general, and the market for initial public offerings in particular, were such that it was unlikely that we would be able to successfully complete an offering before 2012. |
| Ÿ | A relatively flat performance by the benchmarked companies for the quarter ended September 30, 2009 and no significant change in other factors that would warrant a change in valuation. |
| Ÿ | The macro-economic conditions at the time, with uncertainty as to whether the overall economy would rebound in 2009, and the uncertainty as to the impact of the recession on the purchasing patterns of our customer base, which was slower than both our board-approved operating plan, as well as our revised goals. |
February 2010. Our board of directors granted options to purchase 1,601,672 shares of common stock with an exercise price per share of $1.29 on February 11, 2010. In estimating the fair value of our common stock to set the exercise price of such options as of February 11, 2010, the board of directors reviewed and considered the fair value of our common stock granted since the April 30, 2009 valuation report and the results of our operations during the intervening period. Several factors and uncertainties led our board to conclude that the estimated fair value of common stock had not changed since the September 29, 2009 grant, including:
| Ÿ | Although we finished 2009 with revenue that exceeded the revenue that was assumed in our operating plan, one customer accounted for 27.9% of the total, and we had acquired new customers more slowly than our assumptions included in both our 2009 operating plan and our revised goals that were incorporated into the independent valuation report for our common stock as of April 30, 2009. |
As a result, our operating plan for 2010 assumed a lower revenue and a greater loss than had been assumed in creating the April 30, 2009 valuation.
| Ÿ | We finished 2009 with a net loss that was $2.5 million higher than our 2009 operating plan, and management concluded that an additional, unplanned investment of cash would be necessary to fund operations in 2010. |
| Ÿ | The board determined that a change in leadership was needed, and Thomas D. Ebling was engaged as Chief Executive Officer in February 2010. |
| Ÿ | The macro-economic conditions at the time, with uncertainty as to whether the overall economy would rebound in 2010, the continued uncertainty as to the impact of the recession on the purchasing patterns of our customer base and the uncertainty as to our performance under new leadership. |
June and July 2010. Our board of directors granted options to purchase 807,943 shares of common stock with an exercise price per share of $1.47 on June 3, 2010. In estimating the fair value of our common stock, our board of directors reviewed and considered an independent valuation, which was completed on May 28, 2010, that determined that the fair value of the common stock was $1.47 per share as of March 31, 2010, an increase of 14% from $1.29 at February 11, 2010.
Less than two months later, on July 29, 2010, when our results were similar to prior months, our board of directors granted options to purchase 91,302 shares of common stock with an exercise price per share of $1.47. Little had changed since the last stock option grant date and therefore our board and management believed that the estimated fair value of common stock had not changed since the June 3, 2010 grant. Although we finished the second quarter with our net loss on plan and also met our new customer acquisition metrics, the overall market conditions had declined significantly in July. Therefore our board and management believed that the estimated fair value of common stock had not changed since the June 3, 2010 grant.
48
Table of Contents
The primary valuation considerations were:
| Ÿ | An enterprise value of $63.6 million as of the independent valuation report date, which was determined based on a combination of the market-based and income approaches using the probability-weighted expected return method. |
| Ÿ | A discount rate of 30%, based on our estimated cost of capital. |
| Ÿ | A lack of marketability discount of 14%. |
| Ÿ | Liquidity event scenario probabilities of 20% for an initial public offering in 2013, 40% for a sale or merger and 40% for no value to the common shareholders either due to dissolution or continuing as a private company. Though our likelihood for an initial public offering had increased from our prior valuation, our board of directors also determined that the general initial public offering market for small technology companies was still not strong as reflected by the small number of initial public offerings in the first quarter of 2010. In addition, although we had met our board approved operating plan through the first five months of 2010, we had just raised an unplanned round of equity that we believed was needed to operate through 2010 and many of the uncertainties identified at the beginning of the year had not yet been resolved. |
| Ÿ | The increase in the estimated fair value of the common stock from September 29, 2009 to March 31, 2010 was primarily due to application of relatively similar revenue multiples we used in the prior independent valuation report of our benchmarked companies to our higher revenue forecast, resulting from our recent growth. In addition, the estimated fair value of our common stock increased due to the assignment of a higher probability for a positive outcome, either through a merger or an initial public offering, as compared to the prior independent valuation report, due to a relative reduction in risk associated with the overall macroeconomic uncertainty that existed at September 29, 2009. |
December 2010. Our board of directors granted options to purchase 65,824 shares of common stock with an exercise price per share of $2.34 on December 9, 2010. In estimating the fair value of the common stock to set the exercise price of such options as of December 9, 2010, the board of directors reviewed and considered a final draft of an independent valuation report for our common stock as of September 30, 2010. The independent valuation report was finalized on December 3, 2010 and reflected a fair value for our common stock of $2.34 as of September 30, 2010, an increase of 59.2% from $1.47 at March 31, 2010. Our board of directors determined that there were no significant factors affecting the value of our common stock that occurred between September 30, 2010 and December 9, 2010.
The primary valuation considerations were:
| Ÿ | An enterprise value of $95.3 million as of the independent valuation report date, which was determined based on a combination of the market-based and income approaches using the probability-weighted expected return method. |
| Ÿ | A discount rate of 30%, based on our estimated cost of capital. |
| Ÿ | A lack of marketability discount of 20%. |
| Ÿ | Liquidity event scenario probabilities of 20% for an initial public offering in 2012, 45% for a sale or merger and 35% for no value to the common shareholders either due to dissolution or continuing as a private company. The timing for a possible initial public offering was accelerated from 2013 to 2012 as the public markets began to improve in late 2010. Additionally, the probability for a sale or merger increased as well as we continued to operate at or above our board-approved 2010 operating plan. |
| Ÿ | Our operating performance during the nine months ended September 30, 2010 improved primarily as a result of closing significant new customer contracts, as well as realizing revenue growth from our existing customers. |
49
Table of Contents
February 2011. Our board of directors granted options to purchase 122,161 shares of common stock with an exercise price per share of $3.39 on February 21, 2011. In estimating the fair value of the common stock to set the exercise price of such options as of February 21, 2011, the board of directors reviewed and considered a final draft of an independent valuation report for our common stock as of January 1, 2011. The independent valuation report was finalized on February 15, 2011 and reflected a fair value for our common stock of $3.39 as of January 1, 2011, an increase of 44.9% from $2.34 at September 30, 2009. Our board of directors determined that there were no significant factors affecting the value of our common stock that occurred between January 1, 2011 and February 21, 2011.
The primary valuation considerations were:
| Ÿ | An enterprise value of $122.6 million as of the independent valuation report date, which was determined based on a combination of the market-based and income approaches using the probability-weighted expected return method. |
| Ÿ | A discount rate of 25%, based on our estimated cost of capital. |
| Ÿ | A lack of marketability discount of 20%. |
| Ÿ | Liquidity event scenario probabilities of 30% for an initial public offering, or IPO, in 2012, 50% for a sale or merger and 20% for no value to the common shareholders either due to dissolution or continuing as a private company. The probability for either an IPO or a sale or merger scenario increased as we had a strong 2010, particularly in the fourth quarter. |
| Ÿ | Our strong operating performance during the three months ended December 31, 2010, primarily attributable to revenue growth from our existing customers. |
April 2011. Our board of directors granted options to purchase 196,616, 84,166 and 3,333 shares of common stock with an exercise price per share of $5.25 on April 4, 2011, April 15, 2011 and April 26, 2011, respectively. In estimating the fair value of the common stock to set the exercise price of such options as of April 4, 2011 and April 15, 2011, the board of directors reviewed and considered a final draft of an independent valuation report for our common stock as of March 15, 2011. The independent valuation report was finalized on March 31, 2011 and reflected a fair value for our common stock of $5.25 as of March 15, 2011, an increase of 54.9% from $3.39 at January 1, 2011. Our board of directors determined that there were no significant factors affecting the value of our common stock that occurred between March 15, 2011 and March 31, 2011.
The primary valuation considerations were:
| Ÿ | An enterprise value of $178.6 million as of the independent valuation report date, which was determined based on a combination of the market-based and income approaches using the probability-weighted expected return method. |
| Ÿ | A discount rate of 25%, based on our estimated cost of capital. |
| Ÿ | A lack of marketability discount of 20%. |
| Ÿ | Liquidity event scenario probabilities of 35% for an IPO, 55% for a sale or merger and 10% for no value to the common shareholders either due to dissolution or continuing as a private company. The probability for an IPO scenario increased from 30% to 35% from the January 1, 2011 valuation. In addition, the timing for a possible IPO was accelerated from 2012 to three possible scenarios: late 2011, early 2012 or late 2012. The probability of an IPO increased due to progress in our business which indicated that an IPO in 2011 was more likely than previously estimated. In determining the probabilities, our board of directors determined that the IPO market appeared to be improving significantly during the first quarter of 2011, particularly within the technology sector and companies of similar size and scale to us. No value to common shareholders was deemed unlikely and assigned only a 10% probability. |
50
Table of Contents
| Ÿ | We continued to realize revenue growth from our existing customers and our total revenue in the quarter ended March 31, 2011 grew 60.1% from the comparable quarter in 2010. |
September 2011. Our board of directors granted options to purchase 184,964 shares of common stock with an exercise price per share of $8.43 on September 20, 2011. In estimating the fair value of the common stock to set the exercise price of such options as of September 20, 2011, the board of directors reviewed and considered a final draft of an independent valuation report for our common stock as of July 31, 2011. The independent valuation report was finalized on September 9, 2011 and reflected a fair value for our common stock of $8.43 as of July 31, 2011, an increase of 61% from $5.25 at March 15, 2011. Our board of directors determined that there were no significant factors affecting our business that occurred between July 31, 2011 and September 20, 2011 that would impact the value of our common stock.
The primary valuation considerations were:
| Ÿ | An enterprise equity value of $262.0 million as of the independent valuation report date, which was determined based on a combination of the market-based and income approaches using the probability-weighted expected return method. |
| Ÿ | A discount rate of 25%, based on our estimated weighted average cost of capital. |
| Ÿ | A lack of marketability discount of 15%. |
| Ÿ | Liquidity event scenario probabilities of 55% for an IPO, 40% for a sale or merger and 5% for no value to the common shareholders either due to dissolution or continuing as a private company. The probability for an IPO scenario increased from 35% to 55% from the March 15, 2011 valuation based on an increased likelihood of completing an IPO, with a 30% estimate of completing an IPO in the near term. Given our continued execution of our business plan, revenue growth and progression towards an intial public offering, no value to the common shareholders was deemed even more unlikely than at March 15, 2011 and we therefore assigned a 5% probability to this scenario. |
| Ÿ | Our strong operating performance during the six months ended June 30, 2011 as well as the beginning of the three months ended September 30, 2011, particularly related to new customer acquisition, led us to increase our financial forecasts for 2011 and 2012. In addition, we continued to realize strong revenue growth from our existing customers and our revenue in the six months ended June 30, 2011 grew 60% from the comparable period in 2010. |
On February 9, 2012, we and the underwriters determined a preliminary range for the initial public offering price. The midpoint of the preliminary range was $13.50 per share. We note that, as is typical in IPOs, the preliminary range was not derived using a formal determination of fair value, but was determined based upon discussions between us and the underwriters. Among the factors considered in setting the preliminary range were prevailing market conditions and estimates of our business potential, as described below. In addition to this difference in purpose and methodology, we believe that the difference in value between the midpoint of the preliminary range and management’s determination of the value of our common stock on September 20, 2011, $8.43 per share, was primarily the result of the following factors:
| Ÿ | The independent valuation we prepared as of July 31, 2011 contained multiple scenarios including two IPO scenarios: one occurring in 2011 and the other in 2012, with an aggregate probability of 55%; two sale scenarios: one occurring in 2011 and the other in 2012 with an aggregate probability of 40%; and one scenario with no value allocated to common shares with a probability of 5%. If we had considered in July 2011 only a single scenario with 100% probability and assumed that the IPO would be completed by early 2012, the independent valuation would have resulted in an increased fair value determination. |
51
Table of Contents
| Ÿ | The IPO scenario used in our July 31, 2011 independent valuation assumed a range of valuations for our company based on our projected revenues for 2011. In contrast, the valuation methodologies used in determining the estimated price range for this offering were based on our projected financial results for 2012 and 2013. |
| Ÿ | The overall market conditions improved significantly between September 2011 and February 2012. The average closing price of the Dow Jones Industrial Average between August 1 and September 30, 2011 was 15% lower than the closing price on February 9, 2012, when we and the underwriters determined a preliminary range for the IPO price. Only one company executed an IPO in August 2011 and there were no IPO’s in September 2011. Additionally, the stock performance of the comparable public companies identified by our underwriters was significantly greater in February 2012 than in September 2011. The median forward enterprise value to revenue multiple of the peer group identified by our underwriters was 45% lower on September 20, 2011 than on February 9, 2012. |
| Ÿ | Our convertible preferred stock currently has substantial economic rights and preferences over our common stock. The midpoint of the preliminary price range assumed the conversion of our preferred stock upon the completion of this offering and the corresponding elimination of these preferences resulting in an increased common stock valuation. |
| Ÿ | The proceeds of a successful IPO would substantially strengthen our balance sheet by increasing our cash and reducing our outstanding indebtedness. Additionally, the completion of this offering would provide us with access to the public company debt and equity markets. These projected improvements in our financial position influenced the increased common stock valuation indicated by the midpoint of the preliminary price range. |
| Ÿ | History has shown that it is reasonable to expect that the completion of an IPO will increase the value of stock as a result of the significant increase in the liquidity and ability to trade/sell such securities. However, it is not possible to measure such increase in value with precision or certainty. |
Accounting for Income Taxes
We use the liability method of accounting for income taxes. Under the liability method, deferred taxes are determined based on the temporary differences between the financial statement and tax bases of assets and liabilities, using tax rates expected to be in effect during the years in which the bases differences are expected to reverse. We record a valuation allowance when it is not more likely than not that some of our net deferred tax assets will be realized. In determining the need for valuation allowances, we consider our projected future taxable income and the availability of tax planning strategies. We have recorded a full valuation allowance to reduce our net deferred tax assets to zero, because we have determined that it is not more likely than not that any of our net deferred tax assets will be realized. If in the future we determine that we will be able to realize any of our net deferred tax assets, we will make an adjustment to the allowance, which would increase our income in the period that the determination is made.
We have assessed our income tax positions and recorded tax benefits for all years subject to examination, based upon our evaluation of the facts, circumstances and information available at each period end. For those tax positions where we have determined there is greater than 50% likelihood that a tax benefit will be sustained, we have recorded the largest amount of tax benefit that has a likelihood of greater than 50% of being realized upon ultimate settlement with a taxing authority that has full knowledge of all relevant information. For those income tax positions where we have determined there is a less than 50% likelihood that a tax benefit will be sustained, no tax benefit has been recognized in our financial statements.
52
Table of Contents
Results of Operations
The following table sets forth our statements of operations data for each of the periods indicated as a percentage of revenue. The period-to-period comparison of financial results is not necessarily indicative of future results.
| Year Ended December 31, | ||||||||||||
| 2009 | 2010 | 2011 | ||||||||||
| Consolidated Statements of Operations Data: |
||||||||||||
| Revenue: |
||||||||||||
| Subscription |
75.2 | % | 78.3 | % | 83.5 | % | ||||||
| Services |
24.8 | 21.7 | 16.5 | |||||||||
|
|
|
|
|
|
|
|||||||
| Total revenue |
100.0 | 100.0 | 100.0 | |||||||||
| Cost of revenue: |
||||||||||||
| Subscription |
18.5 | 17.0 | 16.8 | |||||||||
| Services |
53.9 | 22.6 | 18.0 | |||||||||
|
|
|
|
|
|
|
|||||||
| Total cost of revenue |
72.4 | 39.6 | 34.8 | |||||||||
|
|
|
|
|
|
|
|||||||
| Gross profit |
27.6 | 60.4 | 65.2 | |||||||||
| Operating expenses: |
||||||||||||
| Sales and marketing |
34.1 | 29.7 | 35.1 | |||||||||
| Research and development |
23.1 | 16.6 | 19.8 | |||||||||
| General and administrative |
17.4 | 11.4 | 11.6 | |||||||||
|
|
|
|
|
|
|
|||||||
| Total operating expenses |
74.6 | 57.7 | 66.5 | |||||||||
|
|
|
|
|
|
|
|||||||
| (Loss) income from operations |
(47.0 | ) | 2.7 | (1.3 | ) | |||||||
| Other (expense) income, net |
(1.1 | ) | (1.6 | ) | (0.8 | ) | ||||||
|
|
|
|
|
|
|
|||||||
| (Loss) income before income taxes |
(48.1 | ) | 1.1 | (2.1 | ) | |||||||
| Income tax expense |
0.3 | 0.4 | 0.4 | |||||||||
|
|
|
|
|
|
|
|||||||
| Net (loss) income |
(48.4 | )% | 0.7 | % | (2.5 | )% | ||||||
|
|
|
|
|
|
|
|||||||
Comparison of Years Ended December 31, 2009, 2010 and 2011
Revenue
| Year Ended December 31, | Change from 2009 to 2010 |
Change from 2010 to 2011 |
||||||||||||||||||||||||||
| 2009 | 2010 | 2011 | $ | % | $ | % | ||||||||||||||||||||||
| (dollars in thousands) | ||||||||||||||||||||||||||||
| Subscription revenue |
$ | 16,085 | $ | 28,714 | $ | 47,219 | $ | 12,629 | 78.5 | % | $ | 18,505 | 64.4 | % | ||||||||||||||
| Percentage of total revenue |
75.2 | % | 78.3 | % | 83.5 | % | ||||||||||||||||||||||
| Services revenue |
$ | 5,312 | $ | 7,976 | $ | 9,328 | $ | 2,664 | 50.2 | % | $ | 1,352 | 17.0 | % | ||||||||||||||
| Percentage of total revenue |
24.8 | % | 21.7 | % | 16.5 | % | ||||||||||||||||||||||
Subscription revenue. Subscription revenue increased by $18.5 million, or 64.4%, from 2010 to 2011. The increase was driven primarily by an increase of $13.3 million in revenue from new customers. We had 101 customers and 361 e-commerce sites operating on our platform as of December 31, 2011, an increase from 69 customers and 215 e-commerce sites operating on our platform as of December 31, 2010. In addition, revenue from existing customers grew $5.2 million from 2010 to 2011. The increase in revenue from existing customers resulted from both organic site growth and the launch of additional sites in 2011. Our customers launched 146 net new sites in 2011, an increase of 31.5% from 111 net new sites in 2010. Revenue realized from overage fees increased from $8.4 million, representing 29.4% of subscription revenue for the year ended December 31, 2010, to $16.0 million, representing 33.9% of subscription revenue for the year ended December 31, 2011.
53
Table of Contents
Subscription revenue increased $12.6 million, or 78.5%, from 2009 to 2010. The increase was driven primarily by an increase of $11.5 million in revenue from new customers. We had 69 customers and 215 e-commerce sites operating on our platform as of December 31, 2010, an increase from 40 customers and 104 e-commerce sites operating by December 31, 2009. In addition, revenue from existing customers grew $1.1 million from 2009 to 2010. The increase in revenue from existing customers resulted from both organic site growth and the launch of additional sites in 2010. Our customers launched 111 net new sites in 2010. Revenue realized from overage fees increased from $4.6 million, representing 28.8% of subscription revenue for the year ended December 31, 2009, to $8.4 million, representing 29.4% of subscription revenue for the year ended December 31, 2010.
Services revenue. Services revenue increased $1.4 million, or 17.0%, from 2010 to 2011. On January 1, 2011, we began recognizing revenue from service arrangements entered into by our customers after their initial e-commerce site launch as the services were performed using a proportional performance model, which for the year ended December 31, 2011, increased revenue by $1.4 million over what would have been recognized under the prior guidance applied in 2010. In addition, the increase was driven by a higher number of customers for which we recognized revenue from service engagements sold with the subscription prior to the customer’s initial site launch on our e-commerce platform. We recognized services revenue from 83 customers in 2011, while in 2010 we recognized services revenue from 54 customers. The increases in services revenue were partially offset by a decrease in revenue as a result of longer recognition periods in 2011 for pre-launch services recognized ratably over the longer of the term of the subscription agreement or estimated expected life of the customer relationship, which generally ranges from three to six years. We continue to evaluate the length of the estimated expected life of our customer relationships as we gain more experience with customer contract renewals.
Services revenue increased $2.7 million, or 50.2%, from 2009 to 2010. The increase was driven by an increase in the number of customers for which we were recognizing services revenue in 2010. In 2010, we recognized services revenue from 54 customers, while in 2009 we recognized services revenue from 37 customers.
Cost of Revenue
| Year Ended December 31, | Change from 2009 to 2010 |
Change from 2010 to 2011 |
||||||||||||||||||||||||||
| 2009 | 2010 | 2011 | $ | % | $ | % | ||||||||||||||||||||||
| (dollars in thousands) | ||||||||||||||||||||||||||||
| Cost of subscription revenue |
$ | 3,964 | $ | 6,222 | $ | 9,511 | $ | 2,258 | 57.0 | % | $ | 3,289 | 52.9 | % | ||||||||||||||
| Percentage of subscription revenue |
24.6 | % | 21.7 | % | 20.1 | % | ||||||||||||||||||||||
| Gross margin |
75.4 | % | 78.3 | % | 79.9 | % | ||||||||||||||||||||||
| Cost of services revenue |
$ | 11,533 | $ | 8,282 | $ | 10,196 | $ | (3,251 | ) | (28.2 | )% | $ | 1,914 | 23.1 | % | |||||||||||||
| Percentage of services revenue |
217.1 | % | 103.8 | % | 109.3 | % | ||||||||||||||||||||||
| Gross margin |
(117.1 | )% | (3.8 | )% | (9.3 | )% | ||||||||||||||||||||||
Cost of subscription revenue. Cost of subscription revenue increased $3.3 million, or 52.9%, from 2010 to 2011. The increase was primarily attributable to $1.5 million of increased depreciation and maintenance expenses associated with equipment for our data centers and $0.8 million of increased hosting and bandwidth expenses due to an expansion of our capacity to accommodate our growth during 2011. In addition, we increased our headcount in our support and technical operations team by 52.9% in 2011, growing from 17 employees at December 31, 2010 to 26 employees at December 31, 2011. As a result, our personnel and related expenses, such as salaries, bonuses,
54
Table of Contents
payroll taxes, recruiting fees and stock compensation, increased $0.8 million in 2011. Finally, we increased the use of third-party contractors in our support organization, which resulted in a $0.1 million increase in consulting expenses in 2011.
Cost of subscription revenue increased $2.3 million, or 57.0%, from 2009 to 2010. The increase was primarily attributable to a $0.8 million increase in depreciation and maintenance expenses associated with equipment for our data centers. In addition, we incurred an additional $0.8 million of increased hosting and bandwidth expenses due to an expansion of our capacity, both in North America and in Europe, and $0.2 million of increased allocated overhead costs such as rent, IT costs, and depreciation and amortization expenses incurred in order to accommodate our growth in 2010. Finally, we increased our headcount in our support and technical operations teams by 41.7% in 2010, increasing from 12 employees at December 31, 2009 to 17 employees at December 31, 2010. As a result, our personnel and related expenses increased $0.4 million in 2010.
Cost of services revenue. Cost of services revenue increased $1.9 million, or 23.1%, from 2010 to 2011. The increase was primarily attributable to $1.2 million of increased personnel and related expenses due to the addition of employees and $0.6 million of increased outside consulting expenses resulting from an increased use of third-party contractors to implement new customer e-commerce sites on our platform. The increases in headcount as well as third-party contractors resulted from an increase in the number of customer implementations conducted during 2011. In 2011, we had more customers in the implementation stage, which resulted in a 19% increase in total project hours over 2010.
Cost of services revenue decreased $3.3 million, or 28.2%, from 2009 to 2010. The decrease was primarily attributable to a reduction in third-party contractor costs that we incurred to implement new customer e-commerce sites on our platform. Contractor costs decreased $2.1 million from $5.0 million in 2009 to $2.9 million in 2010. The reduction in contractor costs resulted from a combination of utilizing lower cost resources in our customer implementations as well as an overall reduction in hours required to complete an implementation. In addition, personnel and related expenses decreased by $1.1 million from 2009 to 2010. During 2009, we streamlined our services organization and also changed the mix of employees to include more billable employees and fewer higher cost non-billable employees.
Operating Expenses
Sales and Marketing
| Year Ended December 31, | Change from 2009 to 2010 |
Change from 2010 to 2011 |
||||||||||||||||||||||||||
| 2009 | 2010 | 2011 | $ | % | $ | % | ||||||||||||||||||||||
| (dollars in thousands) | ||||||||||||||||||||||||||||
| Sales and marketing |
$ | 7,304 | $ | 10,883 | $ | 19,847 | $ | 3,579 | 49.0 | % | $ | 8,964 | 82.4 | % | ||||||||||||||
| Percentage of total revenue |
34.1 | % | 29.7 | % | 35.1 | % | ||||||||||||||||||||||
Sales and marketing expenses increased $9.0 million, or 82.4%, from 2010 to 2011. The increase was attributable to increases in marketing programs and the expansion of our sales force to address increased opportunities in new and existing markets. Total headcount within sales and marketing increased from 51 at December 31, 2010 to 76 at December 31, 2011, an increase of 49.0%. We added employees within our direct sales, business development and marketing organizations in both North America and Europe, which contributed to $4.4 million of increased personnel and related expenses in 2011. In addition, commissions and sales bonuses increased by $2.3 million, or 172.4%, in 2011 as a result of an increase in new customer contracts acquired during the year. We also incurred $0.8 million of increased marketing program expenses in 2011 to support our expansion of our
55
Table of Contents
domestic and international sales activities, including our hosting of a global customer conference in 2011; we did not host a similar conference in 2010. Finally, we incurred $1.0 million of increased travel and entertainment expenses and $0.4 million of increased allocated overhead costs, such as rent, IT costs and depreciation expenses incurred as a result of our growth.
Sales and marketing expenses increased $3.6 million, or 49.0%, from 2009 to 2010. The increase was primarily attributable to increases in marketing programs and the expansion of our sales force to address increased opportunities in new and existing markets. Total headcount in sales and marketing increased 64.5% from December 31, 2009 to December 31, 2010, with the number of employees on our direct sales teams increasing by 44.0%, contributing to an increase of personnel and related costs of $2.2 million in 2010. In addition, we incurred $0.5 million of increased marketing program expenses in 2010 to support our expansion of our domestic and international sales activities. Finally, we incurred $0.3 million of increased travel and entertainment expenses and $0.5 million of increased allocated overhead costs incurred as a result of our growth.
Research and Development
| Year Ended December 31, | Change from 2009 to 2010 |
Change from 2010 to 2011 |
||||||||||||||||||||||||||
| 2009 | 2010 | 2011 | $ | % | $ | % | ||||||||||||||||||||||
| (dollars in thousands) | ||||||||||||||||||||||||||||
| Research and development |
$ | 4,950 | $ | 6,091 | $ | 11,182 | $ | 1,141 | 23.1 | % | $ | 5,091 | 83.6 | % | ||||||||||||||
| Percentage of total revenue |
23.1 | % | 16.6 | % | 19.8 | % | ||||||||||||||||||||||
Research and development expenses increased $5.1 million, or 83.6%, from 2010 to 2011. The increase was attributable to investments made to enhance and improve the functionality of our e-commerce platform. We increased our engineering headcount by 18 employees, or 51.4%, during 2011, which contributed to increased personnel and related expenses of $3.1 million. In addition, we supplemented our internal development efforts with third-party contractors and increased the use of such resources in 2011 in order to accelerate our development efforts. As a result, we incurred increased contractor costs of $1.6 million in 2011. Finally, we incurred $0.3 million of increased allocated overhead costs, such as rent, IT costs and depreciation expenses incurred as a result of our growth.
Research and development expenses increased $1.1 million, or 23.1%, from 2009 to 2010. The increase was primarily attributable to increased headcount in both North America and Europe within our engineering group as we continued to add features and functionality to our platform. Total headcount within research and development increased from 24 at December 31, 2009 to 35 at December 31, 2010, an increase of 45.8%, which contributed to $0.9 million of increased personnel and related expenses in 2010.
General and Administrative
| Year Ended December 31, | Change from 2009 to 2010 |
Change from 2010 to 2011 |
||||||||||||||||||||||||||
| 2009 | 2010 | 2011 | $ | % | $ | % | ||||||||||||||||||||||
| (dollars in thousands) | ||||||||||||||||||||||||||||
| General and administrative |
$ | 3,729 | $ | 4,179 | $ | 6,567 | $ | 450 | 12.1 | % | $ | 2,388 | 57.1 | % | ||||||||||||||
| Percentage of total revenue |
17.4 | % | 11.4 | % | 11.6 | % | ||||||||||||||||||||||
General and administrative expenses increased $2.4 million, or 57.1%, from 2010 to 2011. The increase was driven primarily by increased employee-related costs and professional fees to support our growing business. We incurred increased personnel and related costs of $1.2 million and increased
56
Table of Contents
professional fees of $0.9 million for accounting, audit, legal and tax services incurred as a result of our growth and our pending transition from a private company to a public company. In addition, we incurred increased expenses of allocated overhead costs of $0.2 million relating to overall increased expenses to support our continual growth. Finally, we recognized a loss of $0.1 million for disposed office furniture in 2011 that we did not incur in 2010.
General and administrative expenses increased $0.5 million, or 12.1%, from 2009 to 2010. The increase was primarily attributable to $0.4 million of increased stock compensation in 2010, due to option grants to executives. The headcount in general and administrative increased from 12 employees to 14 employees from 2009 to 2010, and overall personnel expenses, excluding stock compensation, increased $0.2 million from 2009 to 2010, which was partially offset by a $0.1 million decrease in professional fees in 2010.
Other (Expense) Income
| Year Ended December 31, | Change from 2009 to 2010 |
Change from 2010 to 2011 |
||||||||||||||||||||||||||
| 2009 | 2010 | 2011 | $ | % | $ | % | ||||||||||||||||||||||
| (dollars in thousands) | ||||||||||||||||||||||||||||
| Other (expense) income |
$ | (239 | ) | $ | (582 | ) | $ | (443 | ) | $ | (343 | ) | (143.5 | )% | $ | 139 | 23.9 | % | ||||||||||
| Percentage of total revenue |
(1.1 | )% | (1.6 | )% | (0.8 | )% | ||||||||||||||||||||||
Other (expense) income decreased $0.1 million, or 23.9%, from 2010 to 2011. The decrease was attributable to foreign exchange losses of $0.1 million related to fluctuations in the British pound sterling and Euro in relation to the U.S. Dollar in 2011 compared with foreign exchange losses of $0.5 million in the 2010 period. This decrease was partially offset by an increase in 2011 of $0.2 million in interest expense on our notes payable other expenses related to a number of individually insignificant items.
Other (expense) income increased $0.3 million, or 143.5%, from 2009 to 2010. The increase was attributable to greater foreign exchange losses of $0.4 million related to fluctuations in the British pound sterling and Euro in relation to the U.S. Dollar in 2010. This increase was partially offset by other income related to a number of individually insignificant items.
Quarterly Results of Operations
The following tables set forth selected unaudited quarterly consolidated statements of operations data for each of the quarters in the years ended December 31, 2010 and 2011, as well as the percentage of total revenue for each line item shown. The financial information presented for the interim periods has been prepared on the same basis as the audited consolidated financial statements included elsewhere in this prospectus and, in the opinion of management, includes all adjustments, consisting of normal recurring adjustments, necessary for the fair presentation of the results of operations for such periods. This data should be read in conjunction with the audited consolidated financial statements and the related notes included elsewhere in this prospectus. These quarterly operating results are not necessarily indicative of our operating results to be expected for any future period.
57
Table of Contents
| Quarter Ended | ||||||||||||||||||||||||||||||||
| March 31, 2010 |
June 30, 2010 |
Sept. 30, 2010 |
Dec. 31, 2010 |
March 31, 2011 |
June 30, 2011 |
Sept. 30, 2011 |
Dec. 31, 2011 |
|||||||||||||||||||||||||
| (in thousands) |
||||||||||||||||||||||||||||||||
| Revenue: |
||||||||||||||||||||||||||||||||
| Subscription |
$ | 5,547 | $ | 6,107 | $ | 6,890 | $ | 10,170 | $ | 9,324 | $ | 10,358 | $ | 11,220 | $ | 16,317 | ||||||||||||||||
| Services |
1,701 | 1,905 | 2,042 | 2,328 | 2,280 | 2,494 | 2,255 | 2,299 | ||||||||||||||||||||||||
|
|
|
|
|
|
|
|
|
|
|
|
|
|
|
|
|
|||||||||||||||||
| Total revenue |
7,248 | 8,012 | 8,932 | 12,498 | 11,604 | 12,852 | 13,475 | 18,616 | ||||||||||||||||||||||||
|
|
|
|
|
|
|
|
|
|
|
|
|
|
|
|
|
|||||||||||||||||
| Cost of revenue: |
||||||||||||||||||||||||||||||||
| Subscription |
1,213 | 1,277 | 1,705 | 2,027 | 2,061 | 2,308 | 2,473 | 2,669 | ||||||||||||||||||||||||
| Services |
1,653 | 1,903 | 2,314 | 2,412 | 2,305 | 2,392 | 2,958 | 2,541 | ||||||||||||||||||||||||
|
|
|
|
|
|
|
|
|
|
|
|
|
|
|
|
|
|||||||||||||||||
| Total cost of revenue |
2,866 | 3,180 | 4,019 | 4,439 | 4,366 | 4,700 | 5,431 | 5,210 | ||||||||||||||||||||||||
|
|
|
|
|
|
|
|
|
|
|
|
|
|
|
|
|
|||||||||||||||||
| Gross profit |
4,382 | 4,832 | 4,913 | 8,059 | 7,238 | 8,152 | 8,044 | 13,406 | ||||||||||||||||||||||||
| Operating expenses: |
||||||||||||||||||||||||||||||||
| Sales and marketing |
1,986 | 2,686 | 2,864 | 3,347 | 4,532 | 4,771 | 5,082 | 5,462 | ||||||||||||||||||||||||
| Research and development |
1,314 | 1,408 | 1,644 | 1,725 | 2,477 | 2,934 | 2,934 | 2,837 | ||||||||||||||||||||||||
| General and administrative |
981 | 992 | 1,052 | 1,154 | 1,270 | 1,702 | 1,526 | 2,069 | ||||||||||||||||||||||||
|
|
|
|
|
|
|
|
|
|
|
|
|
|
|
|
|
|||||||||||||||||
| Total operating expenses |
4,281 | 5,086 | 5,560 | 6,226 | 8,279 | 9,407 | 9,542 | 10,368 | ||||||||||||||||||||||||
|
|
|
|
|
|
|
|
|
|
|
|
|
|
|
|
|
|||||||||||||||||
| Income (loss) from operations |
101 | (254 | ) | (647 | ) | 1,833 | (1,041 | ) | (1,255 | ) | (1,498 | ) | 3,038 | |||||||||||||||||||
| Other (expense) income, net |
(140 | ) | (565 | ) | 341 | (218 | ) | 353 | 102 | (468 | ) | (430 | ) | |||||||||||||||||||
|
|
|
|
|
|
|
|
|
|
|
|
|
|
|
|
|
|||||||||||||||||
| (Loss) income before income taxes |
(39 | ) | (819 | ) | (306 | ) | 1,615 | (688 | ) | (1,153 | ) | (1,966 | ) | 2,608 | ||||||||||||||||||
| Income tax expense |
6 | 7 | 26 | 103 | 29 | 26 | 125 | 32 | ||||||||||||||||||||||||
|
|
|
|
|
|
|
|
|
|
|
|
|
|
|
|
|
|||||||||||||||||
| Net (loss) income |
$ | (45 | ) | $ | (826 | ) | $ | (332 | ) | $ | 1,512 | $ | (717 | ) | $ | (1,179 | ) | $ | (2,091 | ) | $ | 2,576 | ||||||||||
|
|
|
|
|
|
|
|
|
|
|
|
|
|
|
|
|
|||||||||||||||||
| Quarter Ended | ||||||||||||||||||||||||||||||||
| March 31, 2010 |
June 30, 2010 |
Sept. 30, 2010 |
Dec. 31, 2010 |
March 31, 2011 |
June 30, 2011 |
Sept. 30, 2011 |
Dec. 31, 2011 |
|||||||||||||||||||||||||
| as a percentage of total revenue | ||||||||||||||||||||||||||||||||
| Revenue: |
||||||||||||||||||||||||||||||||
| Subscription |
76.5 | % | 76.2 | % | 77.1 | % | 81.4 | % | 80.4 | % | 80.6 | % | 83.3 | % | 87.7 | % | ||||||||||||||||
| Services |
23.5 | 23.8 | 22.9 | 18.6 | 19.6 | 19.4 | 16.7 | 12.3 | ||||||||||||||||||||||||
|
|
|
|
|
|
|
|
|
|
|
|
|
|
|
|
|
|||||||||||||||||
| Total revenue |
100.0 | 100.0 | 100.0 | 100.0 | 100.0 | 100.0 | 100.0 | 100.0 | ||||||||||||||||||||||||
|
|
|
|
|
|
|
|
|
|
|
|
|
|
|
|
|
|||||||||||||||||
| Cost of revenue: |
||||||||||||||||||||||||||||||||
| Subscription |
16.7 | 15.9 | 19.1 | 16.2 | 17.8 | 18.0 | 18.4 | 14.3 | ||||||||||||||||||||||||
| Services |
22.8 | 23.8 | 25.9 | 19.3 | 19.9 | 18.6 | 22.0 | 13.7 | ||||||||||||||||||||||||
|
|
|
|
|
|
|
|
|
|
|
|
|
|
|
|
|
|||||||||||||||||
| Total cost of revenue |
39.5 | 39.7 | 45.0 | 35.5 | 37.7 | 36.6 | 40.4 | 28.0 | ||||||||||||||||||||||||
|
|
|
|
|
|
|
|
|
|
|
|
|
|
|
|
|
|||||||||||||||||
| Gross profit |
60.5 | 60.3 | 55.0 | 64.5 | 62.3 | 63.4 | 59.6 | 72.0 | ||||||||||||||||||||||||
| Operating expenses: |
||||||||||||||||||||||||||||||||
| Sales and marketing |
27.4 | 33.5 | 32.1 | 26.8 | 39.1 | 37.1 | 37.7 | 29.3 | ||||||||||||||||||||||||
| Research and development |
18.1 | 17.6 | 18.4 | 13.8 | 21.3 | 22.8 | 21.8 | 15.3 | ||||||||||||||||||||||||
| General and administrative |
13.5 | 12.4 | 11.8 | 9.2 | 10.9 | 13.3 | 11.3 | 11.1 | ||||||||||||||||||||||||
|
|
|
|
|
|
|
|
|
|
|
|
|
|
|
|
|
|||||||||||||||||
| Total operating expenses |
59.0 | 63.5 | 62.3 | 49.8 | 71.3 | 73.2 | 70.8 | 55.7 | ||||||||||||||||||||||||
|
|
|
|
|
|
|
|
|
|
|
|
|
|
|
|
|
|||||||||||||||||
| Income (loss) from operation |
1.5 | (3.2 | ) | (7.3 | ) | 14.7 | (9.0 | ) | (9.8 | ) | (11.2 | ) | 16.3 | |||||||||||||||||||
| Other (expense) income, net |
(1.9 | ) | (7.1 | ) | 3.8 | (1.7 | ) | 3.0 | 0.8 | (3.5 | ) | (2.3 | ) | |||||||||||||||||||
|
|
|
|
|
|
|
|
|
|
|
|
|
|
|
|
|
|||||||||||||||||
| (Loss) income before income taxes |
(0.4 | ) | (10.3 | ) | (3.5 | ) | 13.0 | (6.0 | ) | (9.0 | ) | (14.7 | ) | 14.0 | ||||||||||||||||||
| Income tax expense |
— | 0.1 | 0.3 | 0.8 | 0.2 | 0.2 | 0.9 | 0.2 | ||||||||||||||||||||||||
|
|
|
|
|
|
|
|
|
|
|
|
|
|
|
|
|
|||||||||||||||||
| Net (loss) income |
(0.4 | ) | (10.4 | ) | (3.8 | ) | 12.2 | (6.2 | ) | (9.2 | ) | (15.6 | ) | 13.8 | ||||||||||||||||||
|
|
|
|
|
|
|
|
|
|
|
|
|
|
|
|
|
|||||||||||||||||
The following table sets forth our number of customers and the aggregate number of their e-commerce sites for the periods indicated:
| Quarter Ended | ||||||||||||||||||||||||||||||||
| March 31, 2010 |
June 30, 2010 |
Sept. 30, 2010 |
Dec. 31, 2010 |
March 31, 2011 |
June 30, 2011 |
Sept. 30, 2011 |
Dec. 31, 2011 |
|||||||||||||||||||||||||
| Customers |
46 | 53 | 60 | 69 | 75 | 78 | 91 | 101 | ||||||||||||||||||||||||
| E-commerce sites |
123 | 143 | 175 | 215 | 237 | 253 | 321 | 361 | ||||||||||||||||||||||||
In general, our revenue has increased as a result of an increase in the number of customers operating on our platform, increased deployment of multiple e-commerce sites by existing customers and increased revenue attributable to overage fees. In most of the quarters presented, we added sales and marketing personnel to focus on adding new customers and increasing penetration within our existing customer base and added technical support, services, research and development and administrative personnel to support our growth.
58
Table of Contents
Our subscription revenue fluctuates as a result of seasonal variations in our business, principally due to the peak consumer demand and related increased volume of our customer’s revenue during the holiday season. As a result, we have historically had higher subscription revenue in our fourth quarter than other quarters in a given year due to higher subscription fees derived from overage fees. In accordance with this trend, our subscription revenue in the fourth quarter of 2010 exceeded subscription revenue in the preceding three quarters, as well as the first quarter of 2011. Our subscription revenue continued to grow in each quarter of 2011 and grew significantly more in the fourth quarter due to the seasonality noted above.
Along with the seasonally higher revenue we experience in the fourth quarter, we also experience higher overall gross profits in the fourth quarter. Our cost to run our infrastructure is generally fixed within a given quarter. Therefore, when applied against our generally fixed costs, our higher revenue in the fourth quarter results in higher overall gross profits.
Sales and marketing expenses increased sequentially in every quarter presented, primarily as a result of increasing headcount in our direct and channel sales teams, as well as increased marketing programs and events. Sales and marketing expenses as a percentage of revenue varied from quarter to quarter, mainly due to revenue increasing at a higher rate than increases in our sales and marketing expenses. Sales and marketing expenses as a percentage of revenue increased from 26.8% to 29.3% from the fourth quarter of 2010 to the fourth quarter of 2011, due to growth in headcount resulting in increased quarterly employee-related costs, commissions and sales bonuses.
Research and development expenses increased sequentially in every quarter presented except for the quarter ended September 30, 2011, primarily as a result of increasing headcount to maintain and improve the functionality of our platform. Research and development expenses as a percentage of revenue increased from 13.8% to 15.3% from the fourth quarter of 2010 to the fourth quarter of 2011 due to growth in headcount and increased use of external contract developers resulting in increased quarterly employee-related costs and consulting expenses.
General and administrative expenses increased sequentially in every quarter presented except for the quarter ended September 30, 2011, primarily as a result of increasing headcount to support the growth of our business. General and administrative expenses as a percentage of revenue increased from 9.2% to 11.1% from the fourth quarter of 2010 to the fourth quarter of 2011 due to growth in headcount and professional service fees, resulting in increased quarterly employee-related costs and professional fees.
More generally, our quarterly operating results have fluctuated in the past and may continue to fluctuate in the future based on a number of factors, many of which are beyond our control. Such factors include, in addition to those in the “Risk Factors” section of this prospectus:
| Ÿ | factors affecting our customers’ gross revenue processed on our platform; |
| Ÿ | our ability to attract new customers; |
| Ÿ | the timing, committed subscription levels and revenue share rates at which we enter into contracts for our solutions with new customers; |
| Ÿ | the timing of implementations of new websites by our customers; |
| Ÿ | the extent to which our existing customers renew their subscriptions for our solutions and the timing and terms of those renewals; |
| Ÿ | our ability to manage growth, including increases in the number of customers on our platform, additional customer sites and new geographies; |
| Ÿ | the timing and success of competitive solutions offered by our competitors; |
59
Table of Contents
| Ÿ | changes in our pricing policies and those of our competitors; |
| Ÿ | the purchasing and budgeting cycles of our customers; |
| Ÿ | the financial condition of our customers; and |
| Ÿ | general economic and market conditions. |
One or more of these factors may cause our operating results to vary widely. As such, we believe that our quarterly results of operations may vary significantly in the future and that period-to-period comparisons of our operating results may not be meaningful and should not be relied upon as an indication of future performance.
Liquidity and Capital Resources
| Year Ended December 31, | ||||||||||||
| 2009 | 2010 | 2011 | ||||||||||
| (in thousands) |
||||||||||||
| Net cash (used in) provided by operating activities |
$ | (7,030 | ) | $ | 4,784 | $ | 711 | |||||
| Net cash used in investing activities |
(1,624 | ) | (5,163 | ) | (3,511 | ) | ||||||
| Net cash provided by financing activities |
14,475 | 10,377 | 657 | |||||||||
| Effect of foreign exchange rate changes on cash and equivalents |
(38 | ) | (31 | ) | (66 | ) | ||||||
| Net increase (decrease) in cash and equivalents |
5,783 | 9,967 | (2,209 | ) | ||||||||
To date, we have financed our operations primarily through private placements of preferred stock and common stock, proceeds from equipment financings as described below and cash from operating activities. As of December 31, 2011, we had $14.9 million of cash and cash equivalents.
In July 2008, we entered into a loan and security agreement, or the 2008 Loan Agreement, which included a $3.0 million secured revolving credit facility. Although the revolving credit facility expired in June 2009, the 2008 Loan Agreement was amended in May 2009 to include a $2.0 million equipment line of credit, or the Loan. Borrowings under the Loan could be made for eligible equipment purchases through December 31, 2009, and during the year ended December 31, 2009, we made borrowings totaling $1.4 million. The Loan is due in 36 equal monthly payments of principal, plus accrued interest, at an annual rate of 7.5% through December 31, 2012. In April 2010, we amended the Loan and increased the available borrowings to an additional $4.0 million for equipment purchases made through December 31, 2010, and during the year ended December 31, 2010, we made borrowings totaling $2.9 million. Each advance under this amendment is payable over 36 months at a fixed annual interest rate of 7.25%. In April 2011, we further amended the Loan and increased the available borrowings to an additional $4.0 million for equipment purchases made through March 31, 2012. As of December 31, 2011, we made borrowings under this line of $2.6 million. Each advance under the June 2011 amendment is payable over 36 months at a fixed annual interest rate of 6.0%. As of December 31, 2011, total borrowings outstanding under the Loan were $4.0 million, and we had $1.4 million of unused equipment lines available through March 31, 2012.
In August 2011, we further amended the 2008 Loan Agreement to include a secured revolving credit facility of up to $5.0 million. Under the terms of the amendment, borrowing availability varies based upon eligible accounts receivable. The credit facility expires in August 2012, and borrowings bear interest at a variable annual rate of 0.75% above prime rate. To date, we have not drawn down on our revolving credit facility.
The 2008 Loan Agreement is secured by substantially all of our assets, except our intellectual property. The 2008 Loan Agreement also contains various covenants that limit, among other things, indebtedness, investments, liens, transactions and certain mergers and sales of assets. In addition,
60
Table of Contents
the loan contains financial covenants that impose a minimum adjusted quick ratio (as defined in the 2008 Loan Agreement) and minimum quarterly revenue targets. We were in compliance with all such covenants at December 31, 2011.
We believe our current cash and cash equivalents, cash flow from operations, amounts available under our loan agreement and net proceeds of this offering will be sufficient to meet our working capital and capital expenditure requirements for at least the next 12 months.
Net cash (used in) provided by operating activities. Cash provided by operating activities is significantly influenced by the amount of cash we invest in personnel and infrastructure to support the anticipated growth of our business, the increase in the number of customers using our on-demand software and services and the amount and timing of customer payments. Cash provided by operations has historically resulted from net (loss) income driven by sales of subscriptions to our on-demand software and services and adjusted for non-cash expense items such as depreciation and amortization of property and equipment and stock-based compensation. Our cash flows from operating activities are affected by the seasonality of our business, which results in variations in the timing of, our invoicing of, and our receipt of payments from, our customers. We have generally experienced increased invoicing in the fourth quarter of each year mainly due to billings associated with revenue realized from subscription overage fees. As a result, we have also experienced increased levels of customer payments during the first quarter of each year, related to the customer receipts from fourth quarter invoices. We expect this seasonality and resulting trends in cash flows from operating activities to continue.
Our cash provided by operating activities during 2011 was primarily due to our net loss of $1.4 million, adjusted for $5.0 million in non-cash expenses that included $2.9 million of depreciation and amortization, $1.5 million in stock-based compensation and $0.2 million of deferred rent expense. Additionally, our accrued expenses increased $3.2 million primarily due to the use of third-party consultants assisting our client services team in implementing our new customers onto our platform, commissions owed due to new customer acquisition during the period, and other employee related costs. This source of cash was partially offset by a $5.5 million increase in accounts receivable as a result of higher billings in 2011 and a $0.1 million decrease in deferred revenue from customers who were invoiced annually prior to the beginning of the fiscal year.
Our cash provided by operating activities during 2010 was primarily due to our net income of $0.3 million, as our revenue growth, particularly in the fourth quarter, drove net income for the year despite growing operating expenses in 2010 by 32.3%. Cash provided by operating activities was adjusted for $2.9 million in non-cash expenses that included $1.7 million of depreciation and amortization and $1.0 million in stock-based compensation. Working capital uses of cash included a $2.2 million increase in accounts receivable at year end due to higher customer billing volume compared to the prior year mainly due to the increase in revenue from overage fees in the fourth quarter, and a $1.4 million increase in prepaid expense and other assets for prepaid support costs to maintain our increased number of PODs and for value added tax refunds back to us. These uses of cash were offset in part by a $3.6 million increase in deferred revenue, due to more customers on our platform in 2010, a $0.8 million increase in accrued expenses, and a $0.8 million increase in accounts payable due to a higher level of expenses consistent with the overall growth of our business.
Our cash used in operating activities during 2009 was primarily due to our net loss of $10.4 million, as we focused on making additional investments in headcount and infrastructure to service existing growth and in anticipation of future growth. Cash used in operating activities was adjusted for $1.9 million in non-cash expenses that included $1.4 million of depreciation and amortization and $0.5 million in stock-based compensation. Working capital uses of cash included a $3.3 million increase in accounts receivable due to higher customer billing volume compared to the prior year. Additionally, working capital uses of cash included a $1.4 million decrease in accrued expenses, and a
61
Table of Contents
$1.7 million decrease in accounts payable both due to a lower level of contractor use in 2009 compared to the prior year. These uses of cash were partially offset by an $8.2 million increase in deferred revenue, due to more customers on our platform in 2009.
Net cash used in investing activities. Our primary investing activities have consisted of capital expenditures to purchase computer equipment and furniture and fixtures in support of expanding our infrastructure and workforce. As our business grows, we expect our capital expenditures and our investment activity to continue to increase.
For the year ended December 31, 2011, cash used in investing activities consisted of $3.5 million for purchases of property and equipment. In general, our purchases of property and equipment are primarily for data center equipment and network infrastructure to support our customer base, as well as equipment for supporting our increasing employee headcount.
For the year ended December 31, 2010, cash used in investing activities consisted primarily of $4.9 million for purchases of property and equipment, primarily for the build out of our data center equipment and network infrastructure to support our customer base, as well as furniture and equipment to build out our corporate offices in Burlington, Massachusetts.
For the year ended December 31, 2009, cash used in investing activities consisted primarily of $1.4 million for purchases of property and equipment, primarily for the build out of our data center equipment and network infrastructure to support our customer base.
Net cash provided by financing activities. Our primary financing activities have consisted of capital raised to fund our operations as well as proceeds from and payments on equipment debt obligations entered into to finance our property and equipment, primarily equipment used in our data centers. As our business grows, we expect to continue to finance our capital expenditures through equipment debt vehicles.
For the year ended December 31, 2011, cash provided by financing activities consisted of $1.6 million in proceeds from the issuance of our common stock in connection with stock option exercises as well as $2.6 million in proceeds from a note payable in connection with the financing of property and equipment, partially offset by $1.9 million in payments in connection with our equipment debt obligations as well as $1.7 million legal and audit fees associated with filing our registration statement.
For the year ended December 31, 2010, cash provided by financing activities consisted of $7.4 million in proceeds from the issuance of Series D preferred stock, $1.0 million in proceeds from the issuance of our common stock in connection with stock option exercises, $2.9 million in proceeds from notes payable in connection with the financing of property and equipment, partially offset by $0.9 million in payments in connection with our equipment debt obligations.
For the year ended December 31, 2009, cash provided by financing activities consisted of $10.0 million in proceeds from the issuance of Series D preferred stock, $3.3 million in proceeds from the issuance of notes payable to stockholders, which were later converted into Series D preferred stock, and $1.4 million in proceeds from notes payable in connection with the financing of property and equipment, partially offset by $0.2 million in payments in connection with our equipment debt obligations.
Contractual Obligations and Commitments
Our principal commitments consist of obligations under our outstanding debt facilities, leases for our office space, computer equipment, furniture and fixtures, and contractual commitments for hosting
62
Table of Contents
and other support services. The following table summarizes these contractual obligations at December 31, 2011 (in thousands):
| Payment Due by Period | ||||||||||||||||||||
| Total | Less than 1 Year |
1-3 Years |
3-5 Years | More than 5 years |
||||||||||||||||
| (in thousands) |
||||||||||||||||||||
| Operating lease obligations |
$ | 5,564 | $ | 963 | $ | 3,126 | $ | 1,475 | $ | — | ||||||||||
| Equipment notes payable |
3,980 | 2,098 | 1,882 | — | — | |||||||||||||||
| Hosting agreements |
1,087 | 912 | 175 | — | — | |||||||||||||||
|
|
|
|
|
|
|
|
|
|
|
|||||||||||
| $ | 10,631 | $ | 3,973 | $ | 5,183 | $ | 1,475 | $ | — | |||||||||||
Off-Balance Sheet Arrangements
During the periods presented, we did not have any relationships with unconsolidated entities or financial partnerships, such as entities often referred to as structured finance or special purpose entities, which would have been established for the purpose of facilitating off-balance sheet arrangements or other contractually narrow or limited purposes.
Quantitative and Qualitative Disclosures about Market Risk
We have operations both within the United States and internationally, and we are exposed to market risks in the ordinary course of our business. These risks primarily include interest rate, foreign exchange and inflation risks, as well as risks relating to changes in the general economic conditions in the countries where we conduct business. To reduce certain of these risks, we monitor the financial condition of our large customers and limit credit exposure by collecting fees in advance and setting credit limits as we deem appropriate. In addition, our investment strategy currently has been to invest in financial instruments that are highly liquid and readily convertible into cash and that mature within three months from the date of purchase. To date, we have not used derivative instruments to mitigate the impact of our market risk exposures. We have also not used, nor do we intend to use, derivatives for trading or speculative purposes.
Interest Rate Risk
We are exposed to market risk related to changes in interest rates. Our investments are considered cash equivalents and primarily consist of money market funds backed by United States Treasury Bills and certificates of deposit. At December 31, 2011, we had cash and cash equivalents of $14.9 million. The carrying amount of our cash equivalents reasonably approximates fair value, due to the short maturities of these instruments. The primary objectives of our investment activities are the preservation of capital, the fulfillment of liquidity needs and the fiduciary control of cash and investments. We do not enter into investments for trading or speculative purposes. Our investments are exposed to market risk due to a fluctuation in interest rates, which may affect our interest income and the fair market value of our investments. Due to the short-term nature of our investment portfolio, however, we do not believe an immediate 10% increase or decrease in interest rates would have a material effect on the fair market value of our portfolio. We therefore do not expect our operating results or cash flows to be materially affected by a sudden change in market interest rates.
We do not believe our cash equivalents have significant risk of default or illiquidity. While we believe our cash equivalents do not contain excessive risk, we cannot provide absolute assurance that in the future our investments will not be subject to adverse changes in market value. In addition, we maintain significant amounts of cash and cash equivalents at one or more financial institutions that are in excess of federally insured limits. We cannot be assured that we will not experience losses on these deposits.
63
Table of Contents
At December 31, 2011, we had borrowings outstanding with principal amounts of $4.0 million. Our outstanding long-term borrowings consist of fixed interest rate financial instruments. The interest rate of our fixed rate borrowings ranges between 6.0% and 7.5%. The carrying amount of these long-term borrowings approximates fair value based on borrowing rates currently available to us. A hypothetical 10% increase or decrease in interest rates relative to interest rates at December 31, 2011 would not have a material impact on the fair values of all of our outstanding borrowings.
Foreign Currency Exchange Risk
We have foreign currency risks related to our revenue and operating expenses denominated in currencies other than the U.S. Dollar. Our customer contracts are generally denominated in the currencies of the countries in which the customer is located. Our historical revenue has been denominated in U.S. Dollars, the Euro and British Pound Sterling. An immediate 10% adverse change in foreign exchange rates on foreign-denominated accounts receivable at December 31, 2011 would have a 4% adverse impact on our total accounts receivable balance at December 31, 2011. Our operating expenses are generally denominated in the currencies of the countries in which our operations are located, primarily the United States and, to a much lesser extent, the United Kingdom and Germany. More than one quarter of our employees are located in a country other than the United States. Increases and decreases in our foreign denominated revenue from movements in foreign exchange rates are partially offset by the corresponding decreases or increases in our foreign-denominated operating expenses.
As our international operations grow, our risks associated with fluctuation in currency rates will become greater, and we will continue to reassess our approach to managing this risk. In addition, currency fluctuations or a weakening U.S. Dollar can increase the costs of our international expansion. To date, we have not entered into any foreign currency hedging contracts, since exchange rate fluctuations have not had a material impact on our operating results and cash flows. Based on our current international structure, we do not plan on engaging in hedging activities in the near future.
Inflation Risk
We do not believe that inflation has had a material effect on our business, financial condition or results of operations. Nonetheless, if our costs were to become subject to significant inflationary pressures, we may not be able to fully offset such higher costs through price increases. Our inability or failure to do so could harm our business, financial condition and results of operations.
64
Table of Contents
Overview
We are a leading provider of software-as-a-service e-commerce solutions that enable companies to easily design, implement and manage their own customized e-commerce sites, including websites, mobile applications and other digital storefronts. Our customers use our highly scalable and integrated Demandware Commerce platform to create a seamless brand experience for consumers across all digital touch points worldwide. By simplifying access to the complex e-commerce functionality required for an effective and engaging consumer experience, we enable our customers to more easily launch, manage and integrate multiple e-commerce sites, initiate marketing campaigns more quickly and improve e-commerce site traffic, all of which can lead to increased revenue. Our on-demand platform offers the high reliability and security required by customers for their e-commerce sites, in addition to automatic increases in the processing capacity of our customers’ e-commerce sites to meet surges in demand. Through our software-as-a-service, or SaaS, multi-tenant delivery model, we combine the functionality, flexibility and customization capabilities of in-house solutions with the lower costs, speed of implementation and other operational benefits of outsourcing.
Through our on-demand SaaS platform, our customers run the latest version of our software and have access to a steady stream of new and innovative e-commerce functionality as soon as it becomes available. By using our platform, our customers avoid the need for a large upfront investment in on-premise hardware infrastructure and in customized software that is difficult and expensive to implement, upgrade and maintain. They also avoid the limitations of generic vendor-created e-commerce solutions that typically do not offer the flexibility and functionality necessary for merchants and retailers to create, manage and control their own customized online brand presence. We have built a marketplace called Demandware LINK that leverages our open development platform to allow our customers quickly and easily to use an extensive library of integrations to third-party applications that can reduce the cost and complexity of adding capabilities, such as campaign management, dynamic product imaging, order management, social commerce and ratings and reviews. Through our network of data centers, we continually monitor the environment in which our customers’ e-commerce sites operate for performance, availability and accuracy of content delivery. We have provided 99.98% average site availability (excluding planned downtime) since 2005.
Our customers include multinational corporations, large retailers and branded consumer product manufacturers, such as Barneys New York, Burton, Columbia Sportswear, Crocs, House of Fraser, Jewelry Television, Jones Apparel Group, Lifetime Brands, L’Oreal and neckermann.de. We sell our solutions domestically and internationally through both direct and indirect channels. We have direct sales teams throughout North America and Europe and distributor relationships with full service e-commerce vendors that combine our Demandware Commerce platform with a host of complementary services and technologies, such as logistics and warehousing, to provide comprehensive end-to-end e-commerce solutions. See Note 2 to the consolidated financial statements included elsewhere in this prospectus for information on our operations in different geographic regions.
We have structured our contracts to align our interests with those of our customers by participating in a share of our customers’ gross revenue processed on our platform. We derive our subscription revenue from fees paid to us by our customers for their access to our e-commerce solutions for a specified period of time. Our fees are based on a percentage of the total gross revenue our customers process through their e-commerce sites, which operate on our platform, and include a committed level of annual gross revenue from which a minimum subscription fee is derived. If a customer exceeds that baseline subscription amount, we are paid a percentage of the gross revenue processed by that customer on our platform in excess of its committed minimum subscription. Our customer contract terms are typically three years and range from one year to seven years.
65
Table of Contents
Since our inception, we have expanded our offerings and customer base through organic growth. The following charts show the aggregate number of customers using Demandware Commerce and the aggregate number of their e-commerce sites operating on our platform, from March 31, 2008 to December 31, 2011.
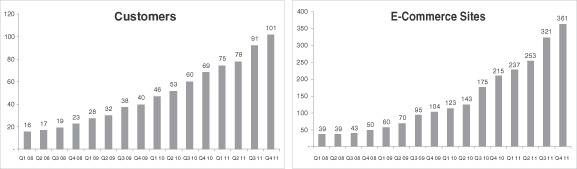
We generated revenue of $21.4 million, $36.7 million and $56.5 million in 2009, 2010 and 2011, respectively. We had a net loss of $10.4 million, net income of $0.3 million, and a net loss of $1.4 million in 2009, 2010 and 2011, respectively.
Industry Overview
E-Commerce is a Key Driver of Growth for the Retail Industry
We believe our total addressable market is at the center of three large and growing industries: retail, e-commerce and SaaS. According to Euromonitor, the global retail industry in 2010 was $11.6 trillion, of which only 2.7% was conducted online. The overall global retail industry grew at a 4.8% compound annual growth rate, or CAGR, from 2005 to 2010, while the global e-commerce market grew at a 17.3% CAGR over the same period to reach $316.5 billion in 2010, demonstrating the significant service shift from offline to online retail during this period and the increasing importance of e-commerce within the retail industry. The global e-commerce industry is expected to reach $653.0 billion in 2015, growing at a CAGR of 15.6% from 2010 to 2015. In addition, the adoption of SaaS solutions has grown significantly, and, according to Gartner, estimated worldwide total software revenue for SaaS delivery within the enterprise application software markets is expected to grow at a CAGR of 17.9% from $10.0 billion in 2010 to $22.7 billion in 2015, and the adoption of cloud-enabled e-commerce platform services is expected to grow at a CAGR of 21.3% from $4.3 billion in 2010 to $11.3 billion in 2015.
The double-digit growth of the e-commerce market is being driven by several factors, including ubiquitous broadband internet connectivity across an increasing number of devices, growing consumer familiarity and comfort with and preference for online shopping and new online shopping models such as social shopping, group buying and flash sales. The increase in the number of manufacturers seeking to market their brands directly to consumers through their own e-commerce sites has also been a major contributor to this growth.
Increasing Complexity of E-Commerce
While the e-commerce market is expanding, it is also becoming more complex, particularly for global multi-channel retailers and branded consumer product manufacturers trying to reach consumers with consistent storefronts across multiple channels, geographies and digital touchpoints. Several trends are driving this increased complexity:
| Ÿ | Need to Maintain Scale and Global Presence. Companies that are unable to maintain the quality and functionality of their e-commerce sites as they grow risk losing both existing and prospective consumers domestically and internationally. Significant infrastructure can be required to provide a reliable online presence that can be quickly and easily scaled to meet growing worldwide consumer demands. |
66
Table of Contents
| Ÿ | Increasing Consumer Demand for Compelling Content and Commerce. As the speed, functionality and sophistication of internet applications continue to improve, consumers increasingly expect a rich, interactive and personalized e-commerce experience, such as active merchandising, social commerce, dynamic product imaging and ratings and reviews. In order for businesses to remain competitive, they must be able to dynamically update and personalize their product offerings to stay current with emerging consumer trends and rising consumer expectations. |
| Ÿ | Proliferation of Retail Channels. E-commerce is expanding beyond traditional web storefronts viewed on a personal computer due to the rapid proliferation of internet-enabled devices, including in-store kiosks, smart phones, tablets, and other devices, allowing consumers to access information and shop through an increasing number of digital retail channels. Consumers increasingly expect a consistent, high-quality and relevant experience across all digital retail channels. |
| Ÿ | Integration of Systems and Business Processes. Businesses have dramatically recast their online presence from static e-commerce sites focused mainly on presentation of basic product information or simple purchasing to dynamic, interactive hubs for consumer marketing, transactions, communications and services. Businesses require robust, scalable and global e-commerce solutions that can integrate with other enterprise solutions, such as enterprise resource planning, customer relationship management, order management, call centers, supply chain management and business intelligence systems. |
| Ÿ | Rapid Pace of Innovation. Technology to facilitate e-commerce is rapidly evolving. For example, new internet-enabled devices are continually developed, updated and made available to consumers at low cost. As the switching costs for consumers adopting the newest technologies remain low and new shopping models evolve, the pressure for companies to keep up with the pace of innovation increases. Companies must be able to invest in and implement new innovative technologies quickly and cost-effectively to be able to reach consumers through new devices or channels, or risk losing them. |
Limitations of Traditional E-Commerce Solutions
Traditionally, there have been two common solutions for the creation and management of an e-commerce business: on-premise enterprise software, which is built, customized and maintained by the merchant itself; and outsourcing, where the entire e-commerce platform for a retailer or brand is outsourced to a third-party provider. While traditional on-premise enterprise software solutions offer the benefits of in-house control and differentiation through custom development, they typically have the following disadvantages:
| Ÿ | Higher Upfront Cost. On-premise software implementations are typically architected to be deployed with large information technology, or IT, teams and require significant upfront investments. These solutions can be ineffective for today’s retailers and branded consumer product manufacturers, who prefer to focus on their core competencies, such as managing their brands and merchandising their products, rather than maintaining IT infrastructure and e-commerce performance. |
| Ÿ | Difficult to Maintain, Upgrade and Scale. Maintenance of traditional on-premise solutions is characterized by ongoing software implementations and on-premise customizations that require significant IT investment before, during and after the upgrade. These internal customizations make it time-consuming and expensive to enhance functionality and also make it difficult for retailers to easily upgrade to the newest release from a software provider. It is also challenging and expensive to scale the required infrastructure, particularly to meet surges in demand. |
67
Table of Contents
While outsourcing an e-commerce site offers the benefits of minimal required resources for internal infrastructure management and ongoing support, it has the following disadvantages:
| Ÿ | Limited Customization and Functionality. Vendor-created outsourced solutions offer limited platform flexibility, making it difficult to change functionality or to control merchandising. This can be unsatisfactory for retailers, who prefer to proactively manage and control their online brand presence given the critical nature of brand as a key differentiator in today’s retail environment. |
| Ÿ | Lack of Integration with Business Processes. The online presence of many retailers has evolved from a simple website to a cross-channel hub for marketing, transactions, communications and services. The lack of innovation and extendibility of a fully outsourced solution, in addition to the lack of integration with business processes, can limit retailers’ ability to effectively manage their brands across multiple channels. |
Opportunity for Software-as-a-Service E-Commerce Solutions
A SaaS delivery model can combine the lower costs, speed of implementation and other operational benefits of outsourcing with the functionality, flexibility and customization capabilities of on-premise enterprise software solutions. As a result, the adoption of SaaS solutions across industries has grown significantly and outpaced the growth of traditional on-premise enterprise software product delivery. In addition, the adoption of SaaS solutions has grown significantly, and, according to Gartner, estimated worldwide total software revenue for SaaS delivery within the enterprise application software markets is expected to grow at a CAGR of 17.9% from $10.0 billion in 2010 to $22.7 billion in 2015, and the adoption of cloud-enabled e-commerce platform services is expected to grow at a CAGR of 21.3% from $4.3 billion in 2010 to $11.3 billion in 2015.
E-commerce is a critical strategy for a significant number of branded consumer product manufacturers and retailers worldwide. In the e-commerce market, we believe there is a significant opportunity for a company that can offer a comprehensive SaaS solution designed to address the increasingly complex requirements of retailers and brands seeking to attract and satisfy consumers in the digital world.
The Demandware Solution
Demandware Commerce combines enterprise-class e-commerce capabilities and functionality with a SaaS multi-tenant delivery model. We deliver our solutions on-demand to enable our customers to more easily launch and manage multiple sites, initiate marketing campaigns more quickly and improve site traffic, all of which can lead to increased revenue. We believe that our on-demand solutions provide the following benefits to our customers:
| Ÿ | Broad Merchandising Functionality. Our platform uses a web-based interface to provide one central location for our customers to control and manage their e-commerce sites – from products to pricing to placement to content. A robust set of sophisticated, yet easy-to-use merchandising tools, including catalog management, customer profiling, pricing, promotions and e-commerce search, provides retailers with enhanced functionality and control to help optimize their e-commerce sites’ efficiency, growth and profitability. Our solutions are able to easily categorize, price, and display products, while efficiently presenting multiple cross-channel promotions, enabling merchandisers to optimize the online shopping experience of their consumers while driving greater revenue. Our functionality also helps retailers strengthen consumer loyalty by delivering tailored user experiences across all digital channels. |
| Ÿ | High Reliability, Safety and Security. We provide high uptime, robust security and built-in disaster recovery through our network of state-of-the-art data centers. We have provided 99.98% average availability (excluding planned downtime) since 2005. Our flexible on-demand platform allows us to quickly and seamlessly increase the processing capacity of our |
68
Table of Contents
| customers’ e-commerce sites to meet surges in demand. We also provide 24/7 monitoring of the environment in which our customers’ e-commerce sites operate, measuring for performance, availability and accuracy of content delivery. Our platform is supported by a dynamic cloud-based architecture and complies with the Payment Card Industry, or PCI, security standards, which is generally referred to as PCI-compliant. Our platform has been benchmarked to handle at least 1,400 dynamic page views per second. |
| Ÿ | Ease of Deployment and Reduced Time To Market. Using our Demandware Commerce platform, customers can easily deploy new e-commerce sites without the need to install or integrate their own hardware and software infrastructure. In addition, customers can leverage our platform to quickly and easily add new sites without the need to expand their own infrastructure. Through Demandware LINK, our customers can access an extensive library of integrations to third-party applications to expand the capabilities and functionality of their e-commerce sites. These features enable our existing customers to accelerate their time-to-market for new e-commerce sites and quickly implement new functionality. In addition, we believe that our typical four to six month platform implementation cycle for new customers is shorter than the period generally required for the development and deployment of comparable on-premise e-commerce software solutions. |
| Ÿ | Customizable E-Commerce Sites. Demandware Commerce allows our customers to quickly and easily customize and deliver a highly flexible digital storefront, using our powerful and intuitive tools based on procedural programming languages such as JavaScript. This gives our customers the flexibility and control of a custom development environment with the convenience, scalability and security of on-demand, multi-tenant delivery. Our open development environment allows our customers’ developers to customize the front-end of their e-commerce sites while sharing our multi-tenant on-demand merchandising platform. As a result, developers and IT professionals can focus their efforts and resources on innovation rather than infrastructure. |
| Ÿ | Continuous Innovation. Consumers increasingly expect greater functionality and relevance from their online experience. Through our SaaS platform, we are able to provide a steady stream of new and innovative e-commerce functionality through multiple product upgrades each year, which our customers can deploy to access the latest technologies on their e-commerce sites. Our customization and integration changes are implemented through automatic upgrades with minimal or no effort required by our customers so they can avoid the time and expense associated with constantly upgrading to new versions with traditional providers. When we enhance our enterprise-class platform, our entire customer community benefits from our latest innovations by being on the same release cycle. In addition to our internal product development work, we work collaboratively with our customers on an ongoing basis to enhance and improve our solutions based on their specific functional requests. |
Our Strategy
Our mission is to extend our position as a leading provider of SaaS e-commerce solutions to become the global backbone for digital commerce between retailers or branded consumer product manufacturers and their consumers. Key elements of our strategy include:
Retaining and Expanding Business with Existing Customers. As our solutions become increasingly integral to our customers’ digital commerce success, we expect to maintain our strong retention rates by providing our customers with high levels of service and support as well as new e-commerce capabilities and functionality. We have structured our contracts to align our interests with those of our customers by participating in a share of our customers’ gross revenue processed on our platform. We believe we have the following opportunities to grow our business with our customers:
| Ÿ | Increasing Customers’ Gross Revenue. Because we share in the gross revenue processed by customers on our platform, we also share an interest in optimizing the effectiveness, |
69
Table of Contents
| engagement and performance of our customers’ e-commerce sites. Early in the site implementation process, we assign an e-commerce strategist to engage with our customers to ensure that their goals are met. Once our customers’ sites are operating on our platform, their assigned e-commerce strategist works hand-in-hand with our customers’ e-commerce teams to help grow their revenue by taking full advantage of the functionality of Demandware Commerce. |
| Ÿ | Increasing the Number of Customers’ E-Commerce Sites. We intend to expand the adoption of Demandware Commerce within our existing customers’ organizations. After initial deployments, many of our customers seek to expand their e-commerce presence by launching additional distinct revenue-generating e-commerce sites for different geographies, brands and channels on our Demandware Commerce platform. Our single instance code base allows our customers to launch e-commerce sites for multiple brands or in multiple geographies cost-effectively and with minimal involvement from their internal IT staff. |
| Ÿ | Extending the Platform Across Channels. The internet is a central hub for our customers’ digital commerce strategies. We have and will continue to extend Demandware Commerce to support channels where consumers want to shop, including smart phones, social networks, call centers and in-store kiosks. A significant part of our strategy includes keeping up-to-date on emerging trends in how consumers shop and making sure we have the functionality on our platform to enable that type of activity. |
Growing Our Customer Base. A significant element of our strategy involves winning new customers. We believe that managing a successful e-commerce operation is more demanding and complex than ever and companies will increasingly migrate to solutions like ours. We believe the continued growth of e-commerce as a strategic and differentiated sales channel provides us with a significant opportunity to acquire new customers by:
| Ÿ | Investing in Direct Sales. A significant portion of our market includes companies that are currently using on-premise or outsourced e-commerce platforms that were not designed for advanced merchandising, marketing and customer experience innovation and that do not offer the benefits of a SaaS solution. There are also companies that have an online presence but do not facilitate e-commerce transactions. As a result, we plan to grow both our enterprise and mid-market direct sales teams to win more of these customers domestically and internationally. |
| Ÿ | Significantly Growing our European Operations. We believe a substantial opportunity exists to continue to grow sales of our solutions internationally, particularly in Europe. We intend to continue to grow our European operations by further investing in direct sales, strategic alliances, services and support in the region. |
| Ÿ | Expanding and Strengthening Our Strategic Alliances. We have strategic relationships with companies such as eCommera, NETRADA and PFSweb that provide full-service end-to-end e-commerce solutions by combining our Demandware Commerce platform with a host of complementary services and technologies, such as logistics and warehousing. We intend to continue to grow our distribution channels through these key alliances, as well as build new alliances. |
Targeting New Markets. We believe substantial demand for our solutions exists in industry sectors, customer segments and geographic regions beyond those on which we are currently focused, including:
| Ÿ | Small- and Medium-Sized Businesses. We are building a sales team to target small- and medium-sized retailers and emerging brands that are just starting to implement their e-commerce strategies and want to quickly scale their online business through strategies that may include mobile commerce, social media, multiple branded sites and international expansion. We also plan to expand our alliances to increase our distribution capabilities for customers in the early stage of developing their e-commerce capabilities. |
70
Table of Contents
| Ÿ | Asia Pacific. We currently assist customers in launching and managing e-commerce sites for consumers in the Asia Pacific region. We also expect to build sales and service operations in the Asia Pacific region. |
Continuing to Innovate and Add New Functionality to Our Platform. We believe we have developed a deep understanding of the digital commerce challenges faced by our customers. We continually collaborate with our customers to build extensive product functionality that addresses their specific needs and requests. We plan to use our expertise in e-commerce to develop new applications, features and functionality that will enhance our solutions and expand our addressable market. We also plan to add incremental functionality to our applications opportunistically through acquisitions and to invest in our Demandware LINK program by adding new partners and expanding our relationship with current partners so that our customers have access to a growing library of integrations to third-party applications.
Products and Services
Demandware Commerce Platform
We offer a comprehensive on-demand e-commerce platform, a network of alliance partners that extends the value of the platform, and a business model designed for sustained customer revenue growth. We deliver our solutions on-demand to our customers who can access and can manage it over the internet using a standard web browser. We have built our solutions using a single code base and a multi-tenant, multi-user architecture that we host.
The following diagram illustrates the key interactive channels and various components of our Demandware Commerce platform:
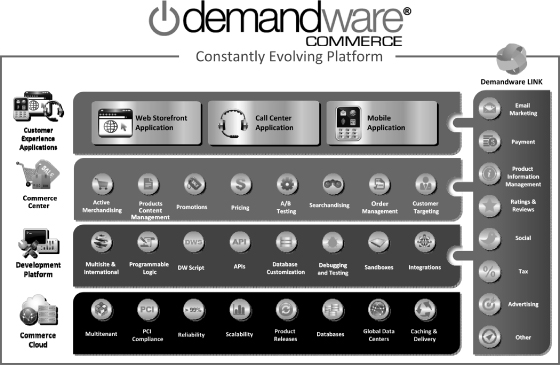
71
Table of Contents
Customer Experience Application. Demandware Commerce provides a single platform that our customers can use to manage consumer interactions across all digital touch points worldwide, enabling a seamless and consistent brand experience on any channel. Our reference applications are based on e-commerce best practices and can be customized to individual needs, with full access to a sophisticated cross-channel merchandising engine and open development environment. Our applications include:
| Ÿ | Web Storefront Applications. With Demandware Commerce, a customer can build a new e-commerce site from scratch or leverage our best practices pre-built storefront, called Site Genesis, to gain quicker time to market. The Site Genesis storefront provides merchandisers with best practice examples of how to run and manage promotions, dynamic search tools, synonym dictionaries and price books. It also includes a multi-site blueprint for technical architects. The Site Genesis storefront can be used as is with out-of-the-box functionality or can be leveraged as a starting point for an e-commerce site that could then be further customized using our UX Studio application to meet a customer’s unique requirements. |
| Ÿ | Call Center Application. Our call center application allows our customers’ call center agents to quickly access order, consumer and product information through a single web-based interface, enabling a more efficient and engaging experience for the consumer. Using this application, agents are able to easily search for products using advanced search techniques and guided navigation. In addition to providing improved customer service, agents can use this software to gain a single view into a consumer’s entire order history and recommend products using rules established by our merchandising tools. |
| Ÿ | Mobile Application. Our mobile application offers a customizable mobile storefront with the functionality our customers need to create a compelling shopping experience for consumers on their mobile devices. Our Demandware Commerce platform provides a unified development environment between the mobile storefront and our customers’ other e-commerce sites for ease of customization and site management. Our mobile application is compatible with all major browsers and with popular smart phones, such as the iPhone, Android and BlackBerry. |
Demandware Commerce Center. Demandware Commerce Center is a centralized and unified application for control and management of all consumer e-commerce experiences across multiple sites and channels. Unlike traditional work environments that require multiple interfaces to manage processes across products, merchandising, consumers, orders and sites, Demandware Commerce Center provides one central access point for management. In addition, users are able to create customized dashboards to display the most commonly used activities and thus increase their efficiency and enhance their ability to manage and change consumer experiences.
Our sophisticated, yet easy-to-use merchandising capabilities enable retailers to deliver tailored user experiences across all digital channels, launch and manage multiple sites, quickly initiate marketing campaigns, improve site traffic and increase revenue. Our capabilities include the following:
| Ÿ | Active Merchandising, which is a metrics-driven online selling engine that controls merchandising interactions across search, personalization, analytics, promotions and catalog according to rules created by each of our customers. |
| Ÿ | Products & Catalogs, which enables merchants to manage seasonal, branded and future product offerings across categories, catalogs and sites. |
| Ÿ | Promotions, which consists of multiple configuration options for creating and controlling product promotions, including over 50 commonly used promotions that can be combined for desired results. |
| Ÿ | Pricing, which consists of a flexible pricing model that allows the merchant to control pricing across multiple catalogs and sites. |
72
Table of Contents
| Ÿ | A/B Testing, which allows merchants to perform comparison tests to determine which merchandise is most often selected, which advertisements are the most appealing and which promotions most inspire customers to buy. |
| Ÿ | Searchandising, which consists of rules that can easily be configured by the merchant to feature products in search results that deliver the best inventory turn, conversion rates and average order size. |
| Ÿ | Order Management, which provides users the ability to access, modify and cancel orders. |
| Ÿ | Customer Targeting, which provides the capability to create rules that include and exclude conditions for triggering different merchandising offers, promotions and products. |
Demandware LINK. Through Demandware LINK, merchants and developers have access to an extensive library of integrations to third-party applications. These applications include campaign management, dynamic product imaging, order management, payment management, personalization, social commerce and ratings and reviews. We support our partners in the development of third-party integrations and undertake a rigorous approval process to ensure quality and compatibility before the application is made available for downloading on Demandware LINK.
Development Platform. Demandware Commerce offers the flexibility and control of a development environment based on a procedural language with the convenience, scalability and security of on-demand, multi-tenant delivery. With Demandware Commerce, developers and IT professionals can focus on innovation rather than infrastructure. Developers can build, customize, test, debug, deploy, integrate and extend their e-commerce sites, all on-demand. Our development platform includes access to an extensive library of pre-built business processes and contains all the necessary tools to edit them. Business processes within the development platform are graphically illustrated as pipelines and are edited through simple drag-and-drop, making it easy for web developers to quickly integrate to other applications and modify the customer experience as necessary.
Commerce Cloud. Web traffic is volatile, global and not linked to brick and mortar store operational hours. Consumers expect online stores to be open and functional at all times, even when they are serving millions of other customers during the busiest shopping season. With legacy in-house systems, retailers and brands have to plan for demand, buy resources for the peak season and create a disaster recovery back-up strategy. The Demandware Commerce Cloud is comprised of our network of state-of-the-art data centers, as well as our cloud-based architecture, which enable our customers to offer a reliable, high-performance, secure online shopping environment that is PCI-compliant. Our on-demand platform allows us to quickly and seamlessly increase the processing capacity of the environment in which our customers’ e-commerce sites operate to meet surges in demand. Through our Commerce Cloud, we also provide high uptime, robust security and built-in disaster recovery.
E-Commerce Retail Practice
We have developed a comprehensive customer success program as a key component of our operational model, which is designed to enable our customers to achieve sustained customer revenue growth and is delivered within the context of a shared success business relationship. In this program, we assign to customers an e-commerce strategist, who works hand-in-hand with our customers’ executives to maximize the value of their investment. These e-commerce strategists are focused on growing our customers’ revenue by taking full advantage of the merchandising features and functionality of Demandware Commerce and a deep understanding of industry practices in site design, merchandising, analytics, interactive marketing, personalization and multi-channel integration.
We also provide customer support engineers who are experts in our products, industry technologies and platforms, making them a trusted resource for timely issue assessment and
73
Table of Contents
resolution. Periodic system maintenance and continuous feature additions are also included in product support agreement coverage, which is included in the subscription fee.
We offer support in multiple languages and through multiple channels, including global support coverage available 24 hours a day, seven days a week. We use our own Demandware XCHANGE user community to leverage best practices for site improvement and provide our customers and distributors with a virtual community to collaborate on product design, release management and best practices.
We monitor customer satisfaction internally as part of formalized programs and at regular intervals during the customer lifecycle, including during the transition from sales to implementation, at the completion of an implementation project and on an on-going basis based on interactions with the account services team.
Client Services
Our customer enablement methodology includes document templates and processes to help project teams focus on the key tactical and strategic areas to maximize returns on our customers’ online investments and minimize business risk. Our customer enablement methodology guides our tactical process to successfully build and deploy an e-commerce site utilizing our Demandware Commerce platform. Our implementation services combine:
| Ÿ | best practices for configuring and/or customizing our Demandware Commerce platform; |
| Ÿ | historical experience with the integration of complementary technologies and adaptation to back-end systems and/or business processes for configuring and/or customizing our Demandware Commerce platform; and |
| Ÿ | project discipline around scope, change and risk management. |
In addition, we offer a full range of training classes to educate all individuals—e-commerce managers, web developers, application developers and IT professionals—who are part of our customers’ implementation, maintenance and optimization teams.
Customers
We have a wide variety of customers across various industries and geographies. As of December 31, 2011 we had 101 customers using our Demandware Commerce platform, up from 10, 23, 40 and 69 as of December 31, 2007, 2008, 2009 and 2010, respectively. Some of our customers have multiple revenue generating sites, either through multiple geographies or multiple brands within a larger organization. As of December 31, 2011, there were 361 revenue-generating e-commerce sites on our platform, up from 19, 50, 104 and 215 as of December 31, 2007, 2008, 2009 and 2010, respectively.
74
Table of Contents
Our largest end-user customers by industry, based on total revenue per customer for the year ended December 31, 2011 include the following, arranged alphabetically:
Apparel
Barneys New York
Carter’s
Columbia Sportswear
Crocs
Deckers
Goertz
House of Fraser
Jones Apparel Group
S. Oliver
Tory Burch
General Merchandise
ASDA
neckermann.de
Proctor & Gamble
Health & Beauty
Bare Escentuals
Guthy-Renker
L’Oreal
Home & Garden
CPO Commerce
Lifetime Brands
Michael’s Stores
Other
TDC
Hanover Direct
Jewelry Television
Panasonic
Sporting Goods
Brooks Sports
Burton
Callaway Golf
Revenue from customers in the apparel industry represented approximately 50% of our total revenue for the year ended December 31, 2011. For the years ended December 31, 2010, and 2011, revenue recognized from neckermann.de represented 20.6% and 16.0%, respectively, of our total revenue.
Sales and Marketing
We sell our on-demand software and services primarily through our direct sales force, which includes field sales representatives, sales engineers, sales management, e-commerce strategists and account development representatives. As of December 31, 2011, we had 54 employees in our direct sales force, up from 36 as of December 31, 2010. Our direct sales force is organized by the size of the target customer as well as by geographic region. Our direct sales force targets primarily enterprise customers, larger retailers and branded consumer product manufacturers that seek to implement more advanced e-commerce merchandising platforms across multiple channels and geographies. Our sales cycle can vary substantially from customer to customer, but typically requires six to nine months depending on the size and complexity of the opportunity. From the time a contract is signed, four to six months are typically required to implement and launch an e-commerce site for a new customer.
We also sell through selected distributors, such as eCommera, NETRADA and PFSweb, that combine our Demandware Commerce platform with a host of complementary services and technologies, such as logistics and warehousing, to provide comprehensive end-to-end e-commerce solutions. Our channel sales force is organized by assignment to distributors as well as by geographic region.
Our marketing efforts and lead generation activities consist primarily of customer referrals, internet advertising, telemarketing, social marketing, trade shows, industry events and press releases. Our marketing programs target our prospective customers’ e-commerce executives and senior business leaders. We also host frequent conferences during which customers participate and we present a variety of programs designed to help accelerate cross-channel e-commerce success with our integrated platform.
75
Table of Contents
Technology, Operations and Development
Technology
Since inception, we have designed our solutions with an on-demand architecture, which our customers can access through a standard web browser. Our solutions use a single code base, with all of our customers running on the current version of our platform. Our technology platform has several key design elements:
| Ÿ | Scalability. The on-demand platform architecture of Demandware Commerce handles sudden spikes in traffic by allocating capacity automatically. We proactively deliver updates and feature upgrades so our customers’ sites operate at peak efficiency. Demandware Commerce automatically provides as much computing power to each e-commerce site as needed to minimize page load times. Our platform has been benchmarked to handle at least 1,400 dynamic page views per second. |
| Ÿ | Reliability. Our state-of-the-art data centers in North America and Europe ensure high performance and redundancy for our customer base. We support large transaction volumes and seasonal peaks in site traffic and have provided 99.98% average site availability (excluding planned down time) since 2005. |
| Ÿ | Security. Our platform secures millions of transactions per year and has met the PCI-DSS level 1.2 set of comprehensive requirements for enhancing payment account data security. The PCI-DSS is a multi-faceted security standard that includes requirements for security management, policies, procedures, network architecture, software design and other critical protective measures. Our platform has been PCI-DSS-compliant since June 2007 and undergoes an annual assessment conducted by a PCI Counsel Qualified Security Assessor. |
| Ÿ | Ease of Deployment. Our customers run on a shared infrastructure, creating scalability and redundancy not possible with typical single-tenant providers. In a typical single-tenant environment, every new stack must be separately purchased, provisioned, managed, scaled and backed-up. In our multi-tenant channel, we can quickly and easily create new environments for development, testing, staging, and production, thus delivering significant cost and time savings for our customers. |
| Ÿ | Flexibility. Our standards-based open framework allows our customers to develop, build, and integrate third-party technologies. Our customers can innovate their site experience using the Eclipse-based open development environment and our UX Studio application to create a unique and relevant branded experience. Using a standards-based server-side scripting language, users can quickly create new logic to business processes, new custom objects, web services calls, integrations to back-end systems and XML data processing. |
| Ÿ | Extendibility. Our Commerce Cloud consists of multiprocessor nodes with large amounts of memory and network capacity, as well as e-commerce databases. The processor nodes are provisioned as web, application or database servers with dynamic isolated network connectivity only to other members in the particular merchant’s environment. In this way, a logical cluster is assembled with a variable number of processor nodes for web, application and database processing. Each merchant environment is logically isolated from all other merchant environments through multiple levels of security for network, port, processor, database and storage systems. Databases can hold product, consumer and order information. Our current data model can be extended by a configuration task performed through a web user interface and does not need a database administrator to manipulate the data model directly. |
Operations
We physically host our on-demand solutions for our customers in 11 secure data center facilities located in North America and Europe. We contract for use of these data center facilities from Equinix
76
Table of Contents
Operating Co. and NaviSite. We engineer and architect the actual computer, storage and network systems upon which our platform operates, which we call our grid computing points of delivery, or PODs, and deploy them to the data center facilities, which provide physical security, including manned security, 365 days a year, 24 hours a day, seven days a week. These facilities also have biometric access controls, and redundant power and environmental controls. We provide system security, including firewalls and encryption technology, and we conduct regular system tests and vulnerability assessments. In the event of a failure, we have engineered our computing grid with back-up and redundancy capabilities designed to provide for business continuity.
Research and Development
Our research and development organization is focused on developing new solutions and enhancing existing solutions, conducting software and quality assurance testing and improving our core technology. We continually enhance our existing software platform and develop new applications to meet our customers’ e-commerce needs. Our research and development organization is located primarily in our Burlington, Massachusetts headquarters. We also employ a team of engineers in our Jena, Germany office.
Our development methodology, in combination with our on-demand delivery model, allows us to release new and enhanced software features on a quarterly or more frequent basis. We patch our software on a regular basis. Based on feedback from our customers and prospects, we continually develop new merchandising functionality while enhancing and maintaining our existing solutions. We do not need to maintain multiple engineering teams to support different versions of the code because all of our customers are running on the current version of our solutions.
Our research and development expenses were $5.0 million in 2009, $6.1 million in 2010 and $11.2 million in 2011. As a percentage of revenue, our research and development expenses were 23.1% in 2009, 16.6% in 2010 and 19.8% in 2011.
Competition
The market for e-commerce platform software, services and solutions is intensely competitive, subject to rapid technological change and significantly affected by new product introductions and other market activities. We expect competition to persist and intensify in the future. Our primary sources of competition include:
| Ÿ | in-house development efforts by potential customers or their web consultants; |
| Ÿ | e-commerce application vendors, such as IBM, Oracle/ATG, eBay/Magento and hybris; |
| Ÿ | full-service e-commerce business process outsourcers, such as Digital River and eBay/GSI Commerce; and |
| Ÿ | providers of hosted on-demand subscription services, such as MarketLive and Venda. |
We compete primarily on the basis of our robust set of merchandising capabilities and features, the reliability and scalability of our solutions, our speed of deployment and cross-channel integration and extendibility.
Our current and potential competitors may have significantly greater financial, technical, marketing and other resources than we do, and there is no assurance we will be able to continue to compete effectively.
77
Table of Contents
Intellectual Property and Proprietary Rights
Our intellectual property and proprietary rights are important to our business. To safeguard them, we rely on a combination of patent, copyright, trade secret, trademark and other rights in the United States and other jurisdictions, as well as confidentiality procedures and contractual provisions to protect our proprietary technology, processes and other intellectual property. We have one issued U.S. patent and one pending application for a U.S. patent. We have confidentiality and license agreements with employees, contractors, customers, distributors and other third parties, which limit access to and use of our proprietary information and software. Though we rely in part upon these legal and contractual protections, we believe that factors such as the skills and ingenuity of our employees and the functionality and frequent enhancements to our solutions are larger contributors to our success in the marketplace.
Despite our efforts to preserve and protect our intellectual property and proprietary rights, unauthorized third parties may attempt to copy, reverse engineer, or otherwise obtain portions of our solutions. Competitors may attempt to develop similar products that could compete in the same market as our product. Unauthorized disclosure of our confidential information by our employees or third parties could occur. Laws of other jurisdictions may not protect our intellectual property and proprietary rights from unauthorized use or disclosure in the same manner as the United States. The risk of unauthorized use of our proprietary and intellectual property rights may increase as our company continues to expand outside of the United States.
Third-party infringement claims are also possible in our industry, especially as software functionality and features expand, evolve, and overlap with other industry segments. Third parties, including non-practicing patent holders, have from time to time claimed, and could claim in the future, that our customers’ e-commerce sites infringe patents they now hold or might obtain or be issued in the future, and, in most cases, we have agreed to indemnify our customers against claims that our products infringe the intellectual property rights of third parties. See “Risk Factors–We could incur substantial costs as a result of any claim of infringement of another party’s intellectual property rights.”
Seasonality
Our subscription revenue fluctuates as a result of seasonal variations in our business, principally due to our customers’ revenue peaks during the holiday season, which correspondingly results in higher overage fees in the fourth quarter than in other quarters. As a result, we have historically had higher subscription revenue in our fourth quarter than other quarters in a given year. Revenue for the fourth quarter represented 36.7%, 34.1% and 32.9% of our total revenue in 2009, 2010 and 2011, respectively.
Employees
As of December 31, 2011 we had 215 employees, including 76 in sales and marketing and 53 in research and development, a 43.3% increase from the 150 employees we had as of December 31, 2010. None of our employees are covered by a collective bargaining agreement. We have never experienced a strike or similar work stoppage, and we consider our relations with our employees to be good.
Properties
Our principal offices are located in Burlington, Massachusetts where we occupy approximately 32,000 square feet of space under a lease that expires in July 2017 and an additional 37,000 square feet of space under a sublease that expires in October 2019. We occupy additional leased facilities of less than 10,000 square feet each in Jena, Germany, Paris, France, Utrecht, the Netherlands, London, the United Kingdom, Munich, Germany and China. We believe that our facilities are adequate for our current needs and that suitable additional or substitute space will be available as needed to accommodate planned expansion of our operations.
78
Table of Contents
Legal Proceedings
We are subject to various legal proceedings that have arisen or may arise in the ordinary course of business. Although some of these proceedings may result in adverse decisions or settlements, we believe that the final disposition of such matters will not have a material effect on our business or financial statements. For information concerning our indemnification obligations to customers against which patent infringement claims have been or may be asserted, see “Risk Factors—We could incur substantial costs as a result of any claim of infringement of another party’s intellectual property rights.”
79
Table of Contents
Executive Officers and Directors
The following table sets forth the name, age and position of each of our executive officers and directors as of December 31, 2011.
| Name |
Age | Position | ||||
| Executive Officers |
||||||
| Thomas D. Ebling |
56 | President, Chief Executive Officer and Director | ||||
| Scott J. Dussault |
40 | Executive Vice President and Chief Financial Officer | ||||
| Jeffrey G. Barnett |
48 | Executive Vice President, Field Operations | ||||
| Wayne R. Whitcomb |
53 | Chief Technology Officer | ||||
| Directors |
||||||
| Stephan Schambach |
41 | Chairman of the Board of Directors | ||||
| Lawrence S. Bohn(2)(3) |
60 | Director | ||||
| Jill Granoff(1)(3) |
49 | Director | ||||
| Charles F. Kane(1) |
54 | Director | ||||
| Jitendra Saxena(1)(2) |
66 | Director | ||||
| Michael J. Skok(2)(3) |
50 | Director | ||||
| (1) | Member of audit committee |
| (2) | Member of compensation committee |
| (3) | Member of nominating and corporate governance committee |
Thomas D. Ebling has served as our President and Chief Executive Officer and a member of our board of directors since October 2009. Mr. Ebling previously served on our board of directors from May 2006 until December 2007. From October 2007 until August 2009, Mr. Ebling served as Chief Executive Officer of Lattice Engines, Inc., a provider of sales and optimization software solutions. Prior to joining Lattice Engines, Mr. Ebling served as Chief Executive Officer and Chairman of the board of directors of ProfitLogic, Inc., a merchandising optimization solutions company, from May 2002 until it was acquired by Oracle Corporation in July 2005. Earlier in his career, Mr. Ebling served as Chief Executive Officer of Torrent Systems, Inc., a data warehousing and analytics software provider, and he held various leadership positions at Marcam Solutions, Inc., a software applications company. Mr. Ebling holds a B.A. in mathematics from Williams College and attended Harvard Law School. Mr. Ebling’s extensive executive leadership experience, knowledge of our company and comprehensive knowledge of the software solutions industry make him a critical asset to our company and board of directors.
Scott J. Dussault joined us in October 2008 and was appointed Executive Vice President and Chief Financial Officer in December 2008. Mr. Dussault previously served as Chief Financial Officer of Archivas, Inc., a developer and distributor of online storage management solutions, from February 2005 until Archivas was acquired in February 2007 by Hitachi Data Systems. Prior to joining Archivas, Mr. Dussault served as Chief Financial Officer of Astra Tech, Inc., a medical devices distributor and subsidiary of AstraZeneca PLC, from September 2004 until January 2005. Prior to joining Astra Tech, Mr. Dussault served as Chief Financial Officer of StorageNetworks, Inc., a publicly-traded data-storage software and services company, from May 1999 until January 2004. Mr. Dussault began his career with Ernst & Young LLP where he practiced in the Entrepreneurial Services group and attained his CPA. He holds a B.S. in Business Administration/Accounting from Stonehill College.
Jeffrey G. Barnett has served as our Executive Vice President, Field Operations since November 2005. He previously served as Vice President of Sales for Europe, Middle East and Africa of Siebel Systems, Inc., a software company, from December 2004 until September 2005. Prior to joining Siebel,
80
Table of Contents
Mr. Barnett served as Managing Director, International Operations of Edocs, Inc., an online billing, payment, and account management software company, from May 2002 until December 2004, and as Vice President, International Sales and Marketing of Edocs from November 1999 until May 2002. Before joining Edocs, Mr. Barnett served as Vice President of Operations of ArborText, Inc., a content publishing company, from September 1990 until June 1999. Mr. Barnett holds a B.S. in computer information systems from Colorado State University and an M.B.A. from the MIT Sloan School of Management.
Wayne R. Whitcomb has served as our Chief Technology Officer and Vice President of Engineering and Technology since helping found Demandware in February 2004. Prior to joining Demandware, Mr. Whitcomb served as Vice President of Engineering and R&D of NaviSite, Inc., a provider of cloud-enabled hosting, managed applications and services, Vice President of Engineering of Mirror Image Internet, Inc., a provider of online content and transaction solutions, and Vice President of Engineering and Operations for CMGI-MyWay.com, a consumer content portal and search engine. Mr. Whitcomb holds a B.S. in Mechanical Engineering from University of Massachusetts, Lowell.
Stephan Schambach is the founder of Demandware and has served as the Chairman of our board of directors since our inception in February 2004. Mr. Schambach also served as our President and Chief Executive Officer from February 2004 until November 2007, and as our Executive Chairman from November 2007 until August 2010. Prior to founding Demandware, Mr. Schambach served as Chief Executive Officer of Intershop Communications AG, an e-commerce company that he founded in 1992 and brought public in 1998. As our founder, Mr. Schambach’s insight and expertise in the e-commerce industry, coupled with his extensive business and executive leadership experience, make him an invaluable asset to our board of directors.
Lawrence S. Bohn has served as a member of our board of directors since 2004. Mr. Bohn is a Managing Director of General Catalyst Partners, a venture capital firm, which he joined in 2003. Prior to joining General Catalyst, Mr. Bohn served as the President, Chief Executive Officer and Chairman of the board of directors of NetGenesis, a leading software and analytic solutions provider, from 1997 until 2001. Prior to NetGenesis, Mr. Bohn served as President of PC Docs, Inc. a developer of document management software for enterprise networks. He currently serves on the board of directors of several private software and technology companies, including BlackDuck, GoodData, HubSpot and Yottaa. Mr. Bohn holds a B.A. from the University of Massachusetts, Amherst and an M.A. in linguistics from Clark University. Mr. Bohn’s executive leadership experience, extensive experience in the fields of cloud computing and SaaS and business acumen qualify him to serve as a member of our board of directors.
Jill Granoff has served as a member of our board of directors since July 2011. Ms. Granoff served as Chief Executive Officer of Kenneth Cole Productions, Inc., a publicly traded company that designs, sources and markets a broad range of fashion footwear, apparel and accessories, from May 2008 until February 2011. She previously served as Executive Vice President of Direct Brands at Liz Claiborne Inc., where she worked from August 2006 to April 2008. In this role, she had global responsibility for Juicy Couture, Lucky Brand Jeans, Kate Spade and Liz Claiborne’s e-commerce and outlet businesses. Prior to joining Liz Claiborne, Ms. Granoff served as President and Chief Operating Officer of Victoria’s Secret Beauty, a division of Limited Brands, where she worked from April 1999 until April 2006. From 1990 to 1999, Ms. Granoff held various executive positions at The Estee Lauder Companies, last serving as Senior Vice President, Strategic Planning, Finance and Information Systems for Estee Lauder, Inc., Ms. Granoff began her career as a management consultant in the strategic planning practice at A.T. Kearney, Inc. Ms. Granoff holds a B.A. from Duke University and an M.B.A. from Columbia University. Ms. Granoff’s extensive business and executive leadership experience in the retail industry provides a breadth of relevant management, operational and financial qualifications to serve as a member of our board of directors.
Charles F. Kane has served as a member of our board of directors since May 2010. Mr. Kane serves on the board of directors of One Laptop Per Child, a non-profit organization that provides
81
Table of Contents
computing and internet access for students in the developing world, for which he served as President and Chief Operating Officer from 2008 until 2009. Mr. Kane served as Executive Vice President and Chief Administrative Officer of Global BPO Services Corp., a special purpose acquisition corporation, from July 2007 until March 2008, and as Chief Financial Officer of Global BPO from August 2007 until March 2008. Prior to joining Global BPO, he served as Chief Financial Officer of RSA Security Inc., a provider of e-security solutions, from May 2006 until RSA was acquired by EMC Corporation in October 2006. From July 2003 until May 2006, he served as Chief Financial Officer of Aspen Technology, Inc., a provider of supply chain management software and professional services. Earlier in his career, Mr. Kane served as President and Chief Executive Officer of Corechange, Inc., an enterprise software company, and he held financial positions with Stratus Computer, Inc., Prime Computer Inc., and Deloitte & Touche LLP. Mr. Kane has served as a member of the board of directors of Progress Software Corp., a provider of infrastructure software, since November 2006. He also served as a member of the board of directors of Borland Software Corp., a provider of open application lifecycle management solutions, from August 2007 until July 2009, and Netezza Corporation, a leading warehouse appliance provider, from May 2005 until Netezza was acquired in November 2010. Mr. Kane is a CPA and holds a B.B.A. in accounting from the University of Notre Dame and an M.B.A. in international finance from Babson College. He is an adjunct professor of international finance at the MIT Sloan School of Management. Mr. Kane’s experience as a senior executive officer at a number of public companies, including as chief financial officer of several of those companies, and his experience serving on the boards of directors of other public and private companies, qualify him to serve on our board of directors.
Jitendra Saxena has served as a member of our board of directors since October 2010. Mr. Saxena founded Netezza Corporation, a leading data warehouse appliance provider, in September 2000, and served as Chief Executive Officer and a member of the board of directors of Netezza from its inception until January 2009. Mr. Saxena served as Chairman of Netezza’s board of directors from February 2009 until it was acquired by IBM in November 2010. Prior to founding Netezza, Mr. Saxena served as Chairman and Chief Executive Officer of Applix, Inc., a provider of performance management applications, from 1983 until 2000. Mr. Saxena currently serves on the board of directors of several private companies and non-profit organizations. Mr. Saxena holds a B.S. in electrical engineering from IIT Mumbai, a M.S. in electrical engineering from Michigan State University and an M.B.A. from Boston University. Mr. Saxena’s qualifications to serve on our board include his decades of experience in the software industry and his leadership experience as chief executive officer of a publicly-traded company.
Michael J. Skok has served as a member of our board of directors since 2004. Mr. Skok is a General Partner at North Bridge Venture Partners, a venture capital firm, which he joined in 2002. Prior to joining North Bridge, Mr. Skok founded and led several software companies, including Symantec/UK and European Software Publishing. He currently serves on the board of directors of several private software and technology companies, including Acquia, Apperian and Unidesk. Mr. Skok holds a joint honors degree from Nottingham University in management science and engineering. Mr. Skok brings to our board of directors over 20 years of leadership experience in the software industry, including in the SaaS and cloud computing fields, and, as an experienced venture capitalist, a keen understanding of the interplay between management and the board.
Composition of the Board of Directors
Our board of directors currently consists of seven members. The members of our board of directors were elected in compliance with the provisions of our voting and stock restriction agreement, as amended, pursuant to which the parties agreed to elect, among others, one director designated by an affiliate of General Catalyst Partners, which designee was Mr. Bohn, one director designated by an affiliate of North Bridge Venture Partners, which designee was Mr. Skok, and Mr. Schambach, our founder. The board composition provisions of our voting and stock restriction agreement will terminate upon the closing of this offering and there will be no further contractual obligations regarding the election of our directors. Our directors hold office until their successors have been elected and qualified or until the earlier of their resignation or removal.
82
Table of Contents
In accordance with the terms of our amended and restated certificate of incorporation and amended and restated by-laws, each of which will become effective upon the closing of this offering, our board of directors will be divided into three classes, each of whose members will serve for staggered three-year terms. Upon the closing of this offering, the classes will be comprised as follows:
| Ÿ | the class I directors will be Mr. Ebling and Mr. Saxena, and their term will expire at the first annual meeting of stockholders held after the closing of this offering; |
| Ÿ | the class II directors will be Mr. Kane and Mr. Schambach, and their term will expire at the second annual meeting of stockholders held after the closing of this offering; and |
| Ÿ | the class III directors will be Mr. Bohn, Ms. Granoff and Mr. Skok and their term will expire at the third annual meeting of stockholders held after the closing of this offering. |
Our amended and restated certificate of incorporation that will become effective upon the closing of this offering provides that the authorized number of directors may be changed only by resolution of our board of directors. Any additional directorships resulting from an increase in the number of directors will be distributed among the three classes so that, as nearly as possible, each class will consist of one-third of the directors. This classification of our board of directors may have the effect of delaying or preventing changes in our control or management.
Our amended and restated certificate of incorporation and amended and restated by-laws, each of which will become effective upon the closing of this offering, provide that our directors may be removed only for cause by the affirmative vote of the holders of at least two-thirds of the votes that all our stockholders would be entitled to cast in an annual election of directors. Upon the expiration of the term of a class of directors, directors in that class will be eligible to be elected for a new three-year term at the annual meeting of stockholders in the year in which their term expires. An election of our directors by our stockholders will be determined by a plurality of the votes cast by the stockholders entitled to vote on the election.
Director Independence
In accordance with the New York Stock Exchange corporate governance listing standards, a director will qualify as “independent” if our board of directors affirmatively determines that he or she has no material relationship with us, either directly or as a partner, stockholder or officer of an organization that has a relationship with us. Ownership of a significant amount of our stock, by itself, does not constitute a material relationship.
Pursuant to the corporate governance listing standards of the New York Stock Exchange, a director employed by us cannot be deemed to be an “independent director,” and consequently neither Mr. Ebling nor Mr. Schambach is an independent director.
In July 2011, our board of directors undertook a review of its composition, the composition of its committees and the independence of each director. Based upon information requested from and provided by each director concerning his background, employment and affiliations, including family relationships, our board of directors determined that each of Messrs. Bohn, Kane, Saxena and Skok and Ms. Granoff is “independent” in accordance with Section 303A.02(b) of the New York Stock Exchange Listed Company Manual. In making its determination, our board of directors considered the percentage of our capital stock owned by entities affiliated with General Catalyst Partners, of which Mr. Bohn is a managing director, and the percentage of our capital stock owned by affiliates of North Bridge Venture Partners, of which Mr. Skok is a general partner.
Our board of directors determined that all of the members of the board’s three standing committees described below are independent, as defined under applicable New York Stock Exchange
83
Table of Contents
rules and, in the case of all members of the audit committee, the independence requirements contemplated by Rule 10A-3 under the Securities Exchange Act of 1934, as amended, which we refer to as the Exchange Act.
Board Leadership Structure
Our board of directors believes that Mr. Schambach’s service as chairman of our board is in the best interests of our company and our stockholders. As our founder, former president and chief executive officer and as chairman of our board since 2004, Mr. Schambach has been an integral part of the leadership of our company and our board of directors since its inception, and his strategic vision has guided our growth and performance. Mr. Ebling has served as our president and chief executive officer since February 2010. Separating the chairman and the president and chief executive officer positions allows our president and chief executive officer to focus on running the business, while allowing the chairman of our board of directors to lead the board in its fundamental role of providing advice to and oversight of management. As our board has determined that each of our directors other than Mr. Schambach and Mr. Ebling is independent, our board believes that the independent directors provide effective oversight of management. Our board believes that its leadership structure is appropriate at the current time because it strikes an effective balance between strategy development and management oversight in the board process.
Board Committees
Our board of directors has established three standing committees—audit, compensation, and nominating and corporate governance—each of which operates under a charter that has been approved by our board. Upon the effectiveness of the registration statement of which this prospectus is a part, we will post each committee’s charter on the corporate governance section of our website, www.demandware.com.
Audit Committee
The audit committee’s responsibilities include:
| Ÿ | appointing, approving the compensation of, and assessing the independence of our registered public accounting firm; |
| Ÿ | overseeing the work of our registered public accounting firm, including through the receipt and consideration of reports from such firm; |
| Ÿ | reviewing and discussing with management and the registered public accounting firm our annual and quarterly financial statements and related disclosures; |
| Ÿ | monitoring our internal control over financial reporting, disclosure controls and procedures and code of business conduct and ethics; |
| Ÿ | overseeing our internal audit function; |
| Ÿ | overseeing our risk assessment and risk management policies; |
| Ÿ | establishing policies regarding hiring employees from the registered public accounting firm and procedures for the receipt and retention of accounting related complaints and concerns; |
| Ÿ | meeting independently with our internal auditing staff, registered public accounting firm and management; |
| Ÿ | reviewing and approving or ratifying any related person transactions; and |
| Ÿ | preparing the audit committee report required by SEC rules to be included in our proxy statement for our annual meeting of stockholders. |
84
Table of Contents
All audit services and all non-audit services, other than de minimis non-audit services, to be provided to us by our registered public accounting firm must be approved in advance by our audit committee.
Effective upon the effectiveness of the registration statement of which this prospectus is a part, the members of our audit committee will be Messrs. Kane and Saxena and Ms. Granoff. Our board of directors has determined that Mr. Kane is an “audit committee financial expert” as defined by applicable SEC rules.
Compensation Committee
The compensation committee’s responsibilities include:
| Ÿ | annually reviewing and approving corporate goals and objectives relevant to compensation of our chief executive officer; |
| Ÿ | determining our chief executive officer’s compensation; |
| Ÿ | reviewing and approving, or making recommendations to our board with respect to, the compensation of our other executive officers; |
| Ÿ | overseeing an evaluation of our senior executives; |
| Ÿ | overseeing and administering our cash and equity incentive plans; |
| Ÿ | reviewing and making recommendations to our board with respect to director compensation; |
| Ÿ | reviewing and discussing annually with management our “Compensation Discussion and Analysis;” and |
| Ÿ | preparing the annual compensation committee report required by SEC rules. |
Effective upon the effectiveness of the registration statement of which this prospectus is a part, the members of our compensation committee will be Messrs. Bohn, Saxena and Skok.
Nominating and Corporate Governance Committee
The nominating and corporate governance committee’s responsibilities include:
| Ÿ | identifying individuals qualified to become board members; |
| Ÿ | recommending to our board of directors the persons to be nominated for election as directors and to each of the Board’s committees; |
| Ÿ | reviewing and making recommendations to the board with respect to management succession planning; |
| Ÿ | developing and recommending to the board corporate governance principles; and |
| Ÿ | overseeing an annual evaluation of the board. |
Effective upon the effectiveness of the registration statement of which this prospectus is a part, the members of our nominating and corporate governance committee will be Ms. Granoff and Messrs. Bohn and Skok.
Compensation Committee Interlocks and Insider Participation
None of our executive officers serves as a member of the board of directors or compensation committee, or other committee serving an equivalent function, of any entity that has one or more
85
Table of Contents
executive officers who serve as members of our board of directors or our compensation committee. None of the members of our compensation committee is an officer or employee of our company, nor have they ever been an officer or employee of our company.
Code of Ethics and Code of Conduct
Our board of directors adopted a written code of business conduct and ethics that applies to our directors, officers and employees, including our principal executive officer, principal financial officer, principal accounting officer or controller, or persons performing similar functions. Following the effectiveness of the registration statement of which this prospectus is a part, we will post the code of business conduct and ethics on our website, www.demandware.com. In addition, we intend to post on our website all disclosures that are required by law or the New York Stock Exchange stock market listing standards concerning any amendments to, or waivers from, any provision of the code.
86
Table of Contents
EXECUTIVE AND DIRECTOR COMPENSATION
The following discussion and analysis of compensation arrangements should be read with the compensation tables and related disclosures set forth below. This discussion contains forward-looking statements that are based on our current plan and expectations regarding future compensation programs. Actual compensation programs that we adopt may differ materially from currently planned programs as summarized in this discussion.
Compensation Discussion and Analysis
This Compensation Discussion and Analysis provides information about the material components of our compensation program for our named executive officers, or NEOs, for 2010 and 2011. Our NEOs for 2010 and 2011 were Thomas D. Ebling, our president and chief executive officer, Scott J. Dussault, our chief financial officer, Jeffrey G. Barnett, executive vice president of field operations, Wayne R. Whitcomb, our chief technology officer. John W. Pearce, who served as our president and chief executive officer in January 2010 and was succeeded by Mr. Ebling, was a NEO in 2010 only.
Our compensation committee is responsible for overseeing our executive compensation program. In this capacity, our compensation committee designs, implements, reviews and approves annually all compensation for our NEOs. The goal of our compensation committee is to ensure that our compensation programs are aligned with the interests of our stockholders and our business goals and that the total compensation paid to each of our NEOs is fair, reasonable and competitive.
Compensation Philosophy and Objectives
Our compensation programs are designed to attract and retain qualified and talented executives, motivating them to achieve our business goals and rewarding them for superior short- and long-term performance. In particular, the primary objectives of our compensation committee with respect to executive compensation are to:
| Ÿ | ensure executive compensation is aligned with our operational and financial performance targets; |
| Ÿ | focus on strategy and long-term performance by providing a portion of executives’ compensation through programs linked to our long-term success; |
| Ÿ | attract executive talent and retain those executives who have demonstrated superior talent and performance and whose continued employment is crucial to our success and growth; |
| Ÿ | ensure that total compensation is fair, reasonable and competitive; and |
| Ÿ | align the interests of our executives with those of our stockholders in order to attain our ultimate objective of increasing stockholder value. |
Elements of Executive Compensation and Relationship to Performance
The key elements of our compensation program are:
| Ÿ | base salary; |
| Ÿ | short-term incentives, which are comprised of annual bonuses and sales commissions; and |
| Ÿ | equity incentive compensation, which is typically subject to multi-year vesting based on continued service and is primarily in the form of stock options, the value of which depends on the performance of our common stock price. |
Our compensation committee assesses the performance of our executives based in part on specific measures and targets established by the compensation committee and our board of directors,
87
Table of Contents
typically in the early part of the first quarter of the calendar year. However, compensation decisions are not driven entirely by financial performance assessments.
For executive officers other than our president and chief executive officer, our compensation committee has sought and considered input from our president and chief executive officer regarding such executive officers’ responsibilities, performance and compensation. Specifically, our president and chief executive officer provides input and recommendations regarding base salary adjustments, if any, bonus targets for performance-based bonuses, equity award levels and the short-term and long-term financial and non-financial performance goals that are used throughout our compensation program, and advises our compensation committee regarding the compensation program’s ability to attract, retain and motivate executive talent. Our compensation committee views each component of executive compensation as related but distinct, and also reviews the total compensation of our NEOs to ensure that our overall compensation objectives are met. Our compensation committee has the discretion to materially increase or decrease the compensation amounts recommended by our president and chief executive officer. Our president and chief executive officer does not attend compensation committee or board of directors’ discussions regarding his own compensation.
Compensation Determination Process
Compensation for our NEOs historically has been individualized and has been based on a variety of factors, including, in addition to the factors listed above, our financial condition, our need for that particular executive position, our compensation committee’s evaluation of the competitive market based on the experience of its members with other companies and their review of anonymous private company compensation surveys, the length of service of an executive and the compensation levels of our other executive officers. Historically, our president and chief executive officer and, with respect to our president and chief executive officer, our board of directors, reviewed the performance of each NEO, generally on an annual basis, and based on this review and the factors described above, set the executive compensation package for him for the coming year. Historically, this review has been undertaken in the first quarter of our fiscal year. We anticipate that following the consummation of this offering, the compensation committee will continue to review all these facets of compensation during the first quarter of each calendar year.
Defining Compensation
Commencing in 2011, our compensation committee reviewed anonymous private company compensation surveys in setting the compensation of our executive officers. Our compensation committee reviewed comparative market data on the compensation and compensation practices of anonymous companies provided by Culpepper and Associates, an independent provider of compensation data. In 2011, the compensation committee considered this company data when determining the 2011 base salaries for our executive officers. Our compensation committee did not engage in benchmarking when determining the 2010 compensation of our executive officers.
More recently, our compensation committee engaged a compensation consultant, Longnecker & Associates, to assist in its discussions on appropriate compensation strategies. Longnecker was engaged in December 2011 to provide compensation advisory services, including providing the following information: outlining pre- to post-IPO compensation practices; reviewing peer companies (see below for a list of the comparable public companies reviewed) and outlining assessment methodology and data sources; providing executive summaries of peer companies’ compensation and considerations for our 2012 compensation program; and presenting competitive executive compensation (including pay practices and compensation levels) and equity usage. In determining compensation for 2012, our compensation committee and our board of directors relied heavily upon the analysis and recommendations provided by Longnecker, which based its analysis on its study of
88
Table of Contents
compensation at comparable public companies. The comparable public companies, or peer group, included: Concur Technologies, Inc., Taleo Corporation, SuccessFactors, Inc., NetSuite, Inc., RealPage, Inc., Intralinks Holdings, Inc., LivePerson, Inc., LogMeIn, Inc., OpenTable, Inc., Vocus, Inc., Responsys, Inc. and Cornerstone OnDemand, Inc. The peer group is subject to change and will be approved by our compensation committee annually. Our compensation committee reviewed and approved the peer group in early 2012.
We believe that compensation should be based on job responsibility, company performance, and individual performance, and we strive to achieve an appropriate mix between equity incentive awards and cash payments in order to meet our compensation objectives. In order to attract and retain highly skilled employees, we must remain competitive with the pay of other employers who compete with us for high caliber talent. For 2011, we structured compensation for our NEOs so that base salaries and target bonus incentive awards are generally consistent with the median of the private company market survey data collected in late 2010. For 2012, we structured compensation for our NEOs so that their base salaries were generally between the 25th and 75th percentile of the range of base salaries of our peer group.
Base Salary. We use base salaries to recognize the experience, skills, knowledge and responsibilities of our employees, including our executive officers. Base salaries for our NEOs typically are established through an arm’s-length negotiation at the time the executive is hired, taking into account the executive’s qualifications, experience and prior salary. None of our NEOs is currently party to an employment agreement that provides for automatic or scheduled increases in base salary. On an annual basis, our compensation committee reviews and evaluates for adjustment the base salaries of our executives based on the scope of an executive’s responsibilities, individual contribution, prior experience and sustained performance. In making decisions regarding salary increases, we may also draw upon the experience of members of our board of directors with other companies and the anonymous private company compensation survey and peer group compensation analysis survey reviewed by the compensation committee. Base salaries are also reviewed and adjusted, as deemed appropriate, in the case of promotions or other significant changes in responsibility. No formulaic base salary increases are provided to our NEOs.
The following table sets forth the base salary for 2010, 2011 and 2012 for our NEOs. Mr. Pearce ceased serving as an employee of Demandware on February 15, 2010.
| Name and Principal Position |
2010 Base Salary | 2011 Base Salary | 2012 Base Salary | |||||||||
| Thomas D. Ebling President and Chief Executive Officer |
$ | 275,000 | $ | 275,000 | $ | 300,000 | ||||||
| Scott J. Dussault Executive Vice President and Chief Financial Officer |
$ | 190,000 | $ | 210,000 | $ | 260,000 | ||||||
| Jeffrey G. Barnett Executive Vice President, Field Operations |
$ | 175,000 | $ | 190,000 | $ | 250,000 | ||||||
| Wayne R. Whitcomb Chief Technology Officer |
$ | 190,000 | $ | 205,000 | $ | 225,000 | ||||||
| John W. Pearce Former President and Chief Executive Officer |
$ | 200,000 | $ | — | $ | — | ||||||
In establishing base salaries for our NEOs for 2010, our compensation committee and our board of directors subjectively determined that, based upon our overall performance, our NEOs’ annual base salaries would not change from 2009.
For 2011, our compensation committee determined that, based on our performance in 2010, and in order to retain and motivate our NEOs who are critical to our success, we would increase the base salaries of those NEOs whose base salaries were below the median base salaries of comparable
89
Table of Contents
executive officers included in the private company compensation surveys reviewed by the compensation committee. Our compensation committee determined that the base salaries of each of Messrs. Dussault, Barnett and Whitcomb were below such levels and, accordingly, in January 2011, increased their base salaries for 2011. In determining the amounts of such base salary increases, our compensation committee and board of directors took into account the sizes of the increases necessary to bring the base salaries of these NEOs to such median levels, their overall performance and the growth of our company. Our board of directors did not assign relative weighting to such factors, nor did it consider specific metrics or achievements in making its determination. Our compensation committee and board of directors subjectively determined that our growth and the overall performance of our NEOs was sufficient to merit raising the base salaries of our NEOs to the median level of comparable officers of our peer group. For 2011, Mr. Dussault’s base salary was increased by 10.5%, from $190,000 to $210,000, Mr. Barnett’s base salary was increased by 8.6%, from $175,000 to $190,000, and Mr. Whitcomb’s base salary was increased by 7.9%, from $190,000 to $205,000. As the 2010 base salary of Mr. Ebling was generally at the median of similarly situated executive officers in our comparable private-company peer group, our board of directors determined not to increase Mr. Ebling’s base salary for 2011.
For 2012, our compensation committee sought to set base salaries for our NEOs between the 25th and 75th percentile of the range of base salaries of our peer group. In 2012, our compensation committee approved base salary increases for Messrs. Ebling, Dussault, Barnett and Whitcomb in order to make their salaries more competitive with those of similarly situated executives in our peer group and based on their overall performance and the growth of our company.
Short-Term Incentives (Annual Cash Bonuses and Sales Commissions). Our short-term incentive program is intended to motivate our NEOs to achieve our company goals as well as reward their individual performance. We provide such short-term incentives through an incentive compensation plan and a separate sales commission plan, as appropriate. Each of Messrs. Ebling, Dussault, Barnett and Whitcomb participates in an incentive compensation plan, under which bonuses may be earned upon our achievement of specified company and individual performance goals. In view of his sales position, Mr. Barnett also participates in an individualized sales commission plan that is similar to the plans used for all of our sales employees, as described below. Both our incentive compensation plan and our executive sales commission plans are treated as “non-equity incentive plan compensation” for purposes of the Summary Compensation Table and Grants of Plan-Based Awards Table below.
Incentive Compensation Plan
2010 Incentive Compensation Plan. For 2010, the compensation committee and our board of directors established an incentive compensation plan for Messrs. Ebling, Dussault, Barnett, Whitcomb and Pearce. Under the terms of the 2010 incentive compensation plan, each executive was entitled to receive a bonus based on achievement of company performance targets and individual objectives established for each executive at the beginning of the year. Our compensation committee also established thresholds for each performance metric. No bonus payout for a particular performance metric would be earned unless the performance threshold for that metric was met. To the extent that actual performance exceeded a performance target, the bonus amount could be increased by as much as 20% over the target bonus payment. The compensation committee and our board of directors set the 2010 performance targets and thresholds at levels that would be difficult to achieve, but attainable.
The following table shows the 2010 target bonus amounts as a percentage of base salary for which each of Messrs. Ebling, Dussault, Barnett, Whitcomb and Pearce was eligible. Target bonus amounts represent the potential bonus payment for which Messrs. Ebling, Dussault, Barnett, Whitcomb and Pearce would have been eligible if all performance targets were fully met. These target bonus
90
Table of Contents
amounts were the result of negotiations between us and these executive officers at the time they were hired.
| Name and Principal Position |
2010 Target Annual Cash Bonus as a Percentage of Base Salary |
2010 Target Bonus Amount |
||||||
| Thomas D. Ebling President and Chief Executive Officer |
54.5 | % | $ | 150,000 | ||||
| Scott J. Dussault Executive Vice President and Chief Financial Officer |
21.1 | % | $ | 40,000 | ||||
| Jeffrey G. Barnett Executive Vice President, Field Operations |
14.3 | % | $ | 25,000 | ||||
| Wayne R. Whitcomb Chief Technology Officer |
21.1 | % | $ | 40,000 | ||||
| John W. Pearce Former President and Chief Executive Officer |
25.0 | % | $ | 50,000 | ||||
The 2010 bonus performance metrics and weighting were as follows:
| Ÿ | 40% of the bonus was based upon total revenue, which is defined as total GAAP revenue recognized for the entire year; |
| Ÿ | 40% of the bonus was based upon committed first year annual contract value for new customer contracts signed in 2010, or ACV, which is the sum of the total amount of minimum subscription fees contractually committed under each of our customer agreements over the first year of the agreement, but excluding support, services and training fees under those agreements; and |
| Ÿ | 20% of the bonus was based upon Profit/Loss, which is defined as GAAP operating income or loss recognized during the year. |
For 2010, the performance targets for 100% payout for total revenue, ACV and profit/loss were $29.0 million, $8.5 million and $(5.9) million, respectively, the threshold targets for 50% payout for total revenue, ACV and profit/loss were $26.1 million, $6.4 million and $(6.5) million, respectively and the performance achievements for total revenue, ACV and profit/loss were $36.7 million, $6.5 million and $1.0 million, respectively. Maximum performance payouts for the performance metrics if all metrics were achieved at 100% or better were as follows: 125% for total revenue, 125% ACV and 100% for profit/loss.
The 2010 achievement percentage, weighting, and weighted achievement percentages were as follows:
| Total Revenue | ACV | Profit/Loss | ||||||||||
| Achievement percentage |
126 | % | 77 | % | 100 | % | ||||||
| Weighting |
40 | % | 40 | % | 20 | % | ||||||
| Weighting achievement percentage |
40 | % | 22 | % | 20 | % | ||||||
In addition to the company performance metrics described above, our compensation committee considered the achievement by each of our executives, other than Mr. Ebling, of individual objectives.
Mr. Dussault’s individual objectives included effective budgeting and financial planning (32.5%), preparing the company for its initial public offering (25.0%), identification and establishment of key company operational and financial metrics (17.5%), effective execution within legal, human resources and facilities (15.0%) and securing debt vehicles adequate to finance our equipment purchases
91
Table of Contents
(10.0%). Our board of directors determined that Mr. Dussault achieved 98.3% of his individual objectives for 2010, substantially achieving his objectives with regard to budgeting and financial planning, preparing the company for its initial public offering, securing debt vehicles and, to a lesser extent, identification and establishment of key company operational and financial metrics and effective execution within the legal, human resources and facilities departments.
Mr. Barnett’s individual objectives included successful management of new customer acquisition ACV, committed revenue share percentage and channel mix (50.0%), effective management of existing customer revenue growth (20.0%), customer contract renewals (15.0%) and sales management (15.0%). Our board of directors determined that Mr. Barnett achieved 85.0% of his individual objectives for 2010, substantially achieving his objectives with regard to effective management of existing customer revenue growth, customer contract renewals, sales management and, to a lesser extent, successful management of new customer acquisition ACV, committed revenue share percentage and channel mix.
Mr. Whitcomb’s individual objectives included maintaining historical service level availability thresholds (35.0%), timely and effective product development and release schedule (50.0%) and operational efficiencies relating to various departments within the company (15.0%). Our board of directors determined that Mr. Whitcomb achieved 92.0% of his individual objectives for 2010, substantially achieving his objectives with regard to maintaining historical service level thresholds, promoting operational efficiencies relating to various departments within the company and, to a lesser extent, timely and effective product development and release schedule.
The resulting individual achievement percentages were then applied to the actual bonus pool established through our company performance targets to determine the actual bonus payout for each executive other than our president and chief executive officer. The compensation committee determined the actual payout for our president and chief executive officer based on subjective evaluation of his performance during 2010.
The following table sets forth the target bonus amount and the actual bonus paid to each of Messrs. Ebling, Dussault, Barnett and Whitcomb under the 2010 incentive compensation plan:
| Name and Principal Position |
2010 Target Bonus Amount |
2010 Actual Bonus Amount |
||||||
| Thomas D. Ebling President and Chief Executive Officer |
$ | 150,000 | $ | 123,000 | ||||
| Scott J. Dussault Executive Vice President and Chief Financial Officer |
$ | 40,000 | $ | 32,226 | ||||
| Jeffrey G. Barnett Executive Vice President, Field Operations |
$ | 25,000 | $ | 17,425 | ||||
| Wayne R. Whitcomb Chief Technology Officer |
$ | 40,000 | $ | 30,176 | ||||
| John W. Pearce Former President and Chief Executive Officer |
$ | 50,000 | $ | 6,250 | ||||
2010 Sales Commission Plan. Because much of Mr. Barnett’s responsibilities are focused on sales of our e-commerce solutions, the compensation committee determined that it would be appropriate for Mr. Barnett also to participate in a sales commission plan, pursuant to which he is eligible to receive commissions based upon the total worldwide sales. The compensation committee subjectively determined that for 2010, Mr. Barnett’s potential commission under the 2010 sales commission plan would constitute 80% of the total annual incentive bonus for which Mr. Barnett was eligible. The commission targets under the 2010 sales commission plan were determined by the
92
Table of Contents
compensation committee and our board of directors and based in part on the recommendation of our president and chief executive officer. The compensation committee designed Mr. Barnett’s commission structure both to reward him for past achievement and to support our retention efforts.
For 2010, the compensation committee established a target for Mr. Barnett of $8.5 million of new customer committed first year ACV. Mr. Barnett’s target commission was $100,000. To the extent that Mr. Barnett exceeded his ACV target in 2010, he was eligible to earn a commission exceeding his target commission. Based on the actual new customer committed first year ACV for 2010, Mr. Barnett was paid a commission of $77,025 under the 2010 sales commission plan.
For 2011, our compensation committee approved a 2011 sales commission plan, which was substantially similar to the 2010 sales commission plan, except that Mr. Barnett’s ACV target increased to a target of $12.8 million of new customer committed average ACV over the term of the initial customer contract. Mr. Barnett’s target commission was $100,000. To the extent that Mr. Barnett exceeded his ACV target in 2011, he was eligible to earn a commission exceeding his target commission. Mr. Barnett will be paid a commission of $163,610 under the 2011 sales commission plan.
For 2012, we expect to approve a 2012 sales commission plan, which will be substantially similar to the 2011 sales commission plan, except that Mr. Barnett’s ACV target will be increased and his target commission will be increased to $175,000.
2011 Incentive Compensation Plan
For 2011, the compensation committee and our board of directors established an incentive compensation plan for Messrs. Ebling, Dussault, Barnett and Whitcomb. Under the terms of the 2011 incentive compensation plan, each executive was eligible to receive a bonus based upon our achievement of certain performance thresholds and targets with respect to several performance metrics, and by meeting individual objectives established for each NEO at the beginning of the year. No bonus payout for a particular performance metric would be earned unless the performance threshold for that metric was met, and bonus payouts would be calculated based on the achievements of individual objectives for each executive. Target bonus amounts represent the potential bonus payments for which Messrs. Ebling, Dussault, Barnett and Whitcomb were eligible to receive if we met our full performance target with respect to each performance metric. However, to the extent that our actual performance exceeded the full performance target with respect to a particular performance metric, the target bonus could be increased by up to 50%. Our compensation committee and board of directors subjectively determined to increase the maximum bonus payout from 20% for 2010 to 50% for 2011 to provide a greater incentive to our executive officers to achieve the 2011 performance targets. This determination was based on the professional judgment of our compensation committee and board of directors and not the consideration of specific factors or qualitative inputs. Our compensation committee designed the 2011 targets to require significant individual effort and company operational success. Individual objectives were tied to the particular area of expertise of the executive officer and his performance in attaining those objectives relative to external forces and overall individual effort. The compensation committee works with our president and chief executive officer to develop and approve the performance goals for each executive (other than himself) and our company as a whole.
93
Table of Contents
The following table shows the 2011 target bonus amounts as a percentage of base salary for which each of Messrs. Ebling, Dussault, Barnett and Whitcomb were eligible. For 2011, our compensation committee and board of directors subjectively determined to increase the target bonus as a percentage of salary of Messrs. Dussault, Barnett and Whitcomb relative to 2010 in order to provide a greater incentive to these executive officers to achieve the 2011 performance targets.
| Name and Principal Position |
2011 Target Bonus as a Percentage of Base Salary |
2011 Target Bonus Amount |
||||||
| Thomas D. Ebling President and Chief Executive Officer |
54.5 | % | $ | 150,000 | ||||
| Scott J. Dussault Executive Vice President and Chief Financial Officer |
23.8 | % | $ | 50,000 | ||||
| Jeffrey G. Barnett Executive Vice President, Field Operations |
26.3 | % | $ | 50,000 | ||||
| Wayne R. Whitcomb Chief Technology Officer |
26.8 | % | $ | 55,000 | ||||
The 2011 bonus performance metrics and weighting were as follows:
| Ÿ | 40% of the bonus was based upon subscription revenue (defined as total GAAP subscription revenue recognized for the entire year, excluding support, services and training revenue); |
| Ÿ | 40% of the bonus was based upon contracted average ACV for new customer contracts signed in 2011, which is the sum of the total amount of minimum subscription fees contractually committed under each of our customer agreements over the entire term of the agreement but excluding nonrecurring support, services and training fees under those agreements, divided by the number of months in the term; and |
| Ÿ | 20% of the bonus was based upon processing efficiency, which is the number of computing processing seconds per month as a percentage of total customer gross revenue processed on the platform. |
For 2011, the performance targets for 100% payout for subscription revenue and ACV were $39.9 million and $12.8 million, respectively. The threshold target for 50% payout for ACV was $9.6 million, and the threshold target for 75% payout for subscription revenue was $38.0 million. We achieved greater than 150% of our performance targets for subscription revenue and ACV. We do not disclose the performance and threshold targets for processing efficiency because the disclosure of such operating metrics would cause us competitive harm. The undisclosed processing efficiency targets were set at levels that were lower (and therefore more difficult to achieve) than actual processing efficiency results we achieved in 2010. Maximum performance payouts for the performance metrics were 150% for subscription revenue, ACV and processing efficiency.
The 2011 achievement percentages, weighting, and weighted achievement percentages were as follows:
| Subscription Revenue |
ACV |
Processing | ||||||||||
| Achievement percentage |
150% | 150% | 150% | |||||||||
| Weighting |
40% | 40% | 20% | |||||||||
| Weighting achievement percentage |
60% | 60% | 30% | |||||||||
In addition to the company performance metrics described above, our compensation committee considered the achievement by each of our NEOs of individual objectives and applied the achievement percentage of such individual objectives against the achievement percentage for the subscription revenue and ACV metrics. The payout for the processing efficiency metric was based on the weighted achievement of that metric.
94
Table of Contents
Mr. Ebling’s individual objectives included the achievement of our subscription revenue goal (20.0%), achievement of our quarterly subscription gross margin goals (20.0%), operating above a floor cash balance level (20.0%), finishing 2011 at or above our revenue projections for 2012 and 2013 that were established at the beginning of 2011 (20.0%) and successful acquisition and rapid ramping of customers targeted as small to mid-sized retailers and brands (20.0%). Although our compensation committee determined that Mr. Ebling achieved 100.0% of his individual objectives for 2011, our compensation committee and Mr. Ebling determined that he should receive 92.6% of his target bonus amount, which is the average achievement level of all of Mr. Ebling’s direct reports.
Mr. Dussault’s individual objectives included effective budgeting and financial planning (20.0%), preparing the company for its initial public offering (40.0%), identification and establishment of key company operational and financial metrics (20.0%), and timely and effective internal financial reporting (20.0%). Our compensation committee determined that Mr. Dussault achieved 97.0% of his individual objectives for 2011, substantially achieving his objectives with regard to effective budgeting and financial planning, preparing the company for its initial public offering, identification and establishment of key company operational and financial metrics, and, to a lesser extent, timely and effective internal financial reporting.
Mr. Barnett’s individual objectives included successful management of our worldwide new customer acquisition ACV (20.0%), successful management of our European new customer acquisition ACV (20.0%), successful acquisition and rapid ramping of customers targeted as small to mid-sized retailers and brands (20.0%), achievement of our subscription revenue growth goal (20.0%) and success in customer and partner enablement initiatives (20.0%). Our compensation committee determined that Mr. Barnett achieved 92.0% of his individual objectives for 2011, substantially achieving his objectives with regard to successful management of our worldwide new customer acquisition ACV, achievement of our subscription revenue growth goal, successful acquisition and rapid ramping of customers targeted as small to mid-sized retailers and brands, success in customer and partner enablement initiatives and, to a lesser extent, successful management of our European new customer acquisition ACV.
Mr. Whitcomb’s individual objectives included maintaining historical service level availability thresholds (25.0%), timely and reliable global product releases (25.0%), successful and timely expansion of the engineering organization (25.0%) and timely and effective product development and release schedule (25.0%). Our board of directors determined that Mr. Whitcomb achieved 90.0% of his individual objectives for 2011, substantially achieving his objectives with regard to maintaining historical service level availability thresholds, timely and reliable global product releases and, to a lesser extent, successful and timely expansion of the engineering organization and timely and effective product development and release schedule.
The resulting individual achievement percentages were then applied to the actual bonus pool established through our company performance targets for our subscription revenue and ACV metrics to determine the actual bonus payout for each NEO.
The following table sets forth the target bonus amount and the actual bonus paid to each of Messrs. Ebling, Dussault, Barnett and Whitcomb under the 2011 incentive compensation plan:
| Name and Principal Position |
2011 Target Bonus Amount |
2011 Actual Bonus Amount |
||||||
| Thomas D. Ebling President and Chief Executive Officer |
$ | 150,000 | $ | 211,680 | ||||
| Scott J. Dussault Executive Vice President and Chief Financial Officer |
$ | 50,000 | $ | 73,200 | ||||
| Jeffrey G. Barnett Executive Vice President, Field Operations |
$ | 50,000 | $ | 70,200 | ||||
| Wayne R. Whitcomb Chief Technology Officer |
$ | 55,000 | $ | 75,900 | ||||
95
Table of Contents
2012 Incentive Compensation Plan
For 2012, our compensation committee established an incentive compensation plan for Messrs. Ebling, Dussault, Barnett and Whitcomb. Under the terms of the 2012 incentive compensation plan, each executive is eligible to receive a bonus based upon our achievement of certain performance thresholds and targets with respect to several performance metrics, and by meeting individual objectives established for each NEO at the beginning of the year. No bonus payout for a particular performance metric will be earned unless the performance threshold for that metric is met, and bonus payouts will be calculated based on the achievements of individual objectives for each executive. Target bonus amounts represent the potential bonus payments for which Messrs. Ebling, Dussault, Barnett and Whitcomb are eligible to receive if we meet our full performance target with respect to each performance metric. However, to the extent that our actual performance exceeds the full performance target with respect to a particular performance metric, the target bonus could be increased by up to 50%. Our compensation committee designed the 2012 targets to require significant individual effort and company operational success. Individual objectives are tied to the particular area of expertise of the executive officer and his performance in attaining those objectives relative to external forces and overall individual effort. The compensation committee works with our president and chief executive officer to develop and approve the performance goals for each executive (other than himself) and our company as a whole.
The following table shows the 2012 target bonus amounts as a percentage of base salary for which each of Messrs. Ebling, Dussault, Barnett and Whitcomb is eligible. For 2012, our compensation committee and board of directors increased the target bonus as a percentage of salary of Messrs. Ebling, Dussault, Barnett and Whitcomb relative to 2011 in order to provide a greater incentive to these executive officers to achieve the 2012 performance targets. In making this decision, the compensation committee and board considered the contributions that would be necessary from each NEO to prepare us to operate as a public company, and determined that incentive compensation increases for certain NEOs would be appropriate to provide them with additional incentives and further align their interests with our stockholders.
| Name and Principal Position |
2012 Target Annual Cash Bonus as a Percentage of Base Salary |
2012 Target Annual Cash Bonus |
||||||
| Thomas D. Ebling President and Chief Executive Officer |
100.0% | $ | 300,000 | |||||
| Scott J. Dussault Executive Vice President and Chief Financial Officer |
38.5 | % | $ | 100,000 | ||||
| Jeffrey G. Barnett Executive Vice President, Field Operations |
30.0 | % | $ | 75,000 | ||||
| Wayne R. Whitcomb Chief Technology Officer |
35.6 | % | $ | 80,000 | ||||
The 2012 bonus performance metrics and weighting are as follows:
| • | 40% of the bonus is based upon subscription revenue (defined as total GAAP subscription revenue recognized for the entire year, excluding support, services and training revenue); |
| • | 40% of the bonus is based upon contracted average ACV for new customer contracts signed in 2012, which is the sum of the total amount of minimum subscription fees contractually committed under each of our customer agreements over the first three years of the agreement but excluding nonrecurring support, services and training fees under those agreements, divided by the number of months in the term; and |
96
Table of Contents
| • | 20% of the bonus is based upon processing efficiency, which is the number of computing processing seconds per month as a percentage of total customer gross revenue processed on the platform. |
Long-Term Equity Incentive Compensation. We use long-term equity incentive compensation to offer long-term incentives to our executives. While we do not have equity ownership guidelines for our executives, we believe that equity grants provide our executives with a strong link to our long-term performance, create an ownership culture and help to align the interests of our executives with those of our stockholders. Because employees profit from stock options only if our stock price increases relative to the stock option’s exercise price, we believe stock options provide meaningful incentives to employees to achieve increases in the value of our stock over time. In addition, the vesting feature of our equity grants contributes to executive retention by providing an incentive to our executives to remain with us during the vesting period.
Prior to this offering, our executives were eligible to participate in the 2004 stock option and grant plan, as amended, or the 2004 Plan. Following the closing of this offering, our employees, including our executive officers, will be eligible to receive stock-based awards pursuant to the 2012 stock incentive plan, or the 2012 Plan, including stock options, restricted stock awards, restricted stock unit awards, stock appreciation rights and other stock-based equity awards, at the discretion of the compensation committee. In determining the size of equity grants to our executives, our compensation committee has historically considered our corporate performance, the applicable executive’s performance and potential for enhancing the creation of value for our stockholders, the amount of equity previously awarded to the executive and the vesting of such awards, the executive’s position and, in the case of awards to executive officers other than our president and chief executive officer, the recommendation of our president and chief executive officer.
Historically, we have granted stock options to compensate our NEOs both in the form of initial grants in connection with the commencement of employment and additional discretionary grants by our board of directors to reward an employee for retention purposes or for other circumstances recommended by management. Typically, the shares underlying the stock options we grant to our executives vest at a rate of 25% per year. Vesting and exercise rights cease shortly after termination of employment except in the case of death or disability. Prior to the exercise of an option, the holder has no rights as a stockholder with respect to the shares subject to such option, including voting rights or the right to receive dividends or dividend equivalents.
We have historically granted stock options at exercise prices of no less than the fair market value of shares of our common stock on the date of grant as determined by our board of directors. The exercise price of all stock options granted after the closing of this offering will be equal to the fair market value of shares of our common stock on the date of grant, which generally will be determined by reference to the market price of our common stock. We historically have not had a program, plan or practice of selecting grant dates for equity incentive awards to our executive officers in coordination with the release of material non-public information. As a privately-owned company, there has been no market for our common stock. Accordingly, in 2010 and in 2011, we had no program, plan or practice pertaining to the timing of stock option grants to executive officers coinciding with the release of material non-public information. Following the closing of this offering, we intend to grant equity awards quarterly during the year, with grant dates typically occurring shortly after publication of our quarterly or annual earnings releases.
In connection with our entry into an employment agreement with Mr. Ebling, as described in “—Change in Control and Severance Benefits, Employment Agreements—Employment Agreements,” on February 11, 2010, our board of directors granted Mr. Ebling two options to purchase an aggregate of 1,446,340 shares of our common stock. The options vest over a four-year period, with 25% of the shares subject to the options scheduled to vest on December 31, 2010, which is the first anniversary of
97
Table of Contents
the vesting commencement date, and the remaining shares subject to the options scheduled to vest in equal monthly installments thereafter. Mr. Ebling’s stock options were granted at an exercise price of $1.29 per share, representing the fair market value of our common stock on the date of grant. In addition, in connection with an equity financing that we closed soon after Mr. Ebling joined the company and as part of our efforts to retain Mr. Ebling, our board of directors granted an additional equity award to Mr. Ebling to ensure that Mr. Ebling’s beneficial ownership percentage of our outstanding capital stock following the financing remained the same as his ownership percentage prior to such financing. As such, on June 3, 2010, our board of directors granted Mr. Ebling an option to purchase 121,664 shares of our common stock, at an exercise price of $1.47 per share, representing the fair market value of our common stock on the date of grant, which vests over a four-year period, with 25% of the shares subject to the option scheduled to vest on December 31, 2010 and the remaining shares subject to the option scheduled to vest in equal monthly installments thereafter.
On June 3, 2010, as an incentive to retain Messrs. Dussault and Whitcomb, our compensation committee granted options to Messrs. Dussault and Whitcomb to purchase 66,666 and 33,333 shares of common stock, respectively. These grants were subjectively determined by our board of directors to be appropriate as a retention incentive based on the respective NEO’s then current stock option holdings. Each of these options was granted at an exercise price of $1.47 per share, representing the fair market value of our common stock on the date of grant, and is scheduled to vest over a four-year period with 25% of the stock options scheduled to vest on March 26, 2011, which is the first anniversary of the vesting commencement date, and the remaining shares subject to the option scheduled to vest in equal monthly installments thereafter.
On February 21, 2011, as an incentive to retain Messrs. Barnett and Whitcomb, our compensation committee granted options to Messrs. Barnett and Whitcomb to purchase 66,666 and 33,333 shares of common stock, respectively. These grants were subjectively determined by our board of directors to be appropriate as a retention incentive based on the respective NEO’s then current stock option holdings. Each of these options was granted at an exercise price of $3.39 per share, representing the fair market value of our common stock on the date of grant, and is scheduled to vest over a four-year period with 25% of the stock options scheduled to vest on February 21, 2012, which is the first anniversary of the vesting commencement date, and the remaining shares subject to the option scheduled to vest in equal monthly installments thereafter.
Benefits and Other Compensation. We maintain broad-based benefits that all of our employees, including our NEOs, are eligible to participate in, such as a 401(k) retirement plan, flexible spending accounts, medical, dental, life and accidental death insurance policies and long-term and short-term disability plans. We also periodically provide meals on-premise to employees in our offices. Our NEOs receive these benefits on the same basis as our other full-time U.S. employees. Offering these benefits serves to attract and retain employees, including our NEOs. We anticipate that we will periodically review our employee benefits programs in order to ensure that they continue to serve these purposes and remain competitive. While our 401(k) plan permits an employer match, we do not currently provide one. We do not provide any retirement benefits separate from the 401(k) plan.
In March 2005, we issued a promissory note to Mr. Whitcomb, our chief technology officer, in the principal amount of $59,700, with a fixed interest rate of 4.28% per year. In connection with the promissory note, we entered into a pledge agreement whereby Mr. Whitcomb pledged certain capital stock of the company owned by him as collateral for the promissory note. In April 2011, we forgave the full outstanding principal and accrued interest of the promissory note, which equaled $75,080 at the time of forgiveness, and released all obligations under the pledge agreement.
98
Table of Contents
We do not currently offer any reportable perquisites to our executive officers.
Tax Considerations
Based on the limitations imposed by Section 162(m) of Internal Revenue Code, public companies generally cannot deduct compensation paid to their chief executive officer and each of their three other most highly compensated officers (other than their chief executive officer and chief financial officer) that exceeds $1,000,000 per person in any fiscal year for federal income tax purposes, unless it is “performance-based compensation,” as defined under Section 162(m). While we cannot predict how the Section 162(m) deductibility limit may affect our compensation program in future years, we intend to maintain an approach to executive compensation that strongly links pay to performance. In addition, although we have not adopted a formal policy regarding tax deductibility of compensation paid to our NEOs, we intend to consider tax deductibility under Section 162(m) as one factor in our compensation decisions.
We have not provided our executives or directors with any gross-up or other reimbursement for taxes that these individuals might pay pursuant to Section 280G or Section 409A of the Internal Revenue Code. Section 280G provides that certain “disqualified individuals,” including officers, certain highly compensated individuals, and employees, independent contractors, and directors who hold more than 1% of our stock, could be subject to significant additional taxes if they receive payments or benefits in connection with a change in control that exceed certain limits, and we or our successor could lose the ability to deduct the amounts subject to the additional tax. In addition, Section 409A imposes significant taxes on an executive officer, director or other service provider who receives “deferred compensation” that does not meet the requirements of Section 409A.
Pension Benefits and Nonqualified Deferred Compensation
We do not provide a pension plan for our employees and none of our NEOs participated in a nonqualified deferred compensation plan during the fiscal year ended December 31, 2010.
Summary Compensation
The following table sets forth the total compensation paid to our NEOs for the years ended December 31, 2010 and 2011, respectively.
| Name and Principal Position |
Year |
|
Salary ($) |
|
|
Option Awards ($)(1) |
|
|
Non-Equity Incentive Compensation ($)(2) |
|
|
All Other Compensation ($) |
|
|
Total ($) |
| ||||||||
| Thomas D. Ebling(3) President and Chief Executive Officer |
|
2011 2010 |
|
|
275,000 243,798 |
|
|
— 1,191,926 |
|
|
211,680 123,000 |
|
|
— — |
|
|
486,680 1,558,724 |
| ||||||
| Scott J. Dussault Executive Vice President and Chief Financial Officer |
|
2011 2010 |
|
|
209,167 190,000 |
|
|
— 59,660 |
|
|
73,200 32,226 |
|
|
— — |
|
|
282,367 281,886 |
| ||||||
| Jeffrey G. Barnett Executive Vice President, Field Operations |
|
2011 2010 |
|
|
189,375 175,000 |
|
|
128,940 — |
|
|
233,810 94,450 |
|
|
— |
|
|
552,125 269,450 |
| ||||||
| Wayne R. Whitcomb(6) Chief Technology Officer |
|
2011 2010 |
|
|
204,375 190,000 |
|
|
64,470 29,830 |
|
|
75,900 30,176 |
|
|
75,080 — |
|
|
419,825 250,006 |
| ||||||
| John W. Pearce(4) Former President and Chief Executive Officer |
2010 | 25,000 | 79,118 | 6,250 | 100,000 | (5) | 210,368 | |||||||||||||||||
99
Table of Contents
| (1) | The amounts in the “Option Awards” column reflect the aggregate fair value of share-based compensation awarded during the year computed in accordance with the provisions of Financial Accounting Standards Board, or FASB, Accounting Standard Codification, or ASC, Topic 718, excluding the impact of estimated forfeitures related to service-based vesting conditions (which in our case were none). See Note 9 to the consolidated financial statements included elsewhere in this prospectus regarding assumptions underlying the valuation of equity awards. We did not grant any option awards to our NEOs in 2009. |
| (2) | Reflects cash bonus awards paid to our NEOs under our 2011 and 2010 incentive compensation plans and, with respect to Mr. Barnett, commissions paid to Mr. Barnett under the 2011 and 2010 sales commission plans, as described above. |
| (3) | Mr. Ebling’s salary amount included in the summary compensation table for 2010 differs from that in the base salary table on page 89 because Mr. Ebling joined Demandware as our president and chief executive officer in February 2010. |
| (4) | Mr. Pearce ceased serving as an employee of Demandware on February 15, 2010. |
| (5) | Reflects consulting fees we paid to Mr. Pearce in 2010 following his cessation of employment at Demandware. |
| (6) | Mr. Whitcomb’s compensation included the forgiveness of the full outstanding principal and accrued interest on a promissory note issued in March 2005. |
Grants of Plan-Based Awards in 2011
The following table sets forth information concerning awards made to our NEOs under our equity and non-equity incentive plans during the fiscal year ended December 31, 2011, including performance-based awards:
| Name |
Grant Date |
Estimated Future Payouts Under Non-Equity Incentive Plan Awards(1) |
All Other Option Awards: Number of Securities Underlying Options (#) |
Exercise or Base Price of Option Awards ($/sh) |
Grant Date Fair Value of Stock and Option Awards ($) |
|||||||||||||||||||||||
| Threshold ($) |
Target ($) |
Maximum ($) |
||||||||||||||||||||||||||
| Thomas D. Ebling |
— | 97,500 | 150,000 | 225,000 | — | — | — | |||||||||||||||||||||
| Scott J. Dussault |
— | 32,500 | 50,000 | 75,000 | — | — | — | |||||||||||||||||||||
| Jeffrey G. Barnett |
— | 32,500 | 50,000 | 75,000 | — | — | — | |||||||||||||||||||||
| — | — | 100,000 | (2) | — | — | — | — | |||||||||||||||||||||
| 2/21/2011 | — | — | — | 66,666 | 3.39 | 128,940 | ||||||||||||||||||||||
| Wayne R. Whitcomb |
— | 35,750 | 55,000 | 82,500 | — | — | — | |||||||||||||||||||||
| 2/21/2011 | — | — | — | 33,333 | 3.39 | 64,470 | ||||||||||||||||||||||
| (1) | Represents threshold, target and maximum payout levels under our incentive bonus plan for 2011. Actual cash bonus amounts paid to each NEO are set forth in the Summary Compensation Table above under the column entitled “Non-Equity Incentive Plan Compensation” for 2011. |
| (2) | Represents Mr. Barnett’s payout target under the 2011 sales commission plan. |
100
Table of Contents
Outstanding Equity Awards at Fiscal Year-End
The following table sets forth information regarding outstanding stock options held as of December 31, 2011 by our NEOs:
| Name |
Vesting Commencement Date |
Number
of Securities Underlying Unexercised Options (#) Exercisable |
Number
of Securities Underlying Unexercised Options (#) Unexercisable |
Option Exercise Price ($/sh) |
Option Expiration Date |
|||||||||||||||
| Thomas D. Ebling |
12/4/2009 | (2) | 34,000 | — | 1.29 | 12/4/2019 | ||||||||||||||
| 12/31/2009 | (2) | 6,460 | 155,038 | 1.29 | 2/11/2020 | |||||||||||||||
| 12/31/2009 | (2) | 142,032 | 568,131 | 1.29 | 2/11/2020 | |||||||||||||||
| 12/31/2009 | (2) | 15,208 | 60,832 | 1.47 | 6/3/2020 | |||||||||||||||
| Scott J. Dussault |
10/20/2008 | (2) | 80,555 | 27,777 | 1.29 | 11/11/2018 | ||||||||||||||
| 4/13/2009 | (2) | 44,444 | 22,222 | 1.29 | 9/29/2019 | |||||||||||||||
| 3/26/2010 | (2) | 29,166 | 37,500 | 1.47 | 6/3/2020 | |||||||||||||||
| Jeffrey G. Barnett |
11/7/2005 | (1) | 208,491 | — | 0.93 | 9/14/2017 | ||||||||||||||
| 4/13/2009 | (2) | 88,889 | 44,444 | 1.29 | 9/29/2019 | |||||||||||||||
| 2/21/2011 | — | 66,666 | 3.39 | 2/21/2021 | ||||||||||||||||
| Wayne R. Whitcomb |
9/1/2007 | (1) | 66,666 | — | 0.93 | 9/17/2017 | ||||||||||||||
| 4/13/2009 | (2) | 33,333 | 16,666 | 1.29 | 9/29/2019 | |||||||||||||||
| 3/26/2010 | (2) | 14,583 | 18,750 | 1.47 | 6/3/2020 | |||||||||||||||
| 2/21/2011 | — | 33,333 | 3.39 | 2/21/2021 | ||||||||||||||||
| (1) | This option is fully vested. |
| (2) | This option vests with respect to 25% of the shares underlying the option on the first anniversary of the vesting commencement date and with respect to the balance of the shares underlying the option in 36 equal monthly installments thereafter. The vesting commencement date is fixed by our board of directors when granting options. Option grants are subject to acceleration upon a change in control of our company as further described in the “Executive and Director Compensation—Potential Payments Upon a Change in Control ” section of this prospectus. |
2011 Option Exercises and Stock Vested
The following table sets forth information concerning the number of shares acquired and the value realized by the NEOs as a result of stock option exercises and restricted stock vesting during the fiscal year ended December 31, 2011:
| Name |
Option Awards | |||||||
| Number of Shares Acquired on Exercise (#) |
Value Realized
on Exercise ($)(1) |
|||||||
| Thomas D. Ebling |
554,115 | 1,648,344 | ||||||
| Scott J. Dussault |
25,000 | 99,000 | ||||||
| Jeffrey G. Barnett |
191,508 | 890,515 | ||||||
| Wayne R. Whitcomb |
— | — | ||||||
| (1) | Value realized on exercise is based on the market price of our common stock on the date of exercise (closing price) less the exercise price, multiplied by the number of shares underlying the exercised options. |
101
Table of Contents
Change in Control and Severance Benefits, Employment Agreements
Severance and Change in Control Benefits
Our board of directors believes that maintaining a stable management team is essential to our long-term success and achievement of our corporate strategies, and is therefore in the best interests of our stockholders. We have entered into employment agreements with each of our executives that provide for base salary, bonuses and/or sales commissions, employee benefit plan participation, and in certain instances, severance or other payments upon a qualifying termination of employment or change of control. See “—Employment Agreements.” We believe that it is important to provide certain of our executives with these benefits to secure their continued dedication to their work, notwithstanding the possibility of a termination by us, and to provide them with additional incentives to continue employment with us. In 2011, our compensation committee retained Longnecker and Associates, an independent compensation consulting firm, to assist us in determining appropriate severance payment and benefit levels for certain NEOs, the compensation committee and our board of directors considered a number of factors, including their experience with and understanding of current market practices. The level of benefits and triggering events to receive such benefits were chosen to be broadly consistent with the compensation committee’s and the board’s view of prevailing competitive practices. The final severance payment and benefit levels were determined after negotiations with the respective executive and were evaluated in terms of the overall compensation packages for such NEO. We believe that our severance benefits are competitive with severance benefits provided to similarly situated individuals at companies against which we compete for talent.
We also recognize that the possibility that we may in the future undergo a change in control, and that this possibility and the uncertainty it may cause among our executives may result in their departure or distraction to the detriment of our company and our stockholders. Accordingly, our board of directors and compensation committee decided to take appropriate steps to encourage the continued attention, dedication and continuity of certain key executive to their assigned duties without the distraction that may arise from the possibility or occurrence of a change in control. As a result, we have entered into agreements with certain of our NEOs that provide additional benefits in the event of a change in control. See “—Employment Agreements.”
We consider these severance protections to be an important part of our executives’ compensation. These arrangements are consistent with our overall compensation objectives because we believe such arrangements are competitive with arrangements offered to executives by companies against which we compete for executives and are critical to achieve our business objective of management retention. We believe that such severance protections are necessary (i) to retain our executives, (ii) to secure the continued dedication and objectivity of our executives, including in circumstances where the company may undergo a change of control, and (iii) to provide the NEOs with an incentive to continue employment with us and motivate them to maximize our value for the benefit of our stockholders.
102
Table of Contents
Potential Payments Upon a Change in Control
The following table sets forth the benefits that would have been payable by us to certain of our NEOs upon a change in control of our company where such NEO’s employment is terminated within six months, in the case of the salary payments listed below, and 12 months, in the case of the value of options listed below, after the change in control by us or our successor without cause or by such NEO for good reason (as defined in the applicable employment agreement). These amounts are calculated on the assumption that the employment termination and change in control event both took place on December 31, 2011. Amounts below reflect potential payments pursuant to each executive’s employment agreement and pursuant to stock options granted under the 2004 Plan.
| Name |
Salary($) | Value of Accelerated Options($)(1) |
||||||
| Thomas D. Ebling |
275,000 | 5,586,829 | ||||||
| Scott J. Dussault |
210,000 | 618,000 | ||||||
| Jeffrey G. Barnett |
190,000 | 653,333 | ||||||
| Wayne R. Whitcomb |
205,000 | 417,500 | ||||||
| (1) | Amounts calculated based on the aggregate amount by which the fair market value of the common stock subject to unvested equity awards exceeded the aggregate exercise price of the awards as of December 31, 2011, using a per share fair market value equal to $8.43. Using a per share fair market value equal to the midpoint of the price range listed on the cover page of this prospectus, the value of accelerated options would be $9,561,723 for Mr. Ebling, $1,061,625 for Mr. Dussault, $1,216,665 for Mr. Barnett and $766,063 for Mr. Whitcomb. |
Potential Payments Upon Termination Apart From a Change in Control
The following table sets forth the benefits that would have been payable by us to Mr. Ebling if his employment had been terminated by us without cause on December 31, 2011 or by Mr. Ebling for good reason (as defined in Mr. Ebling’s employment agreement) on December 31, 2011, in the event such termination occurred prior to or more than six months following a change in control of our company, pursuant to Mr. Ebling’s employment agreement.
| Name |
Salary($) | Value of Accelerated Options($)(1) |
||||||
| Thomas D. Ebling |
137,500 | — | ||||||
| (1) | Amount calculated based on the aggregate amount by which the fair market value of the common stock subject to unvested equity awards exceeded the aggregate exercise price of the awards using the per share fair market value as of December 31, 2011. |
Employment Agreements
Thomas D. Ebling. On February 11, 2010, we entered into an employment agreement with Mr. Ebling, our president and chief executive officer. The employment agreement specifies that Mr. Ebling’s employment with us is “at will” and provides for an annual base salary of $275,000, which was subsequently increased to $300,000 in January 2012, annual performance bonuses pursuant to our incentive compensation plan and an equity award under our 2004 Plan equal to 6.0% of our outstanding capital stock at the time of grant. Under the terms of the employment agreement, Mr. Ebling is eligible to participate in executive benefit plans and programs, if any, on the same terms as other similarly situated employees. On August 22, 2011, we entered into a change of control agreement with Mr. Ebling, which supersedes the February 2010 agreement and which provides that if we terminate Mr. Ebling’s employment without cause or if Mr. Ebling terminates his employment for good reason, Mr. Ebling will receive continued payments of his base salary for six months and a cash bonus equal to such amount that he otherwise would have been eligible to receive had his employment not been terminated. In the
103
Table of Contents
event that (i) we or our successor terminate Mr. Ebling’s employment without cause or if Mr. Ebling terminates his employment for good reason and (ii) such termination occurs during the period ending six months following the consummation of a change of control, Mr. Ebling is entitled to receive a lump-sum payment equal to the sum of 12 months base salary and a cash bonus equal to such amount that he otherwise would have been eligible to receive had his employment not been terminated. In addition, in the event of a change of control, Mr. Ebling is entitled to receive full acceleration of all unvested equity awards. Mr. Ebling must execute a general release of all claims against us in order to receive any severance benefits.
Scott J. Dussault. On September 19, 2008, we entered into an employment agreement with Mr. Dussault, our chief financial officer. The employment agreement specifies that Mr. Dussault’s employment with us is “at will” and provides for an initial annual base salary of $190,000, which was subsequently increased to $210,000 in January 2011 and $260,000 in January 2012. Under the terms of the employment agreement, Mr. Dussault is eligible to receive annual performance bonuses pursuant to our incentive compensation plan and is generally entitled to participate in executive benefit plans and programs, if any, on the same terms as other similarly situated employees. On August 16, 2011, we entered into a change of control agreement with Mr. Dussault that provides that if (i) we or our successor terminate Mr. Dussault’s employment without cause or if Mr. Dussault terminates his employment for good reason and (ii) the termination occurs during the period ending six months following the consummation of a change of control, Mr. Dussault is entitled to receive a lump-sum payment equal to the sum of 12 months base salary and a cash bonus equal to such amount that he otherwise would have been eligible to receive had his employment not been terminated. In addition, in the event of a change of control, Mr. Dussault is entitled to receive full acceleration of all unvested equity awards. Mr. Dussault must execute a general release of all claims against us in order to receive any severance benefits.
Jeffrey G. Barnett. On October 28, 2005, we entered into an employment agreement with Mr. Barnett, our executive vice president, field operations. The employment agreement specifies that Mr. Barnett’s employment with us is “at will” and provides for an initial annual base salary of $175,000, which was subsequently increased to $190,000 in January 2011 and $250,000 in January 2012. Under the terms of the employment agreement, Mr. Barnett is eligible to receive annual performance bonuses pursuant to our incentive compensation plan, sales commissions pursuant to our annual sales compensation plan and is generally entitled to participate in executive benefit plans and programs, if any, on the same terms as other similarly situated employees. On September 15, 2011, we entered into a change of control agreement with Mr. Barnett that provides that if (i) we or our successor terminate Mr. Barnett’s employment without cause or if Mr. Barnett terminates his employment for good reason and (ii) the termination occurs during the period ending six months following the consummation of a change of control, Mr. Barnett is entitled to receive a lump-sum payment equal to the sum of 12 months base salary and a cash bonus equal to such amount that he otherwise would have been eligible to receive had his employment not been terminated. In addition, in the event of a change of control, Mr. Barnett is entitled to receive full acceleration of all unvested equity awards. Mr. Barnett must execute a general release of all claims against us in order to receive any severance benefits.
Wayne R. Whitcomb. On August 4, 2004, we entered into an employment agreement with Mr. Whitcomb, our chief technology officer. The employment agreement specifies that Mr. Whitcomb’s employment with us is “at will” and provides for an initial annual base salary of $130,000, which was subsequently increased to $205,000 in January 2011 and $225,000 in January 2012. Under the terms of the employment agreement, Mr. Whitcomb is eligible to receive annual performance bonuses pursuant to our incentive compensation plan and is generally entitled to participate in executive benefit plans and programs, if any, on the same terms as other similarly situated employees. On August 16, 2011, we entered into a change of control agreement with Mr. Whitcomb that provides that if (i) we or our successor terminate Mr. Whitcomb’s employment without cause or if Mr. Whitcomb terminates his
104
Table of Contents
employment for good reason and (ii) the termination occurs during the period ending six months following the consummation of a change of control, Mr. Whitcomb is entitled to receive a lump-sum payment equal to the sum of 12 months base salary and a cash bonus equal to such amount that he otherwise would have been eligible to receive had his employment not been terminated. In addition, in the event of a change of control, Mr. Whitcomb is entitled to receive full acceleration of all unvested equity awards. Mr. Whitcomb must execute a general release of all claims against us in order to receive any severance benefits.
John W. Pearce. On May 29, 2009, we entered into a succession agreement with Mr. Pearce, our former president and chief executive officer. The succession agreement specified that Mr. Pearce’s resignation as our president, chief executive officer and member of our board of directors would become effective on the date that our board of directors appointed a new president and chief executive officer. Under the terms of the succession agreement, Mr. Pearce was eligible for the following severance benefits: (1) accelerated vesting of his existing stock options and an extension of the exercise period for such options, (2) payment of his accrued salary and all accrued and unused vacation, (3) a year end bonus for the fiscal year ended December 31, 2009 and (4) subject to certain conditions, engagement as a part-time employee or consultant and payment of certain health care benefits during the term of this engagement.
Limitation of Liability and Indemnification
Our amended and restated certificate of incorporation, which will become effective upon the closing of this offering, limits the personal liability of directors for breach of fiduciary duty to the maximum extent permitted by the Delaware General Corporation Law and provides that no director will have personal liability to us or to our stockholders for monetary damages for breach of fiduciary duty or other duty as a director. However, these provisions do not eliminate or limit the liability of any of our directors for the following:
| Ÿ | any breach of the director’s duty of loyalty to us or our stockholders; |
| Ÿ | acts or omissions not in good faith or which involve intentional misconduct or a knowing violation of law; |
| Ÿ | voting for or assenting to unlawful payments of dividends, stock repurchases or other distributions; or |
| Ÿ | any transaction from which the director derived an improper personal benefit. |
Any amendment to or repeal of these provisions will not eliminate or reduce the effect of these provisions in respect of any act, omission or claim that occurred or arose prior to such amendment or repeal. If the Delaware General Corporation Law is amended to provide for further limitations on the personal liability of directors of corporations, then the personal liability of our directors will be further limited to the greatest extent permitted by the Delaware General Corporation Law.
In addition, our amended and restated certificate of incorporation, which will become effective upon the closing of this offering, provides that we must indemnify our directors and officers and we must advance expenses, including attorneys’ fees, to our directors and officers in connection with legal proceedings, subject to very limited exceptions.
We maintain a general liability insurance policy that covers certain liabilities of our directors and officers arising out of claims based on acts or omissions in their capacities as directors or officers. In addition, we have entered into indemnification agreements with our directors and executive officers. These indemnification agreements may require us, among other things, to indemnify each such director or officer for certain expenses, including attorneys’ fees, judgments, fines and settlement amounts, incurred by him in any action or proceeding arising out of his service as one of our directors or executive officers.
105
Table of Contents
Certain of our non-employee directors may, through their relationships with their employers, be insured and/or indemnified against certain liabilities incurred in their capacity as members of our board of directors.
Rule 10b5-1 Sales Plans
Our directors and executive officers may adopt written plans, known as Rule 10b5-1 plans, in which they will contract with a broker to buy or sell shares of our common stock on a periodic basis. Under a Rule 10b5-1 plan, a broker executes trades pursuant to parameters established by the director or officer when entering into the plan, without further direction from him or her. The director or officer may amend or terminate the plan in some circumstances. Our directors and executive officers may also buy or sell additional shares outside of a Rule 10b5-1 plan when they are not in possession of material, nonpublic information.
Stock Option and Other Compensation Plans
The two equity incentive plans described in this section are the 2012 Plan and the 2004 Plan. Prior to this offering, we granted awards to eligible participants under the 2004 Plan. Following the closing of this offering, we expect to grant awards to eligible participants under the 2012 Plan.
2012 Stock Incentive Plan
The 2012 Plan, which will become effective following the closing of this offering, provides for the grant of incentive stock options, non-statutory stock options, restricted stock awards and other stock-based awards. Upon effectiveness of the plan, the number of shares of our common stock that will be reserved for issuance under the 2012 Plan will be the sum of (i) 5,000,000 shares of common stock then available for issuance under the 2004 Plan, described below, and (ii) the number of shares of our common stock subject to outstanding awards under the 2004 Plan that expire, terminate or are otherwise surrendered, cancelled, forfeited or repurchased by us at their original issuance price pursuant to a contractual repurchase right. In addition, our 2012 Plan contains an “evergreen” provision that allows for an annual increase in the number of shares available for issuance under our 2012 Plan on the first day of the fiscal years ending December 31, 2012, 2013 and 2014. The annual increase shall be equal to the lesser of (a) 5,000,000 shares of common stock, (b) 5% of the number of shares of our common stock outstanding on the first day of the fiscal year and (c) an amount determined by our board of directors.
Our employees, officers, directors, consultants and advisors are eligible to receive awards under the 2012 Plan; however, incentive stock options may only be granted to our employees. The maximum number of shares of our common stock with respect to which awards may be granted to any participant under the plan is 1,000,000 shares per calendar year.
In accordance with the terms of the 2012 Plan, our board of directors has authorized our compensation committee to administer the plan. Pursuant to the terms of the 2012 Plan, our compensation committee will select the recipients of awards and determine:
| Ÿ | the number of shares of our common stock covered by options and the dates upon which the options become exercisable; |
| Ÿ | the exercise price of options; |
| Ÿ | the duration of options; and |
| Ÿ | the number of shares of our common stock subject to any restricted stock or other stock-based awards and the terms and conditions of such awards, including conditions for repurchase, issue price and repurchase price. |
106
Table of Contents
If our board of directors delegates authority to an executive officer to grant awards under the 2012 Plan, the executive officer will have the power to make awards to all of our employees, except executive officers. Our board of directors will fix the terms of the awards to be granted by such executive officer, including the exercise price of such awards, and the maximum number of shares subject to awards that such executive officer may make.
Upon a merger or other reorganization event, our board of directors may, in its sole discretion, take any one or more of the following actions pursuant to the 2012 Plan as to some or all outstanding awards other than restricted stock (except to the extent specifically provided otherwise in an applicable award agreement or another agreement between us and a plan participant):
| Ÿ | provide that all outstanding awards shall be assumed or substituted by the successor corporation; |
| Ÿ | upon written notice to a participant, provide that all of the participant’s unexercised options or awards will terminate immediately prior to the consummation of such reorganization event unless exercised by the participant; |
| Ÿ | provide that outstanding awards shall become exercisable, realizable or deliverable, or restrictions applicable to an award will lapse, in whole or in part, prior to or upon the reorganization event; |
| Ÿ | in the event of a reorganization event pursuant to which holders of shares of our common stock will receive a cash payment for each share surrendered in the reorganization event, make or provide for a cash payment to the participants with respect to each award held by a participant equal to (a) the number of shares of common stock subject to the vested portion of the award (after giving effect to any acceleration of vesting that occurs upon or immediately prior to such reorganization event) multiplied by (b) the excess, if any, of (i) the cash payment for each share surrendered in the reorganization event over (ii) the exercise, measurement or purchase price of such award and any applicable tax withholdings, in exchange for the termination of such awards; and |
| Ÿ | provide that, in connection with a liquidation or dissolution, awards convert into the right to receive liquidation proceeds. |
In the case of certain restricted stock units, no assumption or substitution shall be permitted and the restricted stock units shall instead be settled in accordance with the terms of the applicable restricted stock unit agreement.
Upon the occurrence of a reorganization event other than a liquidation or dissolution, the repurchase and other rights with respect to outstanding restricted stock shall continue for the benefit of the successor company and shall, unless the board of directors may otherwise determine, apply to the cash, securities or other property into which shares of our common stock are converted pursuant to the reorganization event; provided that our board of directors may provide for termination or deemed satisfaction of such repurchase or other rights under the instrument evidencing any restricted stock or any other agreement between us and a plan participant. Upon the occurrence of a reorganization event involving a liquidation or dissolution, all conditions on each outstanding restricted stock award will automatically be deemed terminated or satisfied, unless otherwise provided in the agreement evidencing the restricted stock award.
No award may be granted under the 2012 Plan on or after February 9, 2022. Our board of directors may amend, suspend or terminate the 2012 Plan at any time, except that stockholder approval will be required to comply with applicable law or stock market requirements.
107
Table of Contents
2004 Stock Option and Grant Plan
Our 2004 Plan was adopted by our board of directors and approved by our stockholders in August 2004.
The 2004 Plan provides for the grant of incentive stock options, non-qualified stock options, restricted stock awards and other stock-based awards. The number of shares of our common stock that are reserved for issuance under the 2004 Plan is 7,114,747 shares.
Our employees, officers, directors, consultants and other key persons are eligible to receive awards under our 2004 Plan. Pursuant to the terms of the 2004 Plan, our board of directors, or a committee it designates, administers the plan and, subject to any limitations in the plan, selects the recipients of awards and determines:
| Ÿ | the type of the award granted, whether it is incentive stock options, non-qualified stock options, restricted stock awards, unrestricted stock awards, or any combination of the foregoing, the number of shares of our common stock covered by the applicable grant and the dates upon which the options or awards become exercisable; |
| Ÿ | the exercise price of options; |
| Ÿ | the duration of options or restricted stock awards; |
| Ÿ | whether to accelerate exercisability or vesting of all or any portion of any award; and |
| Ÿ | the number of shares of our common stock subject to any restricted stock or other stock-based awards and the terms and conditions of such awards, including conditions for repurchase, issue price and repurchase price. |
Upon a merger or other reorganization event, the 2004 Plan and all outstanding options granted thereunder terminate, unless the parties to the transaction take any one or more of the following actions pursuant to our 2004 Plan as to some or all outstanding options:
| Ÿ | provide that all outstanding options shall be assumed or substituted by the successor corporation; and |
| Ÿ | provide that all outstanding options shall be substituted with new options of the successor entity, or a parent or subsidiary thereof, with an adjustment to the number and kind of shares and the per share exercise prices to which the parties shall agree. |
Notwithstanding the foregoing provisions of the 2004 Plan, the form of stock option agreement adopted by our board of directors provides for 12 months of accelerated vesting of unvested options issued under the 2004 Plan in the event we terminate the stock option holder’s employment during the period ending 12 months following the consummation of a change of control if the option is assumed or continued in the sole discretion of the parties to a sale event.
Upon the occurrence of a reorganization event other than a liquidation or dissolution, the repurchase and other rights under each outstanding restricted stock award shall continue for the benefit of the successor company and shall, unless the board of directors may otherwise determine, apply to the cash, securities or other property into which shares of our common stock are converted pursuant to the reorganization event; provided that the board of directors may provide for termination or deemed satisfaction of such repurchase or other rights under the instrument evidencing any restricted stock award or any other agreement between us and a plan participant. Upon the occurrence of a reorganization event involving a liquidation or dissolution, all conditions on each outstanding restricted stock award will automatically be deemed terminated or satisfied, unless otherwise provided in the agreement evidencing the restricted stock award.
108
Table of Contents
We have established a sub plan for France for our 2004 Plan, or Sub Plan. The Sub Plan was established to ensure favorable tax treatment for optionees residing in France. The Sub Plan allows our board of directors to unilaterally accelerate, reduce, lift or cancel vesting of any option under the Sub Plan to comply with applicable French social or tax laws. Our board of directors may impose a restriction on sale of up to three years on the sale of shares issued as a result of an option exercise under the Sub Plan. Our board of directors can set the exercise price for options issued under the Sub Plan as the greater of fair market value on the date of grant, 80% of the average stock exchange price during the twenty days preceding the related grant or 80% of the average repurchase price of our own shared held by us to be allocated to beneficiaries under the Sub Plan.
As of December 31, 2011, there were options to purchase an aggregate of 4,024,477 shares of common stock outstanding under the 2004 Plan, and there were no shares of restricted stock outstanding under the 2004 Plan. After the effective date of the 2012 Plan, we will grant no further stock options or other awards under the 2004 Plan; however, any shares of common stock reserved for issuance under the 2004 Plan that remain available for issuance and any shares of common stock subject to awards under the 2004 Plan that expire, terminate, or are otherwise surrendered, canceled, forfeited or repurchased without having been fully exercised or resulting in any common stock being issued shall be rolled into the 2012 Plan.
Director Compensation
Mr. Ebling, one of our directors, is also our president and chief executive officer. Mr. Ebling does not receive any additional compensation for his service as a director. See “Executive and Director Compensation—Summary Compensation” above for disclosure relating to his compensation. Mr. Schambach, the chairman of our board of directors, served as our executive chairman from March 1, 2007 until August 31, 2010 pursuant to an employment agreement dated February 14, 2007. Mr. Schambach’s employment agreement provided for an annual base salary of $200,000, an annual bonus of up to $50,000 and annual health insurance payments of up to $20,400. Pursuant to a letter agreement dated as of July 29, 2010, effective on September 1, 2010, we and Mr. Schambach terminated his employment with us, and we engaged Mr. Schambach as a consultant. Under the terms of our consulting arrangement with Mr. Schambach, he is eligible to receive consulting fees of up to $22,900 per month. For 2010, we paid Mr. Schambach $87,358 for his service as an employee and $51,087 for his service as a consultant. For 2011, we paid Mr. Schambach $164,745 for his service as a consultant. Mr. Schambach does not receive any compensation for his service as a director. Mr. Schambach’s consultancy terminated as of December 31, 2011.
In addition to Messrs. Ebling and Schambach, our board of directors consists of five other directors. Of these directors, two are associated with investors who currently hold more than 5% of our outstanding capital stock. Our directors do not receive compensation for serving on the board of directors, with the exception of Ms. Granoff and Messrs. Kane and Saxena. On September 20, 2011, we granted to Ms. Granoff an option to purchase 65,472 shares of our common stock under the 2004 Plan at an exercise price of $8.43 per share, the fair market value of our common stock on the date of grant. Ms. Granoff’s option will vest as to 12.5% of the shares underlying the option at the end of each three-month period beginning on October 27, 2011. On June 3, 2010, we granted to Mr. Kane an option to purchase 65,472 shares of our common stock under the 2004 Plan at an exercise price of $1.47 per share, the fair market value of our common stock on the date of grant. On July 29, 2010, we granted to Mr. Saxena an option to purchase 65,472 shares of our common stock under the 2004 Plan at an exercise price of $1.47 per share, the fair market value of our common stock on the date of grant. Messrs. Kane’s and Saxena’s options vest as to 12.5% of the shares underlying the option at the end of each three-month period beginning on April 23, 2010 and July 29, 2010, respectively. Additionally, on November 5, 2010, we sold and issued to Mr. Saxena 307,904 shares of Series D convertible preferred stock at a purchase price of $1.299106 per share. See “Certain Relationships and Related Person Transactions—Series D Convertible Preferred Stock.”
109
Table of Contents
Each member of our board of directors is entitled to reimbursement for reasonable travel and other expenses incurred in connection with attending board meetings and meetings for any committee on which he serves.
The following table sets forth information for the year ended December 31, 2011 regarding the compensation awarded or paid to our directors, other than Mr. Ebling, whose compensation is included in the “Summary Compensation Table” above.
| Name |
Fees Earned or Paid in Cash ($) |
Option Awards ($) (1) |
Total ($) | |||||||||
| Lawrence S. Bohn |
— | — | — | |||||||||
| Jill Granoff |
— | 292,858 | 292,858 | |||||||||
| Charles F. Kane |
— | — | — | |||||||||
| Jitendra Saxena |
— | — | — | |||||||||
| Michael J. Skok |
— | — | — | |||||||||
| Stephan Schambach |
164,745 | (2) | — | — | ||||||||
| (1) | The amount reported in this column represents the aggregate grant date fair value of the options granted to Ms. Granoff during 2011, computed in accordance with ASC 718. See note 9 to the consolidated financial statements included elsewhere in this prospectus regarding assumptions underlying the valuation of equity awards. The options listed below were granted to Ms. Granoff in connection with her service on our board of directors and consist of an option to purchase 65,472 shares of our common stock at an exercise price of $8.43 per share. |
| (2) | This amount reflects the fees we paid to Mr. Schambach in 2011 for his service as a consultant. Mr. Schambach did not receive any compensation for his service as a director. |
In January 2012, our compensation committee recommended to the board of directors, and in February 2012 our board of directors approved, new arrangements for the compensation of directors who are not employed by us or any of our subsidiaries and who are not holders of or principals, partners, directors or officers of holders of more than 5% of our voting securities. The following summarizes the terms of the compensatory arrangements for such directors, effective upon the completion of this public offering:
| Annual retainer fee for services on the board of directors |
$ | 30,000 | ||
| Additional annual retainer fees for board of director committee service: | ||||
| Audit Committee Chair |
$ | 18,000 | ||
| Audit Committee Member (other than Chair) |
$ | 8,000 | ||
| Compensation Committee Chair |
$ | 8,000 | ||
| Compensation Committee Member (other than Chair) |
$ | 4,000 | ||
| Nominating and Corporate Governance Committee Chair |
$ | 6,000 | ||
| Nominating and Corporate Governance Committee Member (other than Chair) |
$ | 3,000 | ||
In addition, each eligible director will be entitled to an annual restricted stock award under our 2012 Plan having a value on the date of grant of $100,000, which award will vest as to half of the shares on each of the first and second anniversaries of the date of grant.
110
Table of Contents
CERTAIN RELATIONSHIPS AND RELATED PERSON TRANSACTIONS
Since January 1, 2008, we have engaged in the following transactions with our directors and executive officers and holders of more than five percent of our voting securities and affiliates of our directors, executive officers and 5% stockholders. We believe that all of the transactions described below were made on terms no less favorable to us than could have been obtained from unaffiliated third parties.
Issuance of Preferred Stock
Series C Convertible Preferred Stock
In April 2008, we entered into an amendment to our Series C Convertible Preferred Stock Purchase Agreement, pursuant to which we issued and sold to accredited investors an aggregate of 7,050,467 shares of Series C convertible preferred stock, at a purchase price of $1.299106 per share, for an aggregate consideration of $9.1 million in cash. The following table sets forth the shares of Series C convertible preferred stock issued to our directors, officers or holders of more than 5% of our common stock and their affiliates:
| Investor |
Shares of Series C Convertible Preferred Stock |
|||
| Entities affiliated with General Catalyst Partners(1) |
2,848,443 | |||
| Entities affiliated with North Bridge Venture Partners(2) |
2,848,443 | |||
| Stephan Schambach(3) |
1,353,581 | |||
| (1) | Consists of (i) 2,748,982 shares of Series C convertible preferred stock issued and sold to General Catalyst Group III, L.P., or GCG III, and (ii) 99,461 shares of Series C convertible preferred stock issued and sold to GC Entrepreneurs Fund III, L.P., or GCEF III. General Catalyst Partners has ultimate voting and dispositive power over the shares held of record by GCG III and GCEF III. |
| (2) | Consists of (i) 1,911,527 shares of Series C convertible preferred stock issued and sold to North Bridge Venture Partners V-A, L.P., or NBVP V-A, and (ii) 936,916 shares of Series C convertible preferred stock issued and sold to North Bridge Venture Partners V-B, L.P., or NBVP V-B. North Bridge Venture Management V, L.P., or NBVP V, is the sole General Partner of NBVP V-A and NBVP V-B. NBVP GP, LLC, the General Partner of NBVM V, has ultimate voting and dispositive power over the shares held of record by NBVP V-A and NBVP V-B. |
| (3) | Mr. Schambach is the chairman of our board of directors. |
111
Table of Contents
Series D Convertible Preferred Stock
Pursuant to a Series D convertible preferred stock purchase agreement, in April 2009, March 2010 and November 2010, we issued and sold to accredited investors an aggregate of 17,242,628 shares of Series D convertible preferred stock, at a purchase price of $1.299106 per share, for an aggregate consideration of $22.4 million in cash. The following table sets forth the shares of Series D convertible preferred stock issued to our directors, officers or holders of more than 5% of our common stock and their affiliates:
| Investor |
Shares of Series D Convertible Preferred Stock |
|||
| Entities affiliated with General Catalyst Partners(1) |
7,086,876 | |||
| Entities affiliated with North Bridge Venture Partners(2) |
7,086,876 | |||
| Jitendra Saxena(3) |
307,904 | |||
| Stephan Schambach(4) |
2,760,972 | |||
| (1) | Consists of (i) 6,903,703 shares of Series D convertible preferred stock issued and sold to General Catalyst Group IV, L.P., or GCG IV, and (ii) 183,173 shares of Series D convertible preferred stock issued and sold to GC Entrepreneurs Fund IV, L.P., or GCEF IV. General Catalyst Partners has ultimate voting and dispositive power over the shares held of record by GCG IV and GCEF IV. |
| (2) | Consists of (i) 4,755,847 shares of Series D convertible preferred stock issued and sold to NBVP V-A and (ii) 2,331,029 shares of Series D convertible preferred stock issued and sold to NBVP V-B. NBVP V is the sole General Partner of NBVP V-A and NBVP V-B. NBVP GP, LLC, the General Partner of NBVM V, has ultimate voting and dispositive power over the shares held of record by NBVP V-A and NBVP V-B. |
| (3) | Mr. Saxena is a member of our board of directors. |
| (4) | Mr. Schambach is the chairman of our board of directors. |
Stockholder Agreements
Investor Rights Agreement
We have entered into a third amended and restated investor rights agreement, dated April 13, 2009, with the holders of shares of our preferred stock, certain holders of shares of our common stock and the holder of the warrant to purchase our capital stock, including the following directors and holders of more than five percent of our voting securities and their affiliates: entities affiliated with General Catalyst Partners (GCG III, GCEF III, GCG IV and GCEF IV), entities affiliated with North Bridge Venture Partners (NBVP V-A and NBVP V-B), Stephan Schambach and Jitendra Saxena. The third amended and restated investor rights agreement contains a right of first refusal provision that provides that we shall not make certain issuances of our securities unless we first offer up to two-thirds of such securities to certain holders of convertible preferred stock in accordance with the terms of the agreement. The right of first refusal provision does not apply to, and will terminate upon the closing of, this offering. The third amended and restated investor rights agreement also provides that (i) certain holders of our preferred stock will have the right to demand that we file a registration statement, subject to certain limitations, and (ii) the holders of our preferred stock, certain holders of our common stock and the holder of a warrant to purchase capital stock will have the right to request that their shares be covered by a registration statement that we are otherwise filing.
Voting and Stock Restriction Agreement
We entered into a third amended and restated voting and stock restriction agreement, dated as of April 13, 2009, as amended on March 26, 2010, with holders of our preferred stock and certain holders of our common stock, including the following directors, executive officers and holders of more than five
112
Table of Contents
percent of our voting securities and their affiliates: entities affiliated with General Catalyst Partners (GCG III, GCEF III, GCG IV and GCEF IV), entities affiliated with North Bridge Venture Partners (NBVP V-A and NBVP V-B), Stephan Schambach, Wayne Whitcomb and Jitendra Saxena. Pursuant to the terms of the amended and restated voting and stock restriction agreement, the holders of preferred stock have a right of purchase and co-sale in respect of sales of securities by our founder and common stockholders party to the agreement. These purchase and co-sale rights do not apply to shares sold pursuant to this offering and will terminate upon the closing of this offering. In addition, pursuant to the third amended and restated voting and stock restriction agreement, each party to the voting and stock restriction agreement has agreed to vote all of the shares of our capital stock they hold in the manner described therein with respect to the size and composition of our board of directors, subject to certain specified exceptions. These voting obligations will terminate upon the closing of this offering.
Indemnification Agreements
Our amended and restated certificate of incorporation provides that we will indemnify our directors and officers to the fullest extent permitted by Delaware law. In addition, we have entered into indemnification agreements with our directors and executive officers.
Arrangements with Executive Officers and Directors
For a description of the compensation arrangements we have with our executive officers and directors, see “Executive and Director Compensation—Employment Agreements” and “Executive and Director Compensation—Director Compensation.”
Policies and Procedures for Related Person Transactions
Our board of directors adopted a written policy and procedures for the review of any transaction, arrangement or relationship in which Demandware, Inc. is a participant, the amount involved exceeds $120,000, and one of our executive officers, directors, director nominees or 5% stockholders (or their immediate family members), each of whom we refer to as a “related person,” has a direct or indirect material interest.
If a related person proposes to enter into such a transaction, arrangement or relationship, which we refer to as a “related person transaction,” the related person must report the proposed related person transaction to our general counsel. The policy calls for the proposed related person transaction to be reviewed and, if deemed appropriate, approved by the audit committee. Whenever practicable, the reporting, review and approval will occur prior to entry into the transaction. If advance review and approval is not practicable, the audit committee will review, and, in its discretion, may ratify the related person transaction. The policy also permits the chairman of the audit committee to review and, if deemed appropriate, approve proposed related person transactions that arise between committee meetings, subject to ratification by the audit committee at its next meeting. Any related person transactions that are ongoing in nature will be reviewed annually.
A related person transaction reviewed under the policy will be considered approved or ratified if it is authorized by the audit committee after full disclosure of the related person’s interest in the transaction. As appropriate for the circumstances, the audit committee will review and consider:
| Ÿ | the related person’s interest in the related person transaction; |
| Ÿ | the approximate dollar value of the amount involved in the related person transaction; |
| Ÿ | the approximate dollar value of the amount of the related person’s interest in the transaction without regard to the amount of any profit or loss; |
113
Table of Contents
| Ÿ | whether the transaction was undertaken in the ordinary course of our business; |
| Ÿ | whether the terms of the transaction are no less favorable to us than terms that could have been reached with an unrelated third party; |
| Ÿ | the purpose of, and the potential benefits to us of, the transaction; and |
| Ÿ | any other information regarding the related person transaction or the related person in the context of the proposed transaction that would be material to investors in light of the circumstances of the particular transaction. |
The audit committee may approve or ratify the transaction only if it determines that, under all of the circumstances, the transaction is in or is not inconsistent with Demandware’s best interests. The audit committee may impose any conditions on the related person transaction that it deems appropriate.
In addition to the transactions that are excluded by the instructions to the SEC’s related person transaction disclosure rule, our board of directors has determined that the following transactions, among others, do not create a material direct or indirect interest on behalf of related persons and, therefore, are not related person transactions for purposes of this policy:
| Ÿ | interests arising solely from the related person’s position as an executive officer of another entity (whether or not the person is also a director of such entity), that is a participant in the transaction, where (a) the related person and all other related persons own in the aggregate less than a 10% equity interest in such entity, (b) the related person and his or her immediate family members are not involved in the negotiation of the terms of the transaction and do not receive any special benefits as a result of the transaction, (c) the amount involved in the transaction equals less than the greater of $1.0 million or 2% of the annual consolidated gross revenue of the other entity that is a party to the transaction, and (d) the amount involved in the transaction equals less than 2% of our annual consolidated gross revenues; and |
| Ÿ | a transaction that is specifically contemplated by provisions of our amended and restated certificate of incorporation and amended and restated by-laws. |
The policy provides that transactions involving compensation of executive officers shall be reviewed and approved by the compensation committee in the manner specified in its charter.
114
Table of Contents
The following table sets forth information with respect to the beneficial ownership of our common stock, as of January 31, 2012 by:
| Ÿ | each person known by us to beneficially own more than 5% of our common stock; |
| Ÿ | each of our directors; |
| Ÿ | each of our executive officers; and |
| Ÿ | all of our executive officers and directors as a group. |
The column entitled “Percentage of Shares Beneficially Owned—Before Offering” is based on a total of 22,532,595 shares of our common stock outstanding as of January 31, 2012, assuming (i) a 1-for-3 reverse split of our common stock (ii) the conversion of all outstanding shares of our preferred stock into 18,028,763 shares of common stock upon the closing of this offering, which reflects the effect of the 1-for-3 reverse stock split. The column entitled “Percentage of Shares Beneficially Owned—After Offering” is based on 28,032,595 shares of our common stock to be outstanding after this offering, including the 5,500,000 shares of our common stock that we are selling in this offering and the total number of shares of our common stock outstanding as January 31, 2012, but not including any additional shares issuable upon exercise of outstanding stock options or upon exercise of the underwriters’ option to purchase additional shares.
The number of shares beneficially owned by each stockholder is determined under rules issued by the SEC and includes voting or investment power with respect to securities. Under these rules, beneficial ownership includes any shares as to which the individual or entity has sole or shared voting power or investment power. In computing the number of shares beneficially owned by an individual or entity and the percentage ownership of that person, shares of common stock subject to options, warrants or other rights held by such person that are currently exercisable or will become exercisable within 60 days of January 31, 2012 are considered outstanding, although these shares are not considered outstanding for purposes of computing the percentage ownership of any other person. Unless otherwise indicated, the address of all listed stockholders is 5 Wall Street, Burlington, Massachusetts 01803. Each of the stockholders listed has sole voting and investment power with respect to the shares beneficially owned by the stockholder unless noted otherwise, subject to community property laws where applicable.
115
Table of Contents
| Shares Beneficially Owned |
Percentage of Shares Beneficially Owned |
|||||||||||
| Name of Beneficial Owner |
Before Offering |
After Offering |
||||||||||
| 5% Stockholders |
||||||||||||
| Entities affiliated with North Bridge Venture Partners(1) 950 Winter Street |
7,203,867 | 32.0 | % | 25.7% | ||||||||
| Entities affiliated with General Catalyst Partners(2) 20 University Road |
7,203,867 | 32.0 | % | 25.7% | ||||||||
| Stephan Schambach(3) |
4,406,551 | 19.6 | % | 15.7% | ||||||||
| Executive Officers and Directors |
||||||||||||
| Thomas D. Ebling(4) |
944,833 | 4.1 | % | 3.3% | ||||||||
| Scott J. Dussault(5) |
195,830 | * | * | |||||||||
| Jeffrey G. Barnett(6) |
515,275 | 2.3 | % | 1.8% | ||||||||
| Wayne R. Whitcomb(7) |
227,773 | 1.0 | % | * | ||||||||
| Lawrence S. Bohn(2) |
7,203,867 | 32.0 | % | 25.7% | ||||||||
| Jill Granoff(8) |
16,368 | * | * | |||||||||
| Charles F. Kane(9) |
57,288 | * | * | |||||||||
| Jitendra Saxena(10) |
151,738 | * | * | |||||||||
| Michael J. Skok(1) |
— | * | * | |||||||||
| All executive officers and directors as a group (10 persons)(11) |
13,719,523 | 58.3 | % | 47.3% | ||||||||
| * | Represents beneficial ownership of less than 1% of our outstanding common stock. |
| (1) | Consists of (i) 877,993 shares of common stock issuable upon conversion of shares of Series A convertible preferred stock held by North Bridge Venture Partners V-A, L.P., or NBVP V-A; (ii) 430,339 shares of common stock issuable upon conversion of shares of Series A convertible preferred stock held by North Bridge Venture Partners V-B, L.P., or NBVP V-B; (iii) 873,163 shares of common stock issuable upon conversion of shares of Series B convertible preferred stock held by NBVP V-A; (iv) 427,972 shares of common stock issuable upon conversion of shares of Series B convertible preferred stock held by NBVP V-B; (v) 1,497,918 shares of common stock issuable upon conversion of shares of Series C convertible preferred stock held by NBVP V-A; (vi) 734,189 shares of common stock issuable upon conversion of shares of Series C convertible preferred stock held by NBVP V-B; (vii) 1,585,282 shares of common stock issuable upon conversion of shares of Series D convertible preferred stock held by NBVP V-A; and (viii) 777,009 shares of common stock issuable upon conversion of shares of Series D convertible preferred stock held by NBVP V-B. North Bridge Venture Management V, L.P., or NBVM V, is the sole General Partner of NBVP V-A and NBVP V-B. NBVM GP, LLC, the General Partner of NBVM V, has ultimate voting and dispositive power over the shares held of record by NBVP V-A and NBVP V-B. Mr. Skok, a member of our board of directors, is a Manager of NBVM GP, LLC. Mr. Skok does not have sole or shared voting or dispositive power over such shares for the purposes of Section 13 of the Exchange Act. Voting and dispositive power of such shares are vested in Edward T. Anderson and Richard A. D’Amore. |
| (2) | Consists of (i) 1,262,649 shares of common stock issuable upon conversion of shares of Series A convertible preferred stock held by General Catalyst Group III, L.P., or GCG III; (ii) 45,684 shares of common stock issuable upon conversion of shares of Series A convertible preferred stock held by GC Entrepreneurs Fund III, L.P., or GCEF III; (iii) 1,255,703 shares of common stock issuable upon conversion of shares of Series B convertible preferred stock held by GCG III; (iv) 45,432 shares of common stock issuable upon conversion of shares of Series B convertible preferred stock held by GCEF III; (v) 2,154,167 shares of common stock issuable upon conversion of shares of Series C convertible preferred stock held by GCG III; (vi) 77,940 shares of common stock issuable upon conversion of shares of Series C convertible preferred stock held by GCEF III; (vii) 2,301,234 shares of common stock issuable upon conversion of shares of Series D convertible preferred stock held by General Catalyst Group IV, L.P., or GCG IV; and |
116
Table of Contents
| (viii) 61,057 shares of common stock issuable upon conversion of shares of Series D convertible preferred stock held by GC Entrepreneurs Fund IV, L.P., or GCEF IV. General Catalyst Partners has ultimate voting and dispositive power over the shares held of record by GCG III, GCEF III, GCG IV and GCEF IV. Mr. Bohn, a member of our board of directors, is a managing director of General Catalyst Partners and may be deemed to beneficially own the shares held by it. Mr. Bohn disclaims such beneficial ownership, except to the extent of his pecuniary interest therein. Voting and dispositive power of such shares are shared by Mr. Bohn, Joel E. Cutler, David P. Fialkow, William J. Fitzgerald, David J. Orfao and John G. Simon. |
| (3) | Consists of (i) 447,720 shares of common stock issuable upon conversion of shares of Series A convertible preferred stock held by Mr. Schambach; (ii) 514,402 shares of common stock issuable upon conversion of shares of Series B convertible preferred stock held by Mr. Schambach; (iii) 924,104 shares of common stock issuable upon conversion of shares of Series C convertible preferred stock held by Mr. Schambach; (iv) 920,324 shares of common stock issuable upon conversion of shares of Series D convertible preferred stock held by Mr. Schambach; and (v) 1,600,000 shares of common stock held by Mr. Schambach. |
| (4) | Includes 289,238 shares of common stock issuable to Mr. Ebling upon the exercise of stock options within 60 days of January 31, 2012. |
| (5) | Includes 170,830 shares of common stock issuable to Mr. Dussault upon the exercise of stock options within 60 days of January 31, 2012. |
| (6) | Consists of 323,767 shares of common stock issuable to Mr. Barnett upon the exercise of stock options within 60 days of January 31, 2012. |
| (7) | Includes 127,773 shares of common stock issuable to Mr. Whitcomb upon the exercise of stock options within 60 days of January 31, 2012. |
| (8) | Includes 16,368 shares of common stock issuable to Ms. Granoff upon the exercise of stock options within 60 days of January 31, 2012. |
| (9) | Consists of 24,552 shares of common stock issuable to Mr. Kane upon the exercise of stock options within 60 days of January 31, 2012. |
| (10) | Consists of (i) 102,634 shares of common stock issuable upon conversion of shares of Series D convertible preferred stock held by Mr. Saxena and (ii) 49,104 shares of common stock issuable to Mr. Saxena upon the exercise of stock options within 60 days of January 31, 2012. |
| (11) | See footnotes 1 through 10 above. Includes 1,001,632 shares of common stock issuable upon the exercise of stock options within 60 days of January 31, 2012. |
117
Table of Contents
General
Following the closing of this offering, our authorized capital stock will consist of 240,000,000 shares of common stock, par value $0.01 per share, and 10,000,000 shares of preferred stock, par value $0.01 per share. The following are descriptions of our capital stock and provisions of our amended and restated certificate of incorporation and amended and restated by-laws that will become effective upon the closing of this offering. Copies of these documents will be filed with the SEC as exhibits to our registration statement, of which this prospectus forms a part. The description of our common stock reflects changes to our capital structure that will occur upon the closing of this offering.
Common Stock
As of January 31, 2012, there were 22,532,595 shares of our common stock outstanding and held of record by 82 stockholders, assuming the conversion of all outstanding shares of preferred stock.
Holders of our common stock are entitled to one vote for each share held on all matters submitted to a vote of stockholders and do not have cumulative voting rights. An election of directors by our stockholders shall be determined by a plurality of the votes cast by the stockholders entitled to vote on the election. Holders of common stock are entitled to receive proportionately any dividends as may be declared by our board of directors, subject to any preferential dividend rights of any series of preferred stock that we may designate and issue in the future.
In the event of our liquidation or dissolution, the holders of common stock are entitled to receive proportionately our net assets available for distribution to stockholders after the payment of all debts and other liabilities and subject to the prior rights of any outstanding preferred stock. Holders of common stock have no preemptive, subscription, redemption or conversion rights. The rights, preferences and privileges of holders of common stock are subject to and may be adversely affected by the rights of the holders of shares of any series of preferred stock that we may designate and issue in the future.
Preferred Stock
Under the terms of our amended and restated certificate of incorporation that will become effective upon the closing of this offering, our board of directors is authorized to direct us to issue shares of preferred stock in one or more series without stockholder approval. Our board of directors has the discretion to determine the rights, preferences, privileges and restrictions, including voting rights, dividend rights, conversion rights, redemption privileges and liquidation preferences, of each series of preferred stock.
The purpose of authorizing our board of directors to issue preferred stock and determine its rights and preferences is to eliminate delays associated with a stockholder vote on specific issuances. The issuance of preferred stock, while providing flexibility in connection with possible acquisitions, future financings and other corporate purposes, could have the effect of making it more difficult for a third party to acquire, or could discourage a third party from seeking to acquire, a majority of our outstanding voting stock. Upon the closing of this offering, there will be no shares of preferred stock outstanding, and we have no present plans to issue any shares of preferred stock.
Options
As of December 31, 2011, we had outstanding options to purchase an aggregate of 4,024,477 shares of common stock with a weighted average exercise price of $1.92 per share.
118
Table of Contents
Warrants
As of December 31, 2011, we had one outstanding warrant to purchase 23,092 shares of Series C preferred stock, which, upon the closing of this offering, will convert into a warrant to purchase common stock, at an exercise price of $3.90 per share.
Registration Rights
We entered into a third amended and restated investor rights agreement, dated April 13, 2009, with the holders of shares of our preferred stock, certain holders of shares of our common stock and the holder of the warrant to purchase our capital stock. Under the investor rights agreement, holders of shares having registration rights can demand that we file a registration statement or request that their shares be covered by a registration statement that we are otherwise filing, as described below.
Demand Registration Rights
At any time 180 days after the closing of this offering, the holders of two-thirds of the shares having demand registration rights may request that we register all or a portion of their common stock for sale under the Securities Act, so long as the aggregate price to the public in connection with any such offering is at least $5 million. We may be required to effect three of these registrations. In addition, when we are eligible for the use of Form S-3, or any successor form, holders of two-thirds of the shares having demand registration rights may make unlimited requests that we register all or a portion of their common stock for sale under the Securities Act on Form S-3, or any successor form, so long as the aggregate price to the public in connection with any such offering is at least $1 million.
Incidental Registration Rights
If at any time after this offering we register any shares of our common stock, other than a registration statement on Form S-4 or Form S-8, the holders of all shares having registration rights are entitled to notice of the registration and to require us to use best efforts to include all or a portion of their common stock in such registration.
Other Provisions
In the event that any registration in which the holders of registrable shares participate pursuant to the investor rights agreement is an underwritten public offering, the number of registrable shares to be included may, in specified circumstances, be limited due to market conditions.
We will pay all registration expenses, other than underwriting discounts and selling commissions, related to any demand or incidental registration. The investor rights agreement contains customary cross-indemnification provisions, pursuant to which we are obligated to indemnify the selling stockholders in the event of material misstatements or omissions in the registration statement attributable to us, and they are obligated to indemnify us for material misstatements or omissions in the registration statement attributable to them.
Anti-Takeover Provisions
We are subject to Section 203 of the Delaware General Corporation Law. Subject to certain exceptions, Section 203 prevents a publicly held Delaware corporation from engaging in a “business combination” with any “interested stockholder” for three years following the date that the person became an interested stockholder, unless the interested stockholder attained such status with the approval of our board of directors or unless the business combination is approved in a prescribed manner. A “business combination” includes, among other things, a merger or consolidation involving us and the “interested stockholder” and the sale of more than 10% of our assets. In general, an “interested stockholder” is any entity or person beneficially owning 15% or more of our outstanding voting stock and any entity or person affiliated with or controlling or controlled by such entity or person.
119
Table of Contents
Staggered Board; Removal of Directors
Our amended and restated certificate of incorporation and our amended and restated by-laws divide our board of directors into three classes with staggered three-year terms. In addition, they provide that a director may be removed only for cause and only by the affirmative vote of the holders of at least 66 2/3% of the votes that all our stockholders would be entitled to cast in an annual election of directors. Any vacancy on our board of directors, including a vacancy resulting from an enlargement of our board of directors, may be filled only by vote of a majority of our directors then in office.
The classification of our board of directors and the limitations on the removal of directors and filling of vacancies could make it more difficult for a third party to acquire, or discourage a third party from seeking to acquire, control of our company.
Super-Majority Voting
The Delaware General Corporation Law provides generally that the affirmative vote of a majority of the shares entitled to vote on any matter is required to amend a corporation’s certificate of incorporation or by-laws, unless a corporation’s certificate of incorporation or by-laws, as the case may be, requires a greater percentage. Our amended and restated by-laws may be amended or repealed by a majority vote of our board of directors or the affirmative vote of the holders of at least 66 2/3% of the votes that all our stockholders would be entitled to cast in an annual election of directors. In addition, the affirmative vote of the holders of at least two-thirds of the votes which all our stockholders would be entitled to cast in an election of directors is required to amend or repeal or to adopt any provisions inconsistent with any of the provisions of our amended and restated certificate of incorporation described in the prior two paragraphs.
Stockholder Action; Special Meeting of Stockholders
Our amended and restated certificate of incorporation provides that any action required or permitted to be taken by our stockholders must be effected at a duly called annual or special meeting of such stockholders and may not be effected by any consent in writing by such stockholders. Our amended and restated certificate of incorporation and amended and restated by-laws also provide that, except as otherwise required by law, special meetings of our stockholders can only be called by our chairman of the board, our chief executive officer or our board of directors.
Authorized But Unissued Shares
Authorized but unissued shares of our common stock and preferred stock are available for future issuance without stockholder approval, subject to any limitations imposed by the listing standards of the New York Stock Exchange. These additional shares may be used for a variety of corporate finance transactions, acquisitions and employee benefit plans. The existence of authorized but unissued and unreserved common stock and preferred stock could make more difficult or discourage an attempt to obtain control of us by means of a proxy contest, tender offer, merger or otherwise.
Transfer Agent and Registrar
The transfer agent and registrar for our common stock will be American Stock Transfer & Trust Company, LLC.
The New York Stock Exchange
Our common stock has been approved for listing on the New York Stock Exchange under the symbol “DWRE”.
120
Table of Contents
SHARES ELIGIBLE FOR FUTURE SALE
Immediately prior to this offering, there was no public market for our common stock. Future sales of substantial amounts of common stock in the public market, or the perception that such sales may occur, could adversely affect the market price of our common stock. Although our common stock has been approved for listing on the New York Stock Exchange, we cannot assure you that there will be an active public market for our common stock.
Upon the closing of this offering, we will have outstanding an aggregate of 28,032,595 shares of common stock based on the number of shares outstanding as of January 31, 2012. This includes the issuance of 5,500,000 shares of common stock offered by us in this offering and assumes no exercise of options or warrants after January 31, 2012. Of these shares, all shares sold in this offering will be freely tradable without restriction or further registration under the Securities Act, except for any shares purchased by our “affiliates,” as that term is defined in Rule 144 under the Securities Act, whose sales would be subject to the Rule 144 resale restrictions described below, other than the holding period requirement.
The remaining 22,532,595 shares of common stock will be “restricted securities,” as that term is defined in Rule 144 under the Securities Act. These restricted securities are eligible for public sale only if they are registered under the Securities Act or if they qualify for an exemption from registration under Rules 144 or 701 under the Securities Act, which are summarized below.
Subject to the lock-up agreements described below and the provisions of Rules 144 and 701 under the Securities Act, these restricted securities will be available for sale in the public market as follows:
| Date |
Number of Shares | |||
| On the date of this prospectus |
0 | |||
| 90 days after the date of this prospectus |
0 | |||
| 180 days after the date of this prospectus |
22,532,595 | |||
In addition, of the 3,989,852 shares of our common stock that were subject to stock options outstanding as of January 31, 2012, options to purchase 2,007,644 shares of common stock were vested as of January 31, 2012 and, upon exercise, these shares will be eligible for sale subject to the lock–up agreements described below and Rules 144 and 701 under the Securities Act.
Lock-Up Agreements
We and each of our directors and executive officers and holders of substantially all of our outstanding capital stock, who collectively own 99.9% of our shares of our common stock, based on shares outstanding as of January 31, 2012, have agreed that, without the prior written consent of Goldman, Sachs & Co. and Deutsche Bank Securities Inc. on behalf of the underwriters, we and they will not, subject to limited exceptions, during the period ending 180 days after the date of this prospectus, subject to extension in specified circumstances:
| Ÿ | offer, pledge, sell, contract to sell, sell any option or contract to purchase, purchase any option or contract to sell, grant any option, right or warrant to purchase, lend, or otherwise transfer or dispose of, directly or indirectly, any shares of our common stock or any securities convertible into or exercisable or exchangeable for common stock; or |
| Ÿ | enter into any swap or other arrangement that transfers to another, in whole or in part, any of the economic consequences of ownership of our common stock, |
whether any transaction described above is to be settled by delivery of our common stock or such other securities, in cash or otherwise.
121
Table of Contents
These agreements are subject to certain exceptions, and also subject to extensions for up to an additional 34 days, as described in the section of this prospectus entitled “Underwriting.”
Upon the expiration of the applicable lock-up periods, substantially all of the shares subject to such lock-up restrictions will become eligible for sale, subject to the limitations discussed above.
Rule 144
Affiliate Resales of Restricted Securities
In general, beginning 90 days after the effective date of the registration statement of which this prospectus is a part, a person who is an affiliate of ours, or who was an affiliate at any time during the 90 days before a sale, who has beneficially owned shares of our common stock for at least six months would be entitled to sell in “broker’s transactions” or certain “riskless principal transactions” or to market makers, a number of shares within any three-month period that does not exceed the greater of:
| Ÿ | 1% of the number of shares of our common stock then outstanding, which will equal approximately 280,326 shares immediately after this offering based on the number of shares outstanding as of January 31, 2012; or |
| Ÿ | the average weekly trading volume in our common stock on the New York Stock Exchange during the four calendar weeks preceding the filing of a notice on Form 144 with respect to such sale. |
Affiliate resales under Rule 144 are also subject to the availability of current public information about us. In addition, if the number of shares being sold under Rule 144 by an affiliate during any three-month period exceeds 5,000 shares or has an aggregate sale price in excess of $50,000, the seller must file a notice on Form 144 with the SEC and the New York Stock Exchange concurrently with either the placing of a sale order with the broker or the execution directly with a market maker.
Non-Affiliate Resales of Restricted Securities
In general, beginning 90 days after the effective date of the registration statement of which this prospectus is a part, a person who is not an affiliate of ours at the time of sale, and has not been an affiliate at any time during the three months preceding a sale, and who has beneficially owned shares of our common stock for at least six months but less than a year, is entitled to sell such shares subject only to the availability of current public information about us. If such person has held our shares for at least one year, such person can resell under Rule 144(b)(1) without regard to any Rule 144 restrictions, including the 90-day public company requirement and the current public information requirement.
Non-affiliate resales are not subject to the manner of sale, volume limitation or notice filing provisions of Rule 144.
Rule 701
In general, under Rule 701, any of an issuer’s employees, directors, officers, consultants or advisors who purchase shares from the issuer in connection with a compensatory stock or option plan or other written agreement before the effective date of a registration statement under the Securities Act is entitled to sell such shares 90 days after such effective date in reliance on Rule 144. An affiliate of the issuer can resell shares in reliance on Rule 144 without having to comply with the holding period requirement, and non-affiliates of the issuer can resell shares in reliance on Rule 144 without having to comply with the current public information and holding period requirements.
122
Table of Contents
The SEC has indicated that Rule 701 will apply to typical stock options granted by an issuer before it becomes subject to the reporting requirements of the Exchange Act, along with the shares acquired upon exercise of such options, including exercises after an issuer becomes subject to the reporting requirements of the Exchange Act.
Equity Plans
We intend to file one or more registration statements on Form S-8 under the Securities Act to register all shares of common stock subject to outstanding stock options and common stock issued or issuable under our stock plans. We expect to file the registration statement covering shares offered pursuant to our stock plans shortly after the date of this prospectus, permitting the resale of such shares by nonaffiliates in the public market without restriction under the Securities Act and the sale by affiliates in the public market, subject to compliance with the resale provisions of Rule 144.
Registration Rights
Upon the closing of this offering, the holders of 18,028,763 shares of common stock or their transferees will be entitled to various rights with respect to the registration of these shares under the Securities Act. Registration of these shares under the Securities Act would result in these shares becoming fully tradable without restriction under the Securities Act immediately upon the effectiveness of the registration, except for shares purchased by affiliates. See “Description of Capital Stock—Registration Rights” for additional information. Shares covered by a registration statement will be eligible for sale in the public market upon the expiration or release from the terms of the lock-up agreement.
123
Table of Contents
MATERIAL U.S. TAX CONSIDERATIONS FOR NON-U.S. HOLDERS OF COMMON STOCK
The following is a general discussion of material U.S. federal income and estate tax considerations relating to ownership and disposition of our common stock by a non-U.S. holder. For purposes of this discussion, the term “non-U.S. holder” means a beneficial owner of our common stock that is not, for U.S. federal income tax purposes:
| Ÿ | an individual who is a citizen or resident of the United States; |
| Ÿ | a corporation, or other entity treated as a corporation for U.S. federal income tax purposes, created or organized in or under the laws of the United States or of any political subdivision of the United States; |
| Ÿ | an estate the income of which is subject to U.S. federal income taxation regardless of its source; or |
| Ÿ | a trust, if a U.S. court is able to exercise primary supervision over the administration of the trust and one or more U.S. persons have authority to control all substantial decisions of the trust or if the trust has a valid election to be treated as a U.S. person under applicable U.S. Treasury regulations. |
An individual may be treated as a resident instead of a nonresident of the United States in any calendar year for U.S. federal income tax purposes if the individual was present in the United States for at least 31 days in that calendar year and for an aggregate of at least 183 days during the three-year period ending with the current calendar year. For purposes of this calculation, all of the days present in the current year, one-third of the days present in the immediately preceding year and one-sixth of the days present in the second preceding year are counted. Residents are taxed for U.S. federal income tax purposes as if they were U.S. citizens.
This discussion is based on current provisions of the U.S. Internal Revenue Code of 1986, as amended, which we refer to as the Code, existing and proposed U.S. Treasury Regulations promulgated thereunder, current administrative rulings and judicial decisions, all as in effect as of the date of this prospectus and all of which are subject to change or to differing interpretation, possibly with retroactive effect. Any change could alter the tax consequences to non-U.S. holders described in this prospectus. In addition, the Internal Revenue Service, or the IRS, could challenge one or more of the tax consequences described in this prospectus.
We assume in this discussion that each non-U.S. holder holds shares of our common stock as a capital asset (generally, property held for investment). This discussion does not address all aspects of U.S. federal income and estate taxation that may be relevant to a particular non-U.S. holder in light of that non-U.S. holder’s individual circumstances nor does it address any aspects of U.S. state, local or non-U.S. taxes. This discussion also does not consider any specific facts or circumstances that may apply to a non-U.S. holder and does not address the special tax rules applicable to particular non-U.S. holders, such as:
| Ÿ | insurance companies; |
| Ÿ | tax-exempt organizations; |
| Ÿ | financial institutions; |
| Ÿ | brokers or dealers in securities; |
| Ÿ | regulated investment companies; |
| Ÿ | pension plans; |
| Ÿ | controlled foreign corporations; |
124
Table of Contents
| Ÿ | passive foreign investment companies; |
| Ÿ | owners that hold our common stock as part of a straddle, hedge, conversion transaction, synthetic security or other integrated investment; and |
| Ÿ | certain U.S. expatriates. |
In addition, this discussion does not address the tax treatment of partnerships or persons who hold their common stock through partnerships or other entities which are pass-through entities for U.S. federal income tax purposes. A partner in a partnership or other pass-through entity that will hold our common stock should consult his, her or its own tax advisor regarding the tax consequences of the ownership and disposition of our common stock through a partnership or other pass-through entity, as applicable.
Prospective investors should consult their own tax advisors regarding the U.S. federal, state, local and non-U.S. income and other tax considerations of acquiring, holding and disposing of our common stock.
Dividends
If we pay distributions on our common stock, those distributions generally will constitute dividends for U.S. federal income tax purposes to the extent paid from our current or accumulated earnings and profits, as determined under U.S. federal income tax principles. If a distribution exceeds our current and accumulated earnings and profits, the excess will be treated as a tax-free return of the non-U.S. holder’s investment, up to such holder’s tax basis in the common stock. Any remaining excess will be treated as capital gain, subject to the tax treatment described below under the heading “Gain on Disposition of Common Stock.”
Dividends paid to a non-U.S. holder generally will be subject to withholding of U.S. federal income tax at a 30% rate or such lower rate as may be specified by an applicable income tax treaty between the United States and such holder’s country of residence. If we determine, at a time reasonably close to the date of payment of a distribution on our common stock, that the distribution will not constitute a dividend because we do not anticipate having current or accumulated earnings and profits at the end of the taxable year in which the distribution is made, we intend not to withhold any U.S. federal income tax on the distribution as permitted by U.S. Treasury Regulations.
Dividends that are treated as effectively connected with a trade or business conducted by a non-U.S. holder within the United States, and, if an applicable income tax treaty so provides, that are attributable to a permanent establishment or a fixed base maintained by the non-U.S. holder within the United States, are generally exempt from the 30% withholding tax if the non-U.S. holder satisfies applicable certification and disclosure requirements. However, such U.S. effectively connected income, net of specified deductions and credits, is taxed at the same graduated U.S. federal income tax rates applicable to U.S. persons (as defined in the Code). Any U.S. effectively connected income received by a non-U.S. holder that is a corporation may also, under certain circumstances, be subject to an additional “branch profits tax” at a 30% rate or such lower rate as may be specified by an applicable income tax treaty between the United States and such holder’s country of residence.
A non-U.S. holder of our common stock who claims the benefit of an applicable income tax treaty between the United States and such holder’s country of residence generally will be required to provide a properly executed IRS Form W-8BEN (or successor form) and satisfy applicable certification and other requirements. Non-U.S holders are urged to consult their own tax advisors regarding their entitlement to benefits under a relevant income tax treaty.
125
Table of Contents
A non-U.S. holder that is eligible for a reduced rate of U.S. withholding tax under an income tax treaty may obtain a refund or credit of any excess amounts withheld by timely filing an appropriate claim with the IRS.
Gain on Disposition of Common Stock
A non-U.S. holder generally will not be subject to U.S. federal income tax on gain recognized on a disposition of our common stock unless:
| Ÿ | the gain is effectively connected with the non-U.S. holder’s conduct of a trade or business in the United States, and, if an applicable income tax treaty so provides, the gain is attributable to a permanent establishment or fixed base maintained by the non-U.S. holder in the United States; in these cases, the non-U.S. holder will be taxed on a net income basis at the regular graduated rates and in the manner applicable to U.S. persons, and if the non-U.S. holder is a foreign corporation, an additional branch profits tax at a rate of 30%, or a lower rate as may be specified by an applicable income tax treaty, may also apply; |
| Ÿ | the non-U.S. holder is a non-resident alien present in the United States for 183 days or more in the taxable year of the disposition and certain other requirements are met, in which case the non-U.S. holder will be subject to a 30% tax (or such lower rate as may be specified by an applicable income tax treaty) on the net gain derived from the disposition, which may be offset by U.S.-source capital losses of the non-U.S. holder, if any; or |
| Ÿ | we are or have been, at any time during the five-year period preceding such disposition (or the non-U.S. holder’s holding period, if shorter) a “U.S. real property holding corporation” unless our common stock is regularly traded on an established securities market and the non-U.S. holder held no more than 5% of our outstanding common stock, directly or indirectly, during the shorter of the 5-year period ending on the date of the disposition or the period that the non-U.S. holder held our common stock. Generally, a corporation is a “U.S. real property holding corporation” if the fair market value of its “U.S. real property interests” equals or exceeds 50% of the sum of the fair market value of its worldwide real property interests plus its other assets used or held for use in a trade or business. Although there can be no assurance, we believe that we are not currently, and we do not anticipate becoming, a “U.S. real property holding corporation” for U.S. federal income tax purposes. No assurance can be provided that our common stock will be regularly traded on an established securities market for purposes of the rule described above. |
Information Reporting and Backup Withholding Tax
We must report annually to the IRS and to each non-U.S. holder the gross amount of the distributions on our common stock paid to such holder and the tax withheld, if any, with respect to such distributions. Non-U.S. holders may have to comply with specific certification procedures to establish that the holder is not a U.S. person (as defined in the Code) in order to avoid backup withholding at the applicable rate, currently 28%, with respect to dividends on our common stock. Generally, a holder will comply with such procedures if it provides a properly executed IRS Form W-8BEN (or other applicable Form W-8) or otherwise meets documentary evidence requirements for establishing that it is a non-U.S. holder, or otherwise establishes an exemption. Dividends paid to non-U.S. holders subject to withholding of U.S. federal income tax, as described above under “Dividends,” will generally be exempt U.S. backup withholding.
Information reporting and backup withholding generally will apply to the proceeds of a disposition of our common stock by a non-U.S. holder effected by or through the U.S. office of any broker, U.S. or foreign, unless the holder certifies its status as a non-U.S. holder and satisfies certain other requirements, or otherwise establishes an exemption. Generally, information reporting and backup
126
Table of Contents
withholding will not apply to a payment of disposition proceeds to a non-U.S. holder where the transaction is effected outside the United States through a non-U.S. office of a broker. However, for information reporting purposes, dispositions effected through a non-U.S. office of a broker with substantial U.S. ownership or operations generally will be treated in a manner similar to dispositions effected through a U.S. office of a broker. Non-U.S. holders should consult their own tax advisors regarding the application of the information reporting and backup withholding rules to them.
Copies of information returns may be made available to the tax authorities of the country in which the non-U.S. holder resides or is incorporated under the provisions of a specific treaty or agreement.
Backup withholding is not an additional tax. Any amounts withheld under the backup withholding rules from a payment to a non-U.S. holder can be refunded or credited against the non-U.S. holder’s U.S. federal income tax liability, if any, provided that an appropriate claim is timely filed with the IRS.
Recently-Enacted Legislation
Recently-enacted legislation generally imposes a U.S. federal withholding tax at a rate of 30% on dividends and the gross proceeds of a disposition of our common stock paid after December 31, 2012 to certain foreign entities (including foreign financial institutions and foreign intermediaries), unless such foreign entity satisfies various U.S. information reporting and due diligence requirements (generally relating to ownership by U.S. persons of interests in or accounts with the entity). Non-U.S. holders should consult their own tax advisors regarding the possible implications of this legislation on their investment in our common stock.
Federal Estate Tax
Common stock owned or treated as owned by an individual who is a non-U.S. holder (as specially defined for U.S. federal estate tax purposes) at the time of death will be included in the individual’s gross estate for U.S. federal estate tax purposes and, therefore, may be subject to U.S. federal estate tax, unless an applicable estate tax or other treaty provides otherwise.
The preceding discussion of material U.S. federal tax considerations is for general information only. It is not tax advice. Prospective investors should consult their own tax advisors regarding the particular U.S. federal, state, local and non-U.S. tax consequences of purchasing, holding and disposing of our common stock, including the consequences of any proposed changes in applicable laws.
127
Table of Contents
We and the underwriters named below have entered into an underwriting agreement with respect to the shares being offered. Subject to certain conditions, each underwriter has severally agreed to purchase, and we have agreed to sell to them, severally, the number of shares indicated in the following table. Goldman, Sachs & Co. and Deutsche Bank Securities Inc. are the representatives of the underwriters.
| Name |
Number of shares |
|||
| Goldman, Sachs & Co. |
||||
| Deutsche Bank Securities Inc. |
||||
| William Blair & Company, L.L.C. |
||||
| Oppenheimer & Co. Inc. |
||||
| Canaccord Genuity Inc. |
||||
| First Analysis Securities Corporation |
||||
|
|
|
|||
| Total |
5,500,000 | |||
|
|
|
|||
The underwriters are committed to take and pay for all of the shares being offered, if any are taken, other than the shares covered by the option described below unless and until this option is exercised.
If the underwriters sell more shares than the total number set forth in the table above, the underwriters have an option to buy up to an additional 825,000 shares from us. They may exercise that option for 30 days. If any shares are purchased pursuant to this option, the underwriters will severally purchase shares in approximately the same proportion as set forth in the table above.
The following table shows the per share and total underwriting discounts and commissions to be paid by us. These amounts are shown assuming both no exercise and full exercise of the underwriters’ option to purchase up to an additional 825,000 shares of our common stock.
Paid by the Company
| No Exercise |
Full Exercise |
|||||||||
|
|
|
|
|
|||||||
| Per Share |
$ | $ | ||||||||
| Total |
$ | $ | ||||||||
Shares sold by the underwriters to the public will initially be offered at the initial public offering price set forth on the cover of this prospectus. Any shares sold by the underwriters to securities dealers may be sold at a discount of up to $ per share from the initial public offering price. If all of the shares are not sold at the initial public offering price, the representatives may change the offering price and the other selling terms. The offering of the shares by the underwriters is subject to receipt and acceptance and subject to the underwriters’ right to reject any order in whole or in part.
We, our officers, directors, and holders of at least 99.9% of the company’s common stock, have agreed with the underwriters, subject to certain exceptions, not to dispose of or hedge any common stock of the company or securities convertible into or exchangeable for shares of common stock of the company that they hold during the period from the date of this prospectus continuing through the date 180 days after the date of this prospectus, except with the prior written consent of the representatives.
128
Table of Contents
See “Shares Eligible for Future Sale” for a discussion of certain transfer restrictions. The 180-day restricted period described in the preceding paragraph will be automatically extended if: (1) during the last 17 days of the 180-day restricted period we issue an earnings release or announce material news or a material event; or (2) prior to the expiration of the 180-day restricted period, we announce that we will release earnings results during the 15-day period following the last day of the 180-day period, in which case the restrictions described in the preceding paragraph will continue to apply until the expiration of the 18-day period beginning on the issuance of the earnings release or the announcement of the material news or material event.
Prior to the offering, there has been no public market for our shares. The initial public offering price will be negotiated among us and the representatives. Among the factors considered in determining the initial public offering price of the shares, in addition to prevailing market conditions, will be our historical performance, estimates of our business potential and earnings prospects, an assessment of our management and the consideration of the above factors in relation to market valuation of companies in related businesses.
Our common stock has been approved for listing on the New York Stock Exchange under the symbol “DWRE”.
In connection with the offering, the underwriters may purchase and sell shares of the common stock in the open market. These transactions may include short sales, stabilizing transactions and purchases to cover positions created by short sales. Short sales involve the sale by the underwriters of a greater number of shares than they are required to purchase in the offering. “Covered” short sales are sales made in an amount not greater than the underwriters’ option to purchase additional shares from us in the offering. The underwriters may close out any covered short position by either exercising their option to purchase additional shares or purchasing shares in the open market. In determining the source of shares to close out the covered short position, the underwriters will consider, among other things, the price of shares available for purchase in the open market as compared to the price at which they may purchase additional shares pursuant to the option granted to them. “Naked” short sales are any sales in excess of such option. The underwriters must close out any naked short position by purchasing shares in the open market. A naked short position is more likely to be created if the underwriters are concerned that there may be downward pressure on the price of the common stock in the open market after pricing that could adversely affect investors who purchase in the offering. Stabilizing transactions consist of various bids for or purchases of common stock made by the underwriters in the open market prior to the completion of the offering.
The underwriters may also impose a penalty bid. This occurs when a particular underwriter repays to the underwriters a portion of the underwriting discount received by it because the representatives have repurchased shares sold by or for the account of such underwriter in stabilizing or short covering transactions.
Purchases to cover a short position and stabilizing transactions, as well as other purchases by the underwriters for their own accounts, may have the effect of preventing or retarding a decline in the market price of our stock, and together with the imposition of the penalty bid, may stabilize, maintain or otherwise affect the market price of the common stock. As a result, the price of the common stock may be higher than the price that otherwise might exist in the open market. If these activities are commenced, they may be discontinued at any time. These transactions may be effected on the New York Stock Exchange, in the over-the-counter market or otherwise.
The underwriters do not expect sales to discretionary accounts to exceed five percent of the total number of shares offered.
We estimate that our share of the total expenses of the offering, excluding underwriting discounts and commissions, will be approximately $3.5 million.
129
Table of Contents
We have agreed to indemnify the several underwriters against certain liabilities, including liabilities under the Securities Act.
The underwriters and their respective affiliates are full service financial institutions engaged in various activities, which may include securities trading, commercial and investment banking, financial advisory, investment management, principal investment, hedging, financing and brokerage activities.
Certain of the underwriters and their respective affiliates have, from time to time, performed, and may in the future perform, various financial advisory and investment banking services for us, for which they received or will receive customary fees and expenses.
In the ordinary course of their various business activities, the underwriters and their respective affiliates may make or hold a broad array of investments and actively trade debt and equity securities (or related derivative securities) and financial instruments (including bank loans) for their own account and for the accounts of their customers and may at any time hold long and short positions in such securities and instruments. Such investment and securities activities may involve our securities and instruments.
Notice to Non-U.S. Investors
In relation to each Member State of the European Economic Area which has implemented the Prospectus Directive (each, a Relevant Member State), each underwriter has represented and agreed that with effect from and including the date on which the Prospectus Directive is implemented in that Relevant Member State (the Relevant Implementation Date) it has not made and will not make an offer of shares to the public in that Relevant Member State prior to the publication of a prospectus in relation to the shares which has been approved by the competent authority in that Relevant Member State or, where appropriate, approved in another Relevant Member State and notified to the competent authority in that Relevant Member State, all in accordance with the Prospectus Directive, except that it may, with effect from and including the Relevant Implementation Date, make an offer of shares to the public in that Relevant Member State at any time:
| (a) | to legal entities which are authorized or regulated to operate in the financial markets or, if not so authorized or regulated, whose corporate purpose is solely to invest in securities; |
| (b) | to any legal entity which has two or more of (1) an average of at least 250 employees during the last financial year; (2) a total balance sheet of more than € 43,000,000 and (3) an annual net turnover of more than € 50,000,000, as shown in its last annual or consolidated accounts; |
| (c) | to fewer than 100 natural or legal persons (other than qualified investors as defined in the Prospectus Directive) subject to obtaining the prior consent of the representatives for any such offer; or |
| (d) | in any other circumstances that do not require the publication by the Issuer of a prospectus pursuant to Article 3 of the Prospectus Directive. |
For the purposes of this provision, the expression an “offer of shares to the public” in relation to any shares in any Relevant Member State means the communication in any form and by any means of sufficient information on the terms of the offer and the shares to be offered so as to enable an investor to decide to purchase or subscribe the shares, as the same may be varied in that Relevant Member State by any measure implementing the Prospectus Directive in that Relevant Member State and the expression Prospectus Directive means Directive 2003/71/EC and includes any relevant implementing measure in each Relevant Member State.
130
Table of Contents
Each underwriter has represented and agreed that:
| (a) | it has only communicated or caused to be communicated and will only communicate or cause to be communicated an invitation or inducement to engage in investment activity (within the meaning of Section 21 of the FSMA) received by it in connection with the issue or sale of the shares in circumstances in which Section 21(1) of the FSMA does not apply to the Issuer; and |
| (b) | it has complied and will comply with all applicable provisions of the FSMA with respect to anything done by it in relation to the shares in, from or otherwise involving the United Kingdom. |
The shares may not be offered or sold by means of any document other than (i) in circumstances which do not constitute an offer to the public within the meaning of the Companies Ordinance (Cap. 32, Laws of Hong Kong), or (ii) to “professional investors” within the meaning of the Securities and Futures Ordinance (Cap.571, Laws of Hong Kong) and any rules made thereunder, or (iii) in other circumstances which do not result in the document being a “prospectus” within the meaning of the Companies Ordinance (Cap. 32, Laws of Hong Kong), and no advertisement, invitation or document relating to the shares may be issued or may be in the possession of any person for the purpose of issue (in each case, whether in Hong Kong or elsewhere), which is directed at, or the contents of which are likely to be accessed or read by, the public in Hong Kong (except if permitted to do so under the laws of Hong Kong) other than with respect to shares which are or are intended to be disposed of only to persons outside Hong Kong or only to “professional investors” within the meaning of the Securities and Futures Ordinance (Cap. 571, Laws of Hong Kong) and any rules made thereunder.
This prospectus has not been registered as a prospectus with the Monetary Authority of Singapore. Accordingly, this prospectus and any other document or material in connection with the offer or sale, or invitation for subscription or purchase, of the shares may not be circulated or distributed, nor may the shares be offered or sold, or be made the subject of an invitation for subscription or purchase, whether directly or indirectly, to persons in Singapore other than (i) to an institutional investor under Section 274 of the Securities and Futures Act, Chapter 289 of Singapore, or the SFA, (ii) to a relevant person, or any person pursuant to Section 275(1A), and in accordance with the conditions, specified in Section 275 of the SFA or (iii) otherwise pursuant to, and in accordance with the conditions of, any other applicable provision of the SFA.
Where the shares are subscribed or purchased under Section 275 by a relevant person which is: (a) a corporation (which is not an accredited investor) the sole business of which is to hold investments and the entire share capital of which is owned by one or more individuals, each of whom is an accredited investor; or (b) a trust (where the trustee is not an accredited investor) whose sole purpose is to hold investments and each beneficiary is an accredited investor, shares, debentures and units of shares and debentures of that corporation or the beneficiaries’ rights and interest in that trust shall not be transferable for 6 months after that corporation or that trust has acquired the shares under Section 275 except: (1) to an institutional investor under Section 274 of the SFA or to a relevant person, or any person pursuant to Section 275(1A), and in accordance with the conditions, specified in Section 275 of the SFA; (2) where no consideration is given for the transfer; or (3) by operation of law.
The securities have not been and will not be registered under the Securities and Exchange Law of Japan (the Securities and Exchange Law) and each underwriter has agreed that it will not offer or sell any securities, directly or indirectly, in Japan or to, or for the benefit of, any resident of Japan (which term as used herein means any person resident in Japan, including any corporation or other entity organized under the laws of Japan), or to others for re-offering or resale, directly or indirectly, in Japan or to a resident of Japan, except pursuant to an exemption from the registration requirements of, and otherwise in compliance with, the Securities and Exchange Law and any other applicable laws, regulations and ministerial guidelines of Japan.
131
Table of Contents
The validity of the shares of common stock offered hereby will be passed upon for us by Wilmer Cutler Pickering Hale and Dorr LLP. Goodwin Procter LLP has acted as counsel for the underwriters in connection with certain legal matters related to this offering.
The consolidated financial statements as of December 31, 2010 and 2011, and for each of the three years in the period ended December 31, 2011, included in this Prospectus have been audited by Deloitte & Touche LLP, an independent registered public accounting firm, as stated in their report appearing herein and elsewhere in the registration statement. Such financial statements have been so included in reliance upon the report of such firm given upon their authority as experts in accounting and auditing.
WHERE YOU CAN FIND MORE INFORMATION
We have filed with the SEC a registration statement on Form S-1 under the Securities Act with respect to the shares of common stock offered hereby. This prospectus, which constitutes a part of the registration statement, does not contain all of the information set forth in the registration statement or the exhibits and schedules filed therewith. For further information about us and the common stock offered hereby, we refer you to the registration statement and the exhibits and schedules filed thereto. We are required to file periodic reports, proxy statements and other information with the SEC pursuant to the Exchange Act. You may read and copy this information at the Public Reference Room of the SEC, 100 F Street, N.E., Room 1580, Washington, D.C. 20549 on official business days during the hours of 10:00 a.m. to 3:00 p.m. You may obtain information on the operation of the public reference rooms by calling the SEC at 1-800-SEC-0330. The SEC also maintains an internet website that contains reports, proxy statements and other information about registrants, like us, that file electronically with the SEC. The address of that site is www.sec.gov.
132
Table of Contents
INDEX TO CONSOLIDATED FINANCIAL STATEMENTS
| Page | ||
| F-2 | ||
| FINANCIAL STATEMENTS |
||
| F-3 | ||
| Consolidated Statements of Operations—For the Years Ended December 31, 2009, 2010 and 2011 |
F-4 | |
| F-5 | ||
| Consolidated Statements of Cash Flows—For the Years Ended December 31, 2009, 2010 and 2011 |
F-6 | |
| F-7 | ||
F-1
Table of Contents
REPORT OF INDEPENDENT REGISTERED PUBLIC ACCOUNTING FIRM
To the Board of Directors and Stockholders of
Demandware, Inc.
Burlington, Massachusetts
We have audited the accompanying consolidated balance sheets of Demandware, Inc. and subsidiaries (the “Company”) as of December 31, 2010 and 2011, and the related consolidated statements of operations, stockholders’ deficit, and cash flows for each of the three years in the period ended December 31, 2011. These financial statements are the responsibility of the Company’s management. Our responsibility is to express an opinion on these financial statements based on our audits.
We conducted our audits in accordance with the standards of the Public Company Accounting Oversight Board (United States). Those standards require that we plan and perform the audit to obtain reasonable assurance about whether the financial statements are free of material misstatement. The Company is not required to have, nor were we engaged to perform, an audit of its internal control over financial reporting. Our audits included consideration of internal control over financial reporting as a basis for designing audit procedures that are appropriate in the circumstances, but not for the purpose of expressing an opinion on the effectiveness of the Company’s internal control over financial reporting. Accordingly, we express no such opinion. An audit also includes examining, on a test basis, evidence supporting the amounts and disclosures in the financial statements, assessing the accounting principles used and significant estimates made by management, as well as evaluating the overall financial statement presentation. We believe that our audits provide a reasonable basis for our opinion.
In our opinion, such consolidated financial statements present fairly, in all material respects, the financial position of the Company as of December 31, 2010 and 2011, and the results of its operations and its cash flows for each of the three years in the period ended December 31, 2011, in conformity with accounting principles generally accepted in the United States of America.
| /s/ Deloitte & Touche LLP |
| Boston, Massachusetts February 15, 2012 (March 1, 2012 as to the effects of the stock split described in Note 2) |
F-2
Table of Contents
CONSOLIDATED BALANCE SHEETS
(in thousands, except per share data)
| December 31, 2010 |
Actual December 31, 2011 |
Pro Forma December 31, 2011 |
||||||||||
| (unaudited) | ||||||||||||
| ASSETS |
||||||||||||
| Current assets: |
||||||||||||
| Cash and cash equivalents |
$ | 17,148 | $ | 14,939 | ||||||||
| Restricted cash |
125 | — | ||||||||||
| Accounts receivable—net of allowance for doubtful accounts and credit memos of $64 and $117 at December 31, 2010 and 2011 |
11,575 | 16,930 | ||||||||||
| Prepaid expenses and other current assets |
1,451 | 1,878 | ||||||||||
|
|
|
|
|
|||||||||
| Total current assets |
30,299 | 33,747 | ||||||||||
| Property and equipment, net |
5,931 | 6,404 | ||||||||||
| Other assets |
798 | 2,735 | ||||||||||
|
|
|
|
|
|||||||||
| Total assets |
$ | 37,028 | $ | 42,886 | ||||||||
|
|
|
|
|
|||||||||
| LIABILITIES, REDEEMABLE CONVERTIBLE PREFERRED STOCK AND STOCKHOLDERS’ (DEFICIT) EQUITY |
||||||||||||
| Current liabilities: |
||||||||||||
| Current portion of notes payable |
$ | 1,432 | $ | 2,098 | ||||||||
| Accounts payable |
1,963 | 1,884 | ||||||||||
| Accrued expenses |
3,837 | 7,023 | ||||||||||
| Deferred revenue |
15,418 | 13,960 | ||||||||||
| Deferred rent |
133 | 57 | ||||||||||
|
|
|
|
|
|||||||||
| Total current liabilities |
22,783 | 25,022 | ||||||||||
|
|
|
|
|
|||||||||
| Long-term liabilities: |
||||||||||||
| Deferred revenue |
10,851 | 12,210 | ||||||||||
| Notes payable |
1,821 | 1,882 | ||||||||||
| Deferred rent |
300 | 682 | ||||||||||
| Preferred stock warrant liability |
58 | 107 | ||||||||||
|
|
|
|
|
|||||||||
| Total liabilities |
35,813 | 39,903 | ||||||||||
|
|
|
|
|
|||||||||
| Commitments and contingencies (Note 6) |
||||||||||||
| Redeemable convertible preferred stock, $0.01 par value—authorized, 54,207 shares: |
||||||||||||
| Series A: designated, 9,564 shares; issued and outstanding, 9,513 shares at December 31, 2010 and 2011, 0 shares issued and outstanding, pro forma (liquidation value of $14,994 at December 31, 2011) |
14,207 | 14,976 | $ | — | ||||||||
| Series B: designated, 11,166 shares; issued and outstanding, 11,166 shares at December 31, 2010 and 2011, 0 shares issued and outstanding, pro forma (liquidation value of $18,172 at December 31, 2011) |
17,168 | 18,158 | — | |||||||||
| Series C: designated, 16,234 shares; issued and outstanding, 16,165 shares at December 31, 2010 and 2011, 0 shares issued and outstanding, pro forma (liquidation value of $27,901 at December 31, 2011) |
26,196 | 27,884 | — | |||||||||
| Series D: designated, 17,242 shares; issued and outstanding, 17,242 shares at December 31, 2010 and 2011, respectively, 0 shares issued and outstanding, pro forma (liquidation value of $26,667 at December 31, 2011) |
24,758 | 26,585 | — | |||||||||
|
|
|
|
|
|
|
|||||||
| Total redeemable convertible preferred stock |
82,329 | 87,603 | — | |||||||||
|
|
|
|
|
|
|
|||||||
| Stockholders’ (deficit) equity: |
||||||||||||
| Common stock, $0.01 par value—authorized, 27,333 shares; issued and outstanding, 2,938 and 4,469 shares at December 31, 2010 and 2011, 22,498 shares issued and outstanding, pro forma |
29 | 45 | 225 | |||||||||
| Additional paid in capital |
— | — | 87,423 | |||||||||
| Note receivable from stockholder |
(74 | ) | — | — | ||||||||
| Accumulated other comprehensive loss |
(24 | ) | (53 | ) | (53 | ) | ||||||
| Accumulated deficit |
(81,045 | ) | (84,612 | ) | (84,612 | ) | ||||||
|
|
|
|
|
|
|
|||||||
| Total stockholders’ (deficit) equity |
(81,114 | ) | (84,620 | ) | 2,983 | |||||||
|
|
|
|
|
|
|
|||||||
| Total liabilities, redeemable convertible preferred stock and stockholders’ (deficit) equity |
$ | 37,028 | $ | 42,886 | $ | 42,886 | ||||||
|
|
|
|
|
|
|
|||||||
The accompanying notes are an integral part of these consolidated financial statements.
F-3
Table of Contents
CONSOLIDATED STATEMENT OF OPERATIONS
(in thousands, except per share data)
| Year Ended December 31, | ||||||||||||
| 2009 | 2010 | 2011 | ||||||||||
| Revenue: |
||||||||||||
| Subscription |
$ | 16,085 | $ | 28,714 | $ | 47,219 | ||||||
| Services |
5,312 | 7,976 | 9,328 | |||||||||
|
|
|
|
|
|
|
|||||||
| Total revenue |
21,397 | 36,690 | 56,547 | |||||||||
| Cost of revenue: |
||||||||||||
| Subscription |
3,964 | 6,222 | 9,511 | |||||||||
| Services |
11,533 | 8,282 | 10,196 | |||||||||
|
|
|
|
|
|
|
|||||||
| Total cost of revenue |
15,497 | 14,504 | 19,707 | |||||||||
|
|
|
|
|
|
|
|||||||
| Gross profit |
5,900 | 22,186 | 36,840 | |||||||||
| Operating expenses: |
||||||||||||
| Sales and marketing |
7,304 | 10,883 | 19,847 | |||||||||
| Research and development |
4,950 | 6,091 | 11,182 | |||||||||
| General and administrative |
3,729 | 4,179 | 6,567 | |||||||||
|
|
|
|
|
|
|
|||||||
| Total operating expenses |
15,983 | 21,153 | 37,596 | |||||||||
|
|
|
|
|
|
|
|||||||
| (Loss) income from operations |
(10,083 | ) | 1,033 | (756 | ) | |||||||
| Other (expense) income: |
||||||||||||
| Interest income |
13 | 18 | 8 | |||||||||
| Interest expense |
(127 | ) | (144 | ) | (280 | ) | ||||||
| Other (expense) income |
(125 | ) | (456 | ) | (171 | ) | ||||||
|
|
|
|
|
|
|
|||||||
| Other (expense) income, net |
(239 | ) | (582 | ) | (443 | ) | ||||||
|
|
|
|
|
|
|
|||||||
| (Loss) income before income taxes |
(10,322 | ) | 451 | (1,199 | ) | |||||||
| Income tax expense |
55 | 142 | 212 | |||||||||
|
|
|
|
|
|
|
|||||||
| Net (loss) income |
(10,377 | ) | 309 | (1,411 | ) | |||||||
| Accretion of redeemable preferred stock |
(4,322 | ) | (5,106 | ) | (5,274 | ) | ||||||
|
|
|
|
|
|
|
|||||||
| Net loss attributable to common stockholders |
$ | (14,699 | ) | $ | (4,797 | ) | $ | (6,685 | ) | |||
|
|
|
|
|
|
|
|||||||
| Net loss per share attributable to common stockholders |
||||||||||||
| Basic and diluted |
$ | (7.83 | ) | $ | (2.44 | ) | $ | (1.75 | ) | |||
|
|
|
|
|
|
|
|||||||
| Weighted average common shares outstanding, |
||||||||||||
| basic and diluted |
1,878 | 1,967 | 3,823 | |||||||||
|
|
|
|
|
|
|
|||||||
| Pro forma net loss per share attributable to common stockholders, basic and diluted |
$ | (0.06 | ) | |||||||||
|
|
|
|||||||||||
| Pro forma weighted average common shares outstanding, basic and diluted |
21,851 | |||||||||||
|
|
|
|||||||||||
The accompanying notes are an integral part of these consolidated financial statements.
F-4
Table of Contents
CONSOLIDATED STATEMENTS OF STOCKHOLDERS’ DEFICIT
(in thousands)
| Common Stock $0.01 par value |
Additional Paid-In Capital |
Note Receivable From Stockholder |
Accumulated Comprehensive (Loss) Income |
Accumulated Deficit |
Total Stockholders’ Deficit |
Comprehensive (Loss) Income |
||||||||||||||||||||||||||
| Shares | Amount | |||||||||||||||||||||||||||||||
| BALANCE—December 31, 2008 |
1,851 | 19 | — | (70 | ) | 44 | (64,138 | ) | (64,145 | ) | ||||||||||||||||||||||
| Stock-based compensation |
514 | 514 | ||||||||||||||||||||||||||||||
| Interest accrued on note receivable |
(2 | ) | (2 | ) | ||||||||||||||||||||||||||||
| Exercise of common stock options |
46 | — | 40 | 40 | ||||||||||||||||||||||||||||
| Accretion of preferred stock to redemption value |
(554 | ) | (3,768 | ) | (4,322 | ) | ||||||||||||||||||||||||||
| Foreign currency translation adjustments |
(52 | ) | (52 | ) | $ | (52 | ) | |||||||||||||||||||||||||
| Net loss |
(10,377 | ) | (10,377 | ) | (10,377 | ) | ||||||||||||||||||||||||||
|
|
|
|||||||||||||||||||||||||||||||
| Total comprehensive loss |
$ | (10,429 | ) | |||||||||||||||||||||||||||||
|
|
|
|
|
|
|
|
|
|
|
|
|
|
|
|
|
|||||||||||||||||
| BALANCE—December 31, 2009 |
1,897 | 19 | — | (72 | ) | (8 | ) | (78,283 | ) | (78,344 | ) | |||||||||||||||||||||
| Stock-based compensation |
1,046 | 1,046 | ||||||||||||||||||||||||||||||
| Interest accrued on note receivable |
(2 | ) | (2 | ) | ||||||||||||||||||||||||||||
| Exercise of common stock options |
1,041 | 10 | 989 | 999 | ||||||||||||||||||||||||||||
| Accretion of preferred stock to redemption value |
(2,035 | ) | (3,071 | ) | (5,106 | ) | ||||||||||||||||||||||||||
| Foreign currency translation adjustments |
(16 | ) | (16 | ) | $ | (16 | ) | |||||||||||||||||||||||||
| Net income |
309 | 309 | 309 | |||||||||||||||||||||||||||||
|
|
|
|||||||||||||||||||||||||||||||
| Total comprehensive income |
$ | 293 | ||||||||||||||||||||||||||||||
|
|
|
|
|
|
|
|
|
|
|
|
|
|
|
|
|
|||||||||||||||||
| BALANCE—December 31, 2010 |
2,938 | 29 | — | (74 | ) | (24 | ) | (81,045 | ) | (81,114 | ) | |||||||||||||||||||||
| Stock-based compensation |
1,489 | 1,489 | ||||||||||||||||||||||||||||||
| Forgiveness of note receivable |
74 | 74 | ||||||||||||||||||||||||||||||
| Exercise of common stock options |
1,531 | 16 | 1,629 | 1,645 | ||||||||||||||||||||||||||||
| Accretion of preferred stock to redemption value |
(3,118 | ) | (2,156 | ) | (5,274 | ) | ||||||||||||||||||||||||||
| Foreign currency translation adjustments |
(29 | ) | (29 | ) | $ | (29 | ) | |||||||||||||||||||||||||
| Net loss |
(1,411 | ) | (1,411 | ) | (1,411 | ) | ||||||||||||||||||||||||||
|
|
|
|||||||||||||||||||||||||||||||
| Total comprehensive loss |
(1,440 | ) | ||||||||||||||||||||||||||||||
|
|
|
|
|
|
|
|
|
|
|
|
|
|
|
|
|
|||||||||||||||||
| BALANCE—December 31, 2011 |
4,469 | $ | 45 | $ | — | $ | — | $ | (53 | ) | $ | (84,612 | ) | $ | (84,620 | ) | ||||||||||||||||
|
|
|
|
|
|
|
|
|
|
|
|
|
|
|
|||||||||||||||||||
The accompanying notes are an integral part of these consolidated financial statements.
F-5
Table of Contents
CONSOLIDATED STATEMENT OF CASH FLOWS
(in thousands)
| Year Ended December 31, | ||||||||||||
| 2009 | 2010 | 2011 | ||||||||||
| CASH FLOWS FROM OPERATING ACTIVITIES: |
||||||||||||
| Net (loss) income |
$ | (10,377 | ) | $ | 309 | $ | (1,411 | ) | ||||
| Adjustments to reconcile net (loss) income to net cash (used in) provided by operating activities: |
||||||||||||
| Depreciation and amortization |
1,364 | 1,734 | 2,884 | |||||||||
| Loss (gain) on disposal of property and equipment |
— | 1 | 80 | |||||||||
| Bad debt expense |
40 | — | — | |||||||||
| Provision for credit memos |
— | 64 | 147 | |||||||||
| Stock-based compensation |
514 | 1,046 | 1,489 | |||||||||
| Deferred rent expense |
(148 | ) | 138 | 306 | ||||||||
| Other non-cash reconciling items |
91 | (12 | ) | 154 | ||||||||
| Changes in operating assets and liabilities: |
||||||||||||
| Accounts receivable |
(3,284 | ) | (2,303 | ) | (5,502 | ) | ||||||
| Prepaid expenses and other current assets |
(373 | ) | (1,359 | ) | (442 | ) | ||||||
| Accounts payable |
(1,706 | ) | 752 | (108 | ) | |||||||
| Accrued expenses |
(1,373 | ) | 837 | 3,213 | ||||||||
| Deferred revenue |
8,222 | 3,577 | (99 | ) | ||||||||
|
|
|
|
|
|
|
|||||||
| Net cash (used in) provided by operating activities |
(7,030 | ) | 4,784 | 711 | ||||||||
|
|
|
|
|
|
|
|||||||
| CASH FLOWS FROM INVESTING ACTIVITIES: |
||||||||||||
| Purchase of property and equipment |
(1,436 | ) | (4,877 | ) | (3,473 | ) | ||||||
| Proceeds from sale of property and equipment |
— | — | 25 | |||||||||
| (Decrease) increase in restricted cash and other assets |
(188 | ) | (286 | ) | 87 | |||||||
| Loan receivable from Chinese Entity |
— | — | (150 | ) | ||||||||
|
|
|
|
|
|
|
|||||||
| Net cash used in investing activities |
(1,624 | ) | (5,163 | ) | (3,511 | ) | ||||||
|
|
|
|
|
|
|
|||||||
| CASH FLOWS FROM FINANCING ACTIVITIES: |
||||||||||||
| Net proceeds from the issuance of preferred stock |
10,000 | 7,379 | — | |||||||||
| Proceeds from issuance of promissory demand notes payable |
3,250 | — | — | |||||||||
| Proceeds from exercise of stock options |
40 | 999 | 1,645 | |||||||||
| Deferred offering costs |
— | — | (1,674 | ) | ||||||||
| Proceeds from issuance of notes payable |
1,383 | 2,859 | 2,570 | |||||||||
| Payments of notes payable |
(198 | ) | (860 | ) | (1,884 | ) | ||||||
|
|
|
|
|
|
|
|||||||
| Net cash provided by financing activities |
14,475 | 10,377 | 657 | |||||||||
|
|
|
|
|
|
|
|||||||
| EFFECT OF EXCHANGE RATES ON CASH AND CASH EQUIVALENTS |
(38 | ) | (31 | ) | (66 | ) | ||||||
|
|
|
|
|
|
|
|||||||
| INCREASE (DECREASE) IN CASH AND CASH EQUIVALENTS |
5,783 | 9,967 | (2,209 | ) | ||||||||
| CASH AND CASH EQUIVALENTS—Beginning of year |
1,398 | 7,181 | 17,148 | |||||||||
|
|
|
|
|
|
|
|||||||
| CASH AND CASH EQUIVALENTS—End of year |
$ | 7,181 | $ | 17,148 | $ | 14,939 | ||||||
|
|
|
|
|
|
|
|||||||
| SUPPLEMENTARY INFORMATION: |
||||||||||||
| Interest paid |
$ | 122 | $ | 14 | $ | 250 | ||||||
|
|
|
|
|
|
|
|||||||
| Income taxes paid |
$ | 26 | $ | 72 | $ | 203 | ||||||
|
|
|
|
|
|
|
|||||||
| NONCASH INVESTING AND FINANCING ACTIVITIES—Extinguishment of promissory demand notes and accrued interest to purchase to Series D redeemable convertible preferred stock |
$ | 4,847 | $ | — | $ | — | ||||||
|
|
|
|
|
|
|
|||||||
| Deferred offering costs included in accounts payable and accrued expenses |
$ | — | $ | — | $ | 44 | ||||||
|
|
|
|
|
|
|
|||||||
The accompanying notes are an integral part of these consolidated financial statements.
F-6
Table of Contents
NOTES TO CONSOLIDATED FINANCIAL STATEMENTS
| 1. | NATURE OF BUSINESS AND OPERATIONS |
Demandware, Inc. (the “Company”) provides software-as-a-service e-commerce solutions that enable companies to easily design, implement and manage their own customized e-commerce sites, including websites, mobile applications and other digital storefronts. The Company’s customers use its highly scalable and integrated Demandware Commerce platform to create a seamless brand experience for consumers across all digital touch points worldwide.
The Company sells subscriptions to its on-demand software and related services through both a direct sales force and indirect channels. The Company’s current customers consist of retailers and branded consumer product manufacturers that operate principally in the following vertical markets: apparel, health and beauty, home and garden, sporting goods and general merchandise.
The Company derives most of its revenue from subscriptions to its on-demand platform and related services. Subscription fees are based on a variable revenue share pricing model, whereby the Company’s customers pay a percentage of their total gross revenue that is processed on the Company’s platform. As part of their subscription fee, the Company’s customers commit to a minimum level of gross revenue to be processed on the Company’s platform, from which a minimum monthly, quarterly or annual non-refundable subscription fee is derived. If a customer processes more gross revenue than their committed minimum level, then the customer is required to pay the Company additional fees, called overage fees, which are calculated as a percentage of the incremental revenue generated above the committed revenue. No refunds or credits are given if a customer processes less gross revenue than the contracted level. Customer contracts are generally non-cancellable for a minimum period that is typically three years.
The Company’s headquarters are located in Burlington, Massachusetts. The Company was incorporated in Delaware on February 18, 2004. At December 31, 2011 the Company had five wholly owned subsidiaries, Demandware Security Corporation, Demandware GmbH, Demandware UK Limited, Demandware SARL and Demandware Hong Kong Limited.
| 2. | SUMMARY OF SIGNIFICANT ACCOUNTING POLICIES |
Unaudited Pro Forma Information—The unaudited pro forma balance sheet as of December 31, 2011 reflects the conversion of all outstanding shares of the Company’s redeemable convertible preferred stock into an aggregate of 18,028,763 shares of common stock on a 1:1 basis which will occur upon the completion of the proposed initial public offering.
Basis of Presentation and Consolidation—The consolidated financial statements include the accounts of the Company and its wholly owned subsidiaries. All intercompany transactions have been eliminated in consolidation.
Use of Estimates—The preparation of consolidated financial statements in conformity with accounting principles generally accepted in the United States of America (GAAP) requires management to make estimates and assumptions that affect the reported amounts of assets and liabilities and disclosure of contingent assets and liabilities at the date of the financial statements and the reported amounts of revenue, cost of revenue, and expenses during the reporting period. Actual results could differ from those estimates.
On an on-going basis, management evaluates its estimates, including those related to: (1) the realization of tax assets and estimates of tax liabilities, (2) the valuation of preferred stock warrants, (3) the recognition and disclosure of contingent liabilities, (4) the collectability of accounts receivable,
F-7
Table of Contents
(5) the evaluation of revenue recognition criteria, including the determination of standalone value and customer life and (6) assumptions used in the Black-Scholes option pricing model to determine the fair value of stock options, including the fair value of the common stock. These estimates are based on historical data and experience, as well as various other factors that management believes to be reasonable under the circumstances, the results of which form the basis for making judgments about the carrying value of assets and liabilities that are not readily apparent from other sources. The Company has engaged, and may in the future, engage third-party valuation specialists to assist with estimates related to the valuation of its common stock. Such estimates often require the selection of appropriate valuation methodologies and models, and significant judgment in evaluating ranges of assumptions and financial inputs. Actual results may differ from those estimates under different assumptions or circumstances.
Foreign Currency Translation—The functional currency of the Company’s foreign subsidiaries is the local currency. All assets and liabilities denominated in a foreign currency are translated into U.S. dollars at the exchange rate on the balance sheet date. Revenue and expenses are translated at the average exchange rate during the period. Equity transactions are translated using historical exchange rates. Translation gains or losses are included as a component of accumulated other comprehensive income (loss) in stockholders’ equity (deficit). Transaction gains or losses that arise from exchange rate fluctuations on transactions denominated in a currency other than the functional currency are included in other income (expenses) in the accompanying consolidated results of operations as incurred. For the years ended December 31, 2009, 2010 and 2011, foreign currency transaction (losses) of ($0.1) million, ($0.5) million, and ($0.1) million, respectively, are included in other expenses in the accompanying consolidated statements of operations.
Cash Equivalents—Cash equivalents include highly liquid investments maturing within 90 days from the date of purchase. Cash equivalents consist of money market funds.
Restricted Cash—Included in long-term other assets at December 31, 2010 and 2011 is restricted cash of $0.5 million for an irrevocable standby letter of credit. In accordance with the Company’s Burlington, MA office lease agreement, the Company has secured a letter of credit naming the lessor as the beneficiary. The letter of credit is required to fulfill lease requirements in the event the Company should default on its office lease obligation. The letter of credit expires December 31, 2012, but may be extended through July 31, 2017 at the option of the landlord.
At December 31, 2010, the Company had $0.1 million of restricted cash related to a certificate of deposit to secure a letter of credit for its Woburn, Massachusetts facility lease. The certificate of deposit was released from restriction in 2011 when the lease expired, and the $0.1 million certificate of deposit is included in other current assets at December 31, 2011.
Fair Value of Financial Instruments—Financial instruments, including cash equivalents, restricted cash, accounts receivable, accounts payable, and accrued expenses are carried in the consolidated financial statements at amounts that approximate fair value at December 31, 2010 and 2011. Fair values are based on market prices and assumptions concerning the amount and timing of estimated future cash flows and assumed discount rates, reflecting varying degrees of perceived risk. Management believes that the Company’s debt obligations bear interest at rates which approximate prevailing market rates for instruments with similar characteristics and, accordingly, the carrying values for these instruments approximate fair value.
Accounts Receivable—Accounts receivable represent trade receivables from customers when the Company has invoiced for software subscriptions and/or services and it has not yet received payment. The Company presents accounts receivable net of an allowance for doubtful accounts and an allowance for credit memos. The allowance for doubtful accounts and credit memos is the
F-8
Table of Contents
Company’s best estimate of the amount of probable credit losses and returns in the Company’s existing accounts receivable. The Company determines the allowance for doubtful accounts based on analysis of historical bad debts, customer concentrations, customer credit-worthiness, credit history and current economic trends. The allowance for credit memos is determined based on an analysis of historical credit memos issued and current economic trends, and is recorded as a reduction of revenue. The Company reviews its allowances for doubtful accounts and credit memos quarterly. Past due balances over 90 days and specified other balances are reviewed individually for collectability. All other balances are reviewed on an aggregate basis. Account balances are written off against the allowance after all means of collection have been exhausted and the potential for recovery is considered remote. Significant judgments and estimates are made and used in connection with establishing allowances for doubtful accounts and credit memos in any accounting period. Material differences in the amount and timing of the Company’s revenue for any period may result if actual results differ from these judgments and estimates. No significant differences from estimates have been experienced.
Activity within the allowance for doubtful accounts is as follows, (in thousands):
| Years Ended December 31, | ||||||||||||
| 2009 | 2010 | 2011 | ||||||||||
| Balance at beginning of year |
$ | 41 | $ | 5 | $ | — | ||||||
| Charges |
40 | — | — | |||||||||
| Writeoffs |
(76 | ) | (5 | ) | — | |||||||
|
|
|
|
|
|
|
|||||||
| Balance at end of year |
$ | 5 | $ | — | $ | — | ||||||
|
|
|
|
|
|
|
|||||||
Activity within the allowance for credit memos is as follows, (in thousands):
| Years Ended December 31, | ||||||||||||
| 2009 | 2010 | 2011 | ||||||||||
| Balance at beginning of year |
$ | — | $ | — | $ | 64 | ||||||
| Charges to revenue |
— | 64 | 147 | |||||||||
| Amounts written off |
— | — | (94 | ) | ||||||||
|
|
|
|
|
|
|
|||||||
| Balance at end of year |
$ | — | $ | 64 | $ | 117 | ||||||
|
|
|
|
|
|
|
|||||||
Concentrations of Credit Risk and Significant Customers—Financial instruments that potentially expose the Company to concentrations of credit risk include cash, cash equivalents, restricted cash, and accounts receivable. The Company maintains substantially all of its cash, cash equivalents, and restricted cash with one financial institution, which management believes has a high credit standing. To manage credit risk related to accounts receivable, the Company evaluates the allowances for potential credit losses. To date, losses resulting from uncollected receivables have not exceeded management’s expectations.
As of December 31, 2010, the Company had two customers representing 15% and 14% of accounts receivable. As of December 31, 2011, the Company had two customers representing 12% and 10% of accounts receivable. During the years ended December 31, 2009 and 2010, and 2011, one customer represented 28%, 21% and 16%, respectively, of total revenue.
F-9
Table of Contents
Property and Equipment—Property and equipment are recorded at cost and depreciated using the straight-line method over the estimated useful lives of the related assets, which ranges from three to five years. Leasehold improvements are amortized over the lesser of the term of the lease or the useful life of the asset. When assets are retired or disposed of, the assets and related accumulated depreciation are eliminated from the accounts and any resulting gain or loss is included in the determination of net income or loss. Maintenance and repair expenditures are charged to expense as incurred.
Research and Development and Internal Use Software—Research and development expenses consist primarily of personnel and related expenses for the Company’s research and development staff, including salaries, benefits, bonuses and stock-based compensation; the cost of certain third-party contractor costs; and allocated overhead. Expenditures for research and development, other than internal use software costs, are expensed as incurred.
Software development costs associated with internal use software are capitalized when the preliminary project stage is completed, management has decided to make the project a part of its future offering, and the software will be used to perform the function intended. These capitalized costs include external direct costs of services consumed in developing or obtaining internal-use software, personnel and related expenses for employees who are directly associated with and who devote time to internal-use software projects. Capitalization of these costs cease once the project is substantially complete and the software is ready for its intended purpose. Post-configuration training and maintenance costs are expensed as incurred. Capitalized internal use software costs are amortized to cost of revenue using a straight-line method over its estimated useful life of four years, commencing when the software is ready for its intended use.
During 2009, there were no internal software development costs capitalized. During the years ended December 31, 2010 and 2011, $0.2 million and $0.4 million, respectively, of internal use software development costs were capitalized. Capitalized internal use software is included in property and equipment.
Amortization expense related to internal use software totaled $42,000, $0 and $0 during the years ended December 31, 2009, 2010 and 2011, respectively. The net book value of capitalized internal use software at December 31, 2010 and 2011 was $0.2 and $0.6 million, respectively.
Deferred Offering Costs—To date, the Company has incurred approximately $1.7 million in costs related to its proposed initial public offering. These costs have been deferred and will be recorded as an offset to the anticipated proceeds from the offering at the time of closing. Deferred offering costs are included in Other Assets in the accompanying balance sheet.
Segment and Geographic Information—Operating segments are defined as components of an enterprise (business activity from which it earns revenue and incurs expenses) about which discrete financial information is available that is evaluated on a regular basis by the chief operating decision maker, or decision making group, in deciding how to allocate resources and assess performance. The Company’s chief operating decision maker is the Chief Executive Officer. The Company’s chief decision maker reviews consolidated operating results to make decisions about allocating resources and assessing performance for the entire Company. The Company views its operations and manages its business as one operating segment.
F-10
Table of Contents
Information about the Company’s operations in different geographic regions is presented in the tables below (in thousands):
| Year Ended December 31, | ||||||||||||
| 2009 | 2010 | 2011 | ||||||||||
| Revenue: |
||||||||||||
| United States |
$ | 9,445 | $ | 17,869 | $ | 28,445 | ||||||
| Germany |
8,582 | 13,827 | 19,120 | |||||||||
| United Kingdom |
3,364 | 4,154 | 5,582 | |||||||||
| All other international |
6 | 840 | 3,400 | |||||||||
|
|
|
|
|
|
|
|||||||
| Total revenue |
$ | 21,397 | $ | 36,690 | $ | 56,547 | ||||||
|
|
|
|
|
|
|
|||||||
| Long-lived assets (at year end): |
||||||||||||
| United States |
5,884 | 6,230 | ||||||||||
| Germany |
47 | 174 | ||||||||||
|
|
|
|
|
|||||||||
| Total long-lived assets |
$ | 5,931 | $ | 6,404 | ||||||||
|
|
|
|
|
|||||||||
Revenue Recognition—The Company generates revenue from sales of e-commerce solutions via designated websites using the Company’s proprietary technology, which are represented by subscription and support fees and related services, which include application configuration, integration and training.
The Company recognizes revenue when persuasive evidence of an arrangement exists, delivery to customers has occurred or services have been rendered, the fee is fixed or determinable, and collectability is reasonably assured. The Company does not recognize revenue in excess of the amounts for which it has the right to invoice in an annual subscription year.
On January 1, 2011, the Company adopted on a prospective basis, Accounting Standards Update 2009-13 ‘‘Revenue Recognition (Topic 605) — Multiple-Deliverable Revenue Arrangements — a Consensus of the Emerging Issues Task Force,’’ (“ASU 2009-13”) (formerly known as EITF 08-1, ‘‘Revenue Arrangements with Multiple Deliverables’’), which amended the accounting guidance for multiple-deliverable revenue arrangements to:
| Ÿ | provide updated guidance on whether multiple deliverables exist, how the deliverables in an arrangement should be separated, and how the consideration should be allocated; |
| Ÿ | require an entity to allocate revenue in an arrangement using estimated selling prices (“ESP”) of each deliverable if a vendor does not have vendor-specific objective evidence of selling price (“VSOE”) or third-party evidence of selling price (“TPE”); and |
| Ÿ | eliminate the use of the residual method and require a vendor to allocate revenue using the relative selling price method. |
Subscription revenue primarily consists of subscription fees derived from contractually committed minimum levels of gross revenue processed by customers on the Company’s on-demand e-commerce platform, and fees derived from customers’ gross revenue processed above the minimum contracted levels. Customers do not have the contractual right to take possession of the Company’s on-demand software. Accordingly, the Company recognizes the aggregate minimum subscription fee on a straight-line basis over the subscription term, provided that an enforceable contract has been signed by both parties, access to the Company’s software has been granted to the customer, the fee for the subscription is fixed or determinable and collection is reasonably assured. Should a customer exceed the specified minimum levels of gross revenue processed, fees for customer gross revenue processed in excess of the committed minimum level are billed for the excess volume. The Company recognizes revenue in respect of the fees it receives for its customers’ gross revenue processed in excess of the committed minimum level in the period in which such gross revenue is processed and earned. The
F-11
Table of Contents
Company also derives revenue from setup fees. The setup fees are recorded as deferred revenue and recognized revenue ratably over the longer of the subscription agreement or the estimated expected life of the customer relationship, which generally ranges from three to six years.
Service arrangements entered into prior to the customer’s initial use of the Company’s on-demand e-commerce solutions include implementation services such as integration, application configuration and training. Such services can be performed by the Company, third-party service providers, distributors or customers themselves without the Company’s involvement. However, because such services are generally delivered prior to the customer being able to use the Company’s platform, the Company has concluded that such fees do not have stand-alone value, and the Company recognizes them on a straight-line basis over the longer of the life of the subscription agreement or the estimated expected life of the customer relationship, which generally ranges from three to six years. The Company continues to evaluate the length of the amortization period as it gains more experience with customer renewals, and it is possible that, in the future, the estimated expected customer life might change and, if so, the period of amortization will be adjusted.
Service arrangements entered into subsequent to the customer’s initial use of the Company’s on-demand e-commerce solutions include assistance with additional instances of the integration, application configuration and training. Such services can be performed by the Company, third-party service providers, distributors or customers themselves without the Company’s involvement and are not necessary for the customer to access and use the Company’s on-demand e-commerce solutions, and as a result, the Company has concluded that such fees have stand-alone value. For years ended December 31, 2010 and prior, the Company concluded for its bundled arrangements that VSOE or TPE did not exist for the minimum subscription fees earned for the use of the Company’s on-demand e-commerce platform and such fees were considered to be an undelivered element in accordance with FASB ASC 605-25-25, Revenue Recognition—Multiple Element Arrangements. In addition, VSOE or TPE of the value of the post-launch services did not exist and, as a result, the Company recognized these services ratably over the remaining subscription contract period. Effective January 1, 2011, the Company adopted ASU 2009-13 for new multiple element arrangements. Because of the lack of VSOE and similarity with other vendors’ products and pricing, the Company uses ESP to determine the allocation of revenue for bundled arrangements. Beginning on January 1, 2011, the Company recognized revenue from these service arrangements as the services were performed using a proportional performance model, which for the year ended December 31, 2011 increased revenue by $1.4 million over what would have been recognized under the prior guidance.
For multiple-deliverable revenue arrangements, the Company first assesses whether each deliverable has value to the customer on a standalone basis. The Company has determined that the e-commerce solution has standalone value, because, once a customer launches its initial e-commerce site, the solution is fully functional and does not require any additional development, modification or customization.
Based on the standalone value of the deliverables, the Company allocates revenue among the separate deliverables in an arrangement under the relative selling price method using the selling price hierarchy established in ASU 2009-13.
The Company is not able to determine VSOE or TPE for its deliverables because management has determined that there are no third-party offerings reasonably comparable to the Company’s solution. Accordingly, the selling prices of subscriptions to the solution and services are based on ESP. The determination of ESP requires the Company to make significant estimates and judgments. The Company considers numerous factors, including the size and nature of the deliverables themselves; the geography, market conditions and competitive landscape for the sale; internal costs; and pricing and discounting practices. The determination of ESP is made through consultation with and formal
F-12
Table of Contents
approval by senior management. The Company updates its estimates of ESP on an ongoing basis as events and as circumstances may require.
After the fair value of revenue allocable to each deliverable in a multiple deliverable arrangement based on the relative selling price method is determined, revenue is recognized for each deliverable based on the type of deliverable. For subscriptions to the Company’s e-commerce platform, revenue is recognized on a straight-line basis over the subscription term, which is typically three years. For services entered into subsequent to the customer’s initial implementation of the Company’s e-commerce solutions, revenue is recognized using the proportional performance method over the period the services are performed.
Reimbursable costs received for out-of-pocket expenses are recorded as revenue and cost of revenue in the consolidated statements of operations. Sales taxes collected from customers and remitted to government authorities are excluded from revenue.
Deferred revenue represents amounts billed to customers for which revenue has not been recognized. Deferred revenue consists of the unearned portion of services fees or the unearned portion of fees from subscriptions to the Company’s on-demand e-commerce solutions.
Cost of Revenue—Cost of subscription revenue primarily consists of hosting costs, data communications expenses, depreciation expenses associated with computer equipment, personnel and related costs, including salaries, bonuses, payroll taxes, recruiting fees and stock compensation, software license fees and amortization expenses associated with capitalized software. In addition, the Company allocates a portion of overhead, such as rent, IT costs, depreciation and amortization and employee benefits costs, to cost of revenue based on headcount. To date, the expenses associated with capitalized software have not been material to the Company’s cost of subscription revenue.
Cost of services revenue primarily consists of personnel and related costs, third-party contractors and allocated overhead. The Company’s cost of services revenue is expensed as the costs are incurred.
Net Loss Per Share Attributable to Common Stockholders—The Company calculates basic and diluted net loss per common share by dividing the net loss adjusted for the dividend on the redeemable convertible preferred stock by the weighted average number of common shares outstanding during the period. The Company has excluded all potentially dilutive shares, which include redeemable convertible preferred stock, warrant for redeemable convertible preferred stock, and outstanding common stock options, from the weighted average number of common shares outstanding as their inclusion in the computation for all periods would be anti-dilutive due to net losses. The Company’s redeemable convertible preferred stock are participating securities as defined under the authoritative guidance, but are excluded from the earnings per share calculation as they do not have an obligation to share or fund in the Company’s net losses.
F-13
Table of Contents
The following common stock equivalents were excluded from the computation of diluted net loss per share attributable to common stockholders because they had an antidilutive impact (in thousands):
| Year Ended December 31, | ||||||||||||
| 2009 | 2010 | 2011 | ||||||||||
| Options to purchase common stock |
3,566 | 5,014 | 4,492 | |||||||||
| Warrant to purchase convertible preferred stock |
23 | 23 | 23 | |||||||||
| Redeemable convertible preferred stock |
16,129 | 18,028 | 18,028 | |||||||||
Basic and diluted net loss per share is calculated as follows (in thousands, except per share data):
| Year Ended December 31, | ||||||||||||
| 2009 | 2010 | 2011 | ||||||||||
| Numerator: |
||||||||||||
| Net (loss) income |
$ | (10,377 | ) | $ | 309 | $ | (1,411 | ) | ||||
| Accretion of preferred stock |
(4,322 | ) | (5,106 | ) | (5,274 | ) | ||||||
|
|
|
|
|
|
|
|||||||
| Net loss attributable to common shares |
$ | (14,699 | ) | $ | (4,797 | ) | $ | (6,685 | ) | |||
|
|
|
|
|
|
|
|||||||
| Denominator: |
||||||||||||
| Weighted average shares outstanding, basic and diluted |
1,878 | 1,967 | 3,823 | |||||||||
|
|
|
|
|
|
|
|||||||
| Net loss per share, basic and diluted |
$ | (7.83 | ) | $ | (2.44 | ) | $ | (1.75 | ) | |||
Unaudited Pro Forma Net Loss per Share—The unaudited pro forma basic and diluted net loss per share has been computed to give effect to the conversion of the Company’s redeemable convertible preferred stock into common stock. The dilutive effect of outstanding options is reflected in diluted earnings per share by application of the treasury stock method.
Pro forma basic and diluted net loss per share was calculated as follows (in thousands, except per share data):
| Year Ended December 31, 2011 |
||||
| (unaudited) | ||||
| Pro Forma Basic Net Loss per Share: |
||||
| Numerator: |
||||
| Net loss attributable to common shares |
$ | (6,685 | ) | |
| Plus: Accretion of preferred stock |
5,274 | |||
|
|
|
|||
| Pro forma net loss |
$ | (1,411 | ) | |
|
|
|
|||
| Denominator: |
||||
| Weighted average shares outstanding used in computing per share |
3,823 | |||
| Conversion of convertible preferred stock |
18,028 | |||
|
|
|
|||
| Pro forma weighted average shares outstanding used in computing per share amounts |
21,851 | |||
|
|
|
|||
| Pro forma basic net loss per share |
$ | (0.06 | ) | |
|
|
|
|||
| Pro Forma Diluted Net Loss Share: |
||||
| Numerator: |
||||
| Net loss attributable to common shares |
$ | (6,685 | ) | |
| Plus: Accretion of preferred stock |
5,274 | |||
|
|
|
|||
| Pro forma net loss |
$ | (1,411 | ) | |
|
|
|
|||
| Denominator: |
||||
| Weighted average shares outstanding used in computing per share amounts |
3,823 | |||
| Options to purchase common shares |
— | |||
| Conversions of convertible preferred stock |
18,028 | |||
|
|
|
|||
| Pro forma weighted average shares outstanding used in computing per share amounts |
21,851 | |||
|
|
|
|||
| Pro forma diluted net loss per share |
$ | (0.06 | ) | |
|
|
|
|||
F-14
Table of Contents
Impairment of Long-Lived Assets—The Company considers whether indicators of impairment of its long-lived assets are present. If such indicators are present, the Company determines whether the sum of the estimated undiscounted future cash flows attributable to such assets is less than their carrying amount, and if so, the Company recognizes an impairment loss based on the excess of the carrying amount of the assets over their fair value. To date, no such impairment has occurred.
Advertising—Advertising costs are charged to operations as incurred and include direct marketing, events, public relations, sales collateral materials and partner programs. Advertising expense was approximately $0.8 million, $1.2 million and $2.0 million for the years ended December 31, 2009, 2010 and 2011, respectively.
Income Taxes—Deferred tax assets and liabilities are recognized based on temporary differences between the financial reporting and income tax bases of assets and liabilities using rates anticipated to be in effect when such temporary differences reverse. A valuation allowance against deferred tax assets is recorded, based upon the available evidence, if it is more likely than not that some or all of the deferred tax assets will not be realized. The Company assesses its income tax positions and records tax benefits based upon management’s evaluation of the facts, circumstances, and information available at the reporting date. For those tax positions where it is more likely than not that a tax benefit will be sustained, the Company records the largest amount of tax benefit with a greater than 50 percent likelihood of being realized upon ultimate settlement with a taxing authority having full knowledge of all relevant information. For those income tax positions where it is not more likely than not that a tax benefit will be sustained, no tax benefit is recognized in the financial statements. The Company classifies liabilities for uncertain tax positions as non-current liabilities unless the uncertainty is expected to be resolved within one year. Potential interest and penalties associated with such uncertain tax positions are recorded as a component of income tax expense.
Stock-Based Compensation—The Company accounts for all stock options granted to employees and nonemployees using a fair value method. The Black-Scholes option pricing model is used to determine the fair value of the award, which is then recognized on a straight-line basis over the requisite services period, which is the vesting period of the award. The measurement date for employee awards is the date of the grant, and the measurement date for nonemployee awards is the date the performance or services are completed.
Preferred Stock Warrant Liability—The Company accounts for warrants to purchase redeemable convertible preferred stock as liabilities. The warrants are recorded at fair value estimated using the Black-Scholes option pricing model and revalued at each balance sheet date. The change in the fair value of the warrants is recorded as a component of other (expense) income (Note 7).
Other Comprehensive (Loss) Income—Other comprehensive (loss) income consists of net (loss) income and foreign currency translation adjustments. Other comprehensive (loss) income as of December 31, 2009, 2010, and 2011 is $(10.4) million, $0.3 million, and $(1.4) million, respectively.
Warranties—The Company includes service level commitments to its customers warranting certain levels of uptime reliability and performance and permitting those customers to receive credits in the event that the Company fails to meet those levels. To date, the Company has not incurred any material costs as a result of such commitments.
Commissions—The Company recognizes commission expense related to subscriptions in the period in which the contract is signed.
Guarantees—As permitted under Delaware law, the Company indemnifies its officers and directors for liabilities incurred by reason of the fact that the officer or director is, was, or has agreed to
F-15
Table of Contents
serve as, an officer or director of the Company. The term of the indemnification period is for the officer or director’s lifetime. The maximum potential amount of future payments the Company could be required to make under these indemnification provisions is unlimited.
The Company’s agreements with customers generally require the Company to indemnify the customer against claims in which the Company’s services infringe third-party patents, copyrights, or trade secret rights (see Note 6). The term of these indemnification agreements is generally over the term of the subscription agreement. The maximum potential amount of future payments the Company could be required to make under these indemnification agreements is unlimited.
The Company leases office space under operating subleases (see Note 6). The Company has standard indemnification arrangements under these leases that require the Company to indemnify the landlord against losses, liabilities, and claims incurred in connection with the premises covered by the Company’s lease, the Company’s use of the premises, property damage or personal injury, and breach of the agreement.
Recent Accounting Pronouncements—In June 2011, the FASB issued an amendment to the accounting guidance for presentation of comprehensive income. The amended guidance provides companies with two options for presenting comprehensive income. Companies can present the total of comprehensive income, the components of net income, and the components of other comprehensive income either in a single continuous statement of comprehensive income or in two separate but consecutive statements. This guidance eliminates the option to present the components of other comprehensive income as part of the statement of changes in stockholders’ equity. In December 2011, the FASB further amended this guidance to defer the effective date for the reclassifications of items out of accumulated other comprehensive income. In response to stakeholder concerns regarding the operational ramifications of the presentation of these reclassifications for current and previous years, the FASB has deferred the implementation date of this provision to allow time for further consideration. The requirement for the presentation of a combined statement of comprehensive income or separate, but consecutive, statements of net income and other comprehensive income is still effective for fiscal years and interim periods beginning after December 15, 2011, and shall be applied retrospectively. Early adoption is permitted. The Company adopted the guidance effective January 1, 2012. As the new guidance relates only to how comprehensive income is disclosed and does not change the items that must be reported as comprehensive income, the Company does not believe that the adoption of this standard will have a material impact on its financial position or results of operations.
In May 2011, the FASB amended the accounting guidance for fair value to develop common requirements between GAAP and International Financial Reporting Standards. The amendments clarify the FASB’s intent about the application of existing fair value measurement and disclosure requirements and in some instances change a particular principle or requirement for measuring fair value or for disclosing information about fair value measurements. Notable changes under the amended guidance include: (i) application of the highest and best use and valuation premise concepts solely for non-financial assets and liabilities; (ii) measuring the fair value of an instrument classified in a reporting entity’s shareholders’ equity; and (iii) disclosing quantitative information about unobservable inputs used in the fair value measurement within Level 3 of the fair value hierarchy. For public entities, the amendment is effective for interim and annual periods beginning after December 15, 2011. Early application is not permitted. The Company adopted the guidance effective January 1, 2012. The Company is currently evaluating the impact of these amendments on its financial statements and related disclosures.
Stock Split—On February 9, 2012, the Company’s Board of Directors approved a 1-for-3 reverse stock split of the Company’s common stock. The reverse stock split became effective on March 1, 2012. Upon the effectiveness of the reverse stock split, (i) every three shares of outstanding common
F-16
Table of Contents
stock was decreased to one share of common stock, (ii) the number of shares of common stock into which each outstanding warrant or option to purchase common stock is exercisable was proportionally decreased, (iii) the exercise price of each outstanding warrant or option to purchase common stock was proportionately increased, and (iv) the conversion ratio for each share of preferred stock outstanding was proportionately reduced. Unless otherwise indicated, all of the share numbers, share prices and exercise prices in these financial statements have been adjusted, on a retroactive basis, to reflect this 1-for-3 reverse stock split.
| 3. | FAIR VALUE MEASUREMENTS |
Fair value is an exit price, representing the amount that would be received from the sale of an asset or paid to transfer a liability in an orderly transaction between market participants. As such, fair value is a market-based measurement that should be determined based on assumptions that market participants would use in pricing an asset or liability. As a basis for considering such assumptions, GAAP establishes a three-tier value hierarchy, which prioritizes the inputs used in measuring fair value as follows: observable inputs such as quoted prices in active markets (Level 1); inputs other than the quoted prices in active markets that are observable either directly or indirectly (Level 2); and unobservable inputs in which there is little or no market data, which requires the Company to develop its own assumptions (Level 3). This hierarchy requires the Company to use observable market data, when available, and to minimize the use of unobservable inputs when determining fair value. On a recurring basis, the Company measures certain financial assets and liabilities at fair value, including the Company’s cash equivalents.
The assets and liabilities measured at fair value on a recurring basis as of December 31, 2010 and 2011, and the input categories associated with those assets and liabilities are as follows (in thousands):
| Fair Value Measurements Using | ||||||||||||||||
| Amounts at Fair Value |
Quoted Prices in Active Markets for Identical Assets (Level 1) |
Significant Other Observable Inputs (Level 2) |
Significant Unobservable Inputs (Level 3) |
|||||||||||||
| At December 31, 2010 |
||||||||||||||||
| Assets—cash equivalents |
$ | 5,357 | $ | 5,357 | $ | — | $ | — | ||||||||
| Liabilities—preferred stock warrant liability |
$ | 58 | $ | — | $ | — | $ | 58 | ||||||||
| At December 31, 2011 |
||||||||||||||||
| Assets—cash equivalents |
$ | 5,357 | $ | 5,357 | $ | — | $ | — | ||||||||
| Liabilities—preferred stock warrant liability |
$ | 107 | $ | — | $ | — | $ | 107 | ||||||||
The cash equivalents consist of money market funds and are recorded at fair value based on quoted prices. The preferred stock warrant liability is recorded at fair value using the Black-Scholes model (see Note 7).
A rollforward of the fair value measurements of the preferred stock warrant liability categorized with Level 3 inputs as of December 31, 2009, 2010 and 2011 is as follows (in thousands):
| December 31, | ||||||||||||
| 2009 | 2010 | 2011 | ||||||||||
| Balance beginning of period |
$ | 78 | $ | 74 | $ | 58 | ||||||
| Change in fair value of warrant liability |
(4 | ) | (16 | ) | 49 | |||||||
|
|
|
|
|
|
|
|||||||
| Balance end of period |
$ | 74 | $ | 58 | $ | 107 | ||||||
|
|
|
|
|
|
|
|||||||
F-17
Table of Contents
| 4. | PROPERTY AND EQUIPMENT |
Property and equipment as of December 31, 2010 and 2011 consist of the following (in thousands):
| December 31, | ||||||||
| 2010 | 2011 | |||||||
| Computer equipment |
$ | 8,515 | $ | 10,492 | ||||
| Purchased software, including internal use software |
1,685 | 2,613 | ||||||
| Leasehold improvements, including construction in progress |
1,129 | 217 | ||||||
| Office furniture |
455 | 655 | ||||||
|
|
|
|
|
|||||
| Property and equipment—at cost |
11,784 | 13,977 | ||||||
| Less accumulated depreciation and amortization |
(5,853 | ) | (7,573 | ) | ||||
|
|
|
|
|
|||||
| Property and equipment—net |
$ | 5,931 | $ | 6,404 | ||||
|
|
|
|
|
|||||
Depreciation and amortization expense for the years ended December 31, 2009, 2010 and 2011, $1.4 million, $1.7 million and $2.9 million, respectively.
| 5. | DEBT |
Promissory Demand Notes Payable to Stockholders—In December 2008, the Company issued $1.5 million in demand notes payable to stockholders. During February and March 2009, the Company issued an additional $3.3 million of demand notes payable to stockholders (collectively, the “Notes”). The Notes were due upon demand, plus accrued interest at an annual rate of 10%. The Notes were secured by all of the assets of the Company. In April 2009, the outstanding balance of $4.8 million and accrued interest in the amount of $0.1 million were extinguished to purchase 3,731,038 shares of Series D Preferred Stock (see Note 7).
Line of Credit—In July 2008, the Company entered into a loan and security agreement (the “2008 Loan Agreement”) which included a $3.0 million secured revolving credit facility. Under the terms of the agreement, borrowing availability varied based upon eligible accounts receivable, but in no event was less than $1.3 million. Borrowings were collateralized by substantially all of the assets of the Company and bear interest at a variable annual rate equal to the greater of (i) 1.25% above prime rate, or (ii) 7%. In December 2008, in conjunction with the issuance of demand notes payable to stockholders, the line of credit was suspended until the demand notes were paid in full. The line expired in June 2009 and there were no borrowings made under the line of credit in the year ended December 31, 2009.
In August 2011, the Company amended its 2008 Loan Agreement to include an additional secured revolving credit facility of up to $5.0 million. Under the terms of the amendment, borrowing availability varies based upon eligible accounts receivable. Borrowings are collateralized by substantially all of the assets of the Company and bear interest at a variable rate of 0.75% above prime rate. The line expires in August 2012 and there were no borrowings made under the line of credit as of December 31, 2011.
In connection with the 2008 Loan Agreement, the Company issued a warrant to purchase 69,278 shares of Series C Preferred Stock at an exercise price of $1.30 per share that expires in July 2018 (see Note 7).
Equipment Notes Payable—In May 2009, the Company amended its 2008 Loan Agreement to include a $2.0 million equipment line of credit (the “Loan”). Borrowings under the Loan could be made for eligible equipment purchases through December 31, 2009. The Loan is secured by substantially all
F-18
Table of Contents
assets of the Company, except intellectual property. The Loan also contains various covenants that limit, among other things, indebtedness, investments, liens, transactions, and certain mergers and sales of assets. In addition, the loan contains financial covenants that impose a minimum adjusted quick ratio (as defined in the loan agreement) and minimum quarterly revenue targets. The Loan is due in 36 equal monthly payments of principal, plus accrued interest, at an annual rate of 7.50% through December 31, 2012. During the year ended December 31, 2009 the Company made borrowings totaling $1.4 million.
In April 2010, the Company amended the Loan and increased the available borrowings to an additional $4.0 million for equipment purchases made during 2010. Each advance is payable over 36 months at a fixed annual interest rate of 7.25%. During the year ended December 31, 2010, the Company made borrowings totaling $2.9 million.
In June 2011, the Company again amended the Loan and increased the available borrowings to an additional $4.0 million for equipment purchases made through March 31, 2012. Each advance is payable over 36 months at a fixed rate of 6.00%. During the year ended December 31, 2011, the Company made borrowings under this line of $2.6 million, and had available borrowings of $1.4 million as of December 31, 2011.
At December 31, 2010 and 2011, the outstanding balance of the Loan was $3.3 million and $4.0 million, respectively.
As of December 31, 2011, future annual principal payments due under the Loan was as follows (in thousands):
| Years Ending December 31, |
||||
| 2012 |
$ | 2,098 | ||
| 2013 |
1,437 | |||
| 2014 |
445 | |||
|
|
|
|||
| 3,980 | ||||
| Less current portion of notes payable |
2,098 | |||
|
|
|
|||
| Long-term notes payable |
$ | 1,882 | ||
|
|
|
|||
Landlord Note Payable—In March 2008, the Company entered into a note payable with its landlord in the amount of $0.1 million to be applied toward tenant improvements. The note payable is due in 43 equal monthly payments of principal, plus accrued interest, at a rate of 4.258% through August 2011. At December 31, 2010 and 2011, the outstanding balance of the note payable was $18,000 and $0, respectively.
| 6. | COMMITMENTS AND CONTINGENCIES |
Operating Leases—In August 2007, the Company entered into a four-year operating lease for approximately 19,000 square feet. On December 31, 2010, the Company vacated and ceased to use the facility. Accordingly, the Company expensed $0.2 million to rent expense for the eight months of rent expense that would have been incurred in 2011 as the Company did not sublease the space.
In May 2010, the Company entered into an operating lease for approximately 32,000 square feet of new office space that expires in July 2017. In December 2010, the Company entered into an operating lease for approximately 8,000 square feet of new office space in Germany that expires in January 2016.
During the years ended December 31, 2009, 2010 and 2011, rent expense was $0.4 million, $0.9 million, and $1.0 million, respectively.
F-19
Table of Contents
The Company’s obligation for payments under these leases is as follows at December 31, 2011 (in thousands):
| Years Ending December 31 |
||||
| 2012 |
$ | 963 | ||
| 2013 |
1,026 | |||
| 2014 |
1,042 | |||
| 2015 |
1,058 | |||
| 2016 |
933 | |||
| Thereafter |
542 | |||
|
|
|
|||
| Total minimum lease payments |
$ | 5,564 | ||
|
|
|
|||
Hosting Services—The Company has agreements with third parties to provide co-location services for hosting operations, which typically have a term of 24 months. The agreements require payment of a minimum amount per month for a fixed period of time in return for which the hosting service provider provides certain guarantees of network availability. All agreements expire by July 2013.
The Company recorded hosting service expenses of $0.9 million and $1.5 million during the years ended December 31, 2010 and 2011, respectively. Future minimum payments as of December 31, 2011 under these arrangements are $0.9 million in 2012 and $0.2 million in 2013.
Chinese Investment—In connection with establishing operations in China, in December 2011, the Company entered into a funding agreement pursuant to which it lent $150,000 to the owners of a Chinese limited liability company (the “Chinese Entity”) in exchange for a customer-supplier relationship with the Chinese Entity and an option to purchase such entity. As of December 31, 2011, this entity had not commenced operations.
Patent Indemnification—The Company has received indemnification requests from customers that have received letters from, or been sued by, non-practicing entities claiming infringement of patents owned by them. Most of those underlying claims have not yet been resolved, and the extent, if any, of the Company’s indemnification obligations has not been determined. Certain of these matters include speculative claims for substantial or indeterminate amounts of damages. In addition, some of the patents at issue are the subject of pending legal proceedings between the patent owners and one or more leading e-commerce companies, and the outcome of those proceedings could affect the extent to which the patent owners seek to prosecute claims against the Company or its customers. The Company’s business could be materially adversely affected by any significant disputes between the Company and its customers as to intellectual property litigation to which the Company might become a party or for which the Company may be required to provide indemnification. Adverse results in these matters may include awards of substantial monetary damages, costly licensing agreements, or orders preventing the Company from offering certain features, functionalities, products, or services, and may also cause the Company to change its business practices, and require development of non-infringing products or technologies, which could result in a loss of revenues and otherwise harm the Company’s business. As of December 31, 2011, the Company has not made an accrual related to these matters.
The Company records a liability when it believes that a loss is both probable and reasonably estimable. On a quarterly basis, the Company reviews each of its legal proceedings to determine whether it is probable, reasonably possible or remote that a liability has been incurred and, if it is at least reasonably possible, whether a range of loss can be reasonably estimated. Significant judgment is required to determine both the likelihood of there being a loss and the estimated amount of such loss. Until the final resolution of such matters, there may be an exposure to loss in excess of the amount recorded, and such amounts could be material. The Company expenses legal fees in the period in which they are incurred.
F-20
Table of Contents
In all of the Company’s outstanding legal matters for which it has not made an accrual, the Company is unable to estimate a range of reasonably possible loss due to various factors, including, among others, the early stage and uncertain outcome of the pending lawsuits to which the Company is not a party; and the significant factual issues to be resolved regarding the extent, if any, of the Company’s indemnification obligations. Given the significant uncertainties involved in these matters, the Company cannot predict the timing or extent of their impact, if any, on its business, consolidated financial position, results of operations or cash flows, which could be material, particularly in any fiscal quarter in which it may accrue a related liability.
| 7. | REDEEMABLE CONVERTIBLE PREFERRED STOCK |
The Company has 54,206,421 shares of $0.01 par value redeemable convertible preferred stock authorized, of which 9,564,000 shares are designated as Series A redeemable convertible preferred stock (“Series A Preferred Stock”), 11,165,557 shares are designated as Series B redeemable convertible preferred stock (“Series B Preferred Stock”), 16,234,236 shares are designated Series C Preferred Stock (“Series C Preferred Stock”), and 17,242,628 shares are designated as Series D Preferred Stock (“Series D Preferred Stock”).
The following is a summary of the activity related to Company’s redeemable convertible preferred stock (in thousands):
| Redeemable Convertible Preferred Stock | ||||||||||||||||||||||||||||||||||||
| Series A | Series B | Series C | Series D | |||||||||||||||||||||||||||||||||
| Shares | Amount | Shares | Amount | Shares | Amount | Shares | Amount | Total | ||||||||||||||||||||||||||||
| Balance as of January 1, 2009 |
9,513 | $ | 12,668 | 11,166 | $ | 15,187 | 16,165 | $ | 22,820 | — | $ | — | $ | 50,675 | ||||||||||||||||||||||
| Issuance of Series D redeemable convertible preferred stock and extinguishment of promissory notes and accrued interest (net of issuance costs of $153) |
11,546 | 14,847 | 14,847 | |||||||||||||||||||||||||||||||||
| Accretion and dividends on preferred stock |
770 | 991 | 1,689 | 872 | 4,322 | |||||||||||||||||||||||||||||||
|
|
|
|
|
|
|
|
|
|
|
|
|
|
|
|
|
|
|
|||||||||||||||||||
| Balance as of December 31, 2009 |
9,513 | 13,438 | 11,166 | 16,178 | 16,165 | 24,509 | 11,546 | 15,719 | 69,844 | |||||||||||||||||||||||||||
| Issuance of Series D redeemable convertible preferred stock (net of issuance costs of $21) |
5,696 | 7,379 | 7,379 | |||||||||||||||||||||||||||||||||
| Accretion and dividends on preferred stock |
769 | 990 | 1,687 | 1,660 | 5,106 | |||||||||||||||||||||||||||||||
|
|
|
|
|
|
|
|
|
|
|
|
|
|
|
|
|
|
|
|||||||||||||||||||
| Balance as of December 31, 2010 |
9,513 | 14,207 | 11,166 | 17,168 | 16,165 | 26,196 | 17,242 | 24,758 | 82,329 | |||||||||||||||||||||||||||
| Accretion and dividends on preferred stock |
769 | 990 | 1,688 | 1,827 | 5,274 | |||||||||||||||||||||||||||||||
|
|
|
|
|
|
|
|
|
|
|
|
|
|
|
|
|
|
|
|||||||||||||||||||
| Balance as of December 31, 2011 |
9,513 | $ | 14,976 | 11,166 | $ | 18,158 | 16,165 | $ | 27,884 | 17,242 | $ | 26,585 | $ | 87,603 | ||||||||||||||||||||||
|
|
|
|
|
|
|
|
|
|
|
|
|
|
|
|
|
|
|
|||||||||||||||||||
Redeemable Convertible Preferred Stock Issuances—In April 2009, the Company received proceeds of $14.9 million, net of issuance costs of $0.2 million, from the issuance of 11,546,403 shares of Series D Preferred Stock at an issue price of $1.299106 per share, which included the extinguishment of $4.8 million of demand notes and accrued interest of $0.1 million. In 2010, the Company issued an additional 5,696,225 shares of Series D Preferred Stock for proceeds of $7.4 million, net of issuance costs of $21,000.
F-21
Table of Contents
Terms of Redeemable Convertible Preferred Stock—The rights, preferences, and privileges of the Series A Preferred Stock, Series B Preferred Stock, Series C Preferred Stock, and Series D Preferred Stock (collectively, the “Preferred Stock”) is as follows:
Voting—Preferred Stock stockholders are entitled to vote on all matters and are entitled to the number of votes equal to the number of shares of common stock into which each share of preferred stock is then convertible. With certain exceptions, the holders of Preferred Stock shall vote together as a single class.
Dividends—Dividends accrue whether or not declared by the Board of Directors at an annual rate per share of $0.08 for Series A Preferred Stock, $0.08812816 per share for Series B Preferred Stock, $0.10392850 per share for Series C Preferred Stock, and $0.10392850 per share for Series D Preferred Stock. Such dividends are cumulative and payable upon the occurrence of a liquidation event or a redemption event, each as defined. The Preferred Stock is senior to all common stock with respect to dividends. At December 31, 2011, the accrued and unpaid dividends for Series A Preferred Stock were $5.5 million, for Series B Preferred Stock were $5.9 million, $6.9 million for Series C Preferred Stock, and $4.3 million for Series D Preferred Stock. Dividends are included in the carrying value in the preferred stock. The Loan prohibits payment of dividends on the Company’s capital stock without the prior consent of the lender.
Liquidation Rights—In certain events, including the liquidation, dissolution, or winding up of the Company, before any distribution of payments is made to common stockholders, the holders of Preferred Stock are entitled to receive, on a pari passu basis, the greater of (i) an amount equal to $1.00 per share (Series A Preferred Stock), $1.101602 per share (Series B Preferred Stock), $1.299106 (Series C Preferred Stock), and $1.299106 (Series D Preferred Stock), respectively, plus the accruing dividends and any other dividends declared but unpaid, or (ii) the amount a holder of such Preferred Stock received if such holder converted such Preferred Stock into common stock immediately prior to the liquidation event.
If there are insufficient assets legally available to make this distribution in full, then the available assets shall be distributed on a pro rata basis to the holders of Preferred Stock.
Any remaining assets legally available for distribution after satisfaction of the Preferred Stock liquidation amounts shall be distributed to the holders of common stock and the Series D Preferred Stock on a common stock equivalent basis; provided, however, that the participation rights of the Series D Preferred Stock will be capped at an amount equal to three times the original issue price.
Conversion—Each share of Preferred Stock, at the option of the holder, is convertible into a number of fully paid shares of common stock as determined by dividing the respective preferred stock issue price by the conversion price in effect at the time, subject to certain antidilutive adjustments. The initial conversion prices of the Series A Preferred Stock, Series B Preferred Stock, Series C Preferred Stock and Series D Preferred Stock is $1.00, $1.101602, $1.299106, and $1.299106, respectively, resulting in a one-for-one exchange ratio for Series A Preferred Stock, Series B Preferred Stock, Series C Preferred Stock and Series D Preferred Stock as of December 31, 2011 (as of March 1, 2012 and described in Note 2, Preferred Shares will be convertible into common stock on a one-for-three basis). Conversion is automatic immediately upon (i) the closing of an underwritten public offering in which the public offering price equals or exceeds $5.00 per share (adjusted to reflect subsequent stock dividends, stock splits, or recapitalization) and the aggregate proceeds raised equals or exceeds $25,000 or (ii) upon the election of the holders of at least two-thirds of the voting power of the then outstanding shares of Preferred Stock.
Redemption—At the written election of at least two-thirds of the then-outstanding shares of Preferred Stock, the Company is required to redeem all of the outstanding shares of Preferred Stock and pay in full on or after April 13, 2014, at a price equal to $1.00 per share (Series A Preferred Stock), $1.101602 per share (Series B Preferred Stock), $1.299106 per share (Series C Preferred Stock), and $1.299106 per share (Series D Preferred Stock), respectively, plus the accruing dividends and any other dividends declared but unpaid. The Company is accreting the Preferred Stock to redemption value over the period from issuance to April 13, 2014, such that the carrying amounts of the securities will equal the redemption amounts at the earliest redemption date.
F-22
Table of Contents
Preferred Stock Warrants—In July 2008, in conjunction with obtaining a line of credit from a bank (Note 5), the Company issued a warrant to purchase 69,278 shares of Series C Preferred Stock at an exercise price of $1.30 per share that expires in July 2018. At December 31, 2011, the warrant is exercisable and outstanding. So long as the warrant remains outstanding and is exercisable for redeemable convertible preferred stock, the warrant liability will be recorded at fair value at each balance sheet date and any change in fair value will be included as a component of other (expense) income. The Company recognized $4,000, $16,000 and ($49,000) of other income (loss) during the years ended December 31, 2009, 2010 and 2011 for the change in the fair value of the warrants. At December 31, 2010 and 2011, respectively, the fair value of the warrant liability using the Black-Scholes option pricing model and underlying assumptions used in the model were as follows (dollars in thousands):
| As of December 31, 2010 |
As of December 31, 2011 |
|||||||
| Fair value of preferred stock warrant liability |
$ | 58 | $ | 107 | ||||
|
|
|
|
|
|||||
| Risk-free interest rate |
3.0 | % | 1.45 | % | ||||
| Expected dividend yield |
— | — | ||||||
| Expected term (in years) |
7.5 | 6.5 | ||||||
| Expected volatility |
60.9 | % | 59.1 | % | ||||
| 8. | COMMON STOCK |
Restricted Common Stock—Certain employees of the Company hold shares of restricted common stock that was issued for promissory notes that were repayable in full on demand. At December 31, 2010, there was one promissory note outstanding with a balance of $0.1 million, including accrued interest of $15,000, for the purchase of 100,000 shares of common stock. In May 2011, the one outstanding promissory note was forgiven by the Company.
The measurement date for the purchase of 100,000 shares of common stock was not fixed until the note was repaid; therefore, the arrangement was subject to variable accounting and required incremental stock-based compensation to be recorded if the fair value of the underlying common stock changed. Within the research and development expenses line item of the accompanying consolidated statements of operations, the Company recorded, ($39,000), $0.1 million, and $0.4 million of stock-based compensation during the years ended December 31, 2009, 2010, and 2011, related to this award.
Reserved Shares—As of December 31, 2011, the Company has authorized 27,333,333 shares of common stock, respectively and the following number of shares of common stock has been reserved for the potential conversion of preferred stock and exercise of stock options and warrants (in thousands):
| As of December 31, 2011 |
||||
| Series A Preferred Stock |
3,171 | |||
| Series B Preferred Stock |
3,722 | |||
| Series C Preferred Stock |
5,388 | |||
| Series C Preferred Stock warrant |
23 | |||
| Series D Preferred Stock |
5,747 | |||
| 2004 Stock Option and Grant Plan |
4,245 | |||
|
|
|
|||
| Total |
22,296 | |||
|
|
|
|||
F-23
Table of Contents
| 9. | STOCK OPTION PLAN |
In 2004, the Board of Directors adopted the 2004 Stock Option and Grant Plan (the “Plan”) for the issuance of stock options and other equity interests to employees, officers, directors, consultants, and advisors. As of December 31, 2011, the Board of Directors had authorized 7,114,747 shares of common stock for issuance under the Plan. The Board of Directors determines the number of stock options to be granted and the exercise price of option grants. The Board of Directors also determines the number of shares to be issued as restricted stock awards and the terms of such awards. An option awarded under the Plan expires 10 years after the grant date, unless a shorter term is set by the Board of Directors. Stock options generally vest over four years. Certain option agreements provide for acceleration of vesting upon a change of control. As of December 31, 2011, there were 220,968 shares available for grant under the Plan.
The summary of stock option activity for the year ended December 31, 2011 is as follows (in thousands, except per share and term information):
| Shares | Weighted- Average Exercise Price |
Weighted- Average Remaining Contractual Life (in Years) |
Aggregate Intrinsic Value |
|||||||||||||
| Outstanding—January 1, 2011 |
5,014 | $ | 1.20 | 8.00 | $ | 5,732 | ||||||||||
| Granted |
591 | 5.85 | ||||||||||||||
| Forfeited |
(50 | ) | 2.67 | |||||||||||||
| Expired of cancelled |
— | — | ||||||||||||||
| Exercised |
(1,531 | ) | 1.08 | |||||||||||||
|
|
|
|||||||||||||||
| Outstanding—December 31, 2011 |
4,024 | $ | 1.92 | 7.62 | $ | 4,371 | ||||||||||
|
|
|
|||||||||||||||
| Exercisable—December 31, 2011 |
1,947 | $ | 1.20 | 6.72 | $ | 2,049 | ||||||||||
|
|
|
|||||||||||||||
| Options vested and expected to vest—December 31, 2011 |
3,775 | $ | 1.92 | 7.58 | $ | 4,101 | ||||||||||
|
|
|
|||||||||||||||
The following table summarizes information relating to options granted and exercised (in thousands, except per share data):
| Year Ended December 31, | ||||||||||||
| 2009 | 2010 | 2011 | ||||||||||
| Weighted average fair value of options granted |
$ | 0.75 | $ | 0.81 | $ | 3.30 | ||||||
| Aggregate intrinsic value of options exercised |
27 | 1,317 | 5,990 | |||||||||
| Cash proceeds received upon exercise of options |
40 | 999 | 1,645 | |||||||||
The aggregate intrinsic value represents the difference between the estimated fair value at exercise and the exercise price paid by the employee. The amount of aggregate intrinsic value will change based on the fair market value of the common stock.
F-24
Table of Contents
In determining the exercise prices for stock-based awards, the Company’s Board of Directors considers the estimated fair value of the common stock as of each grant date. The determination of the deemed fair value of the Company’s common stock involves significant assumptions, estimates, and complexities that impact the amount of stock-based compensation. The estimated fair value of the Company’s common stock has been determined by management and the Board of Directors after considering a broad range of factors, including, but not limited to, the results obtained from third-party valuations, Company’s financial position, the status of technological developments within the Company, the composition and ability of the management team, the current climate in the marketplace, the illiquid nature of the common stock, arm’s-length sales of the Company’s preferred stock, the effect of the rights and preferences of the preferred stockholders, and the prospects of a liquidity event, among others.
Stock-based compensation expense related to stock options is included in the following line items in the accompanying consolidated statement of operations (in thousands):
| Year Ended December 31, | ||||||||||||
| 2009 | 2010 | 2011 | ||||||||||
| Cost of subscription revenue |
$ | 10 | $ | 16 | $ | 20 | ||||||
| Cost of service revenue |
109 | 74 | 93 | |||||||||
| Research and development |
58 | 100 | 136 | |||||||||
| Sales and marketing |
168 | 156 | 252 | |||||||||
| General and administration |
208 | 595 | 637 | |||||||||
|
|
|
|
|
|
|
|||||||
| $ | 553 | $ | 941 | $ | 1,138 | |||||||
|
|
|
|
|
|
|
|||||||
The Company uses the Black-Scholes option-pricing model to value share-based awards and determine the related compensation expense. The assumptions used to compute stock-based compensation expense for awards granted, are as follows:
| Year Ended December 31, | ||||||||||||
| 2009 | 2010 | 2011 | ||||||||||
| Risk-free interest rate |
2.6 | % | 2.6 | % | 2.1 | % | ||||||
| Expected dividend yield |
— | — | — | |||||||||
| Expected term (in years) |
6 | 6 | 6 | |||||||||
| Expected volatility |
62.0 | % | 62.3 | % | 59.9 | % | ||||||
The risk-free interest rate assumption was based on the U.S. Treasury zero-coupon bonds with maturities similar to those of the expected term of the award being valued. The assumed dividend yield was based on the Company’s expectation of not paying dividends in the foreseeable future. The weighted-average expected life for employee options reflects the application of the simplified method, which represents the average of the contractual term of the options and the weighted-average vesting period for all option tranches. The simplified method has been used since the Company does not have sufficient historical exercise data to provide a reasonable basis upon which to estimate expected term due to a limited period of the Company’s life. The expected life of options granted to nonemployees is equal to the remaining contractual term as of the measurement date. The Company bases its estimate of expected volatility using volatility data from comparable public companies in similar industries and markets because there is currently no public market for the Company’s common stock, and therefore, a lack of market-based company-specific historical and implied volatility information.
F-25
Table of Contents
At December 31, 2011, there was $2.6 million of unrecognized stock compensation expense related to unvested share-based compensation arrangements granted under the Company’s stock award plan. As of December 31, 2011, this expense is expected to be recognized over a weighted-average period of approximately 2 years.
During 2009, the Company repriced options to purchase 426,656 shares of common stock that were originally priced at $1.68 per share and were modified lower to $1.29 per share held by 34 employees. The Company recorded $30,000 of incremental stock-based compensation as a result of this modification.
During 2009, the Company extended the life of options to purchase 26,562 shares of common stock that were held by a former member of the Board of Directors. The Company did not record any incremental stock-based compensation as a result of this modification as the impact was negligible.
| 10. | INCOME TAXES |
The provision for income taxes for the years ended December 31, 2009, 2010 and 2011 consists of the following (in thousands):
| December 31, | ||||||||||||
| 2009 | 2010 | 2011 | ||||||||||
| (Loss) income before income taxes: |
||||||||||||
| Domestic |
$ | (10,527 | ) | $ | 114 | $ | (1,627 | ) | ||||
| International |
205 | 337 | 428 | |||||||||
|
|
|
|
|
|
|
|||||||
| $ | (10,322 | ) | $ | 451 | $ | (1,199 | ) | |||||
|
|
|
|
|
|
|
|||||||
| Current income tax provision: |
||||||||||||
| Federal |
$ | — | $ | — | $ | — | ||||||
| State |
— | 39 | 55 | |||||||||
| Foreign |
55 | 103 | 157 | |||||||||
|
|
|
|
|
|
|
|||||||
| Total current income tax provision |
55 | 142 | 212 | |||||||||
| Deferred income tax provision: |
||||||||||||
| Federal |
— | — | — | |||||||||
| State |
— | — | — | |||||||||
| Foreign |
— | — | — | |||||||||
|
|
|
|
|
|
|
|||||||
| Total deferred income tax provision |
— | — | — | |||||||||
| Total income tax provision |
$ | 55 | $ | 142 | $ | 212 | ||||||
|
|
|
|
|
|
|
|||||||
The differences in total provision for income taxes that would result from applying the 34% federal statutory rate to (loss) income before provision for income taxes and the reported provision for income taxes are as follows:
| Years Ended | ||||||||||||
| December 31, | ||||||||||||
| 2009 | 2010 | 2011 | ||||||||||
| U.S. Federal tax expense at statutory rates |
34 | % | 34 | % | 34 | % | ||||||
| State income taxes, net of federal tax benefit |
6 | % | 5 | % | (14 | )% | ||||||
| Foreign rate differential |
— | (4 | )% | 1 | % | |||||||
| Permanent differences |
(1 | )% | 9 | % | (21 | )% | ||||||
| Uncertain tax provisions |
(1 | )% | 14 | % | (9 | )% | ||||||
| Valuation allowance |
(39 | )% | (27 | )% | (9 | )% | ||||||
|
|
|
|
|
|
|
|||||||
| (1 | )% | |
31 |
% |
(18 | )% | ||||||
|
|
|
|
|
|
|
|||||||
F-26
Table of Contents
Components of the net deferred tax assets as of December 31, 2010 and 2011 are as follows (in thousands):
| December 31, | ||||||||
| 2010 | 2011 | |||||||
| Operating loss carryforwards |
$ | 17,449 | $ | 15,089 | ||||
| Capitalized research and development costs |
3,875 | 3,020 | ||||||
| Accrued expenses |
1,261 | 2,005 | ||||||
| Research and development credits |
617 | 775 | ||||||
| Deferred revenue |
3,494 | 4,359 | ||||||
| Other |
876 | 1,347 | ||||||
|
|
|
|
|
|||||
| Total deferred tax assets |
27,572 | 26,595 | ||||||
| Valuation allowance for deferred tax assets |
(27,572 | ) | (26,595 | ) | ||||
|
|
|
|
|
|||||
| Net deferred tax assets |
$ | — | $ | — | ||||
|
|
|
|
|
|||||
The Company has historically incurred operating losses and given the cumulative losses and limited history of profits, the Company has recorded a full valuation allowance against its deferred tax assets for all periods to date.
The Company’s ability to use the operating loss carryforwards to offset future taxable income is subject to restrictions enacted in the U.S. Internal Revenue Code of 1986. These restrictions limit the future use of the operating loss carryforwards if certain ownership changes described in the Internal Revenue Code occur.
During the years ended December 31, 2009 and 2010, the valuation allowance increased by $4.1 million and $0.6 million, respectively, due to the increase in deferred tax assets, primarily the net operating loss and research and development tax credit carryforwards, and the full valuation allowance against the assets. During the year ended December 31, 2011, the valuation allowance decreased by $1.0 million primarily due to the use of net operating losses to offset federal and state taxable income, which decreased the related tax asset and valuation allowance.
At December 31, 2011, the Company had federal and state net operating loss carryforwards of approximately $44.3 million and $35.6 million, respectively. The net operating losses include federal and state excess benefits related to stock options of $5.1 million and $3.3 million, respectively, that will be charged to APIC when utilized. At December 31, 2011, the Company also had federal and state research and development tax credit carryforwards of $0.5 million and $0.4 million, respectively. The net operating loss carryforwards and tax credits expire at various dates through 2030.
The following table indicates the changes to the Company’s uncertain tax positions for the years ended December 31 (in thousands):
| 2009 | 2010 | 2011 | ||||||||||
| Beginning balance |
$ | 565 | $ | 622 | $ | 670 | ||||||
| Increase related to current tax year |
57 | 48 | 135 | |||||||||
|
|
|
|
|
|
|
|||||||
| Ending balance |
$ | 622 | $ | 670 | $ | 805 | ||||||
|
|
|
|
|
|
|
|||||||
The liability for unrecognized tax benefits includes no accrued interest and penalties. The Company expects none of the unrecognized tax benefits will decrease within the next 12 months related to expired statutes or settlement with the taxing authorities.
F-27
Table of Contents
The Company files federal, state, and foreign income tax returns in jurisdictions with varying statutes of limitations. With few exceptions, all tax years 2004 through 2011 remain subject to examination by federal and most state tax authorities due to the Company’s net operating loss carryforwards. In the Company’s German and United Kingdom foreign jurisdictions, the 2008, 2009, 2010, and 2011 tax years remain subject to examination.
| 11. | EMPLOYEE BENEFITS |
The Company has a 401(k) defined contribution plan (the “401(k) Plan”) for employees. The 401(k) Plan covers substantially all full-time employees. Under the terms of the plan, participants may contribute up to the lower of 20% of their salary or the statutorily prescribed limit to the plan. At the election of its Board of Directors, the Company may make matching employee contributions, but has not done so to date.
| 12. | RELATED PARTY TRANSACTIONS |
In September 2010, Stephan Schambach, the Company’s Chairman of the Board of Directors, entered into a consulting services agreement with the Company to provide assistance in the Company’s European expansion strategy, development of partnerships, and participation in industry conferences and key customer meetings. This agreement was terminated effective December 31, 2011. The Company paid Mr. Schambach $0.1 million and $0.2 million for consulting services in 2010 and 2011, respectively.
| 13. | SUBSEQUENT EVENTS |
Sublease Agreement—In January 2012, the Company entered a sublease agreement for approximately 37,000 square feet of additional office space at their headquarters in Massachusetts. The sublease expires in October 2019, subject to an early termination option that may be exercised by the sublandlord, in which case the Company would be required to vacate the premises no later than November 2015.
Future minimum lease payments, as of December 31, 2011, are as follows (in thousands):
| Years Ending December 31 | ||||
| 2012 |
$ | 405 | ||
| 2013 |
991 | |||
| 2014 |
1,010 | |||
| 2015 |
1,029 | |||
| 2016 |
1,048 | |||
| Thereafter |
3,071 | |||
| Total minimum lease payments |
$ | 7,554 | ||
|
|
|
|||
The Company has evaluated subsequent events that occurred after December 31, 2011 through February 15, 2012 (March 1, 2012 as to the effects of the stock split described in Note 2), the date on which the financial statements for the year ended December 31, 2011 were issued.
F-28
Table of Contents
Table of Contents
Through and including , 2012 (the 25th day after the date of this prospectus), all dealers effecting transactions in these securities, whether or not participating in this offering, may be required to deliver a prospectus. This delivery requirement is in addition to the obligation of dealers to deliver a prospectus when acting as underwriters and with respect to their unsold allotments or subscriptions.
5,500,000 Shares
Demandware, Inc.
Common Stock
Goldman, Sachs & Co.
Deutsche Bank Securities
William Blair & Company
Oppenheimer & Co.
Canaccord Genuity
First Analysis Securities Corp.
Table of Contents
Part II
INFORMATION NOT REQUIRED IN PROSPECTUS
| Item 13. | Other Expenses of Issuance and Distribution. |
The following table indicates the expenses to be incurred in connection with the offering described in this registration statement, other than underwriting discounts and commissions, all of which will be paid by us. All amounts are estimated except the SEC registration fee, the Financial Industry Regulatory Authority, Inc., or FINRA, filing fee and the New York Stock Exchange listing fee.
| Amount | ||||
| SEC registration fee |
$ | 11,610 | ||
| FINRA filing fee |
10,500 | |||
| New York Stock Exchange listing fee |
155,000 | |||
| Accountants’ fees and expenses |
1,300,000 | |||
| Legal fees and expenses |
1,300,000 | |||
| Blue Sky fees and expenses |
10,000 | |||
| Transfer Agent’s fees and expenses |
20,000 | |||
| Printing and engraving expenses |
225,000 | |||
| Miscellaneous |
499,890 | |||
|
|
|
|||
| Total expenses |
$ | 3,532,000 | ||
|
|
|
|||
| Item 14. | Indemnification of Directors and Officers. |
Section 102 of the General Corporation Law of the State of Delaware permits a corporation to eliminate the personal liability of directors of a corporation to the corporation or its stockholders for monetary damages for a breach of fiduciary duty as a director, except where the director breached his duty of loyalty, failed to act in good faith, engaged in intentional misconduct or knowingly violated a law, authorized the payment of a dividend or approved a stock repurchase in violation of Delaware corporate law or obtained an improper personal benefit. Our amended and restated certificate of incorporation provides that no director of the Registrant shall be personally liable to it or its stockholders for monetary damages for any breach of fiduciary duty as a director, notwithstanding any provision of law imposing such liability, except to the extent that the General Corporation Law of the State of Delaware prohibits the elimination or limitation of liability of directors for breaches of fiduciary duty.
Section 145 of the General Corporation Law of the State of Delaware provides that a corporation has the power to indemnify a director, officer, employee, or agent of the corporation, or a person serving at the request of the corporation for another corporation, partnership, joint venture, trust or other enterprise in related capacities against expenses (including attorneys’ fees), judgments, fines and amounts paid in settlement actually and reasonably incurred by the person in connection with an action, suit or proceeding to which he was or is a party or is threatened to be made a party to any threatened, ending or completed action, suit or proceeding by reason of such position, if such person acted in good faith and in a manner he reasonably believed to be in or not opposed to the best interests of the corporation, and, in any criminal action or proceeding, had no reasonable cause to believe his conduct was unlawful, except that, in the case of actions brought by or in the right of the corporation, no indemnification shall be made with respect to any claim, issue or matter as to which such person shall have been adjudged to be liable to the corporation unless and only to the extent that the Court of Chancery or other adjudicating court determines that, despite the adjudication of liability but in view of all of the circumstances of the case, such person is fairly and reasonably entitled to indemnity for such expenses which the Court of Chancery or such other court shall deem proper.
II-1
Table of Contents
Our amended and restated certificate of incorporation provides that we will indemnify each person who was or is a party or threatened to be made a party to any threatened, pending or completed action, suit or proceeding (other than an action by or in the right of us) by reason of the fact that he or she is or was, or has agreed to become, a director or officer, or is or was serving, or has agreed to serve, at our request as a director, officer, partner, employee or trustee of, or in a similar capacity with, another corporation, partnership, joint venture, trust or other enterprise, all such persons being referred to as an “Indemnitee,” or by reason of any action alleged to have been taken or omitted in such capacity, against all expenses (including attorneys’ fees), judgments, fines and amounts paid in settlement actually and reasonably incurred in connection with such action, suit or proceeding and any appeal therefrom, if such Indemnitee acted in good faith and in a manner he or she reasonably believed to be in, or not opposed to, our best interests, and, with respect to any criminal action or proceeding, he or she had no reasonable cause to believe his or her conduct was unlawful. Our amended and restated certificate of incorporation provides that we will indemnify any Indemnitee who was or is a party to an action or suit by or in the right of us to procure a judgment in our favor by reason of the fact that the Indemnitee is or was, or has agreed to become, a director or officer, or is or was serving, or has agreed to serve, at our request as a director, officer, partner, employee or trustee of, or in a similar capacity with, another corporation, partnership, joint venture, trust or other enterprise, or by reason of any action alleged to have been taken or omitted in such capacity, against all expenses (including attorneys’ fees) and, to the extent permitted by law, amounts paid in settlement actually and reasonably incurred in connection with such action, suit or proceeding, and any appeal therefrom, if the Indemnitee acted in good faith and in a manner he or she reasonably believed to be in, or not opposed to, our best interests, except that no indemnification shall be made with respect to any claim, issue or matter as to which such person shall have been adjudged to be liable to us, unless a court determines that, despite such adjudication but in view of all of the circumstances, he or she is entitled to indemnification of such expenses. Notwithstanding the foregoing, to the extent that any Indemnitee has been successful, on the merits or otherwise, he or she will be indemnified by us against all expenses (including attorneys’ fees) actually and reasonably incurred in connection therewith. Expenses must be advanced to an Indemnitee under certain circumstances.
We have entered into indemnification agreements with our directors and executive officers. These indemnification agreements may require us, among other things, to indemnify each such director or officer for certain expenses, including attorneys’ fees, judgments, fines and settlement amounts, incurred by him in any action or proceeding arising out of his service as one of our directors or executive officers.
We maintain a general liability insurance policy that covers certain liabilities of directors and officers of our corporation arising out of claims based on acts or omissions in their capacities as directors or officers.
In any underwriting agreement we enter into in connection with the sale of common stock being registered hereby, the underwriters will agree to indemnify, under certain conditions, us, our directors, our officers and persons who control us within the meaning of the Securities Act, against certain liabilities.
| Item 15. | Recent Sales of Unregistered Securities. |
Set forth below is information regarding our issuances of capital stock and our grants of warrants and options to purchase shares of capital stock within the past three years. Also included is the consideration received by us for such shares, warrants and options and information relating to the section of the Securities Act, or rule of the SEC, under which exemption from registration was claimed.
II-2
Table of Contents
| (a) | Issuances of Capital Stock |
| • | On April 16, 2008, we issued an aggregate of 7,050,467 shares of our Series C convertible preferred stock to five accredited investors, all of which are either directors or holders of 5% of the outstanding capital stock of the company, at a purchase price of $1.299106 per share, for an aggregate consideration of $9.1 million in cash. |
| • | On April 13, 2009, March 16, 2010 and November 5, 2010, we issued and sold to six accredited investors, each of which is either a director or holder of 5% of the outstanding capital stock of the company, an aggregate of 17,242,628 shares of our Series D convertible preferred stock, at a purchase price of $1.299106 per share, for an aggregate consideration of $22.4 million in cash. |
| (b) | Warrants |
| • | On July 18, 2008, we issued a warrant to purchase up to 69,278 shares of our Series C convertible preferred stock at an exercise price of $1.30 per share to Silicon Valley Bank, in connection with our loan agreement. |
| (c) | Stock Option Grants |
| • | From the period beginning January 1, 2008 through January 31, 2012, we have granted stock options to purchase an aggregate of 4,767,039 shares of our Common Stock with exercise prices ranging from $0.93 to $8.43 per share, to employees, directors and consultants pursuant to the 2004 Stock Option and Grant Plan. During the same period, an aggregate of 2,675,700 shares have been issued upon the exercise of stock options for an aggregate consideration of $2.7 million. The shares of Common Stock issued upon exercise of options are deemed restricted securities for the purposes of the Securities Act. |
No underwriters were involved in the foregoing issuances of securities. The securities described in paragraphs (a) and (b) of this Item 15 were issued to accredited investors in reliance upon the exemption from the registration requirements of the Securities Act, as set forth in Section 4(2) under the Securities Act, relative to transactions by an issuer not involving any public offering, to the extent an exemption from such registration was required.
The issuances of stock options and the shares of common stock issuable upon the exercise of the options described in paragraph (c) of this Item 15 were issued pursuant to written compensatory plans or arrangements with our employees, directors and consultants, in reliance on the exemption provided by Rule 701 promulgated under the Securities Act, or pursuant to Section 4(2) under the Securities Act, relative to transactions by an issuer not involving any public offering, to the extent an exemption from such registration was required.
All of the foregoing securities are deemed restricted securities for purposes of the Securities Act. All certificates representing the issued shares of capital stock described in this Item 15 included appropriate legends setting forth that the securities have not been registered and the applicable restrictions on transfer.
| Item 16. | Exhibits and Financial Statement Schedules. |
| (a) | Exhibits. |
The exhibits to the registration statement of which this prospectus is a part are listed in the Exhibit Index attached hereto and incorporated by reference herein.
II-3
Table of Contents
No financial statement schedules have been submitted because they are not required or are not applicable or because the information required is included in the consolidated financial statements or the notes thereto.
| Item 17. | Undertakings. |
The undersigned registrant hereby undertakes to provide to the underwriter, at the closing specified in the underwriting agreement, certificates in such denominations and registered in such names as required by the underwriter to permit prompt delivery to each purchaser.
Insofar as indemnification for liabilities arising under the Securities Act may be permitted to directors, officers and controlling persons of the registrant pursuant to the foregoing provisions, or otherwise, the registrant has been advised that in the opinion of the SEC such indemnification is against public policy as expressed in the Securities Act and is, therefore, unenforceable. In the event that a claim for indemnification against such liabilities (other than the payment by the registrant of expenses incurred or paid by a director, officer or controlling person of the registrant in the successful defense of any action, suit or proceeding) is asserted by such director, officer or controlling person in connection with the securities being registered, the registrant will, unless in the opinion of its counsel the matter has been settled by controlling precedent, submit to a court of appropriate jurisdiction the question whether such indemnification by it is against public policy as expressed in the Securities Act and will be governed by the final adjudication of such issue.
The undersigned hereby undertakes that:
| (1) | For purposes of determining any liability under the Securities Act, the information omitted from the form of prospectus filed as part of this registration statement in reliance upon Rule 430A and contained in a form of prospectus filed by the registrant pursuant to Rule 424(b)(1) or (4) or 497(h) under the Securities Act shall be deemed to be part of this registration statement as of the time it was declared effective. |
| (2) | For the purpose of determining any liability under the Securities Act, each post-effective amendment that contains a form of prospectus shall be deemed to be a new registration statement relating to the securities offered therein, and the offering of such securities at that time shall be deemed to be the initial bona fide offering thereof. |
| (3) | For the purpose of determining liability under the Securities Act to any purchaser, each prospectus filed pursuant to Rule 424(b) as part of a registration statement relating to an offering, other than registration statements relying on Rule 430B or other than prospectuses filed in reliance on Rule 430A, shall be deemed to be part of and included in the registration statement as of the date it is first used after effectiveness. Provided, however, that no statement made in a registration statement or prospectus that is part of the registration statement or made in a document incorporated or deemed incorporated by reference into the registration statement or prospectus that is part of the registration statement will, as to a purchaser with a time of contract of sale prior to such first use, supersede or modify any statement that was made in the registration statement or prospectus that was part of the registration statement or made in any such document immediately prior to such date of first use. |
| (4) | In a primary offering of securities of the undersigned registrant pursuant to this registration statement, regardless of the underwriting method used to sell the securities to the purchaser, if the securities are offered or sold to such purchaser by means of any of the following communications, the undersigned registrant will be a seller to the purchaser and will be considered to offer or sell such securities to such purchaser: |
| (i) | Any preliminary prospectus or prospectus of the undersigned registrant relating to the offering required to be filed pursuant to Rule 424; |
II-4
Table of Contents
| (ii) | Any free writing prospectus relating to the offering prepared by or on behalf of the undersigned registrant or used or referred to by the undersigned registrant; |
| (iii) | The portion of any other free writing prospectus relating to the offering containing material information about the undersigned registrant or its securities provided by or on behalf of the undersigned registrant; and |
| (iv) | Any other communication that is an offer in the offering made by the undersigned registrant to the purchaser. |
II-5
Table of Contents
SIGNATURES
Pursuant to the requirements of the Securities Act, the registrant has duly caused this registration statement to be signed on its behalf by the undersigned, thereunto duly authorized, in the Town of Burlington, Commonwealth of Massachusetts, on this 1st day of March, 2012.
| DEMANDWARE, INC. | ||
| By: |
/S/ THOMAS D. EBLING | |
| Thomas D. Ebling | ||
| President and Chief Executive Officer | ||
Pursuant to the requirements of the Securities Act of 1933, this Registration Statement has been signed by the following persons in the capacities held on the dates indicated.
| Signature |
Title |
Date | ||
| /S/ THOMAS D. EBLING Thomas D. Ebling |
President, Chief Executive Officer and Director (principal executive officer) |
March 1, 2012 | ||
| /S/ SCOTT J. DUSSAULT Scott J. Dussault |
Chief Financial Officer (principal financial and accounting officer) |
March 1, 2012 | ||
| * Lawrence S. Bohn |
Director |
March 1, 2012 | ||
| * Jill Granoff |
Director |
March 1, 2012 | ||
| * Charles F. Kane |
Director |
March 1, 2012 | ||
| * Jitendra Saxena |
Director |
March 1, 2012 | ||
| * Stephan Schambach |
Chairman of the Board |
March 1, 2012 | ||
| * Michael J. Skok |
Director |
March 1, 2012 | ||
| *By: |
/s/ SCOTT J. DUSSAULT | |
| Scott J. Dussault Attorney-in-Fact | ||
II-6
Table of Contents
Exhibit Index
| 1.1+ | Underwriting Agreement | |
| 3.1+ | Fifth Amended and Restated Certificate of Incorporation of the Registrant, as amended and currently in effect | |
| 3.2+ | Form of Amended and Restated Certificate of Incorporation of the Registrant, to be filed upon the closing of this offering | |
| 3.3+ | By-laws of the Registrant, as amended and currently in effect | |
| 3.4+ | Form of Amended and Restated By-laws of the Registrant, effective upon the closing of this offering | |
| 3.5 | Form of Certificate of Amendment of the Fifth Amended and Restated Certificate of Incorporation of the Registrant, as amended, as filed with the Secretary of State of the State of Delaware on March 1, 2012 | |
| 4.1+ | Specimen Stock Certificate evidencing the shares of common stock | |
| 5.1 | Opinion of Wilmer Cutler Pickering Hale and Dorr LLP | |
| 10.1+ | 2004 Stock Option and Grant Plan, as amended | |
| 10.2+ | Form of Non-Qualified Stock Option Agreement under the 2004 Stock Option and Grant Plan | |
| 10.3+ | 2012 Stock Incentive Plan, effective upon the closing of this offering | |
| 10.4+ | Form of Incentive Stock Option Agreement under the 2012 Stock Incentive Plan | |
| 10.5+ | Form of Nonstatutory Stock Option Agreement under the 2012 Stock Incentive Plan | |
| 10.6+ | Third Amended and Restated Investor Rights Agreement, dated April 13, 2009, between the Registrant and the stockholders set forth therein | |
| 10.7+ | Warrant to purchase Series C convertible preferred stock issued to Silicon Valley Bank on July 18, 2008 | |
| 10.8+ | Letter Agreement, dated February 11, 2010, between the Registrant and Thomas D. Ebling | |
| 10.9+ | Incentive Stock Option Agreement, dated February 11, 2010, between the Registrant and Thomas D. Ebling | |
| 10.10+ | Letter Agreement between the Registrant and Scott J. Dussault related to Mr. Dussault’s services to the Registrant | |
| 10.11+ | Agreements between the Registrant and Wayne R. Whitcomb relating to the Promissory Note issued by the Registrant on May 6, 2005, as amended by Amendment No. 1, dated November 30, 2009 | |
| 10.12+ | Restricted Stock Agreement, dated May 6, 2005, between the Registrant and Wayne R. Whitcomb | |
| 10.13+ | Letter Agreement between the Registrant and Wayne R. Whitcomb related to Mr. Whitcomb’s services to the Registrant | |
| 10.14+ | Letter Agreement, dated February 14, 2007, between the Registrant and Stephan Schambach | |
| 10.15+ | Letter Agreement, dated July 29, 2010, between the Registrant and Stephan Schambach | |
| 10.16+ | Letter Agreements between the Registrant and Jeffrey G. Barnett related to Mr. Barnett’s services to the Registrant | |
| 10.17 | Form of indemnification agreement entered into by the Registrant with each of its directors and executive officers in February 2012 | |
| 10.18+ | Loan and Security Agreement, dated July 18, 2008, between the Registrant and Silicon Valley Bank, as amended on December 23, 2008, June 26, 2009, March 2, 2010, April 28, 2010, June 23, 2011 and August 12, 2011 | |
| 10.19+ | Lease Agreement, dated May 28, 2010, between Registrant and Burlington Office Park V Limited Partnership | |
| 10.20†+ | Master Subscription Agreement, dated June 2, 2008, between the Registrant and neckermann.de GmbH, as amended on March 26, 2009, May 21, 2010 and March 2, 2011 | |
| 10.21+ | 2011 Sales Compensation Plan | |
| 10.22+ | Form of Restricted Stock Agreement under the 2012 Stock Incentive Plan | |
| 10.23 | 2012 Executive Incentive Compensation Program | |
| 21.1+ | Subsidiaries of the Registrant | |
| 23.1 | Consent of Deloitte & Touche LLP | |
| 23.2* | Consent of Wilmer Cutler Pickering Hale and Dorr LLP (included in Exhibit 5.1) | |
| 24.1+ | Powers of Attorney of Lawrence S. Bohn, Charles F. Kane, Jitendra Saxena, Stephan Schambach and Michael J. Skok | |
| 24.2+ | Power of Attorney of Jill Granoff | |
| * | To be filed by amendment. |
| † | Confidential treatment requested as to certain portions, which portions have been omitted and filed separately with the Securities and Exchange Commission. |
| + | Previously filed. |