Attached files
| file | filename |
|---|---|
| EX-21 - EX-21 - O CHARLEYS INC | d280193dex21.htm |
| EX-23 - EX-23 - O CHARLEYS INC | d280193dex23.htm |
| EX-32.2 - EX-32.2 - O CHARLEYS INC | d280193dex322.htm |
| EX-32.1 - EX-32.1 - O CHARLEYS INC | d280193dex321.htm |
| EX-31.1 - EX-31.1 - O CHARLEYS INC | d280193dex311.htm |
| EX-10.28 - EX-10.28 - O CHARLEYS INC | d280193dex1028.htm |
| EX-10.36 - EX-10.36 - O CHARLEYS INC | d280193dex1036.htm |
| EXCEL - IDEA: XBRL DOCUMENT - O CHARLEYS INC | Financial_Report.xls |
| EX-31.2 - EX-31.2 - O CHARLEYS INC | d280193dex312.htm |
Table of Contents
UNITED STATES
SECURITIES AND EXCHANGE COMMISSION
Washington, D.C. 20549
FORM 10-K
| x | ANNUAL REPORT PURSUANT TO SECTION 13 OR 15(d) OF THE SECURITIES EXCHANGE ACT OF 1934 |
For the fiscal year ended December 25, 2011
Commission file number 0-18629
O’CHARLEY’S INC.
(Exact name of registrant as specified in its charter)
| Tennessee | 62-1192475 | |
| (State or other jurisdiction of incorporation or organization) |
(I.R.S. Employer Identification No.) | |
| 3038 Sidco Drive Nashville, Tennessee |
37204 | |
| (Address of principal executive offices) | (Zip Code) | |
| Registrant’s telephone number, including area code: | (615) 256-8500 | |
| Securities registered pursuant to Section 12(b) of the Act: | Common Stock, no par | |
| Name of each exchange on which registered | NASDAQ Global Select Market | |
| Securities registered pursuant to Section 12(g) of the Act: | None | |
Indicate by check mark if the registrant is a well-known seasoned issuer, as defined in Rule 405 of the Securities Act. Yes ¨ No x
Indicate by check mark if the registrant is not required to file reports pursuant to Section 13 or Section 15(d) of the Act. Yes ¨ No x
Indicate by check mark whether the registrant (1) has filed all reports required to be filed by Section 13 or 15(d) of the Securities Exchange Act of 1934 during the preceding 12 months (or for such shorter period that the registrant was required to file such reports), and (2) has been subject to such filing requirements for the past 90 days. Yes x No ¨
Indicate by check mark whether the registrant has submitted electronically and posted on its corporate Web site, if any, every Interactive Data File required to be submitted and posted pursuant to Rule 405 of Regulation S-T during the preceding 12 months (or for such shorter period that the registrant was required to submit and post such files). Yes x No ¨
Indicate by check mark if disclosure of delinquent filers pursuant to Item 405 of Regulation S-K is not contained herein, and will not be contained, to the best of the registrant’s knowledge, in definitive proxy or information statements incorporated by reference in Part III of this Form 10-K or any amendment to this Form 10-K. ¨
Indicate by check mark whether the registrant is a large accelerated filer, an accelerated filer, a non-accelerated filer or a smaller reporting company. See the definitions of “large accelerated filer,” “accelerated filer” and “smaller reporting company” in Rule 12b-2 of the Exchange Act.
| Large accelerated filer | ¨ | Accelerated filer | x | |||
| Non-accelerated filer | ¨ (Do not check if a smaller reporting company) | Smaller reporting company | ¨ | |||
Indicate by check mark whether the registrant is a shell company (as defined in Rule 12b-2 of the Act). Yes ¨ No x
The aggregate market value of the voting stock held by non-affiliates of the registrant as of the last business day of the registrant’s most recently completed second fiscal quarter was approximately $121.7 million. For purposes of this calculation, shares held by non-affiliates excludes only those shares beneficially owned by officers, directors and shareholders beneficially owning 10% or more of the outstanding common stock.
The number of shares of common stock outstanding on February 24, 2012 was 21,947,706.
Table of Contents
| 3 | ||||
| 3 | ||||
| 13 | ||||
| 20 | ||||
| 21 | ||||
| 21 | ||||
| 22 | ||||
| 23 | ||||
| 23 | ||||
| 26 | ||||
| Item 7. Management’s Discussion and Analysis of Financial Condition and Results of Operations |
28 | |||
| Item 7A. Quantitative and Qualitative Disclosures About Market Risk |
46 | |||
| 47 | ||||
| Item 9. Changes in and Disagreements with Accountants on Accounting and Financial Disclosure |
75 | |||
| 75 | ||||
| 78 | ||||
| 78 | ||||
| Item 10. Directors, Executive Officers and Corporate Governance |
78 | |||
| 81 | ||||
| 99 | ||||
| Item 13. Certain Relationships and Related Transactions, and Director Independence |
102 | |||
| 103 | ||||
| 105 | ||||
| 105 | ||||
| 110 | ||||
| EX-10.28 Summary of Director and Executive Officer Compensation |
||||
| EX-10.36 Executive Employment Agreement of Marc A. Buehler |
||||
| EX-21 Subsidiaries of the Company |
||||
| EX-23 Consent of KPMG LLP |
||||
| EX-31.1 Section 302 Certification of the Chief Executive Officer |
||||
| EX-31.2 Section 302 Certification of the Chief Financial Officer |
||||
| EX-32.1 Section 906 Certification of the Chief Executive Officer |
||||
| EX-32.2 Section 906 Certification of the Chief Financial Officer |
2
Table of Contents
O’CHARLEY’S INC.
| Item 1. | Business. |
We are a multi-concept restaurant company headquartered in Nashville, Tennessee. We own and operate three restaurant concepts under the “O’Charley’s,” “Ninety Nine” and “Stoney River Legendary Steaks” trade names. As of December 25, 2011, we operated 221 O’Charley’s company-owned restaurants in 17 states in the East, Southeast and Midwest, 105 Ninety Nine restaurants in seven states throughout New England and upstate New York, and 10 Stoney River restaurants in six states in the East, Southeast and Midwest. As of December 25, 2011, we had six franchised O’Charley’s restaurants in four states in the Southeast and Midwest.
The following description of our business should be read in conjunction with the information in Item 7 of this Form 10-K under the caption “Management’s Discussion and Analysis of Financial Condition and Results of Operations” and Item 8 “Financial Statements and Supplementary Data” of this Form 10-K. References made herein to “we,” “our,” “us,” or the “Company” refer to O’Charley’s Inc. and its direct and indirect subsidiaries.
Proposed Acquisition of Our Company
On February 5, 2012, we entered into an Agreement and Plan of Merger (the “Merger Agreement”) with Fidelity National Financial, Inc., a Delaware corporation (“FNF”), and Fred Merger Sub Inc. (“Merger Sub”), a Tennessee corporation and an indirect, wholly-owned subsidiary of FNF, pursuant to which FNF, through Merger Sub, agreed to commence a tender offer (the “Offer”) to acquire all of our outstanding shares of common stock, no par value per share (the “Shares”), for $9.85 per Share, net to the seller thereof in cash (the “Offer Price”), without interest and subject to any required withholding of taxes. The Offer commenced on February 27, 2012.
Completion of the Offer is subject to the satisfaction or waiver of a number of conditions set forth in the Merger Agreement, including (i) that the number of Shares validly tendered and not validly withdrawn, together with any Shares then owned by FNF and its affiliates, equals at least a majority of the Shares outstanding as of the expiration of the Offer on a fully-diluted basis, (ii) the expiration or termination of any applicable waiting period under the Hart-Scott-Rodino Antitrust Improvements Act of 1976, as amended, and certain other antitrust laws, (iii) the absence of a material adverse effect on the Company and (iv) certain other customary conditions.
The Merger Agreement also provides that after consummation of the Offer and subject to statutory waiting periods and the satisfaction or waiver of certain conditions set forth in the Merger Agreement, Merger Sub will merge with and into the Company (the “Merger”) and the Company will become an indirect, wholly-owned subsidiary of FNF. In the Merger, each Share that was not tendered pursuant to the Offer, other than Shares owned by the Company, FNF or Merger Sub or by a wholly-owned subsidiary of the Company or FNF, will be converted into the right to receive cash in an amount equal to the Offer Price, subject to any required withholding of taxes and without interest.
If Merger Sub holds at least 90% of the outstanding Shares immediately prior to the Merger, Merger Sub may effect the Merger as a short-form merger without additional approval by the Company’s shareholders. Otherwise, we would hold a special shareholders’ meeting to obtain shareholder approval of the Merger. Subject to the terms of the Merger Agreement, applicable laws and the number of authorized Shares available under our charter, we have granted to FNF and/or Merger Sub an irrevocable right (the “Top-Up Option”), exercisable following consummation of the Offer, if necessary, to purchase from us, at a price per share equal to the Offer Price, up to that number of newly issued Shares so that FNF, its subsidiaries and Merger Sub own one share more than 90% of the Shares then outstanding on a fully-diluted basis after giving effect to the Top-Up Option.
We are permitted to solicit inquiries or engage in discussions with third parties relating to “acquisition proposals” (as defined in the Merger Agreement) for a 30-day “go-shop” period ending March 6, 2012, and with certain parties who make written competing proposals during the “go-shop” period (each, an “Excluded Party”). After such period, we may not solicit or initiate discussions with third parties regarding other proposals to acquire the Company and have agreed to certain restrictions on our ability to respond to such proposals, subject to the fulfillment of certain fiduciary duties of our board of directors.
3
Table of Contents
The Merger Agreement can be terminated by us or FNF under certain circumstances. If terminated, we must pay FNF a termination fee under certain circumstances, which fee will be either $6.74 million or $3.37 million depending on the circumstances giving rise to payment of the termination fee.
Our Restaurant Concepts
O’Charley’s
We acquired the original O’Charley’s restaurant in Nashville, Tennessee in May 1984. O’Charley’s is a casual-dining restaurant concept whose strategy is to differentiate its restaurants by serving high-quality, freshly prepared food at moderate prices and with genuinely friendly and attentive guest service. O’Charley’s restaurants are intended to appeal to a broad spectrum of guests from a diverse income base with varying family composition.
The O’Charley’s menu features a variety of items, including hand-cut and aged steaks, baby-back ribs basted with a sweet, smoky BBQ sauce, slow roasted prime rib, fresh-never-frozen Atlantic salmon, hand breaded chicken tenders, freshly made salads with O’Charley’s special recipe salad dressings and O’Charley’s signature caramel pie. All entrées are cooked to order and feature a selection of side items in addition to our hot, freshly baked yeast rolls. We believe the large number of freshly prepared items on the O’Charley’s menu helps differentiate our O’Charley’s concept from other casual-dining restaurants.
O’Charley’s restaurants are open seven days a week, serve lunch, dinner and Sunday brunch and offer full bar service. Specialty menu items include seasonal promotions, O’Charley’s lunch and dinner combos and a special kids menu. We are continually developing new menu items for our O’Charley’s restaurants to respond to changing guest tastes and preferences. Lunch entrées start at $5.99, with dinner entrées ranging from $7.99 to $18.79. The average check per guest, including beverages, was $12.64 in 2011, $12.43 in 2010 and $12.85 in 2009.
We seek to create a casual, neighborhood atmosphere in our O’Charley’s restaurants through an open layout and by tailoring the decor of our restaurants to the local community. The interior typically is open, casual and well lighted. Additionally, the interior features warm woods, exposed brick and hand-painted murals depicting local history, people, places and events. The prototypical O’Charley’s restaurant is a free-standing building of approximately 6,000 square feet with seating for 225 guests, including 17 bar seats. We did not open any new restaurants during 2011 and do not plan to open any new restaurants during 2012.
Ninety Nine
In January 2003, we acquired Ninety Nine Restaurants (“Ninety Nine”), a Woburn, Massachusetts-based casual-dining concept that began in 1952 with its initial location at 99 State Street in downtown Boston, Massachusetts. Ninety Nine restaurants are casual-dining restaurants that we believe have earned a reputation as friendly, comfortable places to gather and enjoy great American food and drink at a reasonable price. Ninety Nine restaurants are intended to appeal to mainstream casual-dining and value-oriented guests. The Ninety Nine menu features a wide selection of appetizers, soups, salads, sandwiches, burgers, beef, chicken and seafood entrées and desserts. Ninety Nine restaurants offer full bar service, including a wide selection of imported and domestic beers, wines and specialty drinks.
Ninety Nine restaurants are open seven days a week and serve lunch and dinner. Lunch entrées start at $5.99, with dinner entrées ranging from $7.99 to $18.99. The average check per guest, including beverages, was $14.79 in 2011, $14.59 in 2010 and $14.62 in 2009.
Ninety Nine restaurants seek to provide a warm and friendly neighborhood pub atmosphere. Signature elements of the prototypical Ninety Nine restaurant include an open view kitchen, booth seating and a centrally located rectangular bar. The prototypical Ninety Nine restaurant is a free-standing building of approximately 6,300 square feet with seating for 190 guests, including 30 bar seats. Ninety Nine has historically grown through remodeling traditional and non-traditional restaurant locations as well as through developing new restaurants in the style of our prototype restaurant. We did not open any new restaurants during 2011 and do not plan to open any new restaurants during 2012.
Stoney River Legendary Steaks
We acquired Stoney River Legendary Steaks (“Stoney River”) in May 2000. Stoney River restaurants are steakhouses that appeal to both upscale casual-dining and fine-dining guests by offering the high-quality food and attentive guest service typical of high-end steakhouses at more moderate prices. Stoney River restaurants have an upscale “mountain lodge” design with a large stone fireplace and rich woods that are intended to make the interior of the
4
Table of Contents
restaurant inviting and comfortable. While Stoney River has both free-standing and in-line footprints, the average restaurants have 7,500 square feet with seating for 275 guests including 25 bar seats. During 2009 and 2010, we repositioned Stoney River to provide the same great guest experience with lower menu prices, new menu offerings, and a new menu format. This repositioning included reduced prices of certain menu offerings, the addition of new menu items to appeal to the upscale casual-dining guests and an improved and more price conscious wine list. The Stoney River menu features several offerings of premium Midwestern beef, fresh seafood and a variety of other gourmet entrées. An extensive assortment of freshly prepared salads, side dishes, several specialty appetizers and desserts are also available. Stoney River restaurants offer full bar service, including an extensive selection of wines. The dinner price range of entrées is $12.99 to $33.99. The average check per guest, including beverages, was $35.90 in 2011, $36.97 in 2010, and $41.22 in 2009. We did not open any new restaurants during 2011 and do not plan to open any new restaurants during 2012.
Support Operations
Supply Chain Management. Our supply chain management process offers a systematic approach to managing the acquisition of goods and services that achieves the lowest total cost of ownership and matches internal customers’ needs with marketplace capabilities. The supply chain team focuses on three key areas: strategic sourcing, quality assurance and supply chain operations. Descriptions of these functions are as follows:
| • | Strategic sourcing: manages and facilitates enterprise-wide sourcing activities, including the development of sourcing strategies, supplier negotiation and selection, and supplier performance management for specified expenditure areas. |
| • | Quality assurance: designs, implements, and measures strategic programs for both quality assurance and food safety that ensures we achieve, sustain, and continue to improve best of class programs for food quality and food safety for all our concepts. |
| • | Supply chain operations: ensures uninterrupted, timely flow of goods to our concepts and monitors compliance with all sourcing and distribution agreements. |
Human Resources. We maintain a human resources department that supports restaurant operations and our home office through the design and implementation of policies, programs, procedures and benefits for our team members. The human resources department is responsible for all customary human resource and compensation functions, including hiring, on-boarding, benefits and team member relations (including use of the Open Door Policy, a confidential toll free 800 number, and an alternative dispute resolution process), and the design and implementation of team member compensation policies and practices. The human resources department is also responsible for all training and development of new hourly team members and managers, as well as new product rollouts and the continuing training and development of the restaurant teams.
Guest Relations. Our guests’ perceptions and experiences are measured through the Guest Satisfaction Index (“GSI”). GSI is a survey-based tool designed to measure guest satisfaction levels at each O’Charley’s, Ninety Nine, and Stoney River restaurant, providing immediate feedback to all levels of the organization. Guests are issued an invitation on a random basis through our point-of-sale system to take a telephone survey or an internet survey. Primary focus is placed on identification and improvement of primary drivers of a highly satisfied guest experience. Our ability to continuously monitor service levels and guest satisfaction at the restaurant level, while providing guests with a convenient, brief, unbiased, and user-friendly way to share their comments, allows us to focus on converting satisfied guests to highly satisfied or loyal guests. In addition to measuring and communicating guest satisfaction results, our guest relations team receives and responds as applicable to direct calls, written correspondence and social media feedback from O’Charley’s, Ninety Nine, and Stoney River guests.
Advertising and Marketing. We have an ongoing advertising and marketing plan for each of our restaurant concepts that utilizes some combination of television, radio, internet, outdoor and print advertising. We also support our restaurants with point of purchase materials, menus and local restaurant marketing programs. We focus our marketing efforts on value offerings and new product promotions, the quality and freshness of our products, and the overall guest experience. We conduct or subscribe to studies of food trends, changes in guest tastes and preferences and are continually evaluating the quality of our menu offerings. In addition to advertising, we encourage restaurant level team members to become active in their communities through local charities and other organizations and sponsorships.
Restaurant Reporting and Back-Office Support. Our use of technology and management information systems is essential for the management oversight needed to improve our operating results. We maintain theoretical food, labor, and
5
Table of Contents
beverage cost systems in each of our restaurants through which we closely monitor and control restaurant operating costs. We also maintain operational and financial controls in each restaurant, including management information systems that monitor sales, inventory, and labor and that provide reports and data to our home office. The management accounting system polls data from our restaurants and generates periodic reports of sales, sales mix, guest counts, average check, cash, labor and food cost. Management utilizes this data to monitor the effectiveness of controls and to prepare periodic financial and management reports. We also utilize these systems for financial and budgetary analysis, including analyses of sales by restaurant, product mix and labor utilization. Our internal audit department audits a sample of our restaurants to measure compliance within our operational systems, procedures and controls. Our back office systems and processes are designed to consolidate and integrate our accounting functions. In addition, a centralized call line is available to restaurant management for questions, comments and problem resolution relating to their financial reports or employee benefits. We believe having a consolidated accounting function for our three concepts provides a structure that creates consistency and provides more centralized control over our accounting and financial reporting function while also promoting continuous process improvement and savings.
6
Table of Contents
Restaurant Locations
The following table sets forth the markets in which our company-owned O’Charley’s, Ninety Nine and Stoney River restaurants were located at December 25, 2011, including the number of restaurants in each market.
O’Charley’s Restaurants
| Alabama (18) |
Kentucky (20) | Ohio (19) | ||
| Birmingham (5) | Ashland | Cincinnati (8) | ||
| Decatur | Bowling Green | Cleveland | ||
| Dothan | Cold Spring | Columbus (7) | ||
| Florence | Danville | Dayton (3) | ||
| Guntersville | Elizabethtown | |||
| Huntsville | Florence | South Carolina (11) | ||
| Mobile (4) | Frankfort | Aiken | ||
| Montgomery | Hopkinsville | Anderson | ||
| Opelika | Lexington (4) | Charleston (2) | ||
| Oxford | Louisville (5) | Columbia (2) | ||
| Tuscaloosa | Owensboro | Greenwood | ||
| Paducah | Rock Hill | |||
| Arkansas (1) | Richmond | Simpsonville | ||
| Jonesboro | Spartanburg | |||
| Louisiana (3) | Summerville | |||
| Florida (4) | Lafayette | |||
| Jacksonville (2) | Lake Charles | Tennessee (39) | ||
| Panama City | Monroe | Chattanooga (2) | ||
| Pensacola | Clarksville (2) | |||
| Mississippi (8) | Cleveland | |||
| Georgia (28) | Gulfport | Columbia | ||
| Atlanta (20) | Hattiesburg | Cookeville | ||
| Augusta | Meridian | Dickson | ||
| Columbus | Olive Branch | Jackson | ||
| Dalton | Pearl | Johnson City | ||
| Ft. Oglethorpe | Ridgeland | Kingsport | ||
| Gainesville | Southaven | Knoxville (5) | ||
| Griffin | Tupelo | Manchester | ||
| Macon (2) | Memphis (4) | |||
| Missouri (8) | Morristown | |||
| Illinois (5) | Cape Girardeau | Murfreesboro (2) | ||
| Champaign | St. Louis (7) | Nashville (12) | ||
| Marion | Pigeon Forge | |||
| O’Fallon | North Carolina (21) | Spring Hill | ||
| Springfield (2) | Asheville | Springfield | ||
| Burlington | ||||
| Indiana (21) | Charlotte (7) | Virginia (12) | ||
| Bloomington | Fayetteville | Bristol | ||
| Clarksville | Greensboro | Fredericksburg | ||
| Corydon | Greenville | Harrisonburg | ||
| Evansville (2) | Hendersonville | Lynchburg | ||
| Fort Wayne (2) | Hickory | Roanoke (2) | ||
| Greenfield | Jacksonville | Richmond (6) | ||
| Indianapolis (11) | Raleigh (2) | |||
| Lafayette | Wake Forest | West Virginia (2) | ||
| Richmond | Wilmington | Charleston (2) | ||
| Winston-Salem (2) | ||||
| Wisconsin (1) | ||||
| Grand Chute |
7
Table of Contents
Ninety Nine Restaurants
| Connecticut (11) | New Hampshire (13) | Massachusetts (61) | ||
| Dayville | Concord | Auburn | ||
| Enfield | Dover | Boston (36) | ||
| Groton | Hooksett | Centerville | ||
| Hartford (4) | Littleton | Chicopee | ||
| New Haven | Londonderry | Fairhaven | ||
| Norwich | Manchester | Fall River | ||
| Stratford | Nashua | Fitchburg | ||
| Torrington | North Conway | Franklin | ||
| Portsmouth | Greenfield | |||
| Maine (5) | Salem | Holyoke | ||
| Auburn | Seabrook | Marlboro | ||
| Augusta | Tilton | Mashpee | ||
| Bangor | West Lebanon | North Attleboro | ||
| Portland (2) | North Dartmouth | |||
| New York (9) | Pittsfield | |||
| Rhode Island (3) | Albany (2) | Plymouth | ||
| Cranston | Clifton Park | Seekonk | ||
| Newport | Kingston | Springfield (4) | ||
| Westerly | Plattsburgh | Tewksbury | ||
| Queensbury | West Yarmouth | |||
| Vermont (3) | Rotterdam | Worcester (3) | ||
| Brattleboro | Saratoga Springs | |||
| Rutland | Utica | |||
| Williston |
Stoney River Restaurants
| Georgia (3) |
Kentucky (1) | Maryland (2) | Missouri (1) | |||
| Atlanta (3) | Louisville | Annapolis | St. Louis | |||
| Towson | ||||||
| Illinois (1) | Tennessee (2) | |||||
| Chicago | Nashville (2) |
In addition to the above company-owned locations, the table below sets forth our franchised locations as of December 25, 2011.
Franchised Restaurants (O’Charley’s Restaurants)
| Florida (1) |
Ohio (3) | Pennsylvania (1) | ||
| Orlando | Boardman | Erie | ||
| Cuyahoga Falls | ||||
| Niles | Tennessee (1) | |||
| Nashville |
8
Table of Contents
Franchising
We have entered into exclusive multi-unit development agreements with third-party franchisees to open and operate O’Charley’s restaurants. Franchisees are required to comply with our specifications as to restaurant space, design and décor, menu items, principal food ingredients, team member training and day-to-day operations. The following table illustrates the current agreements that we have with our franchisees along with the contracted markets and the number of restaurants operated by each franchisee as of December 25, 2011:
| Franchise Entity |
Open Restaurants |
Markets | ||
| O’Candall Group, Inc. | 5 | Tampa and Orlando Florida, Western Pennsylvania, Northwest West Virginia and Northern Ohio | ||
| Delaware North Companies Travel Hospitality Services | 1 | Tennessee (Nashville International Airport) | ||
Competition
The restaurant industry is extremely competitive. Restaurants compete across numerous areas, including food quality, price, service quality, location, design, and attractiveness. To remain competitive, we must constantly monitor changing consumer tastes, national and regional economic conditions, the effectiveness of our advertising and many other factors. We compete within each market with national and regional chains and locally-owned restaurants for customers, management and hourly personnel and suitable locations. We also face growing competition from the supermarket industry, which offers “convenient meals” in the form of improved entrées and side dishes. We expect intense competition to continue in these areas.
Service Marks
The name “O’Charley’s” and its logo, the name “Stoney River Legendary Steaks,” and the Ninety Nine restaurants logo are registered service marks with the United States Patent and Trademark Office. We also have other service marks that are registered in the states in which we operate. We are aware of names and marks similar to our service marks used by third parties in certain geographical areas. Use of our service marks by third parties may prevent us from licensing the use of our service marks for restaurants in those areas. We intend to protect our service marks by appropriate legal action whenever we deem it appropriate and necessary.
Government Regulation
We are subject to various federal, state and local laws affecting our business. In addition, each of our restaurants are subject to licensing and regulation by a number of governmental authorities, which may include alcoholic beverage control, health, safety, sanitation, building and fire agencies in the state or municipality in which the restaurant is located. Most municipalities in which our restaurants are located require local business licenses. We are also subject to federal and state environmental regulations, but those regulations have not had a material effect on our operations to date.
Approximately 11.6 percent of restaurant sales in 2011 were attributable to the sale of alcoholic beverages. Each restaurant, where permitted by local law, has appropriate licenses from regulatory authorities allowing it to sell liquor, beer and wine, and in some states or localities, to provide service for extended hours and on Sunday. In addition, the Patient Protection and Affordable Care Act (“PPACA”) will require, effective January 1, 2014, that chain restaurants with 20 or more locations display caloric content on their menus. Also, some states require, or are considering requiring, us to disclose nutritional information on our menus. Each restaurant has food service licenses from local health authorities. The failure of a restaurant to obtain or retain liquor or food service licenses could adversely affect its operations or, in an extreme case, cause us to close the restaurant. We have established standardized procedures for our restaurants designed to assure compliance with applicable codes and regulations.
9
Table of Contents
We are subject, in most states in which we operate restaurants, to “dram-shop” statutes or judicial interpretations, which generally provide a person injured by an intoxicated person the right to recover damages from an establishment that wrongfully served alcoholic beverages to the intoxicated person.
The federal Americans with Disabilities Act prohibits discrimination on the basis of disability in public accommodations and employment. We design our restaurants to be accessible to the disabled and believe that we are in substantial compliance with all current applicable regulations relating to restaurant accommodations for the disabled.
The development and construction of our restaurants are subject to compliance with applicable zoning, land use and environmental regulations. Our restaurant operations are also subject to federal and state minimum wage laws and other laws governing matters such as working conditions, citizenship requirements, overtime and tip credits. In the event a proposal is adopted that materially increases the applicable minimum wage or changes the allowable tip credit, any such changes would likely result in an increase in payroll and benefits expense.
Seasonality
Our sales volumes fluctuate seasonally. Our first fiscal quarter is a 16-week quarter, while our second through fourth fiscal quarters are each 12 weeks. Historically, average weekly sales per restaurant are higher in the first quarter than in subsequent quarters, and we typically generate a disproportionate share of our income from operations in the first quarter. Holidays, severe weather and other disruptive conditions may impact sales volumes seasonally in some operating regions. Because of the seasonality of our business, results for any quarter are not necessarily indicative of the results that may be achieved for the full fiscal year.
Purchasing
Our ability to maintain consistent quality throughout each of our restaurant concepts depends upon acquiring products from reliable sources. Our pre-approved suppliers and our restaurants are required to adhere to strict product and safety specifications established through our quality assurance and culinary programs. These requirements ensure that high-quality products are served in each of our restaurants. We strategically negotiate directly with major suppliers to obtain competitive prices. We also use purchase commitment contracts when appropriate to stabilize the potentially volatile pricing of certain commodity items. All essential products are available from pre-qualified distributors to be delivered to any of our restaurant locations. Additionally, as a purchaser of a variety of protein products, we require our vendors to adhere to humane processing standards for their respective industries and encourage them to evaluate new technologies for food safety and humane processing improvements. Because of the relatively rapid turnover of perishable food products, inventories in the restaurants, consisting primarily of food, beverages and supplies, have a modest aggregate dollar value in relation to revenues.
Team Members
As of December 25, 2011, we employed approximately 21,000 team members, approximately 19,000 of whom represented our hourly workforce within our restaurants. None of our team members are covered by a collective bargaining agreement. We have an alternative dispute resolution program in which all team members are required to participate as a condition of employment. We consider our team member relations to be good.
10
Table of Contents
Executive Officers of the Registrant
Our executive officers are elected by the board of directors and serve at the pleasure of the board of directors. The following table sets forth certain information regarding our executive officers.
| Name |
Age |
Position | ||
| David W. Head | 55 | Chief Executive Officer and President | ||
| R. Jeffrey Williams | 45 | Chief Financial Officer and Treasurer | ||
| Marc A. Buehler | 41 | Concept President-O’Charley’s | ||
| John R. Grady | 59 | Concept President-Ninety Nine Restaurants | ||
| Alfred L. Thimm, Jr. | 52 | Concept President-Stoney River Legendary Steaks | ||
| Colin M. Daly | 40 | General Counsel, Secretary and Compliance Officer | ||
| Lawrence D. Taylor | 53 | Chief Supply Chain Officer | ||
| Robert F. Luz | 51 | Chief Human Resources Officer | ||
| Leon de Wet | 50 | Chief Information Officer |
The following is a brief summary of the business experience of each of our executive officers.
David W. Head has served as Chief Executive Officer (“CEO”), President and member of our board of directors since September 2010. Prior to joining O’Charley’s and since 2006, Mr. Head served as Chairman, President and CEO of Captain D’s Seafood Kitchen, an operator and franchisor of quick-service seafood restaurants. From 2003 to 2006 Mr. Head served as President, CEO and a director of Romacorp, Inc., which operates and franchises Tony Roma’s casual-dining locations. In November 2005 Romacorp, Inc. filed for bankruptcy protection under Chapter 11 of the U.S. Bankruptcy Code.
R. Jeffrey Williams has served as Chief Financial Officer and Treasurer since August 2011 after serving as Interim Chief Financial Officer since December 2010. Mr. Williams has served as Chief Accounting Officer since February 2006 and as Corporate Controller from February 2003 to November 2011. In addition, Mr. Williams served as Controller for the O’Charley’s Concept from July 2001 to February 2003. Prior to joining O’Charley’s, Mr. Williams served as Controller of The Krystal Company from 2000 to 2001. Mr. Williams holds a Master of Business Administration from Vanderbilt University’s Owen Graduate School of Management and is a certified public accountant.
Marc A. Buehler has served as Concept President–O’Charley’s since September 2011. Prior to joining O’Charley’s, Mr. Buehler was President, CEO and a director of Kona Grill, Inc., which operates upscale casual restaurants, since 2009. Mr. Buehler also served as CEO of LS Management, Inc., the operator of two restaurant concepts, Lone Star Steakhouse & Saloon and Texas Land & Cattle Steak House with a total of nearly 200 locations, from July 2007 to May 2009. In addition, from 2002 to 2007, Mr. Buehler was with Romacorp Inc., which operated or franchised over 200 Tony Roma’s, casual dining locations, joining the company as Vice President of Marketing and rising to President, CEO and a director. In November 2005 Romacorp, Inc. filed for bankruptcy protection under Chapter 11 of the U.S. Bankruptcy Code.
John R. Grady has served as Concept President–Ninety Nine Restaurants since April 2004. Mr. Grady joined Ninety Nine Restaurants in March 1975. Prior to being named President of Ninety Nine Restaurants in 2004, Mr. Grady was Executive Vice President and has also served in various capacities in the Operations, Training and Real Estate Departments for Ninety Nine Restaurants over the years.
Alfred L. Thimm, Jr. has served as Concept President–Stoney River Legendary Steaks since February 2011. Prior to being named President, Mr. Thimm served as the President and CEO of Al Copeland Investments, Restaurant Division, a privately owned multi-concept restaurant company and franchise group, from May 2007 to July 2010. Prior to that, Mr. Thimm served as President and Chief Operating Officer (“COO”) of The Palm restaurants which owns and operates a chain of fine-dining steakhouses, from September 1990 to June 2006.
Colin M. Daly, Esq. has served as Secretary since March 2009 and General Counsel since February 2008. Prior to being named General Counsel, Mr. Daly served as the company’s Senior Corporate Counsel from April 2006 to January 2008. Prior to joining O’Charley’s, Mr. Daly served as an Assistant General Counsel for ARAMARK Corporation, a diversified management services company, from 2003 to 2006. Prior to ARAMARK, Mr. Daly practiced law with law firms in Nashville, Tennessee and Philadelphia, Pennsylvania.
11
Table of Contents
Lawrence D. Taylor has served as Chief Supply Chain Officer since May 2006. Prior to joining O’Charley’s, he was the Chief Procurement Officer for Carlson Companies, Inc., a global travel, hospitality, restaurant and marketing company, from 2003 to 2006. Mr. Taylor was Vice President, Supply Chain Management for Carlson Restaurants from 2001 to 2003. Mr. Taylor’s earlier experience included senior procurement and supply chain management positions with Taco Bell Corporation, Burger King, Inc., and Perseco. Mr. Taylor was also an owner-operator of a franchised McDonald’s restaurant.
Robert F. Luz has served as Chief Human Resources Officer since August 2011. Mr. Luz previously served as Vice President of Human Resources since October 2007. Mr. Luz joined Ninety Nine Restaurants in 1999. Prior to being named Vice President of Human Resources, Mr. Luz served as the company’s Executive Vice President of Human Resources and Training for Ninety Nine Restaurants. Prior to joining Ninety Nine, Mr. Luz was Executive Director of Human Resources for Applebee’s International, Inc., a casual-dining restaurant company, from 1993 to 1999. Mr. Luz served as Vice President of Human Resources for Back Bay Restaurant Group, a casual-dining restaurant company, from 1991 to 1993. Mr. Luz served as Vice President of Operations from 1986 to 1991 for Hotel and Restaurant Personnel of America, a national executive recruitment firm specializing in senior hospitality management positions.
Leon de Wet has served as Chief Information Officer since September 2006. Prior to joining O’Charley’s, he was with Brinker International, a casual-dining restaurant company, from 1992 to 2006 and served as the Vice President, Business Intelligence and Strategic Systems, from 2002 to 2006. His previous roles at Brinker International include Senior Member of Technical Staff, Director of Store Systems and Development Manager. Mr. De Wet’s earlier experiences include management and analyst roles in charge of retail systems at various companies, including Michael’s Stores Inc.
Available Information
Our website address is www.ocharleysinc.com. Please note that our website address is provided as an inactive textual reference only. We make available free of charge through our website the annual report on Form 10-K, quarterly reports on Form 10-Q, current reports on Form 8-K, and all amendments to those reports as soon as reasonably practicable after such material is electronically filed with or furnished to the SEC. The information provided on our website is not part of this report, and is therefore not incorporated by reference unless such information is specifically referenced elsewhere in this report.
We have posted our Corporate Governance Guidelines, Code of Conduct and Business Ethics Policy for directors, officers and team members, and the charters of our Audit, Compensation and Human Resources and Nominating and Corporate Governance Committees of the board of directors on our website at www.ocharleysinc.com.
12
Table of Contents
| Item 1A. | Risk Factors. |
Risk Factors
Some of the statements we make in this Annual Report on Form 10-K are forward-looking. Forward-looking statements are generally identifiable by the use of the words “anticipate,” “will,” “believe,” “estimate,” “expect,” “plan,” “intend,” “seek” or similar expressions and are subject to the safe harbor provisions of the Private Securities Litigation Reform Act of 1995. These forward-looking statements include all statements that are not historical statements of fact and those regarding our intent, belief, plans or expectations such as statements concerning our operating and growth strategy, projections of revenue, income or loss, information regarding future restaurant openings and capital expenditures, potential increases in food and other operating costs, and our development, expansion, franchising plans and future operations. Forward-looking statements involve known and unknown risks and uncertainties that may cause actual results in future periods to differ materially from those anticipated in the forward-looking statements. Those risks and uncertainties include, among others, costs and uncertainties relating to the consummation of the transactions contemplated by the definitive merger agreement with Fidelity National Financial, Inc.; the continued deterioration in the United States economy and the related adverse effect on our sales of decreased consumer spending; our ability to achieve our internal forecast of sales and profitability; our ability to comply with the terms and conditions of our financing agreements; our ability to maintain or increase comparable store sales and operating margins at our restaurants; the effect that increases in food, labor, energy, interest costs and other expenses have on our results of operations; the effect of increased competition; our ability to sell or sublease closed restaurants and other surplus assets; our ability to successfully implement and realize projected benefits of our turnaround and transformation process; the resolution of outstanding legal proceedings; and the risks and uncertainties discussed below. Although we believe that the assumptions underlying the forward-looking statements contained herein are reasonable, any of these assumptions could prove to be inaccurate, and, therefore, there can be no assurance that the forward-looking statements included in this Annual Report on Form 10-K will prove to be accurate. In light of the significant uncertainties inherent in the forward-looking statements included herein, you should not regard the inclusion of such information as a representation by us or any other person that our objectives and plans will be achieved. We undertake no obligation to publicly release any revisions to the forward-looking statements contained herein to reflect events and circumstances occurring after the date hereof or to reflect the occurrence of unanticipated events.
We face risks and uncertainties associated with our previously announced signing of a definitive merger agreement related to the acquisition of all our outstanding shares of common stock.
On February 5, 2012, we entered into an Agreement and Plan of Merger (the “Merger Agreement”) with Fidelity National Financial, Inc. (“FNF”) and Fred Merger Sub Inc. (“Merger Sub”), an indirect wholly-owned subsidiary of FNF, pursuant to which Merger Sub has commenced a tender offer to purchase all of the outstanding shares of our common stock for $9.85 per share and, if the tender offer is consummated, subject to the approval of our shareholders, if required, and the satisfaction of certain other conditions set forth in the Merger Agreement, the Company will merge with and into Merger Sub, with the Company continuing as the surviving corporation and becoming an indirect wholly-owned subsidiary of FNF (see note 24 of the “Notes to the Consolidated Financial Statements” for further information).
The announcement of the transactions contemplated by the Merger Agreement, whether or not consummated, may create instability in our relationships with key employees and vendors and may create potential concerns or negative impressions among our customers and prospective customers. The Merger Agreement generally requires us to operate our business in the ordinary course pending consummation of the proposed transaction, but includes certain contractual restrictions on the conduct of our business that may affect our ability to execute on our business strategies and/or to attain our financial goals. We have committed and expect to further commit significant Company resources to the proposed transaction which could have been devoted to other business opportunities. Also, the ensuing process places significant demands upon our management resources, which among other things may distract our senior management and our board of directors from committing the optimum amount of time, attention and resources to our ongoing business operations.
Since the announcement of the proposed transaction, several putative class action lawsuits have been filed by purported shareholders of the Company on behalf of themselves and other shareholders of the Company in relation to the transaction (see note 20 of the “Notes to the Consolidated Financial Statements” for further information). All of these lawsuits seek to enjoin the proposed transaction or rescission of the transaction if it is consummated. We also could be subject to additional litigation related to the proposed transaction, whether or not it is consummated. While we currently believe all such litigation is without merit and will not succeed, these pending and potential lawsuits create additional uncertainty relating to the proposed transaction and defending such matters is costly and distracting to management.
13
Table of Contents
The Merger Agreement can be terminated by us or FNF under certain circumstances. If terminated, we must pay FNF a termination fee under certain circumstances, which fee will be either $6.74 million or $3.37 million depending on the circumstances giving rise to payment of the termination fee. Under certain circumstances, we would be required to reimburse FNF for its actual expenses incurred in connection with the proposed transaction, subject to a $2 million cap, which such expense reimbursement will reduce the subsequent payment of any termination fee.
The completion of the proposed transaction is subject to certain conditions, including, among others, (i) that the number of shares of our common stock validly tendered and not validly withdrawn, together with any shares then owned by FNF and its affiliates, equals at least a majority of the shares of our common stock issued and outstanding on a fully diluted basis, (ii) the expiration or termination of any applicable waiting period under the Hart-Scott-Rodino Antitrust Improvements Act of 1976, as amended, and certain other antitrust laws, (iii) the absence of a material adverse effect on the Company and (iv) certain other customary conditions. We cannot predict whether the closing conditions for the proposed transaction set forth in the Merger Agreement will be satisfied. As a result, we cannot assure you that the proposed transaction will be completed. If the closing conditions for the proposed transaction are not satisfied or waived pursuant to the Merger Agreement, or if the transaction is not completed for any other reason, the market price of our common stock may decline significantly.
In addition, if the proposed transaction does not occur, we will nonetheless remain liable for the significant expenses that we have incurred related to the transaction.
These factors, alone or in combination with other circumstances and events, may have a material adverse effect upon our business, results of operations and financial condition.
FNF and Merger Sub filed a Tender Offer Statement on Schedule TO (the “Schedule TO”) with the SEC on February 27, 2012, and we have filed a Solicitation/Recommendation Statement on Schedule 14D-9 (the “Schedule 14D-9”) with the SEC. The Schedule TO and Schedule 14D-9 have been sent to our shareholders. We urge our investors and shareholders to read the Schedule 14D-9 and the Schedule TO and other relevant materials as they become available because they will contain important information about the proposed transaction.
General economic conditions, as well as those specific to the restaurant industry, may adversely affect our results of operations.
Our business results depend on a number of industry-specific and general economic factors, many of which are beyond our control. These factors include consumer income, interest rates, inflation, consumer credit availability, consumer debt levels, tax rates and policy, unemployment trends and other matters that influence consumer confidence and discretionary spending. A continued deterioration in consumer confidence and these other factors could continue to reduce guest traffic and impose pressures on pricing, harming our results of operations.
The significant slowdown and volatility in the U.S. economy has and is expected to continue to negatively affect our business. For instance, the soft housing market, tight credit and high unemployment rates in recent years have led to a lack of consumer confidence, particularly for consumers that frequent casual-dining chains. Continuing weakness in the spending of those consumers has had and could continue to have an adverse impact on our results of operations. Since our business depends upon consumer discretionary spending, high unemployment and decreased home values, rising fuel and energy costs and tighter access to consumer credit would likely place additional pressure on our guest counts and reduce our profitability as our guests may have lower disposable income and reduce the frequency with which they dine out, may spend less when dining out or may choose more inexpensive restaurants. There can be no assurance that the macroeconomic environment will improve significantly or that the federal government’s stimulus efforts will restore consumer confidence, increase liquidity and the availability of credit, or result in significantly lower unemployment. In response to ongoing economic conditions, many of our competitors have continued discounting activities in markets in which we operate. Our response, or failure to respond, to such discounting could negatively impact our restaurant sales.
In addition, general economic conditions may have an adverse effect on our suppliers, landlords, franchisees and other business partners. Some of our suppliers could experience serious cash flow problems due to the current credit market. As a result, they may attempt to increase their prices, pass through increased costs or alter payment terms. Our suppliers may be forced to reduce their production, shut down their operations or file for bankruptcy protection, which could have a material adverse effect on our business. A weak economic recovery or worsening of the U.S. economy, or even the fear of such a development, could intensify the adverse effects of these difficult market conditions on our results of operations.
14
Table of Contents
Changing consumer preferences could force us to modify our concepts and menus and could result in a reduction in our revenues.
Our O’Charley’s and Ninety Nine restaurants are casual-dining restaurants that feature menus intended to appeal to a broad spectrum of guests. Our Stoney River restaurants are upscale casual-dining steakhouses that feature steaks, fresh seafood and other gourmet entrées. Our continued success depends, in part, upon the popularity of these foods and these styles of dining. Shifts in consumer preferences away from this cuisine or dining style could materially adversely affect our future operating results. The restaurant industry is characterized by the continual introduction of new concepts and is subject to rapidly changing consumer preferences, tastes and eating and purchasing habits. Our success will depend in part on our ability to anticipate and respond to these changes in consumer preferences, as well as other factors affecting the restaurant industry, including new market entrants and demographic changes. In connection with the repositioning of our Stoney River concept in 2009 and 2010, we reduced prices of certain menu offerings and added new menu items. We may make further changes in our concepts and menus in order to respond to changes in consumer tastes or dining patterns. If we change a restaurant concept or menu, we may lose guests who do not prefer the new concept or menu, and may not be able to attract a sufficient new guest base to produce the revenue needed to make the restaurant concept profitable.
Unfavorable publicity, or a failure to respond effectively to adverse publicity, could harm our reputation and adversely impact our guest counts and sales.
The good reputation of our restaurant brands is a key factor in the success of our business. Actual or alleged incidents at any of our restaurants could result in negative publicity that could harm our brands. Negative publicity may result from allegations of illegal, unfair or inconsistent employment practices, guest discrimination, illness or injury. Regardless of whether the allegations or complaints are valid, unfavorable publicity relating to a limited number of our restaurants, or only to a single restaurant, could adversely affect public perception of the entire brand. Negative publicity also may result from health concerns including food safety and flu outbreaks, publication of government or industry findings concerning food products, environmental disasters, crime incidents, scandals involving our employees, or disruptions or operational problems at our restaurants, all of which could make our brands and menu offerings less appealing to our guests and negatively impact our guest counts and sales. Adverse publicity and its effect on overall consumer perceptions of our brands, or our failure to respond effectively to adverse publicity, could have a material adverse effect on our business.
In addition, even incidents occurring at restaurants operated by our competitors or in the supply chain generally could result in negative publicity that could harm the restaurant industry overall and, indirectly, our own brands.
Our restaurants may not be able to compete successfully with other restaurants, which could adversely affect our results of operations.
The restaurant industry is intensely competitive with respect to price, service, location, nutritional and dietary trends and food quality, and there are many well-established competitors with substantially greater financial and other resources than us, including a large number of national and regional restaurant chains, some of which operate more restaurants and have greater financial resources than we do. Some of our competitors have been in existence for a substantially longer period than us and may be better established in the markets where our restaurants are or may be located. Some of our competitors advertise on national television, which may provide them with greater awareness and name recognition than we can achieve through our advertising efforts. Our success to drive incremental sales or maintain sales levels is dependent upon our operational execution and marketing. If our marketing promotions fail to achieve a competitive advantage we may lose market share. Additionally, we face increasing competition from the convergence of restaurant, deli and grocery services, as supermarkets and grocery stores offer “convenient meals” in the form of improved entrées and side dishes in their deli sections. If our restaurants are unable to compete successfully in new and existing markets, our results of operations will be adversely affected.
We also compete with other restaurants for experienced management personnel and hourly team members and with other restaurants and retail establishments for quality sites.
The effectiveness of our marketing and advertising programs could have a material effect on our operating results.
Our revenues are heavily influenced by brand marketing and advertising. Our marketing and advertising programs may not be successful, which may lead us to fail to attract new guests and retain existing guests. If our marketing and advertising programs are unsuccessful, our results of operations could be adversely affected. Our marketing and
15
Table of Contents
advertising programs may also be impacted by the activities of our competitors. Increased spending on advertising and promotions by our competitors could result in increased spending by us on advertising and promotions, or could reduce the effectiveness of our marketing efforts, either of which could adversely affect our results of operations. We believe that the current economic environment and the competitive landscape in the casual-dining restaurant industry have made our customers more value-conscious, and that we must respond to new market conditions and consumers’ demand for superior value. This strategy is reflected in, among other things, menu offerings at our O’Charley’s and Ninety Nine restaurants and our value-oriented pricing and menu changes at our Stoney River restaurants. If we are unable to successfully execute this strategy, our operating margins and financial results could be adversely affected.
We may incur costs or liabilities and lose revenue as the result of existing or proposed government laws or regulation.
Our restaurants are subject to extensive federal, state and local government laws and regulation, including regulations related to the preparation and sale of food (such as labeling, allergens content, trans fat content and other menu information regarding nutrition), the sale of alcoholic beverages, employment matters (such as minimum wage, employee health insurance, organizing and collective bargaining, fair employment practices, and employee health and safety), information security, zoning and building codes and other health, sanitation and safety matters. Compliance with these laws and regulations can be costly and can increase exposure to litigation or governmental investigations or proceedings. The federal healthcare reform legislation that became law in March 2010 or PPACA requires restaurant companies such as ours to disclose calorie information on their menus. We do not expect to incur any material costs from compliance with this provision, but cannot anticipate any changes in guest behavior resulting from the implementation of this portion of the law, which could have an adverse effect on our sales and results of operations.
All of these regulations impact not only our current restaurant operations but also our ability to open new restaurants, if our business strategy calls for us to do so. We will be required to comply with applicable state and local regulations in any new locations into which we expand. Any difficulties, delays or failures in obtaining licenses, permits or approvals in such new locations could delay or prevent the opening of a restaurant in a particular area or reduce operations at an existing location, either of which could materially and adversely affect our growth and results of operations.
The revenues and costs of operating our restaurants may be adversely affected if there are changes in laws governing minimum hourly wages or tip credits, labor or collective bargaining laws, nutritional labeling, environmental matters, workers’ compensation insurance rates, employee health insurance, unemployment tax rates, sales taxes, corporate income tax or other laws and regulations, such as the federal Americans with Disabilities Act, the Family Medical Leave Act and the PPACA. The PPACA contains requirements that may significantly raise our employee health benefits costs or alter the benefits we provide, including mandatory enrollment of employees in company health plans, the elimination of caps on annual and lifetime coverage limits, a ban on pre-existing conditions as an exclusion for coverage, a prohibition on linking eligibility and premium rates to health-status factors, and mandatory coverage availability for dependents through age 26. If our employee health insurance and other of the foregoing costs increase, there can be no assurance that we will be able to offset the increase by increasing our menu prices or by other means, which would adversely affect our results of operations.
If we are unable to comply with our financial covenants, our liquidity and results of operations could be adversely affected.
At December 25, 2011, we had a total of $0.2 million in debt and capital lease obligations. We had no amounts outstanding on our revolving credit facility at December 25, 2011.
Our credit facility contains customary restrictive covenants, including limitations on dividends, repurchases of capital stock, sale leaseback transactions, the incurrence of additional indebtedness, mergers and acquisitions, and asset sales. In addition, our credit facility contains certain financial covenants, including an adjusted debt to EBITDAR ratio, a senior secured leverage ratio, a fixed-charge coverage ratio and capital expenditures ratio. As of the end of our 2011 fiscal year, there were no defaults under our credit facility and we believe we were in compliance with all covenants. Although we currently project that we will remain in compliance with these covenants, there can be no assurance that we will remain in compliance with these covenants.
If we were to violate any of our covenants under our credit facility, there can be no assurance that we will be successful in obtaining amendments or waivers on acceptable terms. Any waiver or amendment may result in future increases in the interest costs and possible additional restrictions under our credit facility.
16
Table of Contents
In addition, we have four separate lease agreements that cover lease arrangements for an aggregate of 30 of our Ninety Nine restaurants, each of which contains a fixed charge covenant calculation. Each of the four restaurant groups are subject to an annual fixed charge coverage ratio of 1.50 to 1.00. Each of the lease agreements exceeded the 1.50 to 1.00 minimum as of the end of fiscal 2011. Failure to remain in compliance with these lease covenants could adversely affect our results of operations.
Our support centers could experience a natural or man-made disaster, resulting in a loss of data and information, and disruption of our business.
Successful operation of our restaurants depends upon the oversight, information systems and administrative support that they receive from our support centers. For example, our information systems provide point-of-sale processing in our restaurants, management of our supply chain, financial reporting, various other processes and transactions and maintaining operational efficiencies. We have developed and tested a Disaster Recovery Plan to respond to the loss of information systems in the event of natural and man-made disasters. This plan allows us to fully restore our critical systems in a remote location within three business days. If the Disaster Recovery Plan were to fail, the loss of data and other capabilities could have an adverse impact on our results of operations and the reliability of our financial information.
We may experience higher operating costs, which would adversely affect our operating results if we cannot increase menu prices to cover them.
Our operating results are significantly dependent on our ability to anticipate and react to increases in food, labor, team member benefits, insurance, energy and other costs. Various factors beyond our control, including adverse weather conditions, governmental regulation, production, availability and recalls of food products, inflation and seasonality may affect our food costs or cause a disruption in our supply chain. Some climatologists predict that the long-term effects of climate change may result in more severe, volatile weather, which could affect our food cost. We cannot predict whether we will be able to anticipate and react to changing food costs by adjusting our purchasing practices and menu prices, and a failure to do so could adversely affect our operating results. In addition, because the pricing strategy at all of our concepts is intended to provide an attractive price-to-value relationship, we may not be able to pass along price increases to our guests, particularly in the current economic environment, without adversely impacting our guest counts.
We compete with other restaurants for experienced management personnel and hourly team members. Each of our concepts offers medical benefits to hourly team members. Increases in health care costs, changes in state or federal minimum wage laws, or changes in legal requirements relating to employee benefits would likely cause an increase in our labor costs. We cannot assure that we will be able to offset increased wage and benefit costs through our purchasing and hiring practices or menu price increases, particularly over the short term. As a result, increases in wages and benefits could have a material adverse effect on our business.
In addition, the current premiums that we pay for our insurance (including workers’ compensation, general liability, property, health, and directors’ and officers’ liability) may increase annually, thereby further increasing our costs. The dollar amount of claims that we actually experience under our workers’ compensation and general liability insurance, for which we carry high per-claim deductibles, may also increase at any time, thereby further increasing our costs. Further, the decreased availability of property and liability insurance has the potential to negatively impact the cost of premiums and the magnitude of uninsured losses, particularly if the insurance carriers themselves became financially unstable.
We outsource certain business processes to third-party vendors that subject us to risks, including disruptions in business and increased costs.
Some business processes that are dependent on technology are outsourced to third parties. Such processes include gift card tracking and authorization, credit card authorization and processing, certain payroll processes and insurance and benefit administrators. We make a diligent effort to ensure that all providers of outsourced services are observing proper internal control practices, including secure data transfers between us and the third-party vendor; however, there are no guarantees that failures will not occur. Failure of third parties to provide adequate services could have an adverse effect on our results of operations, financial condition or ability to accomplish our financial and management reporting.
Failure to protect the integrity and security of individually identifiable data of our guests and team members could expose us to litigation and damage our reputation.
We receive and maintain certain personal information about our guests and team members both internally and with third party vendors. Our use of this information is regulated at the federal and state levels, as well as by certain third party contracts. If our security and information systems are compromised or our business associates fail to comply with
17
Table of Contents
these laws and regulations and this information is obtained by unauthorized persons or used inappropriately, it could adversely affect our reputation, as well as operations, results of operations and financial condition, and could result in litigation against us or the imposition of penalties. As privacy and information security laws and regulations change, or changes are imposed by our business partners, we may incur additional costs to ensure we remain in compliance.
We may incur costs or liabilities as a result of litigation and publicity concerning food quality, health and other issues that can also cause guests to avoid our restaurants.
We are subject to complaints or litigation from time to time from guests alleging illness, injury or other food quality or health concerns. Litigation or adverse publicity resulting from these allegations may materially adversely affect our business, regardless of whether the allegations are valid or whether we are liable. We are subject to litigation under “dram shop’’ laws that allow a person to sue us based on any injury or death caused by an intoxicated person who was wrongfully served alcoholic beverages at one of our restaurants. While we maintain insurance for lawsuits under a “dram shop” law or alleging illness or injury from food, we have significant deductibles under such insurance and any such litigation may result in a verdict in excess of our liability insurance policy limits, which could result in substantial liability for us and could have a material adverse effect on our results of operations.
We are a defendant from time to time in various legal proceedings arising in the ordinary course of our business, including claims relating to injury; claims relating to workplace and employment matters, including wage and hour disputes, discrimination claims and similar matters; claims resulting from “slip and fall” accidents; claims relating to lease and contractual obligations; claims relating to our franchising initiatives; trademark infringement; shareholder claims; and claims from guests or employees alleging illness, injury or other food quality, health or operational concerns.
We do not believe that any of the legal proceedings pending against us as of the date of this report will have a material adverse effect on our liquidity or financial condition. We may incur liabilities, receive benefits, settle disputes, sustain judgments, or accrue expenses relating to legal proceedings in a particular fiscal quarter which may adversely affect our results of operations, or on occasion, receive settlements that favorably affect results of operations. However, the outcome of litigation, particularly class action lawsuits and regulatory actions, is difficult to assess or quantify. Plaintiffs in these types of lawsuits may seek recovery of very large or indeterminate amounts and the magnitude of the potential loss relating to such lawsuits may remain unknown for substantial periods of time. The cost to defend future litigation may be significant. Even if a claim is unsuccessful or is not fully pursued, the negative publicity surrounding any negative allegation regarding our company, our business or our products could adversely affect our reputation with existing and potential guests. As a result, litigation may adversely affect our business, financial condition and results of operations.
A large part of our success depends on our ability to execute our strategic plan and to realize our anticipated supply chain efficiencies.
Our strategic plan involves a number of initiatives intended to improve our restaurant level economics and enhance guest loyalty. Our strategic plan involves significant investments in our management team and our restaurants and the success of the strategic plan depends on our ability to successfully implement the plan and realize the projected return on our investment. Our strategy also includes improving our restaurant level economics, and we believe that effective supply chain management will contribute significantly to achieving this goal. However, a failure to successfully implement and realize projected savings from these actions could adversely affect the results of our strategic plan.
Our restaurants are concentrated geographically; if any one of the regions in which our restaurants are located experiences an economic downturn, adverse weather or other material change, our business results may suffer.
Our O’Charley’s restaurants are located in the Eastern, Southeastern, and Midwestern United States. Our Ninety Nine restaurants are located in the Northeastern United States. As of December 25, 2011, we operated 39 of our 221 O’Charley’s restaurants in Tennessee and 61 of our 105 Ninety Nine restaurants in Massachusetts. As a result, our business and our financial or operating results may be materially adversely affected by adverse economic, weather or business conditions in these markets, as well as in other geographic regions in which we operate restaurants.
18
Table of Contents
Any disruption in our supply chain could adversely affect our ability to operate our restaurants.
Possible shortages or interruptions in the supply of food items and other supplies to our restaurants could adversely affect the availability, quality and cost of items we buy and the operations of our restaurants. Such disruptions may be caused by inclement weather, natural disasters such as floods, drought and hurricanes, the inability of our vendors to obtain credit in a tightened credit market, food safety warnings or advisories or the prospect of such pronouncements, or other conditions beyond our control. Our inability to effectively manage supply chain risk could increase our costs and limit the availability of products critical to our restaurant operations.
We have outsourced the manufacture of all food products, as well as the distribution and transportation services to the O’Charley’s, Ninety Nine and Stoney River brands, to third parties. This makes us dependent upon the performance of third-party manufacturers and distributors for the availability and delivery of food and other supplies. Any disruptions to their operations could have a material impact on our future reported results.
We rely heavily on technology in our business, and any interruption, failure or breach of security of that technology could negatively affect our ability to effectively operate our business.
If we experience problems with our ability to effectively manage our information systems it could disrupt our operations. Our business depends on information systems that assist us in, among other things, point-of-sale processing in our restaurants, management of our supply chain, financial reporting, various other processes and transactions and maintaining operational efficiencies. All of these processes depend upon the reliability and capacity of these information systems. These systems include software developed in-house and systems provided by external contractors and other service providers. To the extent that these external contractors or other service providers become insolvent or fail to support the software or systems, our operations could be negatively affected. If we experience a reduction in the performance, reliability, or availability of our information systems, our operations and ability to produce timely and accurate reports could be adversely affected.
Our information systems and applications require continual maintenance, upgrading, and enhancement to meet our operational needs. In addition, damage or interruption from power outages, computer, network and telecommunications failures, computer viruses, a breach of security, catastrophic events such as fires, floods, earthquakes, tornadoes, hurricanes, acts of war or terrorism and usage errors by our employees could cause delays in customer service, hinder operational efficiencies, result in a loss of data or require a significant investment to remediate the problem. If we are unable to successfully implement, maintain, secure, or expand our systems properly, we could suffer from, among other things, operational disruptions and increases in administrative expenses which could affect our results of operations.
Failure to comply with current regulatory requirements will result in additional expenses and may adversely affect us.
Keeping abreast of, and in compliance with, changing laws, regulations and standards relating to corporate governance and public disclosure, including the Sarbanes-Oxley Act of 2002, Securities and Exchange Commission regulations and NASDAQ Stock Market rules, has required an increased amount of our management’s attention and greater utilization of external resources. We remain committed to maintaining high standards of corporate governance and public disclosure. As a result, we intend to invest all reasonably necessary resources to comply with evolving standards, including any standards or regulations approved under the current government administration. This ongoing investment results in continuing support costs included in general and administrative expenses.
We are dependent on attracting and retaining qualified employees.
Our performance is dependent on attracting and retaining qualified restaurant employees. Availability of staff varies widely from location to location. Many staff members are in entry-level or part-time positions, typically with high rates of turnover. Even though recent trends in employee turnover have been favorable, if restaurant management and staff turnover were to increase, we could suffer higher direct costs associated with recruiting, training and retaining replacement personnel. Management turnover as well as general shortages in the labor pool can cause our restaurants to be operated with reduced staff, which negatively affects our ability to provide appropriate service levels to our customers. Competition for qualified employees exerts upward pressure on wages paid to attract such personnel, resulting in higher labor costs, together with greater recruiting and training expenses.
19
Table of Contents
We are dependent upon our senior management team to execute our business strategy.
Our operations and our ability to execute our business strategy are highly dependent on the efforts of our senior management team. Many of the members of our senior management team do not have long tenures with us. Recent hires include our Chief Executive Officer and President in September 2010, our Stoney River Concept President in February 2011, and our O’Charley’s Concept President in September 2011. Additionally, effective as of December 27, 2010, our former Chief Financial Officer resigned to accept a position with another company, and our Chief Accounting Officer and Corporate Controller was subsequently promoted to serve as our Chief Financial Officer and Treasurer.
Although the members of our senior management team have employment agreements with us, these agreements may not provide sufficient incentives for these officers to continue employment with us. The loss of one or more of the members of our senior management team could adversely affect our business. We do not maintain key man insurance on any of the members of our senior management team.
Identification of material weakness in internal control may adversely affect our financial results.
We are subject to the ongoing internal control provisions of Section 404 of the Sarbanes-Oxley Act of 2002. Those provisions provide for the identification of material weaknesses in internal control. If such a material weakness is identified, it could indicate a lack of adequate controls to generate accurate financial statements. We routinely assess our internal controls, but we cannot assure you that we will be able to timely remediate any material weaknesses that may be identified in future periods, or maintain all of the controls necessary for continued compliance. Likewise, we cannot assure you that we will be able to retain sufficient skilled finance and accounting team members, especially in light of the increased demand for such individuals among publicly-traded companies. As of December 25, 2011 we believe our internal control over financial reporting was effective (see Item 9A “Controls and Procedures”).
Changes to estimates related to our property and equipment, or operating results that are lower than our current estimates at certain restaurant locations, may cause us to incur impairment charges on certain long-lived assets.
We make certain estimates and projections with regard to individual restaurant operations, as well as our overall performance in connection with our impairment analyses for long-lived assets. An impairment charge is required when the carrying value of the asset exceeds the estimated fair value or undiscounted future cash flows of the asset. The projection of future cash flows used in this analysis requires the use of judgment and a number of estimates and projections of future operating results. If actual results differ from our estimates, additional charges for asset impairments may be required in the future. If impairment charges are significant, our results of operations could be adversely affected.
| Item 1B. | Unresolved Staff Comments. |
None.
20
Table of Contents
| Item 2. | Properties. |
As of December 25, 2011, we operated 221 O’Charley’s restaurants, 105 Ninety Nine restaurants and 10 Stoney River Legendary Steaks restaurants. As of that date, our owned and leased properties at these operating locations by concept are as follows:
| Owned | Ground Lease |
Building Lease |
Land and Building Lease |
Total | ||||||||||||||||
| O’Charley’s |
45 | 83 | — | 93 | 221 | |||||||||||||||
| Ninety Nine |
— | 28 | 18 | 59 | 105 | |||||||||||||||
| Stoney River |
3 | 4 | 3 | — | 10 | |||||||||||||||
|
|
|
|
|
|
|
|
|
|
|
|||||||||||
| Total |
48 | 115 | 21 | 152 | 336 | |||||||||||||||
|
|
|
|
|
|
|
|
|
|
|
|||||||||||
See “Item 1-Business-Restaurant Locations” above. Restaurant lease expirations range from 2012 to 2031, with the majority of the leases providing for an option to renew for additional terms ranging from five years or longer. All of our restaurant leases provide for a specified annual rental, and some leases call for additional rental based on sales volume at the particular location over specified minimum levels. Generally, our restaurant leases are triple net leases, which require us to pay the cost of insurance, utilities, and taxes.
As of December 25, 2011, 45 of our company-owned properties were subject to collateral mortgages under our Fourth Amended and Restated Credit Agreement.
We own our home office that is located in Nashville, Tennessee with approximately 60,000 square feet. We lease administrative offices of approximately 15,000 square feet in Woburn, Massachusetts. In June 2009, we entered into an agreement to outsource food and supply distribution for our Ninety Nine restaurants and to sell related assets at our distribution facility in Bellingham, Massachusetts. We sublet the Bellingham, Massachusetts facility, with approximately 79,000 square feet of space. Our lease for this facility expires in September 2015.
| Item 3. | Legal Proceedings. |
On February 9, 2012, a purported shareholder of the Company named David Kaniecki filed a putative class action lawsuit in the Tennessee Chancery Court, 20th Judicial District, against the members of the Board of Directors, the Company, FNF and Merger Sub (the “Kaniecki Complaint”). On February13, 2012, a purported shareholder of the Company named Paul Walleman filed a putative class action lawsuit in the Tennessee Circuit Court, 20th Judicial District, against the members of the Board of Directors, the Company, FNF, Merger Sub and Crescendo Partners (the “Walleman Complaint”). On February 15, 2012, two purported shareholders of the Company named Michael Gilliam and Angela Wieder filed a putative class action lawsuit in the Tennessee Chancery Court, 20th Judicial District, against the members of the Board of Directors, the Company, FNF and Merger Sub (the “Gilliam Complaint”). On February 15, 2012, a purported shareholder of the Company named Hilary Coyne filed a putative class action lawsuit in the Tennessee Chancery Court, 20th Judicial District, against the members of the Board of Directors, the Company, FNF and Merger Sub (the “Coyne Complaint”). On February 15, 2012, a purported shareholder of the Company named Brady White filed a putative class action lawsuit in the Tennessee Chancery Court, 20th Judicial District, against the members of the Board of Directors, the Company, FNF and Merger Sub (the “White Complaint,” and together with the Kaniecki Complaint, the Walleman Complaint, the Gilliam Complaint and the Coyne Complaint, the “Complaints”). Each of the Complaints alleges that the members of the Board of Directors breached their fiduciary duties to shareholders in connection with the sale of the Company. Each of the Complaints alleges that FNF and/or Merger Sub and/or Crescendo Partners aided and abetted the Board of Directors purported breach of its fiduciary duties. Each of the Complaints, in addition to seeking other relief, seeks to enjoin the sale of the Company. With respect to each of the Complaints, the Company believes the plaintiff’s allegations are without merit, and, if one or more of the various plaintiffs proceeds with litigation, the Company will contest the allegations vigorously.
We are a defendant from time to time in various legal proceedings arising in the ordinary course of our business, including claims relating to injury or wrongful death under “dram shop” laws that allow a person to sue us based on any injury caused by an intoxicated person who was wrongfully served alcoholic beverages at one of our restaurants; claims relating to workplace, workers compensation and employment matters, discrimination and similar matters; claims resulting from “slip and fall” accidents; claims relating to lease and contractual obligations; claims relating to our joint venture and franchising initiatives; and claims from guests or employees alleging illness, injury or other food quality, health or operational concerns.
21
Table of Contents
We do not believe that any of the legal proceedings pending against us as of the date of this report will have a material adverse effect on our liquidity or financial condition. We may incur liabilities, receive benefits, settle disputes, sustain judgments, or accrue expenses relating to legal proceedings in a particular fiscal quarter which may adversely affect our results of operations, or on occasion, receive settlements that favorably affect results of operations.
| Item 4. | Mine Safety Disclosures. |
Not applicable.
22
Table of Contents
| Item 5. | Market for Registrant’s Common Equity, Related Stockholder Matters and Issuer Purchases of Equity Securities. |
Our common stock trades on the NASDAQ Global Select Market under the symbol “CHUX.” As of February 24, 2012, there were 2,190 shareholders of record of our common stock.
The following table shows quarterly high and low sales prices for our common stock for the periods indicated, as reported by the NASDAQ Global Select Market.
| High | Low | |||||||
| Fiscal 2011 |
||||||||
| First Quarter |
$ | 8.26 | $ | 5.66 | ||||
| Second Quarter |
7.99 | 5.98 | ||||||
| Third Quarter |
7.82 | 4.51 | ||||||
| Fourth Quarter |
6.84 | 4.85 | ||||||
| Fiscal 2010 |
||||||||
| First Quarter |
$ | 9.95 | $ | 6.35 | ||||
| Second Quarter |
10.00 | 4.38 | ||||||
| Third Quarter |
7.49 | 5.28 | ||||||
| Fourth Quarter |
7.98 | 6.65 | ||||||
23
Table of Contents
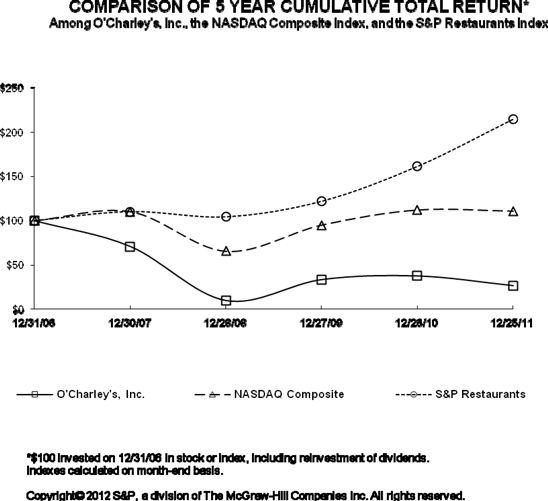
| Graph Data Points |
12/31/06 | 12/30/07 | 12/28/08 | 12/27/09 | 12/26/10 | 12/25/2011 | ||||||||||||||||||
| O’Charley’s Inc. |
$ | 100.00 | $ | 70.95 | $ | 9.90 | $ | 33.56 | $ | 37.62 | $ | 26.75 | ||||||||||||
| NASDAQ Composite |
$ | 100.00 | $ | 110.26 | $ | 65.65 | $ | 95.19 | $ | 112.10 | $ | 110.81 | ||||||||||||
| S&P Restaurants |
$ | 100.00 | $ | 110.35 | $ | 104.41 | $ | 122.05 | $ | 161.43 | $ | 214.83 | ||||||||||||
24
Table of Contents
Issuer Purchases of Equity Securities
The following table sets forth information with respect to purchases of shares of the Company’s common stock made during the quarter ended December 25, 2011 by or on behalf of the Company or any “affiliated purchaser,” as defined by Rule 10b5-1 of the Exchange Act:
| O’Charley’s Accounting Periods |
Total Number of Shares Purchased (1) |
Average Price Paid Per Share |
Total Number of Shares Purchased as Part of Publicly Announced Plans or Programs |
Maximum Number of Shares or Approximate Dollar Value That May Yet be Purchased Under the Plans or Programs |
||||||||||||
| 10/3/11- 10/30/11 |
— | — | ||||||||||||||
| 10/31/11- 11/27/11 |
1,056 | $ | 6.55 | — | — | |||||||||||
| 11/28/11- 12/25/11 |
— | — | ||||||||||||||
|
|
|
|
|
|||||||||||||
| Total for the Quarter |
1,056 | $ | 6.55 | — | — | |||||||||||
|
|
|
|
|
|
|
|
|
|||||||||
| (1) | Represents shares withheld to cover tax-withholding requirements relating to the vesting of restricted stock and stock options issued to employees pursuant to the Company’s shareholder-approved stock incentive plans. |
25
Table of Contents
| Item 6. | Selected Financial Data. |
The selected financial data presented below under the captions “Statement of Operations Data” and “Balance Sheet Data” for, and as of the end of each of the fiscal years in the five-year period ended December 25, 2011, were derived from the consolidated financial statements of O’Charley’s Inc. and its subsidiaries. The selected data should be read in conjunction with the consolidated financial statements as of December 25, 2011 and December 26, 2010 and for each of the fiscal years in the three-year period ended December 25, 2011, and the related notes thereto, as well as “Management’s Discussion and Analysis of Financial Condition and Results of Operations” appearing in this Annual Report on Form 10-K. Fiscal years 2009, 2008 and 2007 have been adjusted to reflect the discontinued operations of certain restaurant locations closed during 2010. See Item 8 “Financial Statements and Supplementary Data” for further discussion of loss from discontinued operations, net loss and related loss per diluted share.
| Fiscal Years | ||||||||||||||||||||
| 2011 | 2010 | 2009 | 2008 | 2007 | ||||||||||||||||
| (In thousands, except per share data) | ||||||||||||||||||||
| Statement of Operations Data: |
||||||||||||||||||||
| Revenues: |
||||||||||||||||||||
| Restaurant sales |
$ | 826,156 | $ | 828,982 | $ | 865,342 | $ | 913,888 | $ | 952,440 | ||||||||||
| Commissary sales |
— | — | — | — | 7,783 | |||||||||||||||
| Franchise and other revenue |
931 | 1,127 | 931 | 843 | 472 | |||||||||||||||
|
|
|
|
|
|
|
|
|
|
|
|||||||||||
| 827,087 | 830,109 | 866,273 | 914,731 | 960,695 | ||||||||||||||||
| Costs and Expenses: |
||||||||||||||||||||
| Cost of restaurant sales: |
||||||||||||||||||||
| Cost of food and beverage |
260,646 | 247,558 | 252,207 | 270,870 | 278,966 | |||||||||||||||
| Payroll and benefits |
287,010 | 293,629 | 305,418 | 319,252 | 325,009 | |||||||||||||||
| Restaurant operating costs |
174,740 | 175,025 | 171,930 | 184,378 | 181,035 | |||||||||||||||
|
|
|
|
|
|
|
|
|
|
|
|||||||||||
| Cost of restaurant sales, exclusive of depreciation and amortization shown separately below |
722,396 | 716,212 | 729,555 | 774,500 | 785,010 | |||||||||||||||
| Cost of commissary sales |
— | — | — | — | 7,700 | |||||||||||||||
| Advertising and marketing expenses |
35,458 | 34,655 | 32,234 | 33,753 | 32,086 | |||||||||||||||
| General and administrative expenses |
31,938 | 39,474 | 38,343 | 44,292 | 48,670 | |||||||||||||||
| Depreciation and amortization of property and equipment |
36,118 | 42,093 | 46,460 | 49,543 | 49,651 | |||||||||||||||
| Impairment, disposal and restructuring charges, net (1) |
2,866 | 14,998 | 8,437 | 12,776 | 15,226 | |||||||||||||||
| Goodwill impairment (2) |
— | — | — | 93,656 | — | |||||||||||||||
| Pre-opening costs |
— | 7 | 597 | 3,655 | 3,065 | |||||||||||||||
|
|
|
|
|
|
|
|
|
|
|
|||||||||||
| 828,776 | 847,439 | 855,626 | 1,012,175 | 941,408 | ||||||||||||||||
|
|
|
|
|
|
|
|
|
|
|
|||||||||||
| (Loss) Income from Operations |
(1,689 | ) | (17,330 | ) | 10,647 | (97,444 | ) | 19,287 | ||||||||||||
| Other Expense (Income): |
||||||||||||||||||||
| Interest expense, net |
9,624 | 11,812 | 11,628 | 14,966 | 12,287 | |||||||||||||||
| Other, net |
1 | (8 | ) | (68 | ) | 10 | (87 | ) | ||||||||||||
|
|
|
|
|
|
|
|
|
|
|
|||||||||||
| 9,625 | 11,804 | 11,560 | 14,976 | 12,200 | ||||||||||||||||
|
|
|
|
|
|
|
|
|
|
|
|||||||||||
| (Loss) Earnings from Continuing Operations Before Income Taxes |
(11,314 | ) | (29,134 | ) | (913 | ) | (112,420 | ) | 7,087 | |||||||||||
| Income Tax Expense (Benefit) (3) |
655 | (1,849 | ) | 2,254 | 15,115 | (1,017 | ) | |||||||||||||
|
|
|
|
|
|
|
|
|
|
|
|||||||||||
| (Loss) Earnings from Continuing Operations |
$ | (11,969 | ) | $ | (27,285 | ) | $ | (3,167 | ) | $ | (127,535 | ) | $ | 8,104 | ||||||
|
|
|
|
|
|
|
|
|
|
|
|||||||||||
| (Loss) Earnings Per Share from Continuing Operations: |
||||||||||||||||||||
| Basic |
$ | (0.56 | ) | $ | (1.29 | ) | $ | (0.15 | ) | $ | (6.10 | ) | $ | 0.35 | ||||||
| Diluted |
$ | (0.56 | ) | $ | (1.29 | ) | $ | (0.15 | ) | $ | (6.10 | ) | $ | 0.34 | ||||||
| Balance Sheet Data (at end of period): |
||||||||||||||||||||
| Working capital deficit |
$ | (19,406 | ) | $ | (13,713 | ) | $ | (16,944 | ) | $ | (31,883 | ) | $ | (21,145 | ) | |||||
| Total assets |
313,611 | 422,741 | 462,255 | 520,262 | 648,983 | |||||||||||||||
| Current portion of long-term debt and capitalized lease obligations |
122 | 1,710 | 1,979 | 6,640 | 8,597 | |||||||||||||||
| Long-term debt and capitalized lease obligations, including current portion |
152 | 118,874 | 131,898 | 163,068 | 145,235 | |||||||||||||||
| Total shareholders’ equity |
168,511 | 178,234 | 209,119 | 211,760 | 366,276 | |||||||||||||||
| Cash dividends per share |
$ | — | $ | — | $ | — | $ | 0.18 | $ | 0.18 | ||||||||||
26
Table of Contents
| (1) | During 2011, the Company recorded total impairment, disposal and restructuring charges, net, of $2.9 million. Included are impairment charges of $1.4 million on three O’Charley’s restaurants, loss on sale of $1.2 million on six O’Charley’s restaurants included in the sale-leaseback transaction and $0.2 million on three assets held for sale. Also included is a gain of $0.2 million due to net reductions of previously closed locations future lease obligations, offset by $0.3 million of exit and disposal cost and other net disposals. |
During 2010, we recorded total impairment, disposal and restructuring charges, net, of $15.0 million. Included are impairment charges of $11.5 million on 16 O’Charley’s restaurants, seven Ninety Nine restaurants and three surplus properties. Also included is $3.2 million for exit and disposal costs relating to restaurant and facility closures. The remaining $0.3 million relates to other net losses on asset disposals.
During 2009, we recorded total impairment, disposal and restructuring charges, net, of $8.4 million. Included are impairment charges of $7.7 million on eight O’Charley’s restaurants, six Ninety Nine restaurants, and two Stoney River restaurants. The remaining $0.7 million charge relates to restructuring costs related to the closing of our Bellingham, Massachusetts distribution facility and the sale of a non-core asset.
During 2008, we recorded total impairment, disposal and restructuring charges, net, of $12.8 million. Included are impairment charges of $12.6 million on five O’Charley’s restaurants, eight Ninety Nine restaurants and two Stoney River restaurants. In addition, we sold our airplane and incurred other immaterial charges. This impairment charge was partially offset by net gains on the disposal of assets of $0.4 million.
During 2007, we recorded total impairment, disposal and restructuring charges, net, of $15.2 million. Included was a $10.2 million charge in connection with changes in our supply chain, which primarily consisted of non-cash charges taken for the loss on the sale of the commissary real estate and facility and related impairment of manufacturing equipment, charges taken for employee severance and retention, and to a lesser extent, legal and transition costs. We also recorded impairment and disposal costs of $5.2 million relating to restaurant impairments and other asset retirements during 2007. Included in the $5.2 million charge is the impairment related to three underperforming O’Charley’s restaurants, one Ninety Nine restaurant, and one Stoney River restaurant.
| (2) | In accordance with Financial Accounting Standards Board (“FASB”) Accounting Standards Codification (“ASC”) 350 “Intangibles – Goodwill and Other” (“FASB ASC 350”), in 2008 we recorded goodwill impairment charges of $93.1 million related to goodwill recorded in connection with the acquisition of the Ninety Nine concept and $0.6 million related to the acquisition of the Stoney River concept, resulting in the write off of all of the goodwill on our balance sheet. |
| (3) | For fiscal 2011, the income tax provision included a net valuation allowance increase of $10.2 million to offset the current year changes in deferred tax assets. For fiscal 2010, the income tax provision included a net valuation allowance increase of $18.6 million to offset the current year increase in deferred tax assets. For fiscal 2009, the income tax provision included a net valuation allowance increase of $6.5 million to offset the current year increase in deferred tax assets. For fiscal 2008, the income tax provision included a charge of $61.6 million to establish a valuation reserve for substantially all of our deferred tax assets. |
27
Table of Contents
| Item 7. | Management’s Discussion and Analysis of Financial Condition and Results of Operations. |
Overview
We are a multi-concept restaurant company headquartered in Nashville, Tennessee. We own and operate three restaurant concepts under the “O’Charley’s,” “Ninety Nine” and “Stoney River Legendary Steaks” trade names. As of December 25, 2011, we operated 221 O’Charley’s company-owned restaurants in 17 states in the East, Southeast and Midwest, 105 Ninety Nine restaurants in seven states throughout New England and upstate New York, and 10 Stoney River restaurants in six states in the East, Southeast and Midwest. As of December 25, 2011, we had six franchised O’Charley’s restaurants in four states in the Southeast and Midwest.
In response to the macroeconomic conditions of the past several years, much of management’s focus has been on improving guest satisfaction, stabilizing and increasing guest counts and sales, controlling margins, reducing overhead costs, maximizing cash flow, and reducing debt. While we believe that we have made progress in these areas, and that the tools we applied, such as our food, labor, and beverage cost management systems, continue to contribute positively to our operating results, we believe that we still have considerable opportunities to improve our financial performance.
Our Guest Satisfaction Index (“GSI”) scores, which we believe are a barometer signifying our guests’ intent to return to the restaurant, continued to improve during fiscal 2011. The percentage of respondents who gave the highest rating for overall satisfaction improved by 400 basis points at O’Charley’s, by 500 basis points at Ninety Nine, and by 300 basis points at Stoney River in fiscal 2011 compared to the prior-year period. Going forward, we believe that our primary focus must be on positioning each of our restaurant concepts to increase guest counts, sales, and profitability.
During 2011, each of our concepts produced positive comparable sales for the full year as compared to the prior year, with a 0.3% increase for O’Charley’s, a 3.9% increase for Ninety Nine and a 7.2% increase for Stoney River. Comparable sales at Ninety Nine and Stoney River concepts have produced positive comparable sales growth for six consecutive quarters. Guest counts and average check per guest increased at two of our three restaurant concepts. We are in the early stages of improving our ability to produce sustainable, long-term profitability growth and believe long-term success will come from continuing to focus on the key points of our turnaround plan: (1) lead with food and win with food: serving a menu of memorable offerings priced to provide a compelling value for our guests; (2) operate great restaurants: consistently delivering a quality dining experience; (3) drive guest counts through effective messages: clearly communicating the attributes of our concepts; and (4) provide attractive and comfortable restaurants: delivering a great environment for our guests every day at each O’Charley’s, Ninety Nine and Stoney River restaurant.
At our O’Charley’s restaurants, during 2011 we saw a slight increase in our comparable sales as compared to the prior-year. While sales and average check per guest increased, our comparable guest counts decreased. During the year we continued to build upon the concept’s existing strengths by simplifying the menu and improving the quality of menu items. We also continued our re-training and re-certification program with our restaurant management teams to improve service and execution, which were also aided by a simplified menu. In addition, we continue to strengthen the management team. During the third quarter we announced the hiring of Marc Buehler as the Concept President for O’Charley’s. Mr. Buehler has extensive experience in casual dining, most recently as President, CEO and a director of Kona Grill, Inc. Subsequent to our fiscal 2011 year-end, we announced the hiring of Rick Trebilcock as our O’Charley’s Vice President of Marketing. Mr. Trebilcock joined us from Potbelly Sandwich Shops and previously led the marketing team at Longhorn Steakhouse when it was owned by RARE Hospitality.
At our Ninety Nine restaurants, we continue to focus on our core guests, who we believe appreciate a friendly environment that offers generous portions of high-quality traditional fare at moderate prices. This “back to the basics” approach has produced six consecutive quarters of accelerating comparable sales growth along with improved guest counts and average check per guest during fiscal 2011.
At our Stoney River restaurants, we have focused on broadening the appeal of this brand to a wider audience. We believe this strategy is the primary reason that, Stoney River’s comparable guest counts have increased for nine consecutive quarters and comparable sales have grown for six consecutive quarters. We are now focused on refreshing our menu choices as well as bringing Stoney River’s cost structure in line with a lower check average.
In addition, during 2011, we redeemed at par $115.2 million principal amount of our 9% Senior Subordinated Notes which were to mature in November 2013 (“the “Senior Notes”). The gross proceeds of approximately $105.0 million from the sale-leaseback of 50 O’Charley’s restaurant properties combined with then available cash funded the redemption of the Senior Notes. The sale-leaseback was completed and announced on October 17, 2011. The Senior Note redemption was completed on November 16, 2011. The anticipated impact of these two transactions will be a
28
Table of Contents
decrease in annual interest expense associated with the Senior Notes of approximately $10.0 million, as well as approximately $2.5 million less in annual depreciation, partly offset by approximately $8.9 million of incremental annual rent expense. In addition, we recorded a loss in the fiscal fourth quarter of 2011 of approximately $1.2 million on the sale of certain properties included in the sale-leaseback transaction. Also on October 17, 2011 we entered into a Fourth Amended and Restated Credit Agreement with existing banks, which reduced our revolving credit facility to $30 million from $45 million and extended the facility’s term under our credit facility to 2016.
As announced subsequent to the end of fiscal 2011, on February 5, 2012, we signed a definitive merger agreement with FNF whereby FNF would acquire all of the outstanding shares of the Company’s common stock for $9.85 per share, representing a total equity value of approximately $221 million on a fully diluted basis. See Item 1 “Business – Proposed Acquisition of Our Company” and Note 24 of the “Notes to the Consolidated Financial Statements” for further information. Unless expressly noted to the contrary, all forward-looking statements in this Item 7 “Management’s Discussion and Analysis of Financial Condition and Results of Operations” relate to us on a stand-alone basis and are not reflective of the impact of the proposed transaction with FNF.
Fiscal years end on the last Sunday of the calendar year. Fiscal years 2011, 2010 and 2009 each consisted of 52 weeks. We have one reportable segment.
Following is an explanation of certain items in our consolidated statements of operations:
Revenues consist primarily of company-operated restaurant sales and, to a lesser extent, royalty and franchise revenue. Restaurant sales include food and beverage sales and are net of applicable state and local sales taxes and discounts. Franchise and other revenue consist of development fees, royalties on sales by franchised units, and royalties on sales of branded food items, particularly salad dressings. The development fees are recognized during the reporting period in which the developed restaurant begins operation. The royalties are recognized as revenue in the period corresponding to the franchisees’ sales. Revenue resulting from the sale of gift cards is recognized in the period redeemed. A percentage of gift card redemptions, based upon actual experience, is recognized as a reduction in restaurant operating cost for gift cards sold that will not be redeemed.
Cost of Food and Beverage primarily consists of the costs of beef, seafood, poultry and alcoholic and non-alcoholic beverages net of vendor discounts and rebates. The three most significant commodities that may affect our cost of food and beverage are beef, seafood, and poultry which accounted for approximately 25 percent, 13 percent and 10 percent, respectively, of our overall cost of food and beverage in fiscal 2011. Generally, temporary increases in these costs are not passed on to guests; however, in the past, we have adjusted menu prices to compensate for increased costs of a more permanent nature.
Payroll and Benefits include payroll and related costs and expenses directly relating to restaurant level activities including restaurant management salaries, bonuses, share-based compensation, 401(k) contribution match, hourly wages for restaurant level team members, payroll taxes, workers’ compensation programs, various health, life and dental insurance programs, vacation expense and sick pay. We have various incentive plans that compensate restaurant management for achieving certain restaurant level financial targets and performance goals.
Restaurant Operating Costs include occupancy and other expenses at the restaurant level, except property and equipment depreciation and amortization. In addition to occupancy costs, supplies, straight-line rent, supervisory salaries, bonuses, share-based compensation, 401(k) and deferred compensation match for multi-unit operational employees, benefits and related expenses, management training salaries, general liability and property insurance, property taxes, utilities, repairs and maintenance, outside services and credit card fees account for the major expenses in this category. A percentage of gift card redemptions, based upon actual experience, is recognized as a reduction in restaurant operating costs for gift cards sold that will not be redeemed.
Advertising and Marketing Expenses include all advertising and marketing-related expenses for the various programs that we utilize to promote traffic and brand recognition for our three restaurant concepts. This category also includes the administrative costs of our marketing departments. We expense advertising and marketing costs in the year incurred, except for certain advertising production costs that are initially capitalized and subsequently expensed the first time the advertising takes place.
General and Administrative Expenses include the costs of the administrative functions that support the existing restaurant base and provide the infrastructure for future growth. Executive management and support staff salaries, bonuses, share-based compensation, 401(k) and deferred compensation match for support employees, benefits, and related expenses, data processing, legal and accounting expenses, changes in the liabilities associated with plan gains or
29
Table of Contents
losses in employees’ self-directed non-qualified deferred compensation plan accounts, and office expenses account for the major expenses in this category. This category also includes all recruiting, relocation and most severance-related expenses. Severance costs associated with the 2010 restaurant closures and the 2009 sale of the Ninety Nine distribution operations are included in the “Impairment, disposal and restructuring charges, net” line.
Depreciation and Amortization, Property and Equipment primarily includes depreciation on property and equipment calculated on a straight-line basis over the estimated useful lives of the respective assets or the lease term plus one renewal term for leasehold improvements, if shorter. Based on the size of the investment that we make, the economic penalty incurred by discontinuing use of the leased facility, our historical experience with respect to the length of time a restaurant operates at a specific location, and leases that typically have multiple five-year renewal options that are exercised entirely at our discretion, we have concluded that one five-year renewal option is reasonably assured.
Impairment, Disposal and Restructuring Charges, net includes asset impairments, either operating or held for sale, severance and other exit costs for closed locations, asset disposals, gains and losses incurred upon the sale of assets, and to a lesser extent, various costs associated with restructuring our supply chain. Impairment charges are taken for land, buildings and equipment and certain other assets whenever events or changes in circumstances indicate that the carrying amount of an asset may not be recoverable. Recoverability of assets to be held and used is measured by a comparison of the carrying amount of the assets to the future undiscounted net cash flows expected to be generated by the assets. The impairment to be recognized is measured by the amount by which the carrying amount of the asset exceeds the fair value of the asset. Impairment charges for assets that are held for sale represent the difference between their current book value and the estimated net sales proceeds. Disposal charges include the costs incurred to prepare the asset or assets for sale, including repair and maintenance; clean up costs; broker commissions; and independent appraisals. Gains and/or losses associated with the sale of assets are also included in this category. Exit and disposal costs are primarily future lease obligations net of expected sublease income, if any, or changes in these net future lease obligations.
We evaluate restaurant closures for potential disclosure as discontinued operations based on an assessment of quantitative and qualitative factors, including the nature of the closure, potential for revenue migration to other company-operated and franchised restaurants, planned market development in the area of the closed restaurant, costs shared with open locations, and the significance of the impact on the related consolidated financial statement line items.
Pre-opening Costs represent costs associated with our store opening teams, as well as other costs associated with opening a new restaurant. These costs are expensed as incurred. These costs also include straight-line rent related to leased properties from the period of time between when we have waived any contingencies regarding use of the leased property and the date on which the restaurant opens. The amount of pre-opening costs incurred in any one period includes costs incurred during the period for restaurants opened and under development. Our pre-opening costs may vary significantly from period to period primarily due to the timing of restaurant development and openings. Pre-opening costs were not material in 2011. Pre-opening costs also include training, supply, and other incremental costs necessary to prepare for the re-opening of an existing restaurant as part of re-branding or remodeling initiatives.
Interest Expense, net represents the sum of the following: interest on our 9% Senior Subordinated notes (the “Senior Notes”) which were fully redeemed during the fourth fiscal quarter of 2011; interest and fees associated with our credit facility; amortization of prepaid interest and finance charges; impact of the interest rate swaps that were terminated in December 2008; amortization of the swap exit payment; changes in the value of the assets associated with our non-qualified deferred compensation plan resulting from gains and losses in the underlying funds; and interest on capital lease obligations; and the premiums paid over the face value of any Senior Notes repurchased during the relevant fiscal period.
Income Tax Expense (Benefit) represents the provision for income taxes, including the impact of permanent tax differences, uncertain tax provisions and valuation allowances on our income tax provision.
Loss from Discontinued Operations, Net includes the operating results of closed locations classified as discontinued operations and impairment, disposal and exit costs related to these restaurants and ongoing real estate, utility and maintenance costs, net of income taxes. Impairment charges are taken for land, buildings and equipment and certain other assets upon closing and are measured by the amount by which the carrying amount of the asset exceeds the fair value of the asset based upon the future highest and best use of the impaired asset. Exit costs represent activities necessary to close the restaurant, including termination benefits such as severance, contract termination costs, and other contract costs that will remain without future economic benefit, such as operating leases. Remaining operating lease obligations are reduced by estimated sublease rentals that could be reasonably obtained.
30
Table of Contents
Results of Operations
The following information should be read in conjunction with our consolidated financial statements and the related notes. The following table reflects our operating results for fiscal years 2011, 2010, and 2009 as a percentage of total revenues unless otherwise indicated. All fiscal years were comprised of 52 weeks. Fiscal year 2009 has been adjusted to reflect the discontinued operations of certain restaurant locations closed during 2010.
| 2011 | 2010 | 2009 | ||||||||||
| Revenues: |
||||||||||||
| Restaurant sales |
99.9 | % | 99.9 | % | 99.9 | % | ||||||
| Franchise and other revenue |
0.1 | 0.1 | 0.1 | |||||||||
|
|
|
|
|
|
|
|||||||
| 100.0 | % | 100.0 | % | 100.0 | % | |||||||
|
|
|
|
|
|
|
|||||||
| Costs and Expenses: |
||||||||||||
| Cost of restaurant sales: (1) |
||||||||||||
| Cost of food and beverage |
31.5 | % | 29.9 | % | 29.1 | % | ||||||
| Payroll and benefits |
34.7 | 35.4 | 35.3 | |||||||||
| Restaurant operating costs |
21.2 | 21.1 | 19.9 | |||||||||
|
|
|
|
|
|
|
|||||||
| Cost of restaurant sales, exclusive of depreciation and amortization shown separately below |
87.4 | 86.4 | 84.3 | |||||||||
| Advertising and marketing expenses |
4.3 | 4.2 | 3.7 | |||||||||
| General and administrative expenses |
3.9 | 4.8 | 4.4 | |||||||||
| Depreciation and amortization of property and equipment |
4.4 | 5.1 | 5.4 | |||||||||
| Impairment, disposal, and restructuring charges, net |
0.3 | 1.8 | 1.0 | |||||||||
| Pre-opening costs |
— | — | 0.1 | |||||||||
|
|
|
|
|
|
|
|||||||
| (Loss) Income from Operations |
(0.2 | ) | (2.1 | ) | 1.2 | |||||||
| Other Expense: |
||||||||||||
| Interest expense, net |
1.2 | 1.4 | 1.3 | |||||||||
| Loss from Continuing Operations Before Income Taxes |
(1.4 | ) | (3.5 | ) | (0.1 | ) | ||||||
| Income Tax Expense (Benefit) |
0.1 | (0.2 | ) | 0.3 | ||||||||
|
|
|
|
|
|
|
|||||||
| Loss from Continuing Operations |
(1.5 | ) | (3.3 | ) | (0.4 | ) | ||||||
| Loss from Discontinued Operations, net |
— | (0.9 | ) | (0.5 | ) | |||||||
|
|
|
|
|
|
|
|||||||
| Net Loss |
(1.5 | )% | (4.2 | )% | (0.9 | )% | ||||||
|
|
|
|
|
|
|
|||||||
| (1) | Shown as a percentage of restaurant sales. |
31
Table of Contents
The following information should be read in conjunction with our consolidated financial statements and the related notes. The following table reflects the margin performance of each of our concepts for fiscal years 2011, 2010, and 2009 as a percentage of restaurant sales for each respective concept. All fiscal years were comprised of 52 weeks. Fiscal year 2009 has been adjusted to reflect the discontinued operations of certain restaurant locations closed during 2010.
| 2011 | 2010 | 2009 | ||||||||||
| O’Charley’s Concept: (1) |
||||||||||||
| Restaurant Sales: |
$ | 519.5 | $ | 529.2 | $ | 558.9 | ||||||
| Cost and expenses (2) |
||||||||||||
| Cost of food and beverage |
32.0 | % | 29.9 | % | 29.0 | % | ||||||
| Payroll and benefits |
34.7 | % | 35.6 | % | 35.2 | % | ||||||
| Restaurant operating costs (3) |
21.1 | % | 20.6 | % | 19.0 | % | ||||||
|
|
|
|
|
|
|
|||||||
| Costs of restaurant sales, exclusive of depreciation and amortization |
87.8 | % | 86.1 | % | 83.2 | % | ||||||
| Ninety Nine Concept: |
||||||||||||
| Restaurant Sales: |
$ | 272.3 | $ | 265.9 | $ | 273.5 | ||||||
| Cost and expenses (2) |
||||||||||||
| Cost of food and beverage |
30.0 | % | 29.1 | % | 28.5 | % | ||||||
| Payroll and benefits |
35.8 | % | 36.3 | % | 36.3 | % | ||||||
| Restaurant operating costs (3) |
21.6 | % | 22.2 | % | 21.5 | % | ||||||
|
|
|
|
|
|
|
|||||||
| Costs of restaurant sales, exclusive of depreciation and amortization |
87.4 | % | 87.6 | % | 86.3 | % | ||||||
| Stoney River Concept: |
||||||||||||
| Restaurant Sales: |
$ | 34.3 | $ | 33.9 | $ | 32.9 | ||||||
| Cost and expenses (2) |
||||||||||||
| Cost of food and beverage |
36.8 | % | 35.7 | % | 36.1 | % | ||||||
| Payroll and benefits |
27.0 | % | 26.9 | % | 29.3 | % | ||||||
| Restaurant operating costs (3) |
19.3 | % | 19.9 | % | 20.7 | % | ||||||
|
|
|
|
|
|
|
|||||||
| Costs of restaurant sales, exclusive of depreciation and amortization |
83.1 | % | 82.5 | % | 86.1 | % | ||||||
| (1) | Includes revenue from O’Charley’s joint venture operations of $5.4 million for fiscal year 2009 and associated costs and expenses, but excludes revenue from franchised restaurants. During 2009, we acquired the remaining interests of both our joint venture operations. |
| (2) | Shown as a percentage of restaurant sales. |
| (3) | Includes rent, where 100 percent of the Ninety Nine restaurant locations are leased compared to 80 percent of O’Charley’s restaurant locations and 70 percent of Stoney River restaurant locations. In 2010, we leased 57 percent of O’Charley’s restaurant locations. The change in 2011 is from the sale-leaseback transaction completed during the fourth quarter of 2011. |
32
Table of Contents
The following tables set forth certain unaudited financial and other restaurant data relating to company-owned restaurants, unless otherwise specified. All fiscal years were comprised of 52 weeks and include the operations of certain restaurant locations closed during 2010, which are classified as discontinued operations in the accompanying financial statements.
| 2011 | 2010 | 2009 | ||||||||||
| Number of Restaurants: |
||||||||||||
| O’Charley’s Restaurants: (1) |
||||||||||||
| In operation, beginning of year |
221 | 235 | 232 | |||||||||
| Restaurants opened/acquired (2) |
— | — | 3 | |||||||||
| Restaurants closed |
— | (14 | ) | — | ||||||||
|
|
|
|
|
|
|
|||||||
| In operation, end of year |
221 | 221 | 235 | |||||||||
|
|
|
|
|
|
|
|||||||
| Ninety Nine Restaurants: |
||||||||||||
| In operation, beginning of year |
106 | 116 | 116 | |||||||||
| Restaurants opened |
— | — | 1 | |||||||||
| Restaurants closed |
(1 | ) | (10 | ) | (1 | ) | ||||||
|
|
|
|
|
|
|
|||||||
| In operation, end of year |
105 | 106 | 116 | |||||||||
|
|
|
|
|
|
|
|||||||
| Stoney River Restaurants: |
||||||||||||
| In operation, beginning of year |
11 | 11 | 11 | |||||||||
| Restaurants opened |
— | — | 1 | |||||||||
| Restaurants closed |
(1 | ) | — | (1 | ) | |||||||
|
|
|
|
|
|
|
|||||||
| In operation, end of year |
10 | 11 | 11 | |||||||||
|
|
|
|
|
|
|
|||||||
| Franchise / Joint Venture Restaurants (O’Charley’s): |
||||||||||||
| In operation, beginning of year |
9 | 10 | 12 | |||||||||
| Restaurants opened |
— | — | 2 | |||||||||
| Restaurants closed/ acquired |
(3 | ) | (1 | ) | (4 | ) | ||||||
|
|
|
|
|
|
|
|||||||
| In operation, end of year |
6 | 9 | 10 | |||||||||
|
|
|
|
|
|
|
|||||||
| Average Weekly Sales per Store: |
||||||||||||
| O’Charley’s |
$ | 45,209 | $ | 44,107 | $ | 46,189 | ||||||
| Ninety Nine |
49,499 | 46,611 | 46,734 | |||||||||
| Stoney River |
65,774 | 59,206 | 59,456 | |||||||||
| Increase (Decrease) in Comparable Store Sales (3): |
||||||||||||
| O’Charley’s |
0.3 | % | (4.9 | )% | (5.8 | )% | ||||||
| Ninety Nine |
3.9 | % | (1.5 | )% | (6.8 | )% | ||||||
| Stoney River |
7.2 | % | (1.5 | )% | (16.4 | )% | ||||||
| (Decrease) Increase in Comparable Store Guest Visits (3): |
||||||||||||
| O’Charley’s |
(1.2 | )% | (1.6 | )% | (4.8 | )% | ||||||
| Ninety Nine |
3.0 | % | (1.6 | )% | (4.7 | )% | ||||||
| Stoney River |
9.0 | % | 9.8 | % | (4.7 | )% | ||||||
| Increase (Decrease) in Comparable Store Average Check per Guest (3): |
||||||||||||
| O’Charley’s |
1.5 | % | (3.4 | )% | (1.1 | )% | ||||||
| Ninety Nine |
0.9 | % | 0.1 | % | (2.2 | )% | ||||||
| Stoney River |
(1.7 | )% | (10.2 | )% | (12.3 | )% | ||||||
| Average Check per Guest (4): |
||||||||||||
| O’Charley’s |
$ | 12.64 | $ | 12.43 | $ | 12.85 | ||||||
| Ninety Nine |
14.79 | 14.59 | 14.62 | |||||||||
| Stoney River |
35.90 | 36.97 | 41.22 | |||||||||
| (1) | “O’Charley’s Restaurants” refers to O’Charley’s company-owned restaurants only. |
| (2) | Represents the acquisition of the remaining ownership interests in our Wi-Tenn Restaurants, LLC joint venture on June 2, 2009 and JFC Enterprises, LLC joint venture on September 28, 2009. |
| (3) | When computing comparable store sales, guest visits and average check per guest, restaurants open for at least 78 weeks are compared from period to period for company-owned restaurants. |
| (4) | The average check per guest is computed using all restaurants open during the year. |
33
Table of Contents
Fiscal Year 2011 Compared with Fiscal Year 2010
Overview
The comparison between our financial results in fiscal 2011 and our financial results in fiscal 2010 was impacted by a number of developments. Comparable store sales and average weekly sales increased at each of our concepts during fiscal 2011 as compared to fiscal 2010. During 2011 we closed two under-performing restaurants. During fiscal 2010, we closed 24 under-performing restaurants, of which nine were considered discontinued operations, and incurred impairment, disposal and restructuring charges of $20.9 million, of which $5.9 million is included in loss from discontinued operations, net on our consolidated statement of operations. The following discussion of year-over-year results pertains only to those locations included in our continuing operations.
Revenues
During fiscal 2011, total revenues decreased $3.0 million, or 0.4 percent, to $827.1 million from $830.1 million in fiscal 2010.
Restaurant sales for company-operated O’Charley’s decreased $9.7 million, or 1.8 percent, to $519.5 million during fiscal 2011, primarily reflecting a comparable store sales increase of 0.3 percent and the closure of ten restaurants since the beginning of fiscal 2010. The closure of the ten restaurants reduced sales in the current year by $11.3 million. The comparable store sales increase of 0.3 percent was the result of a 1.5 percent increase in average check partly offset by a 1.2 percent decrease in guest counts. The 1.5 percent increase in average check increased sales by $7.7 million compared to the prior-year period, while the 1.2 percent decrease in guest counts decreased sales by $6.3 million compared to the prior-year period.
Restaurant sales for Ninety Nine increased $6.4 million, or 2.4 percent, to $272.3 million during fiscal 2011 primarily reflecting a comparable store sales increase of 3.9 percent and the closure of six restaurants since the beginning of fiscal 2010. The closure of the six restaurants reduced sales in the current year by $3.4 million. The comparable store sales increase of 3.9 percent was the result of a 3.0 percent increase in guest counts and a 0.9 percent increase in average check. The 3.0 percent increase in guest counts increased sales by $7.7 million compared to the prior-year period, while the 0.9 percent increase in average check increased sales by $2.5 million compared to the prior-year period.
Restaurant sales for Stoney River Legendary Steaks increased $0.4 million, or 1.2 percent, to $34.3 million during fiscal 2011 primarily reflecting a comparable store sales increase of 7.2 percent and the closure of one restaurant during fiscal 2011. The closure of the restaurant reduced sales in the current year by $1.9 million. The comparable store sales increase of 7.2 percent was the result of a 9.0 percent increase in guest counts partially offset by a 1.7 percent decrease in average check. The 9.0 percent increase in guest counts increased sales by $2.8 million compared to the prior-year period, while the 1.7 percent decrease in average check decreased sales by $0.6 million compared to the prior-year period.
Cost of Food and Beverage
During fiscal 2011, our cost of food and beverage was $260.6 million, or 31.5 percent of restaurant sales, compared with $247.5 million, or 29.9 percent of restaurant sales, in the prior-year period. A number of factors contributed to this $13.1 million increase in food and beverage costs. In addition to changes in trends in consumer behavior, we routinely adjust our product offerings, pricing, and promotional incentives among other factors that collectively comprise our product mix during any given period. During the 2011 fiscal year, we believe the increase is due to a $15.1 million increase in our commodity costs, primarily for beef. This increase was partly offset by a $1.2 million decrease attributed to changes to our product mix, and a $0.8 million decrease attributed to a decline in our restaurant sales.
34
Table of Contents
Payroll and Benefits
During fiscal 2011, payroll and benefits were $287.0 million, or 34.7 percent of restaurant sales, compared to $293.6 million, or 35.4 percent of restaurant sales, in fiscal 2010. As a percentage of restaurant sales, payroll and benefits declined as compared to the prior-year period due primarily to higher productivity from better utilization of our scheduling tools, partly offset by an increase in payroll taxes due to the prior-year period including a credit from the adoption of the Hiring Incentives to Restore Employment (“HIRE”) Act and increased current year employee bonuses. The HIRE Act was not extended to fiscal 2011.
Restaurant Operating Costs
During fiscal 2011, restaurant operating costs were $174.7 million, or 21.2 percent of restaurant sales, compared to $175.0 million, or 21.1 percent of restaurant sales, in fiscal 2010. The $0.3 million year-over-year decrease is due primarily to several partly offsetting items. As compared to the prior-year period, reductions in utilities cost of $1.7 million and general liability expense of $0.8 million were partly offset by an increase in repair and maintenance costs of $0.9 million, an increase in base rent expense of $0.9 million due to the sale-leaseback of 50 owned O’Charley’s properties and increased fees of $0.4 million due to an increase in gift card sales through retail channels.
Advertising and Marketing Expenses
During fiscal 2011, advertising and marketing expenditures were $35.5 million, or 4.3 percent of total revenues, compared to $34.7 million, or 4.2 percent of total revenues, in fiscal 2010. The $0.8 million year-over-year increase is due to an increased investment in social, digital, and television media in our efforts to support our value offering and message.
General and Administrative Expenses
During fiscal 2011, general and administrative expenses were $31.9 million, or 3.9 percent of total revenues, compared to $39.5 million, or 4.8 percent of total revenues, in fiscal 2010. This net 90 basis point decrease in general and administrative expenses is due primarily to a $5.4 million reduction in net compensation, including salaries and bonuses, share-based compensation and severance and a $0.4 million decrease due to a loss in our deferred compensation plan as compared to a gain in the prior-year.
Depreciation and Amortization
During fiscal 2011, depreciation and amortization expense was $36.1 million, or 4.4 percent of total revenues, as compared to $42.1 million, or 5.1 percent of total revenues, in fiscal 2010. This reduction in depreciation is primarily due to lower carrying values of assets following restaurant impairment charges recognized in prior fiscal years as well as the sale-leaseback transaction completed in the fourth quarter of 2011.
Impairment, disposal and restructuring charges, net
Impairment, disposal and restructuring charges, net were $2.9 million, or 0.3 percent of total revenues, in fiscal 2011, compared to $15.0 million, or 1.8 percent of total revenues, in fiscal 2010. Included in fiscal 2011 are impairment charges of $1.4 million on three O’Charley’s restaurants, a $1.2 million loss on sale on six O’Charley’s restaurants included in the sale-leaseback transaction and $0.2 million on three assets held for sale. Also included is a gain of $0.2 million due to net reductions of previously closed locations’ future lease obligations offset by $0.3 million of exit and disposal costs and other net disposal costs. Included in fiscal 2010 are impairment charges of $11.5 million for 16 O’Charley’s restaurants, seven Ninety Nine restaurants and three surplus properties. Also included is $3.2 million for exit and disposal costs relating to restaurant and other facility closures. The remaining $0.3 million relates to other net losses on asset disposals.
Pre-opening Costs
There were no pre-opening costs incurred during 2011 and in 2010 as they were insignificant. There were no new restaurant developments during fiscal 2011 or 2010.
35
Table of Contents
Interest Expense, net
Our net interest expense was $9.6 million or 1.2 percent of total revenues, in fiscal 2011, as compared to $11.8 million, or 1.4 percent of total revenues, in 2010. This $2.2 million decrease is primarily due to our repurchase of the remaining $115.2 million of our Senior Notes in the fourth quarter of 2011.
Income Taxes
For fiscal 2011 we have recorded income tax expense of $0.7 million, compared with $1.8 million of tax benefit in the prior year. Our tax expense includes only the portion associated with continuing operations. This reflects a rate of 5.8 percent applied against our full year pretax loss, and includes changes in deferred tax assets and liabilities and changes in accruals for uncertain tax positions.
Loss from Discontinued Operations, Net
During fiscal 2011, we recorded a $0.2 million loss from discontinued operations, compared to a loss of $7.6 million, net of taxes, in 2010. For fiscal 2011, we recorded exit and disposal costs and the adjustment of future lease obligations for previously closed locations of $0.6 million, partially offset by a gain from the sale of assets held for sale of $0.4 million. During fiscal 2010, we closed nine restaurants that were treated as discontinued operations. Asset impairment charges related to these closed restaurants were $4.8 million and exit and disposal costs were $1.1 million, primarily severance and the present value of future lease obligations, net of expected sublease income. In addition, these restaurants had a combined net loss from operations of $1.7 million during fiscal 2010.
Fiscal Year 2010 Compared with Fiscal Year 2009
Overview
The comparison between our financial results in fiscal 2010 and our financial results in fiscal 2009 was impacted by a number of developments. We continued to experience declines in comparable store sales and average weekly sales at each of our concepts due to the economic environment, however comparable store sales trends improved in the second half of fiscal 2010 as compared to the prior-year period. During fiscal 2010, we closed 24 restaurants, of which nine were considered discontinued operations, and incurred impairment, disposal and restructuring charges of $20.9 million, of which $5.9 million is included in loss from discontinued operations, net on our consolidated statement of operations. The following discussion on year over year results pertains only to those locations included in our continuing operations.
Revenues
During fiscal 2010, total revenues decreased $36.2 million, or 4.2 percent, to $830.1 million from $866.3 million in 2009. In 2010, average check and same-store guest visits decreased at O’Charley’s and Ninety Nine; and average check decreased and same-store guest visits increased at Stoney River Legendary Steaks. We believe these decreases in average check and same store guest visits were due primarily to weak consumer demand caused by the current economic environment. As consumers became more value conscious, we offered a greater variety of lower priced menu options and discounts.
Restaurant sales for O’Charley’s decreased $29.7 million, or 5.3 percent, to $529.2 million during fiscal 2010, reflecting a decline in same-store sales of 4.9 percent and the closure of ten restaurants. The closure of the ten restaurants reduced sales in the current year by $2.2 million. The same-store sales decrease of 4.9 percent was the result of a 3.4 percent decrease in average check and a 1.6 percent decrease in guest counts. The 3.4 percent decrease in average check reduced sales by $18.2 million compared to the prior-year period, while the 1.6 percent decrease in guest counts decreased sales by $8.8 million compared to the prior-year period.
Restaurant sales for Ninety Nine decreased $7.6 million, or 2.8 percent, to $265.9 million during fiscal 2010, reflecting a decline in same-store sales of 1.5 percent and the closing of five restaurants. The closure of the five restaurants reduced sales in the current year by $3.8 million. The same-store sales decrease of 1.5 percent was the result of a 1.6 percent decrease in guest counts partly offset by a 0.1 percent increase in average check. The 1.6 percent decrease in guest counts reduced sales by $4.4 million compared to the prior-year period, while the 0.1 percent increase in average check increased sales by $0.2 million compared to the prior-year period.
36
Table of Contents
Restaurant sales for Stoney River Legendary Steaks increased $1.0 million, or 3.0 percent, to $33.9 million during fiscal 2010. Same-store sales decreased 1.5 percent. The same-store sales decrease of 1.5 percent was the result of a 10.2 percent decrease in average check partly offset by a 9.8 percent increase in guest counts. The 10.2 percent decrease in average check decreased sales by $3.4 million compared to the prior-year period, while the 9.8 percent increase in guest counts increased sales by $2.9 million compared to the prior-year period. The reduction due to the same-store sales decrease was offset by the fiscal 2010 comparative net sales increase resulting from the timing of 2009 store openings and closures.
Cost of Food and Beverage
During fiscal 2010, our cost of food and beverage was $247.6 million, or 29.9 percent of restaurant sales, compared with $252.2 million, or 29.1 percent of restaurant sales, in the same prior-year period. A number of factors contributed to this $4.6 million decrease in food and beverage costs. In addition to changes in trends in consumer behavior, we routinely adjust our product offerings, pricing, and promotional incentives among other factors that collectively comprise our product mix during any given period. During fiscal 2010, we believe the changes to our product mix increased our cost of food and beverage by approximately $10.5 million. This increase was more than offset by a $10.6 million decrease in cost of food and beverage attributable to our decline in sales and a $4.5 million decrease attributed to a reduction in our commodity costs for beef and wheat, partly offset by increase in costs for seafood.
Payroll and Benefits
During fiscal 2010, payroll and benefits were $293.6 million, or 35.4 percent of restaurant sales, compared to $305.4 million, or 35.3 percent of restaurant sales, in fiscal 2009. Payroll and benefit costs as a percentage of restaurant sales was essentially flat when compared to fiscal 2009 due to the de-leveraging impact of lower average weekly sales offset by net reductions in other payroll and benefits costs. The $11.7 million year-over-year decline is due primarily to lower payroll of $4.9 million due primarily to lower sales, reduced bonus expense of $4.2 million due to our operating performance, a reduction in payroll taxes of $2.1 million primarily related to the adoption of the (HIRE) Act, and reduced insurance costs of $1.3 million, partly offset by an increased investment in training of $0.9 million, reflecting our re-training and certification efforts.
Restaurant Operating Costs
During fiscal 2010, restaurant operating costs were $175.0 million, or 21.1 percent of restaurant sales, compared to $171.9 million, or 19.9 percent of restaurant sales, in fiscal 2009. The $3.1 million year-over-year increase is due primarily to a $1.2 million increase in repair and maintenance costs and a $1.0 million increase in our general liability cost due to claims experience.
Advertising and Marketing Expenses
During fiscal 2010, advertising and marketing expenditures were $34.7 million, or 4.2 percent of total revenues, compared to $32.2 million, or 3.7 percent of total revenues, in fiscal 2009. The $2.5 million year-over-year increase is due to an increased investment in television, radio, and print media in our efforts to support our value offerings and message.
General and Administrative Expenses
During fiscal 2010, general and administrative expenses were $39.5 million, or 4.8 percent of total revenues, compared to $38.3 million, or 4.4 percent of total revenues, in fiscal 2009. This net 40 basis point increase in general and administrative expenses is due to the de-leveraging impact of lower sales and $3.4 million of severance costs related to management changes and reductions in our support center staff. Excluding this severance charge, fiscal 2010 general and administrative costs were slightly below fiscal 2009 as a percentage of total revenues.
Depreciation and Amortization
During fiscal 2010, depreciation and amortization expense was $42.1 million, or 5.1 percent of total revenues, as compared to $46.5 million, or 5.4 percent of total revenues, in fiscal 2009. This reduction in depreciation was primarily due to lower carrying values of assets following restaurant impairment charges recognized in fiscal 2010 and prior-year periods.
37
Table of Contents
Impairment, disposal and restructuring charges, net
Impairment, disposal and restructuring charges, net were $15.0 million, or 1.8 percent of total revenues, in fiscal 2010, compared to $8.4 million, or 1.0 percent of total revenues, in fiscal 2009. Included in fiscal 2010 are impairment charges of $11.5 million for 16 O’Charley’s restaurants, seven Ninety Nine restaurants and three surplus properties. Also included is $3.2 million for exit and disposal costs relating to restaurant and other facility closures. The remaining $0.3 million relates to other net losses on asset disposals. Included in 2009 are impairment charges of $7.7 million on eight O’Charley’s restaurants, six Ninety Nine restaurants and two Stoney River restaurants. The remaining $0.7 million charge relates to restructuring costs related to the closing of our Bellingham, Massachusetts distribution facility and the sale of a non-core asset.
Pre-opening Costs
Pre-opening costs during fiscal 2010 were insignificant compared to $0.6 million during fiscal 2009. This decrease in pre-opening costs was the result of no new restaurant development during the fiscal year.
Interest Expense, net
Our net interest expense was $11.8 million, or 1.4 percent of total revenues, in fiscal 2010, as compared to $11.6 million, or 1.3 percent of total revenues, in fiscal 2009. This $0.2 million increase is due to charges associated with changes in the value of deferred compensation balances, partly offset by reduced levels of debt.
Income Taxes
For fiscal 2010 we recorded income tax benefit of $1.8 million, compared with $2.3 million of tax expense in the prior year. Our tax benefit includes only the portion associated with continuing operations. This reflects a rate of 6.3 percent applied against our full year pretax loss, and includes changes in deferred tax assets and liabilities and changes in accruals for uncertain tax positions.
Loss from Discontinued Operations, Net
During fiscal 2010, we recorded a $7.6 million loss from discontinued operations, net of taxes, compared to a loss of $4.2 million in fiscal 2009. During fiscal 2010, we closed nine restaurants that were treated as discontinued operations. Asset impairment charges related to these closed restaurants were $4.8 million and exit and disposal costs were $1.1 million, primarily severance and the present value of future lease obligations, net of expected sublease income. In addition, these restaurants had a combined net loss from operations of $1.7 million during fiscal 2010. During fiscal 2009, we recorded a $4.2 million loss from discontinued operations, net of taxes, which included $2.9 million from asset impairments and a $1.3 million net loss from operations related to the nine restaurants closed in fiscal 2010.
38
Table of Contents
Liquidity and Capital Resources
Our primary sources of capital have historically been cash provided by operations, borrowings under our credit facilities and capital leases. Our principal capital needs have historically arisen from property and equipment additions, acquisitions, and payments on long-term debt and capitalized lease obligations. In addition, we lease a substantial number of our restaurants under operating leases and have substantial operating lease obligations. During the fourth fiscal quarter of 2011, we completed the sale-leaseback of 50 O’Charley’s properties generating $105.0 million of gross proceeds which, along with existing cash, were used to retire the $115.2 million of our outstanding Senior Notes.
Like many restaurant companies, our working capital has historically had current liabilities in excess of current assets due to collection of our sales being received in four days or less while our typical accounts payable turnover, excluding food invoices, averages thirty days. We do not believe this indicates a lack of liquidity. We have slowed our restaurant development in recent years in order to focus on improving the performance of our existing restaurants and reducing our debt. We did not open any new company-owned restaurants at any of our concepts in 2011.
The following table presents a summary of our cash flows for the last three years (in thousands):
| 2011 | 2010 | 2009 | ||||||||||
| Net cash provided by operating activities |
$ | 19,046 | $ | 35,715 | $ | 48,392 | ||||||
| Net cash provided by (used in) investing activities |
87,644 | (14,321 | ) | (6,648 | ) | |||||||
| Net cash used in financing activities |
(117,772 | ) | (13,581 | ) | (26,682 | ) | ||||||
|
|
|
|
|
|
|
|||||||
| Net (decrease) increase in cash and cash equivalents |
$ | (11,082 | ) | $ | 7,813 | $ | 15,062 | |||||
Net cash provided by operating activities during fiscal 2011 was $19.0 million, a decrease of $16.7 million from fiscal 2010. This reduction in net cash provided by operating activities is due to a $6.7 million reduction in net earnings, after adjusting for non-cash charges and a $10.0 million use of cash due to the net change in working capital and other long-term assets and liabilities over the prior year. The $10.0 million net use of cash is primarily due to increased credit card and retail gift card sales receivables, payment timing of accounts payable and lower accruals for severance paid during 2011 and interest as our Senior Notes were retired in the fourth fiscal quarter of 2011.
Net cash provided by operating activities decreased in fiscal 2010 from fiscal 2009 by approximately 26 percent or $12.7 million. This reduction in net cash provided by operating activities is due to a $19.9 million reduction in net earnings, after adjusting for non-cash charges, partly offset by a $7.2 million net increase in the change in working capital and other long-term assets and liabilities over the prior year. The $7.2 million increase is primarily due to partly offsetting changes in accounts payable and inventory. The change in accounts payable is primarily due to the large reduction in payables in 2009 due to reductions to credit balances with certain financial institutions, the outsourcing of our Bellingham, Massachusetts distribution operations during 2009, and lower construction payables due to less construction activity at the end of 2009 as compared to 2008. Partly offsetting the changes in accounts payable were changes in inventory due to the 2009 phase out of our Bellingham, Massachusetts distribution operations and the use of inventory resulting from previous buying opportunities.
Net cash provided by investing activities during fiscal 2011 was $87.6 million, an increase of $102.0 million from fiscal 2010. The increase is due primarily to the $105.0 million in gross proceeds received from the fourth quarter 2011 sale-leaseback of 50 O’Charley’s properties, partly offset by $3.2 million of related transaction costs. Net cash used in investing activities increased in 2010 from 2009 by $7.7 million due primarily to 2009 sales of non-core assets and assets associated with the outsourcing of our Bellingham, Massachusetts distribution services.
Net cash used in financing activities during fiscal 2011 was $117.8 million, an increase of $104.2 million from fiscal 2010. The increase is due primarily to the fourth quarter redemption of the remaining $115.2 million of Senior Notes as compared to the repurchase of $9.8 million of Senior Notes in 2010. Net cash used in financing activities decreased in fiscal 2010 from fiscal 2009 by $13.1 million due primarily to a net decrease of $28.2 million for long-term debt and capital lease payments partly offset by fiscal 2009 payments from the counterparties of our swap agreements to exit the agreement in exchange for $3.5 million and the fiscal 2010 repurchase of our Senior Notes for $9.8 million.
We believe that our various sources of capital, including cash flow from operating activities, availability under our credit facility, and the ability to acquire additional financing, are adequate to fund our capital requirements for at least the next twelve months. As of the end of fiscal 2011, there were no amounts outstanding on our revolving credit facility and $0.2 million outstanding in debt and capital lease obligations. We had $12.8 million of outstanding letters of credit as of December 25, 2011. As of December 25, 2011, we had $17.2 million of remaining borrowing capacity under our revolving credit facility. We do not expect to rely on our credit facility as a significant source of funds during fiscal year 2012.
39
Table of Contents
During the fourth fiscal quarter of 2011, we entered into a Fourth Amended and Restated Credit Agreement (the “Credit Agreement”) with the existing banks under our revolving credit facility which reduced our revolving credit facility to $30 million from $45 million and extended the facility’s term to 2016. The maximum adjusted leverage ratio remained at 5.25. The fixed charge ratio was 1.20 in the fourth fiscal quarter of 2011, ranges from 1.15 to 1.20 in fiscal 2012, and is 1.25 thereafter. We are permitted to make capital expenditures for restaurant remodels and expansion under the new facility of up to $5.0 million for 2011 and up to 35% of the prior year’s Earnings Before Interest Taxes Depreciation and Amortization or EBITDA (as defined therein) for 2012 and the years thereafter. The Credit Agreement also reduced the number of company-owned restaurants subject to collateral mortgages from 47 to 45. As of December 25, 2011, the Company believes it was in compliance with all covenants included in the Credit Agreement.
We have four separate lease agreements that cover an aggregate of 30 of our Ninety Nine restaurants, each of which contains a fixed charge covenant calculation. Each of the four restaurant groups are subject to an annual fixed charge coverage ratio of 1.50 to 1.00. Each of these groups of restaurants were in compliance with this covenant as of the end of fiscal 2011.
In fiscal years 2011, 2010 and 2009, net cash flows provided by (used in) investing activities included capital expenditures incurred principally for improvements to existing restaurants and improvements in our information systems. Capital expenditures for 2011, 2010 and 2009, excluding computer equipment financed through a capital lease obligation of $0.1 million in 2011, were as follows:
| 2011 | 2010 | 2009 | ||||||||||
| (in thousands) | ||||||||||||
| New restaurant capital expenditures |
$ | — | $ | — | $ | 3,053 | ||||||
| Remodel capital expenditures |
301 | 3,096 | 1,184 | |||||||||
| Other capital expenditures |
16,910 | 12,349 | 10,427 | |||||||||
|
|
|
|
|
|
|
|||||||
| Total capital expenditures |
$ | 17,211 | $ | 15,445 | $ | 14,664 | ||||||
|
|
|
|
|
|
|
|||||||
40
Table of Contents
Contractual Obligations and Commercial Commitments
The following tables set forth our contractual obligations and commercial commitments at December 25, 2011 (in thousands):
| Payments Due by Period | ||||||||||||||||||||
| Contractual Obligation |
Total | Less than 1 Yr |
1-3 Yrs | 3-5 Yrs | More Than 5 Years |
|||||||||||||||
| Long-term debt, excluding credit facility |
$ | 65 | $ | 65 | $ | — | $ | — | $ | — | ||||||||||
| Long-term debt interest (1) |
3 | 3 | — | — | — | |||||||||||||||
| Capitalized lease obligations |
94 | 64 | 30 | — | — | |||||||||||||||
| Operating leases |
443,677 | 40,794 | 78,720 | 69,276 | 254,887 | |||||||||||||||
| Uncertain tax positions |
469 | 123 | 230 | 54 | 62 | |||||||||||||||
| Unconditional purchase obligations (2) |
269,027 | 154,871 | 93,092 | 21,064 | — | |||||||||||||||
|
|
|
|
|
|
|
|
|
|
|
|||||||||||
| Total contractual obligations |
$ | 713,335 | $ | 195,919 | $ | 172,073 | $ | 90,394 | $ | 254,949 | ||||||||||
|
|
|
|
|
|
|
|
|
|
|
|||||||||||
| Amount of Commitment Expiration per Period | ||||||||||||||||||||
| Other Commercial Commitments | Total | Less than 1 Yr |
1-3 Yrs | 3-5 Yrs | More Than 5 Years |
|||||||||||||||
| Line of credit (3) |
$ | — | $ | — | $ | — | $ | — | $ | — | ||||||||||
| (1) | This interest relates to notes payable to Stoney River Managing Partners. |
| (2) | These purchase obligations are primarily food obligations with fixed commitments in regards to the time period of the contract with annual price adjustments that can fluctuate and a fixed beverage contract with an annual price adjustment. In situations where the price is based on market prices, we use the existing market prices at December 25, 2011 to determine the amount of the obligation. Total unconditional purchase obligations shown are based on variable pricing that is adjusted annually. |
| (3) | The Company has a $30 million line of credit at December 25, 2011. At December 25, 2011, we had no amounts outstanding on this credit facility. We had $12.8 million of outstanding letters of credit as of December 25, 2011. As of December 25, 2011, we had $17.2 million of remaining borrowing capacity under our credit facility. |
41
Table of Contents
Franchise Arrangements
On May 18, 2005, we entered into a development agreement with O’Candall Group, Inc. and Sam Covelli. Under the terms of the agreement, O’Candall Group, Inc. and/or certain of its affiliates have the right to develop and operate up to 50 new O’Charley’s restaurants by November 2013. The development plans focus on the Tampa, Florida, Orlando, Florida, Western Pennsylvania, Northwest West Virginia and Northern Ohio markets. As of December 25, 2011, the O’Candall Group, Inc. operates five O’Charley’s restaurants.
The franchising arrangement requires us to provide access to certain contractual arrangements that we have with our vendors in order for the franchisee to benefit from those contracts. The development fees for the franchisee are $50,000 each for the initial restaurants and $25,000 each for the remaining restaurants in each of its five granted areas. The franchisee is also required to pay a franchise fee and marketing fund fee that are based on a percentage of sales. Pursuant to the arrangement, the franchisee was required to pay $500,000 as development fees at the closing of the agreement, which represents a portion of the fees associated with the 50 restaurants agreed upon. The franchisee is required to pay the remaining amount of the development fees to us as each new restaurant opens. No development fees for new restaurant openings were recognized in fiscal 2011 or 2010. The Company recognized income of $100,000 in development fees in 2009 for the opening of two restaurants and $50,000 in development fees for fiscal 2008 related to the opening of a franchised restaurant in each of those fiscal years. The remaining development fees paid have been deferred and will be recognized in income as each restaurant opens.
On February 1, 2007, we entered into an Operating Agreement with Delaware North Companies Travel Hospitality Services (“DNC”). Under the terms of the agreement, DNC and/or certain of its affiliates developed and operate one O’Charley’s Restaurant in the Nashville International Airport located in Nashville, Tennessee. The Operating Agreement requires us to provide access to certain contractual arrangements that we have with our vendors in order for the franchisee to benefit from those contracts. The fees for the franchisee were $30,000 for the restaurant. The franchisee is also required to pay a franchise fee that is based on a percentage of sales.
Critical Accounting Policies
We prepare our consolidated financial statements in conformity with U.S. GAAP. The preparation of these financial statements requires us to make estimates and assumptions that affect the reported amounts of assets and liabilities and disclosure of contingent assets and liabilities at the date of the financial statements, and the reported amounts of revenues and expenses during the reporting period (see Note 1 to our consolidated financial statements). Actual results could differ from those estimates. Critical accounting policies are those that management believes are both most important to the portrayal of our financial condition and operating results, and require management’s most difficult, subjective or complex judgments, often as a result of the need to make estimates about the effect of matters that are inherently uncertain. We base our estimates on historical experience and on various other assumptions that are believed to be reasonable under the circumstances, the results of which form the basis for making judgments about the carrying value of assets and liabilities that are not readily apparent from other sources. Judgments and uncertainties affecting the application of those policies may result in materially different amounts being reported under different conditions or using different assumptions. We consider the following policies to be most critical in understanding the judgments that are involved in preparing our consolidated financial statements.
Our critical accounting policies are as follows:
| • | Lease accounting |
| • | Share-based compensation |
| • | Property and equipment, net |
| • | Trademarks |
| • | Impairment of long-lived assets |
| • | Income taxes |
42
Table of Contents
Lease Accounting
Our policy for lease accounting involves recognizing rent on a straight-line basis from the time we are committed to a leased property, which is when all contingencies associated with the delivery of the property by the landlord are taken care of, to the end of the estimated lease term, which may include one or more renewal periods. The useful life over which leasehold improvements are depreciated is the shorter of the estimated useful life or the estimated lease term, which may include one or more renewal periods. We also recognize tenant allowances as a deferred rent liability and amortize them over the estimated lease term, which may include one or more renewal periods. Based upon the size of the investment that we make at a restaurant site, the economic penalty incurred by discontinuing use of the leased facility, our historical experience with respect to the length of time a restaurant operates at a specific location, and leases that typically have multiple five-year renewal options that are exercised entirely at our discretion, we have concluded that one five-year renewal option is reasonably assured.
Share-Based Compensation
We account for share-based compensation in accordance with FASB ASC 718, “Compensation – Stock Compensation,” (“FASB ASC 718”), which requires the measurement and recognition of compensation cost at fair value for all share-based payments including stock options. Share-based compensation for fiscal years 2011, 2010, and 2009 includes compensation expense, recognized over the applicable vesting periods for share-based awards granted prior to these fiscal years, as well as awards granted during these fiscal years.
We use the Black-Scholes-Merton option-pricing model to estimate the fair value of stock options on their grant dates. The Black-Scholes-Merton option pricing model requires various assumptions including the risk free rate, the expected term, the expected dividend yield, and the stock price volatility. If any of these assumptions used in the model change, share-based compensation expense may differ in the future from that recorded in the current period. The Company’s policy is to recognize compensation cost for restricted awards with only service conditions and a graded vesting schedule on a straight-line basis over the requisite service period for the entire award. Compensation expense is recognized for only the portion of options and restricted awards that are expected to vest. Therefore, an estimated forfeiture rate derived from historical employee terminations is applied against share-based compensation expense. The forfeiture rate is applied on a straight-line basis over the service (vesting) period for each separately vesting portion of the award as if the award was in-substance, multiple awards.
Property and Equipment, net
The Company had $220.7 million of property and equipment, net of accumulated depreciation, at December 25, 2011. Our property and equipment are stated at cost and depreciated on a straight-line basis over the following estimated useful lives: building and improvements-30 years; and furniture, fixtures and equipment-3 to 10 years. Leasehold improvements are amortized over the lesser of the asset’s estimated useful life or the expected lease term, inclusive of one renewal period. Equipment under capital leases is amortized to its expected residual value at the end of the lease term. Gains or losses are recognized upon the disposal of property and equipment, and the asset and related accumulated depreciation and amortization are removed from the accounts. Maintenance, repairs and betterments that do not enhance the value of or increase the life of the assets are expensed as incurred. We capitalize all direct external costs associated with obtaining the land, building and equipment for each new restaurant, as well as construction period interest. We also capitalize all direct external costs associated with obtaining the dining room and kitchen equipment, signage and other assets and equipment for each re-branded restaurant. In addition, for each new restaurant and re-branded restaurant we also capitalize a portion of the internal direct costs of our real estate and construction department.
To determine our accounting policies related to capitalizing costs associated with our in-house real estate department, we have taken guidance from FASB ASC 970, “Real Estate—General” (“FASB ASC 970”). While FASB ASC 970 establishes accounting and reporting standards for the acquisition, development, construction, selling and rental costs associated with real estate projects, it excludes from its scope “real estate developed by an entity for use in its own operations, other than for sale or rental.” Given there is no other authoritative literature directly addressing our circumstance of developing real estate projects for our own operations, we have applied the principles of FASB ASC 970 in such accounting for costs.
43
Table of Contents
Inherent in the policies regarding property and equipment are certain significant management judgments and estimates, including useful life, residual value to which the asset is depreciated, the expected value at the end of the lease term for equipment under capital leases, and the determination as to what constitutes enhancing the value of or increasing the life of assets. These significant estimates and judgments, coupled with the fact that the ultimate useful life and economic value at the end of a lease are typically not known until after the passage of time, through proper maintenance of the asset, or through continued development and maintenance of a given market in which a restaurant operates can, under certain circumstances, produce distorted or inaccurate depreciation and amortization or, in some cases result in a write down of the value of the assets. See Critical Accounting Policy “Impairment of Long-Lived Assets” below.
We believe that our accounting policy for property and equipment provides a reasonably accurate means by which the costs associated with an asset are recognized in expense as the cash flows associated with the asset’s use are realized.
Trademarks
Intangible assets with indefinite useful lives are tested for impairment at least annually. At December 25, 2011, we had a $25.9 million indefinite-lived intangible asset shown on our consolidated balance sheets related to the acquisition of Ninety Nine restaurants. The determination of whether this asset is impaired involves significant judgments based upon short-and long-term projections of future sales performance. Changes in strategy, new accounting pronouncements and/or market conditions may result in future impairment of recorded asset balances. We completed a valuation of this intangible asset as of December 25, 2011, the last day of fiscal 2011, and our valuation showed that the fair value of the intangible asset substantially exceeded its net book value and no impairment charge was needed.
Impairment of Long-Lived Assets
Long-lived assets and certain identifiable intangible assets are reviewed for impairment whenever events or changes in circumstances indicate that the carrying amount of an asset may not be recoverable. Recoverability of assets to be held and used is measured by a comparison of the carrying amount of an asset to future net undiscounted cash flows expected to be generated by the asset. If such assets are considered to be impaired, the impairment to be recognized is measured by the amount by which the carrying amount of the assets exceeds the fair value of the assets based upon the future highest and best use of the impaired assets. Assets to be disposed of are reported at the lower of carrying amount or fair value less costs to sell. The cost associated with asset impairments are recorded in the consolidated statement of operations in the financial statement line item impairment, disposal and restructuring charges, net.
The judgments made related to the ultimate expected useful life and our ability to realize undiscounted cash flows in excess of the carrying value of an asset are affected by such issues as ongoing maintenance of the asset, continued development of a given market within which a restaurant operates, including the presence of traffic generating businesses in the area, and our ability to operate the restaurant efficiently and effectively. We assess the projected cash flows and carrying values at the restaurant level whenever events or changes in circumstances indicate that the long-lived assets associated with a restaurant may not be recoverable. In determining projected cash flows, we make key assumptions regarding sales growth, food and labor and other restaurant operating costs, as well as local market expectations. In the event that our economic expectations are not met, estimated future cash flows could be negatively impacted, which may result in a material impairment charge.
We believe that our accounting policy for impairment of long-lived assets provides reasonable assurance that any assets that are impaired are written down to their fair value and a charge is taken in operating earnings on a timely basis. Long-lived assets are tested for possible impairment each fiscal quarter. During fiscal 2011, we recorded total impairment, disposal and restructuring charges, net, of $2.9 million. Included are impairment charges of $1.4 million on three O’Charley’s restaurants, a $1.2 million loss on the sale of six O’Charley’s restaurants included in the sale-leaseback transaction and $0.2 million on three assets held for sale. Also included is a gain of $0.2 million due to net reductions of previously closed location’s future lease obligations offset by $0.3 million of exit and disposal costs and other net disposals. During fiscal 2010, we recorded total impairment, disposal and restructuring charges, net, of $15.0 million. Included are impairment charges of $11.5 million on 16 O’Charley’s restaurants, seven Ninety Nine restaurants and three surplus properties. Also included is $3.2 million for exit and disposal costs relating to restaurant and facility closures. The remaining $0.3 million relates to other net losses on asset disposals. During fiscal 2009, we recorded total impairment, disposal and restructuring charges, net of $8.4 million. Included are impairment charges of $7.7 million on eight O’Charley’s restaurants, six Ninety Nine restaurants, and two Stoney River restaurants. The remaining $0.7 million charge relates to restructuring costs related to the closing of our Bellingham, Massachusetts distribution facility and the sale of a non-core asset.
44
Table of Contents
Income Taxes
We must make estimates of certain items that comprise our income tax provision and the related current and deferred tax liabilities. These estimates include employer tax credits for items such as FICA taxes paid on employee tip income, Work Opportunity and Welfare to Work credits, as well as estimates related to certain depreciation and capitalization policies. These estimates are made based on the best available information at the time of the provision and historical experience. We file our income tax returns many months after our year end. These returns are subject to audit by various federal, state and local governments several years after the returns are filed and could be subject to differing interpretations of the tax laws. We are also required to perform an analysis and measure each uncertain tax position. The analysis and measurement requires estimates and interpretations to be made. We base these estimates upon the best available information at that time of the provision and in coordination with our interpretation of existing tax law.
As part of the computation of the income tax provision, we identify and measure deferred tax assets and liabilities. We weigh available evidence in determining the realization of deferred tax assets. Available evidence includes historical, current and future financial performance of the Company. We also consider the scheduled reversal of deferred tax liabilities, projected future taxable income, and tax planning strategies in making this assessment. If we determine it is more likely than not that some portion or the entire deferred tax asset will not be recognized, the deferred tax asset will be reduced by a valuation allowance. The deferred tax valuation allowance may be released in future years when we consider that it is more likely than not that some portion or all of the deferred tax assets will be realized. To form a conclusion that some or all of the deferred tax assets will be realized, we will need to generate three-year cumulative pre-tax income, and we will need to periodically evaluate whether or not all available evidence, such as future taxable income and reversal of temporary differences, provides sufficient positive evidence to offset any other potential negative evidence that may exist at such time. In the event the deferred tax valuation allowance is released, we would record an income tax benefit for the portion or all of the deferred tax valuation allowance released. At December 25, 2011, the Company had a deferred tax valuation allowance of $101.0 million.
Recently Issued Accounting Pronouncements
In May 2011, the FASB issued Accounting Standards Update No. 2011-04, Amendments to Achieve Common Fair Value Measurement and Disclosure Requirements in U.S. GAAP and International Financial Reporting Standards (Topic 820)-Fair Value Measurement (“ASU 2011-04”), to provide a consistent definition of fair value and ensure that the fair value measurement and disclosure requirements are similar between U.S. GAAP and International Financial Reporting Standards. ASU 2011-04 changes certain fair value measurement principles and enhances the disclosure requirements particularly for level 3 fair value measurements. ASU 2011-04 is effective for the Company in its first quarter of fiscal 2012 and will be applied prospectively. The Company is currently evaluating the impact of adopting ASU 2011-04, but currently believes there will be no significant impact on its consolidated financial statements.
Impact of Inflation
The impact of inflation on the cost of food, labor, equipment, and fuel/energy costs could adversely affect our operations. A majority of our employees are paid hourly rates related to federal and state minimum wage laws. The federal government and several states have instituted or are considering changes to their minimum wage and/or benefit related laws which, if and when enacted, could have an adverse impact on our payroll and benefit costs. In addition, most of our leases require us to pay taxes, insurance, maintenance, repairs and utility costs, and these costs are subject to inflationary pressures. Commodity inflation has had a significant impact on our operating costs. We attempt to offset the effect of inflation through periodic menu price increases, economies of scale in purchasing and cost controls and efficiencies at our restaurants.
45
Table of Contents
| Item 7A. | Quantitative and Qualitative Disclosures About Market Risk. |
We are subject to market risk from exposure to changes in interest rates based on our financing, investing and cash management activities and fluctuations in commodity prices. Our fixed-rate debt consists primarily of capitalized lease obligations and our variable-rate debt consists primarily of our credit facility. A significant portion of our debt is at a fixed-rate; therefore a one percent fluctuation in interest rates is not expected to have a material impact on our results of operations.
We purchase certain commodities such as beef, pork, poultry, seafood, produce, and dairy. These commodities are generally purchased based upon market prices established with vendors. These purchase arrangements may contain contractual features that fix the price paid for certain commodities. We do not use financial instruments to hedge commodity prices because these purchase arrangements help control the ultimate cost paid and any commodity price aberrations are generally short-term in nature.
46
Table of Contents
| Item 8. | Financial Statements and Supplementary Data. |
INDEX TO CONSOLIDATED FINANCIAL STATEMENTS
O’CHARLEY’S INC.
47
Table of Contents
Report of Independent Registered Public Accounting Firm
The Board of Directors and Shareholders
O’Charley’s Inc.:
We have audited the consolidated balance sheets of O’Charley’s Inc. and subsidiaries (the Company) as of December 25, 2011 and December 26, 2010, and the related consolidated statements of operations, shareholders’ equity and comprehensive loss, and cash flows for each of the fiscal years in the three-year period ended December 25, 2011. In connection with our audits of the consolidated financial statements, we have also audited financial statement schedule II, Valuation and Qualifying Accounts. These consolidated financial statements and financial statement schedule are the responsibility of the Company’s management. Our responsibility is to express an opinion on these consolidated financial statements and financial statement schedule based on our audits.
We conducted our audits in accordance with the standards of the Public Company Accounting Oversight Board (United States). Those standards require that we plan and perform the audit to obtain reasonable assurance about whether the financial statements are free of material misstatement. An audit includes examining, on a test basis, evidence supporting the amounts and disclosures in the financial statements. An audit also includes assessing the accounting principles used and significant estimates made by management, as well as evaluating the overall financial statement presentation. We believe that our audits provide a reasonable basis for our opinion.
In our opinion, the consolidated financial statements referred to above present fairly, in all material respects, the financial position of O’Charley’s Inc. and subsidiaries as of December 25, 2011 and December 26, 2010, and the results of their operations and their cash flows for each of the fiscal years in the three-year period ended December 25, 2011, in conformity with U.S. generally accepted accounting principles. Also, in our opinion, the related financial statement schedule, when considered in relation to the basic consolidated financial statements taken as a whole, presents fairly, in all material respects, the information set forth therein.
We also have audited, in accordance with the standards of the Public Company Accounting Oversight Board (United States), the Company’s internal control over financial reporting as of December 25, 2011, based on criteria established in Internal Control-Integrated Framework issued by the Committee of Sponsoring Organizations of the Treadway Commission, and our report dated February 29, 2012 expressed an unqualified opinion on the effectiveness of the Company’s internal control over financial reporting.
/s/ KPMG LLP
Nashville, Tennessee
February 29, 2012
48
Table of Contents
CONSOLIDATED BALANCE SHEETS
| December 25, 2011 |
December 26, 2010 |
|||||||
| (in thousands) | ||||||||
| ASSETS |
||||||||
| Current Assets: |
||||||||
| Cash and cash equivalents |
$ | 18,611 | $ | 29,693 | ||||
| Trade accounts receivable, less allowance for doubtful accounts of $171 in 2011 and $129 in 2010 |
16,841 | 14,931 | ||||||
| Inventories |
9,233 | 9,071 | ||||||
| Assets held for sale |
3,211 | 4,847 | ||||||
| Other current assets |
3,949 | 4,201 | ||||||
|
|
|
|
|
|||||
| Total current assets |
51,845 | 62,743 | ||||||
| Property and equipment, net of accumulated depreciation of $375,078 in 2011 and $379,580 in 2010 |
220,749 | 320,011 | ||||||
| Trade names and other intangible assets |
25,946 | 25,946 | ||||||
| Other assets |
15,071 | 14,041 | ||||||
|
|
|
|
|
|||||
| Total Assets |
$ | 313,611 | $ | 422,741 | ||||
|
|
|
|
|
|||||
| LIABILITIES AND SHAREHOLDERS’ EQUITY |
||||||||
| Current Liabilities: |
||||||||
| Trade accounts payable |
$ | 7,700 | $ | 8,211 | ||||
| Accrued payroll and related expenses |
13,337 | 14,639 | ||||||
| Accrued expenses |
22,436 | 24,314 | ||||||
| Deferred revenue |
18,939 | 17,584 | ||||||
| Federal, state and local taxes |
8,717 | 9,998 | ||||||
| Current portion of long-term debt and capitalized lease obligations |
122 | 1,710 | ||||||
|
|
|
|
|
|||||
| Total current liabilities |
71,251 | 76,456 | ||||||
| Deferred income taxes |
4,426 | 4,034 | ||||||
| Deferred gain on sale-leasebacks |
40,537 | 13,613 | ||||||
| Other liabilities |
28,856 | 33,240 | ||||||
| Long-term debt and capitalized lease obligations, less current portion |
30 | 117,164 | ||||||
| Shareholders’ Equity: |
||||||||
| Common stock—No par value; authorized, 50,000 shares; issued and outstanding, 21,967 in 2011 and 21,713 in 2010 |
167,964 | 165,547 | ||||||
| Retained earnings |
547 | 12,687 | ||||||
|
|
|
|
|
|||||
| Total shareholders’ equity |
168,511 | 178,234 | ||||||
|
|
|
|
|
|||||
| Total Liabilities and Shareholders’ Equity |
$ | 313,611 | $ | 422,741 | ||||
|
|
|
|
|
|||||
See accompanying notes to the consolidated financial statements
49
Table of Contents
CONSOLIDATED STATEMENTS OF OPERATIONS
| Year Ended | ||||||||||||
| December 25, 2011 |
December 26, 2010 |
December 27, 2009 |
||||||||||
| (in thousands, except per share data) | ||||||||||||
| Revenues: |
||||||||||||
| Restaurant sales |
$ | 826,156 | $ | 828,982 | $ | 865,342 | ||||||
| Franchise and other revenue |
931 | 1,127 | 931 | |||||||||
|
|
|
|
|
|
|
|||||||
| 827,087 | 830,109 | 866,273 | ||||||||||
|
|
|
|
|
|
|
|||||||
| Costs and Expenses: |
||||||||||||
| Cost of restaurant sales: |
||||||||||||
| Cost of food and beverage |
260,646 | 247,558 | 252,207 | |||||||||
| Payroll and benefits |
287,010 | 293,629 | 305,418 | |||||||||
| Restaurant operating costs |
174,740 | 175,025 | 171,930 | |||||||||
|
|
|
|
|
|
|
|||||||
| Cost of restaurant sales, exclusive of depreciation and amortization shown separately below |
722,396 | 716,212 | 729,555 | |||||||||
| Advertising and marketing expenses |
35,458 | 34,655 | 32,234 | |||||||||
| General and administrative expenses |
31,938 | 39,474 | 38,343 | |||||||||
| Depreciation and amortization of property and equipment |
36,118 | 42,093 | 46,460 | |||||||||
| Impairment, disposal and restructuring charges, net |
2,866 | 14,998 | 8,437 | |||||||||
| Pre-opening costs |
— | 7 | 597 | |||||||||
|
|
|
|
|
|
|
|||||||
| 828,776 | 847,439 | 855,626 | ||||||||||
|
|
|
|
|
|
|
|||||||
| (Loss) Income from Operations |
(1,689 | ) | (17,330 | ) | 10,647 | |||||||
| Other Expense (Income): |
||||||||||||
| Interest expense, net |
9,624 | 11,812 | 11,628 | |||||||||
| Other, net |
1 | (8 | ) | (68 | ) | |||||||
|
|
|
|
|
|
|
|||||||
| 9,625 | 11,804 | 11,560 | ||||||||||
|
|
|
|
|
|
|
|||||||
| Loss from Continuing Operations Before Income Taxes |
(11,314 | ) | (29,134 | ) | (913 | ) | ||||||
| Income Tax Expense (Benefit) |
655 | (1,849 | ) | 2,254 | ||||||||
|
|
|
|
|
|
|
|||||||
| Loss from Continuing Operations |
(11,969 | ) | (27,285 | ) | (3,167 | ) | ||||||
| Loss from Discontinued Operations, Net |
(171 | ) | (7,630 | ) | (4,158 | ) | ||||||
|
|
|
|
|
|
|
|||||||
| Net Loss |
$ | (12,140 | ) | $ | (34,915 | ) | $ | (7,325 | ) | |||
|
|
|
|
|
|
|
|||||||
| Net Loss Attributable to Common Shareholders – basic and diluted: |
||||||||||||
| Loss from Continuing Operations |
$ | (0.56 | ) | $ | (1.29 | ) | $ | (0.15 | ) | |||
| Loss from Discontinued Operations, net |
— | (0.36 | ) | (0.20 | ) | |||||||
|
|
|
|
|
|
|
|||||||
| Net Loss Attributable to Common Shareholders |
$ | (0.56 | ) | $ | (1.65 | ) | $ | (0.35 | ) | |||
|
|
|
|
|
|
|
|||||||
See accompanying notes to the consolidated financial statements
50
Table of Contents
CONSOLIDATED STATEMENTS OF SHAREHOLDERS’ EQUITY AND
COMPREHENSIVE LOSS
| Common Stock | ||||||||||||||||
| Shares | Amount | Retained Earnings |
Total | |||||||||||||
| (in thousands) | ||||||||||||||||
| Balance, December 28, 2008 |
21,303 | $ | 156,830 | $ | 54,930 | $ | 211,760 | |||||||||
| Comprehensive loss: |
||||||||||||||||
| Net loss |
— | — | (7,325 | ) | (7,325 | ) | ||||||||||
| Noncontrolling interest, net |
— | (384 | ) | — | (384 | ) | ||||||||||
| Shares tendered and retired for minimum tax withholdings |
(51 | ) | (220 | ) | — | (220 | ) | |||||||||
| Shares issued under CHUX Ownership Plan and exercise of stock Options |
229 | 799 | — | 799 | ||||||||||||
| Share-based compensation expense |
66 | 4,489 | — | 4,489 | ||||||||||||
|
|
|
|
|
|
|
|
|
|||||||||
| Balance, December 27, 2009 |
21,547 | 161,514 | 47,605 | 209,119 | ||||||||||||
| Comprehensive loss: |
||||||||||||||||
| Net loss |
— | — | (34,915 | ) | (34,915 | ) | ||||||||||
| Shares tendered and retired for minimum tax withholdings |
(41 | ) | (307 | ) | — | (307 | ) | |||||||||
| Shares issued under CHUX Ownership Plan and exercise of stock Options |
113 | 745 | — | 745 | ||||||||||||
| Excess tax benefit from share-based payments |
— | 11 | — | 11 | ||||||||||||
| Dividends paid |
— | — | (3 | ) | (3 | ) | ||||||||||
| Share-based compensation expense |
94 | 3,584 | — | 3,584 | ||||||||||||
|
|
|
|
|
|
|
|
|
|||||||||
| Balance, December 26, 2010 |
21,713 | 165,547 | $ | 12,687 | 178,234 | |||||||||||
| Comprehensive loss: |
||||||||||||||||
| Net loss |
— | — | (12,140 | ) | (12,140 | ) | ||||||||||
| Shares tendered and retired for minimum tax withholdings |
(28 | ) | (176 | ) | — | (176 | ) | |||||||||
| Shares issued under CHUX Ownership Plan and exercise of stock Options |
127 | 615 | — | 615 | ||||||||||||
| Excess tax benefit from share-based payments |
— | 17 | — | 17 | ||||||||||||
| Share-based compensation expense |
155 | 1,961 | — | 1,961 | ||||||||||||
|
|
|
|
|
|
|
|
|
|||||||||
| Balance, December 25, 2011 |
21,967 | $ | 167,964 | $ | 547 | $ | 168,511 | |||||||||
|
|
|
|
|
|
|
|
|
|||||||||
See accompanying notes to the consolidated financial statements
51
Table of Contents
CONSOLIDATED STATEMENTS OF CASH FLOWS
| Year Ended | ||||||||||||
| December 25, 2011 |
December 26, 2010 |
December 27, 2009 |
||||||||||
| (in thousands) | ||||||||||||
| Cash Flows from Operating Activities: |
||||||||||||
| Net loss |
$ | (12,140 | ) | $ | (34,915 | ) | $ | (7,325 | ) | |||
| Adjustments to reconcile net loss to net cash provided by operating activities: |
||||||||||||
| Depreciation and amortization of property and equipment |
36,118 | 42,495 | 47,283 | |||||||||
| Amortization of debt issuance costs and swap termination payments, net |
(249 | ) | 728 | 282 | ||||||||
| Deferred income taxes and other income tax related items |
769 | 2,484 | (638 | ) | ||||||||
| Share-based compensation |
1,961 | 3,584 | 4,489 | |||||||||
| Loss on early extinguishment of debt |
— | 198 | — | |||||||||
| Amortization of deferred gain on sale-leasebacks |
(1,328 | ) | (1,056 | ) | (1,056 | ) | ||||||
| Loss on the sale of assets |
148 | 182 | 129 | |||||||||
| Impairment, disposal and restructuring charges, net |
2,290 | 20,547 | 10,975 | |||||||||
| Noncontrolling interests |
— | — | (83 | ) | ||||||||
| Changes in assets and liabilities: |
||||||||||||
| Trade accounts and other receivables |
(1,910 | ) | 2,627 | 2,161 | ||||||||
| Inventories |
(162 | ) | 1,318 | 6,836 | ||||||||
| Other current assets |
252 | 212 | 2,544 | |||||||||
| Trade accounts payable |
(511 | ) | 3,110 | (11,365 | ) | |||||||
| Deferred revenue |
1,355 | (385 | ) | (144 | ) | |||||||
| Accrued payroll, accrued expenses, and federal, state and local taxes |
(5,453 | ) | (1,978 | ) | (6,423 | ) | ||||||
| Other long-term assets and liabilities |
(2,094 | ) | (3,436 | ) | 727 | |||||||
|
|
|
|
|
|
|
|||||||
| Net cash provided by operating activities |
19,046 | 35,715 | 48,392 | |||||||||
|
|
|
|
|
|
|
|||||||
| Cash Flows from Investing Activities: |
||||||||||||
| Additions to property and equipment |
(17,211 | ) | (15,445 | ) | (14,664 | ) | ||||||
| Proceeds from sale lease-back transaction |
105,000 | — | — | |||||||||
| Cost of sale lease-back transaction |
(3,166 | ) | — | — | ||||||||
| Proceeds from the sale of assets |
2,938 | 1,137 | 7,971 | |||||||||
| Other, net |
83 | (13 | ) | 45 | ||||||||
|
|
|
|
|
|
|
|||||||
| Net cash provided by (used in) investing activities |
87,644 | (14,321 | ) | (6,648 | ) | |||||||
|
|
|
|
|
|
|
|||||||
| Cash Flows from Financing Activities: |
||||||||||||
| Payments on long-term debt and capitalized lease obligations |
(1,697 | ) | (2,352 | ) | (30,452 | ) | ||||||
| Repurchase of senior notes |
(115,205 | ) | (9,993 | ) | — | |||||||
| Payments to noncontrolling interests |
— | — | (300 | ) | ||||||||
| Dividends paid |
— | (3 | ) | — | ||||||||
| Proceeds from the exercise of stock options and issuances under CHUX Ownership Plan |
615 | 745 | 799 | |||||||||
| Proceeds from swap cancellation |
— | — | 3,510 | |||||||||
| Excess tax benefit from share-based payments |
17 | 11 | — | |||||||||
| Shares tendered and retired for minimum tax withholdings |
(176 | ) | (307 | ) | (220 | ) | ||||||
| Debt issuance costs |
(1,326 | ) | (1,682 | ) | (19 | ) | ||||||
|
|
|
|
|
|
|
|||||||
| Net cash used in financing activities |
(117,772 | ) | (13,581 | ) | (26,682 | ) | ||||||
|
|
|
|
|
|
|
|||||||
| (Decrease) increase in cash and cash equivalents |
(11,082 | ) | 7,813 | 15,062 | ||||||||
| Cash and cash equivalents at beginning of the year |
29,693 | 21,880 | 6,818 | |||||||||
|
|
|
|
|
|
|
|||||||
| Cash and cash equivalents at end of the year |
$ | 18,611 | $ | 29,693 | $ | 21,880 | ||||||
|
|
|
|
|
|
|
|||||||
See accompanying notes to the consolidated financial statements
52
Table of Contents
NOTES TO THE CONSOLIDATED FINANCIAL STATEMENTS
1. Summary of Significant Accounting Policies
O’Charley’s Inc. (the “Company”) owns and operates 221 (at December 25, 2011) full-service restaurant facilities in 17 states in the East, Southeast and Midwest under the trade name “O’Charley’s,” 105 full-service restaurant facilities in seven states throughout New England and upstate New York under the trade name “Ninety Nine Restaurants,” and 10 full-service restaurant facilities in six states in the East, Southeast and Midwest under the trade name “Stoney River Legendary Steaks.” As of December 25, 2011, the Company had six franchised O’Charley’s restaurants, including three in Ohio and one in each of Pennsylvania, Florida and Tennessee. The Company’s fiscal year ends on the last Sunday in December. Fiscal years presented were comprised of 52 weeks in 2011, 2010 and 2009.
Principles of Consolidation. The consolidated financial statements include the accounts of the Company and all of its subsidiaries. All significant intercompany transactions and balances have been eliminated.
Cash Equivalents. For purposes of the consolidated statements of cash flows, the Company considers all highly liquid debt instruments with original maturities of three months or less to be cash equivalents.
Inventories are stated at the lower of cost (first-in, first-out method) or market and consist primarily of food, beverages and supplies.
Operating Leases. The Company has land only, building only and land and building leases that are recorded as operating leases. Most of the leases have rent escalation clauses and some have rent holiday and contingent rent provisions. The rent expense under these leases is recognized on the straight-line basis, except for contingent rent, which is determined as a percentage of gross sales in excess of specified levels, and is recognized when it is probable and estimable that sales will be achieved in amounts in excess of specified levels. The Company uses a lease life or expected lease term that generally is inclusive of one five-year renewal period. Based upon the size of the investment that the Company makes at a restaurant site, the economic penalty incurred by discontinuing use of the leased facility, its historical experience with respect to the length of time a restaurant operates at a specific location, and leases that typically have multiple five-year renewal options that are exercised entirely at its discretion, the Company has concluded that one five-year renewal option is reasonably assured. The Company begins recognizing rent expense on the date that the Company becomes legally obligated under the lease.
Certain leases provide for rent holidays, which are included in the lease life used for the straight-line rent calculation. Rent expense and an accrued rent liability are recorded during the rent holiday periods, during which the Company has possession of and access to the property, including the pre-opening period during construction, but is typically not required or obligated to, and normally does not, make rent payments.
The same lease life that is used for the straight-line rent calculation is also used for assessing leases for capital or operating lease accounting.
Investment in Affiliated Company. The Company has an approximate 8 percent ownership interest in a joint venture to operate a restaurant concept in Chicago, Illinois. The Company is not the primary beneficiary and accounts for its investment using the equity method.
53
Table of Contents
Property and Equipment, net. The Company states property and equipment at cost and depreciates them on the straight-line method over 30 years for buildings and improvements and three to ten years for furniture, fixtures and equipment. Leasehold improvements are amortized over the lesser of the asset’s estimated useful life or the expected lease term, inclusive of one renewal period. Equipment under capitalized leases is amortized to its expected residual value to the Company at the end of the lease term. Gains or losses are recognized upon the disposal of property and equipment, and the asset and related accumulated depreciation and amortization are removed from the accounts. Maintenance, repairs and betterments that do not enhance the value of or increase the life of the assets are expensed as incurred. The Company capitalizes all direct external costs associated with obtaining the land, building and equipment for each new restaurant, as well as construction period interest. The Company also capitalizes all direct external costs associated with obtaining the dining room and kitchen equipment, signage and other assets and equipment. In addition, for each new restaurant and re-branded restaurant, the Company also capitalizes a portion of the internal direct costs of its real estate and construction department.
To determine its accounting policies related to capitalizing costs associated with its in-house real estate department, the Company has followed the guidance from FASB ASC 970, “Real Estate- General” (“FASB ASC 970”). While FASB ASC 970 establishes accounting and reporting standards for the acquisition, development, construction, selling and rental costs associated with real estate projects, it excludes from its scope: “real estate developed by an enterprise for use in its own operations, other than for sale of rental.” Given there is no other authoritative literature directly addressing the Company’s circumstance of developing real estate projects for its own operations, the Company has applied the principles of FASB ASC 970 in accounting for such costs.
Asset Retirement Obligations. The Company has determined that it has potential obligations for certain of its restaurant-level assets. Specifically, the Company has the obligation to remove certain assets from its restaurants at the end of the lease term and therefore records asset retirement obligations.
Intangible Assets. Intangible assets acquired in a purchase business combination and determined to have an indefinite useful life are not amortized, but instead tested for impairment at least annually.
Indefinite-lived intangible assets, such as trademarks, are tested annually for impairment, and are tested for impairment more frequently if events and circumstances indicate that the assets might be impaired. An impairment loss is recognized to the extent that the carrying amount of the indefinite-lived intangible asset exceeds its fair value. This analysis considers relevant historical and projected operating results, current conditions and outlook for the restaurant industry, as well as factors that influence industry change, and applies a relevant valuation methodology to value the intangible asset.
The Company has selected the last day of each fiscal year as the date on which it will test indefinite-lived intangible assets for impairment. The Company reviewed the carrying value of the trademarks, an indefinite-lived intangible asset, and found the fair value of the trademark to be substantially in excess of its net book value and that no impairment charge was needed for the 2011, 2010 or 2009 fiscal years.
Impairment of Long-Lived Assets. Long-lived assets, such as property and equipment, and purchased intangibles subject to amortization are reviewed for impairment whenever events or changes in circumstances indicate that the carrying amount of an asset or asset group may not be recoverable. Recoverability of assets to be held and used is measured by a comparison of the carrying amount of an asset or asset group to estimated undiscounted future cash flows expected to be generated by the asset or asset group. If the carrying amount of an asset or asset group exceeds its estimated future cash flows, an impairment charge is recognized for the amount by which the carrying amount of the asset or asset group exceeds the fair value of the asset or asset group based upon the future highest and best use of the impaired asset or asset group. The costs associated with asset impairments are recorded in the consolidated statement of operations in the financial statement line item impairment, disposal and restructuring charges, net. Fair value is determined by projected future discounted cash flows for each location or the estimated market value of the asset. Assets to be disposed of are separately presented in the consolidated balance sheet and reported at the lower of carrying amount or fair value less costs to sell, and are no longer depreciated. The assets and liabilities of a group classified as held for sale are presented separately in the appropriate asset and liability sections of the consolidated balance sheet.
54
Table of Contents
Revenues. Revenues consist of Company-operated and joint venture restaurant sales and, to a lesser extent, franchise revenue and other revenue. Restaurant sales include food and beverage sales and are net of applicable state and local sales taxes and discounts. Franchise revenue and other revenue consist of development fees, royalties on sales by franchised units, and royalties on sales of branded food items, primarily salad dressings. Development fees for franchisees are between $25,000 and $50,000 per restaurant. The development fees are recognized during the reporting period in which the developed restaurant begins operation. The royalties are recognized in revenue in the period corresponding to the franchisees’ sales. Revenue resulting from the sale of gift cards is recognized in the period redeemed. A percentage of gift card redemptions, based upon actual experience, are recognized as a reduction in restaurant operating costs for gift cards sold that will not be redeemed. The amounts recognized as a reduction in restaurant operating costs for gift cards sold that will not be redeemed was $1.5 million for fiscal 2011, $1.5 million for fiscal 2010 and $1.5 million for fiscal 2009.
Vendor Rebates. The Company receives vendor rebates from various non-alcoholic beverage suppliers, and to a lesser extent, suppliers of food products and supplies. Rebates are recognized as reductions to cost of food and beverage in the same period as the related food and beverage expense.
Advertising and Marketing Cost. The Company expenses advertising and marketing costs as incurred, except for certain advertising production costs that are initially capitalized and subsequently expensed the first time the advertising takes place.
Income Taxes. The Company uses the asset and liability method of accounting for income taxes. Under this method, deferred tax assets and liabilities are recognized for the future tax consequences attributable to differences between financial statement carrying amounts of existing assets and liabilities and their respective tax bases and operating loss and tax credit carry forwards. Deferred tax assets and liabilities are measured using enacted tax rates expected to apply to taxable income in the years in which those temporary differences are expected to be recovered or settled. If current available information raises doubt as to the realization of the deferred tax assets, a valuation allowance is established. These judgments and estimates are reviewed on a periodic basis as regulatory and business factors change. A valuation allowance for deferred tax assets may be required if the amount of taxes recoverable through loss carry-back declines, if the Company projects lower levels of future taxable income, or if the Company has recently experienced pretax losses. Such a valuation allowance would be established through a charge to income tax expense which would adversely affect the Company’s reported operating results. The effect on deferred tax assets and liabilities of a change in tax rates is recognized in the consolidated statement of operations in the period that includes the enactment date.
We recognize the benefits of uncertain tax positions in our financial statements only after determining a more-likely-than-not probability that the uncertain tax positions will withstand challenge, if any, from taxing authorities. When facts and circumstances change, we reassess these probabilities and record any changes in the financial statements as appropriate. We account for uncertain tax positions by determining the minimum recognition threshold that a tax position is required to meet before being recognized in the financial statements. This determination requires the use of judgment in assessing the timing and amounts of deductible and taxable items. Tax positions that meet the more-likely-than-not recognition threshold are recognized and measured as the largest amount of tax benefit that is greater than 50 percent likely of being realized upon settlement with a taxing authority that has full knowledge of all relevant information. We recognize interest and penalties accrued related to unrecognized tax benefits as components of our income tax expense.
Share-Based Compensation. Share-based compensation expense for fiscal years 2011, 2010, and 2009 is recognized at fair value over the applicable vesting periods, for share-based awards granted prior to these fiscal years, as well as awards granted during the fiscal year.
Restricted stock fair value is determined based on the trading price of stock on the grant date. The Company uses the Black-Scholes-Merton option-pricing model to estimate the fair value of stock options on their grant dates. The Company’s policy is to recognize compensation cost for share-based awards with only service conditions and a graded vesting schedule on a straight-line basis over the requisite service period for the entire award. In addition, compensation expense is recognized for only the portion of options and restricted awards that are expected to vest. Therefore, an estimated forfeiture rate derived from historical employee terminations is applied against share-based compensation expense. The forfeiture rate is applied on a straight-line basis over the service (vesting) period for each separately vesting portion of the award as if the award was in-substance, multiple awards. In addition, the Company expenses the discount associated with its employee stock purchase plan based on the actual discount received.
Deferred Compensation. The Company’s nonqualified deferred compensation plan invests in mutual funds, which are classified as trading securities. Trading securities are recorded at fair value, based on quoted market prices. Unrealized holding gains and losses on trading securities are included in earnings. Dividend and interest income are recognized when earned.
55
Table of Contents
Earnings Per Share. The two-class method is an earnings allocation formula that determines earnings per share for common stock and participating securities, according to dividends declared and participation rights in undistributed earnings. Under this method, net earnings are reduced by the amount of dividends declared in the current period for common shareholders and participating security holders. The remaining earnings or “undistributed earnings” are allocated between common stock and participating securities to the extent that each security may share in earnings as if all of the earnings for the period had been distributed. Once calculated, the earnings per common share is computed by dividing the net (loss) earnings attributable to common shareholders by the weighted average number of common shares outstanding during each year presented. Diluted (loss) earnings attributable to common shareholders per common share has been computed by dividing the net (loss) earnings attributable to common shareholders by the weighted average number of common shares outstanding plus the dilutive effect of options and restricted shares outstanding during the applicable periods computed using the treasury method. In cases where the Company has a net loss, no dilutive effect is shown as options and restricted stock become anti-dilutive.
Fair Value of Financial Instruments. Disclosure of fair values is required for most on- and off-balance sheet financial instruments for which it is practicable to estimate that value. This disclosure requirement excludes certain financial instruments, such as trade receivables and payables when the carrying value approximates the fair value, employee benefit obligations, lease contracts, and all nonfinancial instruments, such as land, buildings, and equipment. The fair values of the financial instruments are estimates based upon current market conditions and quoted market prices for the same or similar instruments. Book value approximates fair value for substantially all of the Company’s assets and liabilities for which fair value disclosures are required, except for the Company’s 9 percent senior subordinated Notes. These notes were redeemed during fiscal 2011. The fair value of the 9% Senior Subordinated Notes (“the Senior Notes”) at December 26, 2010 was $116.4 million, compared to the carrying value of $115.2 million. The fair value of the senior subordinated notes at December 26, 2010 was based on quoted market prices as of the last day of fiscal 2011 and fiscal 2010, respectively.
Operating Segments. Due to similar economic characteristics, as well as a single type of product, production process, distribution system and type of guest, the Company reports the operations of its three concepts on an aggregated basis and does not separately report segment information. Revenues from external customers are derived principally from food and beverage sales. The Company does not rely on any major customer as a source of revenue. As a result, separate segment information is not disclosed.
Use of Estimates. Management of the Company has made certain estimates and assumptions relating to the reporting of assets and liabilities and the disclosure of contingent assets and liabilities at the date of the consolidated financial statements and the reported amounts of revenues and expenses during the period to prepare these consolidated financial statements in conformity with U.S. generally accepted accounting principles. Significant items subject to such estimates and assumptions include the carrying amount of property and equipment and intangibles; valuation allowances for receivables; gift card breakage; inventories; deferred income tax assets; the fair value of debt; workers’ compensation and general liability insurance liabilities; and obligations related to employee benefits. Actual results could differ from those estimates.
Recently Issued Accounting Pronouncements.
In May 2011, the FASB issued Accounting Standards Update No. 2011-04, Amendments to Achieve Common Fair Value Measurement and Disclosure Requirements in U.S. GAAP and International Financial Reporting Standards (Topic 820)-Fair Value Measurement (“ASU 2011-04”), to provide a consistent definition of fair value and ensure that the fair value measurement and disclosure requirements are similar between U.S. GAAP and International Financial Reporting Standards. ASU 2011-04 changes certain fair value measurement principles and enhances the disclosure requirements particularly for level 3 fair value measurements. ASU 2011-04 is effective for the Company in its first quarter of fiscal 2012 and will be applied prospectively. The Company is currently evaluating the impact of adopting ASU 2011-04, but currently believes there will be no significant impact on its consolidated financial statements.
2. Discontinued Operations
During fiscal 2010, the Company closed 24 underperforming restaurants: 14 O’Charley’s restaurants and 10 Ninety Nine restaurants. The decision to close these restaurants was the result of an extensive review of the Company’s restaurant portfolio that examined each restaurant’s recent and historical financial and operating performance, its position in the marketplace, and other operating considerations. Given the geographic location of certain restaurants and
56
Table of Contents
in accordance with relevant U.S. generally accepted accounting principles (“GAAP”), nine of these restaurants have been considered discontinued operations. Due to the consideration of these nine restaurants as discontinued operations, fiscal 2009 revenues and expenses have been revised in the accompanying consolidated statements of operations.
During fiscal 2011, the Company recorded a $0.2 million loss from discontinued operations, net of taxes, which includes a $0.4 million gain from the sale of assets held for sale partially offset by $0.6 million of exit and disposal costs and an adjustment of future lease obligations for previously closed locations. During fiscal year 2010, the Company recorded a $7.6 million loss from discontinued operations, net of taxes, which includes $4.8 million from asset impairments, a $1.7 million net loss from operations and $1.1 million of exit and disposal costs, primarily severance and the present value of future lease obligations net of expected sublease income. During fiscal 2009, the Company recorded a $4.2 million loss from discontinued operations, net of taxes, which includes $2.9 million from asset impairments and a $1.3 million net loss from operations. At December 25, 2011, assets related to discontinued operations were $0.8 million of the total $3.2 million classified as held for sale.
The results of discontinued operations were as follows (in thousands):
| 2011 | 2010 | 2009 | ||||||||||
| Revenues |
$ | — | $ | 12,973 | $ | 14,566 | ||||||
| Loss before income taxes |
$ | (171 | ) | $ | (7,640 | ) | $ | (4,265 | ) | |||
| Income tax benefit |
$ | — | $ | (10 | ) | $ | (107 | ) | ||||
| Net loss |
$ | (171 | ) | $ | (7,630 | ) | $ | (4,158 | ) | |||
3. Fair Value Measurements
FASB ASC 820, “Fair Value Measurements and Disclosures,” (“FASB ASC 820”), defines fair value, establishes a framework for measuring fair value and expands disclosures about fair value measurements. In the case of non-operating assets, fair value is determined by the estimated value of the asset less costs associated with the marketing and/or selling the asset.
Fair value is defined under FASB ASC 820 as the price that would be received to sell an asset or paid to transfer a liability (an exit price) in an orderly transaction between market participants on the measurement date. FASB ASC 820 also establishes a three-level fair value hierarchy, which requires an entity to maximize the use of observable inputs and minimize the use of unobservable inputs when measuring fair value. The valuation hierarchy is based upon the transparency of inputs to the valuation of an asset or liability on the measurement date.
| Level 1 | Inputs based on quoted prices in active markets for identical assets. | |
| Level 2 | Inputs other than quoted prices included within Level 1 that are observable for the asset, either directly or indirectly. | |
| Level 3 | Inputs that are unobservable for the asset. | |
Assets and liabilities measured at fair value on a recurring basis are summarized in the table below (in thousands):
| Fair Value Measurement | ||||||||||||
| Description |
Level | 2011 | 2010 | |||||||||
| Deferred compensation plan assets and liabilities |
1 | $ | 3,805 | $ | 4,227 | |||||||
The deferred compensation plan assets are comprised of various investment funds, which are valued based upon their quoted market prices.
57
Table of Contents
Assets and liabilities measured at fair value on a nonrecurring basis are summarized in the table below (in thousands):
| Fair Value Measurement at Reporting Date Using | ||||||||||||||||||||
| December
25, 2011 Carrying Value |
Level 1 | Level 2 | Level 3 | Total Losses |
||||||||||||||||
| Long-lived assets held and used |
$ | 2,138 | $ | — | $ | 2,138 | $ | — | $ | (2,552 | ) | |||||||||
| Long-lived assets held for sale |
884 | — | 884 | — | (237 | ) | ||||||||||||||
|
|
|
|
|
|
|
|
|
|
|
|||||||||||
| Total |
$ | 3,022 | $ | — | $ | 3,022 | $ | — | $ | (2,789 | ) | |||||||||
|
|
|
|
|
|
|
|
|
|
|
|||||||||||
| Fair Value Measurement at Reporting Date Using | ||||||||||||||||||||
| December
26, 2010 Carrying Value |
Level 1 | Level 2 | Level 3 | Total Losses |
||||||||||||||||
| Long-lived assets held and used |
$ | 2,800 | $ | — | $ | 2,546 | $ | 254 | $ | (10,770 | ) | |||||||||
| Long-lived assets held for sale |
1,722 | — | 1,722 | — | (5,536 | ) | ||||||||||||||
|
|
|
|
|
|
|
|
|
|
|
|||||||||||
| Total |
$ | 4,522 | $ | — | $ | 4,268 | $ | 254 | $ | (16,306 | ) | |||||||||
|
|
|
|
|
|
|
|
|
|
|
|||||||||||
During fiscal 2011, in accordance with FASB ASC 360, “Property, Plant and Equipment,” long-lived assets held and used were written down to their fair value resulting in a loss of $2.6 million. The $2.6 million shown in the table above for the year ended December 25, 2011 is included in impairment, disposal and restructuring charges, net. In addition, assets held for sale were written down to their fair value resulting in a loss of $0.2 million. The $0.2 million shown in the table above for the year ended December 25, 2011, is included in impairment, disposal and restructuring charges, net.
During fiscal 2010, in accordance with FASB ASC 360, “Property, Plant and Equipment,” long-lived assets held and used were written down to their fair value resulting in a loss of $10.8 million. Of the $10.8 million shown in the table above for the year ended December 26, 2010, $8.5 million is included in impairment, disposal and restructuring charges, net, and $2.3 million is included in discontinued operations, net, on the consolidated statement of operations. In addition, during fiscal 2010, assets held for sale were written down to their fair value resulting in a loss of $5.5 million. Of the $5.5 million shown in the table above for the year ended December 26, 2010, $3.0 million is included in impairment, disposal and restructuring charges, net, and $2.5 million is included in discontinued operations, net, on the consolidated statement of operations.
Level 2 fair values are based upon broker estimates of value of leasehold improvements and other residual assets, as well as broker listings and sales agreements. In the case of assets held for sale, fair value is determined by the estimated sales value of the asset less costs associated with the marketing and/or selling the asset. Level 3 fair value is determined by projected future discounted cash flows for each restaurant location. The discount rate is the Company’s weighted average borrowing rate on outstanding debt which the Company believes is commensurate with the required rate of return that a potential buyer would expect to receive when purchasing a similar restaurant and the related long-lived assets. The Company limits assumptions about important factors such as sales and margin change to those that are supportable based upon its plans for the restaurant. Long-lived assets held and used in the table above are restaurants that were impaired as a result of the Company’s quarterly impairment review and to a lesser extent certain of the fourth quarter 2010 closures.
58
Table of Contents
4. Intangible Assets
At December 25, 2011 and December 26, 2010, the Company had $25.9 million in indefinite-lived intangible assets shown on its consolidated balance sheets related primarily to the acquisition of Ninety Nine restaurants. The Company tests its intangible assets for potential impairment in accordance with FASB ASC 350 as part of its year-end process or when events or circumstances indicate there may be impairment. The Company completed a valuation of the intangibles as of December 25, 2011, the last day of fiscal 2011, and its valuation showed that the fair value of the intangible asset substantially exceeded its net book value and no impairment charge was needed.
5. Impairment and Disposal Charges
During 2011, the Company recorded total impairment, disposal and restructuring charges, net, of $2.9 million. Included are impairment charges of $1.4 million on three O’Charley’s restaurants, a $1.2 million loss on sale on six O’Charley’s restaurants included in the sale-leaseback transaction and impairment charges of $0.2 million on three assets held for sale.
Also included is a gain of $0.2 million due to net reductions of previously closed locations future lease obligations, offset by $0.3 million of exit and disposal costs and other net disposals.
A reconciliation of the liability balance is summarized in the table below (in millions):
| Exit and Disposal Liability |
||||
| Balance, December 26, 2010 |
$ | 4.7 | ||
| Exit and Disposal Costs- Continuing Operations |
0.1 | |||
| Payments-Continuing Operations |
(1.7 | ) | ||
| Discontinued Operations Activity |
(1.0 | ) | ||
|
|
|
|||
| Balance, December 25, 2011 |
$ | 2.1 | ||
|
|
|
|||
During fiscal year 2011, the Company sold assets held for sale with a combined net book value of $2.3 million and recognized a gain of $0.5 on the sale of those assets. During fiscal year 2010, the Company sold assets held for sale with a combined net book value of $1.1 million for a minimal gain.
During 2010, the Company recorded total impairment, disposal and restructuring charges, net, of $15.0 million. Included are impairment charges of $11.5 million on 16 O’Charley’s restaurants, seven Ninety Nine restaurants and three surplus properties. Also included is $3.2 million for exit and disposal costs relating to the 2010 closures of seven O’Charley’s restaurants, five Ninety Nine restaurants and the Bellingham, Massachusetts distribution center. The remaining $0.3 million relates to other net losses on asset disposals. The excess carrying value of the restaurants was recorded as an impairment charge on the Company’s statement of operations.
During 2009, the Company recorded total impairment, disposal and restructuring charges, net, of $8.4 million. Included are impairment charges of $7.7 million on eight O’Charley’s restaurants, six Ninety Nine restaurants, and two Stoney River restaurants. The remaining $0.7 million charge relates to restructuring costs related to the closing of the Company’s Bellingham, Massachusetts distribution facility and the sale of a non-core asset.
59
Table of Contents
The following table reconciles the impairment, disposal, and restructuring charges as presented on the Consolidated Statements of Operations to the total amount presented on the Consolidated Statement of Cash Flows:
| Fiscal Year End | ||||||||||||
| December 25, 2011 |
December 26, 2010 |
December 27, 2009 |
||||||||||
| (in thousands) | ||||||||||||
| Supply Chain Changes: |
||||||||||||
| Impairments, exit and disposal costs |
$ | (450 | ) | $ | 1,349 | $ | 15 | |||||
| Severance and retention costs, legal costs and transition costs |
— | — | 380 | |||||||||
|
|
|
|
|
|
|
|||||||
| Total charges related to supply chain changes |
(450 | ) | 1,349 | 395 | ||||||||
|
|
|
|
|
|
|
|||||||
| Restaurant impairments, exit and disposal costs |
3,273 | 13,094 | 7,332 | |||||||||
| Other impairments |
237 | 437 | 695 | |||||||||
| Other disposals, net |
(194 | ) | 118 | 15 | ||||||||
|
|
|
|
|
|
|
|||||||
| Total impairment, disposal, and restructuring charges, net |
2,866 | 14,998 | 8,437 | |||||||||
| Impairment, exit and disposal costs – discontinued operations |
171 | 5,913 | 2,918 | |||||||||
| Impairment and supply chain changes paid or accrued |
(747 | ) | (364 | ) | (380 | ) | ||||||
| Other non-cash items |
— | — | — | |||||||||
|
|
|
|
|
|
|
|||||||
| Total non-cash impairment, disposal and restructuring charges |
$ | 2,290 | $ | 20,547 | $ | 10,975 | ||||||
|
|
|
|
|
|
|
|||||||
6. Share–Based Compensation
Total share-based compensation expense was $1.9 million, $3.6 million, and $4.5 million for fiscal 2011, 2010, and 2009, respectively. The Company’s net share-based compensation expense primarily consisted of expense associated with restricted (non-vested) stock awards and to a lesser extent expense associated with the Company’s employee share purchase plan and stock options. On May 21, 2008, the Company adopted the 2008 Equity and Incentive Plan. As of such date, shares granted will be granted under this plan only. Under this plan, the maximum aggregate number of shares that may be issued cannot exceed 1.5 million shares; however options and restricted stock awards under this or certain prior plans, which terminate, expire unexercised, and are forfeited or cancelled, increase this share reserve. As of December 25, 2011, there were approximately 1.1 million remaining shares available for issuance pursuant to the 2008 Equity and Incentive Plan.
(a) Stock Options
The Company has various incentive stock option plans that provide for the grant of both statutory and non-statutory stock options to officers, key team members and nonemployee directors of the Company. Options are granted with exercise prices equal to the fair market value of common stock on the date of the grant, with expiration dates ranging from six to ten years from the grant date and vesting dates ranging from one to seven years as determined by the board of directors. The fair value of the Company’s stock options were estimated using the Black-Scholes-Merton option-pricing model. As of December 25, 2011, the Company had approximately 915,000 unvested stock options outstanding of which approximately 870,000 are expected to vest. As of December 25, 2011, the total compensation cost related to stock option awards not yet recognized was approximately $1.3 million and the weighted average period over which it is expected to be recognized is 0.8 years. During fiscal years 2011, 2010, and 2009, the Company recorded approximately $262,000, $838,000, and $673,000, respectively, of share-based compensation expense related to stock options. Stock option transactions during the year ended December 25, 2011 were as follows:
| Number of Options |
Weighted Average Exercise Price |
Weighted Average Remaining Contractual Life (Years) |
Aggregate Intrinsic Value |
|||||||||||||
| Options outstanding at December 26, 2010 |
1,701,086 | $ | 12.10 | 3.50 | $ | 2,987,647 | ||||||||||
| Granted |
297,500 | 6.76 | ||||||||||||||
| Exercised |
(10,660 | ) | 2.74 | |||||||||||||
| Forfeited |
(218,005 | ) | 7.57 | |||||||||||||
| Expired |
(162,589 | ) | 18.67 | |||||||||||||
|
|
|
|||||||||||||||
| Options outstanding at December 25, 2011 |
1,607,332 | $ | 11.13 | 3.40 | $ | 1,297,242 | ||||||||||
|
|
|
|
|
|
|
|
|
|||||||||
| Options vested and exercisable at December 25, 2011 |
691,160 | $ | 19.51 | 1.20 | $ | 80,920 | ||||||||||
|
|
|
|
|
|
|
|
|
|||||||||
| Options unvested expected to vest at December 25, 2011 |
869,830 | $ | 4.71 | 4.97 | $ | 1,215,689 | ||||||||||
|
|
|
|
|
|
|
|
|
|||||||||
60
Table of Contents
The fair value of options vested during fiscal 2011, 2010, and 2009 was approximately $142,000, $372,000, and $150,000, respectively. For the years ended December 25, 2011 and December 26, 2010, the intrinsic value of options exercised and tax benefit related to the exercise of stock options was insignificant. There were no stock options exercised during fiscal 2009.
For the fiscal year 2011, the Company issued 0.3 million non-qualified stock options having various vesting schedules over a three year period. For fiscal 2010, the Company issued 212,500 non-qualified stock options of which 150,000 vest ratably over three years, 7,500 vested immediately upon grant, 25,000 cliff vest after one year and the remaining cliff vest after three years. For fiscal 2009, the Company issued 1.3 million non-qualified stock options of which the majority cliff vest after three years, while the remaining vest ratably over three years, and expire on February 10, 2015. The following table reflects the weighted average assumptions utilized in the Black-Scholes-Merton option-pricing model to value stock options granted during the 2011, 2010 and 2009 fiscal years and reflects the values as of the date of grant:
| 2011 | 2010 | 2009 | ||||||||||
| Risk-free rate |
1.7 | % | 1.2 | % | 1.9 | % | ||||||
| Expected term (years) |
5.2 | 3.9 | 5.1 | |||||||||
| Expected dividend yield |
0.0 | % | 0.0 | % | 0.0 | % | ||||||
| Volatility |
81.7 | % | 88.5 | % | 67.6 | % | ||||||
| Weighted-average Black-Scholes-Merton fair value per share |
$ | 4.44 | $ | 4.11 | $ | 2.57 | ||||||
The risk-free interest rate is based upon the rates on a non-coupon treasury bond released by the Federal Reserve. The expected term for options granted were derived using the Company’s historical data including post vest cancellations and expirations and calculating the weighted average time in which options were outstanding before being settled. The volatility assumptions were derived using a historical volatility method that synchronizes the historical period over which the volatility is calculated with the expected term using daily stock prices. During fiscal 2011 and 2010, the Company did not pay any dividends and does not plan to pay dividends in the near future.
(b) Restricted (Non-Vested) Stock Awards
During 2011, 2010, and 2009, the Company granted approximately 182,000, 203,000, and 148,000 shares of restricted stock, respectively, to certain members of senior management, the board of directors and other employees. For fiscal 2011, the Company issued 181,770 shares of time-based vesting restricted stock of which 92,020 cliff vest after one year, with the remaining vesting in two to three years from the grant date. For fiscal 2010, the Company issued 203,020 shares of time-based vesting restricted stock of which 40,000 cliff vest after four years, 86,020 cliff vest after one year and the remaining vest ratably over a three year period. For fiscal 2009, the Company issued time-based grants that vest ratably over periods ranging from one to three years and also issued a grant that was immediately vested. The Company recognized net share-based compensation expense of approximately $495,000, $643,000, and $494,000 related to these restricted stock awards granted during fiscal 2011, 2010, and 2009, respectively.
The fair value of the restricted stock awards was determined by using the closing market price for the Company’s stock on the date of grant for each restricted stock award.
61
Table of Contents
The following table sets forth the restricted stock activity during the year ended December 25, 2011.
| Number of Restricted Stock Awards |
Weighted Average Grant Date Fair Value |
|||||||
| Restricted Stock Awards outstanding at December 26, 2010 |
375,984 | $ | 9.45 | |||||
| Granted |
181,770 | 7.03 | ||||||
| Vested |
(214,566 | ) | 10.63 | |||||
| Forfeited |
(26,263 | ) | 10.00 | |||||
|
|
|
|||||||
| Restricted Stock Awards outstanding at December 25, 2011 |
316,925 | $ | 7.21 | |||||
|
|
|
|||||||
During fiscal 2011, 2010, and 2009, the Company recognized share-based compensation expense for all restricted stock awards of approximately $1.6 million, $2.6 million, and $3.4 million, respectively. As of December 25, 2011, the total compensation cost related to time-based restricted stock awards not yet recognized was approximately $2.3 million and the weighted average period over which it is expected to be recognized is 1.2 years. The fair value of shares vested during fiscal 2011, 2010, and 2009, was approximately $2.3 million, $3.2 million, and $6.6 million, respectively. Included in the 316,925 restricted shares outstanding at December 25, 2011 are 5,593 performance-based restricted shares, which vest over four years based upon achievement of annual financial targets through 2011. Based upon the Company’s 2011 and 2010 financial performance, the portion related to 2011 and 2010 financial targets did not vest and accordingly the Company did not recognize any share-based compensation expense for such shares. Based upon the Company’s 2009 financial performance, 86 percent of the shares that relate to fiscal 2009 financial targets vested; therefore, the Company recognized approximately $131,500 of share-based compensation expense related to these shares in 2009.
(c) Employee Stock Purchase Plan
The Company established the CHUX Ownership Plan for the purpose of providing an opportunity for eligible team members of the Company to become shareholders in the Company. On May 12, 2009, the Company’s shareholders approved an increase of 1,000,000 shares of common stock authorized for issuance under the CHUX ownership plan. As a result, the Company has reserved 2,350,000 common shares for this plan. The CHUX Ownership Plan is intended to be an employee stock purchase plan which qualifies for favorable tax treatment under Section 423 of the Internal Revenue Code. The Plan allows participants to purchase common shares at 85 percent of the lower of 1) the closing market price per share of the Company’s common stock on the last trading date of the plan period or 2) the average of the closing market price of the Company’s common stock on the first and the last trading day of the plan period. Contributions of up to 15 percent of base salary are made by each participant through payroll deductions. As of December 25, 2011, there were approximately 816,425 shares available for grant under this plan. During fiscal 2011, 2010, and 2009, the Company recorded pre-tax expense of approximately $94,000, $121,000, and $352,000, respectively, associated with this plan.
62
Table of Contents
7. Asset Retirement Obligations
The Company has determined that it has obligations under certain of its restaurant leases. Specifically, the Company has the obligation to remove certain assets from its restaurants at the end of the lease term. The following is a breakdown of the activity related to the retirement obligation for the years ended December 25, 2011, December 26, 2010 and December 27, 2009.
| (in thousands) | ||||
| Asset Retirement Obligation as of December 28, 2008 |
$ | 715 | ||
| Accretion expense on the present-valued liability |
30 | |||
| Property additions requiring recognition of a liability |
1 | |||
|
|
|
|||
| Asset Retirement Obligation as of December 27, 2009 |
$ | 746 | ||
| Accretion expense on the present-valued liability |
29 | |||
| Property additions requiring recognition of a liability |
— | |||
| Reversal for closed locations |
(101 | ) | ||
|
|
|
|||
| Asset Retirement Obligation as of December 26, 2010 |
$ | 674 | ||
| Accretion expense on the present-valued liability |
26 | |||
| Reversal for closed locations |
(7 | ) | ||
|
|
|
|||
| Asset Retirement Obligation as of December 25, 2011 |
$ | 693 | ||
|
|
|
|||
In calculating the present value of the asset retirement obligation, the Company used the 10-year treasury yield plus the margin that the Company pays above LIBOR in its credit agreement. The 10-year treasury yield was 4.4 percent and the spread over LIBOR was 1.3 percent.
8. Property and Equipment
Property and equipment consist of the following:
| December 25, 2011 |
December 26, 2010 |
|||||||
| (in thousands) | ||||||||
| Land and improvements |
$ | 33,798 | $ | 69,342 | ||||
| Buildings and improvements |
75,405 | 141,742 | ||||||
| Furniture, fixtures and equipment |
293,469 | 285,831 | ||||||
| Leasehold improvements |
192,178 | 193,115 | ||||||
| Equipment under capitalized leases |
132 | 6,935 | ||||||
| Construction in progress |
845 | 2,626 | ||||||
|
|
|
|
|
|||||
| 595,827 | 699,592 | |||||||
| Less accumulated depreciation and amortization |
(375,078 | ) | (379,580 | ) | ||||
|
|
|
|
|
|||||
| $ | 220,749 | $ | 320,011 | |||||
|
|
|
|
|
|||||
Depreciation and amortization of property and equipment (including amounts classified as discontinued operations) was $36.1 million, $42.5 million, and $47.3 million for the years ended December 25, 2011, December 26, 2010, and December 27, 2009, respectively.
63
Table of Contents
9. Assets Held for Sale
Assets held for sale consist of the following:
| December 25, 2011 |
December 26, 2010 |
|||||||
| (in thousands) | ||||||||
| Land |
$ | 2,461 | $ | 3,086 | ||||
| Buildings and improvements |
650 | 722 | ||||||
| Other assets |
100 | 1,039 | ||||||
|
|
|
|
|
|||||
| $ | 3,211 | $ | 4,847 | |||||
|
|
|
|
|
|||||
As of December 25, 2011, the amount shown in assets held for sale consisted of the assets related to four restaurants closed in the fourth quarter of 2010, one liquor license from a restaurant closed in the fourth quarter of 2010, assets related to a site previously subleased which the Company no longer intends to sublease and assets related to a site the Company no longer plans to utilize. The amount shown in assets held for sale on the consolidated balance sheet as of December 26, 2010 consisted of assets related to four restaurants closed in the fourth quarter of 2010, five liquor licenses from restaurants closed in the fourth quarter of 2010, assets related to a site previously subleased which the Company no longer intends to sublease and assets related to a site the Company no longer plans to utilize.
The Company ceases recognizing depreciation expense for all assets that are held for sale. During fiscal 2011, the Company sold a restaurant closed during fiscal 2010 and assets related to six additional restaurants closed during 2010. As a result, the Company received proceeds of $2.8 million and recorded a gain of $0.5 million. During fiscal 2010, the Company sold a restaurant closed during fiscal 2009 with a net book value of $1.1 million for a minimal gain.
10. Other Assets
Other assets consist of the following:
| December 25, 2011 |
December 26, 2010 |
|||||||
| (in thousands) | ||||||||
| Non-qualified deferred compensation plan asset |
$ | 3,043 | $ | 3,660 | ||||
| Liquor licenses |
2,403 | 2,403 | ||||||
| Prepaid interest and finance costs |
6,618 | 3,769 | ||||||
| Other assets |
3,007 | 4,209 | ||||||
|
|
|
|
|
|||||
| $ | 15,071 | $ | 14,041 | |||||
|
|
|
|
|
|||||
The prepaid interest and finance costs shown above are associated with the Company’s debt and are amortized over the life of the loan. As of December 25, 2011, the aggregate cost basis of the investments in the nonqualified deferred compensation plan, combined current and non-current, totaled $3.7 million and combined fair value totaled $3.8 million. As of December 26, 2010, the aggregate cost basis of the investments in the nonqualified deferred compensation plan combined current and non-current, totaled $4.0 million and combined fair value totaled $4.2 million.
64
Table of Contents
11. Accrued Expenses
Accrued expenses consist of the following:
| December 25, 2011 |
December 26, 2010 |
|||||||
| (in thousands) | ||||||||
| Accrued insurance expenses |
$ | 11,481 | $ | 12,124 | ||||
| Accrued employee benefits |
2,682 | 2,468 | ||||||
| Accrued interest |
336 | 1,998 | ||||||
| Accrued utilities |
2,471 | 2,675 | ||||||
| Accrued legal |
553 | 349 | ||||||
| Accrued other expenses |
4,913 | 4,700 | ||||||
|
|
|
|
|
|||||
| $ | 22,436 | $ | 24,314 | |||||
|
|
|
|
|
|||||
The amount for self-insured accrued insurance expenses shown above primarily includes liabilities for workers’ compensation, general liability, and liquor liability claims. Included in accrued employee benefits are liabilities associated with the Company’s self-insured health insurance programs. The total of the accrued self-insured health insurance liabilities at December 25, 2011 and December 26, 2010 was $2.3 million and $2.1 million, respectively. Included in accrued other expenses as of December 25, 2011, is $1.1 million of accrued exit and disposal costs relating to the future lease obligations of closed restaurants and the Bellingham, Massachusetts distribution center.
12. Long-Term Debt
Long-term debt consists of the following:
| December 25, 2011 |
December 26, 2010 |
|||||||
| (in thousands) | ||||||||
| 9% senior subordinated notes |
$ | — | $ | 115,205 | ||||
| Financing arrangements |
— | 142 | ||||||
| Note payable to Stoney River Managing Partners |
65 | 208 | ||||||
|
|
|
|
|
|||||
| $ | 65 | $ | 115,555 | |||||
| Fair value adjustments on hedged debt |
— | 1,894 | ||||||
| Less current portion of long-term debt |
(65 | ) | (285 | ) | ||||
|
|
|
|
|
|||||
| Long-term debt, less current portion |
$ | — | $ | 117,164 | ||||
|
|
|
|
|
|||||
(a) Credit Facility
During the fourth fiscal quarter of 2011, the Company entered into a Fourth Amended and Restated Credit Agreement (the “Credit Agreement”) with the existing banks under our revolving credit facility which reduced our revolving credit facility to $30 million from $45 million and extended the facility’s term to 2016. The maximum adjusted leverage ratio remained at 5.25. The fixed charge ratio was 1.20 in the fourth fiscal quarter of 2011, ranges from 1.15 to 1.20 in fiscal 2012, and is 1.25 thereafter. The Company is permitted to make capital expenditures for restaurant remodels and expansion under the new facility of up to $5.0 million for 2011 and up to 35% of the prior year’s Earnings Before Interest Taxes Depreciation and Amortization or EBITDA (as defined therein) for 2012 and the years thereafter. The Credit Agreement also reduced the number of company-owned restaurants subject to collateral mortgages from 47 to 45.
At December 25, 2011, the Company had no amounts outstanding on its revolving credit facility and $12.8 million outstanding letters of credit, which reduced its available capacity under the Credit Agreement to $17.2 million.
The Credit Agreement includes certain customary representations and warranties, negative covenants and events of default. It requires the Company to comply with certain financial covenants. The Company believes it was in compliance with such covenants at December 25, 2011.
65
Table of Contents
(b) Note Payable to Stoney River Managing Partners
During fiscal 2008, 2007 and 2006, the Company purchased minority interests of four Stoney River restaurants in which the managing partner held an interest. At December 25, 2011, the Company owes approximately $65,000 that bears interest at approximately 3.9 percent and is payable in 2012.
13. Other Liabilities
Other liabilities consist of the following:
| December 25, 2011 |
December 26, 2010 |
|||||||
| (in thousands) | ||||||||
| Deferred rent |
19,547 | 19,160 | ||||||
| Nonqualified deferred compensation plan liability |
3,043 | 3,660 | ||||||
| Liability for uncertain tax positions |
469 | 936 | ||||||
| Other long-term liabilities |
5,797 | 9,484 | ||||||
|
|
|
|
|
|||||
| $ | 28,856 | $ | 33,240 | |||||
|
|
|
|
|
|||||
Included in other long-term liabilities as of December 25, 2011 and December 26, 2010, is $1.0 million and $3.1 million, respectively, of accrued exit and disposal costs relating to the future lease obligations of closed restaurants and the Bellingham, Massachusetts distribution center. Shown separately on the Company’s Consolidated Balance Sheet as of December 25, 2011 and December 26, 2010, are the deferred gains of $28.3 million, $4.5 million, and $16.9 million on the sale-leaseback transactions completed during 2011, 2004, and 2003 respectively. These gains are being deferred and amortized over the 20-year term of the leases that were entered into in conjunction with the transactions.
14. Lease Commitments
The Company has various leases for certain restaurant land and buildings under operating lease agreements. These leases generally contain renewal options of from five years or more and require the Company to pay all executory costs, such as taxes, insurance and maintenance costs, in addition to the lease payments. Certain leases also provide for additional contingent rentals based on a percentage of sales in excess of a minimum rent. The Company leases certain equipment under a capital lease agreement having a lease term of less than three years.
In addition, the Company has four separate lease agreements that cover lease arrangements for an aggregate of 30 of its Ninety Nine restaurants, each of which contains a minimum fixed charge covenant calculation. Each of the four restaurant groups are subject to a minimum annual fixed charge coverage ratio of 1.50 to 1.00. During fiscal year 2011, each of the four groups exceeded the 1.50 to 1.00 minimum.
As of December 25, 2011 and December 26, 2010, $0.1 million and $1.3 million, respectively, of net book value of the Company’s property and equipment were under capitalized lease obligations. The assets under capital lease obligations relate to equipment. The interest rate on the capitalized lease obligation is 8.6 percent.
66
Table of Contents
Future minimum lease payments at December 25, 2011 are as follows:
| Capitalized Equipment Leases |
Operating Leases |
|||||||
| (in thousands) | ||||||||
| 2012 |
$ | 64 | $ | 40,794 | ||||
| 2013 |
30 | 40,197 | ||||||
| 2014 |
— | 38,523 | ||||||
| 2015 |
— | 36,207 | ||||||
| 2016 |
— | 33,069 | ||||||
| Thereafter |
— | 254,887 | ||||||
|
|
|
|
|
|||||
| Total minimum lease payments |
$ | 94 | $ | 443,677 | ||||
|
|
|
|||||||
| Less amount representing interest |
(7 | ) | ||||||
|
|
|
|||||||
| Net minimum lease payments |
87 | |||||||
| Less current portion |
57 | |||||||
|
|
|
|||||||
| Capitalized lease obligations, net of current portion |
$ | 30 | ||||||
|
|
|
|||||||
Rent expense for operating locations leases are as follows:
| 2011 | 2010 | 2009 | ||||||||||
| (in thousands) | ||||||||||||
| Minimum rentals |
$ | 30,713 | $ | 31,585 | $ | 31,389 | ||||||
| Contingent rentals |
179 | 188 | 238 | |||||||||
|
|
|
|
|
|
|
|||||||
| $ | 30,892 | $ | 31,773 | $ | 31,627 | |||||||
|
|
|
|
|
|
|
|||||||
67
Table of Contents
15. Income Taxes
The total income tax expense (benefit) for each respective year is as follows:
| 2011 | 2010 | 2009 | ||||||||||
| (in thousands) | ||||||||||||
| Income tax expense (benefit) attributable to: |
||||||||||||
| Loss from continuing operations |
$ | 672 | $ | (1,838 | ) | $ | 2,254 | |||||
| Loss from discontinued operations |
— | (10 | ) | (106 | ) | |||||||
| Shareholders’ equity, tax benefit derived from non-qualified stock options exercised |
(17 | ) | (11 | ) | — | |||||||
|
|
|
|
|
|
|
|||||||
| Total income tax expense (benefit) |
$ | 655 | $ | (1,859 | ) | $ | 2,148 | |||||
|
|
|
|
|
|
|
|||||||
Income tax expense (benefit) related to loss before income taxes for each respective year is as follows:
| 2011 | 2010 | 2009 | ||||||||||
| (in thousands) | ||||||||||||
| Current |
$ | (114 | ) | $ | (4,332 | ) | $ | 2,892 | ||||
| Deferred |
769 | 2,483 | (638 | ) | ||||||||
|
|
|
|
|
|
|
|||||||
| Income tax expense (benefit) from continuing operations |
$ | 655 | $ | (1,849 | ) | $ | 2,254 | |||||
| Income tax benefit from discontinued operations |
$ | — | $ | (10 | ) | $ | (106 | ) | ||||
Income tax expense (benefit) attributable to loss from continuing operations before income taxes differs from the amounts computed by applying the applicable U.S. federal income tax rate to pretax (loss) earnings as a result of the following:
| 2011 | 2010 | 2009 | ||||||||||
| Federal statutory rate |
35.0 | % | 35.0 | % | 35.0 | % | ||||||
| Increase (decrease) in taxes due to: |
||||||||||||
| State income taxes, net of federal tax benefit |
(1.5 | ) | 0.4 | (80.2 | ) | |||||||
| Tax credits, primarily FICA tip credits |
36.4 | 17.2 | 583.8 | |||||||||
| Stock compensation shortfall |
(2.5 | ) | (1.2 | ) | (217.2 | ) | ||||||
| Valuation allowance |
(89.3 | ) | (54.7 | ) | (545.4 | ) | ||||||
| Other |
16.1 | 9.7 | (22.9 | ) | ||||||||
|
|
|
|
|
|
|
|||||||
| (5.8 | )% | 6.4 | % | (246.9 | )% | |||||||
|
|
|
|
|
|
|
|||||||
68
Table of Contents
The tax effects of temporary differences that give rise to significant portions of the deferred tax assets and deferred tax liabilities at each of the respective year ends are as follows:
| December 25, 2011 |
December 26, 2010 |
|||||||
| (in thousands) | ||||||||
| Deferred tax assets: |
||||||||
| Workers’ compensation, general liability, and employee health insurance accruals |
$ | 4,833 | $ | 4,821 | ||||
| Accrued compensation |
3,418 | 3,749 | ||||||
| Restricted stock |
998 | 1,133 | ||||||
| Asset impairment and exit cost |
18,770 | 19,601 | ||||||
| Property and equipment, principally due to differences in depreciation and amortization |
16,725 | 7,690 | ||||||
| Tax credits, primarily FICA tip credits |
36,848 | 30,783 | ||||||
| Federal net operating loss and state carry-forwards |
5,471 | 5,440 | ||||||
| Goodwill |
14,968 | 17,696 | ||||||
| Other |
75 | 1,165 | ||||||
|
|
|
|
|
|||||
| Total gross deferred tax assets |
102,106 | 92,078 | ||||||
| Deferred tax asset valuation allowance |
(101,044 | ) | (90,887 | ) | ||||
|
|
|
|
|
|||||
| Total net deferred tax assets |
1,062 | 1,191 | ||||||
| Deferred tax liabilities: |
||||||||
| Trademark intangible |
5,892 | 5,251 | ||||||
|
|
|
|
|
|||||
| Total gross deferred tax liabilities |
5,892 | 5,251 | ||||||
|
|
|
|
|
|||||
| Net deferred tax liability |
$ | (4,830 | ) | $ | (4,060 | ) | ||
|
|
|
|
|
|||||
The net deferred tax liabilities are classified as follows:
| 2011 | 2010 | |||||||
| (in thousands) | ||||||||
| Deferred income taxes, non-current liability |
$ | (4,426 | ) | $ | (4,034 | ) | ||
| Deferred income taxes, current liability |
(404 | ) | (26 | ) | ||||
|
|
|
|
|
|||||
| $ | (4,830 | ) | $ | (4,060 | ) | |||
|
|
|
|
|
|||||
The Company has gross state net operating loss carry-forwards of $120.8 million to reduce future tax liabilities, which begin to expire at various times starting in fiscal year 2012, federal general business tax credits of $36.8 million which begin to expire at various times starting in 2027, and federal net operating losses of $0.7 million which expires in 2030.
The Company has established a valuation allowance of $101.0 million as of December 25, 2011 and $90.9 million as of December 26, 2010 to reduce deferred tax assets to the amount that is more likely than not to be realized which includes substantially all deferred tax assets. The change in the deferred tax valuation allowance was $10.2 million in 2011, $18.6 million in 2010, and $6.5 million in 2009. In assessing the realization of deferred tax assets, management considers whether it is more likely than not that some portion or all of the deferred tax assets will not be realized. Under FASB ASC 740, the Company is required to assess whether a valuation allowance should be established against the Company’s deferred tax assets based on the consideration of all available evidence using a “more likely than not” standard. In making such judgments, significant weight is given to evidence that can be objectively verified. The Company has a three-year cumulative pre-tax loss. A cumulative pre-tax loss is given more weight than projections of future income, and a recent historical cumulative loss is considered a significant factor that is difficult to overcome. Therefore, the Company has established a valuation allowance against all deferred tax assets, with the exception of $1.1 million and $1.2 million for 2011 and 2010, respectively, relating to federal and state net operating loss carryovers expected to be realized. The deferred tax valuation allowance may be released in future years when management considers that it is more likely than not that some portion or all of the deferred tax assets will be realized. To form a conclusion that some or all of the deferred tax assets will be realized, the Company will need to periodically evaluate all available evidence, such as whether future taxable income and reversal of temporary differences provides sufficient positive evidence to offset any potential negative evidence that may exist at such time, including the Company’s three-year cumulative pre-tax loss. In the event the deferred tax valuation allowance is released, the Company would record an income tax benefit for the portion or all of the deferred tax valuation allowance released.
69
Table of Contents
The Company has a $0.5 million, net liability recorded as of December 25, 2011 and $1.3 million, net liability recorded for December 26, 2010 for uncertain tax positions. As of December 25, 2011, the total amount of unrecognized tax positions that, if recognized, would affect the effective tax rate is $0.3 million compared to $0.6 for fiscal 2010. The tax years 2007 to 2011 remain open to examination by major taxing jurisdictions.
The following is a tabular reconciliation of the total amounts of unrecognized tax benefits for the years ended December 25, 2011, December 26, 2010 and December 27, 2009. The tabular reconciliation is shown without interest, and is adjusted for uncertain tax positions included in state net operating losses. The amount of interest liability is $0.1 million, $0.2 million, $0.5 million and the adjustment for state net operating losses is $0.3 million, $0.6 million, and $0.6 million for fiscal years ended December 25, 2011, December 26, 2010, and December 27, 2009, respectively.
| 2011 | 2010 | 2009 | ||||||||||
| (in thousands) | ||||||||||||
| Beginning balance |
$ | 1,693 | $ | 3,355 | $ | 3,398 | ||||||
| Gross prior year increases |
3 | 271 | 82 | |||||||||
| Gross prior year decreases |
(573 | ) | (1,521 | ) | (1,033 | ) | ||||||
| Gross current year increases |
51 | 420 | 1,732 | |||||||||
| Settlements |
(68 | ) | (126 | ) | (21 | ) | ||||||
| Lapse of statute of limitations |
(450 | ) | (706 | ) | (803 | ) | ||||||
|
|
|
|
|
|
|
|||||||
| Ending balance |
$ | 656 | $ | 1,693 | $ | 3,355 | ||||||
|
|
|
|
|
|
|
|||||||
16. Shareholders’ Equity
The Company’s charter authorizes 100,000 shares of preferred stock which the board of directors may, without shareholder approval, issue with voting or conversion rights upon the occurrence of certain events. At December 25, 2011, no preferred shares had been issued.
17. Loss per Share and Weighted Average Shares
The following is a reconciliation of the Company’s basic and diluted loss per share calculation. As the Company incurred a net loss in fiscal 2011, 2010 and 2009, the weighted average common shares outstanding used in the determination of the fiscal 2011, 2010 and 2009 basic loss per common share is used for the diluted loss per common share as well.
| 2011 | 2010 | 2009 | ||||||||||
| (in thousands, except per share data) | ||||||||||||
| Loss from Continuing Operations |
$ | (11,969 | ) | $ | (27,285 | ) | $ | (3,167 | ) | |||
| Loss from Discontinued Operations, Net |
(171 | ) | (7,630 | ) | (4,158 | ) | ||||||
|
|
|
|
|
|
|
|||||||
| Net Loss |
$ | (12,140 | ) | $ | (34,915 | ) | $ | (7,325 | ) | |||
|
|
|
|
|
|
|
|||||||
| Weighted average basic and diluted common shares outstanding |
21,534 | 21,211 | 20,826 | |||||||||
| Net Loss Attributable to Common Shareholders – basic and diluted: |
||||||||||||
| Loss from Continuing Operations |
$ | (0.56 | ) | $ | (1.29 | ) | $ | (0.15 | ) | |||
| Loss from Discontinued Operations, Net |
— | (0.36 | ) | (0.20 | ) | |||||||
|
|
|
|
|
|
|
|||||||
| Net Loss Attributable to Common Shareholders |
$ | (0.56 | ) | $ | (1.65 | ) | $ | (0.35 | ) | |||
|
|
|
|
|
|
|
|||||||
Options for 1.6 million, 1.7 million, and 2.3 million shares were excluded from the 2011, 2010, and 2009 diluted weighted average share calculations, respectively, due to these shares being anti-dilutive. In addition, restricted stock awards for 0.3 million, 0.4 million, and 0.6 million shares were excluded from the 2011, 2010, and 2009 diluted weighted average shares calculations, respectively, due to these shares being anti-dilutive.
70
Table of Contents
18. Team Member Benefit Plans
The Company maintains a 401(k) salary reduction and profit-sharing plan (the “Plan”). Under the Plan, team members can make contributions, subject to an annual statutory limit, of the lesser of 60 percent of their annual compensation or $16,500. The Company contributes annually to the Plan an amount equal to 50 percent of team member contributions up to 3 percent of the team member’s annual compensation, subject to certain limitations. Company contributions vest at the rate of 25 percent each year beginning after the team member’s initial year of employment. Additional employer contributions over the initial contribution are made at the discretion of the board of directors. Company contributions were approximately $0.7 million in fiscal 2011, $0.8 million in fiscal 2010, and $1.0 million in fiscal 2009.
The Company maintains a deferred compensation plan for a select group of management team members to provide supplemental retirement income benefits through deferrals of salary and bonus. Participants in this plan can contribute, on a pre-tax basis, up to 50 percent of their base pay and 100 percent of their annual performance bonuses. The Company contributes annually to this plan an amount equal to a matching formula of each participant’s deferrals. Company contributions were approximately $0.1 million for fiscal 2011, $0.3 million for fiscal 2010, and $0.3 million for fiscal 2009. The amount of the deferred compensation plan liability, payable to the participants at December 25, 2011 and December 26, 2010, was approximately $3.8 million and $4.2 million, respectively, and is recorded in accrued expenses and other liabilities and other assets (current and long-term) on the consolidated balance sheets as of December 25, 2011 and December 26, 2010.
19. Consolidated Statements of Cash Flows
Supplemental disclosure of cash flow information is as follows:
| 2011 | 2010 | 2009 | ||||||||||
| (in thousands) | ||||||||||||
| Cash paid for interest (1) |
$ | 11,699 | $ | 11,673 | $ | 8,567 | ||||||
| Income taxes paid (refunded), net |
546 | (496 | ) | 500 | ||||||||
| Other non-cash transactions: |
||||||||||||
| Transfer of assets between assets held-for-sale and property and equipment, net |
889 | 3,452 | 2,056 | |||||||||
| Change in fair value of hedged debt |
(1,894 | ) | (876 | ) | (718 | ) | ||||||
| Additions to capitalized lease obligations |
$ | 132 | $ | — | $ | — | ||||||
| (1) | Cash paid for interest in 2009 is net of the $3.5 million received for termination of the swap agreement. |
20. Litigation and Contingencies
On February 9, 2012, a purported shareholder of the Company named David Kaniecki filed a putative class action lawsuit in the Tennessee Chancery Court, 20th Judicial District, against the members of the Board of Directors, the Company, FNF and Merger Sub (the “Kaniecki Complaint”). On February13, 2012, a purported shareholder of the Company named Paul Walleman filed a putative class action lawsuit in the Tennessee Circuit Court, 20th Judicial District, against the members of the Board of Directors, the Company, FNF, Merger Sub and Crescendo Partners (the “Walleman Complaint”). On February 15, 2012, two purported shareholders of the Company named Michael Gilliam and Angela Wieder filed a putative class action lawsuit in the Tennessee Chancery Court, 20th Judicial District, against the members of the Board of Directors, the Company, FNF and Merger Sub (the “Gilliam Complaint”). On February 15, 2012, a purported shareholder of the Company named Hilary Coyne filed a putative class action lawsuit in the Tennessee Chancery Court, 20th Judicial District, against the members of the Board of Directors, the Company, FNF and Merger Sub (the “Coyne Complaint”). On February 15, 2012, a purported shareholder of the Company named Brady White filed a putative class action lawsuit in the Tennessee Chancery Court, 20th Judicial District, against the members of the Board of Directors, the Company, FNF and Merger Sub (the “White Complaint,” and together with the Kaniecki Complaint, the Walleman Complaint, the Gilliam Complaint and the Coyne Complaint, the “Complaints”). Each of the Complaints alleges that the members of the Board of Directors breached their fiduciary duties to shareholders in connection with the sale of the Company. Each of the Complaints alleges that FNF and/or Merger Sub and/or Crescendo Partners aided and abetted the Board of Directors purported breach of its fiduciary duties. Each of the Complaints, in addition to seeking other relief, seeks to enjoin the sale of the Company. With respect to each of the Complaints, the Company believes the plaintiff’s allegations are without merit, and, if one or more of the various plaintiffs proceeds with litigation, the Company will contest the allegations vigorously.
71
Table of Contents
The Company is a defendant from time to time in various legal proceedings arising in the ordinary course of its business, including claims relating to injury or wrongful death under “dram shop” laws that allow a person to sue the Company based on any injury caused by an intoxicated person who was wrongfully served alcoholic beverages at one of its restaurants; claims relating to workplace, workers’ compensation and employment matters, discrimination and similar matters; claims resulting from “slip and fall” accidents; claims relating to lease and contractual obligations; claims relating to its franchising initiatives; and claims from guests or employees alleging illness, injury or other food quality, health or operational concerns.
The Company does not believe that any of the legal proceedings pending against it as of the date of this report will have a material adverse effect on its liquidity or financial condition. The Company may incur liabilities, receive benefits, settle disputes, sustain judgments, or accrue expenses relating to legal proceedings in a particular fiscal year which may adversely affect its results of operations, or on occasion, receive settlements that favorably affect its results of operations.
21. Franchising Arrangements
The Company may from time to time enter into franchising agreements to develop and operate O’Charley’s restaurants. According to its franchising agreements, the Company is required to provide access to certain contractual arrangements that the Company has with its vendors in order for the franchisee to benefit from those contracts. The franchisee is required to pay a portion of the total development fees based on the number of total contracted restaurants at the closing of the agreement. The franchisee is also required to pay the remaining portion of the development fee to the Company as each new restaurant opens. The development fees paid have been deferred and will be recognized in income as each restaurant opens. The development fees for the franchisee range from $25,000 to $50,000 per restaurant. The franchisee is also required to pay franchise fee and marketing fund fees that are based on a percentage of sales.
O’Candall Group, Inc.
On May 18, 2005, the Company entered into a Development Agreement with O’Candall Group, Inc. and Sam Covelli. Under the terms of the agreement, O’Candall Group, Inc. and/or certain of its affiliates have the right to develop and operate up to 50 new O’Charley’s restaurants by 2013. As of December 25, 2011, the franchisee had opened five O’Charley’s restaurants. The initial development plans are expected to focus on the Tampa, Florida, Orlando, Florida, Western Pennsylvania, Northwest West Virginia and Northern Ohio markets.
Pursuant to the arrangement, the development fees for the franchisee are $50,000 for the initial restaurants and $25,000 each for the remaining restaurants in each of its five granted areas. The franchisee was required to pay $500,000 in development fees at the closing of the agreement, which represents a portion of the fees associated with the 50 restaurants agreed upon. The Company did not recognize any development fee income in fiscal years 2011 or 2010 as no new restaurants were opened. The Company recognized income of $100,000 in development fees in fiscal 2009 for the opening of two restaurants.
Delaware North Companies Travel Hospitality Services, Inc.
On February 1, 2007, the Company entered into an Operating Agreement with Delaware North Companies Travel Hospitality Services (“DNC”). Under the terms of the agreement, DNC and/or certain of its affiliates developed and operate one O’Charley’s Restaurant in the Nashville International Airport located in Nashville, Tennessee.
72
Table of Contents
22. Quarterly Financial and Restaurant Operating Data (Unaudited)
The following is a summary of certain quarterly results of operations data for each of the last two fiscal years. Revenues and earnings (loss) from operations in the table below pertain only to those locations included in our continuing operations.
| First Quarter (1) |
Second Quarter (2) |
Third Quarter (3) |
Fourth Quarter (4) |
|||||||||||||
| (dollars in thousands, except per share data) | ||||||||||||||||
| 2011 |
||||||||||||||||
| Revenues |
$ | 265,046 | $ | 193,293 | $ | 186,588 | $ | 182,160 | ||||||||
| Earnings (loss) from operations |
$ | 5,266 | $ | 703 | $ | (635 | ) | $ | (7,021 | ) | ||||||
| Net Earnings (loss) |
$ | 1,782 | $ | (1,843 | ) | $ | (4,012 | ) | $ | (8,065 | ) | |||||
| Net Earnings (loss) per share(5): |
||||||||||||||||
| Basic |
$ | 0.08 | $ | (0.09 | ) | $ | (0.19 | ) | $ | (0.37 | ) | |||||
| Diluted |
$ | 0.08 | $ | (0.09 | ) | $ | (0.19 | ) | $ | (0.37 | ) | |||||
| Company-owned restaurants in operation, end of quarter |
337 | 337 | 337 | 336 | ||||||||||||
| 2010 |
||||||||||||||||
| Revenues |
$ | 267,100 | $ | 190,917 | $ | 188,642 | $ | 183,450 | ||||||||
| Earnings (loss) from operations |
$ | 3,231 | $ | (237 | ) | $ | (5,163 | ) | $ | (15,160 | ) | |||||
| Net Loss |
$ | (4,344 | ) | $ | (2,523 | ) | $ | (7,438 | ) | $ | (20,610 | ) | ||||
| Net Loss per share(5): |
||||||||||||||||
| Basic |
$ | (0.21 | ) | $ | (0.12 | ) | $ | (0.35 | ) | $ | (0.97 | ) | ||||
| Diluted |
$ | (0.21 | ) | $ | (0.12 | ) | $ | (0.35 | ) | $ | (0.97 | ) | ||||
| Company-owned restaurants in operation, end of quarter |
358 | 358 | 357 | 338 | ||||||||||||
| (1) | During the first quarter of 2011, the Company recorded impairment and disposal charges of $0.2 million. Included is a charge of $0.1 million due to adjustment of future lease obligations for a previously closed location and $0.1 million of exit and disposal charges. During the first quarter of 2010, the Company recorded impairment charges of $2.5 million with respect to two O’Charley’s restaurants and other minor impairment charges of $0.6 million. |
| (2) | During the second quarter of 2011, the Company recorded an impairment and disposal gain of $0.5 million. Included is a $0.7 million gain due to reductions of previously closed locations future lease obligations partially offset by $0.2 million of exit and disposal costs. During the second quarter of 2010, the Company recorded impairment charges of $0.1 million which represented insurance deductible related to flood damage at the Company’s Clarksville, Tennessee location. |
| (3) | During the third quarter of 2011, the Company recorded impairment and disposal charges of $0.2 million. Included is a charge of $0.1 million due to adjustment of future lease obligations for a previously closed location and $0.1 million of exit and disposal charges. During the third quarter of 2010, the Company recorded impairment charges with respect to four O’Charley’s restaurants and other minor impairment charges of $2.5 million. |
| (4) | During the fourth quarter of 2011, the Company recorded impairment and disposal charges of $3.0 million. Of these charges, $1.4 million relates to the impairment of three O’Charley’s restaurants. In addition, impairment charges included $1.2 million related to the loss on the sale of six O’Charley’s restaurants included in the sale-leaseback transaction. The remaining $0.4 million represented exit and disposal costs associated with lease obligations at closed restaurants and other minor impairments and net disposals. During the fourth quarter of 2010, the Company recorded impairment charges of $6.4 million related to ten O’Charley’s restaurants, seven Ninety Nine restaurants and three surplus properties. In addition, $2.8 million of exit and disposal costs were incurred due to the closing of nine restaurants and future lease obligations for the Bellingham, Massachusetts distribution center. During the fourth quarter of 2010, the Company closed 19 underperforming restaurants, of which nine have been classified as discontinued operations. The results of operations for the quarter included a charge of $4.2 million, net of taxes, or $0.20 per basic and diluted share, related to the closure of these nine restaurants. |
| (5) | Quarterly earnings (loss) per share calculations may not add to reported year-to-date earnings (loss) per share due to share repurchases and other changes in weighted shares outstanding. |
73
Table of Contents
23. Commitments
The Company has purchase commitments with various vendors through 2015. These purchase obligations are primarily food obligations with fixed commitments in regards to the time period of the contract with annual price adjustments that can fluctuate and a fixed beverage contract with an annual price adjustment. In situations where the price is based on market prices, the Company used the existing market prices at December 25, 2011 to determine the amount of the obligation.
The following table sets forth our contractual obligation at December 25, 2011 (in thousands):
| Payments Due by Period | ||||||||||||||||||||
| Total | Less than 1 Yr |
1-3 Yrs | 3-5 Yrs | More Than 5 Years |
||||||||||||||||
| Unconditional purchase obligations |
$ | 269,027 | $ | 154,871 | $ | 93,092 | $ | 21,064 | $ | — | ||||||||||
24. Subsequent Events
On February 5, 2012, the Company entered into an Agreement and Plan of Merger (the “Merger Agreement”) with Fidelity National Financial, Inc., a Delaware corporation (“FNF”), and Fred Merger Sub Inc., (“Merger Sub”) a Tennessee corporation and an indirect, wholly-owned subsidiary of FNF, pursuant to which FNF, through Merger Sub, agreed to commence a tender offer (the “Offer”) to acquire all of the outstanding shares of common stock, no par value per share, of the Company (the “Shares”) for $9.85 per Share, net to the seller thereof in cash (the “Offer Price”), without interest and subject to any required withholding of taxes. The Offer commenced on February 27, 2012.
Completion of the Offer is subject to the satisfaction or waiver of a number of conditions set forth in the Merger Agreement, including (i) that the number of Shares validly tendered and not validly withdrawn, together with any Shares then owned by FNF and its affiliates, equals at least a majority of the Shares outstanding as of the expiration of the Offer on a fully-diluted basis, (ii) the expiration or termination of any applicable waiting period under the Hart-Scott-Rodino Antitrust Improvements Act of 1976, as amended, and certain other antitrust laws, (iii) the absence of a material adverse effect on the Company and (iv) certain other customary conditions.
The Merger Agreement also provides that after consummation of the Offer and subject to statutory waiting periods and the satisfaction or waiver of certain conditions set forth in the Merger Agreement, Merger Sub will merge with and into the Company (the “Merger”) and the Company will become an indirect, wholly-owned subsidiary of FNF. In the Merger, each Share that was not tendered pursuant to the Offer, other than Shares owned by the Company, FNF or Merger Sub or by a wholly-owned subsidiary of the Company or FNF, will be converted into the right to receive cash in an amount equal to the Offer Price, subject to any required withholding of taxes and without interest.
If Merger Sub holds at least 90% of the outstanding Shares immediately prior to the Merger, Merger Sub may effect the Merger as a short-form merger without additional approval by the Company’s shareholders. Otherwise, the Company would hold a special shareholders’ meeting to obtain shareholder approval of the Merger. Subject to the terms of the Merger Agreement, applicable laws and the number of authorized Shares available under the Company’s charter, the Company has granted to FNF and/or Merger Sub an irrevocable right (the “Top-Up Option”), exercisable following consummation of the Offer, if necessary, to purchase from the Company, at a price per share equal to the Offer Price, up to that number of newly issued Shares so that FNF, its subsidiaries and Merger Sub own one share more than 90% of the Shares then outstanding on a fully-diluted basis after giving effect to the Top-Up Option.
The Company is permitted to solicit inquiries or engage in discussions with third parties relating to “acquisition proposals” (as defined in the Merger Agreement) for a 30-day “go-shop” period ending March 6, 2012, and with certain parties who make written competing proposals during the “go-shop” period (each, an “Excluded Party”). After such period, the Company may not solicit or initiate discussions with third parties regarding other proposals to acquire the Company and has agreed to certain restrictions on its ability to respond to such proposals, subject to the fulfillment of certain fiduciary duties of the Company’s board of directors.
74
Table of Contents
Schedule Schedule II Valuation and Qualifying Accounts
The Merger Agreement can be terminated by the Company or FNF under certain circumstances. The Company must pay FNF a termination fee under certain circumstances, which fee will be either $6.74 million or $3.37 million depending on the circumstances giving rise to payment of the termination fee.
Schedule II Valuation and Qualifying Accounts
| Description |
Balance at Beginning of Period |
Additions Charges to Costs and Expenses |
Charged to Other Accounts |
Deductions | Balance at End of Period |
|||||||||||||||
| Valuation allowance for deferred tax assets |
||||||||||||||||||||
| Year ended December 25, 2011 |
$ | 90,887 | $ | 10,733 | $ | — | $ | 576 | $ | 101,044 | ||||||||||
| Year ended December 26, 2010 |
$ | 72,263 | $ | 18,624 | $ | — | $ | — | $ | 90,887 | ||||||||||
| Year ended December 27, 2009 |
$ | 65,791 | $ | 8,298 | $ | — | $ | 1,826 | $ | 72,263 | ||||||||||
For the years ended December 25, 2011, December 26, 2010 and December 27, 2009, the additions charged to costs and expenses reflects the additional valuation allowance needed to offset the increase in deferred tax assets from the prior year. The deductions for the year ended December 25, 2011 are higher than prior years due to increased realization of state net operating losses.
See accompanying report of the independent registered public accounting firm.
| Item 9. | Changes in and Disagreements With Accountants on Accounting and Financial Disclosure. |
Not applicable.
| Item 9A. | Controls and Procedures. |
Evaluation of Disclosure Controls and Procedures
Under the supervision and with the participation of our management, including the principal executive officer and principal financial officer, we conducted an evaluation of our disclosure controls and procedures (as defined in Exchange Act Rules 13a-15(e) and 15d-15(e)) as of the end of the period covered by this annual report. Based on that evaluation, the principal executive officer and principal financial officer have concluded that our disclosure controls and procedures were effective to ensure that information required to be disclosed by us in the reports that we file or submit under the Exchange Act is recorded, processed, summarized and reported within the time periods specified in the Securities and Exchange Commission’s rules and forms, and that such information is accumulated and communicated to management, including our principal executive officer and principal financial officer, as appropriate to allow timely decisions regarding required disclosure.
Management’s Annual Report On Internal Control Over Financial Reporting
Management of the Company is responsible for establishing and maintaining adequate internal control over financial reporting as defined in Exchange Act Rules 13a-15(f) and 15d-15(f). The Company’s internal control over financial reporting is designed to provide reasonable assurance regarding the reliability of financial reporting and the preparation of financial statements for external purposes in accordance with U.S. generally accepted accounting principles. The Company’s internal control over financial reporting includes those policies and procedures that:
| (i) | pertain to the maintenance of records that, in reasonable detail, accurately and fairly reflect the transactions and dispositions of the assets of the Company; |
| (ii) | provide reasonable assurance that transactions are recorded as necessary to permit preparation of financial statements in accordance with generally accepted accounting principles, and that receipts and expenditures of the Company are being made only in accordance with authorizations of management and directors of the Company; and |
| (iii) | provide reasonable assurance regarding prevention or timely detection of unauthorized acquisition, use or disposition of the Company’s assets that could have a material effect on the financial statements. |
75
Table of Contents
Because of its inherent limitations, internal control over financial reporting may not prevent or detect misstatements. Also, projections of any evaluation of effectiveness to future periods are subject to the risk that controls may become inadequate because of changes in conditions, or that the degree of compliance with the policies or procedures may deteriorate.
Management assessed the effectiveness of the Company’s internal control over financial reporting as of December 25, 2011. In making this assessment, management used the criteria set forth by the Committee of Sponsoring Organizations of the Treadway Commission (COSO) in Internal Control-Integrated Framework.
Based on management’s assessment and those criteria, management believes that, as of December 25, 2011, the Company’s internal control over financial reporting was effective.
The Company’s independent registered public accounting firm, KPMG LLP, has issued an attestation report on the Company’s internal control over financial reporting.
Changes in Internal Control Over Financial Reporting
There were no changes in our internal control over financial reporting during our fiscal quarter ended December 25, 2011 that have materially affected, or are reasonably likely to materially affect, our internal control over financial reporting.
76
Table of Contents
Report of Independent Registered Public Accounting Firm
The Board of Directors and Shareholders
O’Charley’s Inc.:
We have audited O’Charley’s Inc.’s (the Company) internal control over financial reporting as of December 25, 2011, based on criteria established in Internal Control-Integrated Framework issued by the Committee of Sponsoring Organizations of the Treadway Commission. The Company’s management is responsible for maintaining effective internal control over financial reporting and for its assessment of the effectiveness of internal control over financial reporting, included in the accompanying Management’s Annual Report on Internal Control Over Financial Reporting. Our responsibility is to express an opinion on the Company’s internal control over financial reporting based on our audit.
We conducted our audit in accordance with the standards of the Public Company Accounting Oversight Board (United States). Those standards require that we plan and perform the audit to obtain reasonable assurance about whether effective internal control over financial reporting was maintained in all material respects. Our audit included obtaining an understanding of internal control over financial reporting, assessing the risk that a material weakness exists, and testing and evaluating the design and operating effectiveness of internal control based on the assessed risk. Our audit also included performing such other procedures as we considered necessary in the circumstances. We believe that our audit provides a reasonable basis for our opinion.
A company’s internal control over financial reporting is a process designed to provide reasonable assurance regarding the reliability of financial reporting and the preparation of financial statements for external purposes in accordance with generally accepted accounting principles. A company’s internal control over financial reporting includes those policies and procedures that (1) pertain to the maintenance of records that, in reasonable detail, accurately and fairly reflect the transactions and dispositions of the assets of the company; (2) provide reasonable assurance that transactions are recorded as necessary to permit preparation of financial statements in accordance with generally accepted accounting principles, and that receipts and expenditures of the company are being made only in accordance with authorizations of management and directors of the company; and (3) provide reasonable assurance regarding prevention or timely detection of unauthorized acquisition, use, or disposition of the company’s assets that could have a material effect on the financial statements.
Because of its inherent limitations, internal control over financial reporting may not prevent or detect misstatements. Also, projections of any evaluation of effectiveness to future periods are subject to the risk that controls may become inadequate because of changes in conditions, or that the degree of compliance with the policies or procedures may deteriorate.
In our opinion, O’Charley’s Inc. maintained, in all material respects, effective internal control over financial reporting as of December 25, 2011, based on criteria established in Internal Control-Integrated Framework issued by the Committee of Sponsoring Organizations of the Treadway Commission.
We also have audited, in accordance with the standards of the Public Company Accounting Oversight Board (United States), the consolidated balance sheets of O’Charley’s Inc. and subsidiaries as of December 25, 2011 and December 26, 2010 and the related consolidated statements of operations, shareholders’ equity and comprehensive loss, and cash flows for each of the fiscal years in the three-year period ended December 25, 2011, and our report dated February 29, 2012 expressed an unqualified opinion on those consolidated financial statements.
| /s/ KPMG LLP |
| Nashville, Tennessee |
| February 29, 2012 |
77
Table of Contents
| Item 9B. | Other Information. |
None.
| Item 10. | Directors, Executive Officers and Corporate Governance. |
The following is a brief summary of the business experience, skills and qualifications of each of the directors of the Company. Pursuant to General Instruction G(3) to Form 10-K, certain information required with respect to persons who are or may be deemed to be executive officers of the Company is set forth in Part I, Item 1 of this Annual Report on Form 10-K under the caption “Executive Officers of the Registrant.”
Philip J. Hickey, Jr. has served as the Chairman of our Board of Directors since June 2009. Mr. Hickey has also served as the chief executive officer of Park Row Ventures, an investment and consulting firm, since October 2007. Prior to October 2007, Mr. Hickey served as the chairman of the board of directors of RARE Hospitality International, Inc., a restaurant company, from January 2001 to October 2007 and its chief executive officer from July 1998 until October 2007. Mr. Hickey also served as a director of Radiant Systems, Inc., a provider of technology solutions for managing site operations in the hospitality and retail industries, before the company was sold in August 2011.
Mr. Hickey has extensive experience in the restaurant industry and possesses a sophisticated understanding of the industry’s financial and operational aspects. Under Mr. Hickey’s leadership, RARE Hospitality grew from 108 to 319 restaurants and to over $1 billion in annual revenue. Prior to his experience with Rare Hospitality, Mr. Hickey served as president and chief operating officer of Innovative Restaurant Concepts, Inc. and Rio Bravo International, Inc., operators and franchisors of casual dining restaurants that were acquired by Applebee’s International, Inc. in March 1995. Mr. Hickey’s extensive public company experience and experience and success within our industry demonstrate not only the range of Mr. Hickey’s knowledge, but also exemplify the qualities we believe qualify him as chairman of our Board.
Arnaud Ajdler has been a managing director of Crescendo Partners since December 2005. Mr. Ajdler has also served as a director of Destination Maternity Corporation, a designer and retailer of maternity apparel, since March 2008 and as Chairman of the Board since February 2011. Since its inception in June 2006, Mr. Ajdler has served as a member of the board of directors and the secretary of Rhapsody Acquisition Corp., an OTC Bulletin Board-listed blank check company formed to effect a business combination with an operating business. From June 2004 until June 2006 Mr. Ajdler also served as the chief financial officer, a director and the secretary of Arpeggio Acquisition Corporation, which completed a business combination with Hill International, Inc. in June 2006. Mr. Ajdler also serves as a director, chairman of the corporate governance and nominating committee, and member of the audit committee of Charming Shoppes, Inc., a multi-brand specialty apparel retailer.
Mr. Ajdler brings to the Board a strong business and financial background, as well as perspective from his service on other public Company boards of directors. In particular, Mr. Ajdler’s experience in the retail industry with Destination Maternity Corporation and Charming Shoppes, Inc., provides him with sophisticated perspectives regarding brand marketing and consumer discretionary spending habits, which are directly relevant to our business and value-oriented marketing strategy. In addition to his business and financial experience, Mr. Ajdler also brings to the Board the perspective of a major Company shareholder.
William F. Andrews has served as chairman of the executive committee of Corrections Corporation of America, an owner and operator of privatized correctional and detention facilities, since July 2008, after having served as its chairman of the Board since August 2000. Mr. Andrews has been a principal of Kohlberg & Company, a private equity firm specializing in middle market investing, since 1995. He is currently the chairman of the board of directors of Katy Industries, Inc., a manufacturer and distributor of consumer and commercial products. Mr. Andrews also currently serves as a director of Black Box Corporation, a publicly-traded provider of information technology infrastructure solutions, and Trex Company, Inc., a publicly-traded producer of decking and railing products.
Mr. Andrews is a respected business leader with a diverse business background, bringing to the Board multiple perspectives, including those of an investor and an executive. For 15 years, he has been a principal in the private equity firm Kohlberg & Company, which experience lends him, and consequently our Board, a deep knowledge of how investors analyze and value business enterprises. Additionally, Mr. Andrew’s service as a chief executive officer of another publicly-traded company and in leadership roles on other public company boards has resulted in valuable experience in the processes and policies needed to effectively govern a publicly-traded enterprise.
78
Table of Contents
Douglas Benham is the president and chief executive officer of DNB Advisors, LLC, a restaurant industry consulting firm. Mr. Benham served as president and chief executive officer of Arby’s Restaurant Group, a quick service restaurant Company, from January 2004 until April 2006. From August 2003 until January 2004, Mr. Benham was president and chief executive officer of DNB Advisors, LLC. From January 1989 until August 2003, Mr. Benham served on the board of directors, as well as chief financial officer, of RTM Restaurant Group, Inc., an Arby’s franchisee. Since August 2009, Mr. Benham has served as a director of Sonic Corp., a publicly-traded company which has over 3,500 drive-in restaurants. Mr. Benham also serves as a director and member of the audit committee of Global Income Trust, Inc., a real estate investment trust.
With more than 20 years’ experience in the restaurant industry, Mr. Benham offers the Board valuable knowledge in restaurant operations and management. This understanding of the restaurant industry allows Mr. Benham a variety of viewpoints and perspectives critical to productive board deliberations.
David W. Head has served as Chief Executive Officer, President and member of our Board of Directors since September 2010. Prior to joining O’Charley’s and since 2006, Mr. Head served as chairman, president and chief executive officer of Captain D’s Seafood Kitchen, an operator and franchisor of over 550 quick-service seafood restaurants. From 2003 to 2006, Mr. Head served as president, Chief Executive Officer and a director of Romacorp, Inc., which operates and franchises over 250 Tony Roma’s casual dining locations throughout the United States and in over 30 countries. In November 2005, Romacorp, Inc., as part of its general turnaround strategy, filed for bankruptcy protection under Chapter 11 of the U.S. Bankruptcy Code. In April 2006, Romacorp emerged from bankruptcy protection and has since expanded its international and domestic franchising program. Additionally, Mr. Head successfully led franchised start-up restaurants in the Applebee’s International and Red Robin bar and grill systems.
Mr. Head is a proven leader with a broad skill set, deep operational experience in the restaurant industry, and an impressive track record refining and repositioning restaurant brands. As Chief Executive Officer, he brings management’s perspective to the Board.
Gregory Monahan has been a managing director of Crescendo Partners since December 2008, after serving as a senior vice president (from December 2007 to December 2008), vice president (from December 2005 to December 2007) and an investment analyst (from May 2005 to December 2005) of Crescendo Partners. Mr. Monahan founded Bind Network Solutions in March 1998 and served with that company until November 2002. Mr. Monahan also previously worked as assistant to the chairman of the board and board observer of Computer Horizons Corp. Mr. Monahan also currently serves as a director of Cott Corporation, a non-alcoholic beverage retailer. Mr. Monahan formerly served as a director of Bridgewater Systems, a mobile personalization company, until August 2011.
Mr. Monahan brings to the Board a wide array of financial knowledge and business acumen. His background as an investment analyst allows him to view the Company from the perspective of an existing or potential institutional shareholder. In addition to his business and financial experience, Mr. Monahan also brings to the Board the perspective of a major company shareholder.
Dale W. Polley is currently retired. Mr. Polley was a founder in February 2000 of Pinnacle Financial Partners, a bank holding Company, and served as a member of its board of directors until August 2011. Mr. Polley also serves on the board of directors of Healthstream, Inc., a provider of healthcare education products and services and as a director of CapStar Bank, a Tennessee banking corporation. Mr. Polley served as a director for the Federal Reserve Bank of Atlanta, Nashville Branch from January 1995 to December 2001. Mr. Polley served as president and vice chairman of First American Corporation, a bank holding company, from 1991 to 2000.
Drawing from his financial and accounting background, Mr. Polley Chairs the Company’s Audit Committee and is the Company’s Audit Committee financial expert. Mr. Polley has served as president of another public company. This service, combined with his leadership and management experience in other capacities, his service on other public company boards and his reputation in the Nashville business community and beyond, make him a valued contributor to the Board.
Richard Reiss, Jr. is the chairman of Georgica Advisors, LLC, a private investment management firm. Mr. Reiss is also a director of The Lazard Funds, Inc.
As an experienced and sophisticated investor in companies in a variety of industries, including investments in other restaurant companies, Mr. Reiss brings to the Board a diverse understanding of different industries. With more than 25 years of service on the Company’s Board, Mr. Reiss has cultivated a deep understanding of the Company and its operations strategy.
79
Table of Contents
H. Steve Tidwell has served as chairman of SPFS, Inc., which operates 18 unaffiliated restaurants in three southern states, since January 2000 and served as president of SPFS, Inc. from February 1991 to January 2000. From January 1987 to February 1991, Mr. Tidwell served as secretary and treasurer of SPFS, Inc. Mr. Tidwell served as vice president of real estate and construction at Shoney’s, Inc. from December 1978 to January 1987.
Mr. Tidwell has over 30 years of experience in the restaurant industry, which provides him a broad understanding of our strategic priorities. This background, coupled with over 20 years of service on the Company’s Board, including his valuable guidance to the Board on compensation-related matters as Chair of the Compensation and Human Resources Committee has given Mr. Tidwell an institutional knowledge of the Company and the industry in which it operates and competes.
Robert J. Walker, an attorney for over 40 years, has been a partner in Walker, Tipps & Malone, a law firm, since January 2000.
Mr. Walker’s 40 years of legal experience give him a strong background in the realm of corporate governance and more generally business negotiations. The Board values his insight and leadership skills as well as the knowledge of the restaurant industry that he has developed during his tenure with the Company as a director.
Shirley A. Zeitlin serves as chief executive officer of Zeitlin & Co. Realtors, a real estate brokerage firm. Ms. Zeitlin has served as president and a member of the board of the Tennessee Association of Realtors and the Nashville Board of Realtors. She has also served as a member of the board of the Federal Reserve Bank of Nashville, where she served as chairman in 1991. Ms. Zeitlin serves as an advisory board director of Regions Bank as well as a director for numerous civic and charitable organizations.
Ms. Zeitlin brings a unique background to the Board with regard to her experience in real estate and as an owner and operator of a diverse business enterprise. Her knowledge of and contacts within the real estate industry are directly applicable to our Company, which leases or owns sites in multiple markets. The Board values her experience as a female entrepreneur who is well-connected and respected in the Company’s hometown of Nashville, Tennessee.
Audit Committee and Audit Committee Financial Expert
The Company has a separately-designated standing audit committee established in accordance with applicable rules of the Securities Exchange Act of 1934. Members of the Audit Committee are William F. Andrews, Dale W. Polley and Douglas Benham, each of whom is “independent,” as defined by the applicable rules of the Commission and NASDAQ listing standards. The Board of Directors has determined that each of Messrs. Benham and Polley is an “audit committee financial expert.”
Code of Conduct and Business Ethics Policy
The Company has a Code of Conduct and Business Ethics Policy (the “Code of Conduct”) that applies to all of the Company’s employees, officers and directors. The purpose of the Code of Conduct is to, among other things, provide written standards that are reasonably designed to deter wrongdoing and to promote honest and ethical conduct; to ensure full, fair, accurate, timely and understandable disclosure in reports and documents that the Company files with the Commission and other public communications by the Company; to ensure compliance with applicable governmental laws, rules and regulations; to facilitate prompt internal reporting of violations of the Code of Conduct; and to ensure accountability for adherence to the Code of Conduct.
The Company’s principal executive officer, principal financial officer, principal accounting officer or controller or persons performing similar functions are bound by the Company’s Code of Conduct, which contains provisions consistent with the Commission’s description of a code of ethics. Each of these officers is required to read and certify that he or she has read, understands and has complied with the Code of Conduct. The Company’s chief compliance officer reports quarterly to the Audit Committee as to whether there were any violations of or waivers granted under the Code of Conduct in respect of any of these officers.
A current version of the Company’s Code of Conduct can be obtained from the “Investor Relations” section of the Company’s website at www.ocharleysinc.com. The Company intends to disclose any legally required amendments to, or waivers from, the Code of Conduct with respect to its directors and officers in accordance with the rules and regulations of the Commission and NASDAQ. Any such disclosure will be made in the “Investor Relations” section of the Company’s website at www.ocharleysinc.com.
80
Table of Contents
Section 16(a) Beneficial Ownership Reporting Compliance
Section 16(a) of the Securities Exchange Act of 1934 requires the Company’s officers and directors, and persons who own more than ten percent of the Company’s common stock, to file reports of ownership and changes in ownership with the Commission. Officers, directors and greater than ten percent shareholders are required by regulation to furnish the Company with copies of all Section 16(a) forms they file.
Based solely on its review of the copies of such forms received by it, the Company believes that all filing requirements applicable to its officers, directors and greater than ten percent beneficial owners were complied with during the fiscal year ended December 25, 2011, except that a Form 4 was filed one day late on behalf of Alfred L. Thimm, Jr. to report a stock option award; a Form 4 was filed one day late on behalf of each of Robert F. Luz, Colin M. Daly, R. Jeffrey Williams and Leon De Wet to report the disposition of shares to cover the tax liability associated with the vesting of a restricted stock grant; and a Form 4 was filed late on behalf of each of John R. Grady and Lawrence D. Taylor to report the forfeiture of certain restricted stock awards and the disposition of shares to cover the tax liability associated with the vesting of a restricted stock grant.
| Item 11. | Executive Compensation. |
Compensation Discussion and Analysis
This section discusses the objectives and elements of our executive compensation programs and the compensation awarded to our Named Executive Officers in 2011. It should be read in conjunction with the Summary Compensation Table and the related tables and narratives that follow in this Information Statement. The following individuals were our Named Executive Officers for fiscal 2011 who continue to serve the Company:
| • | David W. Head, our President and Chief Executive Officer; |
| • | R. Jeffrey Williams, our Chief Financial Officer and Treasurer; |
| • | Marc A. Buehler, our O’Charley’s Concept President; |
| • | John R. Grady, our Ninety Nine Restaurants Concept President; and |
| • | Alfred L. Thimm, Jr., our Stoney River Legendary Steaks Concept President. |
The following individual was a Named Executive Officer for fiscal 2011, but is no longer with the Company:
| • | Wilson Craft, our former O’Charley’s Concept President. |
Overview of the Executive Compensation Program
We design our executive compensation policies to motivate members of senior management to execute our strategic plan and to boost Company profitability, creating long-term value for our shareholders. The key objectives of our executive compensation philosophy are as follows:
| • | To provide performance-based compensation that places a significant portion of our executives’ compensation at risk if financial goals are not reached. This means that our Named Executive Officers will forgo bonus and equity incentive opportunities when pre-established performance goals fail to be achieved. |
| • | To link our executive officers’ interests with the goal of creating long-term value for our shareholders through grants of equity-based long-term incentive compensation. |
81
Table of Contents
| • | To provide competitive base salaries, which will compensate our Named Executive Officers for the day-to-day demands and responsibilities placed on them and which serve to attract and retain highly competent individuals. |
Our executive compensation policies are designed to balance the goals of motivating and holding accountable our management team with performance-based compensation and promoting retention of our management team. Challenging economic conditions in the past several years have impacted the casual dining industry. We believe that implementing our turnaround strategy in this environment is a multi-step process. Our turnaround strategy has focused on four key areas:
| • | Lead and win with food – this entails developing great tasting, high quality, margin friendly food that customers will want and see as a great value. |
| • | Operate great restaurants – this entails raising the bar on our restaurant level performance, hiring and retaining the best people, and strengthening our foundational approach to our guest interaction to insure quality, consistency and memorable guest experiences. |
| • | Drive guests experience through effective brand messaging – this entails changes to our branding message from a pure value message to a brand value message that allows our guest to see a combination of quality and value in everything we do. |
| • | Improve our brand face – this entails making investments in our restaurants to improve the atmosphere in such a way that our guests appreciate it and will want to return more often. |
Each of the pieces of this four-pronged strategy are necessary to support the successful turnaround of our business and improve upon our financial results in light of the continuing challenges faced by the Company from the macroeconomic environment as well as our competitors. Our compensation programs include performance and equity-based components intended to motivate our executives to achieve these goals.
Our Fiscal 2011 Compensation Decisions
Our Compensation and Human Resources Committee oversees our executive compensation programs, including those for our Named Executive Officers. Generally, the Compensation and Human Resources Committee reviews the Chief Executive Officer’s compensation annually. The Chief Executive Officer makes annual recommendations to the Committee regarding the pay levels of the other Named Executive Officers, which Committee members review and discuss.
When initially setting the compensation of our Named Executive Officers for fiscal 2011, our Compensation and Human Resources Committee did not engage a compensation consultant. In the past, our Compensation and Human Resources Committee has engaged a compensation consultant to provide advice and market data with respect to our executive compensation matters. In particular, our Compensation and Human Resources Committee has relied on competitive peer group and published compensation survey information compiled and analyzed by a compensation consultant to review and assess our executive compensation program. The Committee has previously used these consultants periodically to gain perspective on market trends in executive compensation and evaluate relative performance, but without any formulaic benchmarking. The Compensation and Human Resources Committee considered this information on market practices along with factors such as internal equity, individual performance, promotion potential and retention risk in determining total direct compensation for our Named Executive Officers.
During the Compensation and Human Resources Committee’s review of 2011 compensation decisions in early 2011, it determined that the Company’s peer group, as constructed in 2009 with the assistance of a compensation consultant, was outdated. As a result the Compensation and Human Resources Committee did not utilize its then existing peer group in setting fiscal 2011 compensation. Recognizing a need to gain perspective on market trends and evaluate the relative performance of our executive officers, the committee engaged Pearl Meyer & Partners (“Pearl Meyer”) in September 2011 to provide guidance in setting the salary for Mr. Head for the remainder of fiscal 2011 and for fiscal 2012, in addition to providing guidance for the compensation of all Named Executive Officers for fiscal 2012. As part of this engagement, Pearl Meyer assisted the Committee in constructing a revised peer group to be used for future compensation decisions.
82
Table of Contents
The companies comprising the revised peer group are:
| BJs Restaurants, Inc. |
McCormick & Schmick’s Seafood Restaurants, Inc. | |
| Buffalo Wild Wings, Inc. |
Red Robin Gourmet Burgers, Inc. | |
| CEC Entertainment, Inc. |
Ruby Tuesday, Inc. | |
| Denny’s Corp. |
Ruth’s Hospitality Group, Inc. | |
| Einstein Noah Restaurant Group Inc. |
Texas Roadhouse, Inc. | |
| Bob Evans Farms, Inc. |
||
Several companies that were used in prior year peer group studies were removed from the 2011 peer group due to the selection criteria identified above. Those companies eliminated from the 2011 peer group included: Biglari Holdings Inc., California Pizza Kitchen, Inc., The Cheesecake Factory, Inc., Chipotle Mexican Grill, Inc., Cracker Barrel Old Country Store, Inc., DineEquity, Inc., P.F. Changs China Bistro, Inc., Panera Bread Co., and Papa Johns International, Inc.
“Say-on-Pay” Considerations. On May 18, 2011, at our 2011 Annual Meeting of Shareholders, our Company held a “say-on-pay” vote, which allowed our shareholders to cast an advisory vote for or against our Company’s executive compensation program and philosophies. Approximately 80% of the votes cast on our say-on-pay proposal were voted in favor of the proposal. The Committee believes this affirms our shareholders’ support of our Company’s executive compensation program and philosophies, including our pay-for-performance philosophy, and reflects the recognition by our shareholders that our executive compensation program aligns the interests of our executives with the interests of our shareholders. Because of the shareholder support of our executive compensation program, the Committee did not make significant changes to its executive compensation program and philosophies, and intends to continue to keep a significant portion of executive compensation tied to Company performance, along with providing incentives for executives to deliver long-term value to our shareholders. The Committee will continue to consider the outcome of our Company’s advisory say-on-pay votes when making future compensation decisions for our Named Executive Officers.
Economic Considerations; Economic Environment. The difficult macroeconomic environment continued to impact our senior executives’ compensation in 2011. With the exception of the bonus awarded to Mr. Thimm for performance relating to the Stoney River concept, no performance bonuses were paid to our Named Executive Officers for fiscal 2011. Additionally, our executives forfeited portions of certain performance based restricted stock awards based on 2011 operating results.
Total Direct Compensation; Allocation Among Components. Our compensation process establishes, for each Named Executive Officer, an appropriate level of “total direct compensation” – i.e., the aggregate total of base salary, cash bonus and long-term incentive compensation that we will pay to such executive during the fiscal year if we meet target performance goals. In allocating compensation among these elements, we believe that the compensation paid to our senior-most managers – those with the greatest ability to influence our Company’s performance – should, to a considerable extent, be tied to performance.
For 2011, in light of 2010 performance and additional leadership changes, our Compensation and Human Resources Committee decided to defer a decision on whether to adjust base salaries until mid-year to provide both the committee and Mr. Head better insight into our Named Executive Officers’ and our Company’s performance when considering salary adjustments. Those increases in base salary are referenced below under “Base Salaries.”
83
Table of Contents
Cash bonus opportunities for fiscal 2011 were based on percentages of base salary, as discussed in more detail below. No equity grants were awarded to our Named Executive Officers in 2011, other than grants in connection with promotions or new hires, as the grants awarded in 2009 to such individuals were intended to constitute three years of equity grants. For 2011, total target direct compensation of our Named Executive Officers was as follows:
| Named Executive Officer(1) | 2011 Base Salary(2) |
2011 Target Cash Bonus |
2011
Long-Term Incentive Compensation(3) |
2011 Targeted Total Direct Compensation |
||||||||||||
| David W. Head |
$ | 625,000 | $ | 625,000 | — | $ | 1,250,000 | |||||||||
| R. Jeffrey Williams |
$ | 300,000 | $ | 120,000 | $ | 229,704 | $ | 649,704 | ||||||||
| Marc A. Buehler |
$ | 400,000 | $ | 75,000 | (4) | $ | 399,540 | $ | 874,540 | |||||||
| John R. Grady |
$ | 367,710 | $ | 220,626 | — | $ | 588,336 | |||||||||
| Alfred L. Thimm, Jr. |
$ | 275,000 | $ | 124,279 | $ | 163,660 | $ | 562,939 | ||||||||
| Wilson Craft |
$ | 445,000 | $ | 311,500 | — | $ | 756,500 | |||||||||
| (1) | Mr. Craft is included in this table as of August 28, 2011, at which point his base salary was $445,000. |
| (2) | Reflects mid-year salary increases as discussed above. |
| (3) | The amounts shown in this column represent the grant date fair value of the stock or option awards, as detailed in the 2011 Grants of Plan-Based Awards table. As previously noted, these grants were made in connection with new hires to Messrs. Thimm and Buehler and the promotion of Mr. Williams to Chief Financial Officer and Treasurer. |
| (4) | Represents sign-on bonus granted in connection with Mr. Buehler joining the Company in September 2011. |
The differences in the amounts of compensation among our top executives reflect the Company’s belief that its senior executives should be compensated in accordance with their relative experience levels of responsibility within the Company and the demands the Company places on them.
2011 Compensation of David W. Head. When setting compensation for Mr. Head upon his hire during fiscal 2010, the Committee referenced the compensation paid to officers holding the position of chief executive officer at companies within our previously-established peer group as well as Mr. Head’s compensation package at his previous employer. Additionally, the committee reviewed information from the annual Hay Group Chain Restaurant Compensation Association survey regarding base salary, target cash bonus and target stock-based compensation. In light of that market-based data, and following negotiations with Mr. Head regarding his employment, Mr. Head’s base salary for 2010 was established at an annualized amount of $535,000, which the Compensation and Human Resources Committee believed was appropriate in light of Mr. Head’s experience, the compensation levels of our other executive officers, and the compensation data referenced above. As an inducement to Mr. Head to accept our employment offer, Mr. Head was entitled to a cash bonus for fiscal 2010 of $75,000. In connection with his hire Mr. Head was also awarded 40,000 shares of restricted stock and an option to purchase 120,000 shares of our common stock, as described in more detail below under “Long-Term Incentive Compensation.” In light of these awards, for 2011 Mr. Head did not receive additional long-term incentive compensation. Mr. Head did receive a cash bonus opportunity as described below under “Cash Bonuses.” The Compensation and Human Resources Committee deferred review of Mr. Head’s base salary until the anniversary of his hire date in September. The Compensation and Human Resources Committee determined at that time to increase Mr. Head’s annual base salary by $90,000 to $625,000. This decision was made in recognition of (i) improving sales and customer counts at the Stoney River and Ninety Nine concepts, (ii) positioning the O’Charley’s concept for improved results in 2012 and (iii) strong individual performance reviews by the Board of Directors. Furthermore, the Compensation and Human Resources Committee felt Mr. Head had strengthened the Company’s senior management team with the addition of new concept presidents at the O’Charley’s and Stoney River concepts, a new Vice President of Operations for the O’Charley’s concept and the promotion of Mr. Williams to Chief Financial Officer and Treasurer.
Base Salaries. As was the case with Mr. Head, our Compensation and Human Resources Committee did not adjust base salaries for our Named Executive Officers other than our CEO when making compensation decisions at the beginning of fiscal 2011 in order to provide the Committee and Mr. Head better insight for evaluating our Named Executive Officers’ and the Company’s performance. An exception to this was a $3,800 increase in annual base salary to Mr. Williams in February 2011 which was made at the same time as other ordinary course salary increases were made to officers that do not report directly to our Chief Executive Officer (at the time Mr. Williams had not yet been promoted to Chief Financial Officer). Mr. Williams received an additional $5,000 per month in salary as compensation for serving as Interim Chief Financial officer from December 26, 2010 until August 9, 2011.
During the latter half of fiscal 2011, at the recommendation of Mr. Head, our Compensation and Human Resources Committee approved raises in base salary for Messrs. Williams and Grady. Mr. Williams’ salary was increased to $300,000 in connection with his promotion to Chief Financial Officer in August 2011. Mr. Grady’s salary was increased by $10,710 to $367,710 in August 2011. The salary increase for Mr. Grady was made in recognition of improvements at our Ninety Nine concept related to our turnaround strategy which included improved sales, guest counts and guest satisfaction scores, and also in recognition of the fact that the Company had not increased salaries for the past three years.
84
Table of Contents
Cash Bonuses. We incentivize our Named Executive Officers by establishing cash bonus opportunities that are tied to financial performance objectives. We believe that the opportunity to earn a significantly variable amount of cash compensation tied to our annual Company performance aligns short-term executive performance with shareholder interests. A performance-based bonus system, administered under our shareholder-approved Executive Incentive Plan, also holds our executives accountable for sub-par Company performance. In 2011 we did not pay performance bonuses to any of our Named Executive Officers, except Mr. Thimm for performance relating to our Stoney River concept. In February 2012, Mr. Buehler received a bonus of $75,000 as an inducement grant related to his joining the Company in September 2011.
For 2011, we developed a bonus program intended to reward our employees for meeting or improving our earnings before interest, taxes, depreciation and amortization, adjusted to exclude severance and recruiting costs and other non-cash charges (this measurement is referred to herein as “adjusted EBITDA”), relative to budgeted amounts. If we did not meet our budgeted adjusted EBITDA, none of our Named Executive Officers could receive a bonus. To the extent our budgeted adjusted EBITDA was met, our Named Executive Officers could earn one third of their target bonus (with targets for each Named Executive Officer as more fully defined below). As adjusted EBITDA performance improved, a greater portion of their respective target bonus could be earned.
For Messrs. Head and Williams, we based bonus eligibility entirely on improvements in Company-wide adjusted EBITDA. For Messrs. Craft, Grady and Thimm, we based bonuses 25% on improvement in Company-wide adjusted EBITDA and 75% on improvement in concept adjusted EBITDA (O’Charley’s, Ninety Nine and Stoney River, respectively). Target bonuses for 2011 as a percentage of base salary for our Named Executive Officers were as follows: Mr. Head, 100%; Mr. Williams, 40%; Mr. Craft, 70%; Mr. Grady, 60%; and Mr. Thimm, 50%.
In order for our Named Executive Officers to receive 100% of their target bonus, Company-wide and/or concept EBITDA results would have had to significantly exceed budgeted adjusted EBITDA. For instance, even if we had attained budgeted adjusted EBITDA at the Company-wide level, only 33% of each individual’s respective target bonus (for that portion tied to Company-wide performance) would have been funded. And accordingly, even if we had attained budgeted adjusted EBITDA at the concept specific level, only 33% of each individual’s respective target bonus (for that portion, if any, tied to concept specific performance) would have been funded. We set 2011 adjusted EBITDA targets, consistent with our budget, at $50.5 million Company-wide; $49.3 million at our O’Charley’s concept; $26.0 million at our Ninety Nine concept; and $3.5 million at our Stoney River concept. Our 2011 Company-wide adjusted EBITDA was $40.2 million, while our O’Charley’s-level adjusted EBITDA was $34.5 million, our Ninety-Nine adjusted EBITDA was $23.6 million, and our Stoney River adjusted EBITDA was $3.7 million. Because the Company-wide targets were not met, no performance bonuses based on Company-wide results were paid to our Named Executive Officers for fiscal 2011. However, because the Stoney River concept exceeded budget adjusted EBITDA, Mr. Thimm earned a bonus of $79,110. As noted above, 75% (or approximately $93,209) of Mr. Thimm’s $124,279 target cash bonus was tied to performance of our Stoney River concept. Our Stoney River concept exceeded adjusted EBITDA by $149,000, which entitled Mr. Thimm to receive 84.9% of the portion of his target bonus that was tied to the Stoney River concept’s performance.
In January 2012 the Compensation and Human Resources Committee awarded Mr. Grady a discretionary cash bonus in the amount of $35,000. This cash bonus was awarded in recognition of improvements at our Ninety Nine concept related to our turnaround strategy which included improved sales, guest counts and guest satisfaction scores. The bonus was also awarded based on the recognition that the failure of Mr. Grady to receive a bonus under the Company’s 2011 cash bonus plan was due in part to rising commodity costs which affected the casual dining industry generally and over which Mr. Grady had little control.
In November 2011 the Compensation and Human Resources Committee awarded Mr. Williams a discretionary cash bonus in the amount of $16,315. This cash bonus was awarded in recognition of Mr. Williams’ contributions with respect to the sale and leaseback transaction completed October 18, 2011.
Long-Term Incentive Compensation. We believe that equity-based long-term incentive compensation provides a strong link between executive interests and the objective of creating shareholder value. To establish such incentives, we historically have used both performance-vesting and time-vesting stock option and restricted stock awards, tailoring the terms of such awards to suit Company and shareholder objectives.
With respect to the number of shares underlying our long-term incentive awards, our historical practice has been to determine the dollar amount of equity compensation that we want to provide, based on our total direct compensation targets and consistent with our compensation strategy of providing significant incentive-based pay. With the exception of
85
Table of Contents
significant promotions and new hires, we generally make equity awards at the first meeting of the Compensation and Human Resources Committee each year. This timing enables us to consider our prior-year performance in determining the appropriate size of equity awards.
In 2009, we evaluated our equity incentive practices in light of our turnaround strategy, the uncertain economic environment and our desire to motivate our existing executive team to lead us through the challenging recessionary environment while building long-term shareholder value. In this context, we awarded time-based stock options (the “2009 Grants”) with a three-year cliff vesting schedule and six-year term at a per-share exercise price of $2.74, the grant-date closing price of our common stock. Mr. Craft’s grant, awarded when he joined the Company in October 2009, contained similar terms. Messrs. Grady and Williams are the only remaining Named Executive Officers with 2009 grants. The option vesting date for the 2009 Grants was intended to provide our existing executives with incentive to remain with us for several years and to build the Company’s value during this time frame. Except in connection with a change in control as discussed more fully below, the Named Executive Officers must be employed with the Company on the vesting date in order to retain any rights with respect to such 2009 Grants.
Importantly, we intended the 2009 Grants to cover three years’ worth of equity grants to our Named Executive Officers (other than grants that might be made in connection with promotions or new hires). In 2011, we made equity grants in connection with new hires to Messrs. Thimm and Buehler. Additionally, Mr. Williams received an equity grant in connection with his promotion to chief financial officer. In 2011, we also applied previously-established performance conditions to the restricted stock we granted to our Named Executive Officers in 2008. These awards were structured to vest in equal 25% annual installments over four years beginning in 2009, subject to performance conditions being achieved each year. Because our Company failed to achieve the 2011 performance conditions, 25% of the award was forfeited. The 2011 performance conditions applied to the portions of these awards allocated for the year were structured in a manner similar to those of our 2011 bonus plan described above – i.e., the tranche required achievement of budgeted Company-wide EBITDA, which was not met.
Severance and Change-in-Control Benefits. It is our experience that reasonable severance and change-in-control benefits are often necessary to recruit and retain effective senior managers. When we agree to provide severance benefits, we try to set payment levels that reflect the fact that it may be difficult for a high-level executive to find comparable employment within a short period of time. In addition, we seek to tie such severance benefits to non-compete covenants designed to protect us from a departed executive immediately joining one of our competitors.
We have entered into executive employment agreements with each of our Named Executive Officers. The employment agreement with Mr. Grady expires in March 2013 Mr. Head, our president and chief executive officer, entered into a similar form of executive employment agreement upon joining the Company in September 2010, which expires on September 30, 2014. Messrs. Buehler and Williams entered into similar forms of executive employment agreements in September and August 2011, respectively; both employment agreements expire on September 30, 2014. Mr. Thimm entered into an executive employment agreement upon joining the Company in February 2011, which expires on February 2, 2014.
Under the agreements entered into with our Named Executive Officers, each such officer agrees to refrain from competing with the Company during the term of their employment and for a period of 12 months thereafter and to refrain from soliciting employees of the Company to terminate their employment. In exchange, we agree to make certain severance payments to each such executive in the event that his employment is terminated without “cause” or if he terminates his employment with “good reason” (as such terms are defined in the executive employment agreements). Upon such a termination Messrs. Grady, Head, Thimm, Williams and Buehler will each be entitled to salary continuation for a period of 12 months. Additionally, Mr. Grady would be entitled to payment of the target bonus amount for the fiscal year in which the termination occurs, or the target bonus amount for the 2008 fiscal year if greater. In the case of Mr. Head, if such a termination occurs he would be eligible for any outstanding bonus earned in the prior year but not yet paid. In addition, upon such a termination, all of our Named Executive Officers with the exception of Mr. Thimm would be entitled, subject to certain limitations, to continuation of certain employee benefits for a period of twelve months.
Mr. Craft’s resignation on August 28, 2011 was treated as a termination without “cause” for purposes of his employment agreement. Consistent with such agreement, he will receive one times his annual salary in weekly installments over a period of fifty-two (52) weeks, and continuation of health insurance benefits for fifty-two (52) weeks following the date of termination.
With respect to potential changes in control of the Company, we believe that it is important to align our senior managers’ financial interests with those of our shareholders. We seek to reduce the reluctance that our senior-most
86
Table of Contents
executives might have in pursuing change-in-control transactions that would benefit our shareholders, but possibly result in job loss for them following such a transaction. To this end, the executive employment agreements with our Named Executive Officers address the possibility of job loss after a change in control. Upon a change in control, the executive is entitled to a lump sum payment if he is terminated within eighteen months of such change in control other than for death, “cause,” “disability,” or “retirement” (as such terms are defined in the respective agreements). The executive is also entitled to such lump sum payment, if, following a change in control, he terminates employment with the Company for “good reason” (as defined in the respective agreements). Upon such a termination, our executive officers are each entitled to the following: Messrs. Head and Grady are each entitled to severance pay in a lump sum amount equal to the sum of (i) 150% of the average of the aggregate annual salary paid to him by the Company during the three calendar years preceding the change in control, and (ii) 150% of the highest bonus compensation paid to him for any of the three calendar years preceding the change in control; Messrs. Buehler and Williams are each entitled to severance pay in a lump sum amount equal to 150% of the salary currently paid to him; and Mr. Thimm is entitled to severance pay in a lump sum amount equal to 100% of his current base salary. In addition, in the event of such a termination following a change in control, Messrs. Head and Grady are entitled to continuation of health insurance benefits for a period of 18 months, while Messrs. Buehler and Williams are entitled to continuation of health insurance benefits for a period of 12 months. Notwithstanding the foregoing, with respect to the employment agreements entered into with Messrs. Head, Grady, Buehler, Williams and Thimm, in the event the lump sum severance payment, either alone or together with other payments that the executive has the right to receive from the Company, exceeds an amount would be deemed to be a “parachute payment” under Section 280G of the Internal Revenue Code of 1986, as amended, the executive may elect to reduce such lump sum severance payment to the largest amount not subject to the excise tax imposed by Section 4999 of the Internal Revenue Code of 1986, as amended. For more information regarding the potential payments upon a termination or change in control for each Named Executive Officer, please see the table entitled “Potential Payments Upon Termination or Change in Control” below.
Retirement Plans. We maintain a 401(k) salary reduction and profit-sharing plan, pursuant to which team members can make contributions up to the lesser of 60% of their annual compensation or the maximum amount permitted by law. The Company contributes quarterly to the 401(k) plan an amount equal to 50% of team member contributions, up to 3% of eligible compensation so contributed. Company contributions vest at the rate of 25% each year beginning after the team member’s initial year of employment. None of our Named Executive Officers participated in our 401(k) salary reduction and profit-sharing plan in 2011.
We maintain a nonqualified deferred compensation plan for certain members of our senior management to provide supplemental retirement income benefits through deferrals of salary and bonuses. Participants in this plan can contribute, on a pre-tax basis, up to 50% of their base pay and 100% of their bonuses. The Company contributes quarterly to this plan an amount derived from applying a matching formula of each participant’s deferrals. Additional details regarding this supplemental retirement plan are provided in the table entitled “2011 Non-Qualified Deferred Compensation.”
Health and Welfare Benefits. Our Named Executive Officers are eligible for health and welfare benefits offered to all of our employees. We provide additional and/or higher levels of coverage for some Company-provided benefits, as outlined in the chart below. We offer these benefits in order to remain competitive with other companies. We determine the amount of benefits to offer based on the cost to the Company relative to the benefit to the named executive. The following is a summary of these benefits:
| Life Insurance |
AD&D Insurance |
Short-Term Disability |
Long-Term Disability |
Supplemental Disability | ||||
| 1X base salary plus average bonus for last two years (up to $1,000,000). | 1X base salary plus average bonus for last two years (up to $1,000,000). | 100% base salary for up to 180 days. | 60% base salary plus average bonus for last two years (up to $10,000 monthly maximum). | Difference between $10,000 monthly maximum for long- term disability and 60% of base salary plus average bonus for last two years, with a maximum combined monthly benefit of $30,000. |
Perquisites. We provide limited perquisites to our Named Executive Officers which include an annual car and gas allowance and health club membership dues. Additionally, we paid tuition in the amount of $19,631 to Vanderbilt University to enable Mr. Williams to pursue a master of business administration degree.
Accounting and Tax Implications. We consider the financial reporting and income tax consequences to the Company of individual compensation elements when making compensation decisions. Overall, we seek to balance the desire to
87
Table of Contents
maintain an effective compensation package for the Named Executive Officers with the need to maximize the immediate deductibility of compensation – while ensuring an appropriate (and transparent) impact on reported earnings and other closely followed financial measures.
In making compensation decisions, we have considered that Internal Revenue Code Section 162(m) limits deductions for compensation paid in excess of $1 million. Our annual cash bonuses are designed to qualify for the exemption of “performance-based” compensation from the deductibility limit. However, we reserve the discretion to design and use compensation elements that may not be deductible within Section 162(m).
88
Table of Contents
Summary Compensation Table
The following table sets forth certain summary information for the fiscal years ended December 25, 2011, December 26, 2010 and December 27, 2009, respectively, with respect to the compensation awarded to, earned by, or paid to our Named Executive Officers.
| Name and Principal Position |
Year | Salary ($)(1) |
Bonus ($)(2) |
Stock Awards ($)(3) |
Option Awards ($)(4) |
Non-Equity Incentive Plan Compensation ($)(5) |
Change in Pension Value and Nonqualified Deferred Compensation Earnings ($) |
All
Other Compensation ($)(6) |
Total ($) |
|||||||||||||||||||||||||||
| David W. Head |
2011 | 567,760 | — | — | — | — | — | 40,436 | 608,196 | |||||||||||||||||||||||||||
| 2010 | 178,421 | 75,000 | 244,000 | 461,340 | — | — | 23,208 | 981,969 | ||||||||||||||||||||||||||||
| R. Jeffrey Williams |
2011 | 270,775 | 16,315 | 155,400 | 74,304 | — | — | 46,926 | 563,721 | |||||||||||||||||||||||||||
| Marc A. Buehler |
2011 | 101,538 | 75,000 | — | 399,540 | — | — | 74,311 | 650,389 | |||||||||||||||||||||||||||
| John R. Grady |
2011 | 361,325 | 35,000 | — | — | — | — | 43,210 | 439,535 | |||||||||||||||||||||||||||
| 2010 | 357,000 | — | — | — | — | — | 49,170 | 406,170 | ||||||||||||||||||||||||||||
| 2009 | 350,134 | — | — | 192,500 | 37,678 | — | 48,431 | 628,743 | ||||||||||||||||||||||||||||
| Alfred L. Thimm, Jr. |
2011 | 241,154 | — | — | 163,660 | 80,474 | — | 34,023 | 519,311 | |||||||||||||||||||||||||||
| Wilson Craft |
2011 | 293,880 | — | — | — | — | — | 183,357 | 477,236 | |||||||||||||||||||||||||||
| 2010 | 445,000 | — | — | — | — | — | 92,084 | 537,084 | ||||||||||||||||||||||||||||
| 2009 | 94,135 | — | — | 943,500 | 35,942 | — | 18,775 | 1,092,352 | ||||||||||||||||||||||||||||
| (1) | The amounts in the Salary column represent the base salary paid for the fiscal year. In the case of Mr. Williams, this amount includes $5,000 per month paid to him for serving as interim Chief Financial Officer until August 9, 2011. Mr. Craft’s annualized salary at the time of his resignation on August 28, 2011 was $445,000. Mr. Buehler was hired on September 16, 2011, with an annualized base salary of $400,000. Mr. Thimm was hired on February 2, 2011 with an annualized base salary $275,000. |
| (2) | The amount of bonus compensation reported for Messrs. Williams and Grady represents a discretionary bonus as discussed in the Compensation Discussion and Analysis and a sign-on bonus for Mr. Buehler. |
| (3) | The amounts in the Stock Awards column reflect the aggregate grant date fair value of restricted stock awards, as determined for financial reporting purposes. As discussed in the Compensation Discussion and Analysis, our Named Executive Officers in 2011 forfeited portions of previously granted performance-based restricted stock awards. |
| (4) | The amounts in the Option Awards column reflect the aggregate grant date fair value, as determined for financial reporting purposes, for awards granted during the respective fiscal years set forth in the Year column. Assumptions used in the calculation of these amounts are discussed in notes 1 and 6 of the “Notes to the Consolidated Financial Statements.” |
| (5) | The amounts in the Non-Equity Incentive Plan Compensation column reflect the cash bonuses paid to the named individuals under the applicable year’s bonus plan described under the heading “Cash Bonuses” above. |
89
Table of Contents
| (6) | Amounts shown in the All Other Compensation column for 2011 include for each Named Executive Officer: |
| Name | Car Allowance ($) |
Deferred Compensation Matching Contributions ($) |
Group ($) |
Disability ($) |
Severance ($) (a) |
Relocation ($) |
Other ($) (b) |
|||||||||||||||||||||
| David W. Head |
25,000 | — | 10,740 | 4,456 | — | — | 240 | |||||||||||||||||||||
| R. Jeffrey Williams |
25,000 | — | 388 | 1,666 | — | — | 19,871 | |||||||||||||||||||||
| Marc A. Buehler |
7,212 | 3,277 | 154 | 741 | — | 62,868 | 60 | |||||||||||||||||||||
| John R. Grady |
25,000 | 10,840 | 433 | 6,937 | — | — | — | |||||||||||||||||||||
| Alfred L. Thimm, Jr. |
22,596 | — | 230 | 3,184 | — | 7,832 | 180 | |||||||||||||||||||||
| Wilson Craft |
16,346 | 7,347 | 308 | 5,157 | 154,038 | — | 160 | |||||||||||||||||||||
| (a) | Pursuant to his employment agreement, this amount includes cash severance provided to Mr. Craft following his resignation on August 28, 2011. |
| (b) | The amounts shown in the Other column include Company contributions to health club dues. The amount listed for Mr. Williams includes $19,631 in tuition paid by the Company to Vanderbilt University. |
90
Table of Contents
2011 Grants of Plan-Based Awards
The following table summarizes grants of plan-based awards made to our Named Executive Officers in 2011.
| Name |
Grant Date |
Estimated Future
Payouts Under Non-Equity Incentive Plan Awards(1) |
All Other Stock Awards: Number of Shares of Stock or Units (#) |
All Other Option Awards: Number of Securities Underlying Options (#) |
Exercise or Base Price of Option Awards ($) |
Grant Date Fair Value of Stock and Option Awards ($)(3) |
||||||||||||||||||||||||||
| Threshold ($) |
Target ($) |
Maximum ($)(2) |
||||||||||||||||||||||||||||||
| David W. Head |
— | 206,250 | 625,000 | — | — | — | — | — | ||||||||||||||||||||||||
| R. Jeffrey Williams |
— | 39,600 | 120,000 | — | — | — | — | — | ||||||||||||||||||||||||
| 05/19/11 | — | — | — | — | 15,000 | 7.39 | 74,304 | |||||||||||||||||||||||||
| 08/10/11 | — | 30,000 | — | — | 155,400 | |||||||||||||||||||||||||||
| Marc A. Buehler |
09/16/11 | — | — | — | — | 100,000 | 6.20 | 399,540 | ||||||||||||||||||||||||
| John R. Grady |
— | 72,807 | 220,626 | — | — | — | — | — | ||||||||||||||||||||||||
| Alfred L. Thimm, Jr. |
— | 41,012 | 124,279 | — | — | — | — | — | ||||||||||||||||||||||||
| 02/08/11 | 40,000 | 6.39 | 163,660 | |||||||||||||||||||||||||||||
| Wilson Craft |
— | 102,795 | 311,500 | — | — | — | — | — | ||||||||||||||||||||||||
| (1) | The amounts shown in Threshold, Target and Maximum columns reflect the threshold and target bonus levels, respectively, that could have been earned under the Company’s cash bonus plan for fiscal year 2011. Upon the attainment of the respective levels of budgeted adjusted EBITDA for the concept or enterprise, as applicable, threshold bonuses would be paid, where Threshold equals 33% of the Target amounts shown above. The plan is described under “Cash Bonuses” above. Mr. Thimm was the only Named Executive Officer to receive a performance-based bonus, which is reflected in the Non-Equity Incentive Plan Compensation column of the Summary Compensation Table and discussed in the “Cash Bonuses” section above. |
| (2) | Unlike previous years, the 2011 bonus plan was uncapped, meaning that there was no maximum amount under the plan. Instead, for every incremental dollar earned above the target EBITDA for the NEOs, 50% of that amount would go into a pool. At the end of the year, the proceeds in the pool would be allocated among all employees who were eligible to receive the award by virtue of surpassing their respective EBITDA target. |
| (3) | The amounts shown in this column represent the grant date fair value of stock options as determined for financial reporting purposes. Assumptions used in the calculation of these amounts are discussed in notes 1 and 6 of the “Notes to the Consolidated Financial Statements.” |
91
Table of Contents
Outstanding Equity Awards at Fiscal 2011 Year-End
The following table summarizes the number of outstanding equity awards held by each of our Named Executive Officers as of December 25, 2011. Market values are based on the closing price of our common stock on December 23, 2011, of $5.54.
| Option Awards |
Stock Awards |
|||||||||||||||||||||||||||||||
| Name |
Number of Securities Underlying Unexercised Options (#) Exercisable |
Number of Securities Underlying Unexercised Options (#) Unexercisable |
Option Exercise Price ($) |
Option Expiration Date |
Number of Shares or Units of Stock That Have Not Vested (#) |
Market Value of Shares or Units of Stock That Have Not Vested ($) |
Equity Incentive Plan Awards: Number of Unearned Shares, Units or Other Rights That Have Not Vested (#) |
Equity Incentive Plan Awards: Market or Payout Value of Unearned Shares, Units or Other Rights That Have Not Vested ($) |
||||||||||||||||||||||||
| David W. Head |
— | 120,000 | (1) | $ | 6.10 | 09/01/20 | 40,000 | (2) | 221,600 | — | — | |||||||||||||||||||||
| R. Jeffrey Williams |
2,760 | — | $ | 21.19 | 02/19/13 | 1,422 | (3) | 7,878 | — | — | ||||||||||||||||||||||
| — | 15,000 | (4) | $ | 2.74 | 02/10/15 | 30,000 | (5) | 166,200 | — | — | ||||||||||||||||||||||
| — | 10,000 | (6) | $ | 7.14 | 02/10/16 | — | — | — | — | |||||||||||||||||||||||
| — | 15,000 | (7) | $ | 7.39 | 05/19/18 | — | — | — | — | |||||||||||||||||||||||
| Marc A. Buehler |
— | 100,000 | (8) | $ | 6.20 | 09/16/18 | — | — | — | — | ||||||||||||||||||||||
| John R. Grady |
24,000 | — | $ | 20.42 | 01/27/13 | 6,518 | (9) | 36,110 | ||||||||||||||||||||||||
| 125,000 | (4) | $ | 2.74 | 02/10/15 | 6,518 | (10) | 36,110 | |||||||||||||||||||||||||
| Alfred L. Thimm, Jr. |
— | 40,000 | (11) | $ | 6.39 | 02/08/18 | — | — | — | — | ||||||||||||||||||||||
| Wilson Craft |
— | 150,000 | (12) | $ | 9.62 | 02/10/15 | — | — | — | — | ||||||||||||||||||||||
| (1) | One-half of these options will vest on September 1, 2012 and the remaining shares will vest on September 1, 2013, provided that executive remains employed by the Company and except as provided under a change in control. |
| (2) | These restricted shares will vest in full on September 1, 2014, provided that executive remains employed by the Company and except as provided under a change in control. |
| (3) | These restricted shares vested in full on February 7, 2012. |
| (4) | These options vested in full on February 10, 2012. |
| (5) | These restricted shares will vest in full on August 10, 2014. |
| (6) | These restricted shares will vest in full on February 10, 2013, provided that executive remains employed by the Company and except as provided under a change in control. |
| (7) | These unvested options, granted on May 19, 2011, vest over three years on each anniversary of the grant. |
| (8) | These unvested options, granted on September 16, 2011, will vest in full on September 16, 2014. |
| (9) | These shares were forfeited on February 1, 2012 for failure to meet minimum performance targets established for the 2011 fiscal year by the compensation and human resources committee. |
| (10) | These shares will vest on March 10, 2012, provided that executive remains employed by the Company and except as provided under a change in control. |
| (11) | These unvested options, granted on February 8, 2011, will vest 50% on February 8, 2013 and 50% on February 8, 2014. |
| (12) | These options were forfeited upon the termination of Mr. Craft’s employment with the Company. |
92
Table of Contents
2011 Option Exercises and Stock Vested
The following table summarizes the number of options exercised and the vesting of restricted stock awards and the value realized by our Named Executive Officers as a result of such events during 2011.
| Option Awards | Stock Awards | |||||||||||||||
| Name | Number of (#) |
Value Realized ($) |
Number of (#) |
Value ($)(1) |
||||||||||||
| David W. Head |
— | — | — | — | ||||||||||||
| R. Jeffrey Williams |
— | — | 1,096 | 6,872 | ||||||||||||
| — | — | 1,421 | 8,910 | |||||||||||||
| Marc A. Buehler |
— | — | — | — | ||||||||||||
| John R. Grady |
— | — | 3,222 | 20,202 | ||||||||||||
| — | — | 3,258 | 19,784 | |||||||||||||
| Alfred L. Thimm, Jr. |
— | — | — | — | ||||||||||||
| — | — | |||||||||||||||
| Wilson Craft |
— | — | — | — | ||||||||||||
| (1) | The amounts shown in the Value Realized on Vesting column represent the aggregate dollar amount realized upon vesting by multiplying the number of shares of stock acquired on vesting by the closing stock price on the vesting date. |
93
Table of Contents
2011 Non-Qualified Deferred Compensation
The following table summarizes non-qualified deferred compensation earned by our Named Executive Officers in 2011.
| Name (1) | Executive ($)(2) |
Registrant ($)(3) |
Aggregate ($) |
Aggregate ($) |
Aggregate ($)(4) |
|||||||||||||||
| Marc A. Buehler |
10,769 | 3,277 | (1,267 | ) | — | 12,779 | ||||||||||||||
| John R. Grady |
21,679 | 10,840 | (3,775 | ) | — | 120,323 | ||||||||||||||
| Wilson Craft |
14,694 | 7,246 | 284 | — | 62,585 | |||||||||||||||
| (1) | Messrs. Head, Williams and Thimm did not participate in the non-qualified plan in 2011 and have no outstanding balance in the plan. |
| (2) | Executive contributions are part of “Salary” in the Summary Compensation Table. |
| (3) | Registrant contributions are included under “All Other Compensation” in the Summary Compensation Table. Company matching contributions equal 50% of the first 6% of compensation so contributed. |
| (4) | The amounts in this column include amounts reported as compensation to the executive in the Summary Compensation Tables in prior years’ proxy statements as follows: Mr. Buehler – $0, Mr. Grady – $64,931 and Mr. Craft – $36,944. These amounts do not take into account amounts distributed in connection with Internal Revenue Code Section 409A transition relief or previously scheduled in-service withdrawals. |
94
Table of Contents
Potential Payments Upon Termination or Change in Control
The following tables summarize the potential payments to be made to our Named Executive Officers upon termination of their employment or a change in control of the Company, assuming termination on December 25, 2011.
David W. Head
| Compensation |
Termination
by Company without Cause or by Executive with Good Reason ($) |
Termination by Company with Cause or by Executive without Good Reason ($) |
Termination following Change in Control other than for Death, Disability or Retirement, without Cause, or with Good Reason ($) |
Termination following Change in Control with Cause or without Good Reason ($) |
Death ($) |
Disability ($) |
Retirement ($) |
|||||||||||||||||||||
| Severance |
625,000 | — | 982,500 | (2) | — | — | — | — | ||||||||||||||||||||
| Accelerated vesting of stock options(1) |
— | — | — | — | — | — | — | |||||||||||||||||||||
| Accelerated vesting of restricted stock |
— | — | 221,600 | — | 221,600 | 221,600 | — | |||||||||||||||||||||
| Non-qualified deferred compensation plan |
— | — | — | — | — | — | — | |||||||||||||||||||||
| Post-termination health insurance |
8,563 | — | 12,845 | — | — | — | — | |||||||||||||||||||||
|
|
|
|
|
|
|
|
|
|
|
|
|
|
|
|||||||||||||||
| Total |
633,563 | — | 1,216,945 | — | 221,600 | 221,600 | — | |||||||||||||||||||||
|
|
|
|
|
|
|
|
|
|
|
|
|
|
|
|||||||||||||||
| (1) | Information regarding outstanding unexercisable options held by each Named Executive Officer is set forth in the Outstanding Equity Awards at Fiscal 2011 Year-End table above. Amounts represent the maximum profit Mr. Head would have received had he exercised any vested options that were in-the-money on December 25, 2011, including those that vested in connection with a termination of employment following a change in control and sold the underlying stock at $5.54 per share, which was the closing price of one share of the Company’s stock on such date. |
| (2) | This amount includes a bonus severance of $112,500. |
R. Jeffrey Williams
| Compensation |
Termination
by Company without Cause or by Executive with Good Reason ($) |
Termination by Company with Cause or by Executive without Good Reason ($) |
Termination following Change in Control other than for Death, Disability or Retirement, without Cause, or with Good Reason ($) |
Termination following Change in Control with Cause or without Good Reason ($) |
Death ($) |
Disability ($) |
Retirement ($) |
|||||||||||||||||||||
| Severance |
300,000 | — | 450,000 | — | — | — | — | |||||||||||||||||||||
| Accelerated vesting of stock options(1) |
— | — | 42,000 | — | — | — | — | |||||||||||||||||||||
| Accelerated vesting of restricted stock |
— | — | 174,078 | — | 174,078 | 174,078 | — | |||||||||||||||||||||
| Non-qualified deferred compensation plan |
— | — | — | — | — | — | — | |||||||||||||||||||||
| Post-termination health insurance |
6,241 | — | 6,241 | — | — | — | — | |||||||||||||||||||||
|
|
|
|
|
|
|
|
|
|
|
|
|
|
|
|||||||||||||||
| Total |
306,241 | — | 672,319 | — | 174,078 | 174,078 | — | |||||||||||||||||||||
|
|
|
|
|
|
|
|
|
|
|
|
|
|
|
|||||||||||||||
| (1) | Information regarding outstanding unexercisable options held by each Named Executive Officer is set forth in the Outstanding Equity Awards at Fiscal 2011 Year-End table above. Amounts represent the maximum profit Mr. Williams would have received had he exercised any vested options that were in-the-money on December 25, 2011, including those that vested in connection with a termination of employment following a change in control and sold the underlying stock at $5.54 per share, which was the closing price of one share of the Company’s stock on December 23, 2011. Outstanding vested and exercisable options held on December 25, 2011 that were out-of-the-money (exercise price above $5.54) are not reflected in this row as the intrinsic value for these options was $0. |
95
Table of Contents
Marc A. Buehler
| Compensation |
Termination
by Company without Cause or by Executive with Good Reason ($) |
Termination by Company with Cause or by Executive without Good Reason ($) |
Termination following Change in Control other than for Death, Disability or Retirement, without Cause, or with Good Reason ($) |
Termination following Change in Control with Cause or without Good Reason ($) |
Death ($) |
Disability ($) |
Retirement ($) |
|||||||||||||||||||||
| Severance |
400,000 | — | 600,000 | — | — | — | — | |||||||||||||||||||||
| Accelerated vesting of stock options(1) |
— | — | — | — | — | — | — | |||||||||||||||||||||
| Accelerated vesting of restricted stock |
— | — | — | — | — | — | — | |||||||||||||||||||||
| Non-qualified deferred compensation plan(2) |
9,492 | 9,492 | 12,779 | 12,779 | 12,779 | 9,492 | 9,492 | |||||||||||||||||||||
| Post-termination health insurance |
8,563 | — | 8,563 | — | — | — | — | |||||||||||||||||||||
|
|
|
|
|
|
|
|
|
|
|
|
|
|
|
|||||||||||||||
| Total |
418,055 | 9,492 | 621,342 | 9,492 | 9,492 | 9,492 | 9,492 | |||||||||||||||||||||
|
|
|
|
|
|
|
|
|
|
|
|
|
|
|
|||||||||||||||
| (1) | Information regarding outstanding unexercisable options held by each Named Executive Officer is set forth in the Outstanding Equity Awards at Fiscal 2011 Year-End table above. Amounts represent the maximum profit Mr. Buehler would have received had he exercised any vested options that were in-the-money on December 25, 2011, including those that vested in connection with a termination of employment following a change in control and sold the underlying stock at $5.54 per share, which was the closing price of one share of the Company’s stock on December 23, 2011. Outstanding vested and exercisable options held on December 25, 2011 that were out-of-the-money (exercise price above $5.54) are not reflected in this row as the intrinsic value for these options was $0. |
| (2) | In the event that a Named Executive Officer’s employment with the Company is terminated, either voluntarily or involuntarily, the officer will receive the balance of the deferred compensation account no sooner than six months following termination of employment or death. The amount shown reflects the participant’s vested balance as of December 25, 2011. |
John R. Grady
| Compensation |
Termination
by Company without Cause or by Executive with Good Reason ($) |
Termination by Company with Cause or by Executive without Good Reason ($) |
Termination following Change in Control other than for Death, Disability or Retirement, without Cause, or with Good Reason ($) |
Termination following Change in Control with Cause or without Good Reason ($) |
Death ($) |
Disability ($) |
Retirement ($) |
|||||||||||||||||||||
| Severance |
606,196 | (2) | — | 594,180 | (3) | — | — | — | — | |||||||||||||||||||
| Accelerated vesting of stock options (1) |
— | — | 350,000 | — | — | — | — | |||||||||||||||||||||
| Accelerated vesting of restricted stock |
— | — | 36,110 | — | 36,110 | 36,110 | — | |||||||||||||||||||||
| Non-qualified deferred compensation plan(4) |
120,323 | 120,323 | 120,323 | 120,323 | 120,323 | 120,323 | 120,323 | |||||||||||||||||||||
| Post-termination health insurance |
8,563 | — | 12,845 | — | — | — | — | |||||||||||||||||||||
|
|
|
|
|
|
|
|
|
|
|
|
|
|
|
|||||||||||||||
| Total |
742,222 | 120,323 | 1,113,458 | 120,323 | 156,433 | 156,433 | 120,323 | |||||||||||||||||||||
|
|
|
|
|
|
|
|
|
|
|
|
|
|
|
|||||||||||||||
| (1) | Information regarding outstanding unexercisable options held by each Named Executive Officer is set forth in the Outstanding Equity Awards at Fiscal 2011 Year-End table above. Amounts represent the maximum profit Mr. Grady would have received had he exercised any vested options that were in-the-money on December 25, 2011, including those that vested in connection with a termination of employment following a change in control and sold the underlying stock at $5.54 per share, which was the closing price of one share of the Company’s stock on December 23, 2011. Outstanding vested and exercisable options held on December 25, 2011 that were out-of-the-money (exercise price above $5.54) are not reflected in this row as the intrinsic value for these options was $0. |
| (2) | This amount includes a severance payment of $220,626 which is equal to 100% of Mr. Grady’s target bonus for fiscal 2011. |
| (3) | This amount includes a severance payment of $56,517 which is equal to 150% of the highest bonus paid to Mr. Grady in the last three years. |
96
Table of Contents
| (4) | In the event that a Named Executive Officer’s employment with the Company is terminated, either voluntarily or involuntarily, the officer will receive the balance of the deferred compensation account no sooner than six months following termination of employment or death. |
Alfred L. Thimm, Jr.
| Compensation |
Termination
by Company without Cause or by Executive with Good Reason ($) |
Termination by Company with Cause or by Executive without Good Reason ($) |
Termination following Change in Control other than for Death, Disability or Retirement, without Cause, or with Good Reason ($) |
Termination following Change in Control with Cause or without Good Reason ($) |
Death ($) |
Disability ($) |
Retirement ($) |
|||||||||||||||||||||
| Severance |
275,000 | — | 275,000 | — | — | — | — | |||||||||||||||||||||
| Accelerated vesting of stock options(1) |
— | — | — | — | — | — | — | |||||||||||||||||||||
| Accelerated vesting of restricted stock |
— | — | — | — | — | — | — | |||||||||||||||||||||
| Non-qualified deferred compensation plan |
— | — | — | — | — | — | — | |||||||||||||||||||||
| Post-termination health insurance |
— | — | — | — | — | — | — | |||||||||||||||||||||
|
|
|
|
|
|
|
|
|
|
|
|
|
|
|
|||||||||||||||
| Total |
275,000 | — | 275,000 | — | — | — | — | |||||||||||||||||||||
|
|
|
|
|
|
|
|
|
|
|
|
|
|
|
|||||||||||||||
| (1) | Information regarding outstanding unexercisable options held by each Named Executive Officer is set forth in the Outstanding Equity Awards at Fiscal 2011 Year-End table above. Amounts represent the maximum profit Mr. Thimm would have received had he exercised any vested options that were in-the-money on December 25, 2011, including those that vested in connection with a termination of employment following a change in control and sold the underlying stock at $5.54 per share, which was the closing price of one share of the Company’s stock on December 23, 2011. Outstanding vested and exercisable options held on December 25, 2011 that were out-of-the-money (exercise price above $5.54) are not reflected in this row as the intrinsic value for these options was $0. |
The following table describes the actual payments that Mr. Craft has been paid or is entitled to receive as a result of his termination during fiscal 2011.
Wilson Craft
| Compensation |
Termination
by Company without Cause or by Executive with Good Reason ($) |
|||
| Severance |
445,000 | |||
| Accelerated vesting of stock options(1) |
0 | |||
| Accelerated vesting of restricted stock |
0 | |||
| Non-qualified deferred compensation plan(2) |
43,666 | |||
| Post-termination health insurance |
0 | |||
|
|
|
|||
| Total |
488,666 | |||
|
|
|
|||
97
Table of Contents
| (1) | This amount represents the maximum profit Mr. Craft would have received had he exercised any vested options that were in-the-money on August 28, 2011, the date of his termination, and sold the underlying stock at $4.84 per share, which was the closing price of one share of the Company’s stock on August 26, 2011, the last trading day before his termination. Outstanding vested and exercisable options held on August 28, 2011 that were out-of-the-money (exercise price above $4.84) are not reflected in this row as the intrinsic value for these options was $0. |
| (2) | In the event that a Named Executive Officer’s employment with the Company is terminated, either voluntarily or involuntarily, the officer will receive the balance of the deferred compensation account no sooner than six months following termination of employment or death. Mr. Craft forfeited a portion of the Company matching contribution reflected in the 2011 Non-Qualified Deferred Compensation Table above that was unvested at the date of his termination. |
2011 Director Compensation
The table below represents the compensation earned by each non-employee director during fiscal 2011.
| Name |
Fees Earned or Paid in Cash ($) |
Stock Awards ($)(1) |
Option Awards ($) |
All
Other Compensation ($)(2) |
Total ($) |
|||||||||||||||
| William F. Andrews |
46,038 | 79,999 | — | — | 126,037 | |||||||||||||||
| Arnaud Ajdler |
49,938 | 79,999 | — | — | 129,937 | |||||||||||||||
| Douglas Benham |
54,288 | 79,999 | — | 2,000 | 136,287 | |||||||||||||||
| Philip J. Hickey, Jr. |
107,150 | 79,999 | — | 387 | 187,536 | |||||||||||||||
| Gregory Monahan |
35,963 | 79,999 | — | — | 115,962 | |||||||||||||||
| Dale W. Polley |
53,688 | 79,999 | — | 2,000 | 135,687 | |||||||||||||||
| Richard Reiss, Jr. |
50,763 | 79,999 | — | 2,000 | 132,762 | |||||||||||||||
| H. Steve Tidwell |
48,213 | 79,999 | — | — | 128,212 | |||||||||||||||
| Robert J. Walker |
37,663 | 79,999 | — | — | 117,662 | |||||||||||||||
| Shirley A. Zeitlin |
33,838 | 79,999 | — | — | 113,837 | |||||||||||||||
| (1) | The amounts in the Stock Awards column reflect the aggregate grant date fair value, as determined for financial reporting purposes, for awards granted in 2011. The grant date fair value of the customary annual stock award to each non-employee director in fiscal 2011 was $79,999. |
| (2) | The amount shown in the All Other Compensation column represent matching charitable contributions made by the Company during 2011 pursuant to the Company’s non-employee director compensation policy, as described below: |
| a. | Each non-employee director is eligible for an O’Charley’s Inc. donation match to their charity of choice. |
| b. | The match is based on the non-employee directors’ personal donations and not those made by business affiliations. |
| c. | The match is capped at $2,000 per year, per non-employee director and may be divided between two separate charities at $1,000 each or $2,000 per charity at any time during the fiscal year. |
During 2011, non-employee directors received an annual retainer of $21,250 payable in cash in quarterly installments, a fee of $2,550 for each Board of Directors meeting attended in person, a fee of $2,550 for each committee meeting attended in person, and fees of $850 for each Board of Directors meeting and $450 for each committee meeting in which the director participated by telephone. Directors who served on the special committee in connection with consideration of the Company’s sale and leaseback transaction announced in October 2011 received $3,000 for each meeting of the special committee attended. Directors were reimbursed for travel expenses associated with serving as a director. Directors who served as chairs of each of the audit, compensation and human resources and Nominating and Corporate Governance Committees received an annual fee of $5,100 payable in cash in quarterly installments. The Chairman of the Board received an annual retainer of $63,750 payable in cash in quarterly installments in addition to the Board retainer and other fees. Directors who are officers or employees of the Company receive no compensation for serving as members of the Board of Directors. The aggregate amount of fees paid to the non-employee directors for the 2011 fiscal year was $506,138. The Company also matches charitable contributions by its non-employee directors up to an aggregate of $2,000 annually for each non-employee director.
98
Table of Contents
Each non-employee director receives a grant of restricted stock valued at $100,000 on the date of his or her initial election or appointment to the Board of Directors. These shares vest in three equal, annual installments beginning on the first anniversary date of the grant. In addition, on the date of each annual meeting of shareholders, each non-employee director who continues as a director following such meeting and who has served as a director for at least 11 months prior to such meeting receives a grant of restricted stock valued at approximately $80,000 based on the closing price of the Company’s common stock on the date of grant. The shares vest in full on the date of the next annual meeting of shareholders following the date of grant.
The Board of Directors evaluates the compensation of directors annually and makes adjustments as it deems advisable and consistent with the best interests of the Company’s shareholders and the financial abilities of the Company. After a review of director compensation practices at companies within the previously-established peer group and on account of recent Company performance and management initiatives, the Board of Directors made the decision to reduce the fee schedule.
Compensation Committee Interlocks
During fiscal year 2011, the Compensation and Human Resources Committee of the Board of Directors was composed of Messrs. Ajdler, Reiss and Tidwell. None of these persons has at any time been an officer or employee of the Company or any of its subsidiaries. In addition, there are no relationships among the Company’s executive officers, members of the Compensation and Human Resources Committee or entities whose executives serve on the Board of Directors or the Compensation and Human Resources Committee that require disclosure under applicable SEC regulations.
Compensation and Human Resources Committee Report
The Compensation and Human Resources Committee of the Company has reviewed and discussed the Compensation Discussion and Analysis required by Item 402(b) of Regulation S-K with management. Based on such review and discussion, the Compensation and Human Resources Committee recommended to the Board of Directors that the Compensation Discussion and Analysis be included in this Annual Report.
| Arnaud Ajdler |
Richard Reiss, Jr. | H. Steve Tidwell (Chair) |
| Item 12. | Security Ownership of Certain Beneficial Owners and Management and Related Stockholder Matters. |
The following persons are known by the Company to be the beneficial owners of more than 5% of the outstanding shares of the Company’s common stock. The following information is as of February 20, 2012 and is based upon information set forth in Schedules 13D and 13G filed by such persons with the Commission.
| Name and Address of Beneficial Owner |
Amount and Nature of Beneficial Ownership |
Percent of Class | ||||||
| Fidelity National Financial, Inc. 601 Riverside Avenue Jacksonville, Florida 32204 |
4,320,942 | (1) | 19.7 | % | ||||
| FMR, LLC 82 Devonshire Street Boston, Massachusetts 02109 |
2,580,557 | (2) | 11.8 | % | ||||
| Crescendo Partners 777 3rd Avenue, 37th Floor New York, New York 10017 |
2,155,798 | (3) | 9.8 | % | ||||
| Dimensional Fund Advisors LP Palisades West, Building One 6300 Bee Cave Road Austin, Texas 78746 |
1,764,038 | (4) | 8.0 | % | ||||
| BlackRock, Inc. 40 East 52nd Street New York, New York 10022 |
1,616,708 | (5) | 7.4 | % | ||||
| Ameriprise Financial, Inc. 145 Ameriprise Financial Center Minneapolis, Minnesota 55474 |
1,290,799 | (6) | 5.9 | % | ||||
| Royce & Associates, LLC 745 Fifth Avenue New York, New York 10151 |
1,124,134 | (7) | 5.1 | % | ||||
99
Table of Contents
| (1) | This information is as of February 5, 2012 and is based solely on a Schedule 13G/A filed jointly by Fidelity National Financial, Inc. and Fred Merger Sub Inc. on February 8, 2012. As reported in such filing, Fidelity National Financial, Inc. and Fred Merger Sub Inc. have shared voting power and shared dispositive power with respect to 2,241,400 shares and sole voting power and sole dispositive power with respect to 2,079,542 shares. As a result of the Tender and Support Agreement, dated as of February 5, 2012, between Fidelity National Financial, Inc., Fred Merger Sub Inc., Crescendo Partners II, L.P., Series Z, Crescendo Partners III, L.P., Arnaud Ajdler and Gregory Monahan (collectively, the “Crescendo Partners”), shared voting power with respect to shares of common stock beneficially owned by such stockholders may be deemed to have been acquired by Fidelity National Financial, Inc. and Fred Merger Sub Inc. through execution of the Tender and Support Agreement. Accordingly, the shares reported by Fidelity National Financial, Inc. and Fred Merger Sub Inc. include those shares separately reported by Crescendo Partners. |
| (2) | This information is as of December 31, 2011, and is based solely on a Schedule 13G/A filed by FMR, LLC on February 14, 2012, reporting sole power to vote or direct the vote of 957 shares and the sole power to dispose or to direct the disposition of 2,580,557 shares. As reported in such filing, Fidelity Management & Research Company (“Fidelity”), a wholly-owned subsidiary of FMR, LLC and an investment adviser registered under Section 203 of the Investment Advisers Act of 1940, is the beneficial owner of 2,579,600 shares or 11.74% of the company’s common stock as a result of acting as investment adviser to various investment companies. The ownership of one investment company, Fidelity Growth Fund, amounted to 1,649,292 shares or 7.51% of the company’s common stock outstanding. Edward C. Johnson 3d and FMR, LLC, through its control of Fidelity and the funds, each has sole dispositive power with respect to 2,579,600 shares owned by the funds. Neither FMR, LLC nor Edward C. Johnson 3d has the sole power to vote or direct the voting of the shares owned directly by the funds, which power resides with the funds’ Boards of Trustees. Pyramis Global Advisors Trust Company, an indirect wholly-owned subsidiary of FMR LLC and a bank as defined in Section 3(a)(6) of the Securities Exchange Act of 1934, is the beneficial owner of 957 shares of the company’s common stock outstanding as a result of serving as investment manager of institutional accounts owning such shares. |
| (3) | This information is as of February 5, 2012, and is based solely on a Schedule 13D/A filed jointly by Crescendo Partners II, L.P., Series Z; Crescendo Investments II, LLC; Crescendo Partners III, L.P.; Crescendo Investments III, LLC; Eric Rosenfeld; Arnaud Ajdler; and Gregory Monahan on February 10, 2012. As reported in such filing, Eric Rosenfeld has sole voting power and sole dispositive power with respect to 2,155,798 shares. |
| (4) | This information is as of December 31, 2011, and is based solely on a Schedule 13G/A filed by Dimensional Fund Advisors LP on February 14, 2012. As reported in such filing, Dimensional Fund Advisors LP has sole voting power with respect to 1,724,897 shares and sole dispositive power with respect to 1,764,038 shares. |
| (5) | This information is as of December 31, 2011, and is based solely on a Schedule 13G/A filed by BlackRock, Inc. on February 10, 2012. As reported in such filing, BlackRock, Inc. has sole voting power and sole dispositive power with respect to 1,616,708 shares. |
| (6) | This information is as of December 31, 2011 and is based solely on a Schedule 13G filed jointly by Ameriprise Financial, Inc. (“AFI”) and Columbia Management Investment Advisers, LLC (“CMIA”) on February 14, 2012. As reported in such filing, Ameriprise Financial, Inc. has shared voting power and shared dispositive power with respect to 756,017 shares and 1,290,799 shares, respectively. AFI, as the parent company of CMIA, may be deemed to beneficially own the share reported by CMIA. Accordingly, the shares reported by AFI include those shares separately reported by CMIA. |
| (7) | This information is as of December 31, 2011, and is based solely on a Schedule 13G filed by Royce & Associates, LLC on January 19, 2012. As reported in such filing, Royce & Associates, LLC has sole voting power and sole dispositive power with respect to 1,124,134 shares. |
100
Table of Contents
The following table contains, as of February 20, 2012, certain information concerning: (i) the current directors of the Company (ii) our Named Executive Officers, as set forth below under Compensation Discussion and Analysis; and (iii) the current directors and executive officers as a group.
| Name |
Age | Director Since |
Position |
Shares of Common Stock Beneficially Owned on February 20, 2012(1) |
Percent of Class |
|||||||||||
| Philip J. Hickey, Jr. |
57 | 2009 | Director, Chairman of the Board | 117,227 | * | |||||||||||
| Arnaud Ajdler |
36 | 2008 | Director | 48,626 | * | |||||||||||
| William F. Andrews |
80 | 2004 | Director | 55,047 | * | |||||||||||
| Douglas Benham |
55 | 2008 | Director | 75,226 | * | |||||||||||
| Gregory Monahan |
38 | 2008 | Director | 36,976 | * | |||||||||||
| Dale W. Polley |
62 | 2001 | Director | 64,922 | * | |||||||||||
| Richard Reiss, Jr. |
67 | 1983 | Director | 152,422 | * | |||||||||||
| H. Steve Tidwell |
69 | 1988 | Director | 113,472 | * | |||||||||||
| Robert J. Walker |
71 | 2000 | Director | 97,422 | * | |||||||||||
| Shirley A. Zeitlin |
77 | 1996 | Director | 74,672 | * | |||||||||||
| David W. Head |
55 | 2010 | Director, President and Chief Executive Officer | 40,000 | * | |||||||||||
| R. Jeffrey Williams |
45 | — | Chief Financial Officer and Treasurer Principal Accounting Officer and Assistant Secretary |
52,185 | * | |||||||||||
| Marc A. Buehler |
42 | — | Concept President – O’Charley’s | — | * | |||||||||||
| John R. Grady |
59 | — | Concept President – Ninety Nine Restaurants | 191,321 | * | |||||||||||
| Alfred L. Thimm, Jr. |
52 | — | Concept President – Stoney River Legendary Steaks | — | * | |||||||||||
| Wilson L. Craft |
58 | — | Former Concept President – O’Charley’s | — | * | |||||||||||
| All current directors and executive officers as a group (19 persons) |
1,325,092 | 5.9 | % | |||||||||||||
| * | less than one percent |
| (1) | Includes the following shares that the named individuals are entitled to acquire within 60 days of the date hereof upon the exercise of options: John R. Grady — 149,000 shares; Dale W. Polley — 5,000 shares; Richard Reiss, Jr. — 10,000 shares; H. Steve Tidwell — 10,000 shares; Robert J. Walker — 10,000 shares; Shirley A. Zeitlin — 10,000 shares; and all current directors and executive officers as a group (19 persons) — 370,260 shares. The shares described in this note are deemed to be outstanding for the purpose of computing the percentage of outstanding common stock owned by such persons individually and by the group, but are not deemed to be outstanding for the purpose of computing the percentage ownership of any other person. |
101
Table of Contents
Equity Compensation Plans
The table below sets forth the following information as of December 25, 2011 with respect to the compensation plans (including individual compensation arrangements) under which the Company’s equity securities are authorized for issuance, aggregated by (i) all compensation plans previously approved by the Company’s security holders and (ii) all compensation plans not previously approved by the Company’s security holders:
| • | the number of securities to be issued upon the exercise of outstanding options; |
| • | the weighted-average exercise price of the outstanding options; and |
| • | the number of securities remaining available for future issuance under the plans. |
In addition to options, warrants and rights, the company’s stock incentive plan allows awards to be made in the form of restricted stock or other forms of equity-based compensation. Shares of restricted stock previously issued by the company are not reflected in the table below.
All of the company’s stock compensation plans have been approved by the Company’s shareholders.
| Plan Category |
Number of securities to be issued upon exercise of outstanding options, warrants and rights |
Weighted average exercise price of outstanding options, warrants and rights |
Number of securities remaining available for future issuance |
|||||||||
| Equity compensation plans approved by security holders |
1,387,332 | $ | 11.93 | 1,089,103 | ||||||||
| Equity compensation plans not approved by security holders |
220,000 | $ | 6.15 | — | ||||||||
|
|
|
|
|
|
|
|||||||
| Total |
1,607,332 | $ | 11.14 | 1,089,103 | ||||||||
| Item 13. | Certain Relationships and Related Transactions, and Director Independence. |
CERTAIN TRANSACTIONS
Since the beginning of the last fiscal year, we are aware of no related party transactions between us and any of our directors, executive officers, 5% shareholders or their family members that require disclosure under Item 404 of Regulation S-K under the Securities Exchange Act of 1934.
We have adopted a written related party transaction policy, administered by our Audit Committee, that requires the Audit Committee to review and either ratify, approve or disapprove all “Interested Transactions,” subject to certain exceptions for specified “pre-approved transactions” not believed to create a material interest with respect to a “Related Party.” “Interested Transactions” are generally defined to include any transaction, arrangement or relationship or series of similar transactions, arrangements or relationships (including any indebtedness or guarantee of indebtedness) in which:
| • | the aggregate amount involved exceeded, or will or may be expected to exceed, $120,000 in any calendar year; |
| • | the Company was, is or will be a participant; and |
| • | any Related Party had, has or will have a direct or material indirect interest. |
For purposes of the policy, a “Related Party” is any:
| • | person who is or was (since the beginning of the last fiscal year for which the Company has filed a Form 10-K and proxy statement, even if they do not presently serve in that role) an executive officer, director or nominee for election as a director; |
| • | greater than 5% beneficial owner of the Company’s common stock, other than entities that hold 5% or more and do not participate on the Board or receive any other rights that would indicate participation in the operations or management of the Company’s business; |
102
Table of Contents
| • | immediate family member of any of the foregoing; or |
| • | firm, corporation or other entity in which any of the foregoing persons is employed or is a general partner, managing member or principal or in a similar position or in which such person has a 10% or greater beneficial ownership interest. |
In determining whether to approve or ratify an Interested Transaction under the policy, the Audit Committee is to consider all relevant information and facts available to it regarding the Interested Transaction and take into account factors such as the Related Party’s relationship to the Company and interest (direct or indirect) in the transaction, the terms of the transaction and the benefits to the Company of the proposed transaction. No director is to participate in the approval of an Interested Transaction for which he or she is a Related Party or otherwise has a direct or indirect interest.
In addition, the Audit Committee is to review and assess ongoing Interested Transactions, if any, on at least an annual basis to determine whether any such transactions remain appropriate or should be modified or terminated.
Director Independence
The Board has determined that each of the following directors is an “independent director” within the meaning of Marketplace Rule 5605(a)(2) of the NASDAQ Stock Market LLC:
| Arnaud Ajdler | Philip J. Hickey, Jr. | H. Steve Tidwell | ||
| William F. Andrews | Gregory Monahan | Robert J. Walker | ||
| Douglas Benham | Dale W. Polley | Shirley A. Zeitlin | ||
| Richard Reiss, Jr. |
| Item 14. | Principal Accounting Fees and Services. |
The Audit Committee of the Board of Directors of the Company has selected KPMG LLP to serve as the independent registered public accounting firm for the current fiscal year. Such firm has served as the company’s independent registered public accounting firm since August 1991.
Fees Billed to the company by KPMG LLP during Fiscal 2011 and Fiscal 2010
On behalf of the Company, the Audit Committee retained KPMG LLP to audit the Company’s consolidated financial statements and its internal control over financial reporting for fiscal year 2011. In connection with the audits of the Company’s consolidated financial statements and its internal control over financial reporting for fiscal years 2011 and 2010, the audit committee entered into an engagement letter with KPMG LLP which set forth the terms by which KPMG LLP performed its audit services. That agreement is subject to alternative dispute resolution procedures, which the company has agreed are the sole methodologies for the resolution of any disputes, and contains an exclusion of punitive damages.
Audit Fees. Audit fees include fees paid by the Company to KPMG LLP in connection with its annual audit of the Company’s consolidated financial statements and internal control over financial reporting and review of the Company’s interim financial statements. Audit fees also include fees for services performed by KPMG LLP that are closely related to the audit and in many cases could only be provided by the Company’s independent registered public accounting firm. Such services include comfort letters, consents and review of documents filed with the SEC. The aggregate fees billed to the Company by KPMG LLP for audit services rendered to the Company and its subsidiaries for the fiscal years ended December 25, 2011 and December 26, 2010 were $558,000 and $559,818, respectively.
Audit-Related Fees. Audit-related fees normally include due diligence and audit services related to mergers and acquisitions, employee benefit plan audits and certain attest services. KPMG LLP did not bill the Company any fees for audit-related services rendered to the Company and its subsidiaries for the fiscal years ended December 25, 2011 and December 26, 2010.
Tax Fees. KPMG LLP did not bill the Company any fees for tax-related services rendered to the Company and its subsidiaries for the fiscal years ended December 25, 2011 and December 26, 2010.
All Other Fees. KPMG LLP did not bill the Company any fees for other services rendered to the Company and its subsidiaries for the fiscal years ended December 25, 2011 and December 26, 2010.
103
Table of Contents
The Audit Committee considered these fees and concluded that the performance of these services was consistent with KPMG LLP’s independence.
The Audit Committee also has adopted a formal policy concerning approval of audit and non-audit services to be provided by the independent registered public accounting firm to the Company. The policy requires that all services that KPMG LLP, the Company’s independent registered public accounting firm, may provide to the Company, including audit services and permitted audit-related and non-audit services, be pre-approved by the Audit Committee. The Audit Committee approved, in accordance with the policy described herein, all audit and non-audit services provided by KPMG LLP during the year ended December 25, 2011.
104
Table of Contents
| Item 15. | Exhibits, Financial Statement Schedules. |
| (a) | 1. | Financial Statements: See Item 8 |
| 2. | Financial Statement Schedules: See Item 8 |
| 3. | Management Contracts and Compensatory Plans and Arrangements: See Item 8 |
4. Exhibits:
| Exhibit Number |
Description | |
| 2.1 | Agreement and Plan of Merger, dated as of February 5, 2012, by and among Fidelity National Financial, Inc. Fred Merger Sub Inc. and O’Charley’s Inc. (Pursuant to Item 601(b)(2) of Regulation S-K, the schedules and exhibits to this agreement are omitted, but will be provided supplementally to the Commission upon request.) (incorporated herein by reference to Exhibit 2.1 of the Company’s Current Report on Form 8-K filed with the Commission on February 6, 2012) (File No. 0-18629) | |
| 2.2 | Tender and Support Agreement, dated as of February 5, 2012, by and among Fidelity National Financial, Inc., Fred Merger Sub Inc. and each of the shareholders of O’Charley’s Inc. (Pursuant to Item 601(b)(2) of Regulation S-K, the schedules and exhibits to this agreement are omitted, but will be provided supplementally to the Commission upon request.) (incorporated herein by reference to Exhibit 2.2 of the Company’s Current Report on Form 8-K filed with the Commission on February 6, 2012) (File No. 0-18629) | |
| 2.3 | Asset Purchase Agreement by and among O’Charley’s Inc., 99 Boston, Inc., 99 Boston of Vermont, Inc., Doe Family II LLC, and each of William A. Doe, III, Dana G. Doe and Charles F. Doe, Jr. (Pursuant to Item 601 (b)(2) of Regulation S-K, the schedules and exhibits to this agreement are omitted, but will be provided supplementally to the Commission upon request.) (incorporated herein by reference to Exhibit 2.1 of the Company’s Current Report on Form 8-K filed with the Commission on November 1, 2002) (File No. 0-18629) | |
| 2.4 | Merger Agreement by and among O’Charley’s Inc., Volunteer Acquisition Corporation, 99 West, Inc., and each of William A. Doe, III, Dana G. Doe and Charles F. Doe, Jr. (Pursuant to Item 601(b)(2) of Regulation S-K, the schedules and exhibits to this agreement are omitted, but will be provided supplementally to the Commission upon request.) (incorporated herein by reference to Exhibit 2.2 of the Company’s Current Report on Form 8-K filed with the Commission on November 1, 2002) (File No. 0-18629) | |
| 3.1 | Restated Charter of O’Charley’s Inc. (restated electronically for Commission filing purposes only) (incorporated by reference to Exhibit 3.1 of the Company’s Current Report on Form 8-K filed with the Commission on May 13, 2009) (File No. 0-18629) | |
| 3.2 | Amended and Restated Bylaws of O’Charley’s Inc. (incorporated by reference to Exhibit 3.2 of the Company’s Current Report on Form 8-K filed with the Commission on May 13, 2009) (File No. 0-18629) | |
| 4.1 | Form of Certificate for the Common Stock (incorporated by reference to Exhibit 4.1 of the Company’s Registration Statement on Form S-1, Registration No. 33-35170) | |
| 10.1 | CHUX Ownership Plan (incorporated by reference to Appendix B to the Company’s Definitive Proxy Statement for the 2009 Annual Meeting of Shareholders filed with the Commission on April 8, 2009) (File No. 0-18629) | |
| 10.2 | Amendment to CHUX Ownership Plan (incorporated by reference to Exhibit 10.2 of the Company’s Annual Report on Form 10-K for the year ended December 27, 2009) (File No. 0-18629) | |
105
Table of Contents
| 10.3* | O’Charley’s 2000 Stock Incentive Plan (incorporated by reference to Exhibit 10.1 of the Company’s Quarterly Report on Form 10-Q for the quarter ended July 9, 2000) (File No. 0-18629) | |
| 10.4* | O’Charley’s Inc. 2008 Equity and Incentive Plan (incorporated by reference to Exhibit 10.1 of the Company’s Current Report on Form 8-K filed with the Commission on May 28, 2008) (File No. 0-18629) | |
| 10.5 | Master Lease, dated December 4, 2001, by and between Double 9 Property I LLC and Doe Family II LLC (incorporated by reference to Exhibit 10.33 of the Company’s Annual Report on Form 10-K for the year ended December 29, 2002) (File No. 0-18629) | |
| 10.6 | Assignment and Assumption of Lease and Acknowledgement of Master Lease Assignment and Subordination, Nondisturbance and Attornment Agreement, dated January 27, 2003, by and among Doe Family II LLC, 99 West, Inc., Double 9 Property I LLC, 99 Remainder I LLC and GE Capital Franchise Finance Corporation (incorporated by reference to Exhibit 10.34 of the Company’s Annual Report on Form 10-K for the year ended December 29, 2002) (File No. 0-18629) | |
| 10.7 | Master Lease, dated December 4, 2001, by and between Double 9 Property II LLC and Doe Family II LLC (incorporated by reference to Exhibit 10.35 of the Company’s Annual Report on Form 10-K for the year ended December 29, 2002) (File No. 0-18629) | |
| 10.8 | First Amendment to Master Lease, dated February 1, 2002, by and between Double 9 Property II LLC and Doe Family II LLC (incorporated by reference to Exhibit 10.36 of the Company’s Annual Report on Form 10-K for the year ended December 29, 2002) (File No. 0-18629) | |
| 10.9 | Assignment and Assumption of Lease and Acknowledgement of Master Lease Assignment and Subordination, Nondisturbance and Attornment Agreement, dated January 27, 2003, by and among Doe Family II LLC, 99 West, Inc., Double 9 Property II LLC, 99 Remainder II LLC and GE Capital Franchise Finance Corporation (incorporated by reference to Exhibit 10.37 of the Company’s Annual Report on Form 10-K for the year ended December 29, 2002) (File No. 0-18629) | |
| 10.10 | Master Lease, dated December 4, 2001, by and between Double 9 Property III LLC and Doe Family II LLC (incorporated by reference to Exhibit 10.38 of the Company’s Annual Report on Form 10-K for the year ended December 29, 2002) (File No. 0-18629) | |
| 10.11 | Assignment and Assumption of Lease and Acknowledgement of Master Lease Assignment and Subordination, Nondisturbance and Attornment Agreement, dated January 27, 2003, by and among Doe Family II LLC, 99 West, Inc., Double 9 Property III LLC, 99 Remainder III LLC and GE Capital Franchise Finance Corporation (incorporated by reference to Exhibit 10.39 of the Company’s Annual Report on Form 10-K for the year ended December 29, 2002) (File No. 0-18629) | |
| 10.12 | Master Lease, dated December 4, 2001, by and between Double 9 Property IV LLC and Doe Family II LLC (incorporated by reference to Exhibit 10.40 of the Company’s Annual Report on Form 10-K for the year ended December 29, 2002) (File No. 0-18629) | |
| 10.13 | First Amendment to Master Lease, dated February 1, 2002, by and between Double 9 Property IV LLC and Doe Family II LLC (incorporated by reference to Exhibit 10.41 of the Company’s Annual Report on Form 10-K for the year ended December 29, 2002) (File No. 0-18629) | |
| 10.14 | Assignment and Assumption of Lease and Acknowledgement of Master Lease Assignment and Subordination, Nondisturbance and Attornment Agreement, dated January 27, 2003, by and among Doe Family II LLC, 99 West, Inc., Double 9 Property IV LLC, 99 Remainder IV LLC and GE Capital Franchise Finance Corporation (incorporated by reference to Exhibit 10.42 of the Company’s Annual Report on Form 10-K for the year ended December 29, 2002) (File No. 0-18629) | |
106
Table of Contents
| 10.15 | Fourth Amended and Restated Credit Agreement, dated as of October 17, 2011, by and among O’Charley’s Inc., as Borrower, the Lenders referred to therein, Wells Fargo Bank, National Association, as Administrative Agent, Bank of America, N.A., as Syndication Agent, Regions Bank, as Documentation Agent, Wells Fargo Securities, LLC, Regions Bank and Merrill Lynch, Pierce, Fenner & Smith Incorporated, as Joint Lead Arrangers and Joint Book Managers (incorporated by reference to Exhibit 10.3 of the Company’s Current Report on Form 8-K filed with the Commission on October 18, 2011) (File No. 0-18629) | |
| 10.16 | Purchase and Sale Agreement, dated as of October 17, 2011, by and among STORE Capital Acquisitions, LLC, O’Charley’s Inc., O’Charley’s Finance Company, Inc. and O’Charley’s Restaurant Properties, LLC (incorporated by reference to Exhibit 10.1 of the Company’s Current Report on Form 8-K filed with the Commission on October 18, 2011) (File No. 0-18629) | |
| 10.17 | Form of Master Lease Agreement, dated as of October 17, 2011 (incorporated by reference to Exhibit 10.2 of the Company’s Current Report on Form 8-K filed with the Commission on October 18, 2011) (File No. 0-18629) | |
| 10.18 | Form of Lease Agreement by and between CNL Funding 2001-A, LP, as landlord, and O’Charley’s Inc., as tenant. In accordance with Rule 12b-31 under the Exchange Act, copies of other lease agreements, which are substantially identical to Exhibit 10.1 in all material respects, except as to the landlord, the tenant, the property involved and the rent due thereunder, are omitted. (incorporated by reference to Exhibit 10.39 of the Company’s Registration Statement on Form S-4, Registration No. 333-112429-03) | |
| 10.19* | Form of Incentive Stock Option Agreement (incorporated by reference to Exhibit 10.1 of the Company’s Quarterly Report on Form 10-Q for the quarter ended October 3, 2004) (File No. 0-18629) | |
| 10.20* | Form of Non-Qualified Stock Option Agreement (incorporated by reference to Exhibit 10.2 of the Company’s Quarterly Report on Form 10-Q for the quarter ended October 3, 2004) (File No. 0-18629) | |
| 10.21* | Form of Restricted Stock Agreement for Employees (Time-Based Vesting) (incorporated by reference to Exhibit 10.3 of the Company’s Quarterly Report on Form 10-Q for the quarter ended October 3, 2004) (File No. 0-18629) | |
| 10.22* | Form of Restricted Stock Agreement for Employees (Performance-Based Vesting) (incorporated by reference to Exhibit 10.4 of the Company’s Quarterly Report on Form 10-Q for the quarter ended October 3, 2004) (File No. 0-18629) | |
| 10.23* | Form of Restricted Stock Agreement for Employees (Performance-Based Vesting) (incorporated by reference to Exhibit 10.37 of the Company’s Annual Report on Form 10-K for the year ended December 30, 2007) (File No. 0-18629) | |
| 10.24* | Form of Restricted Stock Agreement for Employees (Time-Based Vesting) (incorporated by reference to Exhibit 10.38 of the Company’s Annual Report on Form 10-K for the year ended December 30, 2007) (File No. 0-18629) | |
| 10.25* | Form of Restricted Stock Agreement for Directors (incorporated by reference to Exhibit 10.5 of the Company’s Quarterly Report on Form 10-Q for the quarter ended October 3, 2004) (File No. 0-18629) | |
| 10.26* | Form of Non-Qualified Stock Option (incorporated by reference to Exhibit 10.2 of the Company’s Quarterly Report on Form 10-Q for the quarter ended April 19, 2009) (File No. 0-18629) | |
| 10.27 | Lease, dated as of December 17, 2004, between Bellingham Mechanic, LLC and 99 Commissary, LLC and related Guaranty. (incorporated by reference to Exhibit 10.63 of the Company’s Annual Report on Form 10-K for the year ended December 26, 2004) (File No. 0-18629) | |
| 10.28* | Summary of Director and Executive Officer Compensation | |
107
Table of Contents
| 10.29* | O’Charley’s Inc. Deferred Compensation Plan (restated) (incorporated by reference to Exhibit 10.28 of the Company’s Annual Report on Form 10-K for the year ended December 27, 2009) (File No. 0-18629) | |
| 10.30* | First Amendment to the O’Charley’s Inc. Deferred Compensation Plan (incorporated by reference to Exhibit 10.29 of the Company’s Annual Report on Form 10-K for the year ended December 26, 2010) (File No. 0-18629) | |
| 10.31* | Executive Employment Agreement, dated July 30, 2010, by and between O’Charley’s Inc. and David Head (incorporated by reference to Exhibit 10.2 of the Company’s Quarterly Report on Form 10-Q for the quarter ended July 11, 2010) (File No. 0-18629) | |
| 10.32* | Amended and Restated Executive Employment Agreement, dated August 10, 2011, between O’Charley’s Inc. and R. Jeffrey Williams (incorporated by reference to Exhibit 10.1 of the Company’s Current Report on Form 8-K filed with the Commission on August 11, 2011) (File No. 0-18629) | |
| 10.33* | Form of Executive Employment Agreement, dated November 6, 2007, between O’Charley’s Inc. and each of John R. Grady and Lawrence D. Taylor (incorporated by reference to Exhibit 10.1 of the Company’s Current Report on Form 8-K filed with the Commission on November 9, 2007) (File No. 0-18629) | |
| 10.34* | Form of First Amendment to O’Charley’s Inc. Executive Employment Agreement, dated January 12, 2009 (incorporated by reference to Exhibit 10.1 of the Company’s Current Report on Form 8-K filed with the Commission on January 16, 2009) (File No. 0-18629) | |
| 10.35* | Form of Second Amendment to O’Charley’s Inc. Executive Employment Agreement, dated March 11, 2009 (incorporated by reference to Exhibit 10.55 of the Company’s Annual Report on Form 10-K for the fiscal year ended December 28, 2008) (File No. 0-18629) | |
| 10.36* | Executive Employment Agreement, dated as of September 14, 2011, between O’Charley’s Inc. and Marc A. Buehler | |
| 10.37* | Severance Agreement and General Release, dated as of August 22, 2011, between Wilson Craft and O’Charley’s Inc. (incorporated by reference to Exhibit 10.1 of the Company’s Current Report on Form 8-K filed with the Commission on August 22, 2011) (File No. 0-18629) | |
| 10.38* | General Release Agreement, dated June 17, 2010, by and between Jeffrey D. Warne and O’Charley’s Inc. (incorporated by reference to Exhibit 10.1 of the Company’s Quarterly Report on Form 10-Q for the quarter ended July 11, 2010) (File No. 0-18629) | |
| 21 | Subsidiaries of the Company | |
| 23 | Consent of KPMG LLP | |
| 31.1 | Certification of David W. Head, Chief Executive Officer of O’Charley’s Inc., pursuant to Section 302 of the Sarbanes-Oxley Act of 2002 | |
| 31.2 | Certification of R. Jeffrey Williams, Chief Financial Officer of O’Charley’s Inc., pursuant to Section 302 of the Sarbanes-Oxley Act of 2002 | |
| 32.1 | Certification of David W. Head, Chief Executive Officer of O’Charley’s Inc., pursuant to 18 U.S.C. Section 1350, as adopted pursuant to Section 906 of the Sarbanes-Oxley Act of 2002 | |
108
Table of Contents
| 32.2 | Certification of R. Jeffrey Williams, Chief Financial Officer of O’Charley’s Inc., pursuant to 18 U.S.C. Section 1350, as adopted pursuant to Section 906 of the Sarbanes-Oxley Act of 2002 | |
| 101.INS | XBRL Instance Document | |
| 101.SCH | XBRL Schema Document | |
| 101.CAL | XBRL Calculation Linkbase Document | |
| 101.DEF | XBRL Definition Linkbase Document | |
| 101.LAB | XBRL Label Linkbase Document | |
| 101.PRE | XBRL Presentation Linkbase Document | |
| * | Management contract or compensatory plan or arrangement |
109
Table of Contents
Pursuant to the requirements of Section 13 or 15(d) of the Securities Exchange Act of 1934, the registrant has duly caused this report to be signed on its behalf by the undersigned, thereunto duly authorized.
| O’CHARLEY’S INC. | ||||
| Date: February 29, 2012 | By: | /s/ David W. Head | ||
| David W. Head | ||||
| Chief Executive Officer and President | ||||
Pursuant to the requirements of the Securities Exchange Act of 1934, this report has been signed below by the following persons on behalf of the registrant and in the capacities and on the dates indicated.
| Signature | Title |
Date | ||
| /s/ DAVID W. HEAD |
Director, Chief Executive Officer and President | February 29, 2012 | ||
| David W. Head | (Principal Executive Officer) | |||
| /s/ R. JEFFREY WILLIAMS |
Chief Financial Officer and Treasurer | February 29, 2012 | ||
| R. Jeffrey Williams | (Principal Financial and Accounting Officer) | |||
| /s/ PHILIP J. HICKEY, JR |
Chairman of the Board | February 29, 2012 | ||
| Philip J. Hickey, Jr. | ||||
| /s/ ARNAUD AJDLER |
Director | February 29, 2012 | ||
| Arnaud Ajdler | ||||
| /s/ WILLIAM F. ANDREWS |
Director | February 29, 2012 | ||
| William F. Andrews | ||||
| /s/ DOUGLAS BENHAM |
Director | February 29, 2012 | ||
| Douglas Benham | ||||
| /s/ GREGORY MONAHAN |
Director | February 29, 2012 | ||
| Gregory Monahan | ||||
| /s/ DALE W. POLLEY |
Director | February 29, 2012 | ||
| Dale W. Polley | ||||
| /s/ RICHARD REISS, JR. |
Director | February 29, 2012 | ||
| Richard Reiss, Jr. | ||||
| /s/ H. STEVE TIDWELL |
Director | February 29, 2012 | ||
| H. Steve Tidwell | ||||
| /s/ ROBERT J. WALKER |
Director | February 29, 2012 | ||
| Robert J. Walker | ||||
| /s/ SHIRLEY A. ZEITLIN |
Director | February 29, 2012 | ||
| Shirley A. Zeitlin | ||||
110