Attached files
| file | filename |
|---|---|
| 8-K - CURRENT REPORT - SCIENTIFIC GAMES CORP | v304092_8k.htm |
| EX-99.1 - PRESS RELEASE OF SCIENTIFIC GAMES CORPORATION, DATED FEBRUARY 28, 2012. - SCIENTIFIC GAMES CORP | v304092_ex99-1.htm |
Exhibit 99.2

Scientific Games Fourth Quarter 2011 Earnings Presentation

Safe Harbor Statement 2 Throughout this presentation we make "forward - looking statements" within the meaning of the U.S. Private Securities Litigation Reform Act of 1995. Forward - looking statements describe future expectations, plans, results or strategies and can often be identified by the use of terminology such as "may," "will," "estimate," "intend," "continue," "believe," "expect," "anticipate," "could," "potential," "opportunity," or similar terminology. These statements are based upon management's current expectations, assumptions and estimates and are not guarantees of future results or performance. Actual results may differ materially from those contemplated in these statements due to a variety of risks and uncertainties and other factors, including, among other things: competition; material adverse changes in economic and industry conditions; technological change; retention and renewal of existing contracts and entry into new or revised contracts; availability and adequacy of cas h flows to satisfy obligations and indebtedness or future needs; protection of intellectual property; security and integrity of software and systems; laws and government regulation, including those relating to gaming licenses, permits and operations; inability to identify, complete and integrate future acquisitions; inability to benefit from, and risks associated with, stra teg ic equity investments and relationships; failure of Northstar to meet the net income targets or otherwise realize the anticipated benefits under its private management agreement with the Illinois Lottery; seasonality; inability to identify and capitalize on trends and changes in the lottery and gaming industries, including the potential expansion of regulated gaming via the internet; inability to enhance and develop successful gaming concepts; dependence on suppliers and manufacturers; liability for product defects; fluctuations in foreign currency exchange rates and other factors associated with international operatio ns; influence of certain stockholders; dependence on key personnel; failure to perform on contracts; resolution of pending or future litigation; labor matters; and stock price volatility. Additional information regarding risks and uncertainties and ot her factors that could cause actual results to differ materially from those contemplated in forward - looking statements is included from time to time in the Company's filings with the Securities and Exchange Commission, including under the heading "Risk Factors" in our periodic reports. Forward - looking statements speak only as of the date they are made and, except for the Company's ongoing obligations under the U.S. federal securities laws, the Company undertakes no obligation to publicly update any forward - looking statements whether as a result of new information, future events or otherwise. The date of this presentation is as of February 28, 2012, and the information provided herein is presented through the dates indicated on the applicable slides. Forward - looking statements speak only as of the date they are made and, except for Scientific Games’ ongoing obligations under the U.S. federal securities laws, Scientific Games undertakes no obligation to publicly update any forward - looking statements whether as a result of new information, future events or otherwise. Note Regarding Presentation of Non - GAAP Financial Measures: This presentation and the related discussion include certain financial measures that were not prepared in accordance with U.S . generally accepted accounting principles (GAAP). Additional information regarding these non - GAAP financial measures, including reconciliations to the most directly comparable U.S. GAAP financial measures, can be found in this presentation or in Scientific Games’ press release dated February 28, 2012. This press release is available on Scientific Games’ website at www.scientificgames.com in the “Investor Information – Press Releases” section.

2011 Key Performance Indicators (1) Represents the average amount bet less player winnings, excluding taxes and other fees, per installed Global Draw machine per da y. (2) Represents the amount bet less player winnings, excluding taxes and other fees. 3 U.S. Lottery Customers’ Retail Sales Y/Y Δ China Sports Lottery Instant Ticket Retail Sales Y/Y Δ Italy Instant Ticket Retail Sales Y/Y Δ Global Draw U.K. Betting Shop Performance Y/Y Δ 6.6% 4.9% 5.9% 8.3% 6.7% 13.9% 58.2% 65.4% 71.0% 52.6% Q1'11 Q2'11 Q3'11 Q4'11 FY'11 Global Draw U.K. Gross Win/Machine/Day(1) Global Draw U.K. Gross Win(2) 16,863 19,901 20,048 20,319 Terminals 4.3% 6.5% 5.6% 8.5% 6.5% 6.4% (8.2%) 0.5% 2.7% 0.1% Q1'11 Q2'11 Q3'11 Q4'11 FY'11 Instant Tickets Lottery Systems 37.7% 13.9% 24.1% 15.7% 21.4% Q1'11 Q2'11 Q3'11 Q4'11 FY'11 9.7% 12.6% 10.8% 0.0% 8.4% Q1'11 Q2'11 Q3'11 Q4'11 FY'11

Summary of Q4 Results 4 (1) Attributable EBITDA, as used herein, is based on the definition of "consolidated EBITDA" in our credit agreement (summarized in our February 28, 2012 press release), except that attributable EBITDA as used herein includes our share of the EBITDA of all of our equity investments (whereas "consolidated EBITDA" for purposes of the credit agreement gen erally includes our share of the EBITDA of our Italian joint venture but only the income of our other equity investments to the extent it has been distributed to us). Attributable EBITDA is a non - GAAP financial measure that is presented herein as a supplemental disclosure and is reconciled to net income (loss) in our February 28, 2012 press release. (2) Free cash flow, as included herein, represents net cash provided by operating activities less total capital expenditures (whi ch includes lottery and gaming systems expenditures and other intangible assets and software expenditures). Free cash flow is a non - GAAP financial measure that is presented herein as a supplemental disclosure and is reco nciled to net cash provided by operating activities in our February 28, 2012 press release . Fourth Quarter 2011 2010 $ Δ % Δ Reported Results Revenue 239.1$ 212.1$ 27.0$ 12.7% Printed Products 1.0 0.8% Lottery Systems 6.3 10.0% Gaming 19.7 79.9% Operating Income / (Loss) 19.2$ (11.0)$ 30.3$ NM Printed Products 4.4 15.8% Lottery Systems 18.7 NM Gaming 13.4 NM Unallocated Corporate Expense (6.3) (30.3%) Attributable EBITDA (1) 80.3$ 77.7$ 2.6$ 3.4% Total Capital Expenditures (2) 23.5$ 30.2$ (6.7)$ NM Free Cash Flow (2) (5.1) (2.9) (2.2) NM

Printed Products ($ in millions) 5 ▪ U.S. instant ticket sales continued to improve as a result of strong retail sales and, in particular, from sales to the Illinois Lottery ▪ Instant ticket sales to international customers were negatively impacted primarily due to lower volume of tickets sold to Italy ▪ Increase in operating income driven by higher and more profitable revenue mix and decrease in SG&A primarily due to the absence of $2.3 million earn - out payment in Q4’10 related to acquisition completed in 2004 Revenue Q4'10 Revenue $124.2 Instant Ticket Sales to U.S. Customers 3.8 Instant Ticket Sales to International Customers (3.6) Product Sales & Other 0.9 Q4'11 Revenue $125.2 Operating Income Q4'10 Operating Income $27.8 Impact of Change in Revenue 2.3 +/- Selling, General & Administrative Expense 1.9 +/- Stock-Based Compensation 0.0 +/- Depreciation & Amortization 0.2 Q4'11 Operating Income $32.2

Lottery Systems ($ in millions) 6 ▪ U.S. service revenue benefitted from increased instant ticket validation revenue and higher bloc lotto jackpots ▪ Sales revenue growth attributable to international hardware and software sales ▪ Service revenue profitability was negatively impacted by a hardware refurbishment program and an overall less profitable revenue mix ▪ Increase in SG&A primarily related to increased headcount and expenses to support China expansion ▪ Decrease in depreciation and amortization primarily related to the absence of impairment charges Revenue Q4'10 Revenue $63.2 U.S. Service Revenue 3.1 International Sales Revenue 2.6 Other 0.6 Q4'11 Revenue $69.5 Operating Income Q4'10 Operating Income ($7.7) Impact of Change in Revenue 0.4 +/- Selling, General & Administrative Expense (2.1) +/- Stock-Based Compensation (0.2) +/- Depreciation & Amortization 20.7 Q4'11 Operating Income $11.1

Gaming ($ in millions) ▪ Gaming revenue benefitted from a 40% increase in Global Draw and Games Media server - based gaming machines and 8.3% higher gross win per machine per day ▪ Barcrest results positively impacted revenue, but analog AWP sales negatively impacted profitability ▪ Increase in SG&A largely due to the additional overhead expense for Barcrest and an increase in incentive compensation expense ▪ Decline in depreciation and amortization primarily due to the absence of asset write - downs and accelerated depreciation expense 7 (1) Gaming revenue (excluding Racing Business) and Gaming operating income (excluding Racing Business), which exclude the revenue an d operating income, respectively, of the Racing Business that was sold in October 2010, are non - GAAP financial measures that are presented herein as supplemental disclosures and are reconciled to Gaming revenue and o perating income, respectively, in our February 28, 2012 press release. Revenue Revenue (Excl. Racing Business) (1) Q4'10 Revenue $24.7 $23.5 Increase in Server-Based Gaming Terminals & Other 9.4 9.4 Acquisition of Barcrest 11.5 11.5 Sale of Racing Business (1.2) - Q4'11 Revenue $44.4 $44.4 Operating Income Operating Income (Excl. Racing Business) (1) Q4'10 Operating Loss ($10.6) ($10.4) Impact of Change in Revenue 8.9 9.0 +/- Selling, General & Administrative Expense (2.9) (3.3) +/- Stock-Based Compensation 0.2 0.2 +/- Depreciation & Amortization 8.3 8.2 +/- Employee Termination Costs (1.0) (1.0) Q4'11 Operating Income $2.8 $2.8
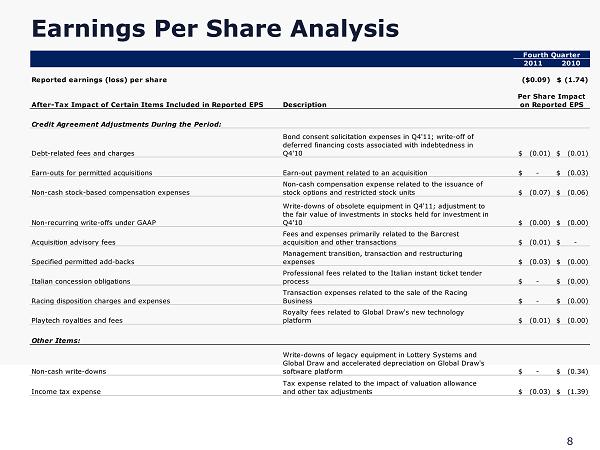
Earnings Per Share Analysis 8 Fourth Quarter 2011 2010 Reported earnings (loss) per share ($0.09) (1.74)$ After-Tax Impact of Certain Items Included in Reported EPS Description Per Share Impact on Reported EPS Credit Agreement Adjustments During the Period: Debt-related fees and charges Bond consent solicitation expenses in Q4'11; write-off of deferred financing costs associated with indebtedness in Q4'10 (0.01)$ (0.01)$ Earn-outs for permitted acquisitions Earn-out payment related to an acquisition -$ (0.03)$ Non-cash stock-based compensation expenses Non-cash compensation expense related to the issuance of stock options and restricted stock units (0.07)$ (0.06)$ Non-recurring write-offs under GAAP Write-downs of obsolete equipment in Q4'11; adjustment to the fair value of investments in stocks held for investment in Q4'10 (0.00)$ (0.00)$ Acquisition advisory fees Fees and expenses primarily related to the Barcrest acquisition and other transactions (0.01)$ -$ Specified permitted add-backs Management transition, transaction and restructuring expenses (0.03)$ (0.00)$ Italian concession obligations Professional fees related to the Italian instant ticket tender process -$ (0.00)$ Racing disposition charges and expenses Transaction expenses related to the sale of the Racing Business -$ (0.00)$ Playtech royalties and fees Royalty fees related to Global Draw's new technology platform (0.01)$ (0.00)$ Other Items: Non-cash write-downs Write-downs of legacy equipment in Lottery Systems and Global Draw and accelerated depreciation on Global Draw's software platform -$ (0.34)$ Income tax expense Tax expense related to the impact of valuation allowance and other tax adjustments (0.03)$ (1.39)$