Attached files
| file | filename |
|---|---|
| 8-K - FORM 8-K - ASHFORD HOSPITALITY TRUST INC | d306845d8k.htm |
 Company Presentation
UBS Conference
February 2012
Exhibit 99.1 |
 Safe Harbor
In
keeping
with
the
SEC’s
“Safe
Harbor”
guidelines,
certain
statements
made
during
this
presentation
could be considered forward-looking and subject to certain risks and
uncertainties that could cause results
to
differ
materially
from
those
projected.
When
we
use
the
words
“will
likely
result,”
“may,”
“anticipate,”
“estimate,”
“should,”
“expect,”
“believe,”
“intend,”
or similar expressions, we intend to
identify forward-looking statements. Such forward-looking
statements include, but are not limited to, our business and
investment strategy, our understanding of our competition, current market trends and
opportunities, projected operating results, and projected capital
expenditures. These forward-looking statements are subject to
known and unknown risks and uncertainties, which could
cause
actual
results
to
differ
materially
from
those
anticipated
including,
without
limitation:
general volatility of the capital markets and the market price of our common
stock; changes in our business or investment strategy; availability,
terms and deployment of capital; availability of qualified personnel;
changes in our industry and the market in which we operate, interest rates or the general
economy, and the degree and nature of our competition. These and other
risk factors are more fully discussed in the Company’s filings
with the Securities and Exchange Commission. EBITDA is defined as net
income before interest, taxes, depreciation and amortization. EBITDA yield is
defined as trailing twelve month EBITDA divided by the purchase price.
EBITDA, FFO, AFFO, CAD and other terms are non-GAAP measures,
reconciliations of which have been provided in prior earnings
releases and filings with the SEC.
This overview is for informational purposes only and is not an offer to
sell, or a solicitation of an offer to buy or sell, any securities of
Ashford Hospitality Trust, Inc. and may not be relied upon in connection
with the purchase or sale of any such security.
2 |
 Agenda
•
Hotel Industry Overview
•
Advantages of REITs
•
Ashford Overview
•
Remington Advantage
•
Asset Management Expertise
•
Most Highly-Aligned Management Team
•
Ashford Outperformance
•
Attractive Dividend
3 |
 Hotel Industry Overview
4
•
Hotel demand is generally driven by the overall economy
Source: Smith Travel Research, U.S. Dept. of
Commerce BEA
-8.0
-6.0
-4.0
-2.0
0.0
2.0
4.0
6.0
8.0
10.0
Hotel Demand
Growth vs
. Real GDP Growth
Real GDP Growth
Hotel Demand Growth |
 Hotel Industry Overview
5
•
Supply growth occurs in cycles and growth above the long-term average
is a significant drag on industry fundamentals
•
We are currently experiencing minimal supply growth, and based on
historical cyclical trends and the lack of development financing, very
low supply growth is expected for the next several years
Source: Smith Travel Research & PWC
-1.0
0.0
1.0
2.0
3.0
4.0
5.0
Supply Growth
Long-term avg
supply growth = 2.1 |
 Hotel Industry Overview
6
Source: Smith Travel Research (non-seasonally
adjusted nominal monthly figures)
•
Revenue per available room (RevPAR) is THE key industry metric,
also calculated as occupancy multiplied by average daily rate (ADR)
•
Real RevPAR is cyclical/mean-reverting, and it appears that it is still
relatively early in the current up-cycle, as Real RevPAR is still
below the long-term average
$52.00
$54.00
$56.00
$58.00
$60.00
$62.00
$64.00
$66.00
$68.00
$70.00
$72.00
$74.00
T-
3 Mo Avg Seasonally-
Adjusted Real RevPAR
Long-term avg real
RevPAR = $65 |
 Hotel Industry Overview
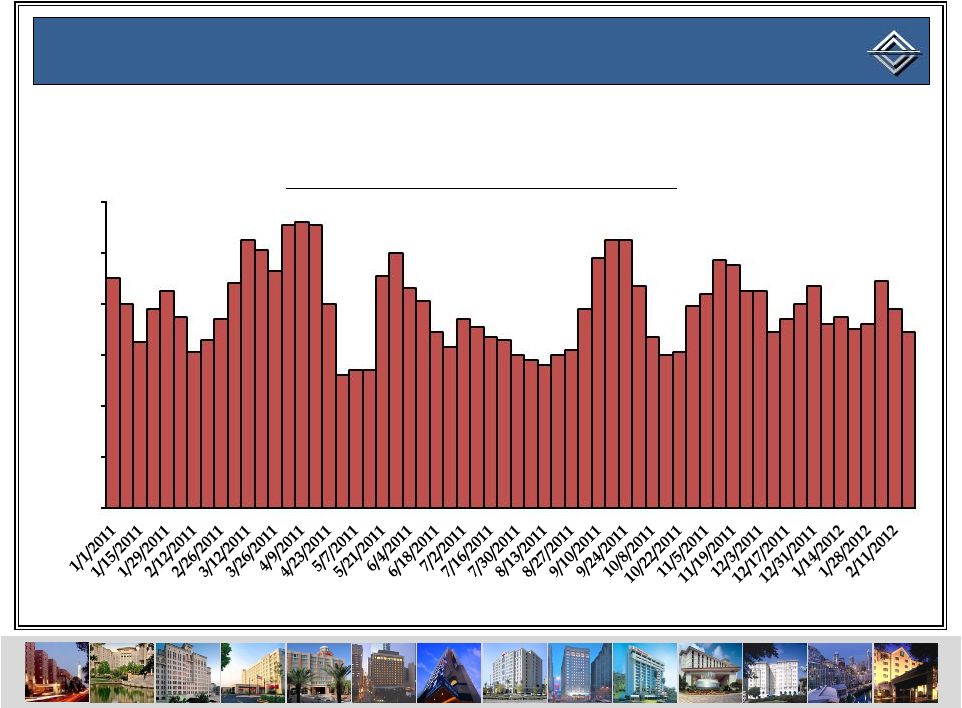
7
Source: Smith Travel Research
•
Despite some of the volatility in the economy here in the U.S. and
abroad, RevPAR growth has remained consistently strong
0.0%
2.0%
4.0%
6.0%
8.0%
10.0%
12.0%
Week Ended
Trailing 28-
Day U.S. RevPAR % Change |
 •
Hotels have historically been a good inflation hedge during periods
of high inflation
Hotel Industry Overview
Hotel Industry Overview
8
Source: Smith Travel Research, PKF & U.S. Dept. of Labor
BLS During periods of high inflation,
ADR growth has met or exceeded
inflation
-15.0%
-10.0%
-5.0%
0.0%
5.0%
10.0%
15.0%
20.0%
ADR vs. CPI Growth
CPI Growth
ADR Growth |
 Advantages of REITs
9
Benefits
Use of
nonrecourse
debt
High-
quality real
estate
retains
value
Not a
financial
asset
Currently
difficult to
develop
Dividend
paying
Inflation
hedge
Hard asset |
 Ashford Highlights
10
Portfolio Statistics*
Total Enterprise Value
$4.1 B
Total Gross Assets
$5.2 B
Peer Comparison
2
nd
Largest (out of 15)
# of Hotels
124
# of Owned Rooms
26,195
# of Property Managers
6
$ ADR
$130.12
$ RevPAR
$93.76
RevPAR Growth %
6.0%
Financial Statistics*
Recent Share Price
$8.80 (2/22/12)
# Fully Diluted Shares
84.3 M
Leverage Ratio
58.8%
Debt Wtd. Avg. Maturity
4.1 Years
Debt Wtd. Avg. Cost
3.38%
Quarterly Dividend
$0.11
Dividend Yield
5.0%
2011 AFFO per Share
$1.86
Cash on Hand
$167.6 M
* As of December 31, 2011 |
 Highland Transaction Summary
11
Transformational 28-hotel, $1.3 billion acquisition with 8,084 rooms,
Transformational 28-hotel, $1.3 billion acquisition with 8,084
rooms, completed 3/10/11
completed 3/10/11
Primarily upper-upscale and luxury full-service assets
Primarily upper-upscale and luxury full-service assets
Expands Ashford’s presence in key markets (Washington D.C and
Expands Ashford’s presence in key markets (Washington D.C and
NY/NJ) and into new markets (Boston and Nashville)
NY/NJ) and into new markets (Boston and Nashville)
Significant growth potential with affiliate manager Remington
Significant growth potential with affiliate manager Remington
taking over management of 19 hotels
taking over management of 19 hotels
2010 EBITDA flows of 18% vs. AHT’s of 104% and NOI 36% below
2010 EBITDA flows of 18% vs. AHT’s of 104% and NOI 36% below
peak
peak |
 High-Quality Portfolio
12
Marriott Bridgewater
Hyatt Regency Coral Gables
Courtyard Seattle Downtown
Capital Hilton
Marriott Seattle Waterfront
Renaissance Tampa
Embassy Suites Portland
Embassy Suites Las Vegas
Embassy Suites Silicon Valley
Renaissance Palm Springs
Marriott DFW Airport
Marriott Plaza San Antonio
Hilton Tampa Westshore
Ritz-Carlton Atlanta
Renaissance Portsmouth |
 High-Quality Portfolio
13
Hilton Parsippany
The Melrose –
D.C.
Hyatt Regency Wind Watch
Boston Back Bay Hilton
Renaissance Nashville
Marriott Sugar Land
Hyatt Regency Savannah
Westin Princeton
The Silversmith -
Chicago
Hilton La Jolla Torrey Pines
Courtyard SF Downtown
Marriott Suites Market Center
Marriott Legacy Center
Hilton Costa Mesa
Courtyard Philadelphia |
 Focused Portfolio
14
* %’s based on 2011 EBITDA |
 Advantages of Remington
15
Share best
Share best
practices
practices
across brands
across brands
Aligned with
Aligned with
ownership
ownership
Immediate
Immediate
attention
attention
Keeps project
Keeps project
management
management
in-house
in-house
Operate the
Operate the
hotels as if
hotels as if
they owned
they owned
them
them
More owner-
More owner-
friendly cost
friendly cost
structure
structure
Constant
Constant
accessibility
accessibility
Additional
Additional
brand
brand
advocate
advocate
Less
Less
disruption
disruption
during
during
renovations
renovations
Check against
Check against
other
other
managers
managers
Company
Company
“drivers”
“drivers”
are
are
operationally
operationally
focused
focused
Reacts rapidly
Reacts rapidly
to real-time
to real-time
changes
changes |
 Asset Management Expertise
16
39%
8%
%
%
52%
51%
37%
%
104%
63%
0%
20%
40%
60%
80%
100%
120%
2007
2008
2009
2010
2011
49
41
53
HOTEL
EBITDA
FLOWS
(Peers
include:
BEE,
CHSP,
DRH,
FCH,
HST,
HT,
LHO,
PEB
&
SHO)
*
Peer Avg
AHT
*Note: 2011 excludes DRH, FCH & HT – financials not yet
available |
 Asset Management Expertise
17
78
(106)
(487)
53
155
114
(58)
(406)
86
184
(600)
(500)
(400)
(300)
(200)
(100)
-
100
200
300
2007
2008
2009
2010
2011
Peer Avg
AHT
HOTEL
EBITDA
MARGIN
Y-O-Y
CHANGE
(BPS)
(Peers
include:
BEE,
CHSP,
CLDT,
DRH,
FCH,
HST,
HT,
LHO,
PEB
&
SHO)
*
*Note: 2011 excludes DRH, FCH & HT – financials not yet
available |
 Asset
Asset
Management
Management
Expertise
Expertise
–
–
Highland
Highland
Portfolio
Portfolio
18
GOP
Margin
Change
BPS
GOP Flow |
 Most Highly-Aligned Management Team
19
Source: 2011 Proxy Filings |
 •
•
Just prior to the downturn, management proactively managed
interest expense through a hedging strategy, which will have
provided about $240m in cash flow at expiration in 2013
•
Because of this significant cash flow cushion, Ashford was able to
buy back about half of the company during the financial crisis
through common share repurchases
•
Common shares were repurchased at an average of $3.26 vs. today’s
price of about $9
Unique Owner’s Mentality
Unique Owner’s Mentality
20
Management’s large ownership stake in the company drives
decisions that maximize shareholder return |
 Consistent Earnings Growth
21
•
Ashford strives to achieve consistently growing, stable earnings
$-
$0.41
$0.96
$1.13
$1.28
$1.31
$1.12
$1.50
$1.86
$-
$0.20
$0.40
$0.60
$0.80
$1.00
$1.20
$1.40
$1.60
$1.80
$2.00
2003
2004
2005
2006
2007
2008
2009
2010
2011
Ashford’s
Historical
AFFO
per
Share |
 Earnings Outperformance
•
Ashford has significantly outperformed REIT peers on an AFFO per
share basis since the previous peak of mid-2007
22
140%
160%
60%
80%
100%
120%
0%
20%
40%
Ashford
Peer Average
Source: SNL & Company Filings
Peers Include: BEE, DRH, FCH, HST, HT, LHO, SHO
(Q4 actuals used for AHT/HST/LHO/BEE/SHO, consensus used for
DRH/FCH/HT) TTM AFFO Per Share (2007Q2 = 100%)
+48%
-65% |
 Shareholder Return Outperformance
23
•
Ashford has also significantly outperformed REIT peers and c-corp
peers on a total shareholder return basis since the previous peak of
mid-2007
Source: Bloomberg |
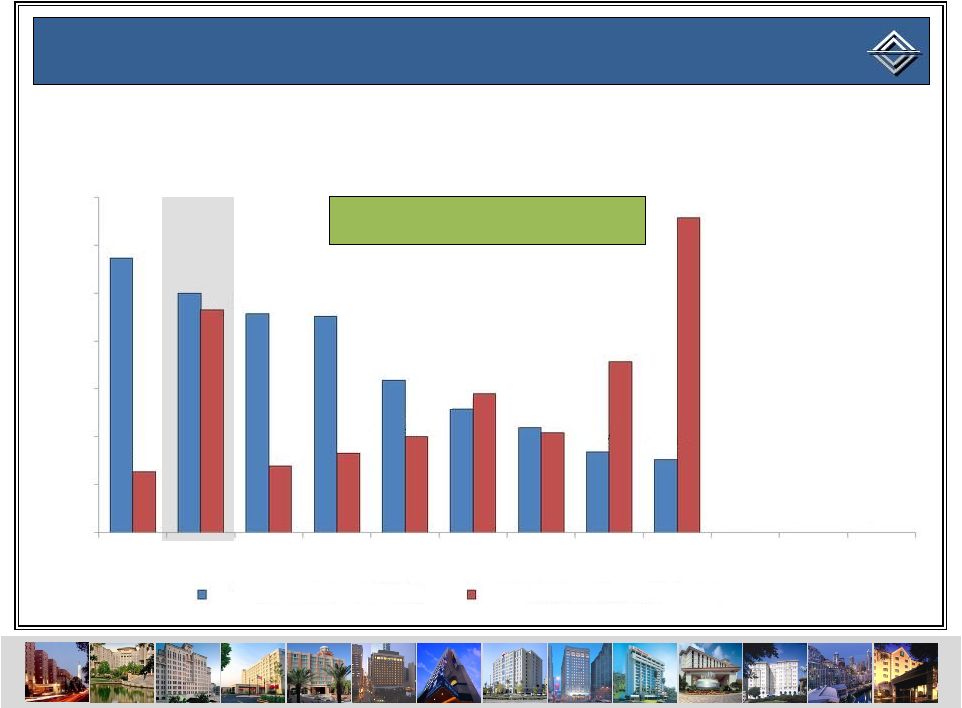 Attractive Dividend Yield & Coverage
24
Ashford recently announced a 10%
dividend increase for 2012
•
Ashford’s dividend yield AND dividend coverage exceed the
peer average
Note: 2011 consensus AFFO per share used for DRH & HT
7.0
6.0
2.0
5.0
4.0
1.0
3.0
-
5.7%
5.0%
4.6%
4.5%
3.2%
2.6%
2.2%
1.7%
1.5%
1.3x
1.4x
4.7x
1.7x
2.0x
2.1x
2.9x
3.6x
6.6x
-
-
-
Dividend Yield (as of 2/22/12)
2011 AFFO Per Share Dividend Coverage
CLDT
AHT
CHSP
HT
DRH
Peer Avg
PEB
LHO
HST
BEE
FCH
SHO |
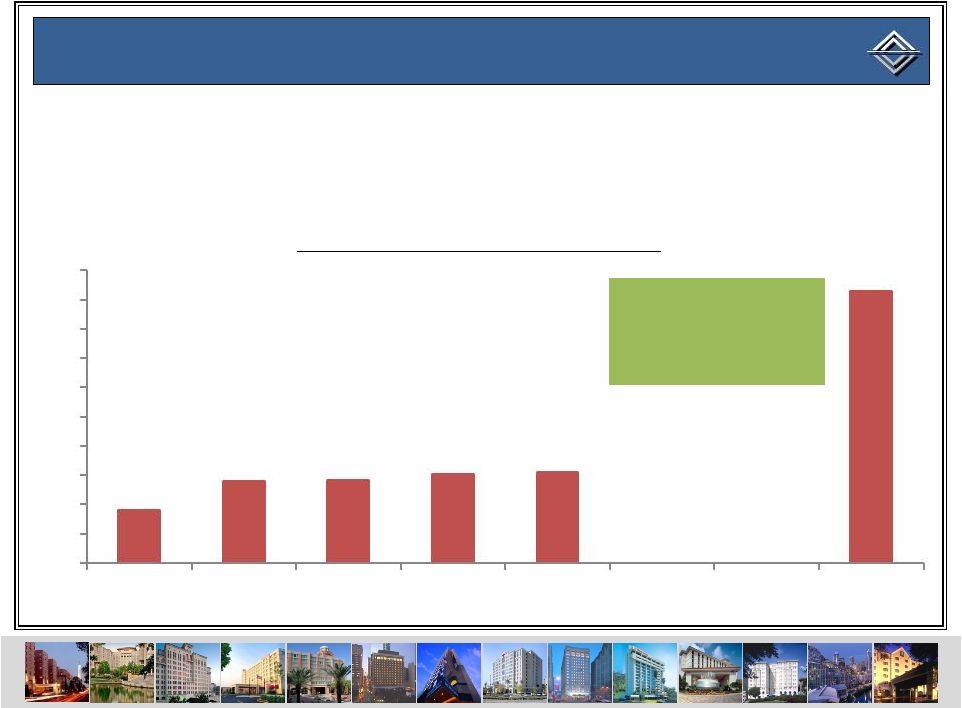 Historical Dividend Coverage
•
25
0.9x
1.4x
1.4x
1.5x
1.6x
4.7x
0.0x
0.5x
1.0x
1.5x
2.0x
2.5
x
3.0x
3.5x
4.0x
4.5x
5.0x
2004
2005
2006
2007
2008
2009
2010
2011
N/A
N/A
Though Ashford didn’t pay
a dividend in 2009 & 2010,
it could have covered its
peak dividend at 1.3x in
2009 & 1.8x in 2010
Ashford could have paid a covered dividend during the
recession, but chose to use the cash to maximize shareholder
return through share repurchases
AFFO
Per
Share
/
Dividend
Coverage |
 Conclusion
•
Best brands / high-quality portfolio
•
•
Management thinks and acts like owners due to significant
ownership stake
•
•
Very attractive dividend
26
Proven operational outperformance due to Ashford asset
management expertise
These factors have led to earnings and shareholder return
outperformance |
 Company Presentation
UBS Conference
February 2012 |