Attached files
| file | filename |
|---|---|
| 8-K - SELECT COMFORT 8-K 2-27-2012 - Sleep Number Corp | form8k.htm |
EXHIBIT 99.1

Unleashing Profitable
Growth Formula
Growth Formula
February 2012

Statements used in this news release relating to future plans, events, financial results or
performance are forward-looking statements subject to certain risks and uncertainties
including, among others, such factors as current general and industry economic trends;
consumer confidence; the effectiveness of our marketing and sales programs, including
advertising and promotional efforts; consumer acceptance of our products, product quality and
brand image; our ability to continue to improve our product line and product quality; warranty
obligations; availability of attractive and cost-effective consumer credit options; execution of
our retail store distribution strategy; rising commodity costs and other inflationary pressures;
our dependence on significant suppliers, including several sole-source suppliers and the
vulnerability of suppliers to recessionary pressures; industry competition; risks of pending and
potentially unforeseen litigation; increasing government regulations; the adequacy of our
management information systems to meet the evolving needs of our business and evolving
regulatory standards; our ability to attract and retain key employees; and uncertainties arising
from global events, such as terrorist attacks or a pandemic outbreak, or the threat of such
events. Additional information concerning these and other risks and uncertainties is contained
in our filings with the SEC, including our Annual Report on Form 10-K, and other periodic
reports filed with the SEC. The company has no obligation to publicly update or revise any of
the forward-looking statements in this presentation.
FORWARD LOOKING STATEMENTS
2

Self-funding, strong balance sheet and no debt
Self-funding, strong balance sheet and no debt
Accelerating margins
Accelerating margins
Compelling sales growth
Compelling sales growth
3
KEY INVESTMENT PROPOSITION

• Differentiated product -
DualAir™ adjustable mattress and
proprietary bedding collection
• Exclusive distribution
• Advantaged business model -
vertically integrated
vertically integrated
• 12 consecutive quarters of profit
improvement 26% comp in 2011
improvement 26% comp in 2011
4
SLEEP NUMBER OVERVIEW

5
Top-Line
Growth
Growth
Top-Line
Growth
Growth
Sustainable
Profitable
Growth
Profitable
Growth
Sustainable
Profitable
Growth
Profitable
Growth
• Older customer with back pain
• Narrow Direct Response media
• National store growth
• Younger, more affluent customer
• Broad-reach media
• Market development
COMPANY TRANSFORMATION
Sleep Number transformed into a strong company with sustainable, profitable growth
2011
(11%)
11%
23%
2011
2010
2009
Growth formula has led to record levels of sales and margin
1-Yr Comp
(4%)
19%
26%
Operating Margin
Operating Margin
8.6%
12.2%
2011
2010
2009
GM%
SM Exp%
61.6%
62.5%
63.3%
47.6%
44.6%
42.7%
4.4%*
EPS
EPS
$0.57
$1.07
2010
2009
$0.24*
*Pro Forma EPS
*Pro Forma Operating Margin
PROVEN GROWTH FORMULA
6
Net Sales Growth
Net Sales Growth
• Asset turnover rate 3x competitors
• Fast growing Return on Invested Capital
Additional financial buffer
Additional financial buffer
+
+
Gap to break-even sales $250M (33%)
Gap to break-even sales $250M (33%)
Break-even sales (ttm)
Actual sales (ttm)
$250M
(33%)
(33%)
$250M
(33%)
(33%)
>$125M in cash &
No debt
No debt
>$125M in cash &
No debt
No debt
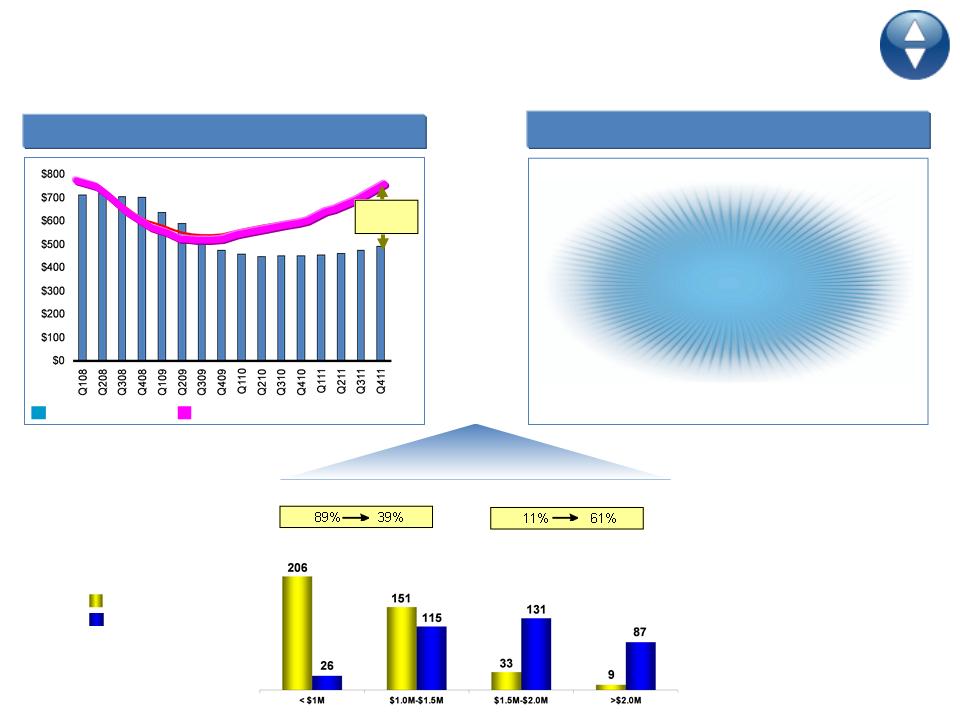
Net sales distribution of
stores open > 1 year
stores open > 1 year
Main Driver
Quantum increase in store productivity
FY09
FY11
7
Sleep Number can manage economic headwinds and continue to invest in opportunities
POSITIONED WITH ECONOMIC FLEXIBILITY
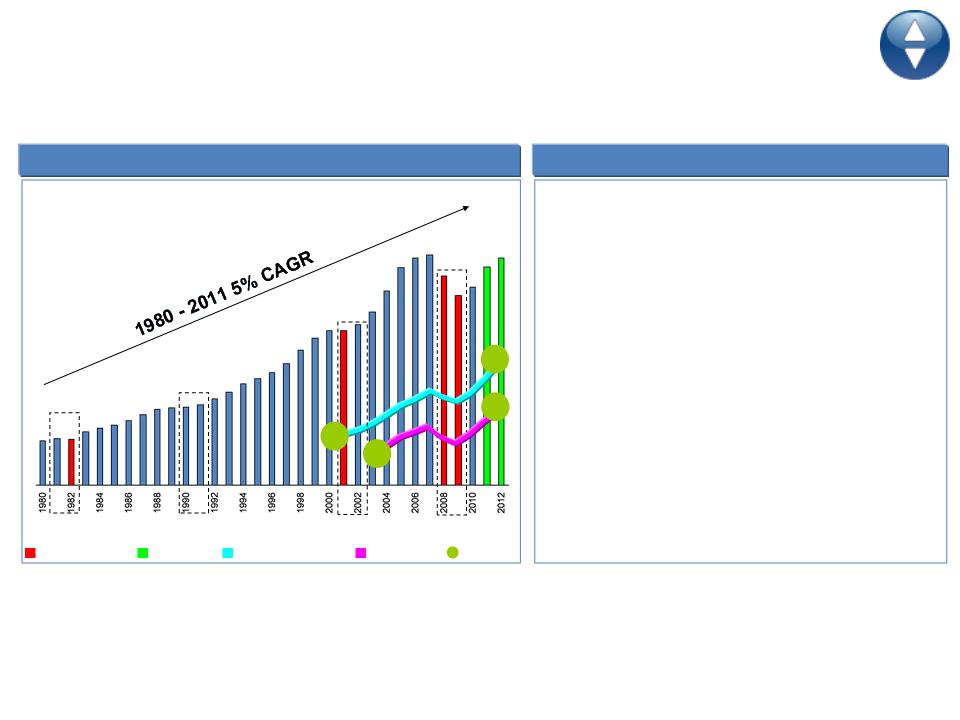
• Consistent growth over past three decades,
reset in 08/09 (resilient following recessions)
reset in 08/09 (resilient following recessions)
• Premium ($>1,000) outpacing total industry
• Current recovery driven by non-innerspring
• Industry sales at retail $12B
• Sleep Number has less than 5% share
US wholesale mattress sales steadily growing
US wholesale mattress sales steadily growing
Industry moving to non-innerspring
Industry moving to non-innerspring
Large industry with Sleep Number in the sweet-spot of premium & non-innerspring growth
INDUSTRY DYNAMICS
8
Premium segment (>$1,000)
Projected growth
Recession
Recession
Recession
Recession
Year of negative growth
1.3
6.9
6.5
6.8
5.6
Source: Industry report (ISPA) & KeyBanc estimates
($ in billions)
54%
Non-Innerspring
5.9
19%
33%
33%
Share of total
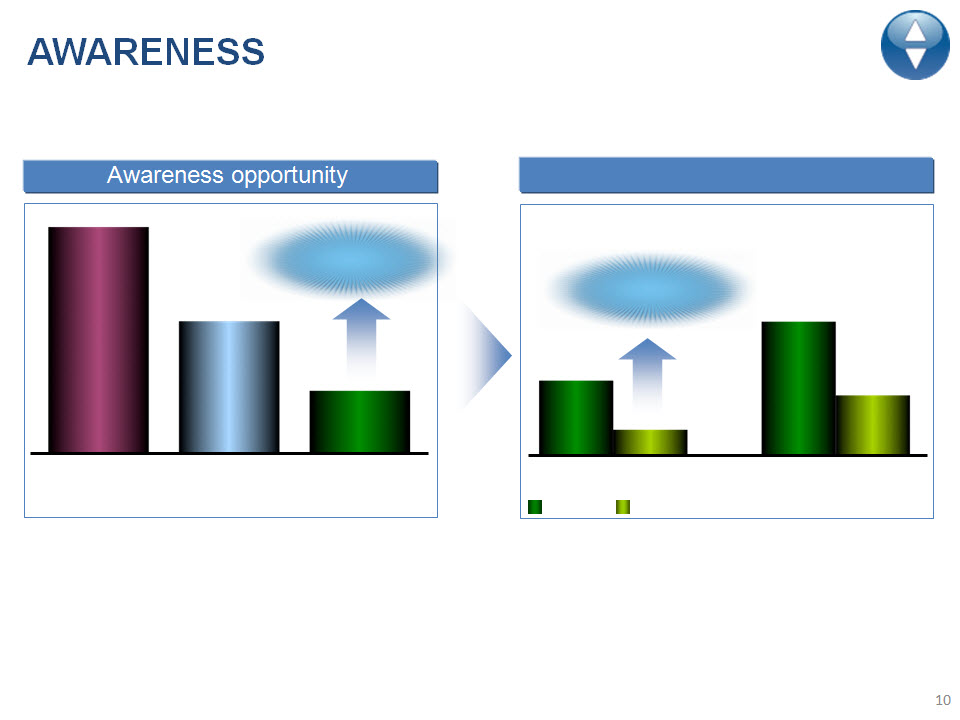
Broadening awareness is #1 growth opportunity
Awareness drives market share
Awareness drives market share
National average
• Leading markets 10-12% share
• Sleep Number awareness lags industry leaders
55%
55%
Leading
Innerspring
Leading
Non-Innerspring
32%
32%
15%
15%
Sleep Number*
Leading markets
10-12%
10-12%
Awareness
Market share
#1 growth
#1 growth
opportunity
opportunity
5%
5%
15%
15%
25%-
40%
10-15% share
10-15% share
$1.5B+ net sales
$1.5B+ net sales
* Awareness as of August 2011
AWARENESS
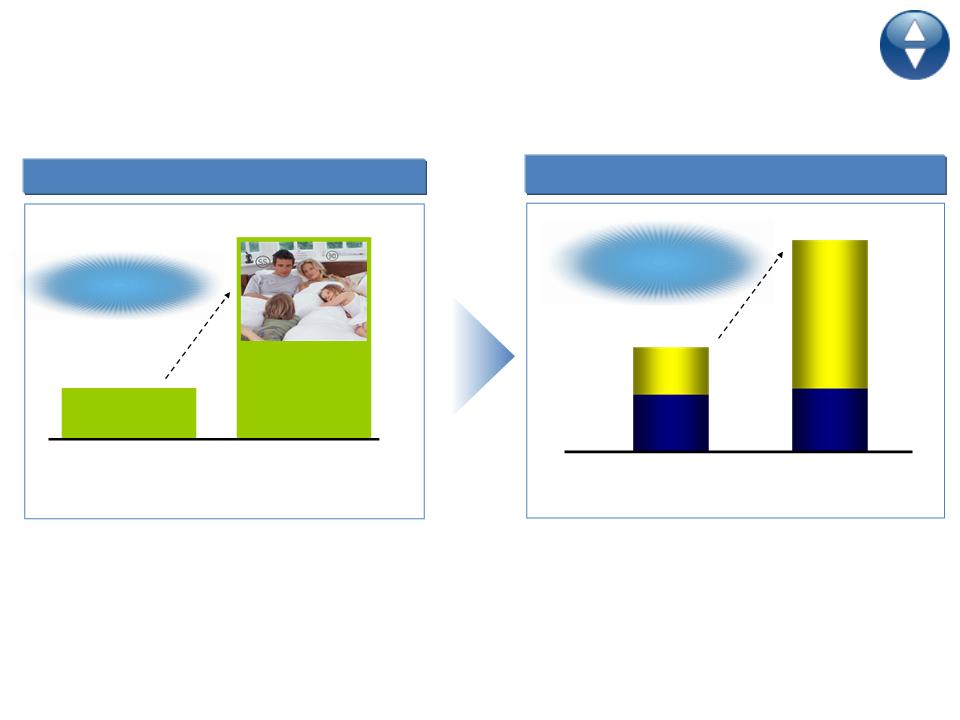
Increasing media investment & effectiveness
Increasing media investment & effectiveness
Broader target Customer
• Broader media strategy increases reach
• Increased investment focused on national
advertising leverage and local development
advertising leverage and local development
• Redefined target customer
• Includes prime mattress buying years
• Moving from need state to aspirational
11
Before
After
• 45-65+ yrs. old
• $50K+ income
• Need state-driven
• 30-54 yrs. old
• $75K+ income
• Values health
• Will pay premium
Targeting a broader customer base and investing for greater reach
2009
2012
Increases target
market 4x
market 4x
Increases target
market 4x
market 4x
Direct
Direct
Media
Media
Broad
Reach
Achieving ~3x reach
Achieving ~3x reach
with 2x investment
with 2x investment
$61M
$120M+
AWARENESS
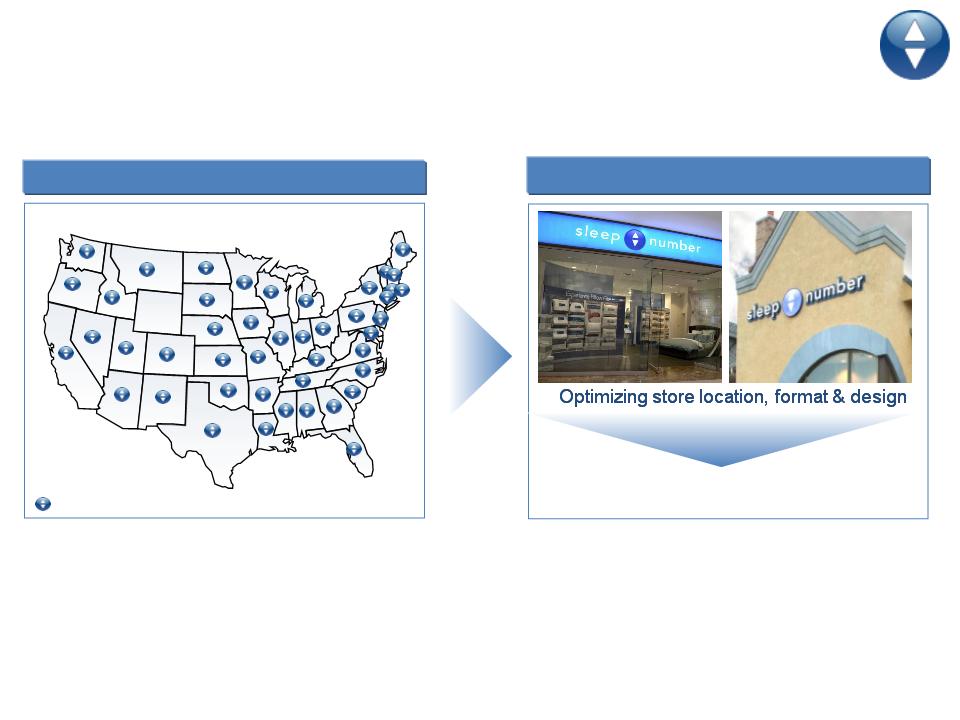
National retailer
National retailer
National scale in place; now focused on local market development
• 380+ stores in 45 states
• Exclusive distribution
• 5-8% annual store growth with >90% market fill-in
12
Sleep Number store presence
• Differentiated store design
• Company-controlled retail experience
• Reposition or remodel 15-20% of stores annually
Flexible real estate - mall and non mall
Flexible real estate - mall and non mall
> $2.0M average sales per store planned in 2012
DISTRIBUTION
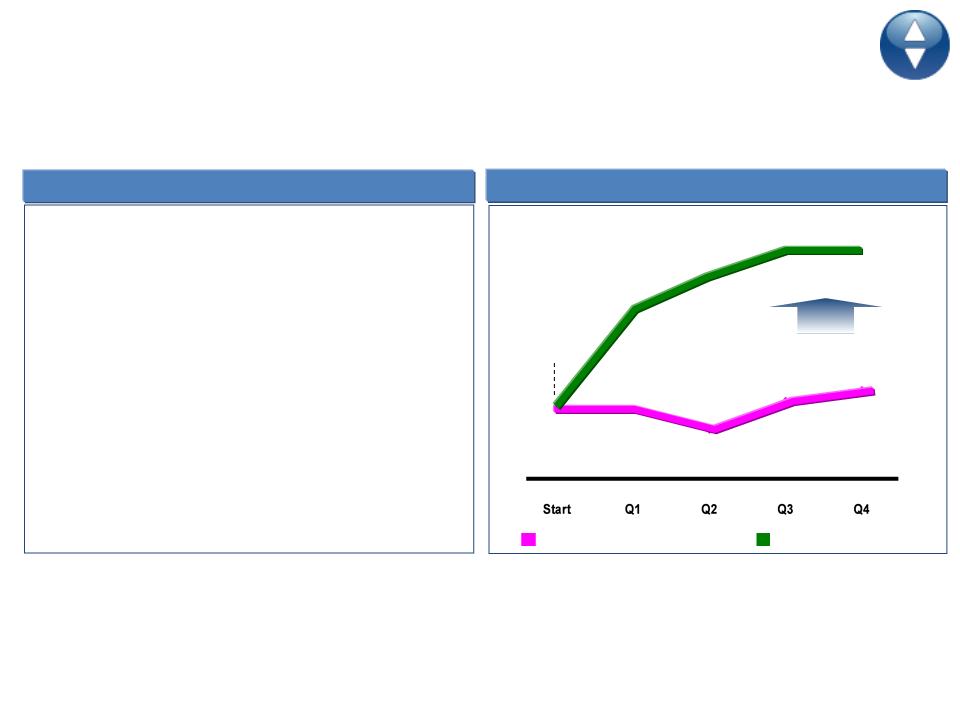
Aggressive growth strategy for large, underdeveloped markets
13
Aggressive growth strategy
Aggressive growth strategy
• Heavy-up local media for break-through share of
media voice
media voice
• Rapidly optimize store location, format and design
• Pilot market success - on track to double market
share in 3 years in these markets
share in 3 years in these markets
• Apply strategy to 13 total markets - represents 1/3
of bedding sales ($4B)
of bedding sales ($4B)
…4 in 2011, 3 in 2012 and 6 in 2013-2014
Aggressive growth pilot
Aggressive growth pilot
Growing 2-3x faster
Year 1
Year 1
22%
16%
25%
28%
49%
59%
66%
66%
2011 YOY% net sales-total company
4 aggressive growth pilots
Integrated
strategy
launch
DISTRIBUTION
INNOVATIVE PRODUCTS
The most differentiated products in the industry
c2
$999
c3
$1,399
c4
$1,699
p5
p6
$2,599
i8
$3,199
i10
$4,699
$2,099
Sleep Number Bed Series Pricing (Queen Sets):
m7
$3,199
Performance
Performance
Innovation
Innovation
Memory Foam
Memory Foam
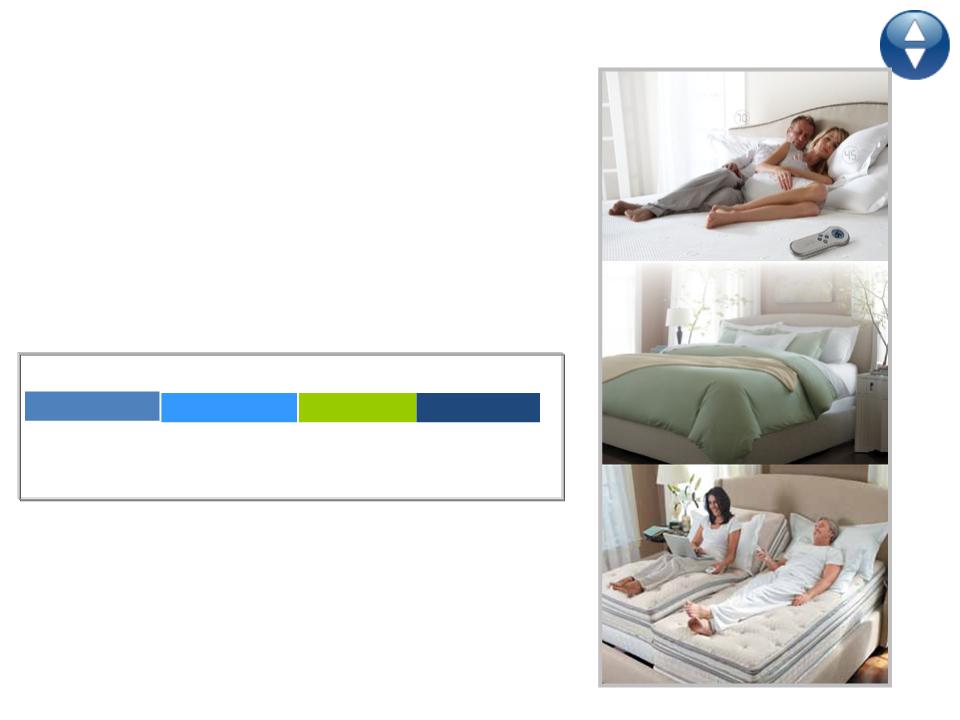
Sleep Number Beds:
• DualAir™ Technology- adjusts on each side for
personalized comfort
• Clinically proven to improve quality of sleep
• Premium good/better/best range of beds
• Opening price point of $699 for queen mattress
Bedding Collection: Solutions designed to improve sleep
FlexFit™ Series: For a fully adjustable experience
Classic
14
15
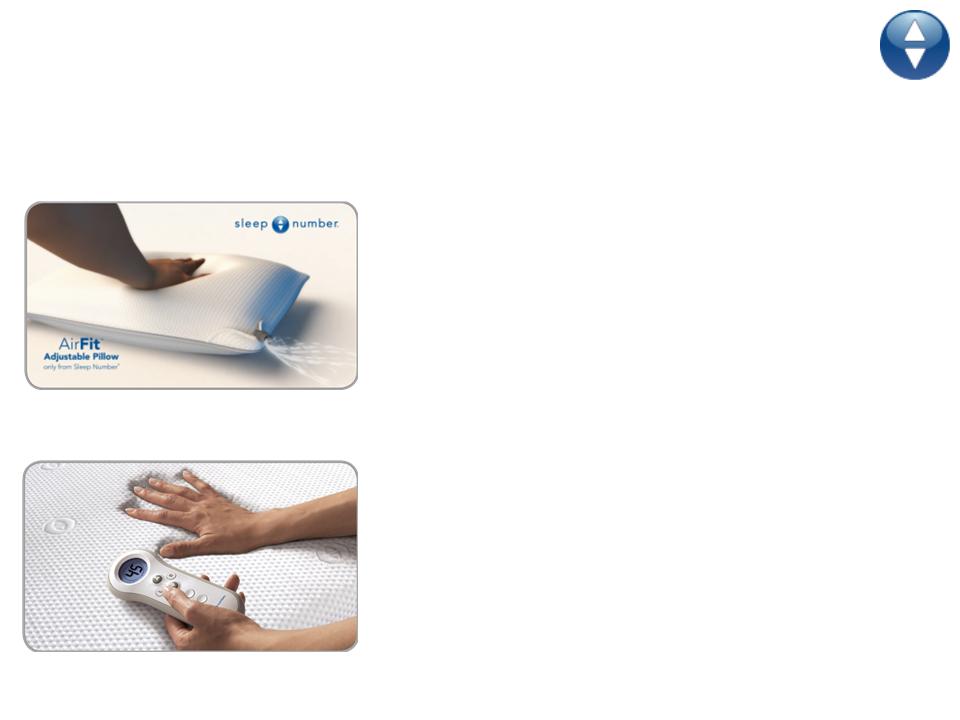
Consumer insight-driven product launches
• Introduction to the Sleep Number experience
• Adjusts to individual’s size, shape, sleeping position
• CoolFit™ Foam, Memory Fiber or European White
Goose Down
Goose Down
• Price $189 - $229
AirFit™ Adjustable Pillow
INNOVATIVE PRODUCTS
• Proprietary CoolFit™ foam with gel technology
• CoolFit™ foam cools, contours and is more breathable
• Exclusive Sleep Number DualAir™ technology
• Price $3,199 queen set
m7 Memory Foam Bed
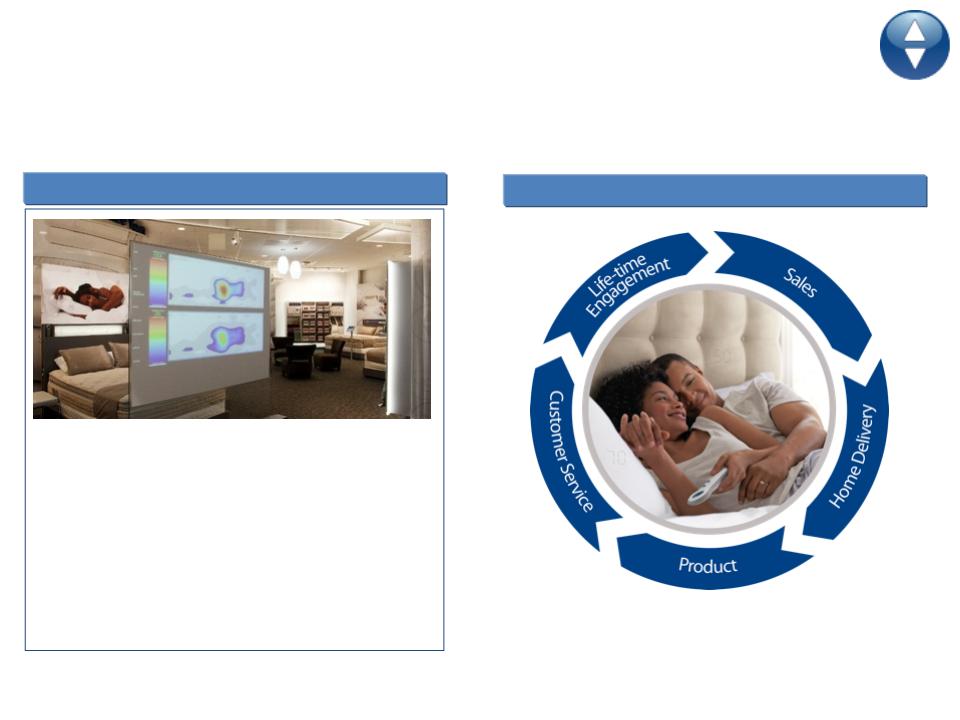
Differentiated store experience
Differentiated store experience
• Highly trained & tenured full time Sleep
Professionals
Professionals
• Technology shows science behind the bed
• Relationship-based selling process
• 95% of customers report store experience
exceeded expectations
exceeded expectations
End-to-end customer experience
End-to-end customer experience
Customers love their Sleep Number experience
16
Controlled brand experience to build value
EXPERIENCE

Growing share through existing and new stores while improving operating margins
2011
2015
$743M*
Open new
stores
stores
$1.5B+
•Build awareness
•Build awareness
•Remodels/Repositions
•Remodels/Repositions
•Product Innovation
•Product Innovation
12%
Operating
Margin
15%+
Operating
Margin
• 5-8% annual store
growth
growth
• 5-8% annual store
growth
growth
• Year 1 new stores >
company average
company average
• Year 1 new stores >
company average
company average
Leverage
existing stores
$400M+
$400M+
17
* (Net Sales)
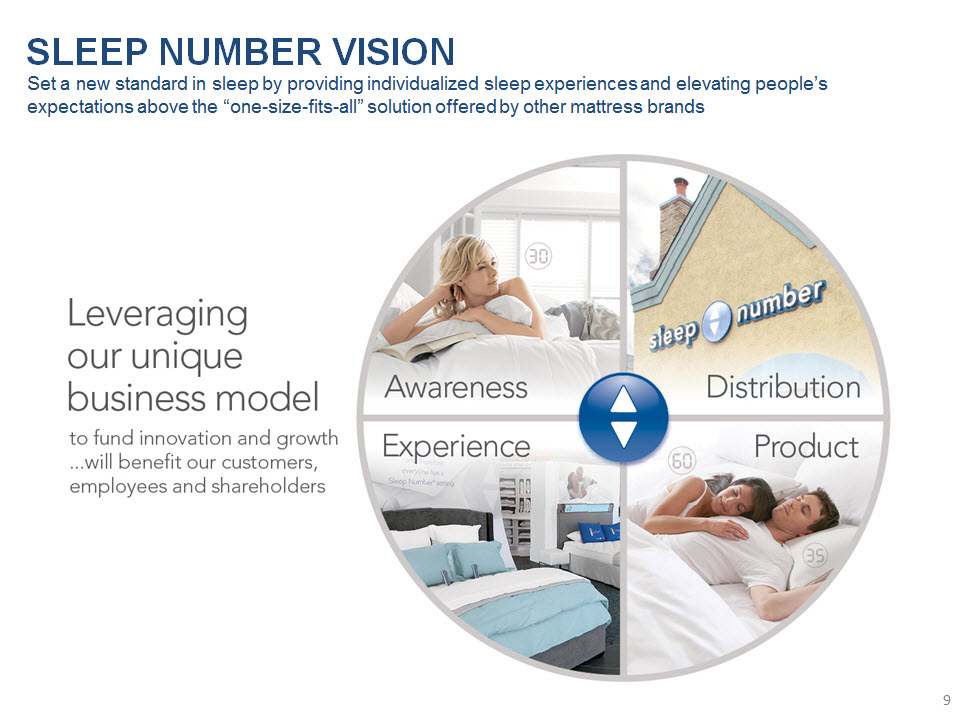
LEVERAGING OUR UNIQUE BUSINESS MODEL
18
Gross Margin
Sales & Marketing
G&A/Other
Operating Margin
Profit Margins
Profit Margins
2011
2011
2015
2015
Drivers
Drivers
63%
43%
8%
12%
>15%
• Supply chain leverage & efficiencies
• Product innovation & pricing
• Store base leverage
• Media mix & efficiency
• Focus on core business
Compelling margin expansion delivers strong bottom-line and EPS growth
EPS growth 20%+
MARGIN OUTLOOK
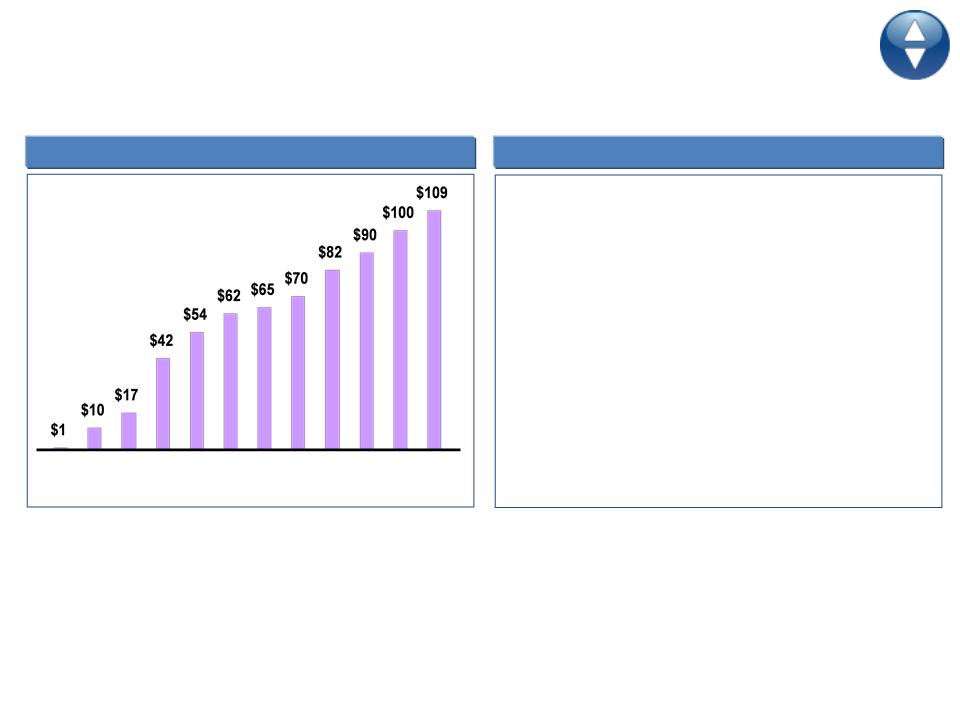
Sleep Number self-funds growth with advantaged profit and cash model
Robust cash flow
Robust cash flow
Q109
Q209
Q309
Q409
Q110
Q210
Q310
Q410
Q111
Q211
Q311
Q411
EBITDA ttm ($ in millions)
Use of Cash
Use of Cash
• Maintain $125M minimum balance
• Priority #1: Self-fund high growth
…stores, systems, product innovation
• Reinstate modest share buyback in 2012
19
STRONG CASH FLOW GENERATION

20
Self-funding, strong balance sheet and no debt
Self-funding, strong balance sheet and no debt
Accelerating margins
Accelerating margins
Compelling sales growth
Compelling sales growth
KEY INVESTMENT PROPOSITION

APPENDIX
21
Bill McLaughlin
President & CEO Age 55
Sleep Number since 2000
President & CEO Age 55
Sleep Number since 2000
Other experience: PepsiCo
Frito-Lay
Frito-Lay
Shelly Ibach
EVP & COO Age 52
Sleep Number since 2007
EVP & COO Age 52
Sleep Number since 2007
Shelly Ibach
EVP & COO Age 52
Sleep Number since 2007
EVP & COO Age 52
Sleep Number since 2007
Other experience: Macy’s
Target Corporation
Kathy Roedel
EVP & Chief Technology & Services
EVP & Chief Technology & Services
Kathy Roedel
EVP & Chief Technology & Services
EVP & Chief Technology & Services
Sleep Number since 2005 • Age 51
Sleep Number since 2005 • Age 51
Other experience: GE Healthcare
Wendy Schoppert
EVP & CFO Age 45
Sleep Number since 2005
EVP & CFO Age 45
Sleep Number since 2005
Other experience: US Bank
America West
Northwest
America West
Northwest
Mark Kimball
SVP & General Counsel Age 53
Sleep Number since 1999
SVP & General Counsel Age 53
Sleep Number since 1999
Other experience: Oppenheimer, Wolff & Donnelly
Karen Richard
SVP & Human Capital Age 41
Sleep Number since 1996
SVP & Human Capital Age 41
Sleep Number since 1996
Other experience: TCF Financial Corp
Strong, experienced management team with long tenure and diverse industry backgrounds
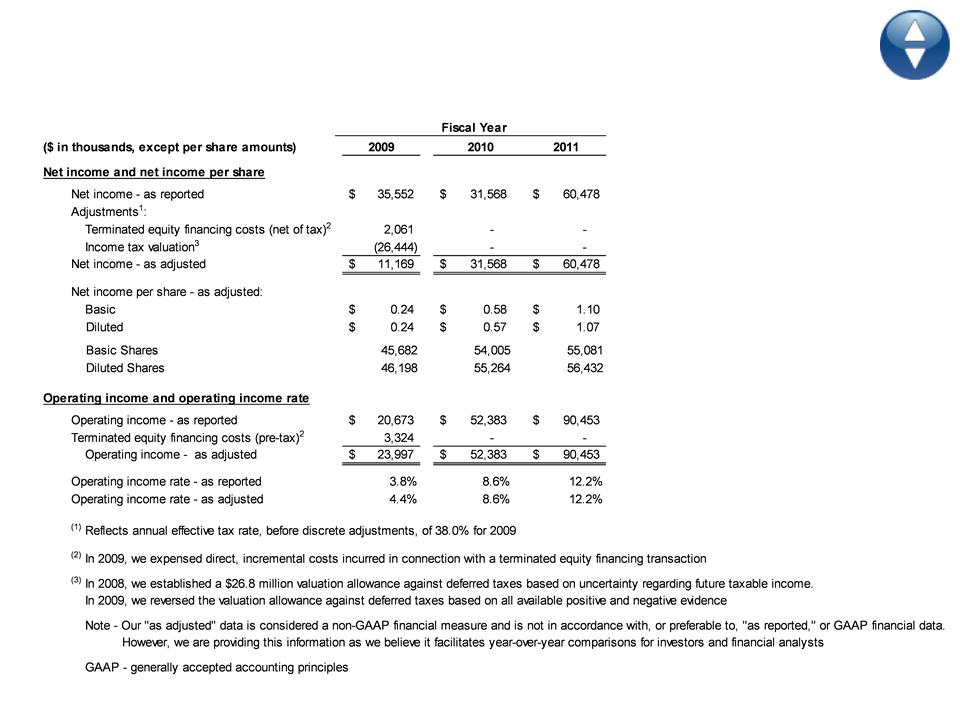
Non-GAAP Financial Measures Reconciliation
Fiscal Years 2009, 2010 and 2011
Fiscal Years 2009, 2010 and 2011
23
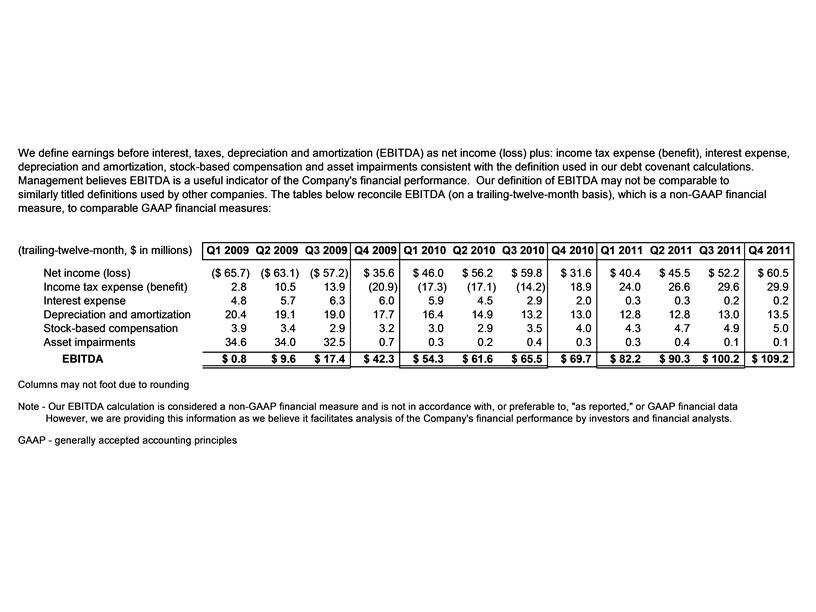
Non-GAAP Financial Measures Reconciliation
EBITDA for 2009, 2010 and 2011 (trailing-twelve-
month basis)
EBITDA for 2009, 2010 and 2011 (trailing-twelve-
month basis)
24

Thank You