Attached files
| file | filename |
|---|---|
| EX-23.1 - EXHIBIT 23.1 - Sleep Number Corp | ex23_1.htm |
| EX-31.2 - EXHIBIT 31.2 - Sleep Number Corp | ex31_2.htm |
| EX-23.2 - EXHIBIT 23.2 - Sleep Number Corp | ex23_2.htm |
| EX-32.1 - EXHIBIT 32.1 - Sleep Number Corp | ex32_1.htm |
| EX-31.1 - EXHIBIT 31.1 - Sleep Number Corp | ex31_1.htm |
| EX-32.2 - EXHIBIT 32.2 - Sleep Number Corp | ex32_2.htm |
| EX-10.20 - EXHIBIT 10.20 - Sleep Number Corp | ex10_20.htm |
| EX-10.36 - EXHIBIT 10.36 - Sleep Number Corp | ex10_36.htm |
| EX-10.21 - EXHIBIT 10.21 - Sleep Number Corp | ex10_21.htm |
| EX-10.22 - EXHIBIT 10.22 - Sleep Number Corp | ex10_22.htm |
UNITED STATES SECURITIES AND EXCHANGE COMMISSION
WASHINGTON, D.C. 20549
FORM 10-K
(Mark one)
|
T
|
ANNUAL REPORT PURSUANT TO SECTION 13 OR 15(d) OF THE SECURITIES EXCHANGE ACT OF 1934
|
For the Fiscal Year Ended January 1, 2011
|
£
|
TRANSITION REPORT PURSUANT TO SECTION 13 OR 15(d) OF THE SECURITIES EXCHANGE ACT OF 1934
|
For the transition period from _________ to _________.
Commission File No. 0-25121
SELECT COMFORT CORPORATION
(Exact name of registrant as specified in its charter)
|
MINNESOTA
|
41-1597886
|
|
(State or other jurisdiction of incorporation or organization)
|
(I.R.S. Employer Identification No.)
|
|
|
|
|
9800 59th Avenue North
|
|
|
Minneapolis, Minnesota
|
55442
|
|
(Address of principal executive offices)
|
(Zip Code)
|
Registrant’s telephone number, including area code: (763) 551-7000
Securities registered pursuant to Section 12(b) of the Act:
|
Title of each class
|
Name of each exchange on which registered
|
|
Common Stock, par value $.01 per share
|
The NASDAQ Stock Market LLC
|
|
|
(NASDAQ Global Select Market)
|
Securities registered pursuant to Section 12(g) of the Act: None
Indicate by check mark if the Registrant is a well-known seasoned issuer, as defined by Rule 405 of the Securities Act.
YES £ NO T
Indicate by check mark if the Registrant is not required to file reports pursuant to Section 13 or Section 15(d) of the Act.
YES £ NO T
Indicate by check mark whether the Registrant (1) has filed all reports required to be filed by Section 13 or 15(d) of the Securities Exchange Act of 1934 during the preceding 12 months (or for such shorter period that the Registrant was required to file such reports), and (2) has been subject to such filing requirements for the past 90 days. YES x NO £
Indicate by check mark whether the registrant has submitted electronically and posted on its corporate Web site, if any, every Interactive Data File required to be submitted and posted pursuant to Rule 405 of Regulation S-T (§ 232.405 of this chapter) during the preceding 12 months (or for such shorter period that the registrant was required to submit and post such files). YES £ NO £
Indicate by check mark if disclosure of delinquent filers pursuant to Item 405 of Regulation S-K (Section 229.405 of this chapter) is not contained herein, and will not be contained, to the best of Registrant’s knowledge, in definitive proxy or information statements incorporated by reference in Part III of this Form 10-K or any amendment to this Form 10-K. T
Indicate by check mark whether the Registrant is a large accelerated filer, an accelerated filer, a non-accelerated filer, or a smaller reporting company. See the definitions of “large accelerated filer,” “accelerated filer” and “smaller reporting company” in Rule 12b-2 of the Exchange Act.
|
Large accelerated filer
|
£
|
Accelerated filer
|
T
|
|
Non-accelerated filer
|
£ (Do not check if a smaller reporting company)
|
Smaller reporting company
|
£
|
Indicate by check mark whether the Registrant is a shell company (as defined in Rule 12b-2 of the Act). YES £ NO x
The aggregate market value of the common equity held by non-affiliates of the Registrant as of July 3, 2010, was $314,102,000 (based on the last reported sale price of the Registrant’s common stock on that date as reported by NASDAQ).
As of January 29, 2011, there were 55,452,000 shares of the Registrant’s common stock outstanding.
DOCUMENTS INCORPORATED BY REFERENCE
Portions of the registrant’s proxy statement to be furnished to shareholders in connection with its 2011 Annual Meeting of Shareholders are incorporated by reference in Part III, Items 10-14 of this Annual Report on Form 10-K.
As used in this Form 10-K, the terms “we,” “us,” “our,” the “Company,” and “Select Comfort” mean Select Comfort Corporation and its subsidiaries and the term “common stock” means our common stock, par value $0.01 per share.
As used in this Form 10-K, the term “bedding” includes mattresses, box springs and foundations and does not include bedding accessories, such as sheets, pillows, headboards, frames, mattress pads and related products.
Select Comfort®, Sleep Number®, Comfort Club®, Sleep Better on Air®, The Sleep Number Bed by Select Comfort (logo)®, Select Comfort (logo with double arrow design)®, Firmness Control System™, Precision Comfort®, Corner Lock™, Intralux®, The Sleep Number Store by Select Comfort (logo)®, You can only find your Sleep Number® setting on a Sleep Number Bed by Select Comfort™, Select Comfort Creator of the Sleep Number Bed®, What’s Your Sleep Number®?, Grand King®, Personalized Warmth Collection®, GridZone®, It’s the Bed that Counts®, Luxlayer®, Pillow[ology] ®, Take Control of Your Sleep®, Changing the way you sleep could change your life®, ComfortFit™, IndividualFit™, PillowFit™, Sleep Number® Inner Circle™, and our stylized logos are trademarks and/or service marks of Select Comfort. This Form 10-K may also contain trademarks, trade names and service marks that are owned by other persons or entities.
Our fiscal year ends on the Saturday closest to December 31, and, unless the context otherwise requires, all references to years in this Form 10-K refer to our fiscal years. Our fiscal year is based on a 52- or 53-week year. All years presented in this Form 10-K are 52 weeks, except for the 2008 fiscal year ended January 3, 2009, which is a 53-week year.
i
TABLE OF CONTENTS
|
2
|
||||
|
Item 1.
|
2
|
|||
|
Item 1A.
|
13
|
|||
|
Item 1B.
|
18
|
|||
|
Item 2.
|
19
|
|||
|
Item 3.
|
20
|
|||
|
Item 4.
|
20
|
|||
|
21
|
||||
|
Item 5.
|
21
|
|||
|
Item 6.
|
24
|
|||
|
Item 7.
|
27
|
|||
|
Item 7A.
|
38
|
|||
|
Item 8.
|
39
|
|||
|
Item 9.
|
63
|
|||
|
Item 9A.
|
63
|
|||
|
Item 9B.
|
64
|
|||
|
65
|
||||
|
Item 10.
|
65
|
|||
|
Item 11.
|
65
|
|||
|
Item 12.
|
65
|
|||
|
Item 13.
|
65
|
|||
|
Item 14.
|
65
|
|||
|
66
|
||||
|
Item 15.
|
66
|
|||
This Annual Report on Form 10-K contains or incorporates by reference certain forward-looking statements within the meaning of the Private Securities Litigation Reform Act of 1995. For this purpose, any statements contained in or incorporated by reference into this Annual Report on Form 10-K that are not statements of historical fact may be deemed to be forward-looking statements, including but not limited to projections of revenues, results of operations, financial condition or other financial items; any statements of plans, strategies and objectives of management for future operations; any statements regarding proposed new products, services or developments; any statements regarding future economic conditions, prospects or performance; statements of belief and any statement or assumptions underlying any of the foregoing. In addition, we or others on our behalf may make forward-looking statements from time to time in oral presentations, including telephone conferences and/or Web casts open to the public, in press releases or reports, on our Internet Web site or otherwise. We try to identify forward-looking statements in this report and elsewhere by using words such as “may,” “will,” “should,” “could,” “expect,” “anticipate,” “believe,” “estimate,” “plan,” “project,” “predict,” “intend,” “potential,” “continue” or the negative of these or similar terms.
Our forward-looking statements speak only as of the date made and by their nature involve substantial risks and uncertainties. Our actual results may differ materially depending on a variety of factors, including the items discussed in greater detail below under the caption “Risk Factors.” These risks and uncertainties are not exclusive and further information concerning the Company and our business, including factors that potentially could materially affect our financial results or condition, may emerge from time to time, including factors that we may consider immaterial or do not anticipate at this time.
We wish to caution readers not to place undue reliance on any forward-looking statement and to recognize that forward-looking statements are predictions of future results, which may not occur as anticipated. We assume no obligation to update forward-looking statements to reflect actual results or changes in factors or assumptions affecting such forward-looking statements. We advise you, however, to consult any further disclosures we make on related subjects in our quarterly reports on Form 10-Q and current reports on Form 8-K that we file with or furnish to the Securities and Exchange Commission.
ITEM 1. BUSINESS
Our Business
Overview
Select Comfort Corporation, based in Minneapolis, Minnesota, was founded in 1987 and is now one of the nation's leading bed manufacturers and retailers. We design, manufacture, market and distribute premium quality, adjustable-firmness beds and other sleep-related accessory products. Select Comfort has evolved from a specialty, niche direct marketer, to a nationwide multi-channel business with fiscal 2010 net sales of $606 million.
The air-chamber technology of our proprietary Sleep Number bed allows adjustable firmness on each side of the mattress and provides a sleep surface that is clinically proven to provide better sleep quality and greater relief of back pain compared to traditional mattress products. In addition, we market and sell accessories and other sleep-related products which focus on providing personalized comfort to complement the Sleep Number bed and provide a better night’s sleep. We have a mission-driven culture focused on serving the individual needs of our customers.
Our mission is to improve lives by individualizing sleep experiences. From our revolutionary series of beds to our exclusive SLEEP NUMBER® Bedding Collection, our vision is to set a new standard in sleep through product innovation and integrated experiences delivered by our sales professionals who have been trained to be knowledgeable in sleep and sleep-related products.
In 1998, Select Comfort became a publicly traded company and is listed on The NASDAQ Stock Market LLC (NASDAQ Global Select Market) under the symbol “SCSS.” When used herein, the terms “Select Comfort,” “Company,” “we,” “us” and “our” refer to Select Comfort Corporation, including consolidated subsidiaries.
Competitive Strengths
Differentiated, Superior Product
Unlike the “one-size-fits-all” solution offered by other mattress brands, the Sleep Number bed offers personalized comfort that is adjustable on each side. Our proprietary air-chamber technology (two independent air chambers) allows couples to adjust the firmness on either side of the bed to meet their own individual preference at the touch of a button.
The unique benefits of our proprietary Sleep Number bed have been validated through clinical sleep research which has shown that people who sleep on a Sleep Number bed generally fall asleep faster, experience deeper sleep with fewer disturbances and experience greater relief from back pain than those sleeping on a traditional innerspring mattress.
Distinctive Brand
In 2001, we created the Sleep Number brand. This branding strategy allows our marketing communications to focus on our bed’s distinguishing and proprietary features – adjustable firmness and support for personalized comfort. This is represented by the digital Sleep Number setting displayed on the bed remote, with a brand message hierarchy as follows:
|
•
|
Only bed with SLEEP NUMBER® settings for personalized comfort;
|
|
•
|
Adjustable firmness on each side for couples;
|
|
•
|
Clinically proven back-pain relief, improved sleep quality; and
|
|
•
|
Exclusive head-to-toe sleep solutions to meet your unique comfort needs.
|
At Sleep Number, we believe that every body is unique. Unlike ordinary mattresses, the Sleep Number bed offers a revolutionary choice—personalized comfort that can be controlled at the touch of a button. The Sleep Number bed can be made firmer or softer on each side, making it the perfect bed for couples. It’s the only bed clinically proven to relieve back pain and provide better sleep quality in comparison with traditional mattress products. With ongoing adjustability, it’s finally a bed that can meet people’s changing needs over time.
Controlled Selling Environment
Over 90% of our sales are generated through our company-controlled distribution channels – Retail, Direct Marketing and E-Commerce. Our nationwide chain of retail stores provides a unique mattress shopping experience and offers a relaxed environment designed to provide education on the importance of sleep and the products that best fit customers’ needs. Controlling the selling process enables us to ensure that the unique benefits of our products are effectively communicated to customers. Our multiple touch-points of service, including sales, delivery and post-sale service, provide several opportunities to communicate with our customers, reinforcing the sale and enabling us to understand and respond quickly to consumer trends and preferences.
Integrated Business Process
We are a vertically integrated business from production through sales and delivery of our products, which allows us to control quality, cost, price and presentation, as well as the unique opportunity to establish ongoing relationships with our customers. The modular design of our Sleep Number bed allows a just-in-time, build-to-order production process which requires minimal inventory in our manufacturing plants and stores, resulting in reduced working capital requirements. Our build-to-order production process also allows our stores to serve primarily as showrooms, without requiring significant product storage capacity, and provides us significant flexibility in changing our product models.
Vision and Strategy
Our vision is to become the new standard in sleep by providing individualized sleep experiences and elevating people’s expectations above the “one-size-fits-all” solutions offered by other mattress brands.
For 2011, we are executing against a defined strategy which focuses on the following key components:
|
•
|
Know our customers as no one else can…use that insight to set new standards in end-to-end customer experience;
|
|
•
|
Broaden awareness and consideration…to take share; earn leadership in premium sleep; and
|
|
•
|
Leverage our core business to achieve new levels of margin…to fund acceleration and innovation.
|
Know Our Customers as No One Else Can
As the only major mattress brand that is both a manufacturer and a multi-channel retailer, we have the opportunity to know our customers and the capability to enhance their entire customer experience from researching products, to the sale, delivery, set-up and post-sales follow-up. Our sales professionals and customer service specialists are trained to be knowledgeable in sleep and sleep-related products and their mission is to assist each customer to individualize their sleep experiences through fast, friendly and accessible service.
We have historically introduced new features and benefits to our Sleep Number beds every two to three years, through a pipeline of research and development activities. We continually focus on improving the reliability and quality of all the products that we sell. Our latest models emphasize enhanced comfort-layer materials, and several feature advancements in temperature balancing technology. We believe our current line represents the most technologically advanced beds we have ever produced and provides ideal comfort and quality sleep for each individual.
Broaden Awareness and Consideration
Our most significant growth driver has been building brand awareness. The Sleep Number brand has been integrated into all of our sales channels and throughout our internal and external communication programs. We utilize a media mix that includes television, radio and print advertising in support of our Sleep Number marketing campaign, with increasing use of digital advertising in our media mix.
As of January 1, 2011 we operated 386 company-owned stores in the U.S., and expect to end 2011 with approximately 380 stores. In 2010, we migrated from a mix of Sleep Number and Select Comfort store marquees to 100% branded as Sleep Number. We are taking both a national and local market-based approach to our growth — increasing our national advertising and focusing on local marketing, real estate optimization and sales execution. We believe that through marketing and sales execution we can increase average sales per store to better leverage the profitability of our fixed cost store base. Beyond 2011, we plan to expand our retail store base to drive sales and profit growth.
We have begun a non-mall store pilot to help build store and brand awareness. The non-mall format will be targeted to highly-visible, well-traveled locations and is intended to complement our existing mall store base. The non-mall design allows us to increase store square footage to display and sell our entire line of Sleep Number beds and bedding collection, and provide a more differentiated, interactive customer experience.
In 2005, we expanded our distribution network outside the U.S. with a retail partner relationship in Canada. During 2007, we formed a strategic alliance with two Australian-based companies to manufacture and distribute Sleep Number beds in Australia and New Zealand. Our international distribution network was not a significant part of our total distribution network in 2010 and we do not plan to expand our international distribution during 2011.
We also sell to key commercial partners which strategically increases awareness of our brand through unique channels. These commercial partners include the QVC television shopping channel, the luxury motor home market, and leading home furnishing retailers in Alaska and Hawaii.
Leverage Our Core Business to Achieve New Levels of Margin
We generated positive net income for six consecutive years from 2002 through 2007. In 2008 our operating results were significantly affected by a decrease in consumer spending and we generated a net loss. In 2009 and 2010, we returned to profitability and generated operating income of $20.7 million and $52.4 million, respectively. The expansion of profitability over the last two years is the result of aggressive cost reductions and disciplined cost controls, leveraging our advantaged business model which generates significant variable profit contribution on modest sales gains. As of January 1, 2011, we had no borrowings under our $20 million revolving credit facility and increased our cash balance to $81 million from $18 million one year ago.
As we enter 2011, our plan is to continue to expand our margins to enhance profitability and provide greater flexibility to invest in growth opportunities. We plan to build on the learnings of recent years, targeting efficient sales gains while maintaining the expense and cash disciplines to grow operating margins and increase net income.
Our Products
Mattresses
We offer Sleep Number beds in three series to help customers choose the bed that is best for them.
|
•
|
The Classic Series is the classic design with personal adjustability at an affordable price. The series includes the Sleep Number c2, c3 and c4 beds.
|
|
•
|
The Performance Series includes our most popular beds, featuring enhanced performance, comfort and a great value. The series includes the Sleep Number p5, p6 and p7 beds.
|
|
•
|
The Innovation Series is the premier experience in personalized comfort combined with leading-edge innovations in sleep technology. The series includes the Sleep Number i8 and i10 beds.
|
The Sleep Number bed series are available through our U.S. company-owned distribution channels. Each bed series comes in standard mattress sizes, ranging from twin to king, as well as some specialty mattress sizes. Our bed series vary in features, functionality and price. As you move up the line, the Sleep Number bed series offer enhanced features and benefits, including higher quality fabrics, additional cushion and padding, higher overall mattress profiles, quieter Firmness Control Systems with additional functions, temperature balancing fabrics, and wireless remote controls as a standard feature.
The contouring support of our Sleep Number beds is optimized when used with our specially designed, proprietary modular base. This durable base, used in place of a box spring, is a modular design that can be disassembled and easily moved through staircases, hallways and other tight spaces.
Our U.S. mattress price points range from approximately $699 for the entry-level c2 queen-size mattress to $3,999 for the luxurious Sleep Number i10 queen-size mattress. Our most popular model is the p5 queen-size mattress which sells for approximately $1,699. Actual prices are at times lower than those quoted due to promotional offerings.
Our unique product design allows us to ship our beds in a modular format to customers throughout the U.S. by United Parcel Service (“UPS”). For an additional fee, customers can take advantage of our home delivery service, which includes bed assembly and optional mattress removal services.
Each of our Sleep Number beds (not including our FlexFit Adjustable Bases) comes with a 30 night in-home trial and better night’s sleep guarantee, which allows customers 30 nights at home to make sure they are completely satisfied with the bed. The customer is responsible for the return shipping costs. Independent durability testing has shown our Sleep Number beds can withstand more than 20 years of simulated use, and each of our Sleep Number beds is backed by our 20-year limited warranty.
Sleep Number Bedding Collection
Like our SLEEP NUMBER® beds, our exclusive SLEEP NUMBER® Bedding Collection offers a line of products to meet each individual’s needs. Our sales professionals have the expertise to guide our customers to sleep solutions that are just right for them. From the way their pillow fits, to the weight of their comforter, we offer the latest innovations. We also offer a number of products that allow for unique personalization, including “Create your Perfect Pillow” and “Create your Perfect Comforter.”
Adjustable Bases/FlexFit
In 2003, we completed the roll-out of our Precision Comfort adjustable base to all of our company-owned retail stores. The adjustable base enables customers to raise the head or foot of the bed, and to experience the comfort of massage, using a handheld remote control. In 2010, we updated the Precision Comfort name to FlexFit Plus and introduced a value option, the FlexFit. Our FlexFit adjustable bases provide customers with an ideal upgrade for their Sleep Number bed, offering them a fully adjustable sleep experience.
Sales Distribution
Unlike traditional mattress manufacturers, which primarily sell through third-party retailers, over 90% of our net sales are through one of three company-controlled distribution channels – Retail, Direct Marketing and E-Commerce. These channels enable us to control the selling process to ensure that the unique benefits of our products are effectively presented to customers. Our direct-to-consumer business model enables us to understand and respond quickly to consumer trends and preferences.
Our retail stores accounted for 84% of our net sales in 2010. Average net sales per company-owned store were $1,295,000 in 2010 versus $1,046,000 in 2009, $984,000 in 2008, $1,318,000 in 2007 and $1,493,000 in 2006, with average sales per square foot of $873 in 2010 versus $710 in 2009, $703 in 2008, $1,024 in 2007 and $1,244 in 2006. In 2010, 70% of our stores generated net sales of over $1,000,000.
Our direct marketing call center and E-Commerce Web site provide national sales coverage, including markets not yet served by one of our retail stores, and accounted for 11% of our net sales in 2010. In addition, these channels provide a cost-effective way to market our products, are a source of information on our products and refer customers to our stores if there is one near the customer.
Beginning in 2002, we supplemented our sales through semi-exclusive relationships with selected home furnishing retailers and specialty bedding retailers. In August 2009, we discontinued distribution through non-company-owned mattress retailers in the contiguous United States. This change was part of the Company’s efforts to reignite the Sleep Number brand and did not have a significant impact on sales or profit in 2010. At the end of 2010, our retail partner program included three retail partners in Hawaii, Alaska and Canada.
In late 2007, we began distribution in Australia and New Zealand through relationships with an Australian-based manufacturer and an Australian-based retailer. Our total net sales attributable to foreign countries were $2.3 million in 2010, $3.7 million in 2009 and $5.4 million in 2008.
Marketing and Advertising
Awareness among the broad consumer audience of our brand, product benefits and store locations has been our most significant opportunity for growth. The Sleep Number advertising campaign was introduced early in 2001 to support our retail stores in selected markets through our first comprehensive multi-media advertising campaign using prime-time TV, national cable television, infomercials, drive-time radio and newspaper advertisements.
Since 2001, the Sleep Number brand positioning has been integrated into our marketing messages across all of our distribution channels, advertising vehicles and media types. We look to our direct response advertising on national cable TV as an economical means to generate leads for our stores. Through our dedicated call center, we are able to provide the inquiring customer more information including the nearest store location, and/or send a video and brochure. We also leverage local advertising, as well as digital and social media, to increase both awareness and consideration of the Sleep Number brand and products. Our total media spending was approximately $70 million in 2010, $61 million in 2009 and $92 million in 2008.
Owners of Sleep Number beds purchased through company-controlled channels are considered Insiders in our InnerCircle rewards program. The program is designed primarily to increase referrals and repeat purchases by strengthening our ongoing relationship with our owners. Each time a referred customer purchases a bed, the referring Insider receives a $50 coupon for purchase of our products, with increasing benefits for multiple referrals. In 2010, approximately 29,000 new customers bought beds after receiving referrals from our Insiders, and existing owners bought approximately 33,000 additional beds.
Qualified customers are offered revolving credit to finance purchases through a private-label consumer credit facility provided by GE Money Bank. Approximately 23% of our net sales in 2010 were financed by GE Money Bank. In 2005, we entered into an amended and restated agreement with GE Money Bank that extends this consumer credit arrangement through February 15, 2012, subject to earlier termination upon certain events and subject to automatic extensions. Under the terms of our agreement, GE Money Bank sets the minimum acceptable credit ratings, the interest rates, fees and all other terms and conditions of the customer accounts, including collection policies and procedures. As the receivables are owned by GE Money Bank, at no time are the receivables purchased or acquired from us. We are not liable to GE Money Bank for our customers’ credit defaults. In connection with all purchases financed under these arrangements, GE Money Bank pays us an amount equal to the total amount of such purchases, net of promotional related discounts, upon delivery to the customer. Customers that do not qualify for credit under our agreement with GE Money Bank may apply for credit under a secondary program that we offer through another provider.
Operations
Manufacturing and Distribution
We have two manufacturing plants, one located in Irmo, South Carolina, and the other in Salt Lake City, Utah, which distribute products in the U.S. and Canada. The manufacturing operations in South Carolina and Utah consist of quilting and sewing of the fabric covers for our beds, and final assembly and packaging of mattresses and bases. In addition, our electrical Firmness Control Systems are assembled in our Utah plant.
We manufacture beds on a just-in-time basis to fulfill orders rather than stocking inventory, which enables us to maintain lower levels of finished goods inventory and operate with limited regional warehousing. Orders are shipped, typically within 48 hours following order receipt, from our manufacturing facilities via UPS or through our company-controlled home delivery, assembly and mattress removal service. Orders are usually received by the customer within five to 14 days from the date of order.
We obtain all of the raw materials and components used to produce our beds from outside sources. A number of components, including our proprietary air chambers, our proprietary blow-molded bases, and various components for our Firmness Control Systems, as well as fabrics and zippers, are sourced from suppliers who currently serve as our sole source of supply for these components. We believe we can obtain these raw materials and components from other sources of supply, although an unexpected loss of supply over a short period of time may not allow us to replace these sources in the ordinary course of business. In 2005, we began identifying secondary sources in order to provide continuity of supply for various components. We will continue to utilize dual sourcing on targeted components when effective.
Our proprietary air chambers are produced to our specifications by an Eastern European supplier, which has been our sole source of supply of air chambers since 1994. Our agreement with this supplier runs through December 2012 and is thereafter subject to automatic annual renewal unless either party gives 365 days’ notice of its intention not to renew the agreement. We expect to continue this supplier relationship for the foreseeable future.
Our proprietary blow-molded bases are produced to our specifications by a single domestic supplier under an agreement that expires in December 2012. We expect to continue this supplier relationship for the foreseeable future.
All of the suppliers that produce unique or proprietary products for us have in place either contingency or disaster recovery plans or redundant production capabilities in other locations in order to safeguard against any unforeseen disasters. We review these plans and sites on a regular basis to ensure the supplier’s ability to maintain an uninterrupted supply of materials and components.
Home Delivery Service
Select Comfort’s home delivery, assembly and mattress removal service has contributed to improving the overall customer experience. Our home delivery technicians can effectively communicate the benefits of the bed, reinforcing the sales process and helping to ensure satisfied customers. In some markets on the East Coast, we provide home delivery, assembly and mattress removal services through a third-party provider. Approximately 58% of beds sold through our company-owned channels in 2010 were delivered by our full-service home delivery team or by our third-party provider.
In 2003, we expanded the availability of our company-controlled delivery, assembly and removal services to all of our retail markets. In 2007, we continued improving our home delivery efficiency and service by consolidating over 100 individually managed cross-dock distribution locations into a Hub and Spoke network organized around regional hubs. At the end of 2010, we operated 11 regional hubs.
Customer Service
We maintain an in-house customer service department staffed by customer service specialists who receive extensive training in sleep technology and all aspects of our products and operations. Our customer service specialists field customer calls and also interact with each of our retail stores to address customer questions and concerns. Our customer service team is part of our total quality process, facilitating early identification of emerging trends or issues. They coordinate with engineering, sourcing, manufacturing, and our Six Sigma team to segment these issues, implement immediate solutions and provide inputs for long-term improvements to product and service design.
Research and Development
Our research and development team continuously seeks to improve product performance and benefits based on sleep science. Through customer surveys and consumer focus groups, we seek feedback on a regular basis to enhance our products. Since the introduction of our first bed, we have continued to improve and expand our product line, including new bed models, quieter and higher quality Firmness Control Systems, wireless remote controls, more luxurious fabrics and covers, and new generations of foams and base systems. Our research and development expenses were $2.1 million in 2010, $2.0 million in 2009 and $3.4 million in 2008.
Information Systems
We use information technology systems to operate, analyze and manage our business, to reduce operating costs and to enhance our customers’ experience. Our major systems include an in-store point of sale system, a retail portal system, in-bound and out-bound telecommunications systems for direct marketing and customer service, E-Commerce systems, a data warehouse system and an enterprise resource planning system. These systems are comprised of both packaged applications licensed from various software vendors and internally developed programs. Our production data center is located in our corporate headquarters with redundant environmental systems.
Intellectual Property
We hold various U.S. and foreign patents and patent applications regarding certain elements of the design and function of our products, including air control systems, remote control systems, air chamber features, border wall and corner piece systems, foundation systems, as well as other technology. We have 19 issued U.S. patents, expiring at various dates between December 2011 and June 2022, and three U.S. patent applications pending. We also hold 35 foreign patents and have nine foreign patent applications pending. Notwithstanding these patents and patent applications, we cannot ensure that these patent rights will provide substantial protection or that others will not be able to develop products that are similar to or competitive with our products. To our knowledge, no third party has asserted a claim against us alleging that any element of our product infringes or otherwise violates any intellectual property rights of any third party.
“Select Comfort” and “Sleep Number” are trademarks registered with the U.S. Patent and Trademark Office. We have a number of other registered trademarks including the double arrow logo, “Select Comfort” with the double arrow logo, “Select Comfort Creator of the Sleep Number Bed” with the double arrow logo, “The Sleep Number Bed by Select Comfort” with the double arrow logo and “What’s Your Sleep Number?” Several of these trademarks have been registered, or are the subject of pending applications, in various foreign countries. Each registered mark is renewable indefinitely as long as the mark remains in use. We are not aware of any material claims of infringement or other challenges asserted against us or our right to use these marks.
Industry and Competition
The U.S. bedding manufacturing industry is a mature and generally stable industry. According to the International Sleep Products Association (“ISPA”), since 1984 the industry has consistently demonstrated growth on a dollar basis, with a 0.3% decline in 2001, 9.1% decline in 2008 and 9.0% decline in 2009 being the only exceptions. According to ISPA, industry wholesale shipments of mattresses and foundations were estimated to be $6.0 billion in 2010, a 6.6% increase compared to $5.7 billion in 2009. We estimate that traditional innerspring mattresses represent approximately 78% of total U.S. bedding sales (based on 2009 sales). Furniture/Today, a furniture industry trade publication, has ranked Select Comfort as the fifth largest mattress manufacturer and third largest U.S. bedding retailer for 2009, with a 4.2% market share of industry revenue and 1.4% market share of industry units.
Over the 5-year, 10-year and 20-year periods ended 2010, the value of U.S. wholesale bedding shipments (decreased)/increased at compound annual growth rates of (2.3%), 2.8% and 4.8%, respectively. We believe that industry unit growth has been primarily driven by population growth, and an increase in the number of homes (including secondary residences) and the increased size of homes. We believe growth in average wholesale prices resulted from a shift to both larger and higher quality beds, which are typically more expensive.
The bedding industry is very competitive. Participants in the bedding industry compete primarily on price, quality, brand name recognition, product availability and product performance, including the perceived levels of comfort and support provided by a mattress. There is a high degree of concentration among the three largest manufacturers of innerspring bedding with nationally recognized brand names, including Sealy, which also owns the Stearns & Foster brand name, Serta, and Simmons. Numerous other manufacturers, primarily operating on a regional or niche basis, serve the balance of the innerspring bedding market. Tempur-Pedic International, Inc., the fourth largest bedding manufacturer (based on 2009 sales), and a number of other mattress manufacturers, offer foam mattress products. Simmons and Sealy, as well as a number of smaller manufacturers, have offered air-bed products in recent years. The bedding retailer business is also highly competitive. Our distribution channels, including our retail stores, compete against regional and local specialty bedding retailers, home furnishing stores, mass merchants and national discount stores. We compete principally on the differentiation and quality of our products, customer service and value pricing.
Governmental Regulation and Environmental Matters
Our operations are subject to federal and state consumer protection and other regulations relating to the bedding industry. These regulations vary among the jurisdictions in which we do business, but generally impose requirements as to the proper labeling of bedding merchandise.
The bedding industry is subject to federal fire retardancy standards developed by the U.S. Consumer Product Safety Commission, which became effective nationwide in July 2007. Compliance with these requirements has increased the cost and complexity of manufacturing our products. These regulations also result in higher product development costs as new products must undergo rigorous flammability testing.
Federal regulations adopted in 2010 restrict the types of credit-based promotional offerings that retailers are allowed to make available to consumers.
Our direct marketing and E-Commerce operations are or may become subject to various adopted or proposed federal and state “do not call” and “do not mail” list requirements, limiting our ability to market our products directly to consumers over the telephone, by e-mail or by regular mail.
We are subject to emerging federal, state and foreign data privacy regulations related to the safeguarding of sensitive customer and employee data, which may drive increased costs in our information systems infrastructure.
We are subject to federal, state and foreign labor laws, including but not limited to laws relating to occupational health and safety, employee privacy, wages and hours, overtime pay, harassment and discrimination, equal opportunity, and employee leaves and benefits.
We are subject to federal and state laws and regulations relating to pollution and environmental protection. We will also be subject to similar laws in foreign jurisdictions if we further expand distribution of our products internationally.
Our retail pricing policies and practices are subject to antitrust regulations in the U.S., Canada, Australia, New Zealand and other jurisdictions where we may sell our products in the future.
Although we believe that we are in compliance in all material respects with these regulations and have implemented a variety of measures to promote continuing compliance, regulations may change over time and we may be required to incur expenses and/or to modify our operations in order to ensure compliance with these regulations, which could harm our profitability and financial condition. If we are found to be in violation of any of the foregoing laws or regulations, we could become subject to fines, penalties, damages or other sanctions, as well as potential adverse public relations, which could adversely impact our business, reputation, sales, profitability and financial condition.
We are not aware of any national or local provisions which have been enacted regulating the discharge of materials into the environment, or otherwise relating to the protection of the environment, that have materially affected, or will materially affect, our net income or competitive position, or will result in material capital expenditures. During fiscal 2010, there were no material capital expenditures for environmental control facilities and no such material expenditures are anticipated.
Customers
No single customer accounts for 10% or more of our net sales. The loss of distribution through QVC, however, could adversely impact our sales and profitability.
Seasonality
Our business is modestly impacted by seasonal influences inherent in the U.S. bedding industry and general retail shopping patterns. The U.S. bedding industry generally experiences lower sales in the second quarter and increased sales during selected holiday or promotional periods.
Working Capital
Selling direct to our customers, with a just-in-time, build-to-order production process in our plants, and with stores that serve primarily as showrooms, allows us to maintain low inventory levels and operate with minimal working capital requirements. We have historically generated sufficient cash flows to self-fund operations through an accelerated cash-conversion cycle. As of January 1, 2011, we had $3.0 million in letters of credit outstanding under our credit facility, with an additional $17.0 million available under the $20.0 million credit facility.
Employees
At January 1, 2011, we employed 2,165 persons, including 1,265 retail sales and support employees, 128 direct marketing and customer service employees, 559 manufacturing and logistics employees, and 213 management and administrative employees. Approximately 112 of our employees were employed on a part-time basis at January 1, 2011. Except for managerial employees and professional support staff, all of our employees are paid on an hourly basis plus commissions for sales professionals. None of our employees is represented by a labor union or covered by a collective bargaining agreement. In recent periods we have focused on and improved our employee engagement levels, which we believe is important to driving both organizational productivity and employee satisfaction.
Executive Officers of the Registrant
William R. McLaughlin, 54, joined our Company in March 2000 as President and Chief Executive Officer. Mr. McLaughlin also served as Chairman of our Board of Directors from May 2004 to February 2008. From December 1988 to March 2000, Mr. McLaughlin served as an executive of PepsiCo Foods International, Inc., a snack food company and subsidiary of PepsiCo, Inc., in various capacities, including from September 1996 to March 2000 as President of Frito-Lay Europe, Middle East and Africa, and from June 1993 to June 1996 as President of Grupo Gamesa, S.A. de C.V., a cookie and flour company based in Mexico. Mr. McLaughlin serves on the boards of Select Comfort, Orion Safety Products, Minnesota Public Radio, Carleton College, The Division of Sleep Medicine at Harvard Medical School and the Museum of Russian Art. He is an Aspen Institute Crown Fellow.
Shelly R. Ibach, 51, has served as Executive Vice President, Sales & Merchandising since October 2008. Ms. Ibach joined Select Comfort as Senior Vice President, U.S. Sales - Company Owned Channels in April 2007. From 1982 to 2007, she held various leadership positions within Marshall Field’s Department Stores - Target Corporation. From 2004 to 2007, Ms. Ibach served as Senior Vice President and General Merchandise Manager for the Home division, within Macy’s North, formally Marshall Field's. Other key positions included Vice President - Divisional Merchandise Manager, Director of Planning and Regional Director of Stores.
Mark A. Kimball, 52, has served as Senior Vice President, General Counsel, Chief Administrative Officer and Secretary since May 1999. From July 2000 to August 2003, Mr. Kimball also assumed responsibility for the Company’s human resources function. For more than five years prior to joining us, Mr. Kimball was a partner in the law firm of Oppenheimer Wolff & Donnelly LLP practicing in the area of corporate finance.
James C. Raabe, 50, has served as Senior Vice President and Chief Financial Officer since April 1999. From September 1997 to April 1999, Mr. Raabe served as our Controller. From May 1992 to September 1997, he served as Vice President – Finance of ValueRx, Inc., a pharmacy benefit management provider. Mr. Raabe held various positions with KPMG LLP from August 1982 to May 1992.
Karen R. Richard, 40, has served as Senior Vice President, Chief Human Resource & Strategy Officer for Select Comfort Corporation since March 2009. From January 2006 through February 2009, Ms. Richard served as Vice President, Human Resources and prior to that she served as Vice President, Finance supporting Select Comfort’s Consumer Channels and Marketing. Ms. Richard also held a variety of positions in the Company’s finance department after joining Select Comfort in May of 1996. From 1993 to 1996, Ms. Richard held various accounting positions with TCF Mortgage Corporation, an affiliate of TCF Financial Corporation.
Kathryn V. Roedel, 50, has served as Executive Vice President, Product and Service since October 2008. Ms. Roedel joined our Company as Senior Vice President, Global Supply Chain in April 2005. From 1983 to 2005, she held leadership positions within two divisions of General Electric Company, in Sourcing, Manufacturing, Quality and Service. From 2003 to March 2005, Ms. Roedel served as the General Manager, Global Supply Chain Strategy for GE Medical Systems. Other key positions included General Manager, Global Quality and Six Sigma; Vice President – Technical Operations and Director/Vice President – Quality Programs for GE Clinical Services, a division of GE Medical Systems.
Wendy L. Schoppert, 44, has served as Senior Vice President and Chief Information Officer since March 2008, and added Chief Marketing Officer to her responsibilities in January 2011 until such time as a permanent Chief Marketing Officer is identified. She joined our Company in April 2005 and previously served as Senior Vice President – New Channel Development and International. From 2002 to March 2005, Ms. Schoppert led various departments within U.S. Bancorp Asset Management, most recently serving as Head of Private Asset Management and Marketing. From 1996 to 2000, she held several positions with America West Holdings Corporation, including Vice President of America West Vacations and head of the airline’s Reservations division. Prior to 1996, Ms. Schoppert held various finance-related positions at both Northwest Airlines and American Airlines. Ms. Schoppert serves on the board of the Children’s Theatre Company.
Tim Werner, 47, had served as Senior Vice President and Chief Marketing Officer since March 2009. Effective January 2011, Tim relinquished the duties of Chief Marketing Officer and is currently serving as Senior Vice President, Marketing Advisor. From October 2008 through February 2009 he served as Vice President, Marketing. Mr. Werner served as Vice President, Direct and E-Commerce from October 2007 to September 2008 and as Vice President, Retail Partners developing our Wholesale business from October 2002 to July 2006. Mr. Werner also held a variety of positions in our Direct Marketing business channel after joining us in May 1996. From 1986 to 1996, Mr. Werner held marketing positions with L.L. Bean, Inc. and Fingerhut Corporation.
Available Information
We are subject to the reporting requirements of the Exchange Act and its rules and regulations. The Exchange Act requires us to file reports, proxy statements and other information with the Securities and Exchange Commission (“SEC”). Copies of our reports, proxy statements and other information can be read and copied at:
SEC Public Reference Room
100 F Street NE
Washington, D.C. 20549
Information on the operation of the Public Reference Room may be obtained by calling the SEC at 1-800-SEC-0330. The SEC maintains a Web site that contains reports, proxy statements and other information regarding issuers that file electronically with the SEC. These materials may be obtained electronically by accessing the SEC’s home page at http://www.sec.gov.
Our corporate Internet Web site is http://www.selectcomfort.com. Through a link to a third-party content provider, our corporate Web site provides free access to our annual reports on Form 10-K, quarterly reports on Form 10-Q, current reports on Form 8-K and all amendments to those reports filed or furnished pursuant to Section 13(a) or 15(d) of the Securities Exchange Act of 1934 as soon as reasonably practicable after electronic filing with the SEC. These documents are posted on our Web site at www.selectcomfort.com — select the “About Us” link and then the “Investor Relations” link. The information contained on our Web site or connected to our Web site is not incorporated by reference into this Form 10-K and should not be considered part of this report.
We also make available, free of charge on our Web site, the charters of the Audit Committee, Management Development and Compensation Committee, and Corporate Governance and Nominating Committee as well as our Code of Business Conduct (including any amendment to, or waiver from, a provision of our Code of Business Conduct) adopted by our Board. These documents are posted on our Web site — select the “Investor Relations” link and then the “Corporate Governance” link.
Copies of any of the above referenced information will also be made available, free of charge, upon written request to:
Select Comfort Corporation
Investor Relations Department
9800 59th Avenue North
Minneapolis, MN 55442
ITEM 1A. RISK FACTORS
An investment in our common stock involves a high degree of risk. You should carefully consider the specific risks set forth below and other matters described in this Annual Report on Form 10-K before making an investment decision. The risks and uncertainties described below are not the only ones facing us. Additional risks and uncertainties, including risks and uncertainties not presently known to us or that we currently see as immaterial, may also harm our business. If any of these risks occur, our business, results of operations, cash flows and financial condition could be materially and adversely affected.
Current and future economic conditions could materially adversely affect our sales, profitability, cash flows and financial condition.
The success of our business model depends to a significant extent upon discretionary consumer spending, which is influenced by a number of general economic factors, including without limitation consumer confidence, the housing market, employment levels, interest rates, inflation and taxation and the level of customer traffic in malls and shopping centers. Adverse trends in any of these economic indicators may adversely affect our sales, profitability, cash flows and financial condition.
A reduction in the availability of credit to consumers generally or under our existing consumer credit programs could harm our sales, profitability, cash flows and financial condition.
A significant percentage of our sales are made under consumer credit programs through third parties. The recent economic downturn resulted in a reduction of credit available to consumers as macroeconomic factors impacted the financial position of consumers and as suppliers of credit adjusted their lending criteria. In addition, changes in federal regulations effective in 2010 placed additional restrictions on all consumer credit programs, including limiting the types of promotional credit offerings that may be offered to consumers.
GE Money Bank provides credit to our customers through a private label credit card program that expires on February 15, 2012, subject to earlier termination upon certain events and subject to automatic extensions. GE Money Bank has discretion to set minimum credit standards under which credit is extended to customers.
Reduction of credit availability due to changing economic conditions, changes in credit standards under our private label credit card program or changes in regulatory requirements, or the termination of our agreement with GE Money Bank, could harm our sales, profitability, cash flows and financial condition.
Our future growth and profitability depends upon the effectiveness and efficiency of our marketing programs.
We are highly dependent on the effectiveness of our marketing messages and the efficiency of our advertising expenditures in generating consumer awareness and sales of our products. In recent periods, including in particular 2007 and 2008, our marketing messages were not as effective as in prior periods. We continue to evolve our marketing strategies, adjusting our messages, the amount we spend on advertising and where we spend it, and no assurance can be given that we will be successful in developing effective messages and in achieving efficiency in our advertising expenditures.
We also believe that consumers are increasingly using the Internet as a part of their shopping experience. As a result, our future growth and profitability will depend in part on (i) the effectiveness and efficiency of our on-line advertising and search optimization programs in generating consumer awareness and sales of our products, (ii) our ability to prevent confusion among consumers that can result from search engines that allow competitors to use or bid on our trademarks to direct consumers to competitors’ websites, and (iii) our ability to prevent internet publication of false or misleading information regarding our products or our competitors’ products.
If our marketing messages are ineffective or our advertising expenditures and other marketing programs, including internet-based programs, are inefficient in creating awareness of our products and brand name, driving consumer traffic to our points of distribution and motivating consumers to purchase our products, our sales, profitability, cash flows and financial condition may be adversely impacted.
Our future growth and profitability depends on our ability to execute our retail store distribution strategy.
Our company-controlled retail store distribution channel is our largest distribution channel and represents our largest opportunity for growth in sales and improvement in profitability. Our stores carry significant fixed costs. We are highly dependent on our ability to maintain and increase sales per store to improve our operating margins.
Our stores are largely mall-based. We depend on the continued popularity of malls as shopping destinations and the ability of mall anchor tenants and other attractions to generate customer traffic for our retail stores. Any decrease in mall traffic could adversely affect our sales, profitability, cash flows and financial condition.
In 2009 we evolved our retail strategy, closing 72 stores to increase trade area per store and discontinued selling through traditional mattress retailers to drive more customers to our company-controlled channels. This strategy is designed to improve our customer experience by utilizing our company-controlled sales process and to improve profitability by driving a greater number of sales through a smaller base of stores. If we are unable to capture sales from these larger trade areas or to improve the overall customer experience, our sales and profitability may be negatively impacted.
Our longer term retail store distribution strategy is also dependent on our ability to renew existing store leases and to secure suitable locations for new store openings, in each case on a cost-effective basis. We may encounter higher than anticipated rents and other costs in connection with managing our retail store base, or may be unable to find or obtain suitable new locations.
A failure to achieve and maintain a high level of product quality could negatively impact our sales, profitability, cash flows and financial condition.
Our products represent a significant departure from traditional innerspring mattresses, which have no moving parts and do not rely on electronics and air control systems. As a result, our beds may be susceptible to failures that do not exist with traditional mattresses. A failure to achieve and maintain acceptable quality standards could impact consumer acceptance of our products or could result in negative media and internet reports or owner dissatisfaction that could negatively impact our brand image and sales levels.
In addition, a decline in product quality could result in an increase in return rates and a corresponding decrease in sales, or an increase in product warranty claims in excess of our warranty reserves. An unexpected increase in return rates or warranty claims could harm our sales, profitability, cash flows and financial condition.
As a consumer products company, we face an inherent risk of exposure to product liability claims in the event that the use of any of our products is alleged to have resulted in personal injury or property damage. In the event that any of our products proves to be defective, we may be required to recall or redesign such products. In 2004 and in 2008, we experienced increased returns and adverse impacts on sales, as well as product liability litigation, as a result of media reports related to the alleged propensity of our products to develop mold. We may experience additional adverse impacts on sales and additional litigation in the event any similar media reports were to occur in the future. We maintain insurance against some forms of product liability claims, but such coverage may not be adequate for liabilities actually incurred. A successful claim brought against us in excess of available insurance coverage, or any claim or product recall that results in significant adverse publicity against us, may have a material adverse effect on our sales, profitability, cash flows and financial condition.
Significant competition in our industry could adversely affect our business.
Because of the vertical integration of our business model we face significant competition with both a number of different types of mattress alternatives and a variety of retailers.
The mattress industry is characterized by a high degree of concentration among the three largest manufacturers of innerspring mattresses and the largest manufacturer of viscoelastic foam mattresses. We believe that many of our competitors have greater financial, marketing and manufacturing resources and better brand name recognition than we do and sell products through broader and more established distribution channels. A number of mattress manufacturers, including several of these larger competitors, have offered air beds that compete with our products.
Our stores and other company-controlled distribution channels compete with other retailers who often provide a wider selection of mattress alternatives than we offer. A number of these retailers also have more points of distribution and greater brand name recognition than we do.
These manufacturing and retailing competitors, or new entrants into the market, may compete aggressively and gain market share with existing or new mattress products, and may pursue or expand their presence in the air bed segment of the market. We have limited ability to anticipate the timing and scale of new product introductions, advertising campaigns or new pricing strategies by our competitors, which could inhibit our ability to retain or increase market share, or to maintain our product margins.
If we are unable to effectively compete with other bedding manufacturers and other retailers, our sales, profitability, cash flows and financial condition may be adversely impacted.
We may be unable to prevent other companies from using our technology or intellectual property in connection with the sale of competitive products.
We own various U.S. and foreign patents and patent applications related to certain elements of the design and function of our beds and related products. We also own several registered and unregistered trademarks and trademark applications, including in particular our Select Comfort and Sleep Number trademarks, which we believe have significant value and are important to the marketing of our products. Our intellectual property rights may not provide substantial protection against infringement or piracy and may not prevent our competitors from developing and marketing products that are similar to or competitive with our beds or other products. In addition, the laws of some foreign countries may not protect our intellectual property rights and confidential information to the same extent as the laws of the United States. If we are unable to protect our intellectual property, we may be unable to prevent other companies from using our technology or trademarks in connection with competitive products, which could adversely affect our sales, profitability, cash flows and financial condition.
We are not aware of any material intellectual property infringement or invalidity claims that may be asserted against us, however, it is possible that third parties, including competitors, may successfully assert such claims. The cost of defending such claims, or any resulting liability, or any failure to obtain necessary licenses on reasonable terms, may adversely impact our sales, profitability, cash flows and financial condition.
We utilize “just-in-time” manufacturing processes with minimal levels of inventory, which could leave us vulnerable to shortages in supply that may harm our ability to satisfy consumer demand and may adversely impact our sales and profitability.
We generally assemble our products after we receive orders from customers utilizing “just-in-time” manufacturing processes with minimal levels of raw materials, work in process and finished goods inventories. Lead times for ordered components may vary significantly. In addition, some components used to manufacture our products are provided on a sole source basis. Any unexpected shortage of materials caused by any disruption of supply or an unexpected increase in the demand for our products, could lead to delays in shipping our beds to customers. Any such delays could adversely affect our sales, customer satisfaction, profitability, cash flows and financial condition.
We rely upon several key suppliers that are, in some instances, the only source of supply currently used by us for particular materials, components or services. A disruption in the supply or substantial increase in cost of any of these products or services could harm our sales, profitability, cash flows and financial condition.
We currently obtain all of the materials and components used to produce our beds from outside sources. In several cases, including our proprietary air chambers, our proprietary blow-molded foundations, our adjustable foundations, various components for our Firmness Control Systems, as well as fabrics and zippers, we have chosen to obtain these materials and components from suppliers who serve as the only source of supply used by us at this time. While we believe that these materials and components, or suitable replacements, could be obtained from other sources, in the event of a disruption or loss of supply of relevant materials or components for any reason, we may not be able to find alternative sources of supply, or if found, may not be found on comparable terms. If our relationship with either the supplier of our air chambers or the supplier of our blow-molded foundations is terminated, we could have difficulty in replacing these sources since there are relatively few other suppliers presently capable of manufacturing these components.
Similarly, we rely on UPS and other carriers to deliver some of our products to customers on a timely and cost-effective basis. Any significant delay in deliveries to our customers could lead to increased returns and cause us to lose sales. Any increase in freight charges could increase our costs of doing business and harm our sales, profitability, cash flows and financial condition.
Fluctuations in commodity prices could result in an increase in component costs and/or delivery costs.
Our business is subject to significant increases or volatility in the prices of certain commodities, including but not limited to fuel, oil, natural gas, rubber, cotton, plastic resin, steel and chemical ingredients used to produce foam. Increases in prices of these commodities or other inflationary pressures may result in significant cost increases for our raw materials and product components, as well as increases in the cost of delivering our products to our customers. To the extent we are unable to offset any such increased costs through value engineering and similar initiatives, or through price increases, our profitability, cash flows and financial condition may be adversely impacted. If we choose to increase prices to offset the increased costs, our unit sales volumes could be adversely impacted.
Our business is subject to risks inherent in global sourcing activities.
Our air chambers and some of our other components are manufactured outside the United States, and therefore are subject to risks associated with foreign sourcing of materials, including but not limited to:
|
|
Ÿ
|
Political instability resulting in disruption of trade;
|
|
|
Ÿ
|
Existing or potential duties, tariffs or quotas on certain types of goods that may be imported into the United States;
|
|
|
Ÿ
|
Disruptions in transportation due to acts of terrorism, shipping delays, foreign or domestic dock strikes, customs inspections or other factors;
|
|
|
Ÿ
|
Foreign currency fluctuations; and
|
|
|
Ÿ
|
Economic uncertainties, including inflation.
|
These factors could increase our costs of doing business with foreign suppliers, lead to inadequate inventory levels or delays in shipping beds to our customers, which could harm our sales, customer satisfaction, profitability, cash flows and financial condition.
Disruption of operations in either of our two manufacturing facilities could increase our costs of doing business or lead to delays in shipping our beds.
We have two manufacturing plants, which are located in Irmo, South Carolina and in Salt Lake City, Utah. We generally manufacture beds to fulfill orders rather than stocking finished goods inventory in our plants or stores. Therefore, the disruption of operations of either of our manufacturing facilities for a significant period of time may increase our costs of doing business and lead to delays in shipping our beds to customers. Such delays could adversely affect our sales, customer satisfaction, profitability, cash flows and financial condition.
Our manufacturing and retail operations are subject to a wide variety of government regulations which could increase costs or cause disruptions to our operations.
We are subject to a wide variety of government regulations relating to the bedding industry or to various aspects of our business and operations, including without limitation; regulations relating to the proper labeling of bedding merchandise; flammability standards applicable to mattresses; environmental and product safety regulations; consumer protection and data privacy regulations; various “do not call” or “do not mail” list requirements; labor laws, including but not limited to laws relating to occupational health and safety, employee privacy, wages and hours, overtime pay, harassment and discrimination, equal opportunity, and employee leaves and benefits; and import and export regulations.
Although we believe that we are in compliance in all material respects with these regulations and have implemented a variety of measures to promote continuing compliance, regulations may change over time and we may be required to incur expenses and/or to modify our operations in order to ensure compliance with these regulations or we may be found to be in violation of the foregoing laws or regulations, which could harm our sales, profitability, cash flows and financial condition.
Regulatory requirements related to flammability standards for mattresses may increase our product costs and increase the risk of disruption to our business.
The federal Consumer Product Safety Commission adopted new flammability standards and related regulations which became effective nationwide in July 2007 for mattresses and mattress and foundation sets. Compliance with these requirements has resulted in higher materials and manufacturing costs for our products, and has required modifications to our information systems and business operations, further increasing our costs and negatively impacting our capacity.
These regulations require manufacturers to implement quality assurance programs and encourage manufacturers to conduct random testing of products. These regulations also require maintenance and retention of compliance documentation. These quality assurance and documentation requirements are costly to implement and maintain. If any product testing, other evidence, or regulatory inspections yield results indicating that any of our products may not meet the flammability standard, we may be required to temporarily cease production and distribution and/or to recall products from the field, and we may be subject to fines or penalties, any of which outcomes could harm our business, reputation, sales, profitability, cash flows and financial condition.
Our management information systems may not be adequate to meet the evolving needs of our business as well as existing and emerging regulatory requirements.
We depend on our management information systems for many aspects of our business. Our current information systems architecture includes some off-the-shelf programs as well as some key software that has been developed by our own programmers, using legacy programming languages that are no longer vendor-supported. Our business may be adversely affected if our management information systems are disrupted or if we are unable to improve, upgrade, integrate or expand our systems to meet the evolving needs of our business and existing and emerging regulatory requirements. Any failure of our systems and processes to adequately protect employee and customer information from theft or loss could adversely impact our business, reputation, sales, profitability, cash flows and financial condition.
The loss of the services of any members of our executive management team could adversely impact our ability to execute our business strategy.
We are currently dependent upon the continued services, ability and experience of our executive management team. The loss of the services of any member of our executive management team could have an adverse effect on our ability to execute our business strategy and growth initiatives and on our sales, profitability, cash flows and financial condition. Our future growth and success will also depend upon our ability to attract, retain and motivate other qualified personnel.
Our charter and corporate documents and Minnesota law make a takeover of our company more difficult and expensive, which may prevent certain changes in control and limit the market price of our common stock.
Our charter, bylaws, certain corporate documents and sections 671 and 673 of the Minnesota Business Corporation Act contain provisions that might enable our management to resist a takeover of our company or which may increase the cost of an acquisition of our company. Provisions in our amended and restated articles of incorporation and amended and restated bylaws may discourage, delay or prevent a merger or acquisition involving us that our shareholders may consider favorable. For example, our amended and restated articles of incorporation authorize five million undesignated shares. Without shareholder approval, our board of directors has the authority to create a class or series of shares from the undesignated shares and to set the terms of the class or series, including voting and dividend rights. With these rights, it could be more difficult for a third party to acquire us. In addition, our amended and restated articles of incorporation provide for a staggered board of directors, with directors serving for three-year terms and approximately one-third of the directors coming up for re-election each year. Having a staggered board will make it more difficult for a third party to obtain control of our board of directors through a proxy contest, which may be a necessary step in any acquisition of us that is not favored by our board of directors. In addition, we have a severance plan that may provide certain employees and executive officers with severance compensation if they are terminated in connection with a change in control of our company and stock award plans that provide for the acceleration of vesting of incentive stock awards upon a change in control of our company. The existence of these provisions could discourage or prevent a change in control of our company, could make a change in control of our company more difficult and expensive and could limit the price that investors might be willing to pay in the future for shares of our common stock.
Risks of certain global events, such as terrorist attacks or a pandemic outbreak, could adversely impact our sales, profitability, financial condition or stock price.
Additional terrorist attacks in the United States or against U.S. targets, or acts of war or threats of war or the escalation of current hostilities involving the United States or its allies, or military or trade disruptions impacting our domestic or foreign suppliers of components of our products, may adversely impact our operations, causing delays or losses in the delivery of merchandise to us and decreased sales. These events could also cause an increase in oil or other commodity prices, which could adversely affect our materials or transportation costs, including the costs of delivery of our products to customers.
A significant pandemic outbreak, or a perceived threat of such an outbreak, could cause significant disruptions to our supply chain, manufacturing capability and distribution system that could adversely impact our ability to produce and deliver products, which could result in a loss of sales and adversely impact our profitability, cash flows and financial condition.
Any of these events could adversely impact consumer confidence and spending or result in increased volatility in the U.S. and worldwide financial markets. These events also could cause, or deepen and prolong, an economic recession in the United States or abroad. Any of these occurrences could have an adverse impact on our sales, profitability, financial condition or stock price.
ITEM 1B. UNRESOLVED STAFF COMMENTS
None.
ITEM 2. PROPERTIES
Distribution Locations
We currently lease all of our existing retail store locations and expect that our policy of leasing, rather than owning stores, will continue. Our store leases generally provide for an initial lease term of five to seven years with a mutual termination option if we do not achieve certain minimum annual sales thresholds. Generally, the store leases require us to pay minimum rent plus percentage rent based on net sales in excess of certain thresholds, as well as certain operating expenses.
The following table summarizes the geographic location of our 386 company-owned stores and 150 retail partner doors as of January 1, 2011:
|
|
Company-
Owned
Stores
|
Retail
Partner
Doors
|
|
Company
Owned
Stores
|
Retail
Partner
Doors
|
||||||||||||
|
Alabama
|
5 | — |
Missouri
|
12 | — | ||||||||||||
|
Alaska
|
— | 3 |
Montana
|
2 | — | ||||||||||||
|
Arizona
|
11 | — |
Nebraska
|
3 | — | ||||||||||||
|
Arkansas
|
3 | — |
Nevada
|
3 | — | ||||||||||||
|
California
|
41 | — |
New Hampshire
|
4 | — | ||||||||||||
|
Colorado
|
11 | — |
New Jersey
|
12 | — | ||||||||||||
|
Connecticut
|
5 | — |
New Mexico
|
2 | — | ||||||||||||
|
Delaware
|
2 | — |
New York
|
10 | — | ||||||||||||
|
Florida
|
25 | — |
North Carolina
|
13 | — | ||||||||||||
|
Georgia
|
12 | — |
North Dakota
|
2 | — | ||||||||||||
|
Hawaii
|
— | 7 |
Ohio
|
16 | — | ||||||||||||
|
Idaho
|
1 | — |
Oklahoma
|
3 | — | ||||||||||||
|
Illinois
|
19 | — |
Oregon
|
4 | — | ||||||||||||
|
Indiana
|
12 | — |
Pennsylvania
|
19 | — | ||||||||||||
|
Iowa
|
5 | — |
South Carolina
|
4 | — | ||||||||||||
|
Kansas
|
3 | — |
South Dakota
|
2 | — | ||||||||||||
|
Kentucky
|
4 | — |
Tennessee
|
5 | — | ||||||||||||
|
Louisiana
|
5 | — |
Texas
|
30 | — | ||||||||||||
|
Maine
|
2 | — |
Utah
|
3 | — | ||||||||||||
|
Maryland
|
11 | — |
Vermont
|
1 | — | ||||||||||||
|
Massachusetts
|
4 | — |
Virginia
|
10 | — | ||||||||||||
|
Michigan
|
11 | — |
Washington
|
10 | — | ||||||||||||
|
Minnesota
|
13 | — |
Wisconsin
|
9 | — | ||||||||||||
|
Mississippi
|
2 | — |
Canada
|
— | 140 | ||||||||||||
|
Total
|
386 | 150 | |||||||||||||||
Manufacturing and Headquarters
We lease our 159,000-square-foot corporate headquarters in the Minneapolis, Minnesota area. The lease commenced in November 2007 and runs through 2017 with two five-year renewal options.
We also lease approximately 122,000 square feet in the Minneapolis, Minnesota area that includes our research and development department, and a distribution center that accepts returns, fulfills accessory orders and processes warranty claims. This lease expires in 2017 and contains one five-year renewal option.
We lease two manufacturing and distribution centers in Irmo, South Carolina and Salt Lake City, Utah of approximately 105,000 square feet and approximately 101,000 square feet, respectively. We lease the Irmo facility through February 2013, and the Salt Lake City facility through July 2015, with a five-year renewal option thereafter.
ITEM 3. LEGAL PROCEEDINGS
We are involved from time to time in various legal proceedings arising in the ordinary course of our business, including primarily commercial, product liability, employment and intellectual property claims. In accordance with generally accepted accounting principles in the United States, we record a liability in our consolidated financial statements with respect to any of these matters when it is both probable that a liability has been incurred and the amount of the liability can be reasonably estimated. At January 1, 2011, our consolidated financial statements include reserves of $1.6 million with respect to contingent liabilities that we determined to be both probable and reasonably estimable. With respect to these pending legal proceedings, we believe that we have valid defenses to claims asserted against us and we do not expect the outcome of these matters to have a material effect on our consolidated results of operations, financial position or cash flows. Litigation, however, is inherently unpredictable, and it is possible that the ultimate outcome of one or more claims asserted against us could adversely impact our results of operations, financial position or cash flows. We expense legal costs as incurred.
ITEM 4. (REMOVED AND RESERVED)
ITEM 5. MARKET FOR THE REGISTRANT’S COMMON EQUITY, RELATED STOCKHOLDER MATTERS AND ISSUER PURCHASES OF EQUITY SECURITIES
Our common stock trades on The NASDAQ Stock Market LLC (NASDAQ Global Select Market) under the symbol “SCSS.” As of January 29, 2011, there were approximately 502 holders of record of our common stock. The following table sets forth the quarterly high and low sales prices per share of our common stock as reported by NASDAQ for the two most recent fiscal years. These quotations reflect inter-dealer prices, without retail mark-up, mark-down or commission, and may not necessarily represent actual transactions.
|
Fourth
Quarter
|
Third
Quarter
|
Second
Quarter
|
First
Quarter
|
|||||||||||||
|
Fiscal 2010
|
||||||||||||||||
|
High
|
$ | 9.27 | $ | 8.82 | $ | 11.78 | $ | 8.65 | ||||||||
|
Low
|
6.64 | 4.95 | 8.09 | 6.45 | ||||||||||||
|
Fiscal 2009
|
||||||||||||||||
|
High
|
$ | 6.79 | $ | 5.00 | $ | 1.25 | $ | 0.98 | ||||||||
|
Low
|
4.76 | 0.79 | 0.55 | 0.20 | ||||||||||||
We are not restricted from paying cash dividends under our credit agreement other than customary legal and contractual restrictions. However, we have not historically paid, and have no current plans to pay, cash dividends on our common stock.
Information concerning stock repurchases completed during the fourth quarter of fiscal 2010 is set forth below:
|
Fiscal Period
|
Total Number of Shares Purchased
|
Average Price Paid per Share
|
Total Number of Shares Purchased as Part of Publicly Announced Plans or Programs (1)
|
Approximate Dollar Value of Shares that May Yet Be Purchased Under the Plans or Programs
|
||||||||||||
|
October 3, 2010 through October 30, 2010
|
— | — | — |
|
||||||||||||
|
October 31, 2010 through November 27, 2010
|
— | — | — |
|
||||||||||||
|
November 28, 2010 through January 1, 2011
|
— | — | — | $ | 206,762,000 | |||||||||||
|
Total
|
— | — | — | |||||||||||||
_____________________
|
(1)
|
On April 20, 2007, our Board of Directors authorized the Company to repurchase up to an additional $250.0 million of our common stock. As of January 1, 2011, the amount remaining under this authorization was $206.8 million. There is no expiration date with respect to this repurchase authority. We may terminate or limit the stock repurchase program at any time. We currently have no plans to repurchase shares under this authorization.
|
Comparative Stock Performance
The graph below compares the total cumulative shareholder return on our common stock over the last five years to the total cumulative return on the Standard and Poor’s (“S&P”) 400 Specialty Stores Index and The NASDAQ Stock Market (U.S.) Index assuming a $100 investment made on December 31, 2005. Each of the three measures of cumulative total return assumes reinvestment of dividends. The stock performance shown on the graph below is not necessarily indicative of future price performance. The information contained in this “Comparative Stock Performance” section shall not be deemed to be “soliciting material” or “filed” or incorporated by reference in future filings with the SEC, or subject to the liabilities of Section 18 of the Securities Exchange Act of 1934, as amended, except to the extent that we specifically request that it be treated as soliciting material or incorporate it by reference into a document filed under the Securities Act of 1933, as amended, or the Securities Exchange Act of 1934, as amended.
COMPARISON OF FIVE-YEAR CUMULATIVE TOTAL RETURN
AMONG SELECT COMFORT CORPORATION, S&P 400 SPECIALTY STORES INDEX,
AND THE NASDAQ STOCK MARKET (U.S.) INDEX
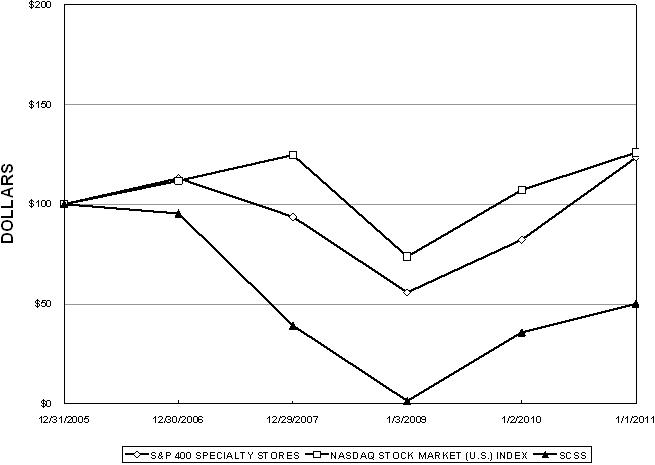
|
12/31/2005
|
12/30/2006
|
12/29/2007
|
1/3/2009
|
1/2/2010
|
1/1/2011
|
|||||||||||||||||||
|
Select Comfort Corporation
|
$ | 100 | $ | 95 | $ | 39 | $ | 1 | $ | 36 | $ | 50 | ||||||||||||
|
S&P 400 Specialty Stores Index
|
100 | 113 | 94 | 56 | 82 | 123 | ||||||||||||||||||
|
The NASDAQ Stock Market (U.S.) Index
|
100 | 112 | 125 | 74 | 107 | 126 | ||||||||||||||||||
Securities Authorized for Issuance under Equity Compensation Plans
The following table summarizes information about our equity compensation plans as of January 1, 2011:
EQUITY COMPENSATION PLAN INFORMATION
|
Plan Category
|
Number of securities to be issued upon exercise of outstanding options, warrants and rights(1)
|
Weighted average exercise price of outstanding options, warrants and rights
|
Number of securities remaining available for future issuance under equity compensation plans (excluding securities reflected in the first column)
|
|||||||||
|
Equity compensation plans approved by security holders
|
3,985,000 | $ | 11.72 | 1,952,000 | ||||||||
|
Equity compensation plans not approved by security holders
|
None
|
Not applicable
|
None
|
|||||||||
|
Total
|
3,985,000 | $ | 11.72 | 1,952,000 | ||||||||
|
(1)
|
Includes the Select Comfort Corporation 1997 Stock Incentive Plan, the Select Comfort Corporation 2004 Stock Incentive Plan and the Select Comfort Corporation 2010 Omnibus Incentive Plan.
|
ITEM 6. SELECTED FINANCIAL DATA
(in thousands, except per share and selected operating data, unless otherwise indicated)
The Consolidated Statements of Operations Data and Consolidated Balance Sheet Data presented below have been derived from our Consolidated Financial Statements and should be read in conjunction with “Management’s Discussion and Analysis of Financial Condition and Results of Operations” and our Consolidated Financial Statements and Notes thereto included in this Annual Report on Form 10-K.
|
Year
|
||||||||||||||||||||||||
|
2010
|
2009
|
2008(2)
|
2007
|
2006(1)
|
2005
|
|||||||||||||||||||
|
Consolidated Statements of Operations Data:
|
||||||||||||||||||||||||
|
Net sales
|
$ | 605,676 | $ | 544,202 | $ | 608,524 | $ | 799,242 | $ | 806,038 | $ | 689,548 | ||||||||||||
|
Gross profit
|
378,263 | 335,460 | 358,572 | 486,415 | 490,508 | 406,476 | ||||||||||||||||||
|
Operating expenses:
|
||||||||||||||||||||||||
|
Sales and marketing
|
269,901 | 259,244 | 332,068 | 372,467 | 341,630 | 286,206 | ||||||||||||||||||
|
General and administrative
|
53,572 | 49,560 | 57,994 | 64,351 | 65,401 | 49,300 | ||||||||||||||||||
|
Research and development
|
2,147 | 1,973 | 3,374 | 5,682 | 4,687 | 2,219 | ||||||||||||||||||
|
Asset impairment charges
|
260 | 686 | 34,594 | 409 | 5,980 | 162 | ||||||||||||||||||
|
Terminated equity financing costs
|
— | 3,324 | — | — | — | — | ||||||||||||||||||
|
Operating income (loss)
|
52,383 | 20,673 | (69,458 | ) | 43,506 | 72,810 | 68,589 | |||||||||||||||||
|
Net income (loss)
|
$ | 31,568 | $ | 35,552 | $ | (70,177 | ) | $ | 27,620 | $ | 47,183 | $ | 43,767 | |||||||||||
|
Net income (loss) as adjusted(6)
|
$ | 31,568 | $ | 11,169 | $ | (23,174 | ) | $ | 27,620 | $ | 50,525 | $ | 43,767 | |||||||||||
|
Net income (loss) per share:
|
||||||||||||||||||||||||
|
Basic
|
$ | 0.58 | $ | 0.78 | $ | (1.59 | ) | $ | 0.59 | $ | 0.89 | $ | 0.82 | |||||||||||
|
Diluted
|
$ | 0.57 | $ | 0.77 | $ | (1.59 | ) | $ | 0.57 | $ | 0.85 | $ | 0.76 | |||||||||||
|
Diluted – as adjusted(6)
|
$ | 0.57 | $ | 0.24 | $ | (0.52 | ) | $ | 0.57 | $ | 0.91 | $ | 0.76 | |||||||||||
|
Shares used in calculation of net income (loss) per share:
|
||||||||||||||||||||||||
|
Basic
|
54,005 | 45,682 | 44,186 | 46,536 | 52,837 | 53,357 | ||||||||||||||||||
|
Diluted
|
55,264 | 46,198 | 44,186 | 48,292 | 55,587 | 57,674 | ||||||||||||||||||
|
Consolidated Balance Sheet Data:
|
||||||||||||||||||||||||
|
Cash, cash equivalents and marketable debt securities
|
$ | 81,361 | $ | 17,717 | $ | 13,057 | $ | 7,279 | $ | 90,175 | $ | 123,091 | ||||||||||||
|
Working capital
|
20,053 | (25,435 | ) | (90,534 | ) | (70,000 | ) | 5,637 | 10,158 | |||||||||||||||
|
Total assets
|
169,957 | 118,240 | 135,413 | 190,489 | 228,961 | 239,838 | ||||||||||||||||||
|
Borrowings under revolving credit facility
|
— | — | 79,150 | 37,890 | — | — | ||||||||||||||||||
|
Total shareholders’ equity (deficit)
|
57,977 | 22,458 | (41,630 | ) | 24,126 | 115,694 | 121,347 | |||||||||||||||||
|
Selected Operating Data:
|
||||||||||||||||||||||||
|
Stores open at period-end
|
386 | 403 | 471 | 478 | 442 | 396 | ||||||||||||||||||
|
Stores opened during period
|
7 | 4 | 19 | 45 | 51 | 40 | ||||||||||||||||||
|
Stores closed during period
|
24 | 72 | 26 | 9 | 5 | 14 | ||||||||||||||||||
|
Retail partner doors(3)
|
150 | 146 | 801 | 891 | 822 | 353 | ||||||||||||||||||
|
Average net sales per store (000’s)(4)
|
$ | 1,295 | $ | 1,046 | $ | 984 | $ | 1,318 | $ | 1,493 | $ | 1,417 | ||||||||||||
|
Percentage of stores with more than $1.0 million in net sales(4)
|
70 | % | 48 | % | 45 | % | 73 | % | 81 | % | 77 | % | ||||||||||||
|
Comparable-store sales increase (decrease)(5)
|
21 | % | 0 | % | (25 | %) | (11 | %) | 7 | % | 15 | % | ||||||||||||
|
Average square footage per store open during period(4)
|
1,484 | 1,474 | 1,410 | 1,315 | 1,200 | 1,121 | ||||||||||||||||||
|
Net sales per square foot(4)
|
$ | 873 | $ | 710 | $ | 703 | $ | 1,024 | $ | 1,244 | $ | 1,264 | ||||||||||||
|
Average store age (in months at period end)
|
113 | 102 | 91 | 84 | 81 | 79 | ||||||||||||||||||
|
Earnings before interest, depreciation and amortization (“EBITDA”) (6)
|
$ | 69,675 | $ | 42,289 | $ | (9,437 | ) | $ | 75,768 | $ | 109,821 | $ | 87,465 | |||||||||||
|
Free cash flows(6)
|
$ | 63,870 | $ | 64,180 | $ | (29,229 | ) | $ | 517 | $ | 28,297 | $ | 61,658 | |||||||||||
|
(1)
|
In the first quarter of fiscal 2006, we adopted the fair value recognition method for our stock-based compensation awards. We elected the modified prospective transition method and, accordingly, financial results for fiscal years prior to 2006 have not been restated. Stock-based compensation expense for fiscal 2010, 2009, 2008, 2007 and 2006 was $3,962, $3,236, $3,702, $6,252 and $8,325, respectively. Prior to the adoption of the fair value recognition method, we followed the intrinsic value method to account for our employee stock options and employee stock purchase plan. Accordingly, no compensation expense was recognized for share purchase rights granted in connection with the issuance of stock options under our employee stock option plan or employee stock purchase plan; however, compensation expense was recognized in connection with the issuance of restricted and performance shares granted. See Note 7 of the Notes to the Consolidated Financial Statements for additional information regarding stock-based compensation. In 2005, prior to the adoption of the fair value recognition method, we recognized $793 of stock-based compensation expense (pre-tax).
|
|
(2)
|
Fiscal year 2008 had 53 weeks. All other fiscal years presented had 52 weeks.
|
|
(3)
|
In August 2009, we announced our decision to discontinue distribution through non-company owned mattress retailers in the contiguous United States.
|
|
(4)
|
For stores open during the entire period indicated.
|
|
(5)
|
Stores are included in the comparable-store calculation in the 13th full month of operation. Stores that have been remodeled or relocated within the same shopping center remain in the comparable-store base. The number of comparable-stores used to calculate such data was 379, 399, 452, 432, 391 and 354 for 2010, 2009, 2008, 2007, 2006 and 2005, respectively. Fiscal 2008 included 53 weeks, as compared to 52 weeks for the other periods presented. Comparable-store sales have been adjusted and reported as if all years had the same number of weeks.
|
|
(6)
|
These non-GAAP measures are not in accordance with, or preferable to, GAAP financial data. However, we are providing this information as we believe it facilitates annual and year-over-year comparisons for investors and financial analysts. See page 25 and 26 for the reconciliation of these non-GAAP measures to the appropriate GAAP measure.
|
Non-GAAP Data Reconciliations
Reported to Adjusted Statements of Operations
(in thousands, except per share amounts)
In addition to disclosing results that are determined in accordance with GAAP, we also disclose non-GAAP results that exclude certain significant charges or credits that are important to an understanding of our ongoing operations. We have provided reconciliations of our non-GAAP measures to the most comparable GAAP measures. We believe that discussion of results excluding certain significant charges or credits provides additional insights into underlying business performance. Adjusted earnings per share is not a measure recognized under GAAP. The determination of significant charges or credits may not be comparable to similarly titled measures used by other companies.
|
Year
|
||||||||||||||||||||||||
|
2010
|
2009
|
2008
|
2007
|
2006
|
2005
|
|||||||||||||||||||
|
Net income (loss) – as reported
|
$ | 31,568 | $ | 35,552 | $ | (70,177 | ) | $ | 27,620 | $ | 47,183 | $ | 43,767 | |||||||||||
|
Adjustments – net of income tax (1)
|
||||||||||||||||||||||||
|
Terminated equity financing costs (2)
|
— | 2,061 | — | — | — | — | ||||||||||||||||||
|
Impairments (3)
|
— | — | 20,163 | — | 3,342 | — | ||||||||||||||||||
|
Income tax valuation (4)
|
— | (26,444 | ) | 26,840 | — | — | — | |||||||||||||||||
|
Net income (loss) – as adjusted
|
$ | 31,568 | $ | 11,169 | $ | (23,174 | ) | $ | 27,620 | $ | 50,525 | $ | 43,767 | |||||||||||
|
Net income (loss) per share – as adjusted:
|
||||||||||||||||||||||||
|
Basic
|
0.58 | 0.24 | (0.52 | ) | 0.59 | 0.96 | 0.82 | |||||||||||||||||
|
Diluted
|
0.57 | 0.24 | (0.52 | ) | 0.57 | 0.91 | 0.76 | |||||||||||||||||
|
Basic shares
|
54,005 | 45,682 | 44,186 | 46,536 | 52,837 | 53,357 | ||||||||||||||||||
|
Diluted shares
|
55,264 | 46,198 | 44,186 | 48.292 | 55,587 | 57,674 | ||||||||||||||||||
|
(1)
|
Reflects annual effective tax rates, before discrete adjustments, of 38.0%, 40.0% and 37.8% for the fiscal years ended January 2, 2010; January 3, 2009; and December 30, 2006, respectively.
|
|
(2)
|
For the fiscal year ended January 2, 2010, we expensed $3.3 million ($2.1 million, net of income tax) of direct, incremental costs incurred in connection with a terminated equity financing transaction.
|
|
(3)
|
Fiscal year ended January 3, 2009 includes impairment charges for the abandonment of our plan to implement SAP®-based applications and impairment charges in excess of $1.0 million for underperforming stores. Fiscal year ended December 30, 2006 includes impairment charges for the abandonment of software projects in connection with our decision to implement an SAP enterprise resource planning system.
|
|
(4)
|
For the fiscal year ended January 3, 2009, we established a $26.8 million valuation allowance against deferred taxes based on uncertainty regarding future taxable income. For the fiscal year ended January 2, 2010, we reversed the valuation allowance against deferred taxes based on all available positive and negative evidence.
|
|
Note -
|
Our “as adjusted” data is considered a non-GAAP financial measure and is not in accordance with, or preferable to, “as reported,” or GAAP financial data. However, we are providing this information as we believe it facilitates annual and year-over-year comparisons for investors and financial analysts.
|
|
GAAP -
|
generally accepted accounting principles
|
Non-GAAP Data Reconciliations (continued)
Earnings before Interest, Taxes, Depreciation and Amortization (EBITDA)
(in thousands)
We define earnings before interest, taxes, depreciation and amortization (“EBITDA”) as net income (loss) plus: income tax expense (benefit), interest expense, depreciation and amortization, stock-based compensation and asset impairments consistent with the definition used in our debt covenant calculations. Management believes EBITDA is a useful indicator of our financial performance. Our definition of EBITDA may not be comparable to similarly titled definitions used by other companies. The tables below reconcile EBITDA, which is a non-GAAP financial measure, to comparable GAAP financial measures.
|
|
Year
|
|||||||||||||||||||||||
|
|
2010
|
2009
|
2008
|
2007
|
2006
|
2005
|
||||||||||||||||||
|
|
|
|
|
|
||||||||||||||||||||
|
Net income (loss)
|
$ | 31,568 | $ | 35,552 | $ | (70,177 | ) | $ | 27,620 | $ | 47,183 | $ | 43,767 | |||||||||||
|
Income tax expense (benefit)
|
18,922 | (20,862 | ) | (2,566 | ) | 15,846 | 28,645 | 26,996 | ||||||||||||||||
|
Interest expense
|
1,951 | 5,996 | 3,375 | 849 | 4 | — | ||||||||||||||||||
|
Depreciation and amortization
|
13,012 | 17,681 | 21,635 | 24,792 | 19,684 | 15,747 | ||||||||||||||||||
|
Stock-based compensation
|
3,962 | 3,236 | 3,702 | 6,252 | 8,325 | 793 | ||||||||||||||||||
|
Asset impairments
|
260 | 686 | 34,594 | 409 | 5,980 | 162 | ||||||||||||||||||
|
EBITDA
|
$ | 69,675 | $ | 42,289 | $ | (9,437 | ) | $ | 75,768 | $ | 109,821 | $ | 87,465 | |||||||||||
Free Cash Flows
(in thousands)
Our “free cash flows” data is considered a non-GAAP financial measure and is not in accordance with, or preferable to, “net cash provided by operations,” or GAAP financial data. However, we are providing this information as we believe it facilitates analysis for investors and financial analysts.
|
|
Year
|
|||||||||||||||||||||||
|
|
2010
|
2009
|
2008
|
2007
|
2006
|
2005
|
||||||||||||||||||
|
|
|
|
|
|
||||||||||||||||||||
|
Net cash provided by operating activities
|
$ | 71,219 | $ | 66,639 | $ | 2,973 | $ | 44,031 | $ | 59,376 | $ | 87,498 | ||||||||||||
|
Subtract: Purchases of property and equipment
|
7,349 | 2,459 | 32,202 | 43,514 | 31,079 | 25,840 | ||||||||||||||||||
|
Free cash flows
|
$ | 63,870 | $ | 64,180 | $ | (29,229 | ) | $ | 517 | $ | 28,297 | $ | 61,658 | |||||||||||
ITEM 7. MANAGEMENT’S DISCUSSION AND ANALYSIS OF FINANCIAL CONDITION AND RESULTS OF OPERATIONS
Forward-Looking Statements
The discussion in this Annual Report contains certain forward-looking statements that relate to future plans, events, financial results or performance. You can identify forward-looking statements by those that are not historical in nature, particularly those that use terminology such as “may,” “will,” “should,” “could,” “expect,” “anticipate,” “believe,” “estimate,” “plan,” “project,” “predict,” “intend,” “potential,” “continue” or the negative of these or similar terms. These statements are subject to certain risks and uncertainties that could cause actual results to differ materially from our historical experience and our present expectations or projections. These risks and uncertainties include, among others:
|
•
|
Current and future general and industry economic trends and consumer confidence;
|
|
•
|
Availability of attractive and cost-effective consumer credit options;
|
|
•
|
The effectiveness of our marketing messages;
|
|
•
|
The efficiency of our advertising and promotional efforts;
|
|
•
|
Our ability to execute our retail distribution strategy, including our ability to cost-effectively close under-performing store locations and to find suitable new store locations;
|
|
•
|
Our ability to continue to improve our product line and service levels, and consumer acceptance of our products, product quality, innovation and brand image;
|
|
•
|
Our ability to achieve and maintain acceptable levels of product quality and acceptable product return and warranty claims rates;
|
|
•
|
Pending and potentially unforeseen litigation;
|
|
•
|
Industry competition and the adequacy of our intellectual property rights to protect our products and brand from competitive or infringing activities;
|
|
•
|
Our “just-in-time” manufacturing processes with minimal levels of inventory, which may leave us vulnerable to shortages in supply;
|
|
•
|
Our dependence on significant suppliers and our ability to maintain relationships with key suppliers, including several sole source suppliers;
|
|
•
|
Rising commodity costs and other inflationary pressures;
|
|
•
|
Risks inherent in global sourcing activities;
|
|
•
|
Risks of disruption in the operations of either of our two manufacturing facilities;
|
|
•
|
Increasing government regulations, including flammability standards for the bedding industry;
|
|
•
|
The adequacy of our management information systems to meet the evolving needs of our business and existing and evolving regulatory standards applicable to data privacy and security;
|
|
•
|
Our ability to attract and retain senior leadership and other key employees, including qualified sales professionals; and
|
|
•
|
Global events, such as terrorist attacks or a pandemic outbreak, or the threat of such events.
|
Additional information concerning these and other risks and uncertainties is contained under the caption “Risk Factors” in this Annual Report on Form 10-K.
Management’s Discussion and Analysis of Financial Condition and Results of Operations (“MD&A”) is intended to provide a reader of our financial statements with a narrative from the perspective of management on our financial condition, results of operations, liquidity and certain other factors that may affect our future results. Our MD&A is presented in six sections:
|
|
•
|
Overview
|
|
|
•
|
Results of Operations
|
|
|
•
|
Liquidity and Capital Resources
|
|
|
•
|
Off-Balance-Sheet Arrangements and Contractual Obligations
|
|
|
•
|
Critical Accounting Policies and Estimates
|
|
|
•
|
Recent Accounting Pronouncements
|
Overview
Business Overview
Select Comfort designs, manufactures, markets and supports a line of adjustable-firmness mattresses featuring air-chamber technology. The air-chamber technology of our proprietary Sleep Number® bed allows adjustable firmness on each side of the mattress and provides a sleep surface that is clinically proven to provide better sleep quality and greater relief of back pain compared to traditional mattress products. In addition, we market and sell accessories and other sleep-related products which focus on providing personalized comfort to complement the Sleep Number bed and provide a better night’s sleep for consumers.
We generate revenue by selling our products through four complementary distribution channels. Three of these channels: Retail, Direct Marketing and E-Commerce, are company-controlled and sell directly to consumers. Our wholesale channel sells to and through the QVC shopping channel and wholesale customers in Alaska, Hawaii, Canada and Australia.
Mission, Vision and Strategy
Our mission is to improve lives by individualizing sleep experiences. Our vision is to become the new standard in sleep by providing individualized sleep experiences and elevating people’s expectations above the “one-size-fits-all” solution offered by other mattress brands.
We are executing against a defined strategy which focuses on the following key components:
|
|
•
|
Know our customers as no one else can…use that insight to set new standards in end-to-end customer experience;
|
|
|
•
|
Broaden awareness and consideration…to take share; earn leadership in premium sleep; and
|
|
|
•
|
Leverage our core business to achieve new levels of margin…to fund acceleration and innovation.
|
Results of Operations
Fiscal 2010 Summary
Key financial highlights for fiscal 2010 and financial outlook for fiscal 2011 are as follows:
|
|
•
|
Net income totaled $31.6 million, or $0.57 per diluted share, compared with net income of $35.6 million, or $0.77 per diluted share in 2009. The 2009 net income included the benefit from the reversal of a $26.8 million valuation allowance for deferred taxes offset by $3.3 million of terminated equity financing costs. On a comparable basis, excluding the valuation allowance and the costs associated with the terminated financing, net income per diluted share would have been $0.24 in 2009.
|
|
|
•
|
Net sales increased 11% to $605.7 million, compared with $544.2 million for the prior year, primarily due to a 21% comparable-store sales increase in our company-controlled retail stores, partially offset by a decrease in sales resulting from both a reduction in our store base and the termination of retail partner relationships during the third quarter of 2009.
|
|
|
•
|
Operating income improved to $52.4 million, or 8.6% of net sales, for 2010, compared with $20.7 million, or 3.8% of net sales, for the same period one year ago. The operating income improvement was driven by strong comparable-store sales growth and efficiency enhancements. Sales-per-store, on a trailing twelve-month basis, increased by 24% to $1.3 million.
|
|
|
•
|
Cash provided by operating activities in 2010 totaled $71.2 million, compared with $66.6 million for the prior year. Operating cash flows for 2009 included $26.1 million of income tax refunds associated with our 2008 pre-tax loss.
|
|
|
•
|
As of January 1, 2011, cash and cash equivalents totaled $81.4 million compared with $17.7 million one year ago, and we had no borrowings under our revolving credit facility.
|
|
|
•
|
Our outlook is for modest improvement in macro-economic trends and comparable-store sales growth higher than industry growth as we increase investments against programs designed to expand market share. We expect to end 2011 with approximately 380 stores after the consolidation of planned store openings and closings, compared with 386 at the end of 2010.
|
The following table sets forth, for the periods indicated, our results of operations expressed as dollars and percentages of net sales. Figures are in millions except percentages and earnings per share amounts. Amounts may not add due to rounding differences.
|
2010
|
2009
|
2008
|
||||||||||||||||||||||
|
$
|
% of
Net Sales
|
$
|
% of
Net Sales
|
$
|
% of
Net Sales
|
|||||||||||||||||||
|
Net sales
|
$ | 605.7 | 100.0 | % | $ | 544.2 | 100.0 | % | $ | 608.5 | 100.0 | % | ||||||||||||
|
Cost of sales
|
227.4 | 37.5 | 208.7 | 38.4 | 250.0 | 41.1 | ||||||||||||||||||
|
Gross profit
|
378.3 | 62.5 | 335.5 | 61.6 | 358.6 | 58.9 | ||||||||||||||||||
|
Operating expenses:
|
||||||||||||||||||||||||
|
Sales and marketing
|
269.9 | 44.6 | 259.2 | 47.6 | 332.1 | 54.6 | ||||||||||||||||||
|
General and administrative
|
53.6 | 8.8 | 49.6 | 9.1 | 58.0 | 9.5 | ||||||||||||||||||
|
Research and development
|
2.1 | 0.4 | 2.0 | 0.4 | 3.4 | 0.6 | ||||||||||||||||||
|
Asset impairment charges
|
0.3 | 0.0 | 0.7 | 0.1 | 34.6 | 5.7 | ||||||||||||||||||
|
Terminated equity financing costs
|
— | 0.0 | 3.3 | 0.6 | — | — | ||||||||||||||||||
|
Total operating expenses
|
325.9 | 53.8 | 314.8 | 57.8 | 428.0 | 70.3 | ||||||||||||||||||
|
Operating income (loss)
|
52.4 | 8.6 | 20.7 | 3.8 | (69.5 | ) | (11.4 | ) | ||||||||||||||||
|
Other expense, net
|
1.9 | 0.3 | 6.0 | 1.1 | 3.3 | 0.5 | ||||||||||||||||||
|
Income (loss) before income taxes
|
50.5 | 8.3 | 14.7 | 2.7 | (72.7 | ) | (12.0 | ) | ||||||||||||||||
|
Income tax expense (benefit)
|
18.9 | 3.1 | (20.9 | ) | (3.8 | ) | (2.6 | ) | (0.4 | ) | ||||||||||||||
|
Net income (loss)
|
$ | 31.6 | 5.2 | % | $ | 35.6 | 6.5 | % | $ | (70.2 | ) | (11.5 | %) | |||||||||||
|
|
2010 | 2009 | 2008 | |||||||||||||||||||||
|
Net income (loss) per share:
|
||||||||||||||||||||||||
|
Basic
|
$ | 0.58 | $ | 0.78 | $ | (1.59 | ) | |||||||||||||||||
|
Diluted
|
0.57 | 0.77 | (1.59 | ) | ||||||||||||||||||||
|
Diluted - as adjusted(1)
|
||||||||||||||||||||||||
|
Weighted-average number of common shares:
|
||||||||||||||||||||||||
|
Basic
|
54.0 | 45.7 | 44.2 | |||||||||||||||||||||
|
Diluted
|
55.3 | 46.2 | 44.2 | |||||||||||||||||||||
|
(1)
|
This non-GAAP measure are not in accordance with, or preferable to, GAAP financial data. However, we are providing this information as we believe it facilitates annual and year-over-year comparisons for investors and financial analysts. See page 25 for reconciliation of this non-GAAP measure to the appropriate GAAP measure.
|
The percentage of our total net sales, by dollar volume, from each of our channels during the last three years was as follows:
|
2010
|
2009
|
2008
|
||||||||||
|
Retail
|
84.0 | % | 81.2 | % | 78.2 | % | ||||||
|
Direct and E-Commerce
|
10.8 | % | 11.5 | % | 13.8 | % | ||||||
|
Wholesale
|
5.2 | % | 7.3 | % | 8.0 | % | ||||||
|
Total
|
100.0 | % | 100.0 | % | 100.0 | % | ||||||
The components of total net sales change, including comparable-store net sales changes, were as follows:
|
Channel increase/(decrease)
|
||||||||||||
|
2010
|
2009
|
2008
|
||||||||||
|
Retail same-store sales
|
21 | % | 0 | % | (25 | %) | ||||||
|
Direct and E-Commerce
|
5 | % | (26 | %) | (29 | %) | ||||||
|
Company-Controlled same-store sales change
|
19 | % | (4 | %) | (26 | %) | ||||||
|
Net store openings/closings
|
(5 | %) | (6 | %) | 4 | % | ||||||
|
Total Company-Controlled channels
|
14 | % | (10 | %) | (22 | %) | ||||||
|
Wholesale
|
(21 | %) | (19 | %) | (38 | %) | ||||||
|
Total net sales change
|
11 | % | (11 | %) | (24 | %) | ||||||
|
|
(1)
|
Stores are included in the comparable-store calculation in the 13th full month of operation. Stores that have been remodeled or relocated within the same shopping center remain in the comparable-store base. Fiscal 2008 included 53 weeks, as compared to 52 weeks in fiscal 2010 and 2009. Comparable-store sales have been adjusted and reported as if all years had the same number of weeks.
|
The number of controlled-owned retail stores during the last three years, and independently owned and operated retail partner stores, was as follows:
|
2010
|
2009
|
2008
|
||||||||||
|
Company-controlled retail stores:
|
||||||||||||
|
Beginning of year
|
403 | 471 | 478 | |||||||||
|
Opened
|
7 | 4 | 19 | |||||||||
|
Closed
|
(24 | ) | (72 | ) | (26 | ) | ||||||
|
End of year
|
386 | 403 | 471 | |||||||||
|
Retail partner stores(1) end of year
|
150 | 146 | 801 | |||||||||
|
|
(1)
|
In August 2009, we announced our decision to discontinue distribution through non-company owned mattress retailers in the contiguous United States.
|
Comparison of 2010 and 2009
Net Sales
Net sales in 2010 increased 11% to $605.7 million, compared with $544.2 million for the same period one year ago. The sales increase was driven by a 21% comparable-store sales increase in our company-controlled retail stores and a 5% increase in our direct and E-Commerce channel sales. These increases were partially offset by the decrease in sales resulting from the 4% year-over-year decline in the number of retail stores we operated and a decrease in wholesale channel sales due in large part to our decision in the third quarter of 2009 to discontinue distribution through retail partners operating approximately 700 stores in the contiguous United States. Total sales of mattress units increased 5% compared to the same period one year ago, with mattress units in company-controlled distribution channels increasing by 11%. Sales of other products and services increased by 16%.
The $61.5 million net sales increase compared with the same period one year ago was comprised of the following: (i) an $86.4 million increase in sales from our company-controlled comparable retail stores, partially offset by a $19.7 million sales decrease resulting from the net decline in the number of stores we operated and (ii) a $3.1 million increase in direct and E-Commerce channel sales, partially offset by (iii) an $8.3 million decrease in wholesale channel sales.
Gross Profit
The gross profit rate increased to 62.5% in 2010 compared with 61.6% in 2009. Approximately 1.2 ppt. of the gross profit rate improvement was due to logistics and manufacturing efficiencies, including material cost reductions, an increase in the percentage of net sales from our higher margin company-controlled distribution channels and leverage from the higher sales volume. The gross profit rate also improved due to a reduction in warranty costs per unit, driven by product quality enhancements. These improvements were partially offset by increased performance-based compensation, and an increase in promotional costs to generate customer traffic and drive sales.
Sales and Marketing Expenses
Sales and marketing expenses in 2010 increased to $269.9 million, or 44.6% of net sales, compared with $259.2 million, or 47.6% of net sales in 2009. The $10.7 million increase was primarily due to an $8.8 million, or 14%, increase in media spending and an increase in variable selling expenses due to the higher sales volume, partially offset by a decrease in expenses resulting from the reduction in our store base. The sales and marketing expense rate declined 3.0 ppt. compared with the same period one year ago due to the leveraging impact of the 11% net sales increase and expense savings from store closures.
General and Administrative Expenses
General and administrative (“G&A”) expenses increased $4.0 million to $53.6 million in 2010, compared with $49.6 million in 2009, but decreased to 8.8% of net sales, compared with 9.1% of net sales in the prior year. The $4.0 million increase was primarily due to higher performance-based incentive compensation resulting from our strong 2010 financial results, partially offset by reduced depreciation expenses and the absence of certain costs incurred during the same period last year, including severance expenses. The G&A expense rate decreased by 0.3 ppt. for 2010 compared with the same period one year ago, primarily due to the leveraging impact of the 11% net sales increase.
Research and Development
Research and development (“R&D”) expenses increased to $2.1 million in 2010 compared with $2.0 million in 2009. R&D expenses for 2010 were 0.4% of net sales, consistent with 2009.
Asset Impairment Charges
During 2010, we recognized impairment charges of $0.3 million primarily related to underperforming stores’ assets. During 2009, we recognized impairment charges of $0.7 million related to assets at stores expected to close prior to their normal lease termination dates, and certain equipment and software.
Terminated Equity Financing Costs
In May 2009, we entered into a securities purchase agreement with a private equity firm. At a special meeting of shareholders held August 27, 2009, our shareholders did not approve the May 2009 securities purchase agreement. During the third quarter of 2009, we expensed $3.3 million of direct, incremental costs incurred in connection with the terminated equity financing.
Other Expense, Net
Other expense, net was $1.9 million for 2010, compared with $6.0 million for the same period one year ago. This decrease was primarily due to (i) reduced current-year interest expense and other debt-related costs as we had no borrowings under our revolving credit facility during 2010, partially offset by (ii) a $1.1 million write-off of unamortized debt costs during the first quarter of 2010. We entered into a new credit agreement on March 26, 2010 and terminated our prior credit agreement.
Income Tax Expense (Benefit)
Income tax expense was $18.9 million for 2010, compared with an income tax benefit of $20.9 million for the same period one year ago. The effective tax rate for 2010 was 37.5% compared with (142.0%) for the same period one year ago. The 2009 income tax benefit and effective tax rate reflected the reversal of a deferred tax valuation allowance based on the resolution of the uncertainty regarding future taxable income during the fourth quarter of 2009. In addition, the 2010 effective tax rate benefited from an increase in the manufacturing deduction, partially offset by an increase in unrecognized tax benefits related to certain federal and state tax matters.
Comparison of 2009 and 2008
Net Sales
Net sales in 2009 decreased 11% to $544.2 million, compared with $608.5 million in 2008. The net sales decrease was due to a 14% year-over-year decline in the number of retail stores we operated, and a decrease in direct, wholesale and E-Commerce channel net sales. Total sales of mattress units decreased 11% compared to the same period one year ago and sales of other products and services decreased by 7%.
The $64.3 million net sales decrease compared with the same period one year ago was comprised of the following: (i) a $30.1 million decrease resulting from the net decline in the number of stores we operated, partially offset by a $2.1 million net increase in net sales from our company-controlled comparable retail stores; (ii) a $20.8 million decrease in direct and E-Commerce Channel sales; and (iii) a $8.9 million decrease in wholesale sales. In addition, 2008 included an additional 53rd week of sales totaling approximately $6.6 million.
Gross Profit
The gross profit rate increased to 61.6% in 2009 compared with 58.9% in 2008. A majority of the gross profit rate increase was due to improved manufacturing efficiencies, lower fuel prices, and actions taken to reduce supply chain and logistics costs which in total added approximately 3.5 ppt. to our gross profit rate for 2009, compared to last year. During the fourth quarter of 2008 and in fiscal 2009, we resized our manufacturing and logistics operations to better align with current customer demand. In addition, a sales mix shift to higher-margin company-controlled channels, higher-margin products and lower warranty expenses improved the gross profit rate by 0.6 ppt., 0.5 ppt. and 0.5 ppt., respectively, compared with the same period one year ago. These improvements were partially offset by an increase in promotional costs to generate customer traffic and drive sales.
Sales and Marketing Expenses
Sales and marketing expenses in 2009 decreased to $259.2 million, or 47.6% of net sales, compared with $332.1 million, or 54.6% of net sales in 2008. The $72.8 million decrease was primarily due to a $30.6 million (or 33%) reduction in media spending and a $20.5 million decrease in other marketing expenses, including financing, promotion and media production expenses compared with the same period one-year ago. The reduction in media and other marketing expenses was mainly due to efforts to enhance the effectiveness and efficiency of our marketing expenditures. The remainder of the expense decrease was due to reduced fixed and variable selling expenses resulting from a 14% year-over-year reduction in our store base, reduced depreciation expense (including the impact of prior-year store asset impairments) and other cost reduction initiatives. The sales and marketing expense rate declined 7.0 ppt. compared to the same period one year ago, with the benefits from the cost reduction initiatives more than offsetting the deleveraging impact of the 11% net sales decline.
General and Administrative Expenses
General and administrative (“G&A”) expenses decreased $8.4 million to $49.6 million or 9.1% of net sales in 2009, compared with $58.0 million or 9.5% of net sales in 2008. The $8.4 million decrease in G&A expenses was primarily due to reduced compensation and benefit costs resulting from workforce reductions, decreased depreciation expense and discretionary spending cuts, partially offset by increased performance-based compensation.
Research and Development
Research and development (“R&D”) expenses decreased to $2.0 million in 2009 compared with $3.4 million in 2008, and decreased as a percentage of net sales to 0.4% from 0.6%.
Asset Impairment Charges
Asset impairment charges decreased to $0.7 million in 2009, compared with $34.6 million in 2008. During 2009, we recognized impairment charges of $0.7 million related to assets at stores expected to close prior to their normal lease termination dates, and certain equipment and software.
During the fourth quarter of fiscal 2008, we elected to abandon our plan to implement an integrated suite of SAP®-based applications and recognized asset impairment charges totaling $27.6 million. Also during 2008, we determined that certain assets at underperforming stores were impaired and recognized impairment charges of $7.0 million.
Terminated Equity Financing Costs
In May 2009, we entered into a securities purchase agreement with a private equity firm. At a special meeting of shareholders held August 27, 2009, our shareholders did not approve the May 2009 securities purchase agreement. During the third quarter of 2009, we expensed $3.3 million of direct, incremental costs incurred in connection with the terminated equity financing.
Other Expense, Net
Other expense, net increased to $6.0 million compared with $3.3 million in 2008. The $2.7 million increase in other expense, net was primarily driven by (i) the current year reduction in capitalized interest expense; (ii) the increased write-off of unamortized debt costs in the current year due to reductions in our revolving credit facility’s borrowing capacity; (iii) an increase in our credit facility fees and expenses; and (iv) increased interest rates compared to the same period one year ago, partially offset by (v) a lower average debt balance for the current year.
Income Tax (Benefit) Expense
Income tax benefit in 2009 was $20.9 million compared with a $2.6 million benefit in 2008. The effective tax rate for 2009 was (142.0%) compared with 3.5% for the same period one year ago. Both 2008 and 2009 were impacted by changes in our deferred tax valuation allowance.
Liquidity and Capital Resources
As of January 1, 2011, we had cash and cash equivalents of $81.4 million compared with $17.7 million as of January 2, 2010. The $63.6 million increase in cash and cash equivalents was primarily due to $71.2 million of cash provided by operating activities partially offset by purchases of property and equipment totaling $7.3 million.
The following table summarizes our cash flows for the fiscal years ended January 1, 2011, and January 2, 2010 (in millions). Amounts may not add due to rounding differences.
|
Fiscal Year Ended
|
||||||||
|
January 1,
2011
|
January 2,
2010
|
|||||||
|
Total cash provided by (used in):
|
||||||||
|
Operating activities
|
$ | 71.2 | $ | 66.6 | ||||
|
Investing activities
|
(7.3 | ) | (2.4 | ) | ||||
|
Financing activities
|
(0.2 | ) | (59.5 | ) | ||||
|
Increase in cash and cash equivalents
|
$ | 63.6 | $ | 4.7 | ||||
Cash provided by operating activities for the fiscal year ended January 1, 2011 was $71.2 million compared with $66.6 million for the fiscal year period ended January 2, 2010. The $4.6 million year-over-year increase in cash from operating activities was comprised of a $15.1 million increase in adjustments to reconcile net income to net cash provided by operating activities (prior year included the reversal of a $26.8 million deferred tax valuation allowance), a $6.5 million decrease in cash from changes in operating assets and liabilities (prior year included a $26.1 million income tax refund), and a $4.0 million decrease in our 2010 net income compared with the same period one year ago (prior year included the reversal of a $26.8 deferred tax valuation allowance). Other changes in operating assets and liabilities included a current year increase in accrued compensation and benefits due to higher incentive compensation resulting from the strong financial performance in 2010, a current year increase in inventories to support the higher sales volume and a current year decrease in prepaid expenses and other assets compared with an increase in the prior year (current year included a refund of a security deposit due to our improved financial position; prior year reflected an increase in prepaid rent and prepaid advertising expenses).
Investing activities for 2010 included $7.3 million of property and equipment purchases, compared with $2.5 million for the same period one year ago. In both periods, our capital expenditures related primarily to new and remodeled retail stores, and investments in information technology. During 2010 we opened seven new retail stores, compared with four new retail stores opened during 2009. Capital expenditures are projected to be approximately $25 million to $30 million in 2011, reflecting a total of 40 to 50 store actions, mainly related to store remodels and relocations, along with an initial investment to upgrade our information systems.
Net cash used in financing activities was $0.2 million during 2010, compared with $59.5 million for the same period one year ago. The $59.3 million year-over-year decrease in cash used in financing activities resulted primarily from an $84.8 million net decrease in short-term borrowings during 2009, partially offset by a $26.5 million increase in proceeds from the issuance of common stock. During fiscal 2009, we completed two separate equity offerings that generated the $26.5 million of net proceeds. Book overdrafts and payments on capital lease obligations are included in the net change in short-term borrowings.
As of January 1, 2011, the remaining authorization under our stock repurchase program was $206.8 million. There is no expiration date governing the period over which we can repurchase shares. We currently have no plans to repurchase our common stock. We continue to focus on strengthening our financial position and increasing our cash balance.
On March 26, 2010, we entered into a new credit agreement (“Credit Agreement”) with Wells Fargo Bank, National Association and terminated our prior credit agreement. The Credit Agreement provides a $20.0 million secured revolving credit facility for working capital and general corporate purposes, including up to $10.0 million available for issuances of letters of credit. Outstanding letters of credit reduce the amounts available under this credit facility. The Credit Agreement expires on July 1, 2012. We are subject to certain financial covenants under the Credit Agreement, including minimum fixed charge coverage ratios, maximum capital expenditure limits, minimum net worth requirements, and maintenance of an aggregate principal balance of zero under the Credit Agreement for a period of not less than 30 consecutive days in each fiscal year. The Credit Agreement is secured by a first priority security interest in our assets and those of our domestic subsidiaries.
At January 1, 2011, $17.0 million was available under the Credit Agreement, we had no borrowings and we were in compliance with all financial covenants. At January 2, 2010, $35.5 million was available under the prior credit facility, we had no borrowings, and we were in compliance with all financial covenants. As of January 1, 2011, and January 2, 2010, we had outstanding letters of credit of $3.0 million and $4.5 million, respectively.
Cash generated from operations and available under our credit facility is expected to provide sufficient operating liquidity and funding for capital expenditures for the foreseeable future. In addition, our business model, which can operate with minimal working capital, does not require significant additional capital to fund operations or organic growth.
We have an agreement with GE Money Bank to offer qualified customers revolving credit arrangements to finance purchases from us (“GE Agreement”). The GE Agreement contains certain financial covenants, including a maximum leverage ratio and a minimum interest coverage ratio. As of January 1, 2011 we were in compliance with all financial covenants.
Under the terms of the GE Agreement, GE Money Bank sets the minimum acceptable credit ratings, the interest rates, fees and all other terms and conditions of the customer accounts, including collection policies and procedures, and is the owner of the accounts.
Off-Balance-Sheet Arrangements and Contractual Obligations
We do not participate in transactions that generate relationships with unconsolidated entities or financial partnerships. As of January 1, 2011, we were not involved in any unconsolidated special purpose entity transactions. Other than our operating leases and $3.0 million of outstanding letters of credit, we do not have any off-balance-sheet financing. A summary of our operating lease obligations by fiscal year is included in the “Contractual Obligations” section below. Additional information regarding our operating leases is available in Item 2, Properties, and Note 5, Leases, of the Notes to Consolidated Financial Statements, included in Item 8, Financial Statements and Supplementary Data, of this Annual Report on Form 10-K.
Contractual Obligations
The following table presents information regarding our contractual obligations by fiscal year (in thousands):
|
Payments Due by Period(1)
|
||||||||||||||||||||
|
Total
|
< 1 Year
|
1 – 3 Years
|
3 – 5 Years
|
> 5 Years
|
||||||||||||||||
|
|
||||||||||||||||||||
|
Operating leases
|
$ | 114,533 | $ | 32,377 | $ | 47,937 | $ | 23,039 | $ | 11,180 | ||||||||||
|
Capital leases
|
713 | 447 | 266 | — | — | |||||||||||||||
|
Purchase commitments
|
4,268 | 4,100 | 168 | — | — | |||||||||||||||
|
Total
|
$ | 119,514 | $ | 36,924 | $ | 48,371 | $ | 23,039 | $ | 11,180 | ||||||||||
|
(1)
|
Our unrecognized tax benefits, including interest and penalties, of $1.6 million have not been included in the Contractual Obligations table as we are not able to determine a reasonable estimate of timing of the cash settlement with the respective taxing authorities.
|
Critical Accounting Policies and Estimates
Our consolidated financial statements are prepared in accordance with U.S. generally accepted accounting principles (“GAAP”). In connection with the preparation of our financial statements, we are required to make estimates and assumptions about future events, and apply judgments that affect the reported amounts of assets, liabilities, sales, expenses and the related disclosure. Predicting future events is inherently an imprecise activity and as such requires the use of judgment. We base our assumptions, estimates and judgments on historical experience, current trends and other factors that management believes to be relevant at the time our consolidated financial statements are prepared. On a regular basis, management reviews the accounting policies, assumptions, estimates and judgments to ensure that our financial statements are presented fairly and in accordance with GAAP. However, because future events and their effects cannot be determined with certainty, actual results could differ from our assumptions and estimates, and such differences could be material.
Our significant accounting policies are discussed in Note 1, Business and Summary of Significant Accounting Policies, of the Notes to Consolidated Financial Statements, included in Item 8, Financial Statements and Supplementary Data, of this Annual Report on Form 10-K. Management believes the accounting policies discussed below are the most critical because they require management’s most difficult, subjective or complex judgments, resulting from the need to make estimates about the effect of matters that are inherently uncertain. Management has reviewed these critical accounting policies and estimates, and related disclosures with the Audit Committee of our Board.
Our critical accounting policies and estimates relate to asset impairment charges, stock-based compensation, self-insured liabilities, warranty liabilities and revenue recognition.
|
Description
|
Judgments and Uncertainties
|
Effect if Actual Results
Differ From Assumptions
|
||
|
Asset Impairment Charges
|
|
|
||
|
Long-lived assets other than goodwill and other intangible assets, which are separately tested for impairment, are evaluated for impairment whenever events or changes in circumstances indicate that the carrying value may not be recoverable. When evaluating long-lived assets for potential impairment, we first compare the carrying value of the asset to the asset's estimated future cash flows (undiscounted and without interest charges). If the estimated undiscounted cash flows are less than the carrying value of the asset, we calculate an impairment loss. The impairment loss calculation compares the carrying value of the asset to the asset's estimated fair value. We generally estimate fair value of long-lived assets, including our retail stores, using the income approach, which we base on estimated future cash flows (discounted and with interest charges). The inputs used to determine fair value relate primarily to future assumptions regarding sales volumes, gross profit rates, store operating expenses and applicable probability weightings regarding future alternative uses. These inputs are categorized as Level 3 inputs under the fair value measurements guidance. The inputs used represent management’s assumptions about what information market participants would use in pricing the assets and are based upon the best information available at the balance sheet date.
Recoverability of assets to be held and used is measured by a comparison of the carrying amount of an asset to the estimated fair value plus net proceeds expected from disposition of the asset (if any). When we recognize an impairment loss, the carrying amount of the asset is reduced to estimated fair value based on discounted cash flows, quoted market prices or other valuation techniques.
Assets to be disposed of are reported at the lower of the carrying amount of the asset or fair value less costs to sell. We review store assets for potential impairment based on historical cash flows, lease termination provisions and expected future store operating results.
If we recognize an impairment loss, the adjusted carrying amount of the asset becomes its new cost basis. For a depreciable long-lived asset, the new cost basis will be depreciated (amortized) over the remaining useful life of that asset.
|
|
Our impairment loss calculations contain uncertainties because they require management to make assumptions and to apply judgment to identify events or changes in circumstances indicating the carrying value of assets may not be recoverable, estimate future cash flows, estimate asset fair values, and select a discount rate that reflects the risk inherent in future cash flows.
Expected cash flows may not be realized, which could cause long-lived assets to become impaired in future periods and could have a material adverse effect on future results of operations.
|
|
We have not made any material changes in our impairment loss assessment methodology during the past three fiscal years.
As of January 1, 2011, we evaluated 20 under-performing retail stores that had sufficient projected future cash flows to support the carrying value of their long-lived assets and therefore, did not result in additional impairment charges. At January 1, 2011, the carrying amount of the long-lived assets for these stores totaled $0.6 million.
We believe that our estimates and assumptions used to calculate long-lived asset impairment charges were reasonable and reflect the current economic environment. Our fair value calculations reflect current consumer spending trends. Our fair value calculations assume the ongoing availability of consumer credit and our ability to provide cost-effective consumer credit options. However, it is reasonably possible that an unexpected decline in consumer spending may expose us to future impairment charges that could be material.
Alternatively, if consumer spending increases at a higher rate than we anticipated, impaired stores (which continue to operate) could generate higher than expected future cash flows and operating profits.
|
|
Description
|
|
Judgments and Uncertainties
|
|
Effect if Actual Results
Differ From Assumptions
|
|
Asset Impairment Charges (con’t)
|
||||
|
Asset impairment charges totaled $0.3 million, $0.7 million and $34.6 million for 2010, 2009 and 2008, respectively. During 2010 total impairment charges included a $0.2 million charge for long-lived assets related to two under-performing retail store locations. As of January 1, 2011, the remaining carrying amount of the long-lived assets at these stores was zero.
|
|
|
|
|
|
Stock-Based Compensation
|
|
|
|
|
|
We have a stock-based compensation plan, which includes non-qualified stock options and nonvested share awards. See Note 1, Business and Summary of Significant Accounting Policies, and Note 7, Shareholders’ Equity, to the Notes to Consolidated Financial Statements, included in Item 8, Financial Statements and Supplementary Data, of this Annual Report on Form 10-K, for a complete discussion of our stock-based compensation programs.
We determine the fair value of our non-qualified stock option awards and the resulting compensation expense at the date of grant using the Black-Scholes-Merton option-pricing model. The most significant inputs into the Black-Scholes-Merton model are exercise price, our estimate of expected stock price volatility and the expected term of the options.
We determine the fair value of our performance-based nonvested share awards at the date of grant generally based on the closing market price of our stock.
|
|
Option-pricing models and generally accepted valuation techniques require management to make assumptions and to apply judgment to determine the fair value of our awards. These assumptions and judgments include estimating the future volatility of our stock price, future employee forfeiture rates and future employee stock option exercise behaviors. Changes in these assumptions can materially affect the fair value estimate or future earnings adjustments.
Performance-based nonvested share awards require management to make assumptions regarding the likelihood of achieving performance goals.
|
|
We do not believe there is a reasonable likelihood that there will be a material change in the future estimates or assumptions we use to determine stock-based compensation expense. However, if actual results are not consistent with our estimates or assumptions, we may be exposed to changes in stock-based compensation expense that could be material.
If actual results are not consistent with the assumptions used, the stock-based compensation expense reported in our financial statements may not be representative of the actual economic cost of the stock-based compensation. Also, if the actual forfeiture rates are not consistent with the assumptions used, it could result in future earnings adjustments.
A 10% change in our stock-based compensation expense for the year ended January 1, 2011, would have affected net income by approximately $246,000 in 2010.
|
|
Self-Insured Liabilities
|
|
|||
|
We are self-insured for certain losses related to health and workers’ compensation claims. However, we obtain third-party insurance coverage to limit our exposure to these claims.
When estimating our self-insured liabilities, we consider a number of factors, including historical claims experience, demographic factors, severity factors and valuations provided by third-party administrators.
Periodically, management reviews its assumptions and the valuations provided by third-party administrators to determine the adequacy of our self-insured liabilities.
|
|
Our self-insured liabilities contain uncertainties because management is required to make assumptions and to apply judgment to estimate the ultimate cost to settle reported claims and claims incurred but not reported as of the balance sheet date.
|
|
We have not made any material changes in the accounting methodology used to establish our self-insured liabilities during the past three fiscal years.
We do not believe there is a reasonable likelihood that there will be a material change in the estimates or assumptions we use to calculate our self-insured liabilities. However, if actual results are not consistent with our estimates or assumptions, we may be exposed to losses or gains that could be material.
A 10% change in our self-insured liabilities at January 1, 2011, would have affected net income by approximately $273,000 in 2010.
|
|
Description
|
|
Judgments and Uncertainties
|
|
Effect if Actual Results
Differ From Assumptions
|
|
Warranty Liabilities
|
|
|
|
|
|
The estimated cost to service warranty claims of customers is included in cost of sales. This estimate is based on historical trends of warranty claims.
We regularly assess and adjust the estimate of accrued warranty claims by updating claims rates for actual trends and projected claim costs.
|
|
Our warranty liability contains uncertainties because our warranty obligations cover an extended period of time. A revision of estimated claim rates or the projected cost of materials and freight associated with sending replacement parts to customers could have a material adverse effect on future results of operations.
|
|
We do not believe there is a reasonable likelihood that there will be a material change in the estimates or assumptions we use to calculate our warranty liability. However, if actual results are not consistent with our estimates or assumptions, we may be exposed to losses or gains that could be material.
A 10% change in our warranty liability at January 1, 2011, would have affected net income by approximately $356,000 in 2010.
|
|
|
|
|
|
|
|
Revenue Recognition
|
|
|
|
|
|
Revenue is recognized when the sales price is fixed or determinable, collectability is reasonably assured and title passes. Amounts billed to customers for delivery and set up are included in net sales. Revenue is reported net of estimated sales returns and excludes sales taxes.
We accrue for sales returns at the time revenue is recognized and charge actual returns against the liability when they are received. Our general return policy is to allow returns after a 30-night trial period. We estimate future projected returns based on historical return rates.
|
|
Our estimates of sales returns contain uncertainties as actual returns may vary from expected rates, resulting in adjustments to net sales in future periods. These adjustments could have a material adverse effect on future results of operations.
|
|
We have not made any material changes in the accounting methodology used to establish our sales returns allowance during the past three fiscal years.
We do not believe there is a reasonable likelihood that there will be a material change in the estimates or assumptions we use to calculate our sales returns allowance. However, if actual results are not consistent with our estimates or assumptions, we may be exposed to losses or gains that could be material.
A 10% change in our sales returns allowance at January 1, 2011, would have affected net income by approximately $183,000 in 2010.
|
Recent Accounting Pronouncements
None currently applicable.
ITEM 7A. QUANTITATIVE AND QUALITATIVE DISCLOSURE ABOUT MARKET RISK
At January 1, 2011, we had no short-term borrowings under our line of credit. We do not currently manage interest rate risk on our debt through the use of derivative instruments.
Any borrowings under our revolving credit facility are currently not subject to material interest rate risk. The credit facility’s interest rate may be reset due to fluctuations in a market-based index, such as the prime rate or LIBOR.
ITEM 8. FINANCIAL STATEMENTS AND SUPPLEMENTARY DATA
Report of Independent Registered Public Accounting Firm
To the Board of Directors and Shareholders of
Select Comfort Corporation
Minneapolis, MN
We have audited the internal control over financial reporting of Select Comfort Corporation and subsidiaries (the “Company”) as of January 1, 2011, based on criteria established in Internal Control – Integrated Framework issued by the Committee of Sponsoring Organizations of the Treadway Commission. The Company’s management is responsible for maintaining effective internal control over financial reporting and for its assessment of the effectiveness of internal control over financial reporting, included in the accompanying Management’s Report on Internal Control Over Financial Reporting. Our responsibility is to express an opinion on the Company’s internal control over financial reporting based on our audit.
We conducted our audit in accordance with the standards of the Public Company Accounting Oversight Board (United States). Those standards require that we plan and perform the audit to obtain reasonable assurance about whether effective internal control over financial reporting was maintained in all material respects. Our audit included obtaining an understanding of internal control over financial reporting, assessing the risk that a material weakness exists, testing and evaluating the design and operating effectiveness of internal control based on the assessed risk, and performing such other procedures as we considered necessary in the circumstances. We believe that our audit provides a reasonable basis for our opinion.
A company's internal control over financial reporting is a process designed by, or under the supervision of, the company's principal executive and principal financial officers, or persons performing similar functions, and effected by the company's board of directors, management, and other personnel to provide reasonable assurance regarding the reliability of financial reporting and the preparation of financial statements for external purposes in accordance with generally accepted accounting principles. A company's internal control over financial reporting includes those policies and procedures that (1) pertain to the maintenance of records that, in reasonable detail, accurately and fairly reflect the transactions and dispositions of the assets of the company; (2) provide reasonable assurance that transactions are recorded as necessary to permit preparation of financial statements in accordance with generally accepted accounting principles, and that receipts and expenditures of the company are being made only in accordance with authorizations of management and directors of the company; and (3) provide reasonable assurance regarding prevention or timely detection of unauthorized acquisition, use, or disposition of the company's assets that could have a material effect on the financial statements.
Because of the inherent limitations of internal control over financial reporting, including the possibility of collusion or improper management override of controls, material misstatements due to error or fraud may not be prevented or detected on a timely basis. Also, projections of any evaluation of the effectiveness of the internal control over financial reporting to future periods are subject to the risk that the controls may become inadequate because of changes in conditions, or that the degree of compliance with the policies or procedures may deteriorate.
In our opinion, the Company maintained, in all material respects, effective internal control over financial reporting as of January 1, 2011, based on the criteria established in Internal Control – Integrated Framework issued by the Committee of Sponsoring Organizations of the Treadway Commission.
We have also audited, in accordance with the standards of the Public Company Accounting Oversight Board (United States), the consolidated financial statements and financial statement schedule listed in the Index at Item 15 as of and for the year ended January 1, 2011, of the Company and our report dated February 24, 2011 expressed an unqualified opinion on those financial statements and financial statement schedule.
\s\ DELOITTE & TOUCHE LLP
Minneapolis, Minnesota
February 24, 2011
Report of Independent Registered Public Accounting Firm
To the Board of Directors and Shareholders of
Select Comfort Corporation
Minneapolis, MN
We have audited the accompanying consolidated balance sheet of Select Comfort Corporation and subsidiaries (the “Company”) as of January 1, 2011, and the related consolidated statements of operations, shareholders’ equity (deficit), and cash flows for the year then ended. Our audit also included the financial statement schedule for the year ended January 1, 2011, listed in the Index at Item 15. These financial statements are the responsibility of the Company’s management. Our responsibility is to express an opinion on these financial statements and financial statement schedule based on our audit. The consolidated financial statements of the Company for the years ended January 2, 2010 and January 3, 2009, were audited by other auditors whose report, dated February 25, 2010, expressed an unqualified opinion on those statements.
We conducted our audit in accordance with the standards of the Public Company Accounting Oversight Board (United States). Those standards require that we plan and perform the audit to obtain reasonable assurance about whether the financial statements are free of material misstatement. An audit includes examining, on a test basis, evidence supporting the amounts and disclosures in the financial statements. An audit also includes assessing the accounting principles used and significant estimates made by management, as well as evaluating the overall financial statement presentation. We believe that our audit provides a reasonable basis for our opinion.
In our opinion, such consolidated financial statements present fairly, in all material respects, the financial position of Select Comfort Corporation and subsidiaries as of January 1, 2011, and the results of their operations and their cash flows for the year then ended in conformity with accounting principles generally accepted in the United States of America. Also, in our opinion, such financial statement schedule, when considered in relation to the basic fiscal 2011 consolidated financial statements taken as a whole, presents fairly, in all material respects, the information set forth therein.
We have also audited, in accordance with the standards of the Public Company Accounting Oversight Board (United States), the Company’s internal control over financial reporting as of January 1, 2011, based on the criteria established in Internal Control—Integrated Framework issued by the Committee of Sponsoring Organizations of the Treadway Commission and our report dated February 24, 2011 expressed an unqualified opinion on the Company’s internal control over financial reporting.
\s\ DELOITTE & TOUCHE LLP
Minneapolis, Minnesota
February 24, 2011
Report of Independent Registered Public Accounting Firm
The Board of Directors and Shareholders
Select Comfort Corporation:
We have audited the accompanying consolidated balance sheet of Select Comfort Corporation and subsidiaries as of January 2, 2010, and the related consolidated statements of operations, shareholders’ equity, and cash flows for each of the fiscal years in the two-year period ended January 2, 2010. In connection with our audits of the consolidated financial statements, we also have audited financial statement schedule II related to valuation and qualifying accounts for each of the fiscal years in the two-year period ended January 2, 2010. These consolidated financial statements and financial statement schedule are the responsibility of the Company’s management. Our responsibility is to express an opinion on these consolidated financial statements and financial statement schedule based on our audits.
We conducted our audits in accordance with the standards of the Public Company Accounting Oversight Board (United States). Those standards require that we plan and perform the audit to obtain reasonable assurance about whether the financial statements are free of material misstatement. An audit includes examining, on a test basis, evidence supporting the amounts and disclosures in the financial statements. An audit also includes assessing the accounting principles used and significant estimates made by management, as well as evaluating the overall financial statement presentation. We believe that our audits provide a reasonable basis for our opinion.
In our opinion, the consolidated financial statements referred to above present fairly, in all material respects, the financial position of Select Comfort Corporation and subsidiaries as of January 2, 2010, and the results of their operations and their cash flows for each of the fiscal years in the two-year period ended January 2, 2010, in conformity with U.S. generally accepted accounting principles. Also in our opinion, the related financial statement schedule, when considered in relation to the basic consolidated financial statements taken as a whole, presents fairly, in all material respects, the information set forth therein.
\s\ KPMG LLP
Minneapolis, Minnesota
February 25, 2010
SELECT COMFORT CORPORATION
AND SUBSIDIARIES
Consolidated Balance Sheets
January 1, 2011 and January 2, 2010
(in thousands, except per share amounts)
|
2010
|
2009
|
|||||||
|
Assets
|
||||||||
|
Current assets:
|
||||||||
|
Cash and cash equivalents
|
$ | 81,361 | $ | 17,717 | ||||
|
Accounts receivable, net of allowance for doubtful accounts of $302 and $379, respectively
|
4,564 | 5,094 | ||||||
|
Inventories
|
19,647 | 15,646 | ||||||
|
Income taxes receivable
|
— | 3,893 | ||||||
|
Prepaid expenses
|
6,388 | 5,879 | ||||||
|
Deferred income taxes
|
4,297 | 5,153 | ||||||
|
Other current assets
|
652 | 720 | ||||||
|
Total current assets
|
116,909 | 54,102 | ||||||
|
Property and equipment, net
|
32,953 | 37,682 | ||||||
|
Deferred income taxes
|
15,965 | 19,071 | ||||||
|
Other assets
|
4,130 | 7,385 | ||||||
|
Total assets
|
$ | 169,957 | $ | 118,240 | ||||
|
Liabilities and Shareholders’ Equity
|
||||||||
|
Current liabilities:
|
||||||||
|
Accounts payable
|
$ | 42,025 | $ | 37,538 | ||||
|
Customer prepayments
|
12,944 | 11,237 | ||||||
|
Compensation and benefits
|
24,857 | 15,518 | ||||||
|
Taxes and withholding
|
5,359 | 4,528 | ||||||
|
Other current liabilities
|
11,671 | 10,716 | ||||||
|
Total current liabilities
|
96,856 | 79,537 | ||||||
|
Warranty liabilities
|
2,815 | 5,286 | ||||||
|
Other long-term liabilities
|
12,309 | 10,959 | ||||||
|
Total non-current liabilities
|
15,124 | 16,245 | ||||||
|
Total liabilities
|
111,980 | 95,782 | ||||||
|
Shareholders’ equity:
|
||||||||
|
Undesignated preferred stock; 5,000 shares authorized, no shares issued and outstanding
|
— | — | ||||||
|
Common stock, $0.01 par value; 142,500 shares authorized, 55,455 and 54,310 shares issued and outstanding, respectively
|
555 | 543 | ||||||
|
Additional paid-in capital
|
36,799 | 32,860 | ||||||
|
Retained earnings (accumulated deficit)
|
20,623 | (10,945 | ) | |||||
|
Total shareholders’ equity
|
57,977 | 22,458 | ||||||
|
Total liabilities and shareholders’ equity
|
$ | 169,957 | $ | 118,240 | ||||
See accompanying notes to consolidated financial statements.
SELECT COMFORT CORPORATION
AND SUBSIDIARIES
Consolidated Statements of Operations
Years ended January 1, 2011, January 2, 2010 and January 3, 2009
(in thousands, except per share amounts)
|
2010
|
2009
|
2008
|
||||||||||
|
Net sales
|
$ | 605,676 | $ | 544,202 | $ | 608,524 | ||||||
|
Cost of sales
|
227,413 | 208,742 | 249,952 | |||||||||
|
Gross profit
|
378,263 | 335,460 | 358,572 | |||||||||
|
Operating expenses:
|
||||||||||||
|
Sales and marketing
|
269,901 | 259,244 | 332,068 | |||||||||
|
General and administrative
|
53,572 | 49,560 | 57,994 | |||||||||
|
Research and development
|
2,147 | 1,973 | 3,374 | |||||||||
|
Asset impairment charges
|
260 | 686 | 34,594 | |||||||||
|
Terminated equity financing costs
|
— | 3,324 | — | |||||||||
|
Total operating expenses
|
325,880 | 314,787 | 428,030 | |||||||||
|
Operating income (loss)
|
52,383 | 20,673 | (69,458 | ) | ||||||||
|
Other expense, net
|
1,893 | 5,983 | 3,285 | |||||||||
|
Income (loss) before income taxes
|
50,490 | 14,690 | (72,743 | ) | ||||||||
|
Income tax expense (benefit)
|
18,922 | (20,862 | ) | (2,566 | ) | |||||||
|
Net income (loss)
|
$ | 31,568 | $ | 35,552 | $ | (70,177 | ) | |||||
|
Basic net income (loss) per share:
|
||||||||||||
|
Net income (loss) per share – basic
|
$ | 0.58 | $ | 0.78 | $ | (1.59 | ) | |||||
|
Weighted-average common shares – basic
|
54,005 | 45,682 | 44,186 | |||||||||
|
Diluted net income (loss) per share:
|
||||||||||||
|
Net income (loss) per share – diluted
|
$ | 0.57 | $ | 0.77 | $ | (1.59 | ) | |||||
|
Weighted-average common shares – diluted
|
55,264 | 46,198 | 44,186 | |||||||||
See accompanying notes to consolidated financial statements.
SELECT COMFORT CORPORATION
AND SUBSIDIARIES
Consolidated Statements of Shareholders’ Equity (Deficit)
Years ended January 1, 2011, January 2, 2010 and January 3, 2009
(in thousands)
|
Retained
|
||||||||||||||||||||
|
Common Stock
|
Additional
|
Earnings/
|
||||||||||||||||||
|
Paid-In
|
(Accumulated
|
|||||||||||||||||||
|
Shares
|
Amount
|
Capital
|
Deficit)
|
Total
|
||||||||||||||||
|
Balance at December 29, 2007
|
44,597 | $ | 446 | $ | — | $ | 23,680 | $ | 24,126 | |||||||||||
|
Exercise of common stock options
|
61 | 1 | 92 | — | 93 | |||||||||||||||
|
Tax effect from stock-based compensation
|
— | — | 28 | — | 28 | |||||||||||||||
|
Stock-based compensation
|
— | — | 3,702 | — | 3,702 | |||||||||||||||
|
Issuances of common stock
|
304 | 3 | 595 | — | 598 | |||||||||||||||
|
Net loss
|
— | — | — | (70,177 | ) | (70,177 | ) | |||||||||||||
|
Balance at January 3, 2009
|
44,962 | $ | 450 | $ | 4,417 | $ | (46,497 | ) | $ | (41,630 | ) | |||||||||
|
Exercise of common stock options
|
57 | — | 130 | — | 130 | |||||||||||||||
|
Exercise of warrants
|
2,000 | 20 | — | — | 20 | |||||||||||||||
|
Tax effect from stock-based compensation
|
— | — | (1,234 | ) | — | (1,234 | ) | |||||||||||||
|
Stock-based compensation
|
328 | 3 | 3,233 | — | 3,236 | |||||||||||||||
|
Issuances of common stock
|
6,963 | 70 | 26,314 | — | 26,384 | |||||||||||||||
|
Net income
|
— | — | — | 35,552 | 35,552 | |||||||||||||||
|
Balance at January 2, 2010
|
54,310 | $ | 543 | $ | 32,860 | $ | (10,945 | ) | $ | 22,458 | ||||||||||
|
Exercise of common stock options
|
958 | 10 | 1,004 | — | 1,014 | |||||||||||||||
|
Tax effect from stock-based compensation
|
— | — | 366 | — | 366 | |||||||||||||||
|
Stock-based compensation
|
353 | 4 | 3,958 | — | 3,962 | |||||||||||||||
|
Repurchases of common stock
|
(166 | ) | (2 | ) | (1,389 | ) | (1,391 | ) | ||||||||||||
|
Net income
|
— | — | — | 31,568 | 31,568 | |||||||||||||||
|
Balance at January 1, 2011
|
55,455 | $ | 555 | $ | 36,799 | $ | 20,623 | $ | 57,977 | |||||||||||
See accompanying notes to consolidated financial statements.
SELECT COMFORT CORPORATION
AND SUBSIDIARIES
Consolidated Statements of Cash Flows
Years ended January 1, 2011, January 2, 2010 and January 3, 2009
(in thousands)
|
2010
|
2009
|
2008
|
||||||||||
|
Cash flows from operating activities:
|
||||||||||||
|
Net income (loss)
|
$ | 31,568 | $ | 35,552 | $ | (70,177 | ) | |||||
|
Adjustments to reconcile net income (loss) to net cash provided by operating activities:
|
||||||||||||
|
Depreciation and amortization
|
14,626 | 19,054 | 22,186 | |||||||||
|
Stock-based compensation
|
3,962 | 3,236 | 3,702 | |||||||||
|
Disposals and impairments of assets
|
251 | 683 | 34,577 | |||||||||
|
Excess tax benefits from stock-based compensation
|
(1,358 | ) | — | (19 | ) | |||||||
|
Deferred income taxes
|
2,352 | (18,209 | ) | 25,075 | ||||||||
|
Change in operating assets and liabilities:
|
||||||||||||
|
Accounts receivable
|
530 | (155 | ) | 13,963 | ||||||||
|
Inventories
|
(4,001 | ) | 3,029 | 13,842 | ||||||||
|
Income taxes
|
6,647 | 22,007 | (25,900 | ) | ||||||||
|
Prepaid expenses and other assets
|
1,579 | (1,776 | ) | 7,627 | ||||||||
|
Accounts payable
|
3,995 | 2,545 | (20,047 | ) | ||||||||
|
Customer prepayments
|
1,707 | (243 | ) | 3,153 | ||||||||
|
Accrued compensation and benefits
|
11,471 | 943 | (250 | ) | ||||||||
|
Other taxes and withholding
|
53 | 1,604 | (1,846 | ) | ||||||||
|
Warranty liabilities
|
(1,398 | ) | (906 | ) | (1,454 | ) | ||||||
|
Other accruals and liabilities
|
(765 | ) | (725 | ) | (1,459 | ) | ||||||
|
Net cash provided by operating activities
|
71,219 | 66,639 | 2,973 | |||||||||
|
Cash flows from investing activities:
|
||||||||||||
|
Purchases of property and equipment
|
(7,349 | ) | (2,459 | ) | (32,202 | ) | ||||||
|
Proceeds from sales of property and equipment
|
10 | 15 | — | |||||||||
|
Net cash used in investing activities
|
(7,339 | ) | (2,444 | ) | (32,202 | ) | ||||||
|
Cash flows from financing activities:
|
||||||||||||
|
Net (decrease) increase in short-term borrowings
|
(1,074 | ) | (84,756 | ) | 35,809 | |||||||
|
Repurchases of common stock
|
(1,391 | ) | — | — | ||||||||
|
Proceeds from issuance of common stock
|
1,014 | 26,534 | 651 | |||||||||
|
Excess tax benefits from stock-based compensation
|
1,358 | — | 19 | |||||||||
|
Debt issuance costs
|
(143 | ) | (1,313 | ) | (1,472 | ) | ||||||
|
Net cash (used in) provided by financing activities
|
(236 | ) | (59,535 | ) | 35,007 | |||||||
|
Increase in cash and cash equivalents
|
63,644 | 4,660 | 5,778 | |||||||||
|
Cash and cash equivalents, at beginning of year
|
17,717 | 13,057 | 7,279 | |||||||||
|
Cash and cash equivalents, at end of year
|
$ | 81,361 | $ | 17,717 | $ | 13,057 | ||||||
|
Supplemental Disclosure of Cash Flow Information
|
||||||||||||
|
Income taxes paid (refunded)
|
$ | 9,732 | $ | (25,978 | ) | $ | (1,313 | ) | ||||
|
Interest paid
|
$ | 444 | $ | 4,747 | $ | 3,636 | ||||||
|
Capital lease obligations incurred
|
$ | 466 | $ | 674 | $ | 1,032 | ||||||
|
Purchases of property and equipment included in accounts payable
|
$ | 965 | $ | 388 | $ | 770 | ||||||
See accompanying notes to consolidated financial statements.
SELECT COMFORT CORPORATION
AND SUBSIDIARIES
Notes to Consolidated Financial Statements
(1) Business and Summary of Significant Accounting Policies
Business
Select Comfort Corporation and our wholly-owned subsidiaries (“Select Comfort” or the “Company”) design, manufacture, market and support a line of adjustable-firmness mattresses featuring air-chamber technology. In addition, we also sell to wholesale customers in Alaska, Hawaii, Canada and Australia. We sell through three distribution channels: Retail, Direct and E-Commerce, and Wholesale. The percentage of our total net sales from each of our channels during the last three years was as follows:
|
2010
|
2009
|
2008
|
||||||||||
|
Retail
|
84.0 | % | 81.2 | % | 78.2 | % | ||||||
|
Direct and E-Commerce
|
10.8 | % | 11.5 | % | 13.8 | % | ||||||
|
Wholesale
|
5.2 | % | 7.3 | % | 8.0 | % | ||||||
|
Total
|
100.0 | % | 100.0 | % | 100.0 | % | ||||||
Basis of Presentation
The consolidated financial statements include the accounts of Select Comfort Corporation and our subsidiaries. All significant intercompany balances and transactions have been eliminated in consolidation.
Fiscal Year
Our fiscal year ends on the Saturday closest to December 31. Fiscal years and their respective fiscal year ends are as follows: fiscal 2010 ended January 1, 2011; fiscal 2009 ended January 2, 2010; and fiscal 2008 ended January 3, 2009. Fiscal 2008 had 53 weeks. Fiscal years 2010 and 2009 each had 52 weeks.
Use of Estimates in the Preparation of Financial Statements
The preparation of consolidated financial statements in conformity with U.S. generally accepted accounting principles (“GAAP”) requires us to make estimates and assumptions. These estimates and assumptions affect the reported amounts of assets and liabilities, disclosure of contingent assets and liabilities at the date of the consolidated financial statements, and the reported amounts of sales, expenses and income taxes during the reporting period. Predicting future events is inherently an imprecise activity and, as such, requires the use of judgment. As future events and their effects cannot be determined with precision, actual results could differ significantly from these estimates. Changes in these estimates will be reflected in the financial statements in future periods. Our critical accounting policies consist of asset impairment charges, stock-based compensation, self-insured liabilities, warranty liabilities and revenue recognition.
Cash and Cash Equivalents
Cash and cash equivalents include highly liquid investments with original maturities of three months or less. The carrying value of these investments approximates fair value due to their short-term maturity. Our banking arrangements allow us to fund outstanding checks when presented to the financial institution for payment, resulting in book overdrafts. Book overdrafts totaled $7.2 million and $7.4 million at January 1, 2011, and January 2, 2010, respectively. Book overdrafts are included in accounts payable in our consolidated balance sheets and in net (decrease) increase in short-term borrowings in the financing activities section of our consolidated statements of cash flows.
The majority of payments due from third-parties for credit card and debit card transactions are processed within one to three business days. All credit card and debit card transactions that process in less than seven days are classified as cash and cash equivalents. Amounts due for these transactions that are classified as cash and cash equivalents totaled $5.3 million and $5.5 million at January 1, 2011, and January 2, 2010, respectively.
SELECT COMFORT CORPORATION
AND SUBSIDIARIES
Notes to Consolidated Financial Statements – (continued)
Accounts Receivable
Accounts receivable are recorded net of an allowance for expected losses and consist primarily of wholesale receivables and receivables from third-party financiers for customer credit card purchases. The allowance is recognized in an amount equal to anticipated future write-offs. We estimate future write-offs based on delinquencies, aging trends, industry risk trends and our historical experience. Account balances are charged off against the allowance when we believe it is probable the receivable will not be recovered.
Inventories
Inventories include material, labor and overhead and are stated at the lower of cost or market. Cost is determined by the first-in, first-out method.
Property and Equipment
Property and equipment, carried at cost, is depreciated using the straight-line method over the estimated useful lives of the assets. Leasehold improvements are depreciated over the shorter of the estimated useful lives of the assets or the contractual term of the lease, with consideration of lease renewal options if renewal appears probable. Property under capital lease is comprised of manufacturing equipment, computer equipment and computer software used in our retail operations and corporate support areas. Estimated useful lives of our property and equipment by major asset category are as follows:
|
Leasehold improvements
|
5 to 10 years
|
|
Office furniture and equipment
|
5 to 7 years
|
|
Production machinery, computer equipment and software
|
3 to 7 years
|
|
Property under capital lease
|
3 to 4 years
|
Other Assets
Other assets include deposits, patents, trademarks and goodwill. Patents and trademarks are amortized using the straight-line method over periods ranging from 10 to 17 years. The carrying value of goodwill at both January 1, 2011, and January 2, 2010, was $2.9 million.
Asset Impairment Charges
We review our long-lived assets and finite-lived intangibles for impairment whenever events or changes in circumstances indicate that the carrying amount of an asset may not be recoverable. Recoverability of assets to be held and used is measured by a comparison of the carrying amount of an asset to future undiscounted cash flows expected to be generated by the asset plus net proceeds expected from disposition of the asset (if any). When we recognize an impairment loss, the carrying amount of the asset is reduced to estimated fair value based on discounted cash flows, quoted market prices or other valuation techniques. Assets to be disposed of are reported at the lower of the carrying amount of the asset or fair value less costs to sell. We review store assets for potential impairment based on historical cash flows, lease termination provisions and expected future store operating results.
The test for goodwill impairment is a two-step process, and is performed at least annually. The first step is a comparison of the fair value of the reporting unit with its carrying amount, including goodwill. If this step reflects impairment, then the loss would be measured as the excess of recorded goodwill over its implied fair value. Implied fair value is the excess of fair value of the reporting unit over the fair value of all identified assets and liabilities. Fair value is determined using a market-based approach utilizing widely accepted valuation techniques, including quoted market prices and our market capitalization. During the fourth quarter of 2010, we completed our annual impairment testing of goodwill, using the valuation techniques as described above, and determined there was no impairment.
SELECT COMFORT CORPORATION
AND SUBSIDIARIES
Notes to Consolidated Financial Statements – (continued)
Warranty Liabilities
We provide a 20-year limited warranty on our adjustable-firmness beds. The customer participates over the last 18 years of the warranty period by paying a portion of the retail value of replacement parts. The estimated warranty costs, which are expensed at the time of sale and included in cost of sales, are based on historical claims rates incurred by us and are adjusted for any current trends as appropriate. Our warranty liability is one of our critical accounting policies and contains uncertainties because our warranty obligations cover an extended period of time. Actual warranty claim costs could differ from these estimates. We regularly assess and adjust the estimate of accrued warranty claims by updating claims rates for actual trends and projected claim costs. A revision of estimated claim rates or the projected cost of materials and freight associated with sending replacement parts to customers could have a material adverse effect on future results of operations.
We classify as noncurrent those estimated warranty costs expected to be paid out in greater than one year. The activity in the accrued warranty liabilities account was as follows (in thousands):
|
2010
|
2009
|
2008
|
||||||||||
|
Balance at beginning of year
|
$ | 7,143 | $ | 8,049 | $ | 9,503 | ||||||
|
Additions charged to costs and expenses for current-year sales
|
3,630 | 5,114 | 6,105 | |||||||||
|
Deductions from reserves
|
(4,318 | ) | (5,822 | ) | (9,537 | ) | ||||||
|
Changes in liability for pre-existing warranties during the current year, including expirations
|
(711 | ) | (198 | ) | 1,978 | |||||||
|
Balance at end of period
|
$ | 5,744 | $ | 7,143 | $ | 8,049 | ||||||
Fair Value of Financial Instruments
Fair value is the price that would be received to sell an asset or paid to transfer a liability (an exit price) in the principal or most advantageous market for the asset or liability in an orderly transaction between market participants at the measurement date. We use a three-tier fair value hierarchy based upon observable and non-observable inputs that prioritizes the information used to develop our assumptions regarding fair value. Fair value measurements are separately disclosed by level within the fair value hierarchy.
The carrying value of cash and cash equivalents, accounts receivable, accounts payable, borrowings under our revolving credit facility, and other current assets and liabilities approximate fair value because of their short-term maturity.
Revenue Recognition
Revenue is recognized when the sales price is fixed or determinable, collectability is reasonably assured and title passes. Amounts billed to customers for delivery and set up are included in net sales. Revenue is reported net of estimated sales returns and excludes sales taxes.
We accept sales returns after a 30-night trial period. The accrued sales returns estimate is based on historical return rates, which are reasonably consistent from period to period and is adjusted for any current trends as appropriate. If actual returns vary from expected rates, sales in future periods are adjusted.
SELECT COMFORT CORPORATION
AND SUBSIDIARIES
Notes to Consolidated Financial Statements – (continued)
Cost of Sales, Sales and Marketing, General and Administrative (“G&A”) and Research & Development (“R&D”) Expenses
The following tables summarize the primary costs classified in each major expense category (the classification of which may vary within our industry):
|
Cost of Sales
|
Sales & Marketing
|
|||
|
|
|
|
|
|
|
•
|
Costs associated with purchasing, manufacturing, shipping, handling and delivering our products to our stores and customers;
|
•
|
Advertising and media production;
|
|
|
|
|
|
||
|
•
|
Physical inventory losses, scrap and obsolescence;
|
•
|
Marketing and selling materials such as brochures, videos, customer mailings and in-store signage;
|
|
|
|
|
|
|
|
|
•
|
Related occupancy and depreciation expenses; and
|
•
|
Payroll and benefits for sales and customer service staff;
|
|
|
|
|
|
|
|
|
•
|
Estimated costs to service warranty claims of customers.
|
•
|
Store occupancy costs;
|
|
|
|
|
|
|
|
|
|
|
•
|
Store depreciation expense; and
|
|
|
|
|
|
|
|
|
|
|
•
|
Promotional financing costs.
|
|
|
|
|
|||
|
G&A
|
R&D(1)
|
|||
|
|
|
|
|
|
|
•
|
Payroll and benefit costs for corporate employees, including information technology, legal, human resources, finance, sales and marketing administration, investor relations and risk management;
|
•
|
Internal labor and benefits related to research and development activities;
|
|
|
|
|
|
||
|
•
|
Occupancy costs of corporate facilities;
|
•
|
Outside consulting services related to research and development activities; and
|
|
|
|
|
|||
|
•
|
Depreciation related to corporate assets;
|
•
|
Testing equipment related to research and development activities.
|
|
|
|
||||
|
•
|
Information hardware, software and maintenance;
|
(1) Costs incurred in connection with R&D are charged to expense as incurred.
|
||
|
|
||||
|
•
|
Insurance;
|
|
|
|
|
|
|
|||
|
•
|
Investor relations costs; and
|
|
|
|
|
|
|
|||
|
•
|
Other overhead costs.
|
|
|
|
Operating Leases
We rent office and manufacturing space under operating leases which, in addition to the minimum lease payments, require payment of a proportionate share of the real estate taxes and certain building operating expenses. We also rent retail space under operating leases which, in addition to the minimum lease payments, may require payment of contingent rents based upon sales levels and payment of a proportionate share of the real estate taxes and certain building operating expenses.
Rent expense is recognized on a straight-line basis over the lease term, after consideration of rent escalations and rent holidays. We record any difference between the straight-line rent amounts and amounts payable under the leases as part of deferred rent, in other current liabilities or other long-term liabilities, as appropriate. The lease term for purposes of the calculation begins on the earlier of the lease commencement date or the date we take possession of the property. During lease renewal negotiations that extend beyond the original lease term, we estimate straight-line rent expense based on current market conditions. At January 1, 2011, and January 2, 2010, deferred rent included in other current liabilities in our consolidated balance sheets was $1.5 million and $1.4 million, respectively, and deferred rent included in other long-term liabilities in our consolidated balance sheets was $3.9 million and $4.0 million, respectively.
SELECT COMFORT CORPORATION
AND SUBSIDIARIES
Notes to Consolidated Financial Statements – (continued)
Leasehold improvements that are funded by landlord incentives or allowances under an operating lease are recorded as deferred lease incentives, in other current liabilities or other long-term liabilities, as appropriate and amortized as reductions to rent expense over the lease term. At January 1, 2011, and January 2, 2010, deferred lease incentives included in other current liabilities in our consolidated balance sheets were $1.2 million and $1.4 million, respectively, and deferred lease incentives included in other long-term liabilities in our consolidated balance sheets were $3.6 million and $4.6 million, respectively.
Lease payments that depend on factors that are not measurable at the inception of the lease, such as future sales levels, are contingent rents and are excluded from minimum lease payments and included in the determination of total rent expense when it is probable the expense has been incurred and the amount is reasonably estimable. Future payments for real estate taxes and certain building operating expenses for which we are obligated are not included in minimum lease payments.
Pre-opening Costs
Costs associated with the start up and promotion of new store openings are expensed as incurred.
Advertising Costs
We incur advertising costs associated with print and broadcast advertisements. Advertising costs are charged to expense when the ad first runs. Advertising expense was $70.2 million, $61.4 million and $92.0 million, in 2010, 2009 and 2008, respectively. Advertising costs deferred and included in prepaid expenses in our consolidated balance sheets were $1.8 million and $1.8 million as of January 1, 2011, and January 2, 2010, respectively.
Insurance
We are self-insured for certain losses related to health and workers’ compensation claims, although we do obtain third-party insurance coverage to limit exposure to these claims. We estimate our self-insured liabilities using a number of factors including historical claims experience and analysis of incurred but not reported claims. Our self-insurance liability was $4.4 million and $4.6 million at January 1, 2011, and January 2, 2010, respectively. At January 1, 2011, and January 2, 2010, $2.3 million and $4.6 million, respectively, were included in other current liabilities and $2.1 million and $0.0 million, respectively, were included in other long-term liabilities in our consolidated balance sheets.
Stock-Based Compensation
We record stock-based compensation expense based on the award’s fair value at the date of grant and the awards that are expected to vest. We recognize stock-based compensation expense over the period during which an employee is required to provide services in exchange for the award, or to their eligible retirement date, if earlier. We use the Black-Scholes-Merton option-pricing model to estimate the fair value of stock options and resulting compensation expense. The most significant inputs into the Black-Scholes-Merton option-pricing model are exercise price, our estimate of expected stock price volatility and the weighted-average expected life of the options. We reduce compensation expense by estimated forfeitures. We include as part of cash flows from financing activities the benefit of tax deductions in excess of recognized compensation expense.
See Note 7, Shareholders’ Equity, for additional information on stock-based compensation.
Income Taxes
We recognize deferred tax assets and liabilities for the future tax consequences attributable to temporary differences between the financial statement carrying amounts of existing assets and liabilities and their respective tax bases. Deferred tax assets and liabilities are measured using enacted tax rates expected to apply to taxable income in the years in which those temporary differences are expected to be recovered or settled. The effect on deferred tax assets and liabilities of a change in tax rates is recognized in income in the period that includes the enactment date. A valuation allowance is established for any portion of deferred tax assets that are not considered more likely than not to be realized. We evaluate all available positive and negative evidence, including the existence of cumulative year losses and our forecast of future taxable income, to assess the need for a valuation allowance on our deferred tax assets.
SELECT COMFORT CORPORATION
AND SUBSIDIARIES
Notes to Consolidated Financial Statements – (continued)
We record a liability for unrecognized tax benefits from uncertain tax positions taken, or expected to be taken, in our tax returns.
We classify interest and penalties on tax uncertainties as a component of income tax expense (benefit) in our consolidated statements of operations.
Income (Loss) Per Share
Basic income (loss) per share excludes dilution and is computed by dividing net income (loss) attributable to common shareholders by the weighted-average number of common shares outstanding during the period. Diluted income (loss) per share includes potentially dilutive common shares consisting of stock options, restricted stock and warrants using the treasury stock method. In 2008, we excluded shares of restricted stock and stock options from our computation of diluted net loss per share, as their inclusion would have had an anti-dilutive effect (i.e., resulted in a lower loss per share).
Sources of Supply
We currently obtain materials and components used to produce our beds from outside sources. As a result, we are dependent upon suppliers that in some instances, are our sole source of supply. We are continuing our efforts to dual-source key components. The failure of one or more of our suppliers to provide us with materials or components on a timely basis could significantly impact our consolidated results of operations and net income (loss) per share. We believe we can obtain these raw materials and components from other sources of supply in the ordinary course of business, although an unexpected loss of supply over a short period of time may not allow us to replace these sources in the ordinary course of business.
Subsequent Events
Events that have occurred subsequent to January 1, 2011 have been evaluated through the date the consolidated financial statements were issued. There have been no subsequent events that occurred during such period that would require recognition or disclosure in the consolidated financial statements as of or for the fiscal year ended January 1, 2011.
SELECT COMFORT CORPORATION
AND SUBSIDIARIES
Notes to Consolidated Financial Statements – (continued)
(2) Fair Value Measurements
The guidance for fair value measurements establishes the authoritative definition of fair value, sets out a framework for measuring fair value and outlines the required disclosures regarding fair value measurements. Fair value is the price that would be received to sell an asset or paid to transfer a liability (an exit price) in the principal or most advantageous market for the asset or liability in an orderly transaction between market participants at the measurement date. We use a three-tier fair value hierarchy based upon observable and non-observable inputs as follows:
|
•
|
Level 1 – observable inputs such as quoted prices in active markets;
|
|
•
|
Level 2 – inputs, other than the quoted prices in active markets, that are observable either directly or indirectly; and
|
|
•
|
Level 3 – unobservable inputs in which there is little or no market data, which require the reporting entity to develop its own assumptions.
|
Assets and liabilities that are measured at fair value on a recurring basis
At January 1, 2011, we did not have any nonfinancial assets or liabilities that required a fair-value measurement on a recurring basis. Our financial assets and liabilities requiring a fair-value measurement on a recurring basis were not significant as of January 1, 2011.
Assets and liabilities that are measured at fair value on a non-recurring basis
Long-Lived Assets
We generally estimate long-lived asset fair values, including our retail stores, using the income approach. The inputs used to determine fair value relate primarily to future assumptions regarding sales volumes, gross profit rates, store operating expenses and applicable probability weightings regarding future alternative uses. These inputs are categorized as Level 3 inputs. The inputs used represent management’s assumptions about what information market participants would use in pricing the assets and are based upon the best information available at the balance sheet date.
Our projected fair value calculations reflect recent consumer spending trends with no significant change in the macroeconomic environment for the foreseeable future. Our fair value calculations assume the ongoing availability of consumer credit and our ability to provide cost-effective consumer credit options.
The following table presents the asset impairment charges we recorded during 2010 and 2009 and the remaining net carrying value of those impaired long-lived assets as of January 1, 2011, and January 2, 2010 (in thousands):
|
Fair Value Measured and
Recorded at Year End Using
|
||||||||||||||||||||
|
Year Ended
|
Net Carrying Value of Long-Lived Assets
|
Level 1
|
Level 2
|
Level 3
|
Impairment Charges for the Year Ended
|
|||||||||||||||
|
January 1, 2011
|
$ | — | $ | — | $ | — | $ | — | $ | (260 | ) | |||||||||
|
January 2, 2010
|
$ | 35 | $ | — | $ | — | $ | 35 | $ | (686 | ) | |||||||||
Financial Assets and Liabilities not Measured at Fair Value
Certain of our financial assets and liabilities are recorded at their carrying amounts which approximate fair value, based on their short-term nature or variable interest rate. These financial assets and liabilities include cash and cash equivalents, accounts receivable and accounts payable.
SELECT COMFORT CORPORATION
AND SUBSIDIARIES
Notes to Consolidated Financial Statements – (continued)
(3) Inventories
Inventories consist of the following (in thousands):
|
January 1,
2011
|
January 2,
2010
|
|||||||
|
Raw materials
|
$ | 4,759 | $ | 3,257 | ||||
|
Work in progress
|
65 | 102 | ||||||
|
Finished goods
|
14,823 | 12,287 | ||||||
| $ | 19,647 | $ | 15,646 | |||||
Our finished goods inventory, as of January 1, 2011, was comprised of $5.4 million of finished beds, including retail display beds and deliveries in-transit to those customers who have utilized home delivery services, $5.3 million of finished components that were ready for assembly for the completion of beds, and $4.1 million of retail accessories.
Our finished goods inventory, as of January 2, 2010, was comprised of $4.8 million of finished beds, including retail display beds and deliveries in-transit to those customers who have utilized home delivery services, $3.4 million of finished components that were ready for assembly for the completion of beds, and $4.1 million of retail accessories.
(4) Property and Equipment
Property and equipment consist of the following (in thousands):
|
January 1,
2011
|
January 2,
2010
|
|||||||
|
Land
|
$ | 1,999 | $ | 1,999 | ||||
|
Leasehold improvements
|
76,026 | 76,579 | ||||||
|
Office furniture and equipment
|
7,694 | 5,260 | ||||||
|
Production machinery, computer equipment and software
|
70,343 | 66,966 | ||||||
|
Property under capital lease
|
2,309 | 1,837 | ||||||
|
Less: Accumulated depreciation and amortization
|
(125,418 | ) | (114,959 | ) | ||||
| $ | 32,953 | $ | 37,682 | |||||
During 2010, 2009 and 2008, we recorded asset impairment charges of $0.3 million, $0.7 million and $34.6 million, respectively. The impairment charges in 2010 were related primarily to underperforming stores’ assets. The impairment charges in 2009 were related to assets at stores expected to close prior to their normal lease termination dates, and certain equipment and software. During the fourth quarter of fiscal 2008, we elected to abandon our plan to implement an integrated suite of SAP®-based applications and recognized asset impairment charges totaling $27.6 million. In addition, during 2008, we reviewed all of our stores for impairment and determined that certain store assets at underperforming stores were impaired. We recognized impairment charges of $7.0 million for the difference between the fair value and the carrying amounts of the related long-lived assets.
Asset impairment charges is one of our critical accounting estimates and requires management to make estimates about future events including sales growth rates, cash flows and asset fair values. We estimate fair values based on probability-weighted discounted cash flows, quoted market prices or other valuation techniques. Predicting future events is inherently an imprecise activity. If actual results are not consistent with the estimates and assumptions used in our asset impairment calculations, we may incur additional impairment charges in the near term.
SELECT COMFORT CORPORATION
AND SUBSIDIARIES
Notes to Consolidated Financial Statements – (continued)
(5) Leases
Operating Leases
Rent expense was as follows (in thousands):
|
2010
|
2009
|
2008
|
||||||||||
|
Facility Rents:
|
||||||||||||
|
Minimum rents
|
$ | 33,195 | $ | 36,040 | $ | 38,157 | ||||||
|
Contingent rents
|
3,074 | 1,507 | 1,962 | |||||||||
|
Total
|
$ | 36,269 | $ | 37,547 | $ | 40,119 | ||||||
|
Equipment Rents
|
$ | 2,259 | $ | 2,238 | $ | 3,412 | ||||||
Capital Leases
During 2010, we entered into capital leases totaling $0.5 million for certain computer equipment. During 2009, we entered into capital leases totaling $0.7 million for certain computer software. During 2008, we entered into capital leases totaling $1.0 million for certain computer and manufacturing equipment. At January 1, 2011, and January 2, 2010, $0.4 million and $0.5 million, respectively, were included in other current liabilities and $0.3 million and $0.3 million, respectively, were included in other long-term liabilities in our consolidated balance sheets.
The aggregate minimum rental commitments under operating leases and future maturities of capital leases for subsequent years are as follows (in thousands):
|
Operating
|
Capital
|
|||||||
|
2011
|
$ | 32,377 | $ | 447 | ||||
|
2012
|
26,932 | 184 | ||||||
|
2013
|
21,005 | 82 | ||||||
|
2014
|
14,495 | — | ||||||
|
2015
|
8,544 | — | ||||||
|
Thereafter
|
11,180 | — | ||||||
|
Total future minimum lease payments
|
$ | 114,533 | 713 | |||||
|
Less: amount representing interest
|
(41 | ) | ||||||
|
Present value of future minimum lease payments
|
$ | 672 | ||||||
SELECT COMFORT CORPORATION
AND SUBSIDIARIES
Notes to Consolidated Financial Statements – (continued)
(6) Debt
Credit Agreement
On March 26, 2010, we entered into a new credit agreement (“Credit Agreement”) with Wells Fargo Bank, National Association and terminated our prior credit agreement. The Credit Agreement provides a $20.0 million secured revolving credit facility for working capital and general corporate purposes, including up to $10.0 million available for issuances of letters of credit. Outstanding letters of credit reduce the amounts available under this credit facility. The Credit Agreement expires on July 1, 2012.
Any borrowings under the Credit Agreement will, at our request, be classified as either LIBOR Loans or ABR Loans (both as defined in the Credit Agreement). The rate of interest payable by us in respect of loans outstanding under the revolving credit facility is (i) with respect to LIBOR Loans, the Adjusted LIBO Rate (as defined in the Credit Agreement) for the interest period then in effect plus 3.00%, or (ii) with respect to ABR Loans, the Adjusted Base Rate (as defined in the Credit Agreement) then in effect plus 0.50%. We are subject to certain financial covenants under the Credit Agreement, including minimum fixed charge coverage ratios, maximum capital expenditure limits, minimum net worth requirements, and maintenance of an aggregate principal balance of zero under the Credit Agreement for a period of not less than 30 consecutive days in each fiscal year. The Credit Agreement is secured by a first priority security interest in our assets and those of our domestic subsidiaries.
At January 1, 2011, $17.0 million was available under the Credit Agreement, we had no borrowings and we were in compliance with all financial covenants. At January 2, 2010, $35.5 million was available under the prior credit facility, we had no borrowings and we were in compliance with all financial covenants. As of January 1, 2011, and January 2, 2010, we had outstanding letters of credit of $3.0 million and $4.5 million, respectively.
(7) Shareholders’ Equity
Stock-Based Compensation Plans
We compensate officers, directors and key employees with stock-based compensation under three stock plans approved by our shareholders in 1997, 2004 and 2010 and administered under the supervision of our Board of Directors (“Board”). At January 1, 2011, a total of 1,952,000 shares were available for future grant under the 2010 stock plan. Stock option awards are granted at exercise prices equal to the closing price of our stock on the date of grant. Generally, options vest proportionally over periods of three to four years from the dates of the grant and expire after ten years. Compensation expense is recognized ratably over the vesting period.
Stock Options
A summary of our stock option activity for the year ended January 1, 2011, is as follows (in thousands, except per share amounts):
|
Stock Options
|
Weighted- Average Exercise Price per Share
|
Weighted- Average Remaining Contractual Term
(years)
|
Aggregate Intrinsic Value (1)
|
|||||||||||||
|
Outstanding at January 2, 2010
|
4,811 | $ | 9.57 | 4.8 | $ | 9,935 | ||||||||||
|
Granted
|
666 | 9.76 | ||||||||||||||
|
Exercised
|
(1,378 | ) | 3.16 | |||||||||||||
|
Canceled/Forfeited
|
(114 | ) | 12.89 | |||||||||||||
|
Outstanding at January 1, 2011
|
3,985 | $ | 11.72 | 5.8 | $ | 8,830 | ||||||||||
|
Exercisable at January 1, 2011
|
2,230 | $ | 11.22 | 4.5 | $ | 5,128 | ||||||||||
|
(1)
|
Aggregate intrinsic value includes only those options where the current share price is equal to or greater than the share price on the date of grant.
|
SELECT COMFORT CORPORATION
AND SUBSIDIARIES
Notes to Consolidated Financial Statements – (continued)
Other information pertaining to options for the years ended January 1, 2011; January 2, 2010; and January 3, 2009; is as follows (in thousands, except per share amounts):
|
2010
|
2009
|
2008
|
||||||||||
|
Weighted-average grant date fair value of stock options granted
|
$ | 6.18 | $ | 1.17 | $ | 1.65 | ||||||
|
Total intrinsic value (at exercise) of stock options exercised
|
$ | 5,860 | $ | 140 | $ | 115 | ||||||
|
Cash received from the exercise of stock options
|
$ | 1,014 | $ | 130 | $ | 92 | ||||||
|
Stock-based compensation expense recognized in the consolidated statements of operations
|
$ | 2,491 | $ | 2,184 | $ | 2,916 | ||||||
|
Excess income tax benefits from exercise of stock options
|
$ | 1,358 | $ | — | $ | 19 | ||||||
At January 1, 2011, there was $6.0 million of total stock option compensation expense related to non-vested awards not yet recognized, which is expected to be recognized over a weighted-average period of 3.7 years.
Determining Fair Value
We estimated the fair value of stock options granted using the Black-Scholes-Merton option-pricing model and a single option award approach. Forfeitures are estimated using historical experience and projected employee turnover. A description of significant assumptions used to estimate the expected volatility, risk-free interest rate and expected terms is as follows:
Expected Volatility – Expected volatility was determined based on implied volatility of our traded options and historical volatility of our stock price.
Risk-Free Interest Rate – The risk-free interest rate was based on the implied yield available on U.S. Treasury zero-coupon issues at the date of grant with a term equal to the expected term.
Expected Term – Expected term represents the period that our stock-based awards are expected to be outstanding and was determined based on historical experience and anticipated future exercise patterns, giving consideration to the contractual terms of unexercised stock-based awards.
The assumptions used to calculate the fair value of awards granted during 2010, 2009 and 2008 using the Black-Scholes-Merton option-pricing model were as follows:
|
Valuation Assumptions
|
2010
|
2009
|
2008
|
|||||||||
|
Expected dividend yield
|
0 | % | 0 | % | 0 | % | ||||||
|
Expected volatility
|
78 | % | 89 | % | 52 | % | ||||||
|
Risk-free interest rate
|
2.0 | % | 2.4 | % | 2.5 | % | ||||||
|
Expected term (in years)
|
4.9 | 4.8 | 5.3 | |||||||||
SELECT COMFORT CORPORATION
AND SUBSIDIARIES
Notes to Consolidated Financial Statements – (continued)
Restricted and Performance Stock
We issue restricted and performance stock awards to certain employees in conjunction with our stock-based compensation plan. The awards generally cliff-vest from two to four years based on continued employment (“time based”). Compensation expense related to time-based stock awards is determined on the grant-date based on the publicly quoted fair market value of our common stock and is charged to earnings on a straight-line basis over the vesting period. Performance stock may be earned and become vested in a specific percentage depending upon the extent to which the target performance is met as of the last day of the performance cycle (“performance based”).
Total compensation expense related to time-based restricted and performance-based stock awards was $1.5 million, $1.1 million and $0.8 million, for the years ended January 1, 2011; January 2, 2010; and January 3, 2009, respectively. Restricted and performance stock activity was as follows for the year ended January 1, 2011 (in thousands, except per share amounts):
|
Restricted Stock
|
Weighted- Average Grant Date Fair Value
|
Performance Stock
|
Weighted- Average Grant Date Fair Value
|
|||||||||||||
|
Outstanding at January 2, 2010
|
314 | $ | 9.03 | 473 | $ | 5.81 | ||||||||||
|
Granted
|
184 | 9.27 | 289 | 9.75 | ||||||||||||
|
Vested
|
(36 | ) | 23.82 | (64 | ) | 24.65 | ||||||||||
|
Canceled/Forfeited
|
(15 | ) | 12.27 | (10 | ) | 22.64 | ||||||||||
|
Outstanding at January 1, 2011
|
447 | $ | 7.83 | 688 | $ | 5.48 | ||||||||||
At January 1, 2011, there was $3.7 million of unrecognized compensation expense related to non-vested restricted and performance share awards, which is expected to be recognized over a weighted-average period of 2.5 years.
Repurchases of Common Stock
On April 20, 2007, our Board authorized the repurchase of up to an additional $250.0 million of our common stock, bringing the total availability under our share repurchase program to $290.0 million. During 2010, 2009 and 2008, we did not repurchase any shares of common stock under this share repurchase program. As of January 1, 2011, the remaining authorization under our share repurchase program was $206.8 million. There is no expiration date governing the period over which we can repurchase shares. We currently have no plans to repurchase our common stock.
The cost of stock repurchases is first charged to additional paid-in capital. Once additional paid-in capital is reduced to zero, any additional amounts are charged to retained earnings (accumulated deficit).
Equity Financing
In May 2009 we entered into a securities purchase agreement with a private equity firm. During a special meeting of shareholders held August 27, 2009, our shareholders did not approve the May 2009 securities purchase agreement. During the third quarter of 2009, we expensed $3.3 million of direct, incremental costs incurred in connection with the terminated equity financing.
During the fourth quarter of 2009, we obtained $26.3 million in net proceeds from the issuance of 8.6 million shares of our common stock through a private equity placement and a public equity offering.
Dividends
We are not restricted from paying cash dividends under our credit agreement other than customary legal and contractual restrictions. However, we have not historically paid, and have no current plans to pay, cash dividends on our common stock.
SELECT COMFORT CORPORATION
AND SUBSIDIARIES
Notes to Consolidated Financial Statements – (continued)
Net Income (Loss) per Common Share
The following computations reconcile net income (loss) per share – basic with net income (loss) per share – diluted (in thousands, except per share amounts):
|
2010
|
2009
|
2008
|
||||||||||
|
Net income (loss)
|
$ | 31,568 | $ | 35,552 | $ | (70,177 | ) | |||||
|
Reconciliation of weighted-average shares outstanding:
|
||||||||||||
|
Basic weighted-average shares outstanding
|
54,005 | 45,682 | 44,186 | |||||||||
|
Effect of dilutive securities:
|
||||||||||||
|
Options
|
817 | 219 | — | |||||||||
|
Restricted shares
|
442 | 269 | — | |||||||||
|
Warrants
|
— | 28 | — | |||||||||
|
Diluted weighted-average shares outstanding
|
55,264 | 46,198 | 44,186 | |||||||||
|
Net income (loss) per share – basic
|
$ | 0.58 | $ | 0.78 | $ | (1.59 | ) | |||||
|
Net income (loss) per share – diluted
|
0.57 | 0.77 | (1.59 | ) | ||||||||
Additional potentially dilutive stock options totaling 2,486,000, 4,405,000 and 5,124,000 for the years 2010, 2009 and 2008, respectively, have been excluded from diluted EPS because these securities’ exercise prices were greater than the average market price of our common shares.
In addition, we excluded certain shares of restricted stock and stock options from our diluted net income (loss) per share calculations as their inclusion would have had an anti-dilutive effect on our net income (loss) per diluted share (i.e., resulted in a lower loss per share). For 2008, we excluded 444,000 shares of restricted stock and 212,000 stock options from our computation of diluted net loss per share.
(8) Other Expense, Net
Other expense, net, consisted of the following (in thousands):
|
2010
|
2009
|
2008
|
||||||||||
|
Interest expense
|
$ | 838 | $ | 5,708 | $ | 4,120 | ||||||
|
Write-off unamortized debt cost
|
1,114 | 291 | 131 | |||||||||
|
Interest income
|
(59 | ) | (16 | ) | (90 | ) | ||||||
|
Capitalized interest expense
|
— | — | (876 | ) | ||||||||
|
Other expense, net
|
$ | 1,893 | $ | 5,983 | $ | 3,285 | ||||||
SELECT COMFORT CORPORATION
AND SUBSIDIARIES
Notes to Consolidated Financial Statements – (continued)
(9) Income Taxes
The expense (benefit) for income taxes consisted of the following (in thousands):
|
2010
|
2009
|
2008
|
||||||||||
|
Current:
|
||||||||||||
|
Federal
|
$ | 15,812 | $ | (2,763 | ) | $ | (26,910 | ) | ||||
|
State
|
758 | 103 | (732 | ) | ||||||||
| 16,570 | (2,660 | ) | (27,642 | ) | ||||||||
|
Deferred:
|
||||||||||||
|
Federal
|
564 | (16,231 | ) | 26,853 | ||||||||
|
State
|
1,788 | (1,971 | ) | (1,777 | ) | |||||||
| 2,352 | (18,202 | ) | 25,076 | |||||||||
|
Income tax expense (benefit)
|
$ | 18,922 | $ | (20,862 | ) | $ | (2,566 | ) | ||||
The following table provides a reconciliation of our income tax expense (benefit) at the statutory federal tax rate to our actual income tax expense (benefit):
|
2010
|
2009
|
2008
|
||||||||||
|
Statutory federal income tax
|
$ | 17,671 | $ | 5,141 | $ | (25,460 | ) | |||||
|
State income taxes, net of federal benefit
|
1,478 | 688 | (3,258 | ) | ||||||||
|
Manufacturing deduction
|
(1,379 | ) | — | — | ||||||||
|
Changes in unrecognized tax benefits
|
895 | 730 | — | |||||||||
|
Change in valuation allowance
|
— | (26,840 | ) | 26,840 | ||||||||
|
Other
|
257 | (581 | ) | (688 | ) | |||||||
| $ | 18,922 | $ | (20,862 | ) | $ | (2,566 | ) | |||||
We file income tax returns with the U.S. federal government and various state jurisdictions. In the normal course of business, we are subject to examination by federal and state taxing authorities. We are no longer subject to federal or state income tax examinations for years prior to 2004.
Deferred Income Taxes
The tax effects of temporary differences that give rise to deferred income taxes were as follows (in thousands):
|
2010
|
2009
|
|||||||
|
Deferred tax assets:
|
||||||||
|
Current:
|
||||||||
|
Compensation and benefits
|
$ | 1,254 | $ | 1,193 | ||||
|
Warranty and returns liabilities
|
1,584 | 1,775 | ||||||
|
Deferred rent and lease incentives
|
911 | 953 | ||||||
|
Other
|
570 | 1,231 | ||||||
|
Long-term:
|
||||||||
|
Property and equipment
|
3,541 | 3,188 | ||||||
|
Stock-based compensation
|
5,964 | 6,957 | ||||||
|
Deferred rent and lease incentives
|
2,416 | 2,701 | ||||||
|
Warranty liability
|
1,419 | 2,096 | ||||||
|
Net operating loss, capital loss and tax credit carryforwards
|
2,773 | 3,418 | ||||||
|
Other
|
469 | 806 | ||||||
|
Total gross deferred tax assets
|
20,901 | 24,318 | ||||||
|
Valuation allowance
|
(639 | ) | (94 | ) | ||||
|
Total net deferred tax assets
|
$ | 20,262 | $ | 24,224 | ||||
SELECT COMFORT CORPORATION
AND SUBSIDIARIES
Notes to Consolidated Financial Statements – (continued)
At January 1, 2011, we had net operating loss carryforwards for state income tax purposes of $43.4 million which will expire between 2011 and 2029.
We evaluate our deferred income taxes quarterly to determine if valuation allowances are required. As part of this evaluation, we assess whether valuation allowances should be established for any deferred tax assets that are not considered more likely than not to be realized, using all available evidence, both positive and negative. This assessment considers, among other matters, the nature, frequency, and severity of recent losses, forecasts of future profitability, taxable income in available carryback periods and tax planning strategies. In making such judgments, significant weight is given to evidence that can be objectively verified.
In 2008 based on all available evidence, we established a $26.8 million valuation allowance against deferred tax assets. In 2009, after reviewing all evidence, we concluded that it was more likely than not that substantially all of our deferred tax assets would be realizable. Our conclusion was based on the quality and quantity of positive evidence, including our return to profitability in 2009, our expectations of profitability going forward, successful renegotiation of our credit facility, additional equity infusions, the significant improvement in our liquidity position, actions taken to reduce our cost structure, all providing support for our ability to rely on our estimates of future profitability. Based on that evidence, much of it occurring in the fourth quarter, we reversed substantially all of the deferred tax valuation allowance at the end of 2009.
Unrecognized Tax Benefits
A reconciliation of the beginning and ending amounts of unrecognized tax benefits for 2009 and 2010 was as follows (in thousands):
|
|
Federal
And
State Tax
|
|||
|
Balance January 3, 2009
|
$ | 152 | ||
|
Increases related to prior-year tax positions
|
243 | |||
|
Increases related to current-year tax positions
|
980 | |||
|
Balance January 2, 2010
|
$ | 1,375 | ||
|
Increases related to prior-year tax positions
|
621 | |||
|
Decreases related to prior-year tax positions
|
(572 | ) | ||
|
Settlements with taxing authorities
|
(138 | ) | ||
|
Increases related to current-year tax positions
|
68 | |||
|
Balance January 1, 2011
|
$ | 1,354 | ||
We recognize interest and penalties (not included in the "Federal and State Tax" above) as components of income tax expense. In 2010, 2009 and 2008, we included $247,000, $78,000 and $3,000, respectively, of penalties and interest in income tax expense (benefit). At January 1, 2011, and January 2, 2010, we had accrued interest and penalties of $292,000 and $81,000, respectively.
At January 1, 2011, and January 2, 2010, the total amounts of unrecognized tax benefits for uncertain tax positions that if recognized, would impact the effective tax rate were $1.6 million and $0.9 million, respectively. The amount of unrecognized tax benefits are not expected to change materially within the next 12 months.
(10) Employee Benefit Plans
Profit Sharing and 401(k) Plan
Under our profit sharing and 401(k) plan, eligible employees may defer up to 50% of their compensation on a pre-tax basis, subject to Internal Revenue Service limitations. Each year, we may make a discretionary contribution equal to a percentage of the employee’s contribution. There was no contribution during 2009. During 2010 and 2008, our contributions, net of forfeitures, were $1.0 million and $1.9 million, respectively.
SELECT COMFORT CORPORATION
AND SUBSIDIARIES
Notes to Consolidated Financial Statements – (continued)
Employee Stock Purchase Plan
We had an employee stock purchase plan (“ESPP”) which permitted employees to purchase our common stock at a 5% discount based on the average price of the stock on the last business day of the offering period (calendar quarter basis). Purchases were funded by employee payroll deductions during the offering period. We discontinued our ESPP plan at the beginning of 2009. At January 3, 2009, ESPP participants had accumulated $132,000 to purchase our common stock. Employees purchased 342,561 shares in 2009 and 236,847 shares in 2008 under this plan.
(11) Commitments and Contingencies
We are involved from time to time in various legal proceedings arising in the ordinary course of our business, including primarily commercial, product liability, employment and intellectual property claims. In accordance with generally accepted accounting principles in the United States, we record a liability in our consolidated financial statements with respect to any of these matters when it is both probable that a liability has been incurred and the amount of the liability can be reasonably estimated. At January 1, 2011, our consolidated financial statements include reserves of $1.6 million with respect to contingent liabilities that we determined to be both probable and reasonably estimable. With respect to pending legal proceedings, we believe that we have valid defenses to claims asserted against us and we do not expect the outcome of these matters to have a material effect on our consolidated results of operations, financial position or cash flows. Litigation, however, is inherently unpredictable, and it is possible that the ultimate outcome of one or more claims asserted against us could adversely impact our results of operations, financial position or cash flows. We expense legal costs as incurred.
Consumer Credit Arrangements
We refer customers seeking extended financing to certain third party financiers (“Card Servicers”). The Card Servicers, if credit is granted, establish the interest rates, fees, and all other terms and conditions of the customer’s account based on their evaluation of the creditworthiness of the customers. As the receivables are owned by the Card Servicers, at no time are the receivables purchased or acquired from us. We are not liable to the Card Servicers for our customers’ credit defaults. In connection with customer purchases financed under these arrangements, the Card Servicers pay us an amount equal to the total amount of such purchases, net of promotional related discounts. The amounts due from Card Servicers under the program were included in accounts receivable and totaled $0.5 million and $1.2 million as of January 1, 2011, and January 2, 2010, respectively.
Our agreement, under which GE Money Bank offers to our qualified customers revolving credit arrangements to finance purchases from us (the “GE Agreement”), contains certain financial covenants, including a maximum leverage ratio and a minimum interest coverage ratio. We were in compliance with all financial covenants at January 1, 2011.
Commitments
As of January 1, 2011, we had $4.3 million of inventory purchase commitments with our suppliers as part of the normal course of business. There are a limited number of supply contracts that contain penalty provisions for failure to purchase contracted quantities. We do not currently expect any payments under these provisions.
At January 1, 2011, we had entered into four lease commitments for future retail store locations. These lease commitments provide for minimum rentals over the next six years, which if consummated based on current cost estimates, would approximate $1.5 million over the initial lease term. These minimum rentals have been included in the future minimum lease payments in Note 5, Leases.
SELECT COMFORT CORPORATION
AND SUBSIDIARIES
Notes to Consolidated Financial Statements – (continued)
(12) Summary of Quarterly Financial Data (unaudited)
The following is a condensed summary of actual quarterly results for 2010 and 2009 (in thousands, except per share amounts):
|
2010
|
First
|
Second
|
Third
|
Fourth
|
||||||||||||
|
Net sales
|
$ | 157,953 | $ | 138,952 | $ | 160,103 | $ | 148,668 | ||||||||
|
Gross profit
|
98,084 | 86,465 | 99,989 | 93,725 | ||||||||||||
|
Operating income
|
14,189 | 9,937 | 16,780 | 11,477 | ||||||||||||
|
Net income
|
7,760 | 6,202 | 10,488 | 7,118 | ||||||||||||
|
Net income per share – diluted
|
0.14 | 0.11 | 0.19 | 0.13 | ||||||||||||
|
2009
|
First
|
Second
|
Third
|
Fourth
|
||||||||||||
|
Net sales
|
$ | 139,614 | $ | 120,647 | $ | 147,470 | $ | 136,471 | ||||||||
|
Gross profit
|
81,784 | 74,340 | 93,555 | 85,781 | ||||||||||||
|
Operating income
|
262 | 952 | 11,980 | 7,479 | ||||||||||||
|
Net (loss) income
|
(2,695 | ) | (3,961 | ) | 6,899 | 35,309 | ||||||||||
|
Net (loss) income per share – diluted
|
(0.06 | ) | (0.09 | ) | 0.15 | 0.69 | ||||||||||
ITEM 9. CHANGES IN AND DISAGREEMENTS WITH ACCOUNTANTS ON ACCOUNTING AND FINANCIAL DISCLOSURE
Effective March 9, 2010 (“Date of Dismissal”), the Audit Committee of our Board of Directors approved the dismissal of KPMG LLP (“KPMG”) as our independent registered public accounting firm. Also effective March 9, 2010, the Audit Committee approved the engagement of Deloitte & Touche LLP (“Deloitte”) as our independent registered public accounting firm for the year ending January 1, 2011.
KPMG’s report on our consolidated financial statements as of and for the 2009 fiscal year ended January 2, 2010 did not contain any adverse opinion or disclaimer of opinion, nor was it qualified or modified as to uncertainty, audit scope, or accounting principles, except that such report contained a separate paragraph that stated:
“As described in Note 1 to the consolidated financial statements, the Company adopted the provisions of SFAS 157, Fair Value Measurements (included in FASB ASC Topic 820, Fair Value Measurements and Disclosures), and SFAS 159, The Fair Value Option for Financial Assets and Liabilities (included in FASB ASC Topic 825, Financial Instruments), on December 30, 2007 and FASB Interpretation No. 48, Accounting for Uncertainty in Income Taxes (included in FASB ASC Topic 740, Income Taxes), on December 31, 2006.”
KPMG’s report on our consolidated financial statements as of and for the 2008 fiscal year ended January 3, 2009 did not contain an adverse opinion or disclaimer of opinion, nor was it qualified or modified as to uncertainty, audit scope or accounting principles, except that such report contained the following qualification:
“The accompanying consolidated financial statements have been prepared assuming that the Company will continue as a going concern. As discussed in Note 1 to the consolidated financial statements, the Company’s losses from operations and inability to generate sufficient cash flow to meet obligations and sustain operations raises substantial doubt about its ability to continue as a going concern. Management’s plans in regard to these matters are also described in Note 1. The consolidated financial statements do not include any adjustments that might result from the outcome of this uncertainty.”
During our two most recent fiscal years ended January 2, 2010 and January 3, 2009 and the subsequent interim period through the Date of Dismissal, there were no disagreements with KPMG on any matter of accounting principles or practices, financial statement disclosure, or auditing scope or procedure which, if not resolved to KPMG’s satisfaction, would have caused KPMG to make reference to the subject matter of the disagreement in connection with its report on our financial statements for such years. Further, there were no reportable events as defined in Item 304(a)(1)(v) of Regulation S-K occurring within our two most recent fiscal years and the subsequent interim period through the Date of Dismissal.
We provided KPMG with a copy of the foregoing disclosures and requested KPMG to furnish us with a letter addressed to the Securities and Exchange Commission stating whether it agrees with the foregoing disclosures and, if not, stating the respects in which it does not agree. A copy of KPMG’s letter furnished in response to this request was included as Exhibit 16.1 to our Form 8-K dated March 9, 2010 and filed with the SEC on March 15, 2010.
During our two most recent fiscal years and the subsequent interim period through the Date of Dismissal, neither the Company nor anyone on its behalf consulted Deloitte regarding the application of accounting principles to a specified transaction, either completed or proposed, or the type of audit opinion that might be rendered on our financial statements, or any other matters or reportable events listed in Items 304(a)(1)(iv) and (v) of Regulation S-K.
ITEM 9A. CONTROLS AND PROCEDURES
Conclusions Regarding the Effectiveness of Disclosure Controls and Procedures
We maintain disclosure controls and procedures, as defined in Exchange Act Rule 13a-15(e), that are designed to ensure that information required to be disclosed by the Company in the reports that it files or submits under the Securities Exchange Act of 1934, as amended, is recorded, processed, summarized, and reported within the time periods specified in the Securities and Exchange Commission’s rules and forms, and that such information is accumulated and communicated to the Company’s management, including its principal executive officer and principal financial officer, or persons performing similar functions, as appropriate to allow timely decisions regarding required disclosure. Our management, with the participation of our chief executive officer and chief financial officer, evaluated the effectiveness of the design and operation of our disclosure controls and procedures as of the end of the period covered by this annual report. Based on this evaluation, our principal executive officer and principal financial officer concluded that our disclosure controls and procedures were effective as of the end of the period covered by this annual report.
Management’s Report on Internal Control Over Financial Reporting
Select Comfort’s management is responsible for establishing and maintaining adequate internal control over financial reporting, as such term is defined in Exchange Act Rule 13a-15(f). Our internal control over financial reporting is a process designed to provide reasonable assurance regarding the reliability of financial reporting and the preparation of financial statements for external purposes in accordance with generally accepted accounting principles. Our internal control over financial reporting includes those policies and procedures that (1) pertain to the maintenance of records that, in reasonable detail, accurately and fairly reflect the transactions and dispositions of the assets of the Company; (2) provide reasonable assurance that transactions are recorded as necessary to permit preparation of financial statements in accordance with U.S. generally accepted accounting principles, and that receipts and expenditures of the Company are being made only in accordance with authorizations of management and directors of the Company; and (3) provide reasonable assurance regarding prevention or timely detection of unauthorized acquisition, use, or disposition of the Company’s assets that could have a material effect on the financial statements.
Because of its inherent limitations, internal control over financial reporting may not prevent or detect misstatements. Also, projections of any evaluation of effectiveness to future periods are subject to the risk that controls may become inadequate because of changes in conditions, or that the degree of compliance with the policies or procedures may deteriorate.
Select Comfort’s management is responsible for establishing and maintaining adequate internal control over financial reporting, as such term is defined in Exchange Act Rules 13a-15(f). Management, with the participation of our principal executive officer and principal financial officer, evaluated the effectiveness of our internal control over financial reporting based on the framework in Internal Control – Integrated Framework issued by the Committee of Sponsoring Organizations of the Treadway Commission. Based on this evaluation under these criteria, management concluded that our internal control over financial reporting was effective as of January 1, 2011.
Fourth Quarter Changes in Internal Control Over Financial Reporting
There were no changes in the Company’s internal control over financial reporting during the quarter ended January 1, 2011 that have materially affected, or are reasonably likely to materially affect, the Company’s internal control over financial reporting.
ITEM 9B. OTHER INFORMATION
None.
ITEM 10. DIRECTORS, EXECUTIVE OFFICERS AND CORPORATE GOVERNANCE
The information under the captions “Election of Directors,” “Corporate Governance” and “Section 16(a) Beneficial Ownership Reporting Compliance” in our Proxy Statement for our 2011 Annual Meeting of Shareholders is incorporated herein by reference. Information concerning our executive officers is included in Part I of this report under the caption “Executive Officers of the Registrant.”
We have adopted a Code of Business Conduct applicable to our directors, officers and employees (including our principal executive officer, principal financial officer, principal accounting officer and controller). The Code of Business Conduct is available on the Investor Relations section of our Web site at http://www.selectcomfort.com. In the event that we amend or waive any of the provisions of the Code of Business Conduct applicable to our principal executive officer, principal financial officer, principal accounting officer and controller, we intend to disclose the same on our Web site at http://www.selectcomfort.com.
ITEM 11. EXECUTIVE COMPENSATION
The information under the caption “Executive Compensation” in our Proxy Statement for our 2011 Annual Meeting of Shareholders is incorporated herein by reference.
ITEM 12. SECURITY OWNERSHIP OF CERTAIN BENEFICIAL OWNERS AND MANAGEMENT AND RELATED STOCKHOLDER MATTERS
The information under the caption “Equity Compensation Plan Information” in Item 5 of this Annual Report on Form 10-K and the information under the caption “Stock Ownership of Management and Certain Beneficial Owners” in our Proxy Statement for our 2011 Annual Meeting of Shareholders is incorporated herein by reference.
ITEM 13. CERTAIN RELATIONSHIPS AND RELATED TRANSACTIONS, AND DIRECTOR INDEPENDENCE
The information under the caption “Corporate Governance” in our Proxy Statement for our 2011 Annual Meeting of Shareholders is incorporated herein by reference.
ITEM 14. PRINCIPAL ACCOUNTING FEES AND SERVICES
The information under the caption “Ratification of Independent Registered Public Accounting Firm” in our Proxy Statement for our 2011 Annual Meeting of Shareholders is incorporated herein by reference.
ITEM 15. EXHIBITS, FINANCIAL STATEMENT SCHEDULES
|
(a)
|
Consolidated Financial Statements and Schedule
|
|
|
(1)
|
Financial Statements
|
All financial statements as set forth under Item 8 of this report
|
|
(2)
|
Consolidated Financial Statement Schedule
|
The following Report and financial statement schedule are included in this Part IV.
Schedule II – Valuation and Qualifying Accounts
All other schedules are omitted because they are not applicable or the required information is included in the consolidated financial statements or notes thereto.
|
|
(3)
|
Exhibits
|
The exhibits to this Report are listed in the Exhibit Index below.
We will furnish a copy of any of the exhibits referred to above at a reasonable cost to any shareholder upon receipt of a written request. Requests should be sent to: Select Comfort Corporation, Investor Relations Department, 9800 59th Avenue North, Minneapolis, Minnesota 55442.
The following is a list of each management contract or compensatory plan or arrangement required to be filed as an exhibit to this Annual Report on Form 10-K pursuant to Item 15(c):
|
|
1.
|
Select Comfort Corporation 1997 Stock Incentive Plan, as amended and restated
|
|
|
2.
|
Form of Incentive Stock Option Agreement under the 1997 Stock Plan
|
|
|
3.
|
Form of Performance Based Stock Option Agreement under the 1997 Stock Plan
|
|
|
4.
|
Select Comfort Corporation 2004 Stock Incentive Plan (Amended and Restated as of January 1, 2007)
|
|
|
5.
|
Form of Nonstatutory Stock Option Award Agreement under the 2004 Stock Incentive Plan
|
|
|
6.
|
Form of Restricted Stock Award Agreement under the 2004 Stock Incentive Plan
|
|
|
7.
|
Form of Performance Stock Award Agreement under the 2004 Stock Incentive Plan
|
|
|
8.
|
Form of Nonstatutory Stock Option Award Agreement (Subject to Performance Adjustment) under the 2004 Stock Incentive Plan
|
|
|
9.
|
Select Comfort Corporation 2010 Omnibus Incentive Plan
|
|
|
10.
|
Form of Nonstatutory Stock Option Award Agreement under the 2010 Omnibus Incentive Plan
|
|
|
11.
|
Form of Restricted Stock Award Agreement under the 2010 Omnibus Incentive Plan
|
|
|
12.
|
Form of Performance Stock Award Agreement under the 2010 Omnibus Incentive Plan
|
|
|
13.
|
Select Comfort Profit Sharing and 401(K) Plan – 2007 Restatement
|
|
|
14.
|
Select Comfort Executive Investment Plan, as Amended and Restated October 29, 2008
|
|
|
15.
|
Employment Letter from the Company to William R. McLaughlin dated March 3, 2000
|
|
|
16.
|
Employment Letter from the Company to William R. McLaughlin dated March 2, 2006
|
|
|
17.
|
Letter Agreement between William R. McLaughlin and Select Comfort Corporation dated as of February 21, 2008
|
|
|
18.
|
Amended and Restated Non-Statutory Stock Option Agreement between Select Comfort Corporation and William R. McLaughlin dated as of April 22, 2008
|
|
|
19.
|
Employment Letter from the Company to Kathryn V. Roedel dated March 8, 2005
|
|
|
20.
|
Employment Letter from the Company to Wendy L. Schoppert dated March 15, 2005
|
|
|
21.
|
Employment Letter from the Company to Mark A. Kimball dated April 22, 1999
|
|
|
22.
|
Summary of Executive Health Program
|
|
|
23.
|
Summary of Executive Tax and Financial Planning Program
|
|
|
24.
|
Amended and Restated Select Comfort Corporation Executive Severance Pay Plan
|
|
|
25.
|
First Amendment to Amended and Restated Select Comfort Corporation Executive Severance Pay Plan
|
|
|
26.
|
Summary of Non-Employee Director Compensation
|
SIGNATURES
Pursuant to the requirements of Section 13 or 15(d) of the Securities Exchange Act of 1934, the Registrant has duly caused this report to be signed on its behalf by the undersigned, thereunto duly authorized.
|
|
SELECT COMFORT CORPORATION
|
|
|
|
(Registrant)
|
|
|
|
|
|
|
Dated: February 24, 2011
|
By:
|
/s/ William R. McLaughlin
|
|
|
|
William R. McLaughlin
|
|
|
|
Chief Executive Officer
|
|
|
|
(principal executive officer)
|
|
|
|
|
|
|
By:
|
/s/ James C. Raabe
|
|
|
|
James C. Raabe
|
|
|
|
Chief Financial Officer
|
|
|
|
(principal financial officer)
|
|
By:
|
/s/ Robert J. Poirier
|
|
|
|
Robert J. Poirier
|
|
|
|
Chief Accounting Officer
|
|
|
|
(principal accounting officer)
|
|
POWER OF ATTORNEY
Know all persons by these presents, that each person whose signature appears below constitutes and appoints William R. McLaughlin, James C. Raabe and Mark A. Kimball, and each of them, as such person’s true and lawful attorneys-in-fact and agents, with full power of substitution and resubstitution, for such person and in such person’s name, place and stead, in any and all capacities, to sign any and all amendments to this Report, and to file the same, with all exhibits thereto, and other documents in connection therewith, with the Securities and Exchange Commission, granting unto said attorneys-in-fact and agents, and each of them, full power and authority to do and perform each and every act and thing requisite and necessary to be done in connection therewith, as fully to all intents and purposes as such person might or could do in person, hereby ratifying and confirming that all said attorneys-in-fact and agents, or any of them or their or such person’s substitute or substitutes, may lawfully do or cause to be done by virtue thereof.
Pursuant to the requirements of the Securities Exchange Act of 1934, this Report has been signed below by the following persons on behalf of the Registrant and in the capacities and on the date or dates indicated.
|
NAME
|
|
TITLE
|
|
DATE
|
|
|
|
|
|
|
|
/s/ Jean-Michel Valette
|
|
Chairman of the Board
|
|
February 24, 2011
|
|
Jean-Michel Valette
|
|
|
|
|
|
|
|
|
|
|
|
/s/ William R. McLaughlin
|
|
Director
|
|
February 24, 2011
|
|
William R. McLaughlin
|
|
|
|
|
|
|
|
|
|
|
|
/s/ Stephen L. Gulis, Jr.
|
|
Director
|
|
February 24, 2011
|
|
Stephen L. Gulis, Jr.
|
|
|
|
|
|
|
|
|
|
|
|
/s/ Christopher P. Kirchen
|
|
Director
|
|
February 24, 2011
|
|
Christopher P. Kirchen
|
|
|
|
|
|
|
|
|
|
|
|
/s/ David T. Kollat
|
|
Director
|
|
February 24, 2011
|
|
David T. Kollat
|
|
|
|
|
|
|
|
|
|
|
|
/s/ Brenda J. Lauderback
|
|
Director
|
|
February 24, 2011
|
|
Brenda J. Lauderback
|
|
|
|
|
|
|
|
|
|
|
|
/s/ Michael A. Peel
|
|
Director
|
|
February 24, 2011
|
|
Michael A. Peel
|
|
|
|
|
|
|
|
|
|
|
|
/s/ Ervin R. Shames
|
|
Director
|
|
February 24, 2011
|
|
Ervin R. Shames
|
|
|
|
|
SELECT COMFORT CORPORATION
EXHIBIT INDEX TO ANNUAL REPORT ON FORM 10-K
FOR THE YEAR ENDED JANUARY 1, 2011
|
Exhibit
No.
|
|
Description
|
|
Method Of Filing
|
|
|
|
|
|
|
|
3.1
|
|
Third Restated Articles of Incorporation of the Company, as amended
|
|
Incorporated by reference to Exhibit 3.1 contained in Select Comfort’s Annual Report on Form 10-K for the fiscal year ended January 1, 2000
(File No. 0-25121)
|
|
|
|
|
|
|
|
3.2
|
|
Articles of Amendment to Third Restated Articles of Incorporation of the Company
|
|
Incorporated by reference to Exhibit 3.1 contained in Select Comfort’s Current Report on Form 8-K filed May 16, 2006 (File No. 0-25121)
|
|
|
|
|
|
|
|
3.3
|
Articles of Amendment to Third Restated Articles of Incorporation of the Company
|
Incorporated by reference to Exhibit 3.1 contained in Select Comfort’s Current Report on Form 8-K filed May 25, 2010 (File No. 0-25121)
|
||
|
|
|
|
|
|
|
3.4
|
|
Restated Bylaws of the Company
|
|
Incorporated by reference to Exhibit 3.1 contained in Select Comfort’s Current Report on Form 8-K filed December 20, 2010 (File No. 0-25121)
|
|
|
|
|
|
|
|
10.1
|
|
Net Lease Agreement dated December 3, 1993 between the Company and Opus Corporation
|
|
Incorporated by reference to Exhibit 10.1 contained in Select Comfort’s Registration Statement on Form S-1, as amended
(Reg. No. 333-62793)
|
|
|
|
|
|
|
|
10.2
|
|
Amendment of Lease dated August 10, 1994 between the Company and Opus Corporation
|
|
Incorporated by reference to Exhibit 10.2 contained in the Select Comfort’s Registration Statement on Form S-1, as amended
(Reg. No. 333-62793)
|
|
|
|
|
|
|
|
10.3
|
|
Second Amendment to Lease dated May 10, 1995 between the Company and Rushmore Plaza Partners Limited Partnership (successor to Opus Corporation)
|
|
Incorporated by reference to Exhibit 10.3 contained in Select Comfort’s Registration Statement on Form S-1, as amended
(Reg. No. 333-62793)
|
|
|
|
|
|
|
|
10.4
|
|
Letter Agreement dated as of October 5, 1995 between the Company and Rushmore Plaza Partners Limited Partnership
|
|
Incorporated by reference to Exhibit 10.4 contained in Select Comfort’s Registration Statement on Form S-1, as amended
(Reg. No. 333-62793)
|
|
|
|
|
|
|
|
10.5
|
|
Third Amendment of Lease, Assignment and Assumption of Lease and Consent dated as of January 1, 1996 among the Company, Rushmore Plaza Partners Limited Partnership and Select Comfort Direct Corporation
|
|
Incorporated by reference to Exhibit 10.5 contained in Select Comfort’s Registration Statement on Form S-1, as amended
(Reg. No. 333-62793)
|
|
|
|
|
|
|
|
10.6
|
|
Fourth Amendment to Lease dated June 30, 2003 between Cabot Industrial Properties, L.P. (successor to Rushmore Plaza Partners Limited Partnership) and Select Comfort Direct Corporation
|
|
Incorporated by reference to Exhibit 10.6 contained in Select Comfort’s Annual report on Form 10-K for the fiscal year ended January 3, 2004 (File No. 0-25121)
|
|
Exhibit
No.
|
|
Description
|
|
Method Of Filing
|
|
|
|
|
|
|
|
10.7
|
|
Fifth Amendment to Lease dated August 28, 2006 between Cabot Industrial Properties, L.P. (successor to Rushmore Plaza Partners Limited Partnership) and Select Comfort Direct Corporation
|
|
Incorporated by reference to Exhibit 10.1 contained in Select Comfort’s Quarterly report on Form 10-Q for the quarter ended September 30, 2006 (File No. 0-25121)
|
|
|
|
|
|
|
|
10.8
|
|
Lease Agreement dated as of September 19, 2002 between the Company and Blind John, LLC (as successor to Frastacky (US) Properties Limited Partnership)
|
|
Incorporated by reference to Exhibit 10.6 contained in Select Comfort’s Annual Report on Form 10-K for the fiscal year ended December 28, 2002 (File No. 0-25121)
|
|
|
|
|
|
|
|
10.9
|
|
Lease Agreement dated September 30, 1998 between the Company and ProLogis Development Services Incorporated
|
|
Incorporated by reference to Exhibit 10.12 contained in Select Comfort’s Annual Report on Form 10-K for the fiscal year ended December 28, 2002 (File No. 0-25121)
|
|
|
|
|
|
|
|
10.10
|
|
Net Lease Agreement (Build-to-Suit) by and between Opus Northwest LLC, as Landlord, and Select Comfort Corporation, as Tenant, dated July 26, 2006
|
|
Incorporated by reference to Exhibit 10.1 contained in Select Comfort’s Quarterly report on Form 10-Q for the quarter ended July 1, 2006 (File No. 0-25121)
|
|
|
|
|
|
|
|
10.11
|
|
Select Comfort Corporation 1997 Stock Incentive Plan, as amended and restated
|
|
Incorporated by reference to Exhibit 10.8 contained in Select Comfort’s Quarterly Report on Form 10-Q for the quarter ended June 30, 2001 (File No. 0-25121)
|
|
|
|
|
|
|
|
10.12
|
|
Form of Incentive Stock Option Agreement under the 1997 Stock Plans
|
|
Incorporated by reference to Exhibit 10.16 contained in the Company’s Registration Statement on Form S-1, as amended
(Reg. No. 333-62793)
|
|
|
|
|
|
|
|
10.13
|
|
Form of Performance Based Stock Option Agreement under the 1997 Stock Plans
|
|
Incorporated by reference to Exhibit 10.17 contained in Select Comfort’s Registration Statement on Form S-1, as amended
(Reg. No. 333-62793)
|
|
|
|
|
|
|
|
10.14
|
|
Select Comfort Corporation 2004 Stock Incentive Plan (Amended and Restated as of January 1, 2007)
|
|
Incorporated by reference to Exhibit 10.16 contained in Select Comfort’s Annual Report on Form 10-K for the fiscal year ended December 30, 2006 (File No. 0-25121)
|
|
|
|
|
|
|
|
10.15
|
|
Form of Nonstatutory Stock Option Award Agreement under the Select Comfort Corporation 2004 Stock Incentive Plan
|
|
Incorporated by reference to Exhibit 10.28 contained in Select Comfort’s Annual Report on Form 10-K for the fiscal year ended December 31, 2005 (File No. 0-25121)
|
|
|
|
|
|
|
|
10.16
|
|
Form of Restricted Stock Award Agreement under the Select Comfort Corporation 2004 Stock Incentive Plan
|
|
Incorporated by reference to Exhibit 10.29 contained in Select Comfort’s Annual Report on Form 10-K for the fiscal year ended December 31, 2005 (File No. 0-25121)
|
|
|
|
|
|
|
|
10.17
|
|
Form of Performance Stock Award Agreement under the Select Comfort Corporation 2004 Stock Incentive Plan
|
|
Incorporated by reference to Exhibit 10.30 contained in Select Comfort’s Annual Report on Form 10-K for the fiscal year ended December 31, 2005 (File No. 0-25121)
|
|
Exhibit
No.
|
|
Description
|
|
Method Of Filing
|
|
|
|
|
|
|
|
10.18
|
|
Form of Nonstatutory Stock Option Award Agreement (Subject to Performance Adjustment) under the Select Comfort Corporation 2004 Stock Incentive Plan
|
|
Incorporated by reference to Exhibit 10.20 contained in Select Comfort’s Annual Report on Form 10-K for the fiscal year ended December 30, 2006 (File No. 0-25121)
|
|
|
|
|
|
|
|
10.19
|
|
Select Comfort Corporation 2010 Omnibus Incentive Plan
|
|
Incorporated by reference to Exhibit 10.1 contained in Select Comfort’s Current Report on Form 8-K filed May 25, 2010 (File No. 0-25121)
|
|
Form of Nonstatutory Stock Option Award Agreement under the 2010 Omnibus Incentive Plan
|
Filed herewith
|
|||
|
Form of Restricted Stock Award Agreement under the 2010 Omnibus Incentive Plan
|
Filed herewith
|
|||
|
Form of Performance Stock Award Agreement under the 2010 Omnibus Incentive Plan
|
Filed herewith
|
|||
|
10.23
|
|
Select Comfort Profit Sharing and 401(K) Plan – 2007 Restatement
|
|
Incorporated by reference to Exhibit 10.22 contained in Select Comfort’s Annual Report on Form 10-K for the fiscal year ended December 30, 2006 (File No. 0-25121)
|
|
|
|
|
|
|
|
10.24
|
|
Select Comfort Executive Investment Plan, as Amended and Restated October 29, 2008
|
|
Incorporated by reference to Exhibit 10.21 contained in Select Comfort’s Annual Report on Form 10-K for the fiscal year ended January 3, 2009 (File No. 0-25121).
|
|
|
|
|
|
|
|
10.25
|
|
Employment Letter from the Company to William R. McLaughlin dated March 3, 2000
|
|
Incorporated by reference to Exhibit 10.1 contained in Select Comfort’s Quarterly Report on Form 10-Q for the quarter ended April 1, 2000 (File No. 0-25121)
|
|
|
|
|
|
|
|
10.26
|
|
Employment Letter from the Company to William R. McLaughlin dated March 2, 2006
|
|
Incorporated by reference to Exhibit 10.1 contained in Select Comfort’s Current Report on Form 8-K filed March 6, 2006 (File No. 0-25121)
|
|
|
|
|
|
|
|
10.27
|
|
Letter Agreement between William R. McLaughlin and Select Comfort Corporation dated as of February 21, 2008
|
|
Incorporated by reference to Exhibit 10.1 contained in Select Comfort’s Current Report on Form 8-K filed February 27, 2008
(File No. 0-25121)
|
|
|
|
|
|
|
|
10.28
|
|
Amended and Restated Non-Statutory Stock Option Agreement between Select Comfort Corporation and William R. McLaughlin dated as of April 22, 2008
|
|
Incorporated by reference to Exhibit 10.1 contained in Select Comfort’s Current Report on Form 8-K filed April 24, 2008 (File No. 0-25121)
|
|
10.29
|
|
Employment Letter from the Company to Kathryn V. Roedel dated March 8, 2005
|
|
Incorporated by reference to Exhibit 10.17 contained in Select Comfort’s Annual Report on Form 10-K for the fiscal year ended December 31, 2005 (File No. 0-25121)
|
|
|
|
|
|
|
|
10.30
|
|
Employment Letter from the Company to Wendy L. Schoppert dated March 15, 2005
|
|
Incorporated by reference to Exhibit 10.18 contained in Select Comfort’s Annual Report on Form 10-K for the fiscal year ended December 31, 2005 (File No. 0-25121)
|
|
Exhibit
No.
|
|
Description
|
|
Method Of Filing
|
|
|
|
|
|
|
|
10.31
|
|
Employment Letter from the Company to Mark A. Kimball dated April 22, 1999
|
|
Incorporated by reference to Exhibit 10.25 contained in Select Comfort’s Annual Report on Form 10-K for the fiscal year ended January 1, 2000 (File No. 0-25121)
|
|
|
|
|
|
|
|
10.32
|
|
Summary of Executive Health Program
|
|
Incorporated by reference to Exhibit 10.36 contained in Select Comfort’s Annual Report on Form 10-K for the fiscal year ended December 31, 2005 (File No. 0-25121)
|
|
|
|
|
|
|
|
10.33
|
|
Summary of Executive Tax and Financial Planning Program
|
|
Incorporated by reference to Exhibit 10.1 contained in Select Comfort’s Current Report on Form 8-K filed January 3, 2005 (File No. 0-25121)
|
|
|
|
|
|
|
|
10.34
|
|
Amended and Restated Select Comfort Corporation Executive Severance Pay Plan
|
|
Incorporated by reference to Exhibit 10.1 contained in Select Comfort’s Current Report on Form 8-K filed August 21, 2008
(File No. 0-25121)
|
|
|
|
|
|
|
|
10.35
|
|
First Amendment to Amended and Restated Select Comfort Corporation Executive Severance Pay Plan
|
|
Incorporated by reference to Exhibit 10.34 contained in Select Comfort’s Annual Report on Form 10-K for the fiscal year ended January 3, 2009 (File No. 0-25121).
|
|
|
|
|
|
|
|
|
Summary of Non-Employee Director Compensation
|
|
Filed herewith
|
|
|
|
|
|
|
|
|
10.37
|
|
Supply Agreement dated October 3, 2006 between the Company and Supplier (1)
|
|
Incorporated by reference to Exhibit 10.39 contained in Select Comfort’s Annual Report on Form 10-K for the fiscal year ended December 30, 2006 (File No. 0-25121)
|
|
10.38
|
|
Amended and Restated Private Label Consumer Credit Card Program Agreement dated as of December 14, 2005 between GE Money Bank and Select Comfort Corporation and Select Comfort Retail Corporation (1)
|
|
Incorporated by reference to Exhibit 10.1 contained in Select Comfort’s Current Report on Form 8-K filed December 20, 2005
(File No. 0-25121)
|
|
|
|
|
|
|
|
10.39
|
|
First Amendment to Amended and Restated Private Label Consumer Credit Card Program Agreement dated as of April 23, 2007 between GE Money Bank and Select Comfort Corporation and Select Comfort Retail Corporation
|
|
Incorporated by reference to Exhibit 10.1 contained in Select Comfort’s Current Report on Form 8-K filed April 27, 2007 (File No. 0-25121)
|
|
|
|
|
|
|
|
10.40
|
|
Second Amendment to Amended and Restated Private Label Consumer Credit Card Program Agreement dated as of February 1, 2008 between GE Money Bank and Select Comfort Corporation and Select Comfort Retail Corporation
|
|
Incorporated by reference to Exhibit 10.3 contained in Select Comfort’s Current Report on Form 8-K filed February 7, 2008
(File No. 0-25121)
|
|
|
|
|
|
|
|
10.41
|
|
GE Waiver and Consent dated May 21, 2009
|
|
Incorporated by reference to Exhibit 10.6 contained in Select Comfort’s Current Report on Form 8-K filed May 26, 2009 (File No. 0-25121)
|
|
|
|
|
|
|
|
10.42
|
Credit Agreement, dated March 26, 2010, by and among Select Comfort Corporation and Wells Fargo Bank, National Association
|
Incorporated by reference to Exhibit 10.1 contained in Select Comfort’s Current Report on Form 8-K filed March 29, 2010 (File No. 0-25121)
|
|
Exhibit
No.
|
|
Description
|
|
Method Of Filing
|
|
|
|
|
|
|
|
21.1
|
|
Subsidiaries of the Company
|
|
Incorporated by reference to Exhibit 21.1 contained in Select Comfort’s Annual Report on Form 10-K for the fiscal year ended January 2, 2010 (File No. 0-25121)
|
|
|
|
|
|
|
|
|
Consent of Independent Registered Public Accounting Firm
|
|
Filed herewith
|
|
|
|
|
|
|
|
|
Consent of Independent Registered Public Accounting Firm
|
Filed herewith
|
|||
|
24.1
|
|
Power of Attorney
|
|
Included on signature page
|
|
|
|
|
|
|
|
|
Certification of Chief Executive Officer pursuant to Section 302 of the Sarbanes-Oxley Act of 2002
|
|
Filed herewith
|
|
|
|
Certification of Chief Financial Officer pursuant to Section 302 of the Sarbanes-Oxley Act of 2002
|
|
Filed herewith
|
|
|
|
|
|
|
|
|
|
Certification of Chief Executive Officer pursuant to Section 906 of the Sarbanes-Oxley Act of 2002
|
|
Filed herewith
|
|
|
|
|
|
|
|
|
|
Certification of Chief Financial Officer pursuant to Section 906 of the Sarbanes-Oxley Act of 2002
|
|
Filed herewith
|
_____________________
|
(1)
|
Confidential treatment has been granted by the Securities and Exchange Commission with respect to designated portions contained within document. Such portions have been omitted and filed separately with the Securities and Exchange Commission pursuant to Rule 24b-2 of the Securities and Exchange Act of 1934, as amended.
|
SELECT COMFORT CORPORATION AND SUBSIDIARIES
Schedule II – Valuation and Qualifying Accounts
(in thousands)
|
Description
|
Balance at Beginning of Period
|
Additions Charged to Costs and Expenses
|
Deductions From Reserves
|
Balance at End of Period
|
||||||||||||
|
Allowance for doubtful accounts
|
||||||||||||||||
|
2010
|
$ | 379 | $ | 197 | $ | 274 | $ | 302 | ||||||||
|
2009
|
713 | 138 | 472 | 379 | ||||||||||||
|
2008
|
876 | 814 | 977 | 713 | ||||||||||||
|
|
||||||||||||||||
|
Accrued sales returns
|
||||||||||||||||
|
2010
|
$ | 2,885 | $ | 29,885 | $ | 29,826 | $ | 2,944 | ||||||||
|
2009
|
2,744 | 25,920 | 25,779 | 2,885 | ||||||||||||
|
2008
|
3,751 | 34,410 | 35,417 | 2,744 | ||||||||||||
75