Attached files
| file | filename |
|---|---|
| EXCEL - IDEA: XBRL DOCUMENT - EXPONENT INC | Financial_Report.xls |
| EX-31.1 - EXHIBIT 31.1 - EXPONENT INC | v242932_ex31-1.htm |
| EX-31.2 - EXHIBIT 31.2 - EXPONENT INC | v242932_ex31-2.htm |
| EX-32.1 - EXHIBIT 32.1 - EXPONENT INC | v242932_ex32-1.htm |
| EX-21.1 - EXHIBIT 21.1 - EXPONENT INC | v242932_ex21-1.htm |
| EX-32.2 - EXHIBIT 32.2 - EXPONENT INC | v242932_ex32-2.htm |
| EX-23.1 - EXHIBIT 23.1 - EXPONENT INC | v242932_ex23-1.htm |
| EX-10.40 - EXHIBIT 10.40 - EXPONENT INC | v242932_ex10-40.htm |
| EX-10.41 - EXHIBIT 10.41 - EXPONENT INC | v242932_ex10-41.htm |
UNITED STATES
SECURITIES AND EXCHANGE COMMISSION
Washington, D.C. 20549
________________________________
FORM 10-K
________________________________
| S | Annual Report pursuant to Section 13 or 15(d) of the Securities Exchange Act of 1934 for the fiscal year ended December 30, 2011. |
OR
| £ | Transition report pursuant to Section 13 or 15(d) of the Securities Exchange Act of 1934 for the transition period from ________ to _________. |
Commission File Number 0-18655
________________________________
EXPONENT, INC.
(Exact name of registrant as specified in its charter)
________________________________
| Delaware | 77-0218904 |
| (State or other jurisdiction of incorporation or organization) | (I.R.S. Employer Identification No.) |
| 149 Commonwealth Drive, Menlo Park, California | 94025 |
| (Address of principal executive offices) | (Zip Code) |
(650) 326-9400
(Registrant’s telephone number, including area code)
Securities registered pursuant to Section 12(b) of the Act:
| Title of Each Class | Name of Each Exchange on Which Registered | |
| Common Stock, $0.001 par value per share | The NASDAQ Stock Market LLC |
Securities registered pursuant to Section 12(g) of the Act: None
Indicate by check mark if the registrant is a well-known seasoned issuer, as defined in Rule 405 of the Securities Act.
| Yes £ | No S |
Indicate by check mark if the registrant is not required to file reports pursuant to Section 13 or Section 15(d) of the Act.
| Yes £ | No S |
Indicate by check mark whether the registrant (1) has filed all reports required to be filed by Section 13 or 15(d) of the Act during the preceding 12 months (or for such shorter period that the registrant was required to file such reports), and (2) has been subject to such filing requirements for the past 90 days.
| Yes S | No £ |
Indicate by check mark whether the registrant has submitted electronically and posted on its corporate Web site, if any, every Interactive Data File required to be submitted and posted pursuant to Rule 405 of Regulation S-T during the preceding 12 months (or for such shorter period that the registrant was required to submit and post such files).
| Yes S | No £ |
Indicate by check mark if disclosure of delinquent filers pursuant to Item 405 of Regulation S-K is not contained herein, and will not be contained, to the best of registrant’s knowledge, in definitive proxy or information statements incorporated by reference in Part III of this Form 10-K or any amendment to this Form 10-K. £
Indicate by check mark whether the registrant is a large accelerated filer, an accelerated filer, a non-accelerated filer, or a smaller reporting company. See definitions of “large accelerated filer”, “accelerated filer” and “smaller reporting company” in Rule 12b-2 of the Exchange Act.
| Large accelerated filer £ | Accelerated filer S | Non-accelerated filer £ | Smaller reporting company £ |
| (Do not check if a smaller | |||
| reporting company) |
Indicate by check mark whether the registrant is a shell company (as defined in Rule 12b-2 of the Exchange Act).
| Yes £ | No S |
The aggregate market value of the voting and non-voting stock held by non-affiliates of the registrant based on the closing sales price of the Common Stock as reported on the NASDAQ National Market on July 1, 2011, the last business day of the registrant’s most recently completed second quarter, was $502,877,855. Shares of the registrant’s common stock held by each executive officer and director and by each entity or person that, to the registrant’s knowledge, owned 10% or more of registrant’s outstanding common stock as of July 1, 2011 have been excluded in that such persons may be deemed to be affiliates of the registrant. This determination of affiliate status is not necessarily a conclusive determination for other purposes.
The number of shares of the issuer’s Common Stock outstanding as of February 17, 2012 was 13,322,962.
DOCUMENTS INCORPORATED BY REFERENCE
Portions of the Registrant’s Definitive Proxy Statement for the Registrant’s 2012 Annual Meeting of Stockholders to be held on May 31, 2012, are incorporated by reference into Part III of this Form 10-K.
| 2 |
EXPONENT, INC.
FORM 10-K ANNUAL REPORT
FISCAL YEAR ENDED DECEMBER 30, 2011
TABLE OF CONTENTS
| Page | ||
| PART I | ||
| Item 1. | Business | 4 |
| Item 1A. | Risk Factors | 13 |
| Item 1B. | Unresolved Staff Comments | 16 |
| Item 2. | Properties | 17 |
| Item 3. | Legal Proceedings | 17 |
| Item 4. | Mine Safety Disclosures | 17 |
| PART II | ||
| Item 5. | Market for Registrant’s Common Equity, Related Stockholder Matters and Issuer Purchases of Equity Securities | 17 |
| Item 6. | Selected Financial Data | 19 |
| Item 7. | Management’s Discussion and Analysis of Financial Condition and Results of Operations | 19 |
| Item 7A. | Quantitative and Qualitative Disclosures About Market Risk | 29 |
| Item 8. | Financial Statements and Supplementary Data | 29 |
| Item 9. | Changes in and Disagreements with Accountants on Accounting and Financial Disclosure | 29 |
| Item 9A. | Controls and Procedures | 29 |
| Item 9B. | Other Information | 30 |
| PART III | ||
| Item 10. | Directors, Executive Officers and Corporate Governance | 30 |
| Item 11. | Executive Compensation | 30 |
| Item 12. | Security Ownership of Certain Beneficial Owners and Management and Related Stockholder Matters | 30 |
| Item 13. | Certain Relationships and Related Transactions, and Director Independence | 30 |
| Item 14. | Principal Accounting Fees and Services | 30 |
| PART IV | ||
| Item 15. | Exhibits, Financial Statement Schedules | 31 |
| Signatures | 59 | |
| Exhibit Index | 60 |
FORWARD-LOOKING STATEMENTS
This Annual Report on Form 10-K contains, and incorporates by reference, certain “forward-looking” statements (as such term is defined in the Private Securities Litigation Reform Act of 1995, and the rules promulgated pursuant to the Securities Act of 1933, as amended, and the Securities Exchange Act of 1934, as amended), including but not limited to statements regarding future growth and market opportunities, revenue, margins, headcount, utilization and operating expenses, that are based on the beliefs of the Company’s management, as well as assumptions made by, and information currently available to, the Company’s management. Such forward-looking statements are subject to the safe harbor created by the Private Securities Litigation Reform Act of 1995. When used in this document and in the documents incorporated herein by reference, statements other than statements of current or historical fact are forward-looking statements. The words “anticipate,” “believe,” “estimate,” “expect” and similar expressions, as they relate to the Company or its management, identify certain of such forward-looking statements. Such statements reflect the current views of the Company or its management with respect to future events and are subject to certain risks, uncertainties and assumptions. Should one or more of these risks or uncertainties materialize, or should underlying assumptions prove incorrect, the Company’s actual results, performance, or achievements could differ materially from those expressed in, or implied by, any such forward-looking statements. Factors that could cause or contribute to such material differences include the possibility that the demand for our services may decline as a result of changes in general and industry specific economic conditions, the timing of engagements for our services, the effects of competitive services and pricing, tort reform and liabilities resulting from claims made against us. Additional risks and uncertainties are discussed in this Report under the heading “Risk Factors” and elsewhere. The inclusion of such forward-looking information should not be regarded as a representation by the Company or any other person that the future events, plans, or expectations contemplated by the Company will be achieved. The Company undertakes no obligation to update or revise any such forward-looking statements.
| 3 |
PART I
Item 1. Business
GENERAL
The history of Exponent, Inc. goes back to 1967, with the founding of the partnership Failure Analysis Associates, which was incorporated the following year in California and reincorporated in Delaware as Failure Analysis Associates, Inc. in 1988. The Failure Group, Inc. was organized in 1989 as a holding company for Failure Analysis Associates, Inc. and changed its name to Exponent, Inc. in 1998. Exponent, Inc. (together with its subsidiaries, “Exponent” or the “Company”) is a science and engineering consulting firm that provides solutions to complex problems. Our multidisciplinary team of scientists, physicians, engineers, business and regulatory consultants brings together more than 90 different technical disciplines to solve complicated issues facing industry and government today. Our professional staff can perform in-depth scientific research and analysis, or very rapid-response evaluations to provide our clients with the critical information they need.
CLIENTS
General
Exponent serves clients in automotive, aviation, chemical, construction, consumer products, energy, government, health, insurance, manufacturing, technology and other sectors of the economy. Many of our engagements are initiated directly by large corporations or by lawyers or insurance companies, whose clients anticipate, or are engaged in, litigation related to their products, equipment, processes or service. Our services in failure prevention and technology evaluation have grown as the technological complexity of products has increased over the years.
Pricing and Terms of Engagements
We generally provide our services on either a fixed-price basis or on a “time and material” basis, charging hourly rates for each staff member involved in a project, based on his or her skills and experience. Our standard rates for professionals range from $135 to $600 per hour. Our engagement agreements typically provide for monthly billing, require payment of our invoices within 30 days of receipt and permit clients to terminate engagements at any time. Clients normally agree to indemnify us and our personnel against liabilities arising out of the use or application of the results of our work or recommendations.
SERVICES
Exponent provides high quality engineering and scientific consulting services to clients around the world. Our service offerings are provided on a project-by-project basis. Many projects require support from multiple practices. We currently operate 23 practices and centers, including:
| · | Biomechanics |
| · | Biomedical Engineering |
| · | Buildings & Structures |
| · | Civil Engineering |
| · | Construction Consulting |
| · | Defense Technology Development |
| · | Ecological & Biological Sciences |
| · | Electrical Engineering & Computer Science |
| · | Engineering Management Consulting |
| · | Environmental & Earth Sciences |
| · | Health Sciences |
| o | Center for Chemical Regulation & Food Safety |
| o | Center for Epidemiology, Biostatistics & Computational Biology |
| o | Center for Exposure Assessment & Dose Reconstruction |
| o | Center for Occupational Medicine & Environmental Health |
| o | Center for Toxicology & Mechanistic Biology |
| · | Human Factors |
| · | Industrial Structures |
| · | Materials & Corrosion Engineering |
| · | Mechanical Engineering |
| · | Polymer Science & Materials Chemistry |
| · | Statistical & Data Sciences |
| · | Thermal Sciences |
| · | Vehicle Analysis |
| 4 |
Biomechanics
Our biomechanics staff uses engineering and biomedical science to solve complex problems at the intersection of biology and engineering. Our expertise is used to understand and evaluate the interaction between the human body as a biological system and the physical environment to explore the cause, nature, and severity of injuries.
During the past year our biomechanics staff performed analyses of human injury related to a variety of products including recreational vehicles, sporting goods, trucks, trains, aircraft and motor cars. They also looked at the implications of using protective devices (such as restraint systems and helmets) on reducing potential injuries and assessed injuries in the workplace, during recreational activities and in the home.
Biomedical Engineering
Our Biomedical Engineering Practice applies engineering principles to the medical field, including the evaluation of designs and performance of medical devices and biotechnology. Our engineers and scientists assist clients with characterization of biomaterials, biological tissues, and medical devices. As part of regulatory compliance, we can perform preclinical testing and formulate a related regulatory strategy, conduct design verification and validation, as well as design and manufacturing failure analyses, recall management, and medical device explant analysis. In addition, our staff can perform analysis of clinical outcomes for medical devices using administrative claims databases. Our expertise is also utilized in product liability, intellectual property litigation, technology acquisition and due diligence matters.
Buildings & Structures
The basic function of a building is to provide structurally sound, durable and environmentally controlled space to house and protect occupants and contents. If this basic function is not achieved, it is because some aspect(s) of the building design or construction failed to perform its intended function. Our architects, engineers, and scientists have been investigating such failures for decades, and we use this experience to solve problems with building systems and components, including finding the best repair options and mitigating the risk of future failures.
During the past year, we have evaluated numerous problems with residential, commercial and industrial structures for insurers, attorneys and owners. Our evaluations often included property inspections, testing, engineering analysis and development of repair recommendations. In addition, we have worked with owners to assess and mitigate the risk of failure associated with hazards such as hurricanes, earthquakes, tsunamis and aging infrastructure. We have assessed these risks to industrial facilities, pipelines and nuclear power plant structures. Finally, we continue to pursue activities to address green/sustainable building issues both from a construction as well as human health standpoint to confront major social and economic decisions regarding the relationship between people-environment-profit and the built environment.
Civil Engineering
Our Civil Engineering Practice provides broad expertise that includes geotechnical engineering, geological engineering, engineering geology, and geology to address a host of geo-failures, including landslides, foundation and retaining wall failures, dam and levee failures and earthwork construction claims. We also provide peer review services for complicated structures such as new nuclear power plant construction. Our Water Resources staff specializes in the application of proven hydrologic, hydraulic, hydrodynamic, and sediment transport research and science to provide scientifically sound and cost-effective solutions to our clients.
Over the past year, our consultants have been engaged in a number of investigations related to landslides, retaining wall and foundation failures, pipeline performance, flooding and flood mitigation, and peer review of new nuclear reactor designs. This practice has had a diverse portfolio of projects and clients that represent a broad spectrum of industries.
Construction Consulting
Our Construction Consulting Practice provides project advisory, risk analysis, strategic planning, dispute resolution, and financial damages services. During the past year, we increased the depth and breadth of our expertise by adding experience in the government contract and claim advisory services arena with particular emphasis in aerospace and defense programs. Our multi-disciplinary staff, which includes engineers, architects, construction managers, schedulers, accountants, and technical specialists, provides these services to both the public and private sectors for clients who represent a diverse mix of companies and agencies and are involved in a wide range of projects – from complex construction and capital projects to Department of Defense aerospace and defense procurements.
| 5 |
Our projects include many sectors of the construction industry as well as facilities and systems which include power plants, transmission and distribution facilities, petrochemical facilities, water/wastewater treatment plants, bridges and roads, marine structures, rail systems, tunnels, airports, detention facilities, commercial buildings, institutional buildings, industrial and manufacturing facilities, sporting arenas, resorts and gaming facilities, rotary and fixed-wing aircraft, shipbuilding, missiles, missile defense systems, simulators and space launch vehicles. We provide services to most construction, aerospace and defense industry participants: owners, lending agencies, prime contractors, subcontractors, designers, attorneys and insurance carriers.
Defense Technology Development
Drawing on our multidisciplinary engineering, testing, failure analysis, and prevention expertise, our Defense Technology Development Practice specializes in harnessing advanced technologies and practices from the commercial world to help our defense clients rapidly achieve solutions to their pressing technology integration and development problems. We identify and leverage the best in commercial off-the-shelf technologies to create solutions ranging from fully integrated systems to mission support modules. Our focus is on cost effectiveness, ease of use, reliability, high quality and speed of engineering design and execution. Our engineers and scientists continue to work in Afghanistan war zone laboratories embedded with U.S. and NATO military personnel to ensure we understand their problems and can rapidly deliver solutions to high priority military technology capability gaps.
During the past year we continued to refine our ground penetrating radar (GPR) system to provide a real-time improvised explosive device/mine detection capability for a range of ground vehicles. Internationally, additional GPR system deliveries were made to the U.K. Ministry of Defence for their operationally deployed route clearance capability, and to the Swedish Ministry of Defence for developmental testing. With our U.S. military client, we have continued our work on the development program to deliver next-generation GPR capability and performance. Our sales in the area of ISR (Intelligence, Surveillance and Reconnaissance) have continued with both the Rapid Deployment Integrated Surveillance Systems and the Mid-Range Thermal Imager System for soldiers in Afghanistan, who require increased situational awareness coupled with night vision capabilities. Also over the past year, we have expanded our mission support and technology quality and evaluation services in the areas of personnel identification, radio-frequency identification, physical and logical access control, biometrics, smart credentials, and data analytics for cyber security.
Ecological & Biological Sciences
Our ecological scientists provide strategic support to clients on issues related to natural resources damages associated with chemicals and forest fires, international environmental disputes, ecosystem service assessments for businesses, climate change, ecological risk assessment, novel remediation methods, restoration of wetlands and other natural resources, large development projects, resource utilization (mineral mining, oil and gas, wood pulp), and the use of chemicals and other products in commerce. The practice specializes in assessing the fate and effects of chemical, biological, and physical stressors on aquatic and terrestrial ecosystems. The practice is comprised of nationally recognized experts that cover all disciplines related to the ecological implications and risks associated with these projects.
Electrical Engineering & Computer Science
Our team of electrical engineers and computer scientists performs a wide array of investigations ranging from electric power systems and equipment to integrated circuits, and contributes to safer, more reliable designs in new products. We operate laboratories for testing both heavy equipment and electronics. In addition we have a broad capability in analyzing computer software.
During the past year our electrical engineers and computer scientists continued to broaden our expertise in computer science consulting. Our team expertise encompasses a breadth of areas including information and numerical sciences, algorithms and data structures, computer graphics, computer architecture, networking and communications, as well as security and cryptography. In software, our team experience includes many aspects of software analysis and design ranging from evaluating the intellectual property content of a software product to resolving failures related to embedded processors and machine control. We also perform complex software review, study the interaction of hardware and software layers, as well as evaluate safety and reliability issues related to device control for safety-critical applications such as medical devices.
| 6 |
Engineering Management Consulting
This practice provides multi-disciplinary expertise and rapid response to assist clients with technical and management consulting services, often in extremely short time frames. Our consultants provide services in the areas of asset strategy and planning, project management, engineering, construction, maintenance, operations, environmental, and risk analysis. This practice primarily services the electric and gas utility industries, focusing on transmission and distribution as well as fossil fuel and nuclear generation.
We provide unique and advanced services in performing risk and reliability assessments. Our scientists and engineers assist our clients in minimizing bottom-line losses in their business or operation. Accidents, unanticipated events, and system failures are the primary causes of deferred or lost production interruptions and may lead to loss of life, injury, property damage, and undesired releases. Our multi-disciplinary staff has performed diverse technical, business-interruption, and compliance-related risk and reliability assessments for chemical, petrochemical, petroleum, and manufacturing clients worldwide.
Environmental & Earth Sciences
Our environmental scientists and engineers provide cost-effective, scientifically defensible and realistic assessments and solutions to complex environmental issues. We offer technical, regulatory and litigation support to industries that include manufacturing, mining and minerals, oil and gas, chemicals, forest products, railroads, aerospace, and trade associations. Our consultants specialize in the areas of environmental chemistry and forensics, hydrogeology, air toxics, modeling and monitoring, remediation consulting, environmental engineering and waste management, and evaluation of environmental and social risks for large international capital projects. Our work often involves complex and high visibility environmental scenarios, claims, or toxic tort matters, where evaluation of contamination and historical reconstruction of events, releases, and doses are central to problem resolution.
Health Centers
Center for Chemical Regulation & Food Safety
Our Center for Chemical Regulation and Food Safety includes experienced staff of both technical and regulatory specialists who are experienced in dealing with foods, and with pesticide and non-pesticide products including conventional chemicals, biochemicals, microbials, biocides, products of biotechnology, and industrial chemicals. We provide practical, creative, scientific and regulatory support to meet global business objectives at every stage of the product cycle, from research and development to retail and beyond.
During the past year our chemical regulation & food safety staff have conducted a wide array of work. The European side of our business was involved with many projects related to plant protection product regulatory submissions, from new active substances to product-specific dossiers for individual member states. In addition, we provided many specialist assessments relating to human and environmental exposure and product efficacy. The first work for the next REACH submission deadline in 2013 also began. REACH (Registration, Evaluation, Authorisation and Restriction of Chemical substances) is the European Union chemicals policy that requires all new substances supplied at greater than 1 tonne (approx. 2,205 lbs.) per year to be registered. In the U.S. we continued to provide services related to pesticide product development and new U.S. product registration, registration review, due diligence, and data compensation, as well as the approval of new pesticide inert ingredients and new non-pesticide chemical approvals. Our food safety consultants assisted clients with food additives, food contact notifications, and nutrition-related analyses, as well as product recall and litigation support.
| 7 |
Center for Epidemiology, Biostatistics & Computational Biology
Our health scientists apply epidemiology to examine and address complex health issues in a variety of settings. Through the principles of epidemiology, we analyze the interaction of host, agent, and environment to reach conclusions about the causes and occurrence of disease in human populations.
Our consultants combine the expertise of several medical specialties, exposure assessment professionals, and other scientists who have advanced degrees in statistics and public health. All of our physicians have graduate training in epidemiology and biostatistics. Our research work has included numerous community health assessments, disease cluster investigations, survey research, occupational cohort and case-control studies, exposure assessment studies, cancer modeling, meta-analyses, and state of the art reviews.
Our health economics and outcomes research scientists determine the value of new medical technologies. We specialize in evaluating the impact of pharmaceuticals, medical devices, biotechnology products, and diagnostics on treatment patterns, medical care resource utilization, and health care costs; we assess the changes in health outcomes that result from new medical technologies, including decreased mortality, reduced disease cases or symptoms, improved quality of life, and increased patient satisfaction; and we quantify changes in health outcomes relative to their costs and to the costs of competing health care interventions, allowing assessment of the appropriate value for these new medical technologies.
Center for Exposure Assessment & Dose Reconstruction
Exposure assessment is the science of estimating human exposure to chemical, physical, and biological agents, accounting for the frequency, magnitude, and duration of the exposure events. Exposure estimates can be compared to toxicity benchmarks or guidelines to assess potential risks to human health, and provide critical inputs to human epidemiology studies, risk assessment, and regulatory compliance.
During the past year we expanded our capabilities in air quality and atmospheric sciences with the addition of staff that provide air quality and meteorological modeling, permitting, and licensing support services. They investigate potential and accidental releases of chemicals to the atmosphere, simulate transport and fate of chemical substances, and develop measures of prevention and control, such as emergency preparedness and response. Our atmospheric scientists work closely with our thermal and process engineers to predict and evaluate the dispersion of air emissions, and work with our risk assessors to evaluate health risks posed by atmospheric releases to the ambient air and to indoor environments.
Center for Occupational Medicine & Environmental Health
This center is composed of industrial hygienists, safety professionals, physicians, and scientists, with specialized training in the anticipation, recognition, evaluation, risk assessment, and control of human health hazards.
Our staff has partnered with and assisted clients with health-related issues involving workers, products, and manufacturing processes, and issues concerning communities and the environment. We draw on the expertise and resources of staff located throughout the U.S. Our team includes senior physicians and experienced health scientists specializing in the fields of epidemiology, industrial hygiene, toxicology, safety, occupational health, veterinary medicine and engineering. This unique multidisciplinary team provides the necessary insight to address complex health issues facing businesses, corporations, property owners and others. We help to investigate a broad variety of environmental health concerns, such as evaluating claims of illnesses from environmental exposures to chemicals, dusts, molds and micro-organisms, and we develop strategies to aid in controlling such exposures, when needed. We also have assisted clients with their preventive health program needs in the workplace and provide external verification of health services performance. Common medical conditions, if not managed well, can erode worker productivity and have consequent effects on the competitiveness of an enterprise.
| 8 |
Center for Toxicology & Mechanistic Biology
We have exceptional expertise and depth in toxicology and mechanistic biology. We provide knowledge and experience that improves decisions affecting the regulation of important substances in commerce. We work with our clients to resolve important issues that affect the safe use of a wide variety of substances. We evaluate the mechanisms by which substances can affect complex biological systems, provide perspectives on potential effects at realistic human and environmental exposure levels, and develop strategies to manage human health and environmental risks. We are recognized for our outstanding credentials and decades of experience from government, academia and industry.
During the past year we continued to provide toxicology and clinical toxicology support in nearly all phases of pharmaceutical and combination drug development from preclinical studies to post-marketing safety assessments. We reviewed existing data and developed new studies on potential endocrine toxicity of chemical substances. Our radiation toxicologists evaluated contamination levels at several Japanese facilities in the Fukushima area after the March 2011, earthquake and subsequent tsunami. We are also extremely active in the research related to the identification, assessment, and prioritization of risks (the probability of adverse effects) associated with engineered nanomaterial development and manufacturing processes.
Human Factors
Our Human Factors staff evaluates human performance and safety in product and system use. Our consultants study how the limitations and capabilities of people, including memory, perception, reaction time, judgment, physical size and dexterity, affect the way they use a product, interact with an organization or environment, process information or participate in an activity.
During the past year our scientists evaluated the human performance issues and behaviors that may have contributed to accident causation. We addressed the reliability of human memory and retrospective reporting in the gathering of fact-based evidence. We continued to review warnings and labeling issues related to consumer products, pharmaceuticals, motor vehicles, medical devices and industrial products. In addition, we assisted manufacturers with compliance of regulatory guidelines related to products and worked with them regarding the Consumer Product Safety Commission’s new publicly available consumer product safety database.
Industrial Structures
Our Industrial Structures Practice, based in Düsseldorf, Germany, specializes in design and assessment of industrial structures subject to extreme conditions. Our Düsseldorf office has provided design reviews and assessments on more than 1,000 structures around the world, and our staff has participated in the creation of several engineering standards.
Our Industrial Structures Practice provides planning, assessment, rehabilitation and dismantling analysis of bearing structures in four particular areas: antenna masts, power plants, buildings and special structures like refractories or tanks. One service we provide in over 800 locations throughout the year is quality assurance of antenna masts for a variety of facilities including telecommunications, wind energy and industrial chimneys. Our consultants provide inspection services related to new construction and assess design deficiencies related to new and existing facilities, as well as assist our clients with on-time, quality construction on their projects.
With the use of our self-developed computer software for non-linear material behavior, close-to-reality assessment of a wide variety of structures such as cracked reinforced concrete structures, multi-layer refractories or masonry towers is provided. Beyond industrial structures more and more commercial property projects are becoming part of this practice.
| 9 |
Materials & Corrosion Engineering
Our in-depth knowledge of materials and electrochemistry, combined with the breadth of collective expertise in many areas of engineering and science, is used to understand how and why materials fail, as well as to prevent future failures. Our engineers and scientists use their broad background in field investigations, root-cause assessments, and materials engineering to solve complex problems for both industrial and legal clients. During the past year we conducted failure analysis, failure prevention, and integrity assessment investigations for a wide variety of clients including medical, aerospace, chemical processing, pipeline, automotive, construction, consumer electronics, recreational, and other industries.
Mechanical Engineering
We provide clients with a thorough comprehension of current or alternative designs to determine potential vulnerabilities before failures occur, develop appropriate risk mitigation methods, and provide post failure investigations. Our consultants review the safety and reliability of processes and products for a variety of industries, including transportation, heavy industry, energy, and consumer products. Our scientists and engineers also provide services in the area of intellectual property and are often asked to interpret the language of a patent from a scientific and engineering perspective and provide valuable insight regarding the proper technical interpretation of patent claims. During the past year our mechanical engineers worked on a wide variety of projects ranging from high profile consumer product recall investigations to pipeline integrity evaluations and worker safety issues. Our staff developed and utilized detailed, validated computational models to evaluate equipment, consumer products and medical devices to solve a variety of technical challenges associated with their design and optimization.
Polymer Science & Materials Chemistry
Our polymer science and materials chemistry staff consults with industrial, government, and insurance clients, as well as their outside counsels, regarding polymers used in diverse applications and chemical aspects of batteries, drug delivery systems, and other products that depend on highly controlled manufacturing environments. We assist clients in understanding the short- and long-term performance of plastic, rubber, adhesive, coating, composite and power systems when challenged by physical, chemical, thermal and other operational stresses. During the past year we added key members to our staff with expertise in performance textiles, engineering plastics, and materials for medical applications. We also increased our presence in our China office and added staff in our new Atlanta office. We continue to work on a number of projects in which polymers and chemistry are important to the performance of medical devices, food packaging, high-performance coatings, utilities and infrastructure, energy and power systems, and general consumer products.
Statistical & Data Sciences
Our Statistical & Data Sciences staff comprises our company’s core capabilities in statistical methodology and offers its expertise to serve clients at any and all stages of the empirical research process including product development, manufacturing, and regulatory stages. The practice specializes in determining whether a particular activity or product poses an unreasonable risk. Risk estimation involves establishing a reference period and then collecting information about the number of injuries (or other adverse events) suffered and the amount of exposure during this period. Through analysis and synthesis of client-supplied data, combined with information from public sources, we help clients measure their own risk in the context of similar risks and determine appropriate courses of action. During the past year, we worked on a variety of projects for government, industry, and legal clients. Our statisticians and data scientists performed assessments of manufacturing quality systems, investigated data mining methods to improve classification tools, and analyzed the reliability of home appliances during use by consumers.
Thermal Sciences
We have investigated and analyzed thousands of fires and explosions ranging from high loss disasters at manufacturing facilities to small insurance claims. Information gained from these analyses has helped us assist clients in assessing preventive measures related to the design of their products. Based on our investigation experience, we also assist industry to minimize their risk of fires and explosions, provide regulatory consulting for permitting new industrial facilities, and assist manufacturers in addressing allegations of the risk of fires associated with consumer products. Our engineers use fire modeling and other computational fire dynamics modeling tools to supplement our analytical, experimental, and field-based activities. Preventive services include process safety hazard analysis for the chemical and oil and gas industries, fire protection engineering and dust explosion consulting.
| 10 |
During the past year, in the context of consumer product safety, our staff reviewed lithium-ion battery technology, its failure modes and past failure history, and studied the life cycle of the storage and distribution of batteries. This work was conducted on behalf of the Fire Protection Research Foundation, a part of the National Fire Protection Association. The review laid out a research approach for evaluating and identifying battery storage facility fire protection strategies. This is part of a larger study of the hazards associated with lithium-ion battery storage, with an aim of developing fire protection strategies to protect battery and battery-powered products, bulk storage and distribution facilities.
Vehicle Analysis
We have performed thousands of investigations for the automotive, trucking, recreational vehicle, marine, aviation, aerospace, and rail industries. Information gained from these analyses has assisted clients in assessing preventive measures related to the design of their products, as well as evaluating failures.
Our Test and Engineering Center located in Phoenix, Arizona, is the setting for our most complex tests, along with rigorous analysis of results. We have gained a worldwide reputation for our ability to mobilize resources expeditiously and efficiently, integrate a broad array of technical disciplines, and provide valuable insight that is objective and withstands rigorous scrutiny. Many of our projects involve addressing the cause of accidents. Our clients rely on us to determine what happened in an accident and why it happened. In many cases, they also want us to discover what could have been done to reduce the severity of the accident or to reduce injuries to those involved. Whether the objective is design analysis, component testing, or accident reconstruction, our knowledge of vehicle systems and accident reconstruction principles and our experience from conducting full-scale tests add insight and proficiency to every project.
COMPETITION
The marketplace for our services is fragmented and we face different sources of competition in providing various services. In addition, the services that we provide to some of our clients can be performed in-house by those clients. Clients that have the capability to perform such services themselves will retain Exponent or other independent consultants because of independence concerns.
In each of the foregoing practices and centers, we believe that the principal competitive factors are: technical capability and breadth of services, ability to deliver services on a timely basis, professional reputation and knowledge of the litigation and regulatory processes. Although we believe that we generally compete favorably in each of these areas, some of our competitors may be able to provide services acceptable to our clients at lower prices.
We believe that the barriers to entry are low and that for many of our technical disciplines, competition is increasing. In response to competitive forces in the marketplace, we continue to explore new markets for our various technical disciplines.
BUSINESS SEGMENTS OVERVIEW
We report two operating segments based on two primary areas of service. One operating segment is a broad service group providing technical consulting in different practices primarily in the areas of engineering and technology development. Our other operating segment provides services in the area of environmental, epidemiology and health risk analysis. This operating segment provides a wide range of consulting services relating to environmental hazards and risks and the impact on both human health and the environment. For more information about the financial condition and results of operations of each segment, please see Part II - “Item 7: Management's Discussion and Analysis of Financial Condition and Results of Operations” and “Item 8: Financial Statements and Supplementary Data.”
EMPLOYEES
As of December 30, 2011, we employed 937 full-time and part-time employees, including 682 engineering and scientific staff, 80 technical support staff and 175 administrative and support staff. Our staff includes 600 employees with advanced degrees, of which 385 employees have achieved the level of Ph.D., Sc.D. or M.D.
ADDITIONAL INFORMATION
The address of our internet website is www.exponent.com. We make available, free of charge through our website, access to our Annual Reports on Form 10-K, Quarterly Reports on Form 10-Q, Current Reports on Form 8-K and other periodic Securities and Exchange Commission (SEC) reports, along with amendments to all of those reports, as soon as reasonably practicable after we file the reports with the SEC. Additionally, copies of materials filed by us with the SEC may be accessed at the SEC’s Public Reference Room at 100 F Street NE, Washington, D.C. or at the SEC’s website at http://www.sec.gov. For information about the SEC’s Public Reference Room, the public may contact 1-800-SEC-0330. Copies of material filed by us with the SEC may also be obtained by writing to us at our corporate headquarters, Exponent, Inc., Attention: Investor Relations, 149 Commonwealth Drive, Menlo Park, CA 94025, or by calling (650) 326-9400. The content of our internet website is not incorporated into and is not part of this Annual Report on Form 10-K.
| 11 |
EXECUTIVE OFFICERS
The executive officers of Exponent and their ages as of February 24, 2012 are as follows:
| Name | Age | Position |
| Paul R. Johnston, Ph.D. | 58 | President, Chief Executive Officer and Director |
| Elizabeth L. Anderson, Ph.D. | 71 | Group Vice President |
| Paul D. Boehm, Ph.D. | 63 | Group Vice President |
| Robert D. Caligiuri, Ph.D. | 60 | Group Vice President |
| Robert C. Lange | 64 | Group Vice President |
| Subbaiah V. Malladi, Ph.D. | 65 | Chief Technical Officer |
| John E. Moalli, Sc.D. | 47 | Group Vice President |
| John D. Osteraas, Ph.D. | 57 | Group Vice President |
| Richard L. Schlenker, Jr. | 46 | Executive Vice President, Chief Financial Officer and Corporate Secretary |
Executive officers of Exponent are appointed by the Board of Directors and serve at the discretion of the Board or until the appointment of their successors. There is no family relationship between any of the directors and officers of the Company.
Paul R. Johnston, Ph.D., joined the Company in 1981, was promoted to Principal Engineer in 1987, and to Vice President in 1996. In 1997, he assumed responsibility for the firm’s network of offices. In July 2003, he was appointed Chief Operating Officer and added responsibility for the Health and Environmental Groups. In 2006, he assumed line responsibility for all of the firm’s consulting groups. Dr. Johnston was named President in May 2007. He was named Chief Executive Officer and elected to the Board of Directors in May 2009. Dr. Johnston received his Ph.D. (1981) in Civil Engineering and M.S. (1977) in Structural Engineering from Stanford University. He received his B.A.I. (1976) in Civil Engineering with First Class Honors from Trinity College, University of Dublin, Ireland where he was elected a Foundation Scholar in 1975. Dr. Johnston is a Registered Professional Civil Engineer in the State of California and a Chartered Engineer in Ireland.
Elizabeth L. Anderson, Ph.D., joined the Company in June 2006 as a Group Vice President and Principal Scientist. Prior to joining Exponent, Dr. Anderson was President and CEO of Sciences International, a health and environmental consulting firm. Dr. Anderson received her Ph.D. (1970) in Organic Chemistry from The American University, M.S. (1964) in Organic Chemistry from the University of Virginia and B.S. (1962) in Chemistry from the College of William and Mary. Dr. Anderson is a Fellow of the Academy of Toxicological Sciences, a founder and past-President of the Society for Risk Analysis and Editor-in-Chief of the journal, Risk Analysis: An International Journal.
Paul D. Boehm, Ph.D., joined the Company in April 2004 as a Group Vice President and Principal Scientist. Prior to joining the Company, Dr. Boehm was Vice President and Market Manager, Oil and Gas Sector, at Battelle Memorial Institute from 2001 to 2004. From 1999 to 2001, Dr. Boehm was Vice President and Managing Director, Environmental Health and Safety Consulting at Arthur D. Little, Inc. Dr. Boehm received his Ph.D. (1977) and M.S. (1973) in Oceanography from the University of Rhode Island and B.S. (1970) in Chemical Engineering from the University of Rochester. Dr. Boehm has published more than 100 articles in peer-reviewed journals and authored numerous reports on environmental forensics and impact assessments. Dr. Boehm has been chosen to serve on several National Research Council panels.
| 12 |
Robert D. Caligiuri, Ph.D., joined the Company in 1987. He was promoted to Principal Engineer in 1990 and Group Vice President in 1999. Dr. Caligiuri received his Ph.D. (1977) and M.S. (1974) in Materials Science and Engineering from Stanford University and B.S. (1973) in Mechanical Engineering from the University of California, Davis. Prior to joining the Company he was a Program Manager and Materials Scientist for SRI International. He is a Registered Professional Metallurgical Engineer in the States of California, Utah, Michigan and North Carolina and a Fellow of the American Society for Materials.
Robert C. Lange worked for the Company from 1982 to 1994. During this period, he was promoted to Principal Engineer and Vice President in 1985. Mr. Lange rejoined Exponent in November 2008 as Group Vice President and Principal Engineer. From 1994 to 2008, Mr. Lange was Executive-In-Charge, Engineering Director, and Executive Director Vehicle Structure and Safety Integration at General Motors Corporation. Mr. Lange received his M.S. (1975) and B.S. (1969) in Mechanical Engineering from the University of Michigan. Mr. Lange is a past Director of the National Safety Council. Mr. Lange is a member of the Transportation Research Board Advisory Committee for Congressional Report on the Strategic Highway Research Plan, SHRP-2 and a past member of the Board of Directors of the National Safety Council. He was Chair of the Society of Automotive Engineers’ Motor Vehicle Systems Board from 2004 to 2008.
Subbaiah V. Malladi, Ph.D., joined the Company in 1982 as a Senior Engineer, becoming a Senior Vice President in January 1988 and a Corporate Vice President in September 1993. In October 1998, Dr. Malladi was appointed Chief Technical Officer of the Company. Dr. Malladi also served as a Director of the Company from March 1991 through September 1993. He was re-appointed as a Director in April 1996 and served on the Board until May 2005. He received a Ph.D. (1980) in Mechanical Engineering from the California Institute of Technology, M.Tech (1972) in Mechanical Engineering from the Indian Institute of Technology, B.E. (1970) in Mechanical Engineering from SRI Venkateswara University, India and B.S. (1966) in Physics, Chemistry and Mathematics from Osmania University, India. Dr. Malladi is a Registered Professional Mechanical Engineer in the State of California.
John E. Moalli, Sc.D., joined the Company in 1992. He was promoted to Principal in 1997, served as an Office and Practice Director and became Group Vice President in 2002. Dr. Moalli received his Sc.D. (1992) in Polymers from the Massachusetts Institute of Technology and B.S. (1987) in Civil Engineering from Northeastern University. Dr. Moalli is a nationally recognized expert in polymetric materials and has an academic appointment at Stanford University.
John D. Osteraas, Ph.D., worked for the Company from 1982 to 1985 as a Senior Engineer. He rejoined the Company in 1990 as a Managing Engineer. He was promoted to Principal Engineer in 1992 and Group Vice President in 2006. Dr. Osteraas received his Ph.D. (1990) in Civil Engineering, M.S. (1977) in Civil Engineering: Structural Engineering from Stanford University and B.S. (1976) in Civil and Environmental Engineering from the University of Wisconsin. Dr. Osteraas is a Registered Professional Engineer in 13 states and is a Fellow of the American Society of Civil Engineers.
Richard L. Schlenker, Jr. joined the Company in 1990. Mr. Schlenker is the Executive Vice President, Chief Financial Officer and Corporate Secretary of the Company. He was appointed Executive Vice President in April 2010, Chief Financial Officer in July 1999 and Secretary of the Company in November 1997. Mr. Schlenker was the Director of Human Resources from 1998 until his appointment as Chief Financial Officer. He was the Manager of Corporate Development from 1996 until 1998. From 1993 to 1996, Mr. Schlenker was a Business Manager, where he managed the business activities for multiple consulting practices within the Company. Prior to 1993, he held several different positions in finance and accounting within the Company. Mr. Schlenker holds a B.S. in Finance from the University of Southern California.
Item 1A. Risk Factors
Exponent operates in a rapidly changing environment that involves a number of uncertainties, some of which are beyond our control. These uncertainties include, but are not limited to, those mentioned elsewhere in this report and those set forth below.
Lack of sizable backlog may lead to less predictable, and perhaps lower, future revenues.
Revenues are primarily derived from services provided in response to client requests or events that occur without notice, and engagements, generally billed as services are performed, are terminable or subject to postponement or delay at any time by clients. As a result, backlog at any particular time is small in relation to our quarterly or annual revenues and is not a reliable indicator of revenues for any future periods. Revenues and operating margins for any particular quarter are generally affected by staffing mix, resource requirements and timing and size of engagements.
| 13 |
Failure to attract and retain key employees may adversely affect our business.
Exponent’s business involves the delivery of professional services and is labor-intensive. Our success depends in large part upon our ability to attract, retain and motivate highly qualified technical and managerial personnel. Qualified personnel are in great demand and are likely to remain a limited resource for the foreseeable future. We cannot provide any assurance that we can continue to attract sufficient numbers of highly qualified technical and managerial personnel and to retain existing employees. The loss of key managerial employees, business generators or any significant number of employees could have a material adverse impact on our business, including our ability to secure and complete engagements.
Competition could reduce our pricing and adversely affect our business.
The markets for our services are highly competitive. In addition, there are relatively low barriers to entry into our markets and we have faced, and expect to continue to face, additional competition from new entrants into our markets. Competitive pressure could reduce the market acceptance of our services and result in price reductions that could have a material adverse effect on our business, financial condition or results of operations.
The loss of a large client could adversely affect our business.
We currently derive a significant portion of our revenues from clients in the consumer electronics, insurance, petrochemical, transportation, and utilities industries and the government sector. The loss of any large client, organization or insurer could have a material adverse effect on our business, financial condition or results of operations.
Our business can be adversely affected by downturns in the overall economy.
The markets that we serve are cyclical and subject to general economic conditions. The direction and relative strength of the global economy continues to be uncertain. If the economic growth in the United States, where we primarily operate, continues to be slow and not improve, our clients may consolidate or go out of business and thus demand for our services could be reduced significantly.
Our clients may be unable to pay for our services.
If a client's financial difficulties become severe, the client may be unwilling or unable to pay our invoices in the ordinary course of business, which could adversely affect collections of both our accounts receivable and unbilled services. On occasion, some of our clients have entered bankruptcy, which has prevented us from collecting amounts owed to us. The bankruptcy of a client with substantial accounts receivable could have a material adverse effect on our financial condition and results of operations.
We hold substantial investments that could present liquidity risks.
Our cash equivalent and short-term investment portfolio as of December 30, 2011, consisted primarily of obligations of state and local government agencies and the U.S. Treasury. We follow an established investment policy to monitor, manage and limit our exposure to interest rate and credit risk. The policy sets forth credit quality standards and limits our exposure to any one issuer, as well as our maximum exposure to various asset classes.
As a result of current adverse financial market conditions, investments in some financial instruments may pose risks arising from liquidity and credit concerns. As of December 30, 2011, we had no impairment charge associated with our investment portfolio relating to such adverse financial market conditions. Although we believe our current investment portfolio has a low risk of impairment, we cannot predict future market conditions or market liquidity and can provide no assurance that our investment portfolio will remain unimpaired.
Our business is dependent on our professional reputation.
The professional reputation of Exponent and its consultants is critical to our ability to successfully compete for new client engagements and attract or retain professionals. Proven or unproven allegations against us may damage our professional reputation. Any factors that damage our professional reputation could have a material adverse effect on our business.
| 14 |
Our business can be adversely impacted by deregulation or reduced regulatory enforcement.
Public concern over health, safety and preservation of the environment has resulted in the enactment of a broad range of environmental and/or other laws and regulations by local, state and federal lawmakers and agencies. These laws and the implementing of new regulations affect nearly every industry, as well as the agencies of federal, state and local governments charged with their enforcement. To the extent changes in such laws, regulations and enforcement or other factors significantly reduce the exposures of manufacturers, owners, service providers and others to liability, the demand for our services may be significantly reduced.
Tort reform can reduce demand for our services.
Several of our practices have a significant concentration in litigation support consulting services. To the extent tort reform reduces the exposure of manufacturers, owners, service providers and others to liability, the demand for our litigation support consulting services may be significantly reduced.
Our quarterly results may vary.
Variations in our revenues and operating results occur from time to time, as a result of a number of factors, such as the significance of client engagements commenced and completed during a quarter, the timing of engagements, the number of working days in a quarter, employee hiring and utilization rates, and integration of companies acquired. Because a high percentage of our expenses, particularly personnel and facilities related expenses, are relatively fixed in advance of any particular quarter, a variation in the timing of the initiation or the completion of our client assignments can cause significant variations in operating results from quarter to quarter.
Our engagements may result in professional or other liability.
Our services typically involve difficult engineering and scientific assignments and carry risks of professional and other liability. Many of our engagements involve matters that could have a severe impact on a client's business, cause a client to lose significant amounts of money, or prevent a client from pursuing desirable business opportunities. Accordingly, if a client is dissatisfied with our performance, the client could threaten or bring litigation in order to recover damages or to contest its obligation to pay our fees. Litigation alleging that we performed negligently, disclosed client confidential information, lost or damaged evidence, infringed on patents, or otherwise breached our obligations to a client could expose us to significant liabilities to our clients or other third parties or tarnish our reputation.
Potential conflicts of interests may preclude us from accepting some engagements.
We provide litigation support consulting and other services primarily in connection with significant disputes, or other matters that are usually adversarial or that involve sensitive client information. The nature of our consulting services may preclude us from accepting engagements with other potential clients because of conflicts. Accordingly, the nature of our business limits the number of both potential clients and potential engagements.
The market price of our common stock may be volatile.
Many factors could cause the market price of our common stock to rise and fall. These include the risk factors listed above, changes in estimates of our performance or recommendations by securities analysts, future sales of shares of common stock in the public market, market conditions in the industry and economy as a whole, acquisitions or strategic alliances involving us or our competitors, restatement of financial results and changes in accounting principles or methods. In addition, the stock market often experiences significant price fluctuations. These fluctuations are often unrelated to the operating performance of particular companies. These broad market fluctuations may adversely affect the market price of our common stock. When the market price of a company's stock drops significantly, shareholders often institute securities class action litigation against that company. Any litigation against us could cause us to incur substantial costs, divert the time and attention of our management and other resources, or otherwise harm our business.
| 15 |
Impairment of goodwill may require us to record a significant charge to earnings.
On our balance sheet, we have $8,607,000 of goodwill subject to periodic evaluation for impairment. Failure to achieve sufficient levels of cash flow at reporting units, the loss of key employees, changes to the scope of operations of our business or a significant and sustained decline in our stock price could result in goodwill impairment charges. During times of financial market volatility, significant judgment is required to determine the underlying cause of the decline and whether stock price declines are short-term in nature or indicative of an event or change in circumstances.
Impairment of long-lived assets or restructuring activities may require us to record a significant charge to earnings.
Our long-lived assets, including our office and laboratory space in Menlo Park, California and our test and engineering center in Phoenix, Arizona, are subject to periodic testing for impairment. Failure to achieve sufficient levels of cash flow at reporting units could result in impairment of our long-lived assets. In addition, we have operating lease commitments for office, warehouse and laboratory space of $20,542,000 as of December 30, 2011. Changes in the business environment could lead to changes in the scope of operations of our business. These changes, including the closure of one or more offices, could result in restructuring and/or asset impairment charges.
Our international operations create special risks that could adversely affect our business.
In addition to our offices in the United States, we have physical offices in the United Kingdom, Germany, Switzerland and China and conduct business in several other countries. We expect to continue to expand globally and our international revenues may account for an increasing portion of our revenues in the future. Our international operations carry special financial, business and legal risks, including cultural and language differences; employment laws and related factors that could result in lower utilization, higher staffing costs, and cyclical fluctuations of utilizations and revenues; currency fluctuations that adversely affect our financial position and operating results; burdensome regulatory requirements and other barriers to conducting business; managing the risks associated with engagements with foreign officials and governmental agencies, including the risks arising from the Foreign Corrupt Practices Act; greater difficulties in managing and staffing foreign operations; successful entry and execution in new markets; restrictions on the repatriation of earnings, and potentially adverse tax consequences.
Inherent risks related to government contracts may adversely affect our business.
We work for various United States and foreign governmental entities and agencies. Government entities reserve the right to audit our contracts and conduct inquiries and investigations of our business practices with respect to government contracts. Findings from an audit may result in fees being refunded to the government or prospective adjustment to previously agreed upon rates that will affect future margins. If a government client discovers improper or illegal activities in the course of audits or investigations, we may become subject to various civil and criminal penalties and administrative sanctions, which may include termination of contracts, forfeiture of profits, suspension of payments, fines and suspensions or debarment from doing business with other agencies of the government. The inherent limitations of internal controls may not prevent or detect all improper or illegal activities, regardless of the adequacy of such controls. Government contracts, and the proceedings surrounding them, are often subject to more extensive scrutiny and publicity than other commercial contracts. Negative publicity related to our government contracts, regardless of whether it is accurate, may further damage our business by affecting our ability to compete for new contracts.
Item 1B. Unresolved Staff Comments
None.
| 16 |
Item 2. Properties
Our Silicon Valley office facilities consist of a 153,738 square foot building, with office and laboratory space located on a 6.3-acre tract of land we own in Menlo Park, California and an adjacent 27,000 square feet of leased warehouse storage space.
Our Test and Engineering Center (TEC) occupies 147 acres in Phoenix, Arizona. We lease this land from the state of Arizona under a 30-year lease agreement that expires in January 2028 and have options to renew for two fifteen-year periods. We constructed an indoor test facility as well as an engineering and test preparation building at the TEC.
In addition, we lease office, warehouse and laboratory space in 18 other locations in 13 states and the District of Columbia, as well as in Germany, China, Switzerland and the United Kingdom. Leases for these offices, warehouse and laboratory facilities have terms generally ranging between one and ten years. Aggregate lease expense in fiscal 2011 for all leased properties was $5,180,000.
Item 3. Legal Proceedings
Exponent is not engaged in any material legal proceedings.
Item 4. Mine Safety Disclosures
Not applicable.
PART II
Item 5. Market for Registrant’s Common Equity, Related Stockholder Matters and Issuer Purchases of Equity Securities
Exponent’s common stock is traded on the NASDAQ Global Select Market, under the symbol “EXPO”. The following table sets forth for the fiscal periods indicated the high and low sales prices for our common stock.
| Stock prices by quarter | High | Low | ||||||
| Fiscal Year Ended December 31, 2010: | ||||||||
| First Quarter | $ | 29.94 | $ | 25.13 | ||||
| Second Quarter | $ | 33.92 | $ | 26.71 | ||||
| Third Quarter | $ | 35.00 | $ | 28.36 | ||||
| Fourth Quarter | $ | 41.26 | $ | 30.87 | ||||
| Fiscal Year Ended December 30, 2011: | ||||||||
| First Quarter | $ | 45.53 | $ | 35.06 | ||||
| Second Quarter | $ | 45.53 | $ | 39.86 | ||||
| Third Quarter | $ | 47.93 | $ | 35.56 | ||||
| Fourth Quarter | $ | 51.17 | $ | 38.13 | ||||
As of February 17, 2012, there were 332 holders of record of our common stock. Because many of the shares of our common stock are held by brokers and other institutions on behalf of stockholders, we believe that there are considerably more beneficial holders of our common stock than record holders.
We have never paid cash dividends on our common stock. See Item 7 of Part II “Management’s Discussion and Analysis of Financial Condition and Results of Operations – Liquidity and Capital Resources.”
| 17 |
The following table provides information on the Company’s share repurchases (of Company common stock) for the quarter ended December 30, 2011 (in thousands, except price per share):
| Total Number of Shares Purchased | Average Price Paid Per Share | Total Number of Shares Purchased as Part of Publicly Announced Plans or Programs | Approximate Dollar Value of Shares That May Yet Be Purchased Under the Plan or Program | |||||||||||||
| October 1 to October 28 | 25 | $ | 40.75 | 25 | $ | 9,627 | ||||||||||
| October 29 to November 25 | - | - | - | $ | 9,627 | |||||||||||
| November 26 to December 30 | 5 | $ | 44.01 | 5 | $ | 9,406 | ||||||||||
| Total | 30 | $ | 41.30 | 30 | ||||||||||||
On February 9, 2012, the Company’s Board of Directors authorized an additional $35 million for the repurchase of the Company’s common stock.
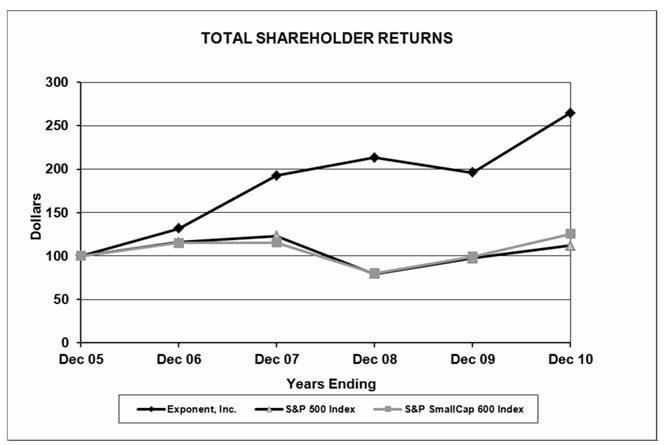
COMPANY STOCK PRICE PERFORMANCE GRAPH
The graph compares the Company’s cumulative total stockholder return calculated on a dividend-reinvested basis from 2006 through 2011 with those of the Standard & Poor’s (“S&P”) 500 Index and the S&P SmallCap 600 Index. The Company does not have a comparable peer group and thus has selected the S&P Small Cap 600 Index. The graph assumes that $100 was invested on the last day of 2006. Note that the historic stock price performance is not necessarily indicative of future stock price performance.
| 18 |
Item 6. Selected Financial Data
The following selected consolidated financial data are derived from our consolidated financial statements. This data should be read in conjunction with the consolidated financial statements and notes thereto, and with Item 7, Management’s Discussion and Analysis of Financial Condition and Results of Operations.
| Fiscal Year | ||||||||||||||||||||
| (In thousands, except per share data) | 2011 | 2010 | 2009 | 2008 | 2007 | |||||||||||||||
| Consolidated Statements of Income Data: | ||||||||||||||||||||
| Revenues before reimbursements | $ | 246,667 | $ | 221,860 | $ | 205,714 | $ | 206,194 | $ | 183,139 | ||||||||||
| Revenues | $ | 272,446 | $ | 248,753 | $ | 227,882 | $ | 228,838 | $ | 205,148 | ||||||||||
| Operating income | $ | 53,460 | $ | 43,241 | $ | 33,262 | $ | 36,722 | $ | 29,944 | ||||||||||
| Net income | $ | 32,695 | $ | 27,521 | $ | 22,127 | $ | 23,160 | $ | 20,341 | ||||||||||
| Net income per share: | ||||||||||||||||||||
| Basic | $ | 2.31 | $ | 1.92 | $ | 1.56 | $ | 1.57 | $ | 1.36 | ||||||||||
| Diluted | $ | 2.22 | $ | 1.83 | $ | 1.47 | $ | 1.47 | $ | 1.25 | ||||||||||
| Consolidated Balance Sheet Data: | ||||||||||||||||||||
| Cash and cash equivalents | $ | 84,439 | $ | 106,549 | $ | 67,895 | $ | 32,598 | $ | 10,700 | ||||||||||
| Short-term investments | $ | 25,260 | $ | - | $ | 7,490 | $ | 24,772 | $ | 53,034 | ||||||||||
| Working capital | $ | 137,803 | $ | 136,860 | $ | 103,253 | $ | 82,073 | $ | 88,794 | ||||||||||
| Total assets | $ | 268,788 | $ | 258,892 | $ | 206,481 | $ | 183,090 | $ | 182,391 | ||||||||||
| Long-term liabilities | $ | 21,298 | $ | 17,358 | $ | 11,333 | $ | 6,761 | $ | 6,509 | ||||||||||
| Total stockholders’ equity | $ | 186,715 | $ | 183,800 | $ | 150,071 | $ | 128,094 | $ | 131,919 | ||||||||||
Item 7. Management’s Discussion and Analysis of Financial Condition and Results of Operations
OVERVIEW
Exponent, Inc. is a science and engineering consulting firm that provides solutions to complex problems. Our multidisciplinary team of scientists, physicians, engineers, business and regulatory consultants brings together more than 90 different technical disciplines to solve complicated issues facing industry and government today. Our services include analysis of products, people, property, processes and finances related to litigation, product recall, regulatory compliance, research, development and design.
CRITICAL ACCOUNTING ESTIMATES
In preparing our consolidated financial statements, we make assumptions, judgments and estimates that can have a significant impact on our revenue, operating income and net income, as well as on the value of certain assets and liabilities on our consolidated balance sheet. We base our assumptions, judgments and estimates on historical experience and various other factors that we believe to be reasonable under the circumstances. Actual results could differ materially from these estimates under different assumptions or conditions. On a regular basis we evaluate our assumptions, judgments and estimates and make changes accordingly. We believe that the assumptions, judgments and estimates involved in the accounting for revenue recognition and estimating the allowance for doubtful accounts have the greatest potential impact on our consolidated financial statements, so we consider these to be our critical accounting policies. We discuss below the assumptions, judgments and estimates associated with these policies. Historically, our assumptions, judgments and estimates relative to our critical accounting policies have not differed materially from actual results. For further information on our critical accounting policies, see Note 1 of our Notes to Consolidated Financial Statements.
Revenue recognition. We derive our revenues primarily from professional fees earned on consulting engagements, product sales in our defense technology development practice, fees earned for the use of our equipment and facilities, as well as reimbursements for outside direct expenses associated with the services that are billed to our clients.
| 19 |
Substantially all of our engagements are performed under time and material or fixed-price billing arrangements. For time and material and fixed-price projects, revenue is generally recognized as the services are performed. For substantially all of our fixed-price engagements we recognize revenue based on the relationship of incurred labor hours at standard rates to our estimate of the total labor hours at standard rates we expect to incur over the term of the contract. Our estimate of total labor hours we expect to incur over the term of the contract is based on the nature of the project and our past experience on similar projects. We believe this methodology achieves a reliable measure of the revenue from the consulting services we provide to our customers under fixed-price contracts.
Significant management judgments and estimates must be made and used in connection with the revenues recognized in any accounting period. These judgments and estimates include an assessment of collectibility and, for fixed-price engagements, an estimate as to the total effort required to complete the project. If we made different judgments or utilized different estimates, the amount and timing of our revenue for any period could be materially different.
All contracts are subject to review by management, which requires a positive assessment of the collectibility of contract amounts. If, during the course of the contract, we determine that collection of revenue is not reasonably assured, we do not recognize the revenue until its collection becomes reasonably assured, which in those situations would generally be upon receipt of cash. We assess collectibility based on a number of factors, including past transaction history with the client, as well as the credit-worthiness of the client. Losses on fixed-price contracts are recognized during the period in which the loss first becomes evident. Contract losses are determined to be the amount by which the estimated total costs of the contract exceeds the total fixed price of the contract.
Estimating the allowance for doubtful accounts. We must make estimates of our ability to collect accounts receivable and our unbilled work-in-process. In circumstances where we are aware of a specific customer’s inability to meet its financial obligations to us, we record a specific allowance to reduce the net recognized receivable to the amount we reasonably believe will be collected. For all other customers we recognize allowances for doubtful accounts based upon historical bad debts, customer concentration, customer credit-worthiness, current economic conditions, aging of amounts due and changes in customer payment terms. As of December 30, 2011, our accounts receivable balance was $73,065,000, net of an allowance for doubtful accounts of $2,339,000.
| 20 |
The following table sets forth, for the periods indicated, the percentage of revenues of certain items in our consolidated statements of income and the percentage increase (decrease) in the dollar amount of such items year to year:
| PERCENTAGE OF REVENUES | PERIOD TO | |||||||||||||||||||
| FOR FISCAL YEARS | PERIOD CHANGE | |||||||||||||||||||
| 2011 | 2010 | 2009 | 2011 vs. 2010 | 2010 vs. 2009 | ||||||||||||||||
| Revenues | 100.0 | % | 100.0 | % | 100.0 | % | 9.5 | % | 9.2 | % | ||||||||||
| Operating expenses: | ||||||||||||||||||||
| Compensation and related expenses | 57.6 | 58.2 | 61.5 | 8.3 | 3.4 | |||||||||||||||
| Other operating expenses | 8.5 | 8.6 | 9.4 | 8.5 | 0.3 | |||||||||||||||
| Reimbursable expenses | 9.5 | 10.8 | 9.7 | (4.1 | ) | 21.3 | ||||||||||||||
| General and administrative expenses | 4.8 | 5.0 | 4.8 | 6.1 | 12.3 | |||||||||||||||
| 80.4 | 82.6 | 85.4 | 6.6 | 5.6 | ||||||||||||||||
| Operating income | 19.6 | 17.4 | 14.6 | 23.6 | 30.0 | |||||||||||||||
| Other income, net | 0.5 | 1.4 | 1.6 | (60.8 | ) | (7.8 | ) | |||||||||||||
| Income before income taxes | 20.1 | 18.8 | 16.2 | 17.4 | 26.2 | |||||||||||||||
| Provision for income taxes | 8.1 | 7.7 | 6.5 | 15.3 | 28.8 | |||||||||||||||
| Net income | 12.0 | % | 11.1 | % | 9.7 | % | 18.8 | % | 24.4 | % | ||||||||||
EXECUTIVE SUMMARY
Revenues for fiscal 2011 increased 10% and revenues before reimbursements increased 11% as compared to prior year. This growth was due to strong demand for our consulting services particularly in our mechanics and materials, electrical, thermal, human factors, and engineering management consulting practices and our health and environmental groups. We experienced strong demand for our consulting services from a diverse set of clients for both reactive and proactive projects and continued to see elevated levels of activity on a few major assignments. As a result, utilization increased to 71% as compared to 70% during the prior year.
We made progress during fiscal 2011 in several of our strategic growth areas. In energy consulting, we continued to work on projects for several utilities and oil and gas clients to assist them with understanding why certain pipeline failures have occurred as well as the evaluation of their pipeline risk management programs. In design consulting, we experienced an increase in battery consulting activity from a broad set of industries including consumer electronics, medical devices, automotive, aerospace and battery suppliers. In our environmental and health groups, we performed in-depth scientific studies to understand both the short- and long-term impact of chemicals in the environment. In defense technology development we continued to work on improvised explosive device detection technology.
During fiscal 2011, technical full time equivalent employees increased 6.6% as we added new Ph.D.’s from top universities and made several senior hires.
Net income increased 19% and diluted earnings per share increased to $2.22 as compared to $1.83 last year. We were able to improve profitability and margins by effectively managing headcount over the past year to align our resources with demand and benefited from some major projects which resulted in improved utilization and increased leverage of our cost structure.
| 21 |
We remain focused on selectively adding top talent and developing the skills necessary to expand upon our market position, providing clients with in-depth scientific research and analysis to determine what happened and how to prevent failures or exposures in the future, capitalizing on opportunities in defense technology development and emerging growth areas, managing other operating expenses, generating cash from operations, maintaining a strong balance sheet and undertaking activities such as share repurchases to enhance shareholder value. We expect some of our major assignments to step down from their elevated levels of activity as they move through their project life cycle.
OVERVIEW OF THE YEAR ENDED DECEMBER 30, 2011
Our revenues consist of professional fees earned on consulting engagements, product sales in our defense technology development practice, fees for use of our equipment and facilities, and reimbursements for outside direct expenses associated with the services performed that are billed to our clients.
We operate on a 52-53 week fiscal year with each year ending on the Friday closest to December 31st. The fiscal years ended December 30, 2011, December 31, 2010 and January 1, 2010 included 52 weeks of activity.
During fiscal 2011, we had a 10% increase in revenues as compared to fiscal 2010. The increase in revenues was due to an increase in billable hours in our engineering and other scientific segment and our environmental and health segment and higher billing rates. Billable hours increased 9.0% to 981,000 during fiscal 2011 as compared to 900,000 during fiscal 2010. The increase in billable hours was due strong demand for our consulting services across a broad set of practices and elevated levels of activity on several major assignments. Technical full-time equivalent employees increased 6.6% to 661 during fiscal 2011 as compared to 620 during fiscal 2010 due to our recruiting and retention efforts which resulted in the addition of several experienced consultants in biomechanics and atmospheric sciences during fiscal 2011. Utilization increased to 71% for fiscal 2011 as compared to 70% for fiscal 2010. The increase in utilization was due to elevated levels of activity on several major assignments and our management of headcount to align resources with anticipated demand. Product sales in defense technology development increased to $12,300,000 during fiscal 2011 as compared to $12,100,000 during fiscal 2010. Product sales will vary from year to year due to the timing of new contracts and the delivery dates of products.
FISCAL YEARS ENDED DECEMBER 30, 2011, AND DECEMBER 31, 2010
Revenues
| Fiscal Years | Percent | |||||||||||
| (In thousands except percentages) | 2011 | 2010 | Change | |||||||||
| Engineering and other scientific | $ | 199,772 | $ | 184,146 | 8.5 | % | ||||||
| Percentage of total revenues | 73.3 | % | 74.0 | % | ||||||||
| Environmental and health | 72,674 | 64,607 | 12.5 | % | ||||||||
| Percentage of total revenues | 26.7 | % | 26.0 | % | ||||||||
| Total revenues | $ | 272,446 | $ | 248,753 | 9.5 | % | ||||||
The increase in revenues for our engineering and other scientific segment was due to an increase in billable hours and higher billing rates. During fiscal 2011, billable hours for this segment increased by 8.1% to 693,000 as compared to 641,000 during fiscal 2010. This increase was due to strong demand for our services. Technical full-time equivalent employees increased 3.9% to 458 during fiscal 2011 from 441 during fiscal 2010 due to our recruiting and retention efforts. Utilization increased to 73% for fiscal 2011 as compared to 70% for fiscal 2010 due in part to elevated levels of activity on a number of major assignments and our management of headcount to align resources with anticipated demand. Product sales in defense technology development increased to $12,300,000 during fiscal 2011 as compared to $12,100,000 during fiscal 2010.
The increase in revenues from our environmental and health segment was due to an increase in billable hours and higher billing rates. The increase in billable hours was due to strong demand for our services. During fiscal 2011, billable hours for this segment increased by 11.2% to 288,000 as compared to 259,000 during fiscal 2010. Utilization decreased to 68% for fiscal 2011 as compared to 70% for fiscal 2010. The decrease in utilization was due in part to our investment in hiring experienced consultants during the current year. Technical full-time equivalent employees increased by 13.4% to 203 during fiscal 2011 as compared to 179 during fiscal 2010.
Revenues are primarily derived from services provided in response to client requests or events that occur without notice and engagements are generally terminable or subject to postponement or delay at any time by our clients. As a result, backlog at any particular time is small in relation to our quarterly or annual revenues and is not a reliable indicator of revenues for any future periods.
| 22 |
Compensation and Related Expenses
| Fiscal Years | Percent | |||||||||||
| (In thousands except percentages) | 2011 | 2010 | Change | |||||||||
| Compensation and related expenses | $ | 156,853 | $ | 144,842 | 8.3 | % | ||||||
| Percentage of total revenues | 57.6 | % | 58.2 | % | ||||||||
The increase in compensation and related expenses during fiscal 2011 was due to an increase in payroll, bonuses, and fringe benefits partially offset by the change in the value of assets associated with our deferred compensation plan. Payroll increased $7,941,000 and fringe benefits increased $1,996,000 due to a 6.6% increase in technical full time equivalent employees and our annual salary increase on April 2, 2011. Bonuses increased by $4,240,000 due to a corresponding increase in profitability. During fiscal 2011, deferred compensation expense decreased $2,198,000 with a corresponding decrease to other income, net, as compared to fiscal 2010 due to the change in value of assets associated with our deferred compensation plan. This decrease consisted of a decrease in the value of the plan assets of $273,000 during fiscal 2011 and an increase in the value of the plan assets of $1,925,000 during fiscal 2010. We expect an increase in average technical full-time equivalent employees during fiscal 2012. Average technical full-time equivalent employees for the fourth quarter of fiscal 2011 were 677. We also expect an increase in compensation expense due to the impact of our annual salary increases which will be effective at the beginning of the second quarter of fiscal 2012.
Other Operating Expenses
| Fiscal Years | Percent | |||||||||||
| (In thousands except percentages) | 2011 | 2010 | Change | |||||||||
| Other operating expenses | $ | 23,238 | $ | 21,413 | 8.5 | % | ||||||
| Percentage of total revenues | 8.5 | % | 8.6 | % | ||||||||
Other operating expenses include facilities-related costs, technical materials, computer-related expenses and depreciation and amortization of property, equipment and leasehold improvements. The increase in other operating expenses was primarily due to an increase in occupancy expenses of $788,000, an increase in computer expenses of $450,000, and an increase in technical materials of $281,000. The increase in occupancy expenses was due to planned maintenance activities for our owned facilities and costs associated with the increase in technical full-time equivalent employees. The increase in computer expenses and technical materials was associated with the increase in technical full-time equivalent employees and investments in our corporate infrastructure. We expect other operating expenses to grow as we selectively add new talent and make investments in our corporate infrastructure.
Reimbursable Expense
| Fiscal Years | Percent | |||||||||||
| (In thousands except percentages) | 2011 | 2010 | Change | |||||||||
| Reimbursable expenses | $ | 25,779 | $ | 26,893 | (4.1 | )% | ||||||
| Percentage of total revenues | 9.5 | % | 10.8 | % | ||||||||
Reimbursable expenses for fiscal 2011 remained relatively consistent with fiscal 2010. The amount of reimbursable expenses will vary from year to year depending on the nature of our projects.
General and Administrative Expenses
| Fiscal Years | Percent | |||||||||||
| (In thousands except percentages) | 2011 | 2010 | Change | |||||||||
| General and administrative expenses | $ | 13,116 | $ | 12,364 | 6.1 | % | ||||||
| Percentage of total revenues | 4.8 | % | 5.0 | % | ||||||||
The increase in general and administrative expenses during fiscal 2011 was primarily due to an increase in contributions of $272,000, an increase in travel and meals of $260,000, an increase in marketing and business development of $178,000, an increase in professional development of $169,000 and several individually insignificant increases partially offset by a decrease in legal expenses of $552,000. The increase in travel and meals, marketing and business development, and professional development were due to our continuing investment in employee and business development activities. The decrease in legal fees was due to a decrease in costs associated with legal claims during fiscal 2011 as compared to fiscal 2010. We expect general and administrative expenses to increase as we selectively add new talent, expand our business development efforts, and pursue staff development initiatives.
| 23 |
Other Income and Expense
| Fiscal Years | Percent | |||||||||||
| (In thousands except percentages) | 2011 | 2010 | Change | |||||||||
| Other income and expense, net | $ | 1,359 | $ | 3,467 | (60.8 | )% | ||||||
| Percentage of total revenues | 0.5 | % | 1.4 | % | ||||||||
Other income and expense, net, consists primarily of interest income earned on available cash, cash equivalents and short-term investments, changes in the value of assets associated with our deferred compensation plan and rental income from leasing excess space in our Silicon Valley facility. During fiscal 2011, other income, net, decreased $2,198,000 with a corresponding decrease to deferred compensation expenses, as compared to fiscal 2010 due to a change in value of assets associated with our deferred compensation plan. This decrease consisted of a decrease in the value of the plan assets of $273,000 during fiscal 2011 and an increase in the value of the plan assets of $1,925,000 during fiscal 2010.
Income Taxes
| Fiscal Years | Percent | |||||||||||
| (In thousands except percentages) | 2011 | 2010 | Change | |||||||||
| Income taxes | $ | 22,124 | $ | 19,187 | 15.3 | % | ||||||
| Percentage of total revenues | 8.1 | % | 7.7 | % | ||||||||
| Effective tax rate | 40.4 | % | 41.1 | % | ||||||||
The increase in income tax expense was due to a corresponding increase in pre-tax income. The decrease in the effective tax rate was due to a decrease in state taxes as a result of the mix of income earned in various state jurisdictions.
FISCAL YEARS ENDED DECEMBER 31, 2010, AND JANUARY 1, 2010
Revenues
| Fiscal Years | Percent | |||||||||||
| (In thousands except percentages) | 2010 | 2009 | Change | |||||||||
| Engineering and other scientific | $ | 184,146 | $ | 171,757 | 7.2 | % | ||||||
| Percentage of total revenues | 74.0 | % | 75.4 | % | ||||||||
| Environmental and health | 64,607 | 56,125 | 15.1 | % | ||||||||
| Percentage of total revenues | 26.0 | % | 24.6 | % | ||||||||
| Total revenues | $ | 248,753 | $ | 227,882 | 9.2 | % | ||||||
The increase in revenues for our engineering and other scientific segment during fiscal 2010 was due to an increase in reimbursable project related costs for consulting projects in our defense technology development practice, an increase in billable hours and higher billing rates. Reimbursable project related costs for consulting projects in our defense technology development practice increased 68% to $8,017,000 during fiscal 2010 as compared to $4,762,000 during fiscal 2009 due to an increase in activity in this practice. During fiscal 2010, billable hours for this segment increased by 0.5% to 641,000 as compared to 638,000 during fiscal 2009. Technical full-time equivalent employees for this segment decreased by 4.1% to 441 during fiscal 2010 as compared to 460 during fiscal 2009. Utilization for this segment increased to 70% for fiscal 2010 as compared to 67% during fiscal 2009. The increase in utilization was due to our management of headcount to align resources with demand and the benefit of some major projects. Product sales in our defense technology development practice were $12.1 million for both fiscal 2010 and 2009.
The increase in revenues for our environmental and health segment during fiscal 2010 was driven by an increase in billable hours and higher billing rates. During fiscal 2010, billable hours for this segment increased by 13.1% to 259,000 as compared to 229,000 during fiscal 2009. The increase in billable hours was due to an increase in activity in the areas of our business that are related to litigation and regulatory compliance pertaining to the registration of chemicals. Technical full-time equivalent employees for this segment increased by 4.7% to 179 during fiscal 2010 as compared to 171 during fiscal 2009. Utilization for this segment increased to 70% for fiscal 2010 as compared to 64% for fiscal 2009. The increase in utilization was due to our management of headcount to align resources with demand and the benefit of some major projects.
| 24 |
Compensation and Related Expenses
| Fiscal Years | Percent | |||||||||||
| (In thousands except percentages) | 2010 | 2009 | Change | |||||||||
| Compensation and related expenses | $ | 144,842 | $ | 140,107 | 3.4 | % | ||||||
| Percentage of total revenues | 58.2 | % | 61.5 | % | ||||||||
The increase in compensation and related expenses during fiscal 2010 was due to an increase in bonus expense partially offset by a decrease in payroll expense. Bonus expense increased by $5,422,000 due to a corresponding increase in profitability. Payroll expense decreased by $972,000 due to a 1.7% decrease in technical full time equivalent employees partially offset by our annual salary increases. Included in compensation and related expenses, with a corresponding increase to other income, net, is the increase in value of assets associated with our deferred compensation plan of $1,925,000 and $1,891,000 for fiscal 2010 and fiscal 2009, respectively.
Other Operating Expenses
| Fiscal Years | Percent | |||||||||||
| (In thousands except percentages) | 2010 | 2009 | Change | |||||||||
| Other operating expenses | $ | 21,413 | $ | 21,340 | 0.3 | % | ||||||
| Percentage of total revenues | 8.6 | % | 9.4 | % | ||||||||
Other operating expenses include facilities-related costs, technical materials, computer-related expenses and depreciation and amortization of property, equipment and leasehold improvements. Other operating expenses remained relatively consistent with the prior year due to our continuing efforts to manage our cost structure by reducing discretionary spending and negotiating favorable agreements with our vendors.
Reimbursable Expenses
| Fiscal Years | Percent | |||||||||||
| (In thousands except percentages) | 2010 | 2009 | Change | |||||||||
| Reimbursable expenses | $ | 26,893 | $ | 22,168 | 21.3 | % | ||||||
| Percentage of total revenues | 10.8 | % | 9.7 | % | ||||||||
The increase in reimbursable expenses was primarily due to an increase in project related costs in our defense technology development practice. The amount of reimbursable expenses will vary from year to year depending on the nature of our projects.
General and Administrative Expenses
| Fiscal Years | Percent | |||||||||||
| (In thousands except percentages) | 2010 | 2009 | Change | |||||||||
| General and administrative expenses | $ | 12,364 | $ | 11,005 | 12.3 | % | ||||||
| Percentage of total revenues | 5.0 | % | 4.8 | % | ||||||||
The increase in general and administrative expenses during fiscal 2010 was primarily due to an increase in legal expenses of $692,000, an increase in travel and meals of $563,000, and an increase in contributions of $227,000 partially offset by a decrease in bad debt expense of $617,000. The increase in legal fees was primarily due to the costs associated with legal claims. The increase in travel and meals was due to an increase in business development activities and a company-wide managers meeting. The decrease in bad debt expense was primarily due to an improvement in the general macroeconomic climate and the 2009 bankruptcy filings of Chrysler and General Motors.
Other Income and Expense
| Fiscal Years | Percent | |||||||||||
| (In thousands except percentages) | 2010 | 2009 | Change | |||||||||
| Other income and expense, net | $ | 3,467 | $ | 3,759 | (7.8 | )% | ||||||
| Percentage of total revenues | 1.4 | % | 1.6 | % | ||||||||
Other income and expense, net, consists primarily of investment income earned on available cash, cash equivalents and short-term investments, rental income from leasing excess space in our Silicon Valley facility, and changes in the value of assets associated with our deferred compensation plan. The decrease in other income and expense, net, during fiscal 2010 was primarily due to a decrease in interest income of $416,000 due to lower short-term interest rates. Included in other income and expense, net, with a corresponding increase to compensation and related expenses, is the increase in value of assets associated with our deferred compensation plan of $1,925,000 and $1,891,000 for fiscal 2010 and fiscal 2009, respectively.
| 25 |
Income Taxes
| Fiscal Years | Percent | |||||||||||
| (In thousands except percentages) | 2010 | 2009 | Change | |||||||||
| Income taxes | $ | 19,187 | $ | 14,894 | 28.8 | % | ||||||
| Percentage of total revenues | 7.7 | % | 6.5 | % | ||||||||
| Effective tax rate | 41.1 | % | 40.2 | % | ||||||||
The increase in income tax expense was due to a corresponding increase in pre-tax income and an increase in our effective tax rate. The increase in our effective tax rate was primarily due to a decrease in tax-exempt interest income.
LIQUIDITY AND CAPITAL RESOURCES
| Fiscal Years | ||||||||||||
| (In thousands) | 2011 | 2010 | 2009 | |||||||||
| Net cash provided by (used in): | ||||||||||||
| Operating activities | $ | 46,596 | $ | 36,052 | $ | 26,816 | ||||||
| Investing activities | $ | (29,354 | ) | $ | 4,930 | $ | 16,136 | |||||
| Financing activities | $ | (39,344 | ) | $ | (2,220 | ) | $ | (7,760 | ) | |||
We financed our business in fiscal 2011 principally through available cash and cash flows from operating activities. We invest our excess cash in cash equivalents and short-term investments. At the end of fiscal 2011 we had $109.7 million in cash, cash equivalents and short-term investments compared to $106.5 million at the end of the prior year.
The increase in net cash provided by operating activities during fiscal 2011 as compared to the prior year was due to an increase in net income, a smaller increase in accounts receivable, and a smaller increase in prepaid expenses and other assets partially offset by a decrease in accounts payable and accrued liabilities. Accounts receivable increased $3,018,000 during fiscal 2011 as compared to an increase of $11,181,000 during fiscal 2010. The smaller increase in accounts receivable during fiscal 2011 was due improved collections. Prepaid expenses and other assets increased $1,929,000 during fiscal 2011 as compared to an increase of $8,520,000 during fiscal 2010. The smaller increase during fiscal 2011 was due to a decrease in inventory of $1,267,000 during fiscal 2011 as compared to an increase of $2,712,000 during fiscal 2010 and a decrease in prepaid taxes of $1,964,000 during fiscal 2011 as compared to an increase of $1,065,000 during fiscal 2010. Accounts payable and accrued liabilities decreased $997,000 during fiscal 2011 as compared to an increase of $9,485,000 during fiscal 2010. The decrease in accounts payable and accrued liabilities during the fiscal 2011 was due to the timing of payments to vendors and a decrease in the amount of materials purchased at year end related to projects in our defense technology development business.
The increase in net cash provided by operating activities during fiscal 2010 as compared to fiscal 2009 was due to an increase in net income, a larger increase in accrued payroll and employee benefits, a larger increase in accounts payable and accrued liabilities, an increase in deferred revenue, and an increase in stock-based compensation partially offset by a larger increase in accounts receivable and an increase in prepaid expenses and other assets. Accrued payroll and employee benefits increased $8,696,000 during fiscal 2010 as compared to an increase of $507,000 during fiscal 2009. The larger increase in accrued payroll and employee benefits was primarily due to an increase in deferred compensation and an increase in accrued bonuses driven by a corresponding increase in profitability. Accounts payable and accrued liabilities increased by $9,485,000 during fiscal 2010 as compared to an increase of $714,000 during fiscal 2009. The larger increase in accounts payable and accrued liabilities was due to an increase in activity in our defense technology development practice and the timing of payments to our vendors. Deferred revenues increased $1,374,000 during fiscal 2010 as compared to a decrease of $1,414,000 during fiscal 2009. The increase in deferred revenues was due to an increase in pre-billed projects. Stock-based compensation was $9,257,000 during fiscal 2010 as compared to $7,931,000 during fiscal 2009. The increase in stock-based compensation was due to additional restricted stock unit grants during fiscal 2010 and an increase in the accrued bonus that we expect to settle with fully vested restricted stock units. Accounts receivable increased $11,181,000 during fiscal 2010 as compared to an increase of $4,372,000 during fiscal 2009. The larger increase in accounts receivable was due to an increase in revenues. Prepaid expenses and other assets increased $8,520,000 during fiscal 2010 as compared to a decrease of $635,000 during fiscal 2009. The larger increase in prepaid expenses and other assets during fiscal 2010 was due to an increase in deferred compensation, an increase in inventory and an increase in prepaid income taxes.
During fiscal 2011, 2010, and 2009, net cash (used in) provided by investing activities primarily related to the purchase and sale or maturity of short-term investments.
| 26 |
The increase in cash used in financing activities during fiscal 2011, as compared to fiscal 2010, was due to an increase in repurchases of our common stock under our stock repurchase programs. The decrease in net cash used in financing activities during fiscal 2010, as compared to fiscal 2009, was due to a decrease in repurchases of our common stock under our stock repurchase programs.
We expect to continue our investing activities, including capital expenditures. Furthermore, cash reserves may be used to repurchase common stock under our stock repurchase programs or strategically acquire firms that are complementary to our business.
The following schedule summarizes our principal contractual commitments as of December 30, 2011 (in thousands):
| Operating | ||||||||||||||||
| lease | Capital | Purchase | ||||||||||||||
| Fiscal year | commitments | leases | Obligations | Total | ||||||||||||
| 2012 | $ | 7,257 | $ | 50 | $ | 1,892 | $ | 9,199 | ||||||||
| 2013 | 5,304 | 49 | - | 5,353 | ||||||||||||
| 2014 | 4,025 | 48 | - | 4,073 | ||||||||||||
| 2015 | 2,699 | - | - | 2,699 | ||||||||||||
| 2016 | 1,904 | - | - | 1,904 | ||||||||||||
| Thereafter | 1,890 | - | - | 1,890 | ||||||||||||
| $ | 23,079 | $ | 147 | $ | 1,892 | $ | 25,118 | |||||||||
The above table does not reflect unrecognized tax benefits of $388,000, the timing of which is uncertain. Refer to Note 8 of the Notes to Consolidated Financial Statements for additional discussion on unrecognized tax benefits.
We maintain a nonqualified deferred compensation plan for the benefit of a select group of highly compensated employees. Vested amounts due under the plan of $18,756,000 were recorded as a long-term liability on our consolidated balance sheet at December 30, 2011. Company assets that are earmarked to pay benefits under the plan are held in a rabbi trust and are subject to the claims of our creditors. As of December 30, 2011, invested amounts under the plan of $18,911,000 were recorded as a long-term asset on our consolidated balance sheet.
As permitted under Delaware law, we have agreements whereby we indemnify our officers and directors for certain events or occurrences while the officer or director is, or was serving, at our request in such capacity. The indemnification period covers all pertinent events and occurrences during the officer’s or director’s lifetime. The maximum potential amount of future payments we could be required to make under these indemnification agreements is unlimited; however, we have director and officer insurance coverage that reduces our exposure and enables us to recover a portion of any future amounts paid. We believe the estimated fair value of these indemnification agreements in excess of applicable insurance coverage is minimal.
Off-Balance Sheet Arrangements
As part of our ongoing business, we do not engage in transactions that generate relationships with unconsolidated entities or financial partnerships, such as entities often referred to as structured finance or special purpose entities.
| 27 |
Non-GAAP Financial Measures
Regulation G, conditions for use of Non-Generally Accepted Accounting Principles ("Non-GAAP") financial measures, and other SEC regulations define and prescribe the conditions for use of certain Non-GAAP financial information. Generally, a non-GAAP financial measure is a numerical measure of a company's performance, financial position or cash flow that either excludes or includes amounts that are not normally excluded or included in the most directly comparable measure calculated and presented in accordance with GAAP. We closely monitor two financial measures, EBITDA and EBITDAS, which meet the definition of Non-GAAP financial measures. We define EBITDA as net income before income taxes, interest income, depreciation and amortization. We define EBITDAS as EBITDA before stock-based compensation. The Company regards EBITDA and EBITDAS as useful measures of operating performance and cash flow to complement operating income, net income and other GAAP financial performance measures. Additionally, management believes that EBITDA and EBITDAS provide meaningful comparisons of past, present and future operating results. These measures are used to evaluate our financial results, develop budgets and determine employee compensation. These measures, however, should be considered in addition to, and not as a substitute or superior to, operating income, cash flows, or other measures of financial performance prepared in accordance with GAAP. A reconciliation of the Non-GAAP measures to the nearest comparable GAAP measure is set forth below.
The following table shows EBITDA as a percentage of revenues before reimbursements for fiscal years 2011, 2010 and 2009:
| (in thousands, except percentages) | ||||||||||||
| Fiscal Years | ||||||||||||
| 2011 | 2010 | 2009 | ||||||||||
| Revenues before reimbursements | $ | 246,667 | $ | 221,860 | $ | 205,714 | ||||||
| EBITDA | $ | 58,994 | $ | 50,833 | $ | 40,759 | ||||||
| EBITDA as a % of revenues before reimbursements | 23.9 | % | 22.9 | % | 19.8 | % | ||||||
The increase in EBITDA as a percentage of revenues before reimbursements for fiscal 2011 as compared to fiscal 2010 was primarily due to an increase in utilization and our efforts to manage our cost structure. Utilization for fiscal 2011 increased to 71% as compared to 70% during fiscal 2010 due to elevated levels of activity on a few major assignments. The increase in EBITDA as a percentage of revenues before reimbursements for fiscal 2010 as compared to fiscal 2009 was primarily due to an increase in utilization and our efforts to manage our cost structure. Utilization for fiscal 2010 increased to 70% as compared to 66% during fiscal 2009.
| 28 |
The following table is a reconciliation of EBITDA and EBITDAS to the most comparable GAAP measure, net income, for fiscal 2011, 2010 and 2009:
| (in thousands) | ||||||||||||
| Fiscal Years | ||||||||||||
| 2011 | 2010 | 2009 | ||||||||||
| Net Income | $ | 32,695 | $ | 27,521 | $ | 22,127 | ||||||
| Add back (subtract): | ||||||||||||
| Income taxes | 22,124 | 19,187 | 14,894 | |||||||||
| Interest income, net | (236 | ) | (198 | ) | (614 | ) | ||||||
| Depreciation and amortization | 4,411 | 4,323 | 4,352 | |||||||||
| EBITDA | 58,994 | 50,833 | 40,759 | |||||||||
| Stock-based compensation | 10,340 | 9,257 | 7,931 | |||||||||
| EBITDAS | $ | 69,334 | $ | 60,090 | $ | 48,690 | ||||||
Item 7A. Quantitative and Qualitative Disclosure About Market Risk
Exponent is exposed to interest rate risk associated with our balances of cash, cash equivalents and short-term investments. We manage our interest rate risk by maintaining an investment portfolio primarily consisting of debt instruments with high credit quality and relatively short average effective maturities in accordance with the Company’s investment policy. The maximum effective maturity of any issue in our portfolio of cash equivalents and short-term investments is 3 years and the maximum average effective maturity of the portfolio cannot exceed 12 months.
If interest rates were to instantaneously increase or decrease by 100 basis points, the change in the fair value of our portfolio of cash equivalents and short-term investments would not have a material impact on our financial statements. We do not use derivative financial instruments in our investment portfolio. Notwithstanding our efforts to manage interest rate risk, there can be no assurances that we will be adequately protected against the risks associated with interest rate fluctuations.
We are exposed to some foreign currency exchange rate risk associated with our foreign operations. Given the limited nature of these operations, we believe that any exposure would be minimal.
Item 8. Financial Statements and Supplementary Data
See Item 15 of this Form 10-K for required financial statements and supplementary data.
Item 9. Changes in and Disagreements with Accountants on Accounting and Financial Disclosure
None.
Item 9A. Controls and Procedures
KPMG LLP, an independent registered public accounting firm, has audited the Company’s internal control over financial reporting, as stated in their report which is included in Part IV, Item 15 of this Form 10-K.
| (a) | Conclusion Regarding the Effectiveness of Disclosure Controls and Procedures. |
Under the supervision and with the participation of our management, including our principal executive officer and principal financial officer, we conducted an evaluation of our disclosure controls and procedures, as such term is defined under Rule 13(a)-15(e) promulgated under the Securities Exchange Act of 1934, as amended (the “Exchange Act”). Based on this evaluation, our principal executive officer and our principal financial officer concluded that our disclosure controls and procedures were effective as of the end of the period covered by this annual report.
| 29 |
| (b) | Management’s Report on Internal Control Over Financial Reporting. |
Our management is responsible for establishing and maintaining adequate internal control over financial reporting, as such term is defined in Exchange Act Rule 13a-15(f). Because of its inherent limitations, internal control over financial reporting may not prevent or detect misstatements. Also, projections of any evaluation of effectiveness to future periods are subject to the risk that controls may become inadequate because of changes in conditions, or that the degree of compliance with the policies or procedures may deteriorate. Under the supervision and with the participation of our management, including our principal executive officer and principal financial officer, we conducted an evaluation of the effectiveness of our internal control over financial reporting based on the framework in Internal Control - Integrated Framework issued by the Committee of Sponsoring Organizations of the Treadway Commission. Based on our evaluation under the framework in Internal Control - Integrated Framework, our management concluded that our internal control over financial reporting was effective as of December 30, 2011.
| (c) | Changes in Internal Control Over Financial Reporting. |
There have not been any changes in the Company’s internal control over financial reporting, as such term is defined in Rule 13a-15(f) under the Exchange Act, during the most recent fiscal quarter that have materially affected, or are reasonably likely to materially effect, the Company’s internal control over financial reporting.
Item 9B. Other Information
None.
PART III
Certain information required by Part III is omitted from this Annual Report on Form 10-K. We intend to file a definitive Proxy Statement pursuant to Regulation 14A not later than 120 days after the end of the fiscal year covered by this Annual Report on Form 10-K, and certain information included therein is incorporated herein by reference.
Item 10. Directors, Executive Officers and Corporate Governance
The information required by this item with respect to our directors, code of ethics and compliance with section 16(a) of the Exchange Act is incorporated by reference to the sections of the Company’s definitive Proxy Statement for its 2012 Annual Meeting of Stockholders (the "Proxy Statement") entitled "Proposal No. 1: Election of Directors," "Code of Business Conduct and Corporate Governance" and "Compliance with Section 16(a) of the Exchange Act." See Item 1 for information regarding the executive officers of the Company.
Item 11. Executive Compensation
The information required by this item is incorporated by reference to the section of the Proxy Statement entitled "Executive Officer Compensation".
Item 12. Security Ownership of Certain Beneficial Owners and Management and Related Stockholder Matters
The information required by this item is incorporated by reference to the sections of the Proxy Statement entitled "Stock Ownership” and “Equity Compensation Plan Information".
Item 13. Certain Relationships and Related Transactions, and Director Independence
The information required by this item is incorporated by reference to the sections of the Proxy Statement entitled "Related Party Transactions" and “Proposal No. 1 – Election of Directors”.
Item 14. Principal Accounting Fees and Services
The information required by this item is incorporated by reference to the section of the Proxy Statement entitled "Principal Accounting Fees and Services".
| 30 |
PART IV
Item 15. Exhibits, Financial Statement Schedules
| (a) | The following documents are filed as part of this Annual Report on Form 10-K. |
| 1. | Financial Statements |
| The following consolidated financial statements of Exponent, Inc. and subsidiaries and the Report of Independent Registered Public Accounting Firm are included herewith: | ||
| Page | ||
| Report of Independent Registered Public Accounting Firm | 32 | |
| Consolidated Statements of Income for the years ended December 30, 2011, December 31, 2010 and January 1, 2010 | 33 | |
| Consolidated Balance Sheets as of December 30, 2011 and December 31, 2010 | 34 | |
| Consolidated Statements of Comprehensive Income for the years ended December 30, 2011, December 31, 2010 and January 1, 2010 | 35 | |
| Consolidated Statements of Stockholders’ Equity for the years ended December 30, 2011, December 31, 2010 and January 1, 2010 | 36 | |
| Consolidated Statements of Cash Flows for the years ended December 30, 2011, December 31, 2010 and January 1, 2010 | 38 | |
| Notes to Consolidated Financial Statements | 39 | |
| 2. | Financial Statement Schedules |
The following financial statement schedule of Exponent, Inc. for the years ended December 30, 2011, December 31, 2010 and January 1, 2010 is filed as part of this Report and should be read in conjunction with the consolidated financial statements of Exponent, Inc. and subsidiaries:
| Page | ||
| Schedule II - Valuation and Qualifying Accounts | 58 |
Schedules other than those listed above have been omitted since they are either not required, not applicable, or the information is otherwise included elsewhere in the report.
| 3. | Exhibits |
| Page | ||
| (a) Exhibit Index | 60 | |
| 31 |
Report of Independent Registered Public Accounting Firm
The Board of Directors and Stockholders
Exponent, Inc.:
We have audited the accompanying consolidated balance sheets of Exponent, Inc. and subsidiaries (the Company) as of December 30, 2011 and December 31, 2010, and the related consolidated statements of income, comprehensive income, stockholders’ equity, and cash flows for each of the years in the three-year period ended December 30, 2011. In connection with our audits of the consolidated financial statements, we have also audited the accompanying financial statement schedule II. We also have audited the Company’s internal control over financial reporting as of December 30, 2011, based on the criteria established in Internal Control – Integrated Framework issued by the Committee of Sponsoring Organizations of the Treadway Commission (COSO). The Company’s management is responsible for these consolidated financial statements, for maintaining effective internal control over financial reporting, and for its assessment of the effectiveness of internal control over financial reporting, included in the accompanying Management’s Report on Internal Control over Financial Reporting, appearing under Item 9A(b). Our responsibility is to express an opinion on these consolidated financial statements and financial statement schedule II, and an opinion on the Company’s internal control over financial reporting based on our audits.
We conducted our audits in accordance with the standards of the Public Company Accounting Oversight Board (United States). Those standards require that we plan and perform the audits to obtain reasonable assurance about whether the financial statements are free of material misstatement and whether effective internal control over financial reporting was maintained in all material respects. Our audits of the consolidated financial statements included examining, on a test basis, evidence supporting the amounts and disclosures in the financial statements, assessing the accounting principles used and significant estimates made by management, and evaluating the overall financial statement presentation. Our audit of internal control over financial reporting included obtaining an understanding of internal control over financial reporting, assessing the risk that a material weakness exists, and testing and evaluating the design and operating effectiveness of internal control based on the assessed risk. Our audits also included performing such other procedures as we considered necessary in the circumstances. We believe that our audits provide a reasonable basis for our opinions.
A company’s internal control over financial reporting is a process designed to provide reasonable assurance regarding the reliability of financial reporting and the preparation of financial statements for external purposes in accordance with generally accepted accounting principles. A company’s internal control over financial reporting includes those policies and procedures that (1) pertain to the maintenance of records that, in reasonable detail, accurately and fairly reflect the transactions and dispositions of the assets of the company; (2) provide reasonable assurance that transactions are recorded as necessary to permit preparation of financial statements in accordance with generally accepted accounting principles, and that receipts and expenditures of the company are being made only in accordance with authorizations of management and directors of the company; and (3) provide reasonable assurance regarding prevention or timely detection of unauthorized acquisition, use, or disposition of the company’s assets that could have a material effect on the financial statements.
Because of its inherent limitations, internal control over financial reporting may not prevent or detect misstatements. Also, projections of any evaluation of effectiveness to future periods are subject to the risk that controls may become inadequate because of changes in conditions, or that the degree of compliance with the policies or procedures may deteriorate.
In our opinion, the consolidated financial statements referred to above present fairly, in all material respects, the financial position of Exponent, Inc. and subsidiaries as of December 30, 2011 and December 31, 2010, and the results of its operations and its cash flows for each of the years in the three-year period ended December 30, 2011, in conformity with accounting principles generally accepted in the United States of America. Also in our opinion, the related financial statement schedule, when considered in relation to the basic financial statements taken as a whole, presents fairly, in all material respects, the information set forth therein. Also, in our opinion, Exponent, Inc. and subsidiaries maintained, in all material respects, effective internal control over financial reporting as of December 30, 2011, based on the criteria established in Internal Control – Integrated Framework issued by COSO.
KPMG LLP
San Francisco, California
February 24, 2012
| 32 |
Exponent, Inc. and Subsidiaries
Consolidated Statements of Income
| Fiscal Years | ||||||||||||
| (In thousands, except per share data) | 2011 | 2010 | 2009 | |||||||||
| Revenues: | ||||||||||||
| Revenues before reimbursements | $ | 246,667 | $ | 221,860 | $ | 205,714 | ||||||
| Reimbursements | 25,779 | 26,893 | 22,168 | |||||||||
| Revenues | 272,446 | 248,753 | 227,882 | |||||||||
| Operating expenses: | ||||||||||||
| Compensation and related expenses | 156,853 | 144,842 | 140,107 | |||||||||
| Other operating expenses | 23,238 | 21,413 | 21,340 | |||||||||
| Reimbursable expenses | 25,779 | 26,893 | 22,168 | |||||||||
| General and administrative expenses | 13,116 | 12,364 | 11,005 | |||||||||
| 218,986 | 205,512 | 194,620 | ||||||||||
| Operating income | 53,460 | 43,241 | 33,262 | |||||||||
| Other income: | ||||||||||||
| Interest income, net | 236 | 198 | 614 | |||||||||
| Miscellaneous income, net | 1,123 | 3,269 | 3,145 | |||||||||
| Income before income taxes | 54,819 | 46,708 | 37,021 | |||||||||
| Provision for income taxes | 22,124 | 19,187 | 14,894 | |||||||||
| Net income | $ | 32,695 | $ | 27,521 | $ | 22,127 | ||||||
| Net income per share: | ||||||||||||
| Basic | $ | 2.31 | $ | 1.92 | $ | 1.56 | ||||||
| Diluted | $ | 2.22 | $ | 1.83 | $ | 1.47 | ||||||
| Shares used in per share computations: | ||||||||||||
| Basic | 14,181 | 14,354 | 14,186 | |||||||||
| Diluted | 14,751 | 15,069 | 15,030 | |||||||||
See accompanying notes to the Consolidated Financial Statements.
| 33 |
Exponent, Inc. and Subsidiaries
Consolidated Balance Sheets
| Fiscal Years | ||||||||
| (In thousands, except par value) | 2011 | 2010 | ||||||
| Assets | ||||||||
| Current assets: | ||||||||
| Cash and cash equivalents | $ | 84,439 | $ | 106,549 | ||||
| Short-term investments | 25,260 | - | ||||||
| Accounts receivable, net of allowance for doubtful account of $2,339 and $2,126, respectively | 73,065 | 72,034 | ||||||
| Prepaid expenses and other assets | 8,521 | 10,585 | ||||||
| Deferred income taxes | 7,293 | 5,426 | ||||||
| Total current assets | 198,578 | 194,594 | ||||||
| Property, equipment and leasehold improvements, net | 27,215 | 27,267 | ||||||
| Goodwill | 8,607 | 8,607 | ||||||
| Deferred income taxes | 14,692 | 12,940 | ||||||
| Deferred compensation plan assets | 18,911 | 15,068 | ||||||
| Other assets | 785 | 416 | ||||||
| $ | 268,788 | $ | 258,892 | |||||
| Liabilities and Stockholders’ Equity | ||||||||
| Current liabilities: | ||||||||
| Accounts payable and accrued liabilities | $ | 6,738 | $ | 9,715 | ||||
| Accrued payroll and employee benefits | 48,089 | 41,888 | ||||||
| Deferred revenues | 5,948 | 6,131 | ||||||
| Total current liabilities | 60,775 | 57,734 | ||||||
| Other liabilities | 700 | 413 | ||||||
| Deferred compensation | 18,756 | 15,068 | ||||||
| Deferred rent | 1,842 | 1,877 | ||||||
| Total liabilities | 82,073 | 75,092 | ||||||
| Commitments and contingencies | ||||||||
| Stockholders’ equity: | ||||||||
| Preferred stock, $.001 par value; 5,000 shares authorized; no shares outstanding | - | - | ||||||
| Common stock, $.001 par value; 100,000 shares authorized; 16,427 shares issued | 16 | 16 | ||||||
| Additional paid-in capital | 108,071 | 96,089 | ||||||
| Accumulated other comprehensive loss | ||||||||
| Investment securities, available for sale | 52 | - | ||||||
| Foreign currency translation adjustments | (523 | ) | (451 | ) | ||||
| (471 | ) | (451 | ) | |||||
| Retained earnings | 179,432 | 156,086 | ||||||
| Treasury stock, at cost: 3,127 and 2,431 shares held, respectively | (100,333 | ) | (67,940 | ) | ||||
| Total stockholders’ equity | 186,715 | 183,800 | ||||||
| $ | 268,788 | $ | 258,892 | |||||
See accompanying notes to the Consolidated Financial Statements.
| 34 |
Exponent, Inc. and Subsidiaries
Consolidated Statements of Comprehensive Income
| Fiscal Years | ||||||||||||
| (In thousands) | 2011 | 2010 | 2009 | |||||||||
| Net income | $ | 32,695 | $ | 27,521 | $ | 22,127 | ||||||
| Other comprehensive (loss) income, net of tax: | ||||||||||||
| Foreign currency translation adjustments, net of tax | (72 | ) | (53 | ) | (122 | ) | ||||||
| Unrealized gain (loss) arising during the period on investments, net of tax | 52 | (31 | ) | 100 | ||||||||
| Comprehensive income | $ | 32,675 | $ | 27,437 | $ | 22,105 | ||||||
See accompanying notes to the Consolidated Financial Statements.
| 35 |
Exponent, Inc. and Subsidiaries
Consolidated Statements of Stockholders’ Equity
| Accumulated | ||||||||||||||||||||||||||||||||
| Additional | other | |||||||||||||||||||||||||||||||
| Common Stock | paid-in | comprehensive | Retained | Treasury Stock | ||||||||||||||||||||||||||||
| (In thousands) | Shares | Amount | capital | income (loss) | earnings | Shares | Amount | Total | ||||||||||||||||||||||||
| Balance at January 2, 2009 | 16,427 | $ | 16 | $ | 72,734 | $ | (345 | ) | $ | 127,127 | 2,737 | $ | (71,438 | ) | $ | 128,094 | ||||||||||||||||
| Employee stock purchase plan | - | - | 146 | - | - | (33 | ) | 702 | 848 | |||||||||||||||||||||||
| Exercise of stock options, net of swaps | - | - | (227 | ) | - | (5,185 | ) | (392 | ) | 8,251 | 2,839 | |||||||||||||||||||||
| Tax benefit for stock option plans | - | - | 3,282 | - | - | - | - | 3,282 | ||||||||||||||||||||||||
| Amortization of unrecognized stock-based compensation | - | - | 4,134 | - | - | - | - | 4,134 | ||||||||||||||||||||||||
| Purchase of treasury shares | - | - | - | - | - | 540 | (13,121 | ) | (13,121 | ) | ||||||||||||||||||||||
| Foreign currency translation adjustments | - | - | - | (122 | ) | - | - | - | (122 | ) | ||||||||||||||||||||||
| Grant of restricted stock units to settle accrued bonus | - | - | 3,739 | - | - | - | - | 3,739 | ||||||||||||||||||||||||
| Settlement of restricted stock units | - | - | - | - | (4,463 | ) | (162 | ) | 2,614 | (1,849 | ) | |||||||||||||||||||||
| Unrealized gain on investments | - | - | - | 100 | - | - | - | 100 | ||||||||||||||||||||||||
| Net income | - | - | - | - | 22,127 | - | - | 22,127 | ||||||||||||||||||||||||
| Balance at January 1, 2010 | 16,427 | $ | 16 | $ | 83,808 | $ | (367 | ) | $ | 139,606 | 2,690 | $ | (72,992 | ) | $ | 150,071 | ||||||||||||||||
| Employee stock purchase plan | - | - | 125 | - | - | (26 | ) | 671 | 796 | |||||||||||||||||||||||
| Exercise of stock options, net of swaps | - | - | (82 | ) | - | (6,059 | ) | (330 | ) | 8,220 | 2,079 | |||||||||||||||||||||
| Tax benefit for stock option plans | - | - | 3,972 | - | - | - | - | 3,972 | ||||||||||||||||||||||||
| Amortization of unrecognized stock-based compensation | - | - | 4,724 | - | - | - | - | 4,724 | ||||||||||||||||||||||||
| Purchase of treasury shares | - | - | - | - | - | 244 | (6,899 | ) | (6,899 | ) | ||||||||||||||||||||||
| Foreign currency translation adjustments | - | - | - | (53 | ) | - | - | - | (53 | ) | ||||||||||||||||||||||
| Grant of restricted stock units to settle accrued bonus | - | - | 3,566 | - | - | - | - | 3,566 | ||||||||||||||||||||||||
| Settlement of restricted stock units | - | - | (24 | ) | - | (4,982 | ) | (147 | ) | 3,060 | (1,946 | ) | ||||||||||||||||||||
| Unrealized loss on investments | - | - | - | (31 | ) | - | - | - | (31 | ) | ||||||||||||||||||||||
| Net income | - | - | - | - | 27,521 | - | - | 27,521 | ||||||||||||||||||||||||
| Balance at December 31, 2010 | 16,427 | $ | 16 | $ | 96,089 | $ | (451 | ) | $ | 156,086 | 2,431 | $ | (67,940 | ) | $ | 183,800 | ||||||||||||||||
See accompanying notes to the Consolidated Financial Statements.
| 36 |
| Accumulated | ||||||||||||||||||||||||||||||||
| Additional | other | |||||||||||||||||||||||||||||||
| Common Stock | paid-in | comprehensive | Retained | Treasury Stock | ||||||||||||||||||||||||||||
(In thousands) | Shares | Amount | capital | income (loss) | earnings | Shares | Amount | Total | ||||||||||||||||||||||||
| Balance at December 31, 2010 | 16,427 | $ | 16 | $ | 96,089 | $ | (451 | ) | $ | 156,086 | 2,431 | $ | (67,940 | ) | $ | 183,800 | ||||||||||||||||
| Employee stock purchase plan | - | - | 222 | - | - | (21 | ) | 672 | 894 | |||||||||||||||||||||||
| Exercise of stock options, net of swaps | - | - | (162 | ) | - | (1,484 | ) | (102 | ) | 2,982 | 1,336 | |||||||||||||||||||||
| Tax benefit for stock option plans | - | - | 2,378 | - | - | - | - | 2,378 | ||||||||||||||||||||||||
| Amortization of unrecognized stock-based compensation | - | - | 5,044 | - | - | - | - | 5,044 | ||||||||||||||||||||||||
| Purchase of treasury shares | - | - | - | - | - | 1,002 | (40,573 | ) | (40,573 | ) | ||||||||||||||||||||||
| Foreign currency translation adjustments | - | - | - | (72 | ) | - | - | - | (72 | ) | ||||||||||||||||||||||
| Grant of restricted stock units to settle accrued bonus | - | - | 4,538 | - | - | - | - | 4,538 | ||||||||||||||||||||||||
| Settlement of restricted stock units | - | - | (38 | ) | - | (7,865 | ) | (183 | ) | 4,526 | (3,377 | ) | ||||||||||||||||||||
| Unrealized gain on investments | - | - | - | 52 | - | - | - | 52 | ||||||||||||||||||||||||
| Net income | - | - | - | - | 32,695 | - | - | 32,695 | ||||||||||||||||||||||||
| Balance at December 30, 2011 | 16,427 | $ | 16 | $ | 108,071 | $ | (471 | ) | $ | 179,432 | 3,127 | $ | (100,333 | ) | $ | 186,715 | ||||||||||||||||
See accompanying notes to the Consolidated Financial Statements.
| 37 |
Exponent, Inc. and Subsidiaries
Consolidated Statements of Cash Flows
| Fiscal Years | ||||||||||||
| (In thousands) | 2011 | 2010 | 2009 | |||||||||
| Cash flows from operating activities: | ||||||||||||
| Net income | $ | 32,695 | $ | 27,521 | $ | 22,127 | ||||||
| Adjustments to reconcile net income to net cash | ||||||||||||
| provided by operating activities: | ||||||||||||
| Depreciation and amortization of property, equipment | ||||||||||||
| and leasehold improvements | 4,411 | 4,323 | 4,352 | |||||||||
| Amortization of premiums and accretion of discounts | ||||||||||||
| on short-term investments | 344 | 35 | 170 | |||||||||
| Deferred rent expense | (417 | ) | 454 | (370 | ) | |||||||
| Provision for doubtful accounts | 1,987 | 1,809 | 3,918 | |||||||||
| Stock-based compensation | 10,340 | 9,257 | 7,931 | |||||||||
| Deferred income tax provision | (3,663 | ) | (3,229 | ) | (4,100 | ) | ||||||
| Tax benefit for stock option plans | (2,378 | ) | (3,972 | ) | (3,282 | ) | ||||||
| Changes in operating assets and liabilities: | ||||||||||||
| Accounts receivable | (3,018 | ) | (11,181 | ) | (4,372 | ) | ||||||
| Prepaid expenses and other assets | (1,929 | ) | (8,520 | ) | 635 | |||||||
| Accounts payable and accrued liabilities | (997 | ) | 9,485 | 714 | ||||||||
| Accrued payroll and employee benefits | 9,404 | 8,696 | 507 | |||||||||
| Deferred revenues | (183 | ) | 1,374 | (1,414 | ) | |||||||
| Net cash provided by operating activities | 46,596 | 36,052 | 26,816 | |||||||||
| Cash flows from investing activities: | ||||||||||||
| Capital expenditures | (3,835 | ) | (2,475 | ) | (2,017 | ) | ||||||
| Purchase of short-term investments | (26,599 | ) | - | - | ||||||||
| Maturity of short-term investments | - | 7,405 | 18,153 | |||||||||
| Sale of short-term investments | 1,080 | - | - | |||||||||
| Net cash (used in) provided by | ||||||||||||
| investing activities | (29,354 | ) | 4,930 | 16,136 | ||||||||
| Cash flows from financing activities: | ||||||||||||
| Tax benefit for stock option plans | 2,378 | 3,972 | 3,282 | |||||||||
| Payroll taxes for restricted stock units | (3,527 | ) | (1,946 | ) | (1,849 | ) | ||||||
| Repurchase of common stock | (40,573 | ) | (7,145 | ) | (12,875 | ) | ||||||
| Exercise of share-based payment awards | 2,378 | 2,899 | 3,682 | |||||||||
| Net cash used in financing activities | (39,344 | ) | (2,220 | ) | (7,760 | ) | ||||||
| Effect of foreign currency exchange rates on cash | ||||||||||||
| and cash equivalents | (8 | ) | (108 | ) | 105 | |||||||
| Net (decrease) increase in cash and cash equivalents | (22,110 | ) | 38,654 | 35,297 | ||||||||
| Cash and cash equivalents at beginning of year | 106,549 | 67,895 | 32,598 | |||||||||
| Cash and cash equivalents at end of year | $ | 84,439 | $ | 106,549 | $ | 67,895 | ||||||
| See accompanying notes to the Consolidated Financial Statements | ||||||||||||
| 38 |
Exponent, Inc. and Subsidiaries
Notes to Consolidated Financial Statements
Note 1: Summary of Significant Accounting Policies
Basis of Presentation
Exponent, Inc. together with its subsidiaries (collectively referred to as the “Company”) is a science and engineering consulting firm that provides solutions to complex problems. The accompanying consolidated financial statements include the accounts of the Company and its wholly owned subsidiaries. All significant intercompany transactions and balances have been eliminated in consolidation.
The Company operates on a 52-53 week fiscal year with each year ending on the Friday closest to December 31st. Fiscal periods 2011, 2010 and 2009 included 52 weeks of activity and ended on December 30, 2011, December 31, 2010 and January 1, 2010, respectively.
Authorized Capital Stock
The Company committed to stockholders in a letter dated May 23, 2006 to limit its use of the increased authorized capital stock to 40 million common shares, and 2 million preferred shares, unless the approval of the Company’s stockholders is obtained subsequently, such as through a further amendment to the Company’s authorized capital stock.
Revenue Recognition
The Company derives its revenues primarily from professional fees earned on consulting engagements, product sales in its defense technology development practice, fees earned for the use of its equipment and facilities, as well as reimbursements for outside direct expenses associated with the services that are billed to its clients. Any taxes assessed on revenues relating to services provided to our clients are recorded on a net basis.
The Company reports service revenues net of subcontractor fees. The Company has determined that it is not the primary obligor with respect to these subcontractors because:
| · | its clients are directly involved in the subcontractor selection process; |
| · | the subcontractor is responsible for fulfilling the scope of work; and |
| · | the Company passes through the costs of subcontractor agreements with only a minimal fixed percentage mark-up to compensate it for processing the transactions. |
Reimbursements, including those related to travel and other out-of-pocket expenses, and other similar third party costs such as the cost of materials, are included in revenues, and an equivalent amount of reimbursable expenses are included in operating expenses. Any mark-up on reimbursable expenses is included in revenues.
Substantially all of the Company’s engagements are performed under time and material or fixed-price billing arrangements. On time and material and fixed-price projects, revenue is generally recognized as the services are performed. For substantially all of the Company’s fixed-price engagements, it recognizes revenue based on the relationship of incurred labor hours at standard rates to its estimate of the total labor hours at standard rates it expects to incur over the term of the contract. The Company believes this methodology achieves a reliable measure of the revenue from the consulting services it provides to its customers under fixed-price contracts given the nature of the consulting services the Company provides and the following additional considerations:
| · | the Company considers labor hours at standard rates and expenses to be incurred when pricing its contracts; |
| · | the Company generally does not incur set up costs on its contracts; |
| · | the Company does not believe that there are reliable milestones to measure progress toward completion; |
| · | if the contract is terminated early, the customer is required to pay the Company for time at standard rates plus materials incurred to date; |
| · | the Company does not recognize revenue for award fees or bonuses until specific contractual criteria are met; |
| · | the Company does not include revenue for unpriced change orders until the customer agrees with the changes; |
| · | historically the Company has not had significant accounts receivable write-offs or cost overruns; and |
| · | its contracts are typically progress billed on a monthly basis. |
Product revenue is recognized, when both title and risk of loss transfer to the customer and customer acceptance has occurred, provided that no significant obligations remain.
| 39 |
Gross revenues and reimbursements for the fiscal years ended December 30, 2011, December 31, 2010 and January 1, 2010, respectively, were:
| Fiscal Years | ||||||||||||
| (In thousands) | 2011 | 2010 | 2009 | |||||||||
| Gross revenues | $ | 280,671 | $ | 260,413 | $ | 234,602 | ||||||
| Less: Subcontractor fees | 8,225 | 11,660 | 6,720 | |||||||||
| Revenues | 272,446 | 248,753 | 227,882 | |||||||||
| Reimbursements: | ||||||||||||
| Out-of-pocket reimbursements | 6,162 | 4,870 | 4,652 | |||||||||
| Other outside direct expenses | 19,617 | 22,023 | 17,516 | |||||||||
| 25,779 | 26,893 | 22,168 | ||||||||||
| Revenues before reimbursements | $ | 246,667 | $ | 221,860 | $ | 205,714 | ||||||
Significant management judgments and estimates must be made in connection with the revenues recognized in any accounting period. These judgments and estimates include an assessment of collectibility and, for fixed-price engagements, an estimate as to the total effort required to complete the project. If the Company made different judgments or utilized different estimates, the amount and timing of its revenue for any period could be materially different.
All consulting contracts are subject to review by management, which requires a positive assessment of the collectibility of contract amounts. If, during the course of the contract, the Company determines that collection of revenue is not reasonably assured, it does not recognize the revenue until its collection becomes reasonably assured, which in those situations would generally be upon receipt of cash. The Company assesses collectibility based on a number of factors, including past transaction history with the client, as well as the credit-worthiness of the client. Losses on fixed-price contracts are recognized during the period in which the loss first becomes evident. Contract losses are determined to be the amount by which the estimated total costs of the contract exceeds the total fixed price of the contract.
Use of Estimates
The preparation of financial statements in conformity with accounting principles generally accepted in the United States of America requires management to make estimates and assumptions that affect the reported amounts of assets and liabilities and disclosure of contingent assets and liabilities at the date of the financial statements and the reported amounts of revenues and expenses during the period. Actual results could differ from those estimates.
Foreign Currency Translation
The Company translates the assets and liabilities of foreign subsidiaries, whose functional currency is the local currency, at exchange rates in effect at the balance sheet date. Revenues and expenses are translated at the average rates of exchange prevailing during the year. The adjustment resulting from translating the financial statements of such foreign subsidiaries is included in accumulated other comprehensive income, which is reflected as a separate component of stockholders’ equity.
Cash Equivalents
Cash equivalents consist of highly liquid investments such as money market mutual funds, commercial paper and debt securities with original maturities of three months or less.
Short-term Investments
Short-term investments consist of debt securities classified as available-for-sale and are carried at their fair value as of the balance sheet date. Short-term investments generally mature between three months and three years from the purchase date. Investments with maturities beyond one year are classified as short-term based on their highly liquid nature and because such marketable securities represent investments readily available for current operations.
The amortized cost of securities is adjusted for amortization of premiums and accretion of discounts to maturity. Such amortization is included in interest income. Realized gains or losses are determined on the specific identification method and are reflected in other income. Net unrealized gains and losses are recorded directly in accumulated other comprehensive income except for unrealized losses that are deemed to be other-than-temporary, which are reflected in net income.
Investments are reviewed on a regular basis to evaluate whether or not any security has experienced an other-than temporary decline in fair value. When assessing investments for other-than-temporary declines in fair value, the Company considers the significance of the decline in value as a percentage of the original cost, how long the market value of the investment has been less than its original cost, and any news that has been released specific to the investee.
| 40 |
Allowances for Doubtful Accounts
The Company maintains allowances for doubtful accounts for estimated losses resulting from the inability of customers to meet their financial obligations. In circumstances where the Company is aware of a specific customer’s inability to meet its financial obligations a specific allowance is recorded to reduce the net recognized receivable to the amount the Company reasonably believes will be collected. For all other customers the Company recognizes allowances for doubtful accounts based upon historical bad debts, customer concentration, customer credit-worthiness, current economic conditions, aging of amounts due and changes in customer payment terms.
Property, Equipment and Leasehold Improvements
Property, equipment and leasehold improvements are stated at cost less accumulated depreciation and amortization. Depreciation and amortization are recognized using the straight-line method. Buildings are depreciated over their estimated useful lives ranging from thirty to forty years. Equipment is depreciated over its estimated useful life, which generally ranges from two to seven years. Leasehold improvements are amortized over the shorter of their estimated useful lives, generally seven years, or the term of the related lease.
Impairment of Long-Lived Assets
The Company evaluates long-lived assets for impairment whenever events or changes in circumstances indicate that the carrying amount of an asset may not be recoverable. Recoverability of assets to be held and used is measured by a comparison of the carrying amount of the assets to future undiscounted cash flows to be generated by the asset. If such assets are considered to be impaired, the impairment to be recognized is measured as the amount by which the carrying amount of the assets exceeds the fair value of the assets. The Company has not recognized impairment losses on any long-lived assets in fiscal 2011, 2010 or 2009.
Goodwill
The Company assesses the impairment of goodwill annually and whenever events or changes in circumstances indicate that the carrying amount may be impaired. The Company’s annual goodwill impairment review is completed during the fourth quarter of each year. Starting in 2011, the Company evaluates goodwill for each reporting unit for impairment by assessing qualitative factors to determine whether it is necessary to perform the two-step goodwill impairment test. The Company considers events and circumstances, including but not limited to, macroeconomic conditions, industry and market considerations, cost factors, overall financial performance, changes in management or key personnel, changes in strategy, changes in customers, a change in the composition or carrying amount of a reporting units net assets and changes in the price of its common stock. If, after assessing the totality of events or circumstances, the Company determines that it is more likely than not that the fair value of a reporting unit is greater than its carrying amount, then the two-step goodwill impairment test is not performed.
If the two-step goodwill test is performed, the Company determines the existence of impairment by assessing the fair value of the applicable reporting unit, including goodwill, using expected future cash flows to be generated by the reporting unit. If the carrying amount of a reporting unit exceeds its fair value, an impairment loss is recognized for any excess of the carrying amount of the reporting unit’s goodwill over the implied fair value of the goodwill. The implied fair value of goodwill is determined by allocating the fair value of the reporting unit in a manner similar to a purchase price allocation. The residual fair value after this allocation is the implied value of the reporting unit goodwill.
The Company completed its annual assessment for all reporting units with goodwill for fiscal 2011 and determined, after assessing the totality of the qualitative factors, that it is more likely than not that the fair value of the reporting unit is greater than its carrying amount. Accordingly there was no indication of impairment and the two-step goodwill impairment test was not performed. The Company did not recognize any goodwill impairment losses in fiscal years 2011, 2010 or 2009.
Deferred Revenues
Deferred revenues represent amounts billed to clients in advance of services provided, primarily on fixed-price projects. The Company had $5,948,000 and $6,131,000 in deferred revenues as of December 30, 2011 and December 31, 2010, respectively.
Income Taxes
Income taxes are accounted for under the asset and liability method. Deferred tax assets and liabilities are recognized for the expected tax consequences of temporary differences between the tax basis and the financial reporting basis of assets and liabilities. Deferred tax assets and liabilities are measured using the enacted tax rates and laws in effect when the differences are expected to reverse. The effect on deferred tax assets and liabilities from changes in tax rates is recognized in income in the period that includes the enactment date. A valuation allowance is recorded for deferred tax assets if it is more likely than not that some portion or all of the deferred tax assets will not be realized. U.S. income taxes are provided on the earnings of foreign subsidiaries unless the subsidiaries earnings are considered permanently reinvested outside the U.S. An uncertain tax position is recognized if it is determined that it is more likely than not to be sustained upon examination. The tax position is measured as the largest amount of benefit that is greater than fifty percent likely of being realized upon ultimate settlement. The Company’s policy is to recognize interest and penalties related to unrecognized tax benefits as income tax expense. Accrued interest and penalties are insignificant at December 30, 2011.
| 41 |
Fair Value of Financial Instruments
Financial instruments consist of cash and cash equivalents, short-term investments, accounts receivable, other assets and accounts payable. The carrying amount of the Company’s cash and cash equivalents, short-term investments, accounts receivable, other assets and accounts payable approximates their fair values.
Stock-Based Compensation
Stock-based compensation is measured at the grant date based on the fair value of the award and is recognized as expense on a straight-line basis over the requisite service period of the entire award. The Company estimates the number of awards that are expected to vest and revises the estimate as actual forfeitures differ from that estimate. Estimated forfeiture rates are based on the Company’s historical experience.
Net Income Per Share
Basic per share amounts are computed using the weighted-average number of common shares outstanding during the period. Dilutive per share amounts are computed using the weighted-average number of common shares outstanding and potentially dilutive securities, using the treasury stock method if their effect would be dilutive.
The following schedule reconciles the denominators of the Company’s calculation for basic and diluted net income per share:
| Fiscal Years | ||||||||||||
| (In thousands) | 2011 | 2010 | 2009 | |||||||||
| Shares used in basic per share computation | 14,181 | 14,354 | 14,186 | |||||||||
| Effect of dilutive common stock options outstanding | 184 | 288 | 460 | |||||||||
| Effect of unvested restricted stock units outstanding | 386 | 427 | 384 | |||||||||
| Shares used in diluted per share computation | 14,751 | 15,069 | 15,030 | |||||||||
There were no options excluded from the diluted per share calculation for the fiscal years ended December 30, 2011 and December 31, 2010. Common stock options to purchase 60,000 shares with exercise prices greater than the average fair market value of the Company’s common stock, were excluded from the diluted per share calculation for the fiscal year ended January 1, 2010. The weighted average exercise price for the antidilutive shares was $31.01 for the fiscal year ended January 1, 2010.
Recent Accounting Pronouncements
In September 2011, the Financial Accounting Standards Board issued Accounting Standards Update No. 2011-08 “Intangibles – Goodwill and Other,” which allows an entity to first assess qualitative factors to determine whether it is necessary to perform the two-step goodwill impairment test. An entity may assess qualitative factors to determine whether it is more likely than not (that is, a likelihood of more than 50 percent) that the fair value of a reporting unit is less than its carrying amount, including goodwill. If, after assessing the totality of events or circumstances, an entity determines that it is not more likely than not that the fair value of a reporting unit is less than its carrying amount, then the first and second steps of the goodwill impairment test are not performed. The new standard is effective for annual and interim goodwill impairment tests performed for fiscal years beginning after December 15, 2011. Early adoption is permitted. The Company adopted the new standard for its annual impairment assessment during the fourth quarter of fiscal 2011.
| 42 |
Note 2: Cash, cash equivalents and short-term investments
Cash, cash equivalents and short-term investments consisted of the following as of December 30, 2011:
| Amortized | Unrealized | Unrealized | Estimated | |||||||||||||
| (In thousands) | Cost | Gains | Losses | Fair Value | ||||||||||||
| Classified as current assets: | ||||||||||||||||
| Cash | $ | 39,991 | $ | - | $ | - | $ | 39,991 | ||||||||
| Cash equivalents: | ||||||||||||||||
| Money market securities | 44,448 | - | - | 44,448 | ||||||||||||
| Total cash equivalents | 44,448 | - | - | 44,448 | ||||||||||||
| Total cash and cash equivalents | 84,439 | - | - | 84,439 | ||||||||||||
| Short-term investments: | ||||||||||||||||
| State and municipal bonds | 25,173 | 91 | (4 | ) | 25,260 | |||||||||||
| Total short-term investments | 25,173 | 91 | (4 | ) | 25,260 | |||||||||||
| Total cash, cash equivalents | ||||||||||||||||
| and short-term investments | $ | 109,612 | $ | 91 | $ | (4 | ) | $ | 109,699 | |||||||
Cash, cash equivalents and short-term investments consisted of the following as of December 31, 2010:
| Amortized | Unrealized | Unrealized | Estimated | |||||||||||||
| (In thousands) | Cost | Gains | Losses | Fair Value | ||||||||||||
| Classified as current assets: | ||||||||||||||||
| Cash | $ | 41,782 | $ | - | $ | - | $ | 41,782 | ||||||||
| Cash equivalents: | ||||||||||||||||
| Money market securities | 64,767 | - | - | 64,767 | ||||||||||||
| Total cash equivalents | 64,767 | - | - | 64,767 | ||||||||||||
| Total cash and cash equivalents | 106,549 | - | - | 106,549 | ||||||||||||
| Short-term investments: | ||||||||||||||||
| State and municipal bonds | - | - | - | - | ||||||||||||
| Total short-term investments | - | - | - | - | ||||||||||||
| Total cash, cash equivalents | ||||||||||||||||
| and short-term investments | $ | 106,549 | $ | - | $ | - | $ | 106,549 | ||||||||
All cash equivalents had maturities of three months or less and short-term investments had maturities of 20 months or less, with an average effective maturity of 0.427 years as of December 30, 2011.
| 43 |
Note 3: Fair Value Measurements
The Company measures certain financial assets and liabilities at fair value on a recurring basis, including available-for-sale fixed income securities, trading fixed income and equity securities held in its deferred compensation plan and the liability associated with its deferred compensation plan. The fair value of these certain financial assets and liabilities was determined using the following inputs at December 30, 2011 (in thousands):
| Fair Value Measurements at Reporting Date Using | ||||||||||||||||
| Total | Quoted Prices in Active Markets for Identical Assets (Level 1) | Significant Other Observable Inputs (Level 2) | Significant Unobservable Inputs (Level 3) | |||||||||||||
| Assets | ||||||||||||||||
| Money market securities (1) | $ | 44,448 | $ | 44,448 | $ | - | $ | - | ||||||||
| Fixed income available for sale securities (2) | 25,260 | - | 25,260 | - | ||||||||||||
| Fixed income trading securities held in deferred compensation plan (3) | 7,456 | 7,456 | - | - | ||||||||||||
| Equity trading securities held in deferred compensation plan (3) | 12,626 | 12,626 | - | - | ||||||||||||
| Total | $ | 89,790 | $ | 64,530 | $ | 25,260 | $ | - | ||||||||
| Liabilities | ||||||||||||||||
| Deferred compensation plan (4) | 19,927 | 19,927 | - | - | ||||||||||||
| Total | $ | 19,927 | $ | 19,927 | $ | - | $ | - | ||||||||
| (1) | Included in cash and cash equivalents on the Company’s consolidated balance sheet. |
| (2) | Included in short-term investments on the Company’s consolidated balance sheet. |
| (3) | Included in other current assets and deferred compensation plan assets on the Company’s consolidated balance sheet. |
| (4) | Included in accrued liabilities and deferred compensation on the Company’s consolidated balance sheet. |
| 44 |
The fair value of these certain financial assets and liabilities was determined using the following inputs at December 31, 2010 (in thousands):
| Fair Value Measurements at Reporting Date Using | ||||||||||||||||
| Total | Quoted Prices in Active Markets for Identical Assets (Level 1) | Significant Other Observable Inputs (Level 2) | Significant Unobservable Inputs (Level 3) | |||||||||||||
| Assets | ||||||||||||||||
| Money market securities (1) | $ | 64,767 | $ | 64,767 | $ | - | $ | - | ||||||||
| Fixed income trading securities held in deferred compensation plan (2) | 4,956 | 4,956 | - | - | ||||||||||||
| Equity trading securities held in deferred compensation plan (2) | 10,423 | 10,423 | - | - | ||||||||||||
| Total | $ | 80,146 | $ | 80,146 | $ | - | $ | - | ||||||||
| Liabilities | ||||||||||||||||
| Deferred compensation plan (3) | 15,379 | 15,379 | - | - | ||||||||||||
| Total | $ | 15,379 | $ | 15,379 | $ | - | $ | - | ||||||||
| (1) | Included in cash and cash equivalents on the Company’s consolidated balance sheet. |
| (2) | Included in other current assets and deferred compensation plan assets on the Company’s consolidated balance sheet. |
| (3) | Included in accrued liabilities and deferred compensation on the Company’s consolidated balance sheet. |
Fixed income available-for-sale securities as of December 30, 2011 represent primarily obligations of state and local government agencies. Fixed income and equity trading securities represent mutual funds held in the Company’s deferred compensation plan. See Note 12 for additional information about the Company’s deferred compensation plan. There were no available-for-sale investments as of December 31, 2010.
At December 30, 2011 and December 31, 2010, the Company did not have any assets or liabilities valued using significant unobservable inputs.
The carrying amount of the Company’s accounts receivable, other assets and accounts payable approximates their fair values. There were no other-than-temporary impairments or credit losses related to available-for-sale securities during the years ended December 30, 2011, December 31, 2010 and January 1, 2010.
| 45 |
Note 4: Property, Equipment and Leasehold Improvements
| Fiscal Years | ||||||||
| (In thousands) | 2011 | 2010 | ||||||
| Property: | ||||||||
| Land | $ | 4,450 | $ | 4,450 | ||||
| Buildings | 33,983 | 33,727 | ||||||
| Construction in progress | 134 | 40 | ||||||
| Equipment: | ||||||||
| Machinery and equipment | 27,142 | 25,118 | ||||||
| Office furniture and equipment | 6,457 | 5,861 | ||||||
| Leasehold improvements | 9,498 | 9,233 | ||||||
| 81,664 | 78,429 | |||||||
| Less accumulated depreciation and amortization | 54,449 | 51,162 | ||||||
| Property, equipment and leasehold improvements, net | $ | 27,215 | $ | 27,267 | ||||
Depreciation and amortization for the fiscal years ended December 30, 2011, December 31, 2010 and January 1, 2010, was $4,411,000, $4,323,000 and $4,352,000, respectively.
Note 5: Goodwill
Below is a breakdown of goodwill, reported by segment as of December 30, 2011 and December 31, 2010:
| Environmental | Engineering and | |||||||||||
| (In thousands) | and health | other scientific | Total | |||||||||
| Goodwill | $ | 8,099 | $ | 508 | $ | 8,607 | ||||||
There were no changes in the carrying amount of goodwill for the fiscal years ended December 30, 2011, December 31, 2010 and January 1, 2010. There were no goodwill impairments or gains or losses on disposals for any portion of the Company’s reporting units during the fiscal year ended December 30, 2011.
| 46 |
Note 6: Inventory
At December 30, 2011 the Company had $739,000 and $849,000 of finished goods and raw materials inventory, respectively, included in prepaid expenses and other current assets on its consolidated balance sheet. At December 31, 2010, the Company had $1,630,000 and $1,225,000 of finished goods and raw materials inventory, respectively. Inventory is stated at the lower of cost or market using the specific identification method.
Note 7: Other Significant Balance Sheet Components
Account receivable, net
| Fiscal Years | ||||||||
| (In thousands) | 2011 | 2010 | ||||||
| Billed accounts receivable | $50,338 | $47,198 | ||||||
| Unbilled accounts receivable | 25,066 | 26,962 | ||||||
| Allowance for doubtful | ||||||||
| accounts | (2,339 | ) | (2,126 | ) | ||||
| Total accounts receivable, net | $ | 73,065 | $ | 72,034 | ||||
Accounts payable and accrued liabilities
| Fiscal Years | ||||||||
| (In thousands) | 2011 | 2010 | ||||||
| Accounts payable | $ | 4,215 | $ | 6,966 | ||||
| Accrued liabilities | 2,523 | 2,749 | ||||||
| Total accounts payable and other accrued liabilities | $ | 6,738 | $ | 9,715 | ||||
Accrued payroll and employee benefits
| Fiscal Years | ||||||||
| (In thousands) | 2011 | 2010 | ||||||
| Accrued bonuses payable | $ | 29,736 | $ | 25,485 | ||||
| Accrued 401(k) contributions | 6,175 | 5,753 | ||||||
| Accrued vacation | 7,267 | 6,586 | ||||||
| Other accrued payroll and employee benefits | 4,911 | 4,064 | ||||||
| Total accrued payroll and employee benefits | $ | 48,089 | $ | 41,888 | ||||
Other accrued payroll and employee benefits consist primarily of accrued wages, payroll taxes and disability insurance programs.\
Note 8: Income Taxes
Income before income taxes includes income from foreign operations of $2,361,000, $2,995,000 and $1,269,000 for fiscal 2011, 2010 and 2009, respectively.
Total income tax expense for the fiscal years ended December 30, 2011, December 31, 2010 and January 1, 2010 consisted of the following:
| Fiscal Years | ||||||||||||
| (In thousands) | 2011 | 2010 | 2009 | |||||||||
| Current | ||||||||||||
| Federal | $ | 20,544 | $ | 17,383 | $ | 14,932 | ||||||
| Foreign | 656 | 758 | 320 | |||||||||
| State | 4,587 | 4,275 | 3,742 | |||||||||
| 25,787 | 22,416 | 18,994 | ||||||||||
| Deferred | ||||||||||||
| Federal | (3,013 | ) | (2,474 | ) | (3,353 | ) | ||||||
| State | (650 | ) | (755 | ) | (747 | ) | ||||||
| (3,663 | ) | (3,229 | ) | (4,100 | ) | |||||||
| Total | $ | 22,124 | $ | 19,187 | $ | 14,894 | ||||||
The Company’s effective tax rate differs from the statutory federal tax rate of 35% as shown in the following schedule:
| Fiscal Years | ||||||||||||
| (In thousands) | 2011 | 2010 | 2009 | |||||||||
| Tax at federal statutory rate | $ | 19,187 | $ | 16,347 | $ | 12,957 | ||||||
| State taxes, net of federal | ||||||||||||
| benefit | 2,568 | 2,361 | 1,881 | |||||||||
| Tax exempt interest income | (74 | ) | (62 | ) | (210 | ) | ||||||
| Non-deductible expenses | 240 | 205 | 170 | |||||||||
| Non-deductible stock-based compensation | 12 | 34 | 54 | |||||||||
| Other | 191 | 302 | 42 | |||||||||
| Tax expense | $ | 22,124 | $ | 19,187 | $ | 14,894 | ||||||
| Effective tax rate | 40.4 | % | 41.1 | % | 40.2 | % | ||||||
| 47 |
The tax effects of temporary differences that give rise to significant portions of the deferred tax assets and deferred tax liabilities at December 30, 2011 and December 31, 2010 are presented in the following schedule:
| Fiscal Years | ||||||||
| (In thousands) | 2011 | 2010 | ||||||
| Deferred tax assets: | ||||||||
| Accrued liabilities and allowances | $ | 13,288 | $ | 11,786 | ||||
| Deferred compensation | 13,916 | 11,448 | ||||||
| Total deferred tax assets | 27,204 | 23,234 | ||||||
| Deferred tax liabilities: | ||||||||
| State taxes | (1,095 | ) | (1,289 | ) | ||||
| Deductible goodwill | (2,724 | ) | (2,490 | ) | ||||
| Property, equipment and leasehold improvements | (866 | ) | (217 | ) | ||||
| Other | (534 | ) | (872 | ) | ||||
| Total deferred tax liabilities | (5,219 | ) | (4,868 | ) | ||||
| Net deferred tax assets | $ | 21,985 | $ | 18,366 | ||||
Management believes it is more likely than not that the results of future operations will generate sufficient taxable income to realize the net deferred tax assets.
The Company is entitled to a deduction for federal and state tax purposes with respect to employees’ stock award activity. The net deduction in taxes otherwise payable arising from that deduction has been credited to additional paid-in capital. For the fiscal years ended December 30, 2011, December 31, 2010 and January 1, 2010, the net deduction in tax payable arising from employees’ stock award activity was $2,378,000, $3,972,000 and $3,282,000 respectively.
The Company and its subsidiaries file income tax returns in the United States federal jurisdiction, California and various other state and foreign jurisdictions. The Company is no longer subject to United States federal income tax examination for years prior to 2008. The Company is no longer subject to California franchise tax examinations for years prior to 2007. With few exceptions, the Company is no longer subject to state and local or non-United States income tax examination by tax authorities for years prior to 2007.
At December 30, 2011, the Company had unrecognized tax benefits of $388,000, which primarily related to uncertainty regarding the sustainability of certain deductions taken on the Company’s federal and state income tax returns. A reconciliation of the beginning and ending amount of unrecognized tax benefits is as follows (in thousands):
| Balance at January 1, 2010 | 324,000 | |||
| Additions based on tax positionsrelated to the current year | 83,000 | |||
| Additions for tax positions of prior years | 3,000 | |||
| Reductions due to lapse of statute of limitations | (34,000 | ) | ||
| Settlements | - | |||
| Balance at December 31, 2010 | $ | 376,000 | ||
| Additions based on tax positions related to the current year | 83,000 | |||
| Additions for tax positions of prior years | - | |||
| Reductions due to lapse of statute of limitations | (55,000 | ) | ||
| Reductions due to change in accounting method | (16,000 | ) | ||
| Settlements | - | |||
| Balance at December 30, 2011 | $ | 388,000 |
Unrecognized tax benefits are included in other liabilities in the accompanying balance sheet. To the extent these unrecognized tax benefits are ultimately recognized, they will impact the effective tax rate in a future period. There are no uncertain tax positions whose resolution in the next 12 months is expected to materially affect operating results.
Deferred income taxes have not been provided on the undistributed earnings of foreign subsidiaries. The amount of such earnings at December 30, 2011 was $2,184,000. These earnings have been permanently reinvested and the Company does not plan to initiate any action that would precipitate the payment of income taxes thereon. It is not practicable to estimate the amount of additional tax that might be payable on the undistributed foreign earnings.
| 48 |
Note 9: Stockholders’ Equity
Preferred Stock
The Company has authorized 5,000,000 shares of undesignated preferred stock with a par value of $0.001 per share. The Company committed to stockholders in a letter dated May 23, 2006 to limit its use to 2,000,000 preferred shares, unless the approval of the Company’s stockholders is obtained subsequently, such as through a further amendment to the Company’s authorized capital stock. None of the preferred shares were issued and outstanding at December 30, 2011 and December 31, 2010.
Treasury Stock
Net losses related to the re-issuance of treasury stock to settle restricted stock unit and stock option awards of $9,349,000, $11,041,000 and $9,648,000 were recorded as a reduction to retained earnings during fiscal 2011, 2010 and 2009, respectively.
Repurchase of Common Stock
The Company repurchased 1,002,000 shares of its common stock for $40,573,000 during the fiscal year ended December 30, 2011. The Company repurchased 244,000 shares of its common stock for $6,899,000 during the fiscal year ended December 31, 2010. The Company repurchased 540,000 shares of its common stock for $13,121,000 during the fiscal year ended January 1, 2010. On May 25, 2011 the Board of Directors authorized an additional $35.0 million for the repurchase of Exponent’s common stock. As of December 30, 2011, the Company had remaining authorization under its stock repurchase plan of $9,406,000 to repurchase shares of common stock.
Note 10: Stock-Based Compensation
On May 29, 2008, the Company’s stockholders approved the 2008 Equity Incentive Plan and the 2008 Employee Stock Purchase Plan (“ESPP”). The 2008 Equity Incentive Plan and ESPP were previously adopted by the Company’s Board of Directors on April 8, 2008, subject to stockholder approval. Upon stockholder approval of the 2008 Equity Incentive Plan and ESPP each of the following plans were terminated: the 1999 Stock Option Plan, the Restricted Stock Award Plan, the 1998 Stock Option Plan and the Employee Stock Purchase Plan established in 1992.
The 2008 Equity Incentive Plan allows for the award of stock options, stock awards (including stock units, stock grants and stock appreciation rights or other similar equity awards) and cash awards to officers, employees, consultants and non-employee members of the Board of Directors. The total number of shares reserved for issuance under the 2008 Equity Incentive Plan is 1,869,720 shares of common stock, subject to adjustment resulting from a stock split or the payment of a stock dividend or any other increase or decrease in the number of issued shares of the Company’s stock effected without receipt of consideration by the Company. As of December 30, 2011, 905,442 shares were available for grant under the 2008 Equity Incentive Plan.
The ESPP allows for officers and employees to purchase common stock through payroll deductions of up to 15% of a participant’s eligible compensation. Shares of common stock are purchased under the ESPP at 95% of the fair market value of the Company’s common stock on each purchase date. Subject to adjustment resulting from a stock split or the payment of a stock dividend or any other increase or decrease in the number of issued shares of the Company’s stock effected without receipt of consideration by the Company, the total number of shares reserved for issuance under the ESPP was 200,000 shares of common stock. As of December 30, 2011, 101,838 shares were available for grant. Weighted average purchase prices for shares sold under all ESPP plans in fiscal 2011, 2010 and 2009 were $41.70, $30.72 and $25.46, respectively.
Restricted Stock Units
The Company grants restricted stock units to employees and outside directors. These restricted stock unit grants are designed to attract and retain employees, and to better align employee interests with those of the Company’s stockholders. For a select group of employees, up to 40% of their annual bonus is settled with fully vested restricted stock unit awards. Under these fully vested restricted stock unit awards, the holder of each award has the right to receive one share of the Company’s common stock for each fully vested restricted stock unit four years from the date of grant. Each individual who received a fully vested restricted stock unit award is granted a matching number of unvested restricted stock unit awards. These unvested restricted stock unit awards cliff vest four years from the date of grant, at which time the holder of each award will have the right to receive one share of the Company’s common stock for each restricted stock unit award, provided the holder of each award has met certain employment conditions. In the case of retirement at 59 ½ years or older, all unvested restricted stock unit awards will continue to vest provided the holder of each award does all consulting work through the Company and does not become an employee for a past or present client, beneficial party or competitor of the Company.
| 49 |
The value of these restricted stock unit awards is determined based on the market price of the Company’s common stock on the date of grant. The value of fully vested restricted stock unit awards issued is recorded as a reduction to accrued bonuses. The portion of bonus expense that the Company expects to settle with fully vested restricted stock unit awards is recorded as stock-based compensation during the period the bonus is earned. For the fiscal years ended December 30, 2011, December 31, 2010 and January 1, 2010, the Company recorded stock-based compensation expense associated with accrued bonus awards of $5,295,000, $4,533,000 and $3,797,000, respectively.
The Company recorded stock-based compensation expense associated with the unvested restricted stock unit awards of $4,464,000, $4,077,000 and $3,467,000 during the fiscal years ended December 30, 2011, December 31, 2010 and January 1, 2010, respectively.
The number of restricted stock unit awards outstanding as of December 30, 2011 is as follows(1):
| Number | Weighted- | |||||||
| of awards | average | |||||||
| outstanding | fair value | |||||||
| Balance as of January 2, 2009 | 489,100 | $ | 19.78 | |||||
| Awards granted | 337,867 | 24.14 | ||||||
| Awards vested | (284,423 | ) | 19.00 | |||||
| Awards cancelled | (8,307 | ) | 17.71 | |||||
| Balance as of January 1, 2010 | 534,237 | $ | 23.00 | |||||
| Awards granted | 265,894 | 28.78 | ||||||
| Awards vested | (241,916 | ) | 23.26 | |||||
| Awards cancelled | (2,833 | ) | 26.73 | |||||
| Balance as of December 31, 2010 | 555,382 | $ | 25.64 | |||||
| Awards granted | 249,997 | 38.59 | ||||||
| Awards vested | (260,064 | ) | 28.29 | |||||
| Awards cancelled | (2,981 | ) | 29.58 | |||||
| Balance as of December 30, 2011 | 542,334 | $ | 30.32 | |||||
(1) Does not include employee stock purchase or stock option plans.
Stock Options
The Company currently grants stock options under the 2008 Equity Incentive Plan. Options are granted for terms of ten years and generally vest ratably over a four-year period from the grant date. The Company grants options at exercise prices equal to the fair value of the Company’s common stock on the date of grant. During the fiscal years ended December 30, 2011, December 31, 2010 and January 1, 2010, the Company recorded stock-based compensation expense of $34,000, $31,000 and $56,000, respectively, associated with stock options granted prior to, but not yet vested as of December 30, 2005. During the fiscal years ended December 30, 2011, December 31, 2010 and January 1, 2010, the Company recorded stock-based compensation expense of $547,000, $616,000 and $611,000, respectively, associated with stock options granted after December 30, 2005.
| 50 |
Option activity is as follows(1):
| Weighted- | Aggregate | |||||||||||||||
| Weighted- | average | intrinsic | ||||||||||||||
| Number | average | remaining | value | |||||||||||||
| of shares | exercise | contractual | (in | |||||||||||||
| outstanding | price | term (years) | thousands) | |||||||||||||
| Balance as of January 2, 2009 | 1,188,299 | $ | 10.10 | |||||||||||||
| Options granted | 30,000 | 23.07 | ||||||||||||||
| Options cancelled | - | - | ||||||||||||||
| Options exercised | (401,190 | ) | 7.73 | |||||||||||||
| Balance as of January 1, 2010 | 817,109 | $ | 11.74 | |||||||||||||
| Options granted | 42,500 | 25.96 | ||||||||||||||
| Options cancelled | - | - | ||||||||||||||
| Options exercised | (348,469 | ) | 7.67 | |||||||||||||
| Balance as of December 31, 2010 | 511,140 | $ | 15.69 | |||||||||||||
| Options granted | 30,000 | 37.72 | ||||||||||||||
| Options cancelled | - | - | ||||||||||||||
| Options exercised | (105,744 | ) | 14.07 | |||||||||||||
| Balance as of December 30, 2011 | 435,396 | $ | 17.60 | 4.31 | $ | 12,353 | ||||||||||
| Vested and expected to vest as of December 30, 2011 | 426,418 | $ | 17.43 | 4.25 | $ | 12,172 | ||||||||||
| Exercisable at December 30, 2011 | 331,518 | $ | 14.31 | 3.36 | $ | 10,497 | ||||||||||
(1) Does not include restricted stock or employee stock purchase plans
The total intrinsic value of options exercised during the fiscal years ended December 30, 2011, December 31, 2010 and January 1, 2010 was $2,994,687, $8,086,064 and $7,673,830, respectively. The aggregate intrinsic value in the table above represents the total pre-tax intrinsic value (the difference between the Company’s closing stock price on the last trading day of the fiscal year ended December 30, 2011, and the exercise price, multiplied by the number of in-the-money options) that would have been received by the option holders had all option holders exercised their options on December 30, 2011. This amount changes based on the fair-value of the Company’s stock.
Information regarding options outstanding at December 30, 2011 is summarized below:
| Outstanding | Exercisable | |||||||||||||||||||
| Weighted- | Weighted- | Weighted | ||||||||||||||||||
| Number | average | Average | Number | average | ||||||||||||||||
| Range of | of | remaining | Exercise | of | exercise | |||||||||||||||
| exercise price | options | life in years | Price | shares | price | |||||||||||||||
| $5.89-7.02 | 104,396 | 1.01 | $ | 6.88 | 104,396 | $ | 6.88 | |||||||||||||
| $11.31-11.31 | 40,000 | 2.20 | $ | 11.31 | 40,000 | $ | 11.31 | |||||||||||||
| $12.02-15.65 | 91,000 | 3.40 | $ | 13.48 | 79,000 | $ | 13.64 | |||||||||||||
| $18.37-25.96 | 132,500 | 6.57 | $ | 22.42 | 85,622 | $ | 20.99 | |||||||||||||
| $31.01-$37.72 | 67,500 | 7.44 | $ | 33.99 | 22,500 | $ | 31.01 | |||||||||||||
| 435,396 | 4.31 | $ | 17.60 | 331,518 | $ | 14.31 | ||||||||||||||
| 51 |
The Company uses the Black-Scholes option-pricing model to determine the fair value of options granted. The determination of the fair value of stock-based payment awards on the date of grant using an option-pricing model is affected by the Company’s stock price as well as assumptions regarding a number of complex and subjective variables. These variables include expected stock price volatility over the term of the award, actual and projected employee stock option exercise behaviors, the risk-free interest rate and expected dividends.
The Company used historical exercise and post-vesting forfeiture and expiration data to estimate the expected term of options granted. The historical volatility of the Company’s common stock over a period of time equal to the expected term of the options granted was used to estimate expected volatility. The risk-free interest rate used in the option-pricing model was based on United States Treasury zero coupon issues with remaining terms similar to the expected term on the options. The Company does not anticipate paying any cash dividends in the foreseeable future and therefore used an expected dividend yield of zero in the option-pricing model. The Company is required to estimate forfeitures at the time of grant and revise those estimates in subsequent periods if actual forfeitures differ from those estimates. Historical data was used to estimate pre-vesting option forfeitures and stock-based compensation expense was recorded only for those awards that are expected to vest. All share based payment awards are recognized on a straight-line basis over the requisite service periods of the awards.
The assumptions used to value option grants for the fiscal years ended December 30, 2011, December 31, 2010 and January 1, 2010 are as follows:
| Stock Option Plan | ||||||||||||
| 2011 | 2010 | 2009 | ||||||||||
| Expected life (in years) | 6.5 | 6.6 | 6.6 | |||||||||
| Risk-free interest rate | 3.1 | % | 3.2 | % | 2.1 | % | ||||||
| Volatility | 39 | % | 40 | % | 40 | % | ||||||
| Dividend yield | 0 | % | 0 | % | 0 | % | ||||||
The weighted-average fair value of options granted during the fiscal years ended December 30, 2011, December 31, 2010 and January 1, 2010 were $16.51, $11.70 and $10.02, respectively.
The amount of stock-based compensation expense recognized in the Company’s consolidated statements of income for the fiscal years ended December 30, 2011, December 31, 2010 and January 1, 2010 is as follows:
| 2011 | 2010 | 2009 | ||||||||||
| (In thousands) | ||||||||||||
| Compensation and related expenses: | ||||||||||||
| Restricted stock units | $ | 9,402 | $ | 8,257 | $ | 6,993 | ||||||
| Stock option grants | 581 | 647 | 667 | |||||||||
| Sub-total | 9,983 | 8,904 | 7,660 | |||||||||
| General and administrative expenses: | ||||||||||||
| Restricted stock units | 357 | 353 | 271 | |||||||||
| Sub-total | 357 | 353 | 271 | |||||||||
| Total stock-based compensation expense | $ | 10,340 | $ | 9,257 | $ | 7,931 | ||||||
As of December 30, 2011, there was $4.2 million of unrecognized compensation cost, expected to be recognized over a weighted average period of 2.3 years, related to unvested restricted stock unit awards and $0.8 million of unrecognized compensation cost, expected to be recognized over a weighted average period of 2.4 years, related to unvested stock options. Total unrecognized compensation costs will be adjusted for future changes in estimated forfeitures.
| 52 |
A summary of the Company’s unvested stock options is as follows:
| Unvested | Weighted- | |||||||
| options | average | |||||||
| outstanding | fair value | |||||||
| Balance of unvested stock options as of January 2, 2009 | 224,000 | $ | 8.70 | |||||
| Options granted | 30,000 | 10.02 | ||||||
| Options vested | (90,250 | ) | 8.04 | |||||
| Options forfeited | - | - | ||||||
| Balance of unvested stock options as of January 1, 2010 | 163,750 | $ | 9.31 | |||||
| Options granted | 42,500 | 11.70 | ||||||
| Options vested | (70,250 | ) | 8.19 | |||||
| Options forfeited | - | - | ||||||
| Balance of unvested stock options as of December 31, 2010 | 136,000 | $ | 10.64 | |||||
| Options granted | 30,000 | 16.51 | ||||||
| Options vested | (62,122 | ) | 10.23 | |||||
| Options forfeited | - | - | ||||||
| Balance of unvested stock options as of December 30, 2011 | 103,878 | $ | 12.58 | |||||
Note 11: Retirement Plans
The Company provides a 401(k) plan for its employees whereby the Company contributes to each eligible employee’s 401(k) account 7% of the employee’s eligible base salary plus overtime. The employee does not need to make a contribution to the plan to be eligible for the Company’s 7% contribution. To be eligible under the plan, an employee must be at least 21 years of age and be either a full-time or part-time salaried employee. The 7% Company contribution will vest 20% per year for the first 5 years of employment and then immediately thereafter. The Company’s expenses related to this plan were $6,148,000, $5,598,000, and $5,744,000 in fiscal 2011, 2010, and 2009, respectively.
Note 12: Deferred Compensation Plan
The Company maintains a nonqualified deferred compensation plan for the benefit of a select group of highly compensated employees. Under this plan participants may elect to defer up to 100% of their compensation. Company assets that are earmarked to pay benefits under the plan are held in a rabbi trust and are subject to the claims of the Company’s creditors. As of December 30, 2011 and December 31, 2010, the invested amounts under the plan totaled $20,082,000 and $15,379,000, respectively. These assets are classified as trading securities and are recorded at fair market value with changes recorded as adjustments to other income and expense.
As of December 30, 2011 and December 31, 2010, vested amounts due under the plan totaled $19,927,000 and $15,379,000, respectively. Changes in the liability are recorded as adjustments to compensation expense. During the fiscal years 2011, 2010 and 2009, the Company recognized compensation expense of $(273,000), $1,925,000 and $1,891,000 respectively, as a result of changes in the market value of the trust assets with the same amount being recorded as other income, net.
Note 13: Commitments and Contingencies
The following is a summary of the future minimum payments, required under non-cancelable operating leases, with terms in excess of one year, as of December 30, 2011:
| (In thousands) | ||||
| Lease | ||||
| Fiscal year | commitments | |||
| 2012 | $ | 7,257 | ||
| 2013 | 5,304 | |||
| 2014 | 4,025 | |||
| 2015 | 2,699 | |||
| 2016 | 1,904 | |||
| Thereafter | 1,890 | |||
| $ | 23,079 | |||
Total rent expense from property leases in fiscal 2011, 2010, and 2009 was $5,180,000, $5,030,000 and $4,941,000, respectively. Total expense from other operating leases and commitments in fiscal 2011, 2010, and 2009 was $1,477,000, $1,400,000 and $1,549,000, respectively. The Company had $1,892,000 in outstanding purchase commitments as of December 30, 2011. These commitments are expected to be fulfilled by the end of fiscal 2012.
| 53 |
In July of 2008, the Company was served with a writ by a former client. The writ did not articulate a claim. The Company met with the former client in November of 2008 and again in January of 2009 and learned in those discussions of potential claims against the Company arising out of the testimony delivered by one of the Company’s employees. The former client claims that this testimony contributed to an adverse verdict against them. Given the uncertainty as to whether the claimant will choose to pursue one or more claims against the Company, and the nature of the potential claims against the Company, an estimated loss cannot be determined at this time. The Company believes it has a strong defense against all such potential claims and intends to vigorously defend itself. Further, the Company believes that some of the potential claims would be covered by insurance. Although the Company’s ultimate liability in this matter (if any) cannot be determined, based upon information currently available, the Company believes, after consultation with legal counsel, the ultimate resolution of these potential claims will not have a material adverse effect on its financial condition, results of operations or liquidity.
In addition to the above matters, the Company is a party to various other legal actions from time to time and may be contingently liable in connection with claims and contracts arising in the normal course of business, the outcome of which the Company believes, after consultation with legal counsel, will not have a material adverse effect on its financial condition, results of operations or liquidity. All legal costs associated with litigation are expensed as incurred.
Note 14: Other Income, Net
Interest and other income, net, consisted of the following:
| Fiscal Years | ||||||||||||
| (In thousands) | 2011 | 2010 | 2009 | |||||||||
| Interest income | $ | 237 | $ | 199 | $ | 617 | ||||||
| Interest expense | (1 | ) | (1 | ) | (3 | ) | ||||||
| Rental income | 1,310 | 1,390 | 1,405 | |||||||||
| Gain (loss) on deferred compensation investments | (273 | ) | 1,925 | 1,891 | ||||||||
| Gain (loss) on foreign exchange | 70 | (69 | ) | (298 | ) | |||||||
| Other | 16 | 23 | 147 | |||||||||
| Total | $ | 1,359 | $ | 3,467 | $ | 3,759 | ||||||
Note 15: Industry and Client Credit Risk
The Company serves clients in various segments of the economy. During fiscal 2011, 2010 and 2009 the Company provided services representing approximately 10%, 13% and 12%, respectively, of revenues to clients and to organizations and insurers acting on behalf of clients in the transportation industry. During fiscal 2011, 2010 and 2009 the Company derived approximately 15%, 15% and 12%, respectively, of revenues from U.S. federal, state and local government agencies and contractors.
No single customer comprised more than 10% of the Company’s revenues for the years ended December 30, 2011 and December 31, 2010. The Company derived 10% of revenues from agencies of the U.S. federal government for the year ended January 1, 2010. Agencies of the U.S. federal government comprised 12% of the Company’s accounts receivable at December 30, 2011. No single customer comprised more than 10% of the Company’s accounts receivable at December 31, 2010.
| 54 |
Note 16: Supplemental Cash Flow Information
The following is supplemental disclosure of cash flow information:
| Fiscal Years | ||||||||||||
| (In thousands) | 2011 | 2010 | 2009 | |||||||||
| Cash paid during the year: | ||||||||||||
| Income taxes | $ | 21,669 | $ | 19,465 | $ | 15,297 | ||||||
| Non-cash investing and financing activities: | ||||||||||||
| Capital leases for equipment | $ | 142 | $ | - | $ | - | ||||||
| Unrealized gain (loss) on investments | $ | 52 | $ | (31 | ) | $ | 100 | |||||
| Vested stock unit awards granted to settle accrued bonus | $ | 4,538 | $ | 3,566 | $ | 3,739 | ||||||
| Stock repurchases payable to broker | $ | - | $ | - | $ | 246 | ||||||
Note 17: Segment Reporting
The Company reports two operating segments based on two primary areas of service. One operating segment is a broad service group providing technical consulting in different practices primarily in the areas of engineering and technology development. The Company’s other operating segment provides services in the area of environmental, epidemiology and health risk analysis. This operating segment provides a wide range of consulting services relating to environmental hazards and risks and the impact on both human health and the environment.
Segment information is presented for selected data from the statements of income and statements of cash flows for fiscal years 2011, 2010, and 2009. Segment information for selected data from the balance sheets is presented for the fiscal years ended December 30, 2011 and December 31, 2010. The chief operating decision maker does not review total assets in his evaluation of segment performance and capital allocation.
| Revenues | ||||||||||||
| Fiscal Years | ||||||||||||
| (In thousands) | 2011 | 2010 | 2009 | |||||||||
| Engineering and other scientific | $ | 199,772 | $ | 184,146 | $ | 171,757 | ||||||
| Environmental and health | 72,674 | 64,607 | 56,125 | |||||||||
| Total revenues | $ | 272,446 | $ | 248,753 | $ | 227,882 | ||||||
| Operating Income | ||||||||||||
| Fiscal Years | ||||||||||||
| (In thousands) | 2011 | 2010 | 2009 | |||||||||
| Engineering and other scientific | $ | 57,779 | $ | 49,182 | $ | 41,407 | ||||||
| Environmental and health | 22,367 | 20,801 | 15,922 | |||||||||
| Total segment operating income | 80,146 | 69,983 | 57,329 | |||||||||
| Corporate operating expense | (26,686 | ) | (26,742 | ) | (24,067 | ) | ||||||
| Total operating income | $ | 53,460 | $ | 43,241 | $ | 33,262 | ||||||
| Capital Expenditures | ||||||||||||
| Fiscal Years | ||||||||||||
| (In thousands) | 2011 | 2010 | 2009 | |||||||||
| Engineering and other scientific | $ | 2,489 | $ | 1,706 | $ | 1,249 | ||||||
| Environmental and health | 313 | 209 | 161 | |||||||||
| Total segment capital expenditures | 2,802 | 1,915 | 1,410 | |||||||||
| Corporate capital expenditures | 1,033 | 560 | 607 | |||||||||
| Total capital expenditures | $ | 3,835 | $ | 2,475 | $ | 2,017 | ||||||
| Depreciation and Amortization | ||||||||||||
| Fiscal Years | ||||||||||||
| (In thousands) | 2011 | 2010 | 2009 | |||||||||
| Engineering and other scientific | $ | 2,700 | $ | 2,730 | $ | 2,820 | ||||||
| Environmental and health | 227 | 195 | 195 | |||||||||
| Total segment depreciation and amortization | 2,927 | 2,925 | 3,015 | |||||||||
| Corporate depreciation and amortization | 1,484 | 1,398 | 1,337 | |||||||||
| Total depreciation and amortization | $ | 4,411 | $ | 4,323 | $ | 4,352 | ||||||
| 55 |
Information regarding the Company’s operations in different geographical areas:
| Property, Equipment and Leasehold Improvements, net | ||||||||
| Fiscal Years | ||||||||
| (In thousands) | 2011 | 2010 | ||||||
| United States | $ | 26,953 | $ | 27,033 | ||||
| Foreign Countries | 262 | 234 | ||||||
| Total | $ | 27,215 | $ | 27,267 | ||||
| Revenues (1) | ||||||||||||
| Fiscal Years | ||||||||||||
| (In thousands) | 2011 | 2010 | 2009 | |||||||||
| United States | $ | 239,994 | $ | 220,527 | $ | 211,562 | ||||||
| Foreign Countries | 32,452 | 28,226 | 16,320 | |||||||||
| Total | $ | 272,446 | $ | 248,753 | $ | 227,882 | ||||||
(1) Geographic revenues are allocated based on the location of the client.
Note 18: Subsequent Event
On February 9, 2012, the Company’s Board of Directors authorized an additional $35 million for the repurchase of the Company’s common stock.
| 56 |
Comparative Quarterly Financial Data (unaudited)
Summarized quarterly financial data is as follows:
| Fiscal 2011 | April 1, | July 1, | September 30, | December 30, | ||||||||||||
| (In thousands, except per share data) | 2011 | 2011 | 2011 | 2011 | ||||||||||||
| Revenues before reimbursements | $ | 64,183 | $ | 60,573 | $ | 61,387 | $ | 60,524 | ||||||||
| Revenues | 73,473 | 65,106 | 65,951 | 67,916 | ||||||||||||
| Operating income | 12,366 | 13,377 | 16,524 | 11,193 | ||||||||||||
| Income before income taxes | 13,379 | 13,960 | 14,400 | 13,080 | ||||||||||||
| Net income | $ | 8,003 | $ | 8,217 | $ | 8,744 | $ | 7,731 | ||||||||
| Net income per share | ||||||||||||||||
| Basic | $ | 0.55 | $ | 0.57 | $ | 0.63 | $ | 0.56 | ||||||||
| Diluted | $ | 0.53 | $ | 0.55 | $ | 0.60 | $ | 0.54 | ||||||||
| Shares used in per share computations | ||||||||||||||||
| Basic | 14,532 | 14,402 | 13,975 | 13,775 | ||||||||||||
| Diluted | 15,140 | 14,971 | 14,554 | 14,322 | ||||||||||||
| Fiscal 2010 | April 2, | July 2, | October 1, | December 31, | ||||||||||||
| (In thousands, except per share data) | 2010 | 2010 | 2010 | 2010 | ||||||||||||
| Revenues before reimbursements | $ | 55,201 | $ | 55,128 | $ | 56,906 | $ | 54,625 | ||||||||
| Revenues | 59,406 | 60,439 | 66,306 | 62,602 | ||||||||||||
| Operating income | 9,507 | 12,775 | 11,570 | 9,389 | ||||||||||||
| Income before income taxes | 10,530 | 12,281 | 13,203 | 10,694 | ||||||||||||
| Net income | $ | 6,239 | $ | 7,280 | $ | 7,820 | $ | 6,182 | ||||||||
| Net income per share | ||||||||||||||||
| Basic | $ | 0.44 | $ | 0.51 | $ | 0.54 | $ | 0.43 | ||||||||
| Diluted | $ | 0.42 | $ | 0.48 | $ | 0.52 | $ | 0.41 | ||||||||
| Shares used in per share computations | ||||||||||||||||
| Basic | 14,212 | 14,377 | 14,385 | 14,443 | ||||||||||||
| Diluted | 14,940 | 15,054 | 15,053 | 15,094 | ||||||||||||
| 57 |
Schedule II
Valuation and Qualifying Accounts
| Additions |
Deletions (1) | |||||||||||||||||||
| Accounts | ||||||||||||||||||||
| Balance at | Provision | Provision | Written-off | Balance | ||||||||||||||||
| Beginning of | Charged to | Charged to | Net of | at End of | ||||||||||||||||
| (In thousands) | Year | Expense | Revenues | Recoveries | Year | |||||||||||||||
| Year Ended December 30, 2011 | ||||||||||||||||||||
| Allowance for bad debt | $ | 702 | $ | 709 | $ | - | $ | (592 | ) | $ | 819 | |||||||||
| Allowance for contract losses | $ | 1,424 | $ | - | $ | 1,278 | $ | (1,182 | ) | $ | 1,520 | |||||||||
| Year Ended December 31, 2010 | ||||||||||||||||||||
| Allowance for bad debt | $ | 788 | $ | 641 | $ | - | $ | (727 | ) | $ | 702 | |||||||||
| Allowance for contract losses | $ | 1,929 | $ | - | $ | 1,168 | $ | (1,673 | ) | $ | 1,424 | |||||||||
| Year Ended January 1, 2010 | ||||||||||||||||||||
| Allowance for bad debt | $ | 563 | $ | 1,319 | $ | - | $ | (1,094 | ) | $ | 788 | |||||||||
| Allowance for contract losses | $ | 1,886 | $ | - | $ | 2,599 | $ | (2,556 | ) | $ | 1,929 | |||||||||
(1) Balance includes currency translation adjustments.
Recoveries of accounts receivable previously written-off were $105,000, $213,000 and $131,000 for the years ended December 30, 2011, December 31, 2010, and January 1, 2010, respectively.
Schedules other than above have been omitted since they are either not required, not applicable, or the information is otherwise included in the Report.
| 58 |
SIGNATURES
Pursuant to the requirements of Section 13 or 15(d) of the Securities Exchange Act of 1934, the Registrant has duly caused this report to be signed on its behalf by the undersigned, thereunto duly authorized.
| EXPONENT, INC. | ||
| (Registrant) | ||
| Date: February 24, 2012 | /s/ Richard L. Schlenker, Jr. | |
| Richard L. Schlenker, Jr., Executive Vice President, | ||
| Chief Financial Officer and Corporate Secretary | ||
Pursuant to the requirements of the Securities Exchange Act of 1934, this report has been signed below by the following persons on behalf of the registrant and in the capacities and on the dates indicated:
| Signature | Title | Date | ||
| /s/ Paul R. Johnston | President, Chief Executive Officer and Director | February 24, 2012 | ||
| Paul R. Johnston, Ph.D. | ||||
| /s/ Richard L. Schlenker, Jr. | Executive Vice President, Chief Financial Officer and | February 24, 2012 | ||
| Richard L. Schlenker, Jr. | Corporate Secretary (Principal Financial and Accounting Officer) | |||
| /s/ Michael R. Gaulke | Chairman of the Board of Directors | February 24, 2012 | ||
| Michael R. Gaulke | ||||
| /s/ Samuel H. Armacost | Director | February 24, 2012 | ||
| Samuel H. Armacost | ||||
| /s/ Mary B. Cranston | Director | February 24, 2012 | ||
| Mary B. Cranston | ||||
| /s/ Leslie G. Denend | Director | February 24, 2012 | ||
| Leslie G. Denend, Ph.D. | ||||
| /s/ Stephen C. Riggins | Director | February 24, 2012 | ||
| Stephen C. Riggins | ||||
| /s/ John B. Shoven | Director | February 24, 2012 | ||
| John B. Shoven, Ph.D. |
| 59 |
EXHIBIT INDEX
The following exhibits are filed as part of, or incorporated by reference into (as indicated parenthetically), the Annual Report on Form 10-K:
| 3.1(i) | Restated Certificate of Incorporation of the Company (incorporated by reference from the Company’s Registration Statement on Form S-1 as filed on June 25, 1990, registration number 33-35562). |
| 3.1(ii) | Certificate of Amendment of Restated Certificate of Incorporation of the Company (incorporated by reference from the Company’s Current Report on Form 8-K filed on May 24, 2006). |
| 3.2 | Amended and Restated Bylaws of the Company (incorporated by reference from the Company’s Current Report on Form 8-K as filed on February 14, 2012). |
| 4.1 | Specimen copy of Common Stock Certificate of the Company (incorporated by reference from the Company’s Registration Statement on Forms S-1 as filed on June 25, 1990, registration number 33-35562). |
| *10.6 | Exponent, Inc. 1998 Non Statutory Stock Option Plan dated October 24, 1998 (incorporated by reference from the Company’s Annual Report on Form 10-K for the fiscal year ended January 1, 1999). |
| 10.10 | Exponent, Inc. 1999 Stock Option Plan (incorporated by reference from the Company’s Annual Report on Form 10-K for the fiscal year ended December 31, 1999). |
| *10.11 | Exponent, Inc. 1999 Restricted Stock Plan (incorporated by reference from the Company’s Annual Report on Form 10-K for the fiscal year ended December 31, 1999). |
| 10.15 | Commercial Lease No. 03-53542 between the Company and the Arizona State Land Department, effective January 17, 1998 (incorporated by reference from the Company’s Annual Report on Form 10-K for the fiscal year ended January 3, 2003). |
| *10.17 | Exponent Nonqualified Deferred Compensation Plan (incorporated by reference from the Company’s Annual Report on Form 10-K for the fiscal year ended December 31, 2004). |
| *10.19 | Form of Indemnification Agreement entered into or proposed to be entered into between the Company and its officers and directors (incorporated by reference from the Company’s Quarterly Report on Form 10-Q for the fiscal quarter ended March 31, 2006). |
| 10.20 | Services Agreement between the Company and Exponent Engineering P.C. (incorporated by reference from the Company’s Quarterly Report on Form 10-Q for the fiscal period ended March 31, 2006). |
| *10.21 | Employment Offer Letter between the Company and Dr. Elizabeth Anderson (incorporated by reference from the Company’s Current Report on Form 8-K filed on August 9, 2006). |
| 10.24 | Amendment No. 1 to Exponent, Inc. 1998 Nonstatutory Stock Option Plan dated January 29, 2007 (incorporated by reference from the Company’s Annual Report on Form 10-K for the fiscal year ended December 29, 2006). |
| 10.25 | Amendment No. 1 to Exponent, Inc. 1999 Stock Option Plan dated January 29, 2007 (incorporated by reference from the Company’s Annual Report on Form 10-K for the fiscal year ended December 29, 2006). |
| 10.26 | Amendment No. 1 to Exponent, Inc. 1999 Restricted Stock Plan dated January 29, 2007 (incorporated by reference from the Company’s Annual Report on Form 10-K for the fiscal year ended December 29, 2006). |
| 10.28 | 2008 Employee Stock Purchase Plan (incorporated by reference from the Company’s Annual Report on Form 10-K for the fiscal year ended January 1, 2009). |
| 60 |
| *10.31 | Form of Restricted Stock Unit Employee Bonus Grant Agreement under the 2008 Equity Incentive Plan (incorporated by reference from the Company’s Annual Report on Form 10-K for the fiscal year ended January 1, 2009). |
| *10.32 | Form of Restricted Stock Unit Employee Matching Grant Agreement under the 2008 Equity Incentive Plan (incorporated by reference from the Company’s Annual Report on Form 10-K for the fiscal year ended January 1, 2009). |
| *10.33 | Form of Restricted Stock Unit Director Grant Agreement under the 2008 Equity Incentive Plan (incorporated by reference from the Company’s Annual Report on Form 10-K for the fiscal year ended January 1, 2009). |
| *10.34 | Amended and Restated Restricted Stock Unit Bonus Grant Agreement under the 1999 Restricted Stock Plan (incorporated by reference from the Company’s Annual Report on Form 10-K for the fiscal year ended January 1, 2009). |
| *10.35 | Amended and Restated Restricted Stock Unit Matching Grant Agreement under the 1999 Restricted Stock Plan (incorporated by reference from the Company’s Annual Report on Form 10-K for the fiscal year ended January 1, 2009). |
| *10.36 | Amended and Restated Restricted Stock Unit Director Grant Agreement under the 1999 Restricted Stock Plan (incorporated by reference from the Company’s Annual Report on Form 10-K for the fiscal year ended January 1, 2009). |
| *10.37 | Amended and Restated 2008 Equity Incentive Plan (incorporated by reference from the Company’s Quarterly Report on Form 10-Q for the fiscal period ended July 2, 2010). |
| 10.38 | Exponent, Inc. 401(k) Savings Plan, as amended and restated effective January 1, 2010 (incorporated by reference from the Company’s Annual Report on Form 10-K for the fiscal year ended December 31, 2010). |
| 10.39 | First Amendment to the Exponent, Inc. 401(k) Savings Plan (as amended and restated January 1, 2010) (incorporated by reference from the Company’s Quarterly Report on Form 10-Q for the fiscal period ended July 1, 2011). |
| 10.40 | Second Amendment to the Exponent, Inc. 401(k) Savings Plan (as amended and restated January 1, 2010). |
| *10.41 | Form of Stock Option Agreement under the 2008 Equity Incentive Plan. |
| 21.1 | List of subsidiaries. |
| 23.1 | Consent of Independent Registered Public Accounting Firm. |
| 31.1 | Certification of Chief Executive Officer pursuant to Rule 13a – 14(a) of the Securities Exchange Act of 1934. |
| 31.2 | Certification of Chief Financial Officer pursuant to Rule 13a – 14(a) of the Securities Exchange Act of 1934. |
| 32.1 | Certification of Chief Executive Officer pursuant to 18 U.S.C. Section 1350. |
| 32.2 | Certification of Chief Financial Officer pursuant to 18 U.S.C. Section 1350. |
| 101.INS | XBRL Instance Document |
| 101.SCH | XBRL Taxonomy Schema Document |
| 101.CAL | XBRL Taxonomy Calculation Linkbase Document |
| 101.LAB | XBRL Taxonomy Label Linkbase Document |
| 101.PRE | XBRL Taxonomy Presentation Linkbase Document |
| 101.DEF | XBRL Taxonomy Definition Linkbase Document |
* Indicates management compensatory plan, contract or arrangement
| 61 |