Attached files
Table of Contents
UNITED STATES
SECURITIES AND EXCHANGE COMMISSION
Washington, D.C. 20549
FORM 10-K
(Mark One)
| x | Annual Report Pursuant to Section 13 or 15(d) of the Securities Exchange Act of 1934 |
For the fiscal year ended December 31, 2011 December 31, 2011
OR
| ¨ | Transition Report Pursuant to Section 13 or 15(d) of the Securities Exchange Act of 1934 |
For the transition period from to
Commission File Number 001-34108
DIGIMARC CORPORATION
(Exact name of registrant as specified in its charter)
| Oregon | 26-2828185 | |
| (State or other jurisdiction of incorporation or organization) |
(I.R.S. Employer Identification No.) |
9405 SW Gemini Drive, Beaverton, Oregon 97008
(Address of principal executive offices) (Zip Code)
(503) 469-4800
(Registrant’s telephone number, including area code)
Securities registered pursuant to Section 12(b) of the Act:
| Title of Each Class |
Name of Each Exchange on Which Registered | |
| Common Stock, $0.001 Par Value Per Share | The NASDAQ Stock Market LLC |
Securities registered pursuant to Section 12(g) of the Act: NONE
Indicate by check mark if the registrant is a well-known seasoned issuer, as defined in Rule 405 of the Securities Act. Yes ¨ No x
Indicate by check mark if the registrant is not required to file reports pursuant to Section 13 or Section 15(d) of the Act. Yes ¨ No x
Indicate by check mark whether the registrant (1) has filed all reports required to be filed by Section 13 or 15(d) of the Securities Exchange Act of 1934 during the preceding 12 months (or for such shorter period that the registrant was required to file such reports), and (2) has been subject to such filing requirements for the past 90 days. Yes x No ¨
Indicate by check mark whether the registrant has submitted electronically and posted on its corporate web site, if any, every Interactive Data File required to be submitted and posted pursuant to Rule 405 of Regulation S-T during the preceding 12 months (or for such shorter period that the registrant was required to submit and post such files). Yes x No ¨
Indicate by check mark if disclosure of delinquent filers pursuant to Item 405 of Regulation S-K is not contained herein, and will not be contained, to the best of registrant’s knowledge, in definitive proxy or information statements incorporated by reference in Part III of this Form 10-K or any amendment to this Form 10-K. x
Indicate by check mark whether the registrant is a large accelerated filer, an accelerated filer, a non-accelerated filer, or a smaller reporting company. See the definitions of “large accelerated filer,” “accelerated filer,” and “smaller reporting company” in Rule 12b-2 of the Exchange Act.
| Large accelerated filer |
¨ | Accelerated filer | x | |||||
| Non-accelerated filer |
¨ | (Do not check if a smaller reporting company) | Smaller reporting company | ¨ |
Indicate by check mark whether the registrant is a shell company (as defined in Rule 12b-2 of the Exchange Act). Yes ¨ No x
The aggregate market value of common stock, par value $0.001 per share, held by non-affiliates of the registrant, based on the closing price of our common stock on The Nasdaq Global Market on the last business day of the registrant’s most recently completed fiscal second quarter (June 30, 2011), was approximately $236 million. Shares of common stock beneficially held by each officer and director have been excluded from this computation because these persons may be deemed to be affiliates. This determination of affiliate status is not necessarily a conclusive determination for any other purposes.
As of February 15, 2012, 7,099,338 shares of the registrant’s common stock were outstanding.
DOCUMENTS INCORPORATED BY REFERENCE
Portions of the registrant’s proxy statement pursuant to Regulation 14A (the “Proxy Statement”) for its 2012 annual meeting of shareholders are incorporated by reference into Items 10, 11, 12, 13 and 14 of Part III of this Annual Report on Form 10-K. The registrant intends to file the Proxy Statement not later than 120 days after the end of the fiscal year covered by this Annual Report on Form 10-K.
Table of Contents
| PART I |
| |||||
| Item 1. |
1 | |||||
| Item 1A. |
6 | |||||
| Item 1B. |
17 | |||||
| Item 2. |
17 | |||||
| Item 3. |
17 | |||||
| Item 4. |
17 | |||||
| PART II |
||||||
| Item 5. |
18 | |||||
| Item 6. |
21 | |||||
| Item 7. |
Management’s Discussion and Analysis of Financial Condition and Results of Operations |
24 | ||||
| Item 7A. |
44 | |||||
| Item 8. |
45 | |||||
| Item 9. |
Changes in and Disagreements with Accountants on Accounting and Financial Disclosure |
45 | ||||
| Item 9A. |
45 | |||||
| Item 9B. |
48 | |||||
| PART III |
||||||
| Item 10. |
49 | |||||
| Item 11. |
49 | |||||
| Item 12. |
Security Ownership of Certain Beneficial Owners and Management and Related Stockholder Matters |
49 | ||||
| Item 13. |
Certain Relationships and Related Transactions, and Director Independence |
49 | ||||
| Item 14. |
49 | |||||
| Item 15. |
50 | |||||
| 51 | ||||||
| E-1 | ||||||
Table of Contents
PART I
Unless the context otherwise requires, references in this Annual Report on Form 10-K to (i) “Digimarc,” “we,” “our” and “us” refer to Digimarc Corporation and (ii) “Old Digimarc” refers to the former Digimarc Corporation, which merged with and into a wholly owned subsidiary of L-1 Identity Solutions, Inc. (“L-1”) on August 13, 2008, and its consolidated subsidiaries (other than us).
All dollar amounts are in thousands, unless otherwise noted.
Digimarc Discover is a registered trademark of Digimarc Corporation. This Annual Report on Form 10-K also includes trademarks and trade names owned by other parties, and all other such trademarks and trade names mentioned in this Annual Report on Form 10-K are the property of their respective owners.
| ITEM 1: | BUSINESS |
The following discussion of Digimarc’s business contains forward-looking statements relating to future events or the future financial performance of Digimarc. Our actual results could differ materially from those anticipated in these forward-looking statements. Please see the discussion regarding forward-looking statements included in this Annual Report on Form 10-K in Item 7, Management’s Discussion and Analysis of Financial Condition and Results of Operations, under the caption “Forward-Looking Statements.”
The following discussion of our business should be read in conjunction with our consolidated financial statements and the related notes and other financial information appearing elsewhere in this Annual Report on Form 10-K.
Overview
Digimarc Corporation enables governments and enterprises around the world to give digital identities to media and objects that computers can sense and recognize and to which they can react. Our technology provides the means to infuse persistent digital information, perceptible only to computers and digital devices, into all forms of media content. The unique digital identifier placed in media generally persists with it regardless of the distribution path and whether it is copied, manipulated or converted to a different format, and does not affect the quality of the content or the enjoyment or other traditional uses of it. Our technology permits computers and digital devices to quickly identify relevant data from vast amounts of media content.
Our technologies, and those of our licensees, span a range of media content, enabling our customers and those of our partners to:
| • | Quickly and reliably identify and effectively manage music, movies, television programming, digital images, documents and other printed materials, especially in light of new non-linear distribution over the internet; |
| • | Deter counterfeiting of money, media and goods, and piracy of movies and music; |
| • | Support new digital media distribution models and methods to monetize media content; |
| • | Leverage the power of ubiquitous computing to instantly link consumers to a wealth of information and/or interactive experiences related to the media and objects they encounter each day; |
| • | Provide consumers with more choice and access to media content when, where and how they want it; |
| • | Enhance imagery and video by associating metadata or authenticating media content for government and commercial uses; and |
| • | Better secure identity documents to enhance national security and combat identity theft and fraud. |
1
Table of Contents
At the core of our intellectual property is a signal processing innovation known as “digital watermarking,” which allows imperceptible digital information to be embedded in all forms of digitally designed, produced or distributed media content and some physical objects, including photographs, movies, music, television, personal identification documents, financial instruments, industrial parts and product packages. The digital information can be detected and read by a wide range of computers, mobile phones and other digital devices.
Digital watermarking allows our customers to embed digital data into any media content that is digitally processed at some point during its lifecycle. The technology can be applied to printed materials, video, audio, and images. The inclusion of these digital signals enables a wide range of improvements in security and media management, and new business models for distribution and consumption of media content. Over the years our technology and intellectual property portfolios have grown to encompass many related technologies.
We provide solutions directly and through our licensees. Our proprietary technology has proven to be a powerful element of document security, giving rise to our long-term relationship with a consortium of central banks, which we refer to as the Central Banks, and many leading companies in the information technology industry. We and our licensees have successfully propagated digital watermarking in music, movies, television broadcasts, images and printed materials. Digital watermarks have been used in these applications to improve media rights and asset management, reduce piracy and counterfeiting losses, improve marketing programs, permit more efficient and effective distribution of valuable media content and enhance consumer entertainment and commercial experiences.
Banknote counterfeit deterrence was the first commercially successful use of our technologies in a large scale system to deter banknote counterfeiting. More recently, innovations based on Old Digimarc’s digital watermarking technology and experience have been leveraged to create new products to deter counterfeiting and tampering of driver licenses and other government-issued secure credentials. In parallel, Old Digimarc’s business partners, under patent or technology licenses from us, are delivering digital watermarking solutions to track and monitor the distribution of music, images, television and movies to consumers. In November of 2007, we announced a relationship with The Nielsen Company (US) LLC, or Nielsen, to license our patents in support of Nielsen’s industry leading television audience measurement.
On July 1, 2009, we commenced operation of two joint ventures with Nielsen. In connection with these joint ventures, we terminated our agreement with Nielsen, dated as of October 1, 2007, to enter into the joint venture agreements, and entered into a new patent license agreement. Under the first joint venture, TVaura LLC, Digimarc and Nielsen engage in the development of copyright filtering solutions, royalty/audit solutions for online video and audio rights organizations, guilds or other organizations involved in the reconciliation of royalties, residuals and other payments, and other related products. Under the second joint venture, TVaura Mobile LLC, Digimarc and Nielsen engage in the development of certain enhanced television offerings, and other related products. We provide technical and development services to TVaura LLC’s business. Digimarc and Nielsen each own approximately one half of each joint venture.
On April 30, 2010, following our Annual Meeting and approval by our shareholders, we changed our state of incorporation from Delaware to Oregon by means of a merger into a newly formed, wholly owned Oregon subsidiary.
On October 5, 2010, we entered into a patent licensing arrangement with IV Digital Multimedia Inventions, LLC, a Delaware limited liability company affiliated with Intellectual Ventures (“IV”), pursuant to which we granted an exclusive license to sublicense, subject to pre-existing encumbrances and a grant-back license, an aggregate of approximately 900 of the 1,200 patents and applications held by us noted below in the section titled “Technology and Intellectual Property.”
Financial information about geographic areas is included in Note 5 of our Notes to Financial Statements.
2
Table of Contents
Customers and Business Partners
Our revenues are generated through commercial and government applications of our technology. We generate a majority of our revenue from service and license fees paid to us under long-term contracts with the Central Banks, Nielsen, IV, Civolution, Verance Corporation (“Verance”) and our joint venture with Nielsen, TVaura LLC. The remainder of our revenues are generated primarily from patent and technology license fees and royalties paid by commercial business partners providing media identification and management solutions to movie studios and music labels, television broadcasters, creative professionals and other customers around the world. Patent and technology licensing is expected to continue to contribute most of the revenues from our non-government customers for the foreseeable future.
In 2011, revenues from government contracts accounted for approximately 28% of our total revenue, and revenues generated under our contract with the Central Banks accounted for substantially all of the revenue generated under our government contracts. Our government contracts typically span one or more base years and multiple option years. A government agency generally has the right to not exercise option periods.
Information about customers that accounted for 10% or more of revenue in the last three years is included in Note 5 of our Notes to Financial Statements.
Products and Services
We provide media identification and management solutions to commercial entities and government customers and license our technology and patent inventions to other solution providers. Our largest government customer is the Central Banks, with whom we have for the last 13 of years been developing, deploying, supporting and continuing to enhance a system to deter digital counterfeiting of currency using personal computers and digital reprographics.
We license primarily to commercial entities who use our technology and patented inventions in the media and entertainment industry. Commercial customers use a range of solutions from our business partners and us to identify, track, manage and protect content as it is distributed and consumed—either digitally or physically—and to enable new consumer applications to access networks and information from personal computers and mobile devices. Many movie studios, record labels, broadcasters, creative professionals and other customers rely on digital watermarking as a cost-effective means to:
| • | deter piracy and illegal use of movies, music and images; |
| • | protect entertainment content from copyright infringement; |
| • | track and monitor entertainment content for rights usage and licensing compliance; |
| • | monitor advertisements to verify ad placement and measure return on investment; |
| • | enhance information access, search and marketing capabilities related to media content; and |
| • | enable fair and legitimate use of content by consumers. |
Digital watermarks are easily embedded into all forms of media and are imperceptible to human senses, but quickly detected by computers, networks or other digital devices like smartphones. Unlike barcodes and tags, a watermarking solution does not require publishers to give up valuable space in magazines and newspapers; nor does it impact the overall layout or aesthetics of the publication. One of our more recent product offerings is the Digimarc Discover™ platform, which delivers a range of rich media experiences to its readers on their smartphones. Unique to the Digimarc Discover platform is its ability to use various content identification technologies as needed, including our patented digital watermarking technology.
3
Table of Contents
As part of our intellectual property marketing and patent monetization efforts, our key objectives in building relationships with potential customers and partners are to:
| • | make progress toward the realization of our vision and mission; |
| • | expand the scope of our license program; |
| • | more effectively monetize our patent assets; |
| • | encourage large scale adoption of our technologies by industry leaders; |
| • | improve our financial performance; |
| • | increase the scale and rate of growth of our software and services business; and |
| • | lay a foundation for continuing innovation. |
Current licensees include, but are not limited to, AlpVision SA, AquaMobile, Arbitron, Civolution, Digital Space, IV, Microsoft Corporation, Monic, The Nielsen Company, Signum Technologies, Verance and Verimatrix, Inc.
Technology and Intellectual Property
We develop intellectual property to differentiate our products and technology, mitigate infringement risks, and develop opportunities for licensing. Our broad patent portfolio covers a wide range of methods, applications, system architectures and business processes.
Most of our patents relate to various methods for embedding and decoding digital information in video, audio and images, whether the content is rendered in analog or digital formats. The digital information is generally embedded by making subtle modifications to the fundamental elements of the content itself, generally at a signal processing level. The changes necessary to embed this information are so subtle that they are generally not noticeable by people during normal use. Because the message is carried by the content itself, it is file-format independent. The embedded digital information generally survives most normal content transformations, including compression, edits, rotation, scaling, re-sampling, file-format transformations, copying, scanning and printing.
Our patent portfolio contains a number of innovations in digital watermarking, pattern recognition (sometimes referred to as “fingerprinting”), digital rights management and related fields. To protect our significant efforts in creating our technology, we have implemented an extensive intellectual property protection program that relies on a combination of patent, copyright, trademark and trade secret laws, and nondisclosure agreements and other contracts. As a result, we believe we have one of the world’s most extensive patent portfolios in digital watermarking and related fields, with approximately 1,200 granted and pending U.S. and foreign filings as of December 31, 2011. We continue to develop and broaden our portfolio of patented inventions in the fields of media identification and management technology and related applications and systems. We devote significant resources to developing and protecting our inventions and continuously seek to identify and evaluate potential licensees for our patents.
For a discussion of activities and costs related to our research and development in the last three years, please read “Research, development and engineering” under Part II, Item 7, “Management’s Discussion and Analysis of Financial Condition and Results of Operations.”
Markets
Our patented inventions are used in various media identification and management products and solutions supporting a variety of media objects, from movies and music to banknotes and secure credentials. Each media object enabled by our inventions creates the potential for several applications, such as:
| • | counterfeiting and piracy deterrence; |
| • | content identification and media management; |
4
Table of Contents
| • | authentication and monitoring; |
| • | linking to networks and providing access to information; and |
| • | enhanced services in support of mobile commerce. |
We believe the market for most of these applications is in the early stages of development and that existing solutions represent only a small portion of the potential market for our products, services and technology.
Competition
No single competitor or small number of competitors dominate our market. Our competitors vary depending on the application of our products and services. Our business partners and we generally compete with non-digital watermarking technologies for the security or marketing budgets of the producers and distributors of media objects, documents, products and advertising. These alternatives include, among other things, encryption-based security systems and technologies and solutions based on fingerprinting and pattern recognition. Our competitive position in digital watermarking application is strong because of our large, high quality, sophisticated patent portfolio and our substantial and growing amount of intellectual property in related media security and management innovations that span basic technologies, applications, system designs and business processes. Our intellectual property portfolio allows us to use proprietary technologies that are well regarded by our customers and partners and not available to our competitors. We compete based on the variety of features we offer and a traditional cost/benefit analysis against alternative technologies and solutions. We anticipate that our competitive position within some markets may be affected by factors such as reluctance to adopt new technologies and by changes in government regulations.
Backlog
Based on projected commitments we have for the periods under contract with our respective customers, we anticipate our current contracts as of December 31, 2011 will generate a minimum of $44 million in revenue through early 2015, the remaining term of these contracts. We expect approximately $28 million of this amount to be recognized as revenue during 2012. Some factors that lead to increased backlog include:
| • | contracts with new customers; |
| • | renewals with current customers; |
| • | add-on orders to current customers; and |
| • | contracts with longer contractual periods replacing contracts with shorter contractual periods. |
Some factors that lead to decreased backlog include:
| • | recognition of revenue associated with backlog currently in place; |
| • | contracts with shorter contractual periods replacing contracts with longer contractual periods; |
| • | modifications to existing contracts; and |
| • | contracts ending with existing customers. |
The mix of these factors, among others, dictates whether our backlog increases or decreases for any given period. Our backlog may not result in actual revenue in any particular period, because the orders, awards and contracts included in our backlog may be subject to modification, cancellation or suspension. We may not realize revenue on certain contracts, orders or awards included in our backlog or the timing of any realization may change.
5
Table of Contents
Employees
At December 31, 2011, we had 109 full-time employees, including 21 in sales, marketing, technical support and customer support; 66 in research, development and engineering, including intellectual property; and 22 in finance, administration, information technology and legal.
Our employees are not covered by any collective bargaining agreement, and we have never experienced a work stoppage. We believe that our relations with our employees are good.
Available Information
We make available free of charge through our website at www.digimarc.com our Annual Reports on Form 10-K, Quarterly Reports on Form 10-Q, Current Reports on Form 8-K, and amendments to these and other reports filed or furnished by us pursuant to Section 13(a) or 15(d) of the Securities Exchange Act of 1934 as soon as reasonably practicable after we file these materials with the Securities and Exchange Commission.
| ITEM 1A: RISK | FACTORS |
The following risks relate principally to our business and our status as a publicly-traded company. The risks and uncertainties described below are those risks of which we are aware and that we consider to be material to our business. If any of the following risks and uncertainties develops into actual events, our business, financial condition or results of operations could be materially adversely affected. In that case, the trading price of our common stock could decline. Our business, financial condition, results of operations and cash flows may be affected by a number of factors, including the factors set forth below.
RISKS RELATED TO OUR BUSINESS
(1) A small number of customers account for a substantial portion of our revenues, and the loss of any large contract could materially disrupt our business.
Historically, we have derived a significant portion of our revenues from a limited number of customers. Five customers, the Bank for International Settlements (acting on behalf of the Central Banks), Nielsen (including the joint ventures TVaura LLC and TVaura Mobile LLC), IV, Verance and Civolution represented approximately 94% of our revenue for the year ended December 31, 2011. Most of our revenues come from long-term contracts generally having terms of three to five years, with some licenses for the life of the associated patents, which could be up to 20 years. The agreements with some of these customers provide minimum or fixed payment obligations that expire within the next few years. Some contracts we enter into contain termination for convenience provisions. If we were to lose such a contract for any reason, or if revenues from variable payment obligations do not replace revenues under the existing fixed payment obligations, our financial results could be adversely affected.
We expect to continue to depend upon a small number of customers for a significant portion of our revenues for the foreseeable future. The loss of, or decline in, orders or backlog from one or more major customers could reduce our revenues and have a material adverse effect on our financial results.
(2) Although we achieved profitability in 2008, 2010 and 2011, we may not sustain profitability, particularly if we were to lose large contracts.
For the year ended December 31, 2011, we generated net income of $5.7 million, including a tax benefit of $2.6 million originating from the release of a valuation allowance against deferred tax assets, and resulted in increasing retained earnings to $7.1 million. Our profit was primarily due to licensing arrangements with IV that we entered into in the fourth quarter of 2010. On a quarterly basis, our operating results have been inconsistent.
Maintaining profitability in the future will depend upon a variety of factors, including our ability to maintain and obtain more significant partnerships like those we have with the Central Banks, Nielsen, IV, Civolution and Verance. Profitability will also depend on growth in revenues of our licensees and our efficiency in executing our
6
Table of Contents
business strategy and capitalizing on new opportunities. Various adverse developments, including the loss of large contracts, the expiration of fixed payment obligations on our contracts or cost overruns on our existing contracts, could have a negative effect on our revenues, margins and profitability.
(3) We may be adversely affected by variability of contracted arrangements.
We have frequently agreed to modify the terms of contractual arrangements with our customers, partners and licensees in response to changes in circumstances underlying the original contractual arrangements, and it is likely that we will do so in the future. As a result of this practice, the terms of our contractual arrangements with our customers, partners and licensees may vary over time and, depending on the particular modification, could have a material adverse effect on our financial position, results of operations or cash flows.
Some of our customers report royalties to us based on their revenues and their interpretation and allocation of contracted royalty rates. It is possible that the originally reported royalties could differ materially from those determined by an audit performed by us or a third party, or self-corrected by the customer.
(4) A significant portion of our future revenue is subject to commercial and government contracts and development of new markets that may involve unpredictable delays and other unexpected changes. Such volatility and uncertainty might limit our actual revenue in any given quarter or year.
We derive substantial portions of our revenue from commercial contracts tied to development schedules or development of new markets, which could shift for months, quarters or years as the needs of our customers and the markets in which they participate change. Government agencies and commercial customers also face budget pressures that introduce added uncertainty. Any shift in development schedules, the markets in which we or our licensees participate, or customer procurement processes, which are outside our control and may not be predictable, could result in delays in bookings forecasted for any particular period, could affect the predictability of our quarterly and annual results, and might limit our actual revenue in any given quarter or year, resulting in reduced and less predictable revenue and adversely affecting profitability.
The Company is also expanding into new markets, which involve inherent risk and unpredictability. Until recent years, the Company’s business was focused primarily on digital watermarking and related signal processing technology. The Company’s work in that field dated back to the early 1990s, so that by the time of the 1999 public offering of our predecessor company, we were an established competitor or participant in that area, and had a historical perspective that provided certain advantages. Those advantages continued to grow and serve us as our tenure in the field lengthened.
In recent years, particularly with the proliferation of smartphones and increased demands in the public sector for enhanced covert security options, we have investigated other technologies that may provide attractive future opportunities. These generally include technologies that leverage our strength in signal processing and support our vision for intuitive, pervasive computing. As we seek to expand outside our historical expertise, we lack the history and insight that benefited us in the watermarking field. We also lack the size and scale typical of contractors providing products and services to the federal government. While we were in the vanguard of commercial application of digital watermarking, we are not so uniquely poised in these other disciplines. Accordingly, it may be difficult for us to replicate our watermarking success in other technologies we might pursue.
(5) The market for our products is highly competitive, and alternative technologies or larger companies that compete with us may undermine, limit or eliminate the market for our products’ technologies, which would decrease our revenue and profits.
The markets in which we compete for business are intensely competitive and rapidly evolving. We expect competition to continue from both existing competitors and new market entrants. We face competition from other companies and from alternative technologies, including some of our customers and licensees. Because the market solutions based on our technologies are still in an early stage of development, we also may face competition from unexpected sources.
7
Table of Contents
Alternative technologies that may directly or indirectly compete with particular applications of our watermarking technologies include:
| • | Encryption—securing data during distribution using a secret code so it cannot be accessed except by authorized users; |
| • | Containers—inserting a media object in an encrypted wrapper, which prevents the media object from being duplicated, used for content distribution and transaction management; |
| • | Traditional anti-counterfeiting technologies—a number of solutions used by many governments (that compete for budgetary outlays) designed to deter counterfeiting, including optically sensitive ink, magnetic threads and other materials used in the printing of currencies; |
| • | Image recognition—one or several pre-specified or learned objects or object classes that can be recognized, usually together with their two-dimensional positions in the image or three-dimensional poses in the scene, such as Google Goggles, which provides a stand-alone program illustration of this function; |
| • | Radio frequency tags—embedding a chip that emits a signal when in close proximity with a receiver, used in some photo identification credentials, labels and tags; |
| • | Internet technologies—numerous existing and potential Internet access and search methods are competitive with Digimarc Mobile systems and the searching capabilities of Digimarc for Images; |
| • | Digital fingerprints and signatures—a metric, or metrics, computed solely from a source image or audio or video track, that can be used to identify an image or track, or authenticate the image or track; |
| • | Smart cards—badges and cards including a semiconductor memory and /or processor, used for authentication and related purposes; and |
| • | Bar codes or QR codes—data-carrying codes, typically visible in nature (but may be invisible if printed in ultraviolet- or infrared-responsive inks). |
In the competitive environments in which we operate, product generation, development and marketing processes relating to technology are uncertain and complex, and require accurate prediction of demand as well as successful management of various risks inherent in technology development. In light of these uncertainties, it is possible that our failure to successfully accommodate future changes in technologies related to our technology could have a long-term negative effect on our growth and results of operations.
New developments are expected to continue, and discoveries by others, including current and potential competitors, possibly could render our services and products noncompetitive. Moreover, because of rapid technological changes, we may be required to expend greater amounts of time and money than anticipated to develop new products and services, which in turn may require greater revenue streams from those products and services to cover developmental costs. Many of the companies that compete with us for some of our business, as well as other companies with whom we may compete in the future, are larger and may have greater technical, financial, marketing and political resources than we do. These resources could enable these companies to initiate severe price cuts or take other measures in an effort to gain market share or otherwise impede our progress. We may be unable to compete successfully against current or future participants in our market or against alternative technologies, and the competitive pressures we face could decrease our revenue and profits in the future.
(6) We may not realize all the expected benefits of our patent licensing arrangement with Intellectual Ventures.
In connection with our patent licensing arrangement with IV, we granted an exclusive license to sublicense a substantial portion of our patent assets to IV in exchange for various strategic and financial benefits. We may not realize all the expected benefits of our patent licensing arrangement with IV, including the expected full payment of the license issue fee, profit participation revenues, reduction of patent prosecution and maintenance costs, and full payment for the assistance we provide to IV with respect to the licensed patents. Any failure to realize these
8
Table of Contents
expected benefits could have a material adverse effect on our financial position, results of operations or cash flows. We have given IV control over both prosecution and enforcement of these assets. While IV can seek our assistance and has committed to pay for it, we cannot guarantee that they will seek our assistance in prosecution, nor enforce the patents to the extent we would.
(7) The joint ventures we entered into with Nielsen may not provide a return on investment on the initial and subsequent cash contributions, because of the risks attendant in any start-up company and competition that the proposed products and services of the joint ventures face.
TVaura LLC is a jointly owned company that we established with Nielsen to focus on the discovery, development and commercialization of copyright filtering solutions, royalty/audit systems or products for online video and audio rights organizations, guilds or other organizations involved in reconciliation of royalties, residuals and other payments, and other related products. TVaura Mobile LLC is a jointly owned company that we established with Nielsen to focus on the discovery, development and commercialization of certain enhanced television offerings and other related products, an area of burgeoning competition and increasing emphasis to Nielsen and Digimarc. As part of these joint ventures, we licensed to each of TVaura LLC and TVaura Mobile LLC all of our patents and technology not already subject to exclusive license grants to other licensees. The products that have been developed to date, and additional products contemplated by the joint ventures, which are still in the development stage, will require additional investment and oversight before they can be brought to market. If the joint ventures are successful in developing these products, the products will be new and untested, and they may not have a ready market. Starting in 2012 and for the foreseeable future, most of our investment will be in TVaura Mobile LLC.
We cannot predict how the market will react to our product offerings or any potential revenue that may be realized. We provided initial financial support to both joint ventures through October 2011, and additional investment will be required, regardless of whether the joint ventures are successful in their product development efforts. Our continued investment in these two joint ventures may result in neither product offerings nor a return on investment.
In connection with TVaura LLC and TVaura Mobile LLC, we may experience:
| • | difficulties in integrating our corporate culture and business objectives with those of Nielsen into the joint ventures; |
| • | diversion of our management’s time and attention from other business objectives; |
| • | higher than anticipated costs of integration, development and operations at the joint ventures; |
| • | difficulties in hiring or retaining key employees who are necessary to manage the joint ventures; or |
| • | difficulties in coordinating with an entity remote to our Beaverton, Oregon operations. |
Moreover, each of TVaura LLC and TVaura Mobile LLC is operated as an independent company and governed by a members’ committee. We and Nielsen can elect an equal number of representatives to serve on each members’ committee. Each joint venture develops products pursuant to an operating plan that is approved by the members’ committee. Since Nielsen has significant oversight and voting rights with respect to major business decisions of TVaura LLC and TVaura Mobile LLC, we do not have control over the joint ventures’ operations, including business decisions that may affect each joint venture’s profitability or success in meeting its objectives. For any of these reasons, or as a result of other factors, we may not realize the anticipated benefits of the joint ventures, and our participation in the joint ventures could adversely affect the results of our other business efforts.
(8) Disagreements between Nielsen and us regarding strategy and priorities of the joint ventures or shortage of additional funding for the joint ventures may impede the development of joint venture products, which could negatively affect the value of our investment in TVaura LLC and TVaura Mobile LLC.
Potential disagreements between Nielsen and us regarding a development decision or any other decision submitted to either joint venture’s members’ committee may cause significant delays in the development and
9
Table of Contents
commercialization of the particular joint venture’s products and technology and could negatively affect the value of our investment in the joint ventures. In addition, neither we nor Nielsen have any obligation to fund the joint ventures beyond the initial cash contributions provided in the joint venture agreements. If the joint ventures are unable to generate cash sufficient to develop and commercialize their products, and if additional funding is unavailable from us, Nielsen or third parties, we may not recognize the intended benefits of the joint ventures.
(9) Our future growth will depend to some extent on our successful implementation of our technology in solutions provided by third parties.
Our business and strategy rely substantially on deployment of our technology by our licensees and other third-party software developers and original equipment manufacturers. For example, one form of our technology is commonly deployed in image editing applications to permit users of these products to read data embedded in imagery, and thereby identify ownership and discern the identities of image owners. Another form of our technology is used in our anti-counterfeiting products. Our patented inventions are also being deployed as part of Digital Cinema systems to theatres around the world by companies that integrate technologies and subsystems. In addition, we rely on the ability of IV to license our patented inventions to third party licensees pursuant to the patent licensing arrangement we entered into with IV in October 2010. If third parties who include our technology in their products or otherwise license our intellectual property for use in their products cease to do so, or we fail to obtain other partners who will incorporate, embed, integrate or bundle our technology, or these partners are unsuccessful in their efforts, our efforts to expand deployment of our technology and increase licensing revenues would be adversely affected. Consequently, our ability to increase revenues would be adversely affected and we may suffer other adverse effects to our business. In addition, if our technology does not perform according to market expectations, our future sales would suffer as customers seek other providers.
(10) We depend on our management and key employees for our future success. If we are not able to retain, hire or integrate these employees, we may not be able to meet our commitments.
Our success depends to a significant extent on the performance and continued service of our management and our intellectual property team. The loss of the services of any of these employees could limit our growth or undermine customer relationships.
Due to the high level of technical expertise that our industry requires, our ability to successfully develop, market, sell, license and support our products, services, and intellectual property depends to a significant degree upon the continued contributions of our key personnel in engineering, sales, marketing, operations, legal and licensing, many of whom would be difficult to replace. We believe our future success will depend in large part upon our ability to retain our current key employees and our ability to attract, integrate and retain these personnel in the future. It may not be practical for us to match the compensation some of our employees could garner at other employment. In addition, we may encounter difficulties in hiring and retaining employees because of concerns related to our financial performance or operating results. These circumstances may have a negative effect on the market price of our common stock, and employees and prospective employees may factor in the uncertainties relating to our stability and the value of any equity-based incentives in their decisions regarding employment opportunities and decide to leave our employ. Moreover, our business is based in large part on patented technology, which is a unique and sophisticated signal processing technology. New employees require substantial training, involving significant resources and management attention. Competition for experienced personnel in our business can be intense. If we do not succeed in attracting new, qualified personnel or in integrating, retaining and motivating our current personnel, our growth and ability to deliver products and services that our customers require may be hampered. Although our employees generally have executed agreements containing non-competition clauses, we do not assure you that a court would enforce all of the terms of these clauses or the agreements generally. If these clauses were not fully enforced, our employees could be able to freely join our competitors. Although we generally attempt to control access to and distribution of our proprietary information by our employees, we do not assure you that the confidential nature of our proprietary information will be maintained in the course of such future employment. Any of these events could have a material adverse effect on our financial and business prospects.
10
Table of Contents
(11) If leading companies in our industry or standard-setting bodies or institutions downplay, minimize or reject the use of our technology, deployment may be slowed and we may be unable to achieve revenue growth, particularly in the media and entertainment sectors.
Many of our business endeavors, such as our licensing of intellectual property in support of audio and video copy-control applications, can be impeded or frustrated by larger, more influential companies or by standard-setting bodies or institutions downplaying, minimizing or rejecting the value or use of our technology. A negative position by these companies, bodies or institutions, if taken, may result in obstacles for us that we would be incapable of overcoming and may block or impede the adoption of digital watermarking, particularly in the media and entertainment market. In addition, potential customers in the media and entertainment industry may delay or reject initiatives that relate to deployment of our technology. Such a development would make the achievement of our business objectives in this market difficult or impossible.
(12) We are subject to risks encountered by companies developing and relying upon new technologies, products and services for substantial amounts of their growth or revenue.
Our business and prospects must be considered in light of the risks and uncertainties to which companies with new and rapidly evolving technology, products and services are exposed. These risks include the following:
| • | we may be unable to develop sources of new revenue or sustainable growth in revenue because our current and anticipated technologies, products and services may be inadequate or may be unable to attract or retain customers; |
| • | the intense competition and rapid technological change in our industry could adversely affect the market’s acceptance of our existing and new products and services; |
| • | we may be unable to develop and maintain new technologies upon which our existing and new products and services are dependent in order for our products and services to be sustainable and competitive and in order for us to expand our revenue and business; and |
| • | our licensees may not be able to successfully enter new markets or grow their businesses, limiting the royalties payable to us and our associated revenues and profits. |
Some of our key technology and solutions from our patent or technology licensees are in the development stage. Consequently, products incorporating our technology and solutions are undergoing technological change and are in the early stages of introduction in the marketplace. Delays in the adoption of these products or adverse competitive developments may result in delays in the development of new revenue sources or the growth in our revenue. In addition, we may be required to incur unanticipated expenditures if product changes or improvements are required. Moreover, new industry standards might redefine the products that we or our licensees are able to sell, especially if these products are only in the prototype stage of development. If product changes or improvements are required, success in marketing these products by us or our licensees and achieving profitability from these products could be delayed or halted. We also may be required to fund any changes or improvements out of operating income, which could adversely affect our profitability.
(13) We may not be able to adequately protect or enforce our intellectual property, and we may be subject to infringement claims and other litigation, which could adversely affect our business.
Our success depends in part on licensing our proprietary technology. To protect our intellectual property portfolio, we rely on a combination of patent, copyright, trademark and trade secret rights, confidentiality procedures and licensing arrangements. Unlicensed copying and use of our intellectual property or infringement of our intellectual property rights may result in the loss of revenue to us. Although we devote significant resources to developing and protecting our technologies, and periodically evaluate potential competitors of our technologies for infringement of our intellectual property rights, these infringements may nonetheless go undetected or may arise in the future.
11
Table of Contents
We face risks associated with our patent position, including the potential need from time to time to engage in significant legal proceedings to enforce our patents, the possibility that the validity or enforceability of our patents may be challenged, and the possibility that third parties will be able to compete against us without infringing our patents. Our recently resolved litigation with Verance, which brought a declaratory judgment action alleging that certain of our patents are invalid or not infringed, is an example. Budgetary concerns may cause us not to file or continue litigation against known infringers of our patent rights, or may cause us not to file for, or pursue, patent protection for all of our inventive technology, in jurisdictions where they may have value. Some governmental entities that might infringe our intellectual property rights may enjoy sovereign immunity from such claims. Failure to reliably enforce our patent rights against infringers may make licensing more difficult. If we fail to protect our intellectual property rights and proprietary technology adequately, if there are changes in applicable laws that are adverse to our interests, or if we become involved in litigation relating to our intellectual property rights and proprietary technology or relating to the intellectual property rights of others, our business could be seriously harmed because the value ascribed to our intellectual property could diminish and result in a lower stock price, or we may incur significant costs in bringing legal proceedings against third parties who are infringing our patents.
Effective protection of intellectual property rights may be unavailable or limited. Patent protection throughout the world is generally established on a country-by-country basis. We have applied for patent protection in the U.S. and in various other countries. We do not assure you, however, that pending patents will be issued or that issued patents will be valid or enforceable. Failure to obtain these patents or failure to enforce those patents that are obtained may result in a loss of revenue to us. We do not assure you that the protection of our proprietary rights will be adequate or that our competitors will not independently develop similar technologies, duplicate our services or design around any of our patents or other intellectual property rights.
In the ordinary course of building strategic business relationships with potential partners we may encounter companies that we believe are infringing on our patent portfolio. When we encounter these companies we believe are infringing, we try to negotiate a license to our patents. If we are unable to negotiate a license and continue to believe they are infringing on our patents, we may file a lawsuit and incur legal fees in the process.
Patents have finite lives, and our ability to continue to commercially exploit our patents is limited to the term of the patents. Our earliest patents will begin expiring in July 2012. The size and strength of our portfolio depends on the number of patents that have been granted, offset by the number of patents that expire, in any given year. We continue to grow our patent portfolio, but we cannot assure that we will be able to exploit newer patents to the extent that we have our earlier patents.
We are the exclusive licensee under some third-party patents, and may need the assistance of these parties if we choose to enforce any of these patent rights. The cooperation of these third parties cannot be assured. Although we rely on some of these technologies for our products or for our licenses to third parties to date, the licensed patents have not been material to our operations.
As more companies engage in business activities relating to digital watermarking, and develop corresponding intellectual property rights, it is increasingly likely that claims may arise which assert that some of our products or services infringe upon other parties’ intellectual property rights. These claims could subject us to costly litigation and divert management resources. These claims may require us to pay significant damages, cease production of infringing products, terminate our use of infringing technology or develop non-infringing technologies. In these circumstances, continued use of our technology may require that we acquire licenses to the intellectual property that is the subject of the alleged infringement, and we might not be able to obtain these licenses on commercially reasonable terms or at all. Our use of protected technology may result in liability that threatens our continuing operation.
Some of our contracts include indemnity and similar provisions regarding our non-infringement of third-party intellectual property rights. As deployment of our technology increases, and more companies enter our markets, the likelihood of a third party lawsuit resulting from these provisions increases. If an infringement arose in a context
12
Table of Contents
governed by such a contract, we may have to refund to our customer amounts already paid to us or pay significant damages, or we may be sued by the party whose intellectual property has allegedly been infringed upon.
As part of our confidentiality procedures, we generally enter into non-disclosure agreements with our employees, directors, consultants and corporate partners, and attempt to control access to and distribution of our technology, solutions, documentation and other proprietary information. Despite these procedures, third parties could copy or otherwise obtain and make unauthorized use of our technology, solutions or other proprietary information or independently develop similar technologies, solutions or information. The steps that we have taken to prevent misappropriation of our solutions, technology or other proprietary information may not prevent their misappropriation.
(14) If our revenue models and pricing structures relating to products and services that are under development do not gain market acceptance, the products and services may fail to attract or retain customers and we may not be able to generate new or sustain existing revenue.
Some of our business involves embedding digital watermarks in traditional and digital media, including secure documents, audio, video and imagery, and licensing our intellectual property. Our revenue stream is based primarily on a combination of development, consulting, subscription and license fees from a variety of media identification and management applications. We also launched our Digimarc Discover initiative during 2011, which incorporates new business and pricing models for licensing access to our online services portal and value added service providers. We have not fully developed revenue models for some of these future digital watermarking applications and licensing endeavors. Because some of our products and services are not yet well-established in the marketplace, and because some of these products and services will not directly displace existing solutions, we cannot be certain that the pricing structure for these products and services will gain market acceptance or be sustainable over time or that the marketing for these products and services will be effective.
(15) If we are unable to respond to regulatory or industry standards effectively, or if we are unable to develop and integrate new technologies effectively, our growth and the development of our products and services could be delayed or limited.
Our future success will depend in part on our ability to enhance and improve the responsiveness, functionality and features of our products and services, and those of our business partners, in accordance with regulatory or industry standards. Our ability to remain competitive will depend in part on our ability to influence and respond to emerging industry and governmental standards in a timely and cost-effective manner. If we are unable to influence these or other standards or respond to these standards effectively, our growth and the development of various products and services could be delayed or limited.
Our market is characterized by new and evolving technologies. The success of our business will depend on our ability to develop and integrate new technologies effectively and address the increasingly sophisticated technological needs of our customers in a timely and cost-effective manner. Our ability to remain competitive will depend in part on our ability to:
| • | enhance and improve the responsiveness, functionality and other features of the products and services we offer or plan to offer; |
| • | continue to develop our technical expertise; and |
| • | develop and introduce new services, applications and technologies to meet changing customer needs and preferences and to integrate new technologies. |
We do not assure you that we will be successful in responding to these technological and industry challenges in a timely and cost-effective manner. If we are unable to develop or integrate new technologies effectively or respond to these changing needs, our margins could decrease, and our release of new products and services and the deployment of our watermarking technology could be adversely affected.
13
Table of Contents
(16) We may need to retain additional employees or contract labor in the future in order to take advantage of new business opportunities arising from increased demand, which could increase costs and impede our ability to achieve or sustain profitability in the short term.
We have staffed our company with the intent of achieving and sustaining profitability. Our current staffing levels could affect our ability to respond to increased demand for our services. In addition, to meet any increased demand and take advantage of new business opportunities in the future, we may need to increase our workforce through additional employees or contract labor. Although we believe that increasing our workforce would potentially support anticipated growth and profitability, it would increase our costs. If we experience such an increase in costs, we may not succeed in achieving or sustaining profitability in the short term.
(17) An increase in our operations outside of the U.S. subjects us to risks additional to those to which we are exposed in our domestic operations.
We believe that revenue from sales of products and services to commercial, governmental and other customers outside the U.S. could represent a growing percentage of our total revenue in the future. International sales and services are subject to a number of risks that can adversely affect our sales of products and services to customers outside of the U.S., including the following:
| • | changes in foreign government regulations and security requirements; |
| • | export license requirements, tariffs and taxes; |
| • | trade barriers; |
| • | difficulty in protecting intellectual property; |
| • | difficulty in collecting accounts receivable; |
| • | currency fluctuations; |
| • | longer payment cycles than those for customers in the U.S.; |
| • | difficulty in managing foreign operations; and |
| • | political and economic instability. |
We do not have an extensive operational infrastructure for international business. We generally depend on local or international business partners and subcontractors for performance of substantial portions of our business. These factors may result in greater risk of performance problems or of reduced profitability with respect to our international programs in these markets. In addition, if foreign customers, in particular foreign government authorities, terminate or delay the implementation of our products and services, it may be difficult for us to recover our potential losses.
(18) The terms and conditions of our contracts could subject us to damages, losses and other expenses if we fail to meet delivery and other performance requirements.
Our service contracts typically include provisions imposing:
| • | development, delivery and installation schedules and milestones; |
| • | customer acceptance and testing requirements; and |
| • | other performance requirements. |
To the extent these provisions involve performance over extended periods of time, risks of noncompliance may increase. From time to time we have experienced delays in system implementation, timely acceptance of programs, concerns regarding program performance and other contractual disputes. If we fail to meet contractual milestones or other performance requirements as promised, or to successfully resolve customer disputes, we
14
Table of Contents
could incur liability for damages, as well as increased costs, lower margins, or compensatory obligations in addition to other losses, such as harm to our reputation. Any unexpected increases in costs to meet our contractual obligations or any other requirements necessary to address claims and damages with regard to our customer contracts could have a material adverse effect on our business and financial results.
(19) Products deploying our technology could have unknown defects or errors, which may give rise to claims against us, divert application of our resources from other purposes or increase our project implementation and support costs.
Products and services as complex as those we offer or develop may contain undetected defects or errors. Furthermore, we often provide complex implementation, integration, customization, consulting and other technical services in connection with the implementation and ongoing maintenance of our products. Despite testing, defects or errors in our products and services may occur, which could result in delays in the development and implementation of products and systems, inability to meet customer requirements or expectations in a timely manner, loss of revenue or market share, increased implementation and support costs, failure to achieve market acceptance, diversion of development resources, injury to our reputation, increased insurance costs, increased service and warranty costs and warranty or breach of contract claims. Although we attempt to reduce the risk of losses resulting from warranty or breach of contract claims through warranty disclaimers and liability limitation clauses in our sales agreements when we can, these contractual provisions are sometimes not included and may not be enforceable in every instance. If a court refuses to enforce the liability limiting provisions of our contracts for any reason, or if liabilities arise that were not contractually limited or adequately covered by insurance, the expense associated with defending these actions or paying the resultant claims could be significant.
(20) The security systems used in our product and service offerings may be circumvented or sabotaged by third parties, which could result in the disclosure of sensitive information or private personal information or cause other business interruptions that could damage our reputation and disrupt our business.
Our business relies on computers and other information technologies, both internal and at customer locations. The protective measures that we use may not prevent security breaches, and failure to prevent security breaches may disrupt our business, damage our reputation, and expose us to litigation and liability. A party who is able to circumvent security measures could misappropriate sensitive or proprietary information or materials or cause interruptions or otherwise damage our products, services and reputation, and the property of our customers. If unintended parties obtain sensitive data and information, or create bugs or viruses or otherwise sabotage the functionality of our systems, we may receive negative publicity, incur liability to our customers or lose the confidence of our customers, any of which may cause the termination or modification of our contracts. Further, our insurance coverage may be insufficient to cover losses and liabilities that may result from these events.
In addition, we may be required to expend significant capital and other resources to protect ourselves against the threat of security breaches or to alleviate problems caused by these breaches. Any protection or remedial measures may not be available at a reasonable price or at all, or may not be entirely effective if commenced.
(21) We are periodically involved in the ordinary course of business in litigation, and an adverse resolution of such litigation may adversely affect our business, financial condition, results of operations, and cash flows.
From time to time, in our normal course of business, we are a party to various legal claims, actions and complaints. As part of our patent licensing program, we bring claims or counterclaims of patent infringement to enforce our patent rights. Given the uncertain nature of litigation generally, we are not able to estimate the amount or range of gain or loss that could result from an outcome of litigation. Litigation can be expensive, lengthy, and disruptive to normal business operations. The results of complex legal proceedings are often
15
Table of Contents
uncertain and difficult to predict. We could incur charges in excess of any currently established accruals and, to the extent available, excess liability insurance. An unfavorable outcome in any legal proceedings could have a material adverse effect on our business, financial condition, results of operations, and cash flows.
RISKS RELATED TO OUR CAPITAL STOCK
(22) Our common stock price may be volatile, and you could lose all or part of your investment in shares of our common stock.
The price of shares of our common stock may fluctuate as a result of changes in our operating performance or prospects and other factors. Some specific factors that may have a significant effect on the price of shares of our common stock include:
| • | the public’s reaction to our public disclosures; |
| • | actual or anticipated changes in our operating results or future prospects; |
| • | potential changes from originally reported royalties by customers resulting from an audit performed by us or a third party, or self-corrected by the customer; |
| • | strategic actions by us or our competitors, such as acquisitions or restructurings; |
| • | new laws or regulations or new interpretations of existing laws or regulations applicable to our business; |
| • | changes in accounting standards, policies, guidance, interpretations or principles applicable to us; |
| • | conditions of the industry as a result of changes in financial markets or general economic or political conditions; |
| • | the failure of securities analysts to cover our common stock in the future, or changes in financial estimates by analysts; |
| • | changes in analyst recommendations or earnings estimates regarding us, other comparable companies or the industry generally, and our ability to meet those estimates; |
| • | future issuances of our common stock or the perception that future sales could occur; and |
| • | volatility in the equity securities market. |
(23) Our common stock price may increase or decrease on no material news or developments.
As a thinly-traded microcap company, volatility in the equity securities market may disproportionately affect swings in our stock price, upward and downward. Over the past year, we have had significant fluctuations in our stock price and market capitalization on no material news or developments. We suspect that the effects of computerized trading also exacerbate fluctuations in our stock price.
(24) Our corporate governance documents, our rights agreement and Oregon law may delay or prevent an acquisition of us that shareholders may consider favorable, which could decrease the value of your shares.
Our articles of incorporation and bylaws and Oregon law contain provisions that could make it more difficult for a third party to acquire us without the consent of our board of directors. These provisions include supermajority voting requirements for shareholders to amend our organizational documents and limitations on actions by our shareholders by written consent. In addition, our board of directors has the right to issue preferred stock without shareholder approval, which could be used to dilute the stock ownership of a potential hostile acquirer. On July 31, 2008, our Board of Directors adopted a rights agreement pursuant to which one one-hundredth (1/100) of a preferred stock purchase right will be issued for each outstanding share of our common stock. In general terms, our rights agreement works by imposing a significant penalty upon any person or group that acquires 15% or more of our outstanding common stock without the approval of our Board of
16
Table of Contents
Directors. Oregon law also restricts the ability to vote shares of stock acquired in a transaction that causes the acquiring person to control at least one-fifth, one-third or one-half of the votes entitled to be cast in the election of directors. Shares acquired in a control share acquisition have no voting rights except as authorized by a vote of the shareholders. Although we believe these provisions protect our shareholders from coercive or otherwise unfair takeover tactics and thereby provide for an opportunity to receive a higher bid by requiring potential acquirers to negotiate with our board of directors, these provisions apply even if the offer may be considered beneficial by some shareholders.
| ITEM 1B: UNRESOLVED | STAFF COMMENTS |
None.
| ITEM 2: | PROPERTIES |
We lease our principal administrative, marketing, research, and intellectual property development facility, which is approximately 46,000 square feet in size and located in Beaverton, Oregon. In May 2010 we entered into an amendment with the landlord to extend the length of our facilities lease through August 2016. See Note 9 to our financial statements for further lease related disclosures.
| ITEM 3: | LEGAL PROCEEDINGS |
Verance Corporation, a Digimarc licensee, filed a declaratory judgment action against Digimarc in the United States District Court in Delaware on September 30, 2010, alleging the invalidity and non-infringement of 22 patents held by Digimarc. Verance Corp. v. Digimarc Corp., 1:10-cv-00831-UNA. The District Court dismissed Verance’s action. On September 9, 2011 Verance filed a Notice of Appeal with the Court of Appeals for the Federal Circuit. On December 6, 2010, Digimarc filed suit against Verance Corporation in the District of Oregon seeking payment for breach of contract by Verance related to Verance’s failure to make payments under the licensing agreement between Digimarc and Verance. Digimarc Corp. v. Verance Corp., CV’10-1489 JE.
In January 2012, Digimarc and Verance entered into mediation, sponsored by the Federal Circuit in Washington, D.C. The mediation resulted in a resolution, on January 31, 2012, of all disputes between the parties, including dismissal of all actions and appeals, a payment of $8 million by Verance for amounts due through the third quarter of 2011, a payment of approximately $852,500 for fourth quarter 2011 royalties, entry by the parties into a three year agreement (starting in the fourth quarter of 2011) with blended royalty rates for unified fields of use, and a grant to Verance of nine annual renewal options.
Digimarc was named as one of several defendants in a complaint filed by Walker Digital, LLC (“Walker”), in the U.S. District Court for the District of Delaware on April 22, 2011, case number 11-cv-00363-UNA, alleging patent infringement. The case was settled in early October 2011 with a negotiated patent license arrangement between TVaura Mobile LLC and Walker.
| ITEM 4: | MINE SAFETY DISCLOSURES |
Not applicable.
17
Table of Contents
PART II
| ITEM 5: | MARKET FOR REGISTRANT’S COMMON EQUITY, RELATED STOCKHOLDER MATTERS AND ISSUER PURCHASES OF EQUITY SECURTIES |
Our common stock began trading on the Nasdaq Stock Market LLC in October 2008 under the symbol “DMRC.” The closing price of our common stock on the Nasdaq Global Market was $29.20 on February 15, 2012. The following table lists the high and low sales prices of our common stock for the periods indicated, as reported by The Nasdaq Global Market.
| Year Ended December 31, | ||||||||||||||||
| 2011 | 2010 | |||||||||||||||
| High | Low | High | Low | |||||||||||||
| First quarter |
$ | 31.55 | $ | 24.03 | $ | 22.00 | $ | 14.75 | ||||||||
| Second quarter |
$ | 35.47 | $ | 24.58 | $ | 20.41 | $ | 16.41 | ||||||||
| Third quarter |
$ | 43.82 | $ | 25.38 | $ | 23.99 | $ | 18.07 | ||||||||
| Fourth quarter |
$ | 29.31 | $ | 21.00 | $ | 32.10 | $ | 22.56 | ||||||||
At February 15, 2012, we had 203 shareholders of record of our common stock, as shown in the records of our transfer agent. Since many holders hold shares in “street name,” we believe that there is a significantly larger number of beneficial owners of our common stock than the number of record holders.
We have never declared or paid cash dividends on our capital stock. We have repurchased a significant number of shares over the last few years.
Since the inception of our stock repurchase program in April 2009, through December 31, 2011, our Board of Directors has authorized the repurchase of $10.0 million of our common stock. As of December 31, 2011, we had repurchased 216,244 shares under this program at an aggregate purchase price of $4.7 million. Shares of our common stock may be purchased in the open market or through privately negotiated transactions, subject to market conditions. This repurchase program does not obligate us to acquire any specific number of shares or to acquire shares over any specified period of time.
On January 26, 2011, the Company repurchased 552,536 shares of its common stock from Koninklijke Philips Electronics, N.V., in a privately negotiated transaction. The shares were purchased for an aggregate price of approximately $14.9 million, including transaction fees.
In addition to the stock repurchase program described above, and the withholding (repurchase) of shares of common stock in connection with the vesting of restricted shares, described below, from time to time, we repurchase shares in connection with stock option exercises, to cover exercise price and taxes.
18
Table of Contents
The following table sets forth information regarding purchases of our equity securities during the three-month period ended December 31, 2011:
| Period |
(a) Total number of shares purchased (1) |
(b) Average price paid per share (1) |
(c) Total number of shares purchased as part of publicly announced plans or programs |
(d) Approximate dollar value) of shares that may yet be purchased under the plans or programs |
||||||||||||
| Month 1 |
||||||||||||||||
| October 1, 2011 to October 31, 2011 |
11,290 | $ | 26.79 | — | $ | 5.3 million | ||||||||||
| Month 2 |
||||||||||||||||
| November 1, 2011 to November 30, 2011 |
1,888 | $ | 27.49 | — | $ | 5.3 million | ||||||||||
| Month 3 |
||||||||||||||||
| December 1, 2011 to December 31, 2011 |
66 | $ | 23.89 | — | $ | 5.3 million | ||||||||||
|
|
|
|
|
|||||||||||||
| Total |
13,244 | $ | 26.87 | — | ||||||||||||
| (1) | Includes stock option shares and fully vested restricted stock shares of common stock withheld (purchased) by us in satisfaction of required withholding tax liability. |
19
Table of Contents
STOCK PERFORMANCE GRAPH
The following graph compares the performance of our common stock with the performance of (i) the Nasdaq U.S. Index and (ii) a peer group selected by us. The comparison assumes $100 was invested on October 17, 2008, the first day of trading in our common stock at the closing price on that date and in each of the two indices at the closing price on that date and assumes reinvestment of any dividends. We believe that the companies in the peer group are comparable to us in terms of line-of-business, market capitalization, revenues, and number of employees, and therefore, comprise an appropriate peer group for purposes of comparing stock performance. The comparisons in the graph are based on historical data and are not indicative of, nor intended to forecast, future performance of our common stock.
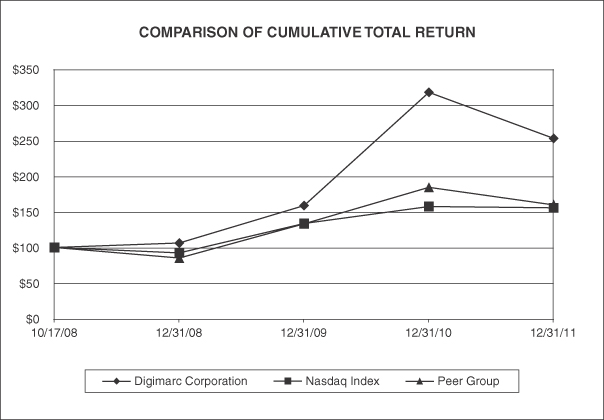
| Company Name / Index |
Base Period 10/17/08 |
INDEXED RETURNS Years Ending |
||||||||||||||||||
| 12/31/08 | 12/31/09 | 12/31/10 | 12/31/11 | |||||||||||||||||
| Digimarc Corporation |
100 | 106.03 | 158.62 | 317.57 | 252.80 | |||||||||||||||
| Nasdaq Index |
100 | 92.15 | 133.63 | 157.35 | 155.55 | |||||||||||||||
| Peer Group |
100 | 85.24 | 133.36 | 184.32 | 159.84 | |||||||||||||||
Companies included in the Peer Group index of the stock performance graph are as follows:
| 8X8 INC BITSTREAM DEMANDTEC INC DITECH NETWORKS INC DTS INC |
GLU MOBILE INC INSIGNIA SYSTEMS INC KEYNOTE SYSTEMS INC ORBCOMM INC |
PDF SOLUTIONS INC SELECTICA INC SUPPORT.COM INC VERSANT CORP WARWICK VALLEY TELEPHONE CO |
| (1) | The peer group does not include three companies from our 2010 peer group, DIVX Inc, Endwave Corp and Phoenix Technologies Ltd, since they were acquired in 2011. |
20
Table of Contents
| ITEM 6: | SELECTED FINANCIAL DATA |
The selected financial data set forth below should be read in conjunction with the financial statements and the notes to the financial statements and “Management’s Discussion and Analysis of Financial Condition and Results of Operations,” which are included elsewhere in this report.
On August 1, 2008, Old Digimarc (“predecessor”) spun off its wholly owned subsidiary, DMRC LLC, which was formed in anticipation of the spin-off and held all of the assets and liabilities of Old Digimarc’s Digital Watermarking Business. We changed our name back to Digimarc Corporation shortly after the spin-off.
Until August 1, 2008, we were a wholly owned subsidiary of DMRC LLC, which immediately prior to the spin-off was a wholly owned subsidiary of Old Digimarc. DMRC LLC was formed in Delaware on June 18, 2008, in anticipation of the spin-off of the Digital Watermarking Business. Prior to the spin-off, in a transaction which we refer to as the restructuring, Old Digimarc contributed all of the assets and liabilities related to its Digital Watermarking Business, together with all of Old Digimarc’s cash, including cash received upon the exercise of stock options, to DMRC LLC. The restructuring did not result in the loss of any significant Digital Watermarking Business customers or contracts.
Following the restructuring, all of the limited liability company interests of DMRC LLC were transferred to a newly created trust for the benefit of Old Digimarc record holders on the basis of one limited liability company interest of DMRC LLC for every three and one-half shares of Old Digimarc common stock held by the shareholder as of the spin-off record date and time. DMRC LLC then merged with and into DMRC Corporation, and each limited liability company interest of DMRC LLC was converted into one share of common stock of DMRC Corporation. After completion of the acquisition of Old Digimarc by L-1, DMRC Corporation changed its name to Digimarc Corporation. As a result, upon effectiveness of the Form 10 on October 16, 2008, each Old Digimarc record holder received one share of Digimarc common stock for every three and one-half shares of Old Digimarc common stock held by the shareholder as of the spin-off record date and time, and we became an independent, publicly-traded company owning and operating the Digital Watermarking Business.
The following tables set forth our selected financial information as of and for each of the years in the five-year period ended December 31, 2011, which has been derived from audited financial statements as of December 31, 2011, 2010, 2009, 2008, and 2007, and as of August 1, 2008 , and years ended December 31, 2011, 2010, 2009, and 2007; and for the periods August 2, 2008 through December 31, 2008 and January 1, 2008 through August 1, 2008. The selected predecessor financial information presented may not reflect the results of operations or financial condition that would have resulted had we been operating as an independent, publicly-traded company during the periods presented.
21
Table of Contents
Statement of Operations Data (1)
| Successor | Successor | Successor | Predecessor (2) | Total* | Predecessor (2) | |||||||||||||||||||||||||
| Year
Ended December 31, |
Year Ended December 31, |
|||||||||||||||||||||||||||||
| 2011 | 2010 | 2009 | Period August 2, 2008 through December 31, 2008 |
Period January 1, 2008 through August 1, 2008 |
2008 | 2007 | ||||||||||||||||||||||||
| Operating revenues |
$ | 36,039 | $ | 31,150 | $ | 19,071 | $ | 7,832 | $ | 11,950 | $ | 19,782 | $ | 13,025 | ||||||||||||||||
| Gross profit percentage |
81 | % | 78 | % | 67 | % | 70 | % | 69 | % | 70 | % | 69 | % | ||||||||||||||||
| Operating income (loss) |
$ | 6,389 | $ | 6,151 | $ | (2,565 | ) | $ | (357 | ) | $ | 836 | $ | 479 | $ | (1,310 | ) | |||||||||||||
| Net income (loss) |
$ | 5,656 | $ | 4,174 | $ | (2,757 | ) | $ | 76 | $ | 1,415 | $ | 1,491 | $ | 55 | |||||||||||||||
| Earnings (loss) per share: |
||||||||||||||||||||||||||||||
| Net income (loss) per share—basic |
$ | 0.84 | $ | 0.59 | $ | (0.39 | ) | $ | 0.01 | |||||||||||||||||||||
| Net income (loss) per share—diluted |
$ | 0.76 | $ | 0.55 | $ | (0.39 | ) | $ | 0.01 | |||||||||||||||||||||
| Weighted average shares outstanding—basic |
6,741 | 7,120 | 7,140 | 7,156 | ||||||||||||||||||||||||||
| Weighted average shares outstanding—diluted |
7,430 | 7,623 | 7,140 | 7,156 | ||||||||||||||||||||||||||
| Pro-forma earnings (loss) per share: |
||||||||||||||||||||||||||||||
| Net income (loss) per share—basic and diluted |
$ | 0.20 | $ | 0.21 | $ | 0.01 | ||||||||||||||||||||||||
| Weighted average shares outstanding—basic and diluted |
7,143 | 7,143 | 7,143 | |||||||||||||||||||||||||||
| * | Used for comparative purposes |
Balance Sheet Data (1)
| Successor | Successor | Successor | Successor | Predecessor (2) | Predecessor (2) | |||||||||||||||||||||
| As of December 31, | ||||||||||||||||||||||||||
| 2011 | 2010 | 2009 | 2008 | As of August 1, 2008 |
As
of December 31, 2007 |
|||||||||||||||||||||
| Cash, cash equivalents and short-term marketable securities |
$ | 25,663 | $ | 34,781 | $ | 42,786 | $ | 40,168 | $ | 54,749 | $ | 32,713 | ||||||||||||||
| Long-term marketable securities |
$ | 7,715 | $ | 11,163 | $ | — | $ | 5,744 | $ | — | $ | — | ||||||||||||||
| Total assets |
$ | 45,793 | $ | 55,765 | $ | 50,483 | $ | 52,441 | $ | 64,111 | $ | 38,451 | ||||||||||||||
| Long-term liabilities |
$ | 464 | $ | 525 | $ | 99 | $ | 257 | $ | 237 | $ | 215 | ||||||||||||||
| Redeemable preferred stock |
$ | 50 | $ | 50 | $ | 50 | $ | 50 | $ | — | $ | — | ||||||||||||||
22
Table of Contents
| (1) | The Old Digimarc/L-1 merger agreement provided that all cash and cash equivalents, short-term marketable securities and restricted cash, collectively referred to as the aggregate cash, of Old Digimarc was treated as cash retained by Digimarc in its carved-out financial statements. As a result, the presentation of the financial statements and operating data of Digimarc during the carve-out periods reflect the cash flow of Old Digimarc, including its Secure ID Business, combined with Digimarc. For 2007, the consolidated results of Old Digimarc reflected an operating loss of $1.6 million. Cash provided by operations and capital expenditures for the same period was $16.3 million and $17.7 million, respectively. |
| (2) | The predecessor financial statements include certain accounts of Old Digimarc and the assets, liabilities and results of operations of Old Digimarc’s Digital Watermarking Business that were separated, or “carved-out,” from Old Digimarc. The operating expenses included in the predecessor financial statements include proportional allocations of various shared services common costs of Old Digimarc because specific identification of the expenses was not practicable. The common costs include expenses from Old Digimarc related to various operating shared services cost centers, including: executive, finance and accounting, human resources, legal, marketing, intellectual property, facilities and information technology. Management believes that the assumptions underlying the predecessor financial statements are reasonable. |
The financial information in the predecessor financial statements does not include all of the expenses that would have been incurred had the predecessor been a separate, stand-alone public entity. As such, the predecessor financial information does not reflect the financial position, results of operations and cash flows of Digimarc’s current business had the predecessor operated as a separate, stand-alone public entity during the period presented in the predecessor financial statements. Additionally, the predecessor financial statements include proportional allocations of various shared services common costs of Old Digimarc because specific identification of these expenses was not practicable. Operating costs of Digimarc on a stand-alone basis have been higher than those allocated to the predecessor operations under the shared services methodology applied in the predecessor financial statements. Consequently, the financial position, results of operations and cash flows reflected in the predecessor financial statements may not be indicative of those that would have been achieved had the predecessor operated as a separate, stand-alone entity for the period reflected in the predecessor financial statements.
23
Table of Contents
| ITEM 7: | MANAGEMENT’S DISCUSSION AND ANALYSIS OF FINANCIAL CONDITION AND RESULTS OF OPERATIONS |
The following Management’s Discussion and Analysis of Financial Condition and Results of Operations contains forward-looking statements relating to future events or the future financial performance of Digimarc, which involve risks and uncertainties. Our actual results could differ materially from those anticipated in these forward-looking statements. Please see the discussion regarding forward-looking statements included at the end of this discussion, under the caption “Forward-Looking Statements” and Item 1A, “Risk Factors” for a discussion of some of the uncertainties, risks and assumptions associated with these statements.
The following discussion should be read in conjunction with our financial statements and the related notes and other financial information appearing elsewhere in this Annual Report on Form 10-K.
All dollar amounts are in thousands, unless otherwise noted.
Overview
Digimarc Corporation enables governments and enterprises around the world to give digital identities to media and objects that computers can sense and recognize and to which they can react. Our inventions provide the means to infuse persistent digital information, perceptible only to computers and digital devices, into all forms of media content. The unique digital identifier placed in media generally persists with it regardless of the distribution path and whether it is copied, manipulated or converted to a different format, and does not affect the quality of the content or the enjoyment or other traditional uses of it. Our technology permits computers and digital devices to quickly identify relevant data from vast amounts of media content.
Our growth strategy encompasses both our government and commercial businesses. We plan additional investment in research and development of a commercial mobile platform that boosts device specific capabilities.
To protect our significant efforts in creating our inventions, we have implemented an extensive intellectual property protection program that relies on a combination of patent, copyright, trademark and trade secret laws, and nondisclosure agreements and other contracts. We believe we have one of the world’s most extensive patent portfolios in the field of digital watermarking and related media enhancement innovations, with approximately 1,200 granted and pending U.S. and foreign filings as of December 31, 2011. Most of these patents are subject to an exclusive patent licensing arrangement as described further below.
As part of our intellectual property marketing initiative and patent monetization strategy, on October 5, 2010, we entered into a patent licensing arrangement with IV Digital Multimedia Inventions, LLC, a Delaware limited liability company affiliated with IV, pursuant to which we granted an exclusive license to sublicense, subject to pre-existing encumbrances and a grant-back license, an aggregate of approximately 900, of the 1,200, noted above, patents and applications held by us.
We believe recent intellectual property licensing initiatives we have commenced represent substantial opportunities for us to grow our license and subscription revenues, as well as our service revenues. These initiatives, however, may require additional investment in our intellectual property enforcement program and research and development.
Critical Accounting Policies and Estimates
The preparation of financial statements in accordance with accounting principles generally accepted in the U.S. (“U.S. GAAP”) requires us to make estimates and judgments that affect the reported amounts of assets, liabilities, revenue and expenses, and related disclosure of contingent assets and liabilities. On an on-going basis, we evaluate our estimates, including those related to bad debts, fixed assets, intangible assets, income taxes, long-term service contracts, marketable securities, and contingencies and litigation. We base our estimates on
24
Table of Contents
historical experience and on various other assumptions we believe to be reasonable in the circumstances. Actual results may differ from these estimates under different assumptions or conditions.
Some of our accounting policies require higher degrees of judgment than others in their application. These include revenue recognition on long-term service contracts, revenue recognition on license and subscription arrangements, impairments and estimation of useful lives of long-lived assets, contingencies and litigation, patent costs, stock- based compensation and income taxes (valuation allowance). We believe the following critical accounting policies affect our more significant judgments and estimates used in the preparation of our financial statements:
Revenue recognition:
We derive our revenue primarily from development services and licensing of our patent portfolio:
| • | Service revenue consists primarily of software development and consulting services. The majority of service revenue arrangements are structured as time and materials consulting agreements and fixed price consulting agreements. |
| • | License revenue, including royalty revenue, originates primarily from licensing our technology and patents where we receive royalties as an income stream. Subscription revenue, which includes the sale of web-based subscriptions related to various software products, is recurring in nature. |
Revenue is recognized in accordance with Accounting Standards Codification (“ASC”) 605 “Revenue Recognition” and 985 “Software” when the following four criteria are met:
| (i) | persuasive evidence of an arrangement exists, |
| (ii) | delivery has occurred, |
| (iii) | the fee is fixed or determinable, and |
| (iv) | collection is probable. |
Some customer arrangements encompass multiple deliverables, such as patent license, professional services, software subscriptions, and maintenance fees. For arrangements that include multiple deliverables, we identify separate units of accounting at inception based on the consensus reached under ASC 605, which provides that revenue arrangements with multiple deliverables should be divided into separate units of accounting if certain criteria are met. The consideration for the arrangement is allocated to the separate units of accounting using the relative selling price method.
The relative selling price method allocates the consideration based on our specific assumptions rather than assumptions of a marketplace participant, and any discount in the arrangement proportionally to each deliverable on the basis of each deliverable’s selling price.
Applicable revenue recognition criteria are considered separately for each separate unit of accounting as follows:
| • | Revenue from professional service arrangements is generally determined based on time and materials. Revenue for professional services is recognized as the services are performed. Billing for services rendered generally occurs within one month after the services are provided. |
| • | License revenue is recognized when amounts owed to Digimarc have been earned, are fixed or determinable (within our normal 30 to 60 day payment terms), and collection is probable. If the payment terms extend beyond our normal 30 to 60 days, the fee may not be considered to be fixed or determinable, and the revenue would then be recognized when installments are due. |
| • | We record revenue from certain license agreements upon cash receipt as a result of collectability not being reasonably assured. |
25
Table of Contents
| • | Our standard payment terms for license arrangements are 30 to 60 days. Extended payment terms increase the likelihood we will grant a customer a concession, such as reduced license payments or additional rights, rather than hold firm on minimum commitments in an agreement to the point of losing a potential advocate and licensee of patented technology in the marketplace. Extended payment terms on patent license arrangements are not considered to be fixed or determinable if payments are due beyond our standard payment terms, primarily because of the risk of substantial modification present in our patent licensing business. As such, revenue on license arrangements with extended payment terms are recognized as fees become fixed and determinable. |
| • | Subscription revenue is accounted for under ASC 985. Subscription revenue is generally paid in advance and recognized over the term of the license, which is generally twelve months, or upon delivery and acceptance if we grant a perpetual license with no further obligations. |
Deferred revenue consists of billings in advance for professional services, licenses and subscriptions for which revenue has not been earned.
Impairments and estimation of useful lives of long-lived assets: We periodically assess long-lived assets for impairment whenever events or changes in circumstances indicate that the carrying amount of an asset may not be recoverable, in accordance with the provisions of ASC 360 “Property, Plant and Equipment.” This statement requires that long-lived assets and certain identifiable intangibles be reviewed for impairment whenever events or changes in circumstances indicate that the carrying amount of an asset may not be recoverable. Recoverability of assets to be held and used is measured by a comparison of the carrying amount of an asset to future net undiscounted cash flows expected to be generated by the asset. If the assets are considered to be impaired, the impairment to be recognized is measured by the amount by which the carrying amount of the assets exceeds the fair value of the assets. Fair value is determined based on discounted cash flows or appraised values, depending on the nature of the asset. Also, we periodically review the useful lives of long-lived assets whenever events or changes in circumstances indicate that the useful life may have changed. If the estimated useful lives of the assets do change, we adjust the depreciation or amortization period to a shorter or longer period, based on the circumstances identified.
Contingencies and litigation: We periodically evaluate all pending or threatened contingencies or commitments, if any, that are reasonably likely to have a material adverse effect on our operations or financial position. We assess the probability of an adverse outcome and determine if it is remote, reasonably possible or probable as defined in accordance with the provisions of ASC 450 “Contingencies.” If information available prior to the issuance of our financial statements indicates that it is probable that an asset has been impaired or a liability has been incurred at the date of our financial statements, and the amount of the loss, or the range of probable loss can be reasonably estimated, then the loss is accrued and charged to operations. If no accrual is made for a loss contingency because one or both of the conditions pursuant to ASC 450 are not met, but the probability of an adverse outcome is at least reasonably possible, we will disclose the nature of the contingency and provide an estimate of the possible loss or range of loss, or state that such an estimate cannot be made.
Patent costs: Costs associated with the application and award of patents in the U.S. and various other countries are capitalized and amortized on a straight-line basis over the term of the patents as determined at award date, which varies depending on the pendency period of the application, generally approximating seventeen years. Capitalized patent costs include internal legal labor, professional legal fees, government filing fees and translation fees related to obtaining the Company’s patent portfolio.
Costs associated with the maintenance and annuity fees of patents are accounted for as prepaid assets at the time of payment and amortized over the respective periods, generally from one to four years.
These patent costs are capitalized based on our determination that the related patents provide value through the life of the patent. However, we may subsequently determine a patent should be abandoned or has been impaired, in which case the accumulated cost, including maintenance fees, would be written off. Through December 31, 2011, abandonment or write-offs have not been material either individually or in the aggregate.
26
Table of Contents
Stock-based compensation: We account for stock-based compensation in accordance with ASC 718 “Compensation—Stock Compensation,” which requires the measurement and recognition of compensation for all stock-based awards made to employees and directors including stock options and employee stock purchases under a stock purchase plan based on estimated fair values. We use the Black-Scholes option pricing model as our method of valuation for stock- based awards. Our determination of the fair value of stock-based awards on the date of grant using an option pricing model is affected by our stock price as well as assumptions regarding a number of highly complex and subjective variables. These variables include, but are not limited, to the expected life of the award, our expected stock price, volatility over the term of the award and actual and projected exercise behaviors. Although the fair value of stock-based awards is determined in accordance with ASC 718, the Black-Scholes option pricing model requires the input of highly subjective assumptions, and other reasonable assumptions could provide differing results. For example, if we have low volatility, we would have a corresponding lower fair value of the stock-based award than if we had a higher volatility. The fair value of restricted stock awards granted is based on the fair market value of our common stock on the date of the grant (measurement date), and is recognized over the vesting period of the related restricted stock using the straight-line method.
Income taxes, valuation allowance: We account for income taxes in accordance with ASC 740 “Income Taxes.” Deferred income taxes reflect the net tax effects of temporary differences between the carrying amounts of assets and liabilities for financial reporting purposes and the amounts used for income tax purposes. A valuation allowance is required for deferred tax assets if, based on available evidence, it is more likely than not that all or some portion of the asset will not be realized due to the inability to generate sufficient taxable income in the period and/or of the character necessary to utilize the benefit of the deferred tax asset. The more-likely-than-not criterion means the likelihood of realization is greater than 50 percent. When evaluating whether it is more likely than not that all or some portion of the deferred tax asset will not be realized, we evaluate all available evidence, both positive and negative, that may affect the realizability of deferred tax assets and that should be identified and considered in determining the appropriate amount of the valuation allowance.
Results of Operations—the Years Ended December 31, 2011 and December 31, 2010
The following tables present our statements of operations data for the periods indicated.
| Year
Ended December 31, 2011 |
Year
Ended December 31, 2010 |
|||||||
| Revenue: |
||||||||
| Service |
$ | 12,395 | $ | 12,324 | ||||
| License and subscription |
23,644 | 18,826 | ||||||
|
|
|
|
|
|||||
| Total revenue |
36,039 | 31,150 | ||||||
| Cost of revenue: |
||||||||
| Service |
6,638 | 6,464 | ||||||
| License and subscription |
299 | 236 | ||||||
|
|
|
|
|
|||||
| Total cost of revenue |
6,937 | 6,700 | ||||||
| Gross profit |
29,102 | 24,450 | ||||||
| Operating expenses: |
||||||||
| Sales and marketing |
4,336 | 3,545 | ||||||
| Research, development and engineering |
7,327 | 5,687 | ||||||
| General and administrative |
9,956 | 7,864 | ||||||
| Intellectual property |
1,094 | 1,203 | ||||||
|
|
|
|
|
|||||
| Total operating expenses |
22,713 | 18,299 | ||||||
|
|
|
|
|
|||||
| Operating income |
6,389 | 6,151 | ||||||
|
|
|
|
|
|||||
| Net loss from joint ventures |
(2,714 | ) | (2,180 | ) | ||||
| Interest income, net |
195 | 245 | ||||||
|
|
|
|
|
|||||
| Income before provision for income taxes |
3,870 | 4,216 | ||||||
| (Provision) benefit for income taxes |
1,786 | (42 | ) | |||||
|
|
|
|
|
|||||
| Net income |
$ | 5,656 | $ | 4,174 | ||||
|
|
|
|
|
|||||
27
Table of Contents
| Year
Ended December 31, 2011 |
Year
Ended December 31, 2010 |
|||||||
| Revenue: |
||||||||
| Service |
34 | % | 40 | % | ||||
| License and subscription |
66 | 60 | ||||||
|
|
|
|
|
|||||
| Total revenue |
100 | 100 | ||||||
| Cost of revenue: |
||||||||
| Service |
18 | 21 | ||||||
| License and subscription |
1 | 1 | ||||||
|
|
|
|
|
|||||
| Total cost of revenue |
19 | 22 | ||||||
| Gross profit |
81 | 78 | ||||||
| Operating expenses: |
||||||||
| Sales and marketing |
12 | 12 | ||||||
| Research, development and engineering |
20 | 18 | ||||||
| General and administrative |
28 | 25 | ||||||
| Intellectual property |
3 | 4 | ||||||
|
|
|
|
|
|||||
| Total operating expenses |
63 | 59 | ||||||
|
|
|
|
|
|||||
| Operating income |
18 | 19 | ||||||
|
|
|
|
|
|||||
| Net loss from joint ventures |
(8 | ) | (7 | ) | ||||
| Interest income, net |
1 | 1 | ||||||
|
|
|
|
|
|||||
| Income (loss) before provision for income taxes |
11 | 13 | ||||||
| (Provision) benefit for income taxes |
5 | — | ||||||
|
|
|
|
|
|||||
| Net income |
16 | % | 13 | % | ||||
|
|
|
|
|
|||||
Summary
Our revenue increased in 2011 from 2010 primarily as a result of revenue derived from our relationships with IV and Verance, a long-term licensee. Our revenue for 2010 included a one-time payment of license fees of $4.5 million from Arbitron in the first quarter of 2010. The improved mix of high margin license revenue to total revenue also contributed favorably to our higher gross profit.
Throughout 2011, we continued to invest in the development and marketing of Digimarc Discover, an application designed for digital devices to hear, see and react to their surroundings, in developing additional intellectual property and in our strategic initiatives. We also continued to incur legal expenses in connection with our litigation matter with Verance. Finally, our deferred tax asset valuation reserve was reversed in the second quarter of 2011 reflecting our determination that it was more likely than not that our deferred tax assets will be realized in current and future periods.
Revenue
| Year
Ended December 31, 2011 |
Year
Ended December 31, 2010 |
Dollar Increase |
Percent Increase |
|||||||||||||
| Revenue: |
||||||||||||||||
| Service |
$ | 12,395 | $ | 12,324 | $ | 71 | 1 | % | ||||||||
| License and subscription |
23,644 | 18,826 | 4,818 | 26 | % | |||||||||||
|
|
|
|
|
|
|
|||||||||||
| Total |
$ | 36,039 | $ | 31,150 | $ | 4,889 | 16 | % | ||||||||
|
|
|
|
|
|
|
|||||||||||
| Revenue (as % of total revenue): |
||||||||||||||||
| Service |
34 | % | 40 | % | ||||||||||||
| License and subscription |
66 | % | 60 | % | ||||||||||||
|
|
|
|
|
|||||||||||||
| Total |
100 | % | 100 | % | ||||||||||||
|
|
|
|
|
|||||||||||||
28
Table of Contents
We derive our revenue primarily from:
| 1) | development services provided to government and commercial customers and |
| 2) | licensing our patents. |
Service. Service revenue consists primarily of software development and consulting services. The majority of service revenue arrangements are structured as time and materials consulting agreements, or fixed price consulting agreements. The majority of our service revenue is derived from contracts with the Central Banks, Nielsen, including the joint venture TVaura LLC, government agencies and IV. The agreements range from several months to several years in length, and our longer term contracts are subject to work plans that are reviewed and agreed upon at least annually. These contracts generally provide for billing hours worked at predetermined rates and, to a lesser extent, for cost reimbursement for third party costs and services. Increases or decreases in the services provided under these contracts are generally subject to both volume and price changes. The volume of work is generally negotiated at least annually and can be modified as the customer’s needs change. We also have provisions in our longer term contracts that allow for specific hourly rate price increases on an annual basis to account for cost of living variables. Contracts with other government agencies are generally shorter term in nature, less linear in billings and less predictable than our longer terms contracts because the contracts with other government agencies are subject to government budgets and funding.
The increases in service revenue were primarily due to increased program work related to the Central Banks and increased revenue from our relationship with IV, offset by decreased revenue from other government customers.
License and subscription. License revenue originates primarily from licensing our technology and patents where we receive royalties as our income stream. Subscription revenue consists primarily of royalty revenue from the sale of our web-based subscriptions related to various software products, which are more recurring in nature. Revenues from our licensed products have minimal associated direct costs, and thus are highly profitable.
The increases in license and subscription revenue were primarily attributed to revenue derived from the IV relationship and increased royalty revenue from Verance, offset by the one-time payment of license fees from Arbitron in the first quarter of 2010. See related disclosures in Part I, Item 3, “Legal Proceedings” of this Annual Report on Form 10-K.
Revenue by geography
| Year Ended December 31, 2011 |
Year Ended December 31, 2010 |
Dollar Increase |
Percent Increase |
|||||||||||||
| Revenue by geography: |
||||||||||||||||
| Domestic |
$ | 22,660 | $ | 19,034 | $ | 3,626 | 19 | % | ||||||||
| International |
13,379 | 12,116 | 1,263 | 10 | % | |||||||||||
|
|
|
|
|
|
|
|||||||||||
| Total |
$ | 36,039 | $ | 31,150 | $ | 4,889 | 16 | % | ||||||||
|
|
|
|
|
|
|
|||||||||||
| Revenue (as % of total revenue): |
||||||||||||||||
| Domestic |
63 | % | 61 | % | ||||||||||||
| International |
37 | % | 39 | % | ||||||||||||
|
|
|
|
|
|||||||||||||
| Total |
100 | % | 100 | % | ||||||||||||
Domestic revenue increased primarily as a result of increased revenue derived from the IV relationship and increased royalty revenue from Verance, offset by the one-time payment of license fees from Arbitron in the first quarter of 2010.
International revenue increased primarily due to increased royalties from Civolution and increased service revenue from the Central Banks.
29
Table of Contents
We anticipate revenue growth in 2012 from our existing customers, including the payments received from Verance related to the terms of the settlement agreement (see related disclosures under “Liquidity and Capital Resources – Future Cash Expectations” in this section and Note 17 of our Notes to Financial Statements), and from new customers as we continue to expand the marketing and monetization of our intellectual property portfolio.
Cost of revenue
Service. Cost of service revenue primarily includes costs that are allocated from research, development, engineering and sales and marketing that relate directly to performing services under our customer contracts, and, to a lesser extent, direct costs of program delivery for both personnel and operating expenses. Allocated costs include:
| • | salaries, a payroll tax and benefit factor, incentive compensation and related costs of our software developers, quality assurance personnel, product managers, business development managers and other personnel where we bill our customers for time and materials costs; |
| • | payments to outside contractors that are billed to customers; |
| • | charges for equipment directly used by the customer; |
| • | depreciation charges for machinery, equipment and software; |
| • | travel costs directly attributable to service and development contracts; and |
| • | charges for infrastructure and centralized costs of facilities and information technology. |
License and subscription. Cost of license and subscription revenue primarily includes:
| • | patent or software license costs for any patents licensed from third parties where the party receives a portion of royalties or license revenue received by Digimarc; |
| • | internet service provider connectivity charges and image search data fees to support the services offered to our subscription customers; and, to a lesser extent, |
| • | amortization of capitalized patent costs. |
Gross profit
| Year Ended December 31, 2011 |
Year Ended December 31, 2010 |
Dollar Increase (Decrease) |
Percent Increase (Decrease) |
|||||||||||||
| Gross Profit: |
||||||||||||||||
| Service |
$ | 5,757 | $ | 5,860 | $ | (103 | ) | (2 | )% | |||||||
| License and subscription |
23,345 | 18,590 | 4,755 | 26 | % | |||||||||||
|
|
|
|
|
|
|
|||||||||||
| Total |
$ | 29,102 | $ | 24,450 | $ | 4,652 | 19 | % | ||||||||
|
|
|
|
|
|
|
|||||||||||
| Gross Profit (as % of related revenue components): |
||||||||||||||||
| Service |
46 | % | 48 | % | ||||||||||||
| License and subscription |
99 | % | 99 | % | ||||||||||||
| Total |
81 | % | 78 | % | ||||||||||||
Gross profit, defined as revenues less cost of revenues, as described above, increased primarily as a result of increased license and royalty revenues from IV and Verance, offset by the one-time payment of license fees from Arbitron in the first quarter of 2010.
The increase in total gross profit as a percentage of revenue was due primarily to changes in revenue mix, where higher margin license revenue was a greater percent of total revenue. The decrease in service gross profit as a percentage of service revenue resulted primarily from a change in mix of labor resources.
30
Table of Contents
Operating expenses
Sales and marketing
| Year Ended December 31, 2011 |
Year Ended December 31, 2010 |
Dollar Increase |
Percent Increase |
|||||||||||||
| Sales and marketing |
$ | 4,336 | $ | 3,545 | $ | 791 | 22 | % | ||||||||
| Sales and marketing (as % of total revenue) |
12 | % | 12 | % | ||||||||||||
Sales and marketing expenses consist primarily of:
| • | compensation, benefits and related costs of sales and marketing employees and product managers; |
| • | travel and market research costs, and costs associated with marketing programs, such as trade shows, public relations and new product launches; |
| • | professional services and outside contractors for product and marketing initiatives; |
| • | incentive compensation in the form of stock-based compensation expense; and |
| • | charges for infrastructure and centralized costs of facilities and information technology. |
We allocate certain costs of sales and marketing to cost of service revenue when they relate directly to our service contracts. For direct billable labor hours, we allocate to cost of service revenue:
| • | salaries; |
| • | a payroll tax and benefits factor; and |
| • | incentive compensation related to our stock compensation plans. |
We record all remaining, or “residual,” costs as sales and marketing costs.
The increases in sales and marketing expense resulted primarily from:
| • | increased headcount and compensation-related expenses of $0.4 million from hiring additional sales and marketing support for our mobile device market initiatives; and |
| • | increased marketing and professional fees of $0.3 million related to a number of sales initiatives, including our Digimarc Discover Platform. |
We anticipate that we will continue to incur sales and marketing costs similar to existing levels to support ongoing sales initiatives.
Research, development and engineering
| Year Ended December 31, 2011 |
Year Ended December 31, 2010 |
Dollar Increase |
Percent Increase |
|||||||||||||
| Research, development and engineering |
$ | 7,327 | $ | 5,687 | $ | 1,640 | 29 | % | ||||||||
| Research, development and engineering (as % of total revenue) |
20 | % | 18 | % | ||||||||||||
Research, development and engineering expenses arise primarily from three areas that support our business model:
| • | Fundamental Research: |
| • | investigation of new watermarking algorithms to increase robustness and/or computational efficiency; |
| • | mobile device usage models and imaging sub-systems in camera-phones; |
| • | industry conference participation and authorship of papers for industry journals; |
| • | survey and study of human and computer interaction models with a focus on mobile devices and modeling of intent; |
31
Table of Contents
| • | development of new intellectual property, including documentation of claims and production of supporting diagrams and materials; and |
| • | research in fingerprinting and other content identification technologies. |
| • | Platform Development: |
| • | tuning and optimization of implementation models to improve resistance to non-malicious attacks and routine transformations, such as JPEG, cropping and printing; and |
| • | mobile platform creation to leverage device specific capabilities (e.g., instruction sets and Graphics Processing Units (“GPUs”). |
| • | Product Development: |
| • | creation of Online Services Portal to provide campaign management and routing services for the Digimarc Discover platform; |
| • | implementation of web-hosted image watermark embedder in support of Digimarc Discover platform; and |
| • | iterative development and release of the Digimarc Discover application for the iTunes and Android marketplaces. |
Research, development and engineering expenses consist primarily of:
| • | compensation, benefits, recruiting and related costs of software and hardware developers and quality assurance personnel; |
| • | payments to outside contractors; |
| • | the purchase of materials and services for product development; |
| • | incentive compensation in the form of stock-based compensation expense; and |
| • | charges for infrastructure and centralized costs of facilities and information technology. |
We allocate certain costs of research, development and engineering to cost of service revenue when they relate directly to our service contracts. For direct billable labor hours, we allocate to cost of service revenue:
| • | salaries; |
| • | a payroll tax and benefits factor; and |
| • | incentive compensation related to our stock compensation plans. |
We record all remaining, or “residual,” costs as research, development and engineering costs.
The increases in research, development and engineering expense resulted primarily from increased headcount and compensation-related expenses of $1.5 million from hiring engineers and scientists to facilitate sales growth of our products and services, including increased investments primarily related to the mobile device market.
We anticipate that we will continue to invest in research, development and engineering expenses at higher levels to support our ongoing research and product initiatives.
General and administrative
| Year Ended December 31, 2011 |
Year Ended December 31, 2010 |
Dollar Increase |
Percent Increase |
|||||||||||||
| General and administrative |
$ | 9,956 | $ | 7,864 | $ | 2,092 | 27 | % | ||||||||
| General and administrative (as % of total revenue) |
28 | % | 25 | % | ||||||||||||
32
Table of Contents
We incur general and administrative costs in the functional areas of finance, legal, human resources, executive and board of directors. Costs for facilities and information technology are also managed as part of the general and administrative processes and are allocated to this area as well as each of the areas in costs of services, sales and marketing, and research, development and engineering.
General and administrative expenses consist primarily of:
| • | compensation, benefits and related costs; |
| • | third party and professional fees associated with legal, accounting, human resources and costs associated with being a public company; |
| • | incentive compensation in the form of stock-based compensation expense; and |
| • | charges for infrastructure and centralized costs of facilities and information technology. |
The increases in general and administrative expenses resulted primarily from:
| • | increased legal fees of $1.6 million primarily related to the litigation matter with Verance; |
| • | increased compensation-related expenses of $0.5 million primarily related to an additional layer of stock-based awards and payroll taxes related to stock option exercises; and |
| • | increased accounting fees of $0.2 million related to the transition to our new auditors that we engaged in late 2010 for the 2010 audit. |
We anticipate that we will continue to incur general and administrative expenses at existing or lower levels in the near term, particularly lower legal fees as a result of our settlement with Verance in January 2012, while continuing to examine means to reduce general and administrative expenses as a percentage of revenue in the longer term.
Intellectual property
| Year Ended December 31, 2011 |
Year Ended December 31, 2010 |
Dollar Decrease |
Percent Decrease |
|||||||||||||
| Intellectual property |
$ | 1,094 | $ | 1,203 | $ | 109 | 9 | % | ||||||||
| Intellectual property (as % of total revenue) |
3 | % | 4 | % | ||||||||||||
We incur intellectual property expenses that arise primarily from costs associated with documenting, applying for, and maintaining domestic and international patents and trademarks.
Gross expenditures for intellectual property costs, before reflecting the effect of capitalized patent costs, primarily consist of:
| • | compensation, benefits and related costs of attorneys and legal assistants; |
| • | third party costs, including filing and governmental regulatory fees and fees for outside legal counsel and translation costs, each incurred in the patent process; |
| • | incentive compensation in the form of stock-based compensation expense; and |
| • | charges for infrastructure and centralized costs of facilities and information technology. |
We allocate certain costs of intellectual property to cost of service revenue when they relate directly to our service contracts, primarily for support services provided to IV. For direct billable labor hours, we allocate to cost of service revenue:
| • | salaries; |
| • | a payroll tax and benefits factor; and |
33
Table of Contents
| • | incentive compensation related to our stock compensation plans. |
Intellectual property expenses can vary from period to period based on:
| • | the level of capitalized patent activity, and |
| • | prosecution costs and direct labor hours (salaries, payroll taxes and benefits factor and incentive compensation related to our stock compensation plans) related to the patents that were exclusively licensed to IV that are allocated to cost of revenue. |
The decreases in intellectual property expenses in 2011 compared to 2010 reflect the variable spending levels described in the preceding paragraph, including a greater portion of patent related costs assumed by IV as part of our 2010 licensing arrangement.
We anticipate that we will continue to invest in intellectual property expenses at existing levels.
Stock-based compensation
| Year Ended December 31, 2011 |
Year Ended December 31, 2010 |
Dollar Increase |
Percent Increase |
|||||||||||||
| Cost of revenue |
$ | 593 | $ | 373 | $ | 220 | 59 | % | ||||||||
| Sales and marketing |
302 | 192 | 110 | 57 | % | |||||||||||
| Research, development and engineering |
560 | 314 | 246 | 78 | % | |||||||||||
| General and administrative |
2,568 | 2,083 | 485 | 23 | % | |||||||||||
| Intellectual property |
193 | 106 | 87 | 82 | % | |||||||||||
|
|
|
|
|
|
|
|||||||||||
| Total |
$ | 4,216 | $ | 3,068 | $ | 1,148 | 37 | % | ||||||||
|
|
|
|
|
|
|
|||||||||||
The increases in stock-based compensation expense were primarily due to an additional layer of stock-based awards. We anticipate incurring an additional $9,463 in stock-based compensation expense through December 2015 for awards outstanding as of December 31, 2011.
Net loss from joint ventures
| Year Ended December 31, 2011 |
Year Ended December 31, 2010 |
Dollar Increase |
Percent Increase |
|||||||||||||
| Net loss from joint ventures |
$ | (2,714 | ) | $ | (2,180 | ) | $ | 534 | 24 | % | ||||||
The increases in the net loss from joint ventures resulted primarily from increased litigation costs in connection with the legal matter with Walker Digital, and increased research, development and engineering costs for product development. See related disclosures of each of the joint ventures in Note 13 of our Notes to Financial Statements.
Interest income, net
| Year Ended December 31, 2011 |
Year Ended December 31, 2010 |
Dollar Decrease |
Percent Decrease |
|||||||||||||
| Interest income, net |
195 | 245 | (50 | ) | (20 | )% | ||||||||||
34
Table of Contents
The decreases in interest income, net was primarily due to a combination of lower balances and lower interest earned on cash and investment balances. The lower balances primarily resulted from cash expended for stock repurchases, net of cash provided from operations and the lower interest rates reflect continued monetary policy set by the federal government.
Provision for income taxes
For the year ended December 31, 2011, the provision for income taxes reflects current income tax expense, deferred tax benefit, and withholding tax expense in various foreign jurisdictions. The withholding taxes are computed by our customers and paid to foreign jurisdictions on our behalf. Although there is current tax expense, there is no current tax payable due to the utilization of excess tax benefits associated with stock compensation. There is a deferred tax benefit resulting primarily from the release of the valuation allowance during the second quarter of 2011. During the year ended December 31, 2011 we concluded, based on an analysis of all the facts, including projections of future income, that it is more likely than not that our deferred tax assets will be realized.
For the year ended December 31, 2010, the provision for income taxes reflects withholding tax expense in various foreign jurisdictions. The withholding taxes are computed by our customers and paid to foreign jurisdictions on our behalf. There was no provision for income taxes related to net income because the computed amount was completely offset with available federal and state attribute carryforwards and there was a full valuation allowance on net deferred tax assets.
Results of Operations—the Years Ended December 31, 2010 and December 31, 2009
The following tables present our statements of operations data for the periods indicated.
| Year Ended December 31, 2010 |
Year Ended December 31, 2009 |
|||||||
| Revenue: |
||||||||
| Service |
$ | 12,324 | $ | 10,845 | ||||
| License and subscription |
18,826 | 8,226 | ||||||
|
|
|
|
|
|||||
| Total revenue |
31,150 | 19,071 | ||||||
| Cost of revenue: |
||||||||
| Service |
6,464 | 6,090 | ||||||
| License and subscription |
236 | 211 | ||||||
|
|
|
|
|
|||||
| Total cost of revenue |
6,700 | 6,301 | ||||||
| Gross profit |
24,450 | 12,770 | ||||||
| Operating expenses: |
||||||||
| Sales and marketing |
3,545 | 3,034 | ||||||
| Research, development and engineering |
5,687 | 4,989 | ||||||
| General and administrative |
7,864 | 6,299 | ||||||
| Intellectual property |
1,203 | 1,013 | ||||||
|
|
|
|
|
|||||
| Total operating expenses |
18,299 | 15,335 | ||||||
|
|
|
|
|
|||||
| Operating income (loss) |
6,151 | (2,565 | ) | |||||
|
|
|
|
|
|||||
| Net loss from joint ventures |
(2,180 | ) | (691 | ) | ||||
| Interest income, net |
245 | 522 | ||||||
|
|
|
|
|
|||||
| Income (loss) before provision for income taxes |
4,216 | (2,734 | ) | |||||
| Provision for income taxes |
(42 | ) | (23 | ) | ||||
|
|
|
|
|
|||||
| Net income (loss) |
$ | 4,174 | $ | (2,757 | ) | |||
|
|
|
|
|
|||||
35
Table of Contents
| Year Ended December 31, 2010 |
Year Ended December 31, 2009 |
|||||||
| Revenue: |
||||||||
| Service |
40 | % | 57 | % | ||||
| License and subscription |
60 | 43 | ||||||
|
|
|
|
|
|||||
| Total revenue |
100 | 100 | ||||||
| Cost of revenue: |
||||||||
| Service |
21 | 32 | ||||||
| License and subscription |
1 | 1 | ||||||
|
|
|
|
|
|||||
| Total cost of revenue |
22 | 33 | ||||||
| Gross profit |
78 | 67 | ||||||
| Operating expenses: |
||||||||
| Sales and marketing |
12 | 16 | ||||||
| Research, development and engineering |
18 | 26 | ||||||
| General and administrative |
25 | 33 | ||||||
| Intellectual property |
4 | 5 | ||||||
|
|
|
|
|
|||||
| Total operating expenses |
59 | 80 | ||||||
|
|
|
|
|
|||||
| Operating income (loss) |
19 | (13 | ) | |||||
|
|
|
|
|
|||||
| Net loss from joint ventures |
(7 | ) | (4 | ) | ||||
| Interest income, net |
1 | 3 | ||||||
|
|
|
|
|
|||||
| Income (loss) before provision for income taxes |
13 | (14 | ) | |||||
| Provision for income taxes |
— | — | ||||||
|
|
|
|
|
|||||
| Net income |
13 | % | (14 | )% | ||||
|
|
|
|
|
|||||
Summary
Our improved operating results for the year ended December 31, 2010 were due primarily to successfully executing our intellectual property monetization strategy as reflected in the licensing arrangements with Arbitron and IV, offset by investments in our product initiatives and joint ventures with Nielsen.
Revenue
| Year Ended December 31, 2010 |
Year Ended December 31, 2009 |
Dollar Increase |
Percent Increase |
|||||||||||||
| Revenue: |
||||||||||||||||
| Service |
$ | 12,324 | $ | 10,845 | $ | 1,479 | 14 | % | ||||||||
| License and subscription |
18,826 | 8,226 | 10,600 | 129 | % | |||||||||||
|
|
|
|
|
|
|
|||||||||||
| Total |
$ | 31,150 | $ | 19,071 | $ | 12,079 | 63 | % | ||||||||
|
|
|
|
|
|
|
|||||||||||
| Revenue (as % of total revenue): |
||||||||||||||||
| Service |
40 | % | 57 | % | ||||||||||||
| License and subscription |
60 | % | 43 | % | ||||||||||||
|
|
|
|
|
|||||||||||||
| Total |
100 | % | 100 | % | ||||||||||||
|
|
|
|
|
|||||||||||||
The increases in service revenue were due primarily to increased program work from the Central Banks , increased services under our joint venture agreement with Nielsen, the completion of government contracts that are non-linear in nature and support services related to the IV arrangement.
36
Table of Contents
The increases in license and subscription revenue were due primarily to the licensing arrangements with IV and Arbitron and increased royalties from Civolution, offset by decreased royalties from Verance, a cash basis customer, which chose to not pay its quarterly royalties to us and sought legal remedies against us. See related disclosures in Part I, Item 3, “Legal Proceedings” of this Annual Report on Form 10-K.
Revenue by geography
| Year Ended December 31, 2010 |
Year Ended December 31, 2009 |
Dollar Increase |
Percent Increase |
|||||||||||||
| Revenue by geography: |
||||||||||||||||
| Domestic |
$ | 19,034 | $ | 8,673 | $ | 10,361 | 119 | % | ||||||||
| International |
12,116 | 10,398 | 1,718 | 17 | % | |||||||||||
|
|
|
|
|
|
|
|||||||||||
| Total |
$ | 31,150 | $ | 19,071 | $ | 12,079 | 63 | % | ||||||||
|
|
|
|
|
|
|
|||||||||||
| Revenue (as % of total revenue): |
||||||||||||||||
| Domestic |
61 | % | 45 | % | ||||||||||||
| International |
39 | % | 55 | % | ||||||||||||
|
|
|
|
|
|||||||||||||
| Total |
100 | % | 100 | % | ||||||||||||
Domestic revenue increased due primarily to the licensing arrangements with IV and Arbitron, the completion of government contracts that are non-linear in nature, and revenues received under the licensing and joint venture agreements with Nielsen.
International revenue increased primarily due to increased royalties from Civolution and increased service revenue from the Central Banks.
Gross profit
| Year Ended December 31, 2010 |
Year Ended December 31, 2009 |
Dollar Increase |
Percent Increase |
|||||||||||||
| Gross Profit: |
||||||||||||||||
| Service |
$ | 5,860 | $ | 4,755 | $ | 1,105 | 23 | % | ||||||||
| License and subscription |
18,590 | 8,015 | 10,575 | 132 | % | |||||||||||
|
|
|
|
|
|
|
|||||||||||
| Total |
$ | 24,450 | $ | 12,770 | $ | 11,680 | 91 | % | ||||||||
|
|
|
|
|
|
|
|||||||||||
| Gross Profit (as % of related revenue components): |
||||||||||||||||
| Service |
48 | % | 44 | % | ||||||||||||
| License and subscription |
99 | % | 97 | % | ||||||||||||
| Total |
78 | % | 67 | % | ||||||||||||
The increases in gross profit primarily reflected the effect of the licensing arrangements with IV and Arbitron and royalties from Civolution, service revenues under our joint venture agreement with Nielsen and our agreement with the Central Banks, and the completion of government contracts.
The increases in gross profit as a percentage of revenue was due primarily to favorable margins from our government (including the Central Banks) and Nielsen joint venture service contracts primarily as a result of improved labor utilization in the variable component of our costs of services, and increased revenues attributed to the licensing arrangements with IV, Arbitron and Civolution.
37
Table of Contents
Operating expenses
Sales and marketing
| Year Ended December 31, 2010 |
Year Ended December 31, 2009 |
Dollar Increase |
Percent Increase |
|||||||||||||
| Sales and marketing |
$ | 3,545 | $ | 3,034 | $ | 511 | 17 | % | ||||||||
| Sales and marketing (as % of total revenue) |
12 | % | 16 | % | ||||||||||||
The increases in sales and marketing expense resulted primarily from:
| • | increased professional fees of $0.4 million related to developing marketing materials for our patent monetization and mobile device market initiatives, and |
| • | increased contract labor and professional fees of $0.2 million related to the mobile device market, in particular visual search. |
Research, development and engineering
| Year Ended December 31, 2010 |
Year Ended December 31, 2009 |
Dollar Increase |
Percent Increase |
|||||||||||||
| Research, development and engineering |
$ | 5,687 | $ | 4,989 | $ | 698 | 14 | % | ||||||||
| Research, development and engineering (as % of total revenue) |
18 | % | 26 | % | ||||||||||||
The increases in research, development and engineering expense resulted primarily from increased headcount and employee compensation-related expenses from hiring additional engineers and scientists to facilitate expected growth in service revenue, and to increase our investment in research and development primarily related to the mobile device market, in particular visual search.
General and administrative
| Year Ended December 31, 2010 |
Year Ended December 31, 2009 |
Dollar Increase |
Percent Increase |
|||||||||||||
| General and administrative |
$ | 7,864 | $ | 6,299 | $ | 1,565 | 25 | % | ||||||||
| General and administrative (as % of total revenue) |
25 | % | 33 | % | ||||||||||||
The increases in general and administrative expenses resulted primarily from:
| • | increased professional fees of $0.6 million related to the IV arrangement and investor relations, |
| • | increased legal and accounting fees of $0.5 million related to the IV arrangement and litigation matters, and |
| • | increased stock-based compensation of $0.3 million related to an additional layer of stock-based award grants. |
Intellectual property
| Year Ended December 31, 2010 |
Year Ended December 31, 2009 |
Dollar Increase |
Percent Increase |
|||||||||||||
| Intellectual property |
$ | 1,203 | $ | 1,013 | $ | 190 | 19 | % | ||||||||
| Intellectual property (as % of total revenue) |
4 | % | 5 | % | ||||||||||||
38
Table of Contents
The increases in intellectual property expenses reflect variable spending levels based on:
| • | the level of capitalized patent activity, and |
| • | prosecution costs and direct labor hours (salaries, payroll taxes and benefits factor and incentive compensation related to our stock compensation plans) related to the patents that were exclusively licensed to IV that are allocated to cost of revenue. |
Stock-based compensation
| Year Ended December 31, 2010 |
Year Ended December 31, 2009 |
Dollar Increase (Decrease) |
Percent Increase (Decrease) |
|||||||||||||
| Cost of revenue |
$ | 373 | $ | 231 | $ | 142 | 61 | % | ||||||||
| Sales and marketing |
192 | 210 | (18 | ) | (9 | )% | ||||||||||
| Research, development and engineering |
314 | 187 | 127 | 68 | % | |||||||||||
| General and administrative |
2,083 | 1,747 | 336 | 19 | % | |||||||||||
| Intellectual property |
106 | 69 | 37 | 54 | % | |||||||||||
|
|
|
|
|
|
|
|||||||||||
| Total |
$ | 3,068 | $ | 2,444 | $ | 624 | 26 | % | ||||||||
|
|
|
|
|
|
|
|||||||||||
The increases in stock-based compensation expense were primarily due to an additional layer of stock-based awards.
Net loss from joint ventures
| Year Ended December 31, 2010 |
Year Ended December 31, 2009 |
Dollar Decrease |
Percent Decrease |
|||||||||||||
| Net loss from joint ventures |
$ | (2,180 | ) | $ | (691 | ) | $ | (1,489 | ) | (215 | )% | |||||
The increase in the net loss from joint ventures resulted primarily from a full year of operations for the joint ventures in 2010.
Interest income, net
| Year Ended December 31, 2010 |
Year Ended December 31, 2009 |
Dollar Decrease |
Percent Decrease |
|||||||||||||
| Interest income, net |
245 | 522 | (277 | ) | (53 | )% | ||||||||||
The decreases in interest income, net was due primarily to due to a combination of lower balances and lower interest earned on cash and marketable securities balances.
Provision for income taxes
For the years ended December 31, 2010 and 2009, the provision for income taxes reflects withholding tax expense in various foreign jurisdictions. The withholding taxes are computed by our customers and paid to foreign jurisdictions on our behalf.
39
Table of Contents
Liquidity and Capital Resources
| December 31, 2011 |
December 31, 2010 |
|||||||
| Working capital |
$ | 26,859 | $ | 35,526 | ||||
| Current (liquidity) ratio (1) |
8.4:1 | 9.7:1 | ||||||
| Cash, cash equivalents and short-term marketable securities |
$ | 25,663 | $ | 34,781 | ||||
| Long-term marketable securities |
$ | 7,715 | $ | 11,163 | ||||
| Total cash, cash equivalents and all marketable securities |
$ | 33,378 | $ | 45,944 | ||||
| (1) | The current (liquidity) ratio is calculated by dividing total current assets by total current liabilities. |
The $12.6 million decrease in cash, cash equivalents and all marketable securities at December 31, 2011 from December 31, 2010 resulted primarily from:
| • | the purchase of common stock from a shareholder, Koninklijke Philips Electronics N.V, in a privately negotiated transaction; |
| • | purchases of common stock related to the vesting of restricted stock and exercise of stock options in satisfaction of required withholding tax liability, and repurchases made under our stock repurchase program; and |
| • | cash contributions to the joint ventures with Nielsen. |
Financial instruments that potentially subject us to concentrations of credit risk consist primarily of cash and cash equivalents, marketable securities, and trade accounts receivable. We place our cash and cash equivalents with major banks and financial institutions and at times deposits may exceed insured limits. Both short- and long-term marketable securities include federal agency notes, company notes, and commercial paper. Our investment policy requires the portfolio to be invested to ensure that the greater of $3 million or 7% of the invested funds will be available within 30 days notice.
Other than cash used for operating needs, which may include short-term marketable securities, our investment policy limits our credit exposure to any one financial institution or type of financial instrument by limiting the maximum of 5% of our cash and cash equivalents and marketable securities or $1 million, whichever is greater, to be invested in any one issuer except for the U.S. government and U. S. federal agencies, which have no limits, at the time of purchase. Our investment policy also limits our credit exposure by limiting to a maximum of 40% of our cash and cash equivalents and marketable securities, or $15 million, whichever is greater, to be invested in any one industry category, e.g., financial or energy industries, at the time of purchase. As a result, we believe our credit risk associated with cash and investments to be minimal. A decline in the market value of any security below cost that is deemed to be other-than-temporary results in a reduction in carrying amount of fair value. To determine whether an impairment is other-than-temporary, we consider whether we have the ability and intent to hold the investment until a market price recovery and evidence indicating that the cost of the investment is recoverable outweighs evidence to the contrary. There have been no other-than-temporary impairments identified or recorded by us.
Operating Cash Flow. The components of operating cash flows were:
| Year Ended December 31, 2011 |
Year Ended December 31, 2010 |
Dollar Increase (Decrease) |
Percent Increase (Decrease) |
|||||||||||||
| Net income |
$ | 5,656 | $ | 4,174 | $ | 1,482 | 36 | % | ||||||||
| Non-cash items |
4,832 | 5,892 | (1,102 | ) | (19 | )% | ||||||||||
| Changes in operating assets and liabilities |
(254 | ) | 366 | (578 | ) | (158 | )% | |||||||||
|
|
|
|
|
|
|
|||||||||||
| Net cash provided by operating activities |
$ | 10,234 | $ | 10,432 | $ | (198 | ) | (2 | )% | |||||||
|
|
|
|
|
|
|
|||||||||||
40
Table of Contents
| Year
Ended December 31, 2010 |
Year
Ended December 31, 2009 |
Dollar Increase |
Percent Increase |
|||||||||||||
| Net income (loss) |
$ | 4,174 | $ | (2,757 | ) | $ | 6,931 | 251 | % | |||||||
| Non-cash items |
5,892 | 3,724 | 2,168 | 58 | % | |||||||||||
| Changes in operating assets and liabilities |
366 | (188 | ) | 554 | 295 | % | ||||||||||
|
|
|
|
|
|
|
|||||||||||
| Net cash provided by operating activities |
$ | 10,432 | $ | 779 | $ | 9,653 | 1,239 | % | ||||||||
|
|
|
|
|
|
|
|||||||||||
Net income (loss)
The increase in operating results for the year ended December 31, 2011 compared to the year ended December 31, 2010 reflects higher license revenues primarily related to IV and Verance, offset by a one-time licensing payment of $4.5 million from Arbitron in 2010 and increased operating expenses related to our mobile device market initiatives and the litigation matter with Verance. In addition, we reversed the valuation allowance on our deferred tax assets in the second quarter of 2011 and recorded the tax assets in the financial statements resulting in a recognized tax benefit of $2.6 million from the valuation allowance release, offset by the $0.8 million income tax provision.
The increase in operating results for the year ended December 31, 2010 compared to the year ended December 31, 2009 reflects higher revenues, primarily attributable to revenue received under the licensing arrangements with IV and Arbitron and royalty revenues from Civolution, offset by increased stock compensation expense, legal and professional fees related to IV arrangement and consulting and marketing expenses related to product initiatives.
Non-cash items
The decrease in non-cash items for the year ended December 31, 2011 compared to the year ended December 31, 2010 was primarily the result of the deferred income tax benefit that resulted from the reversal of the valuation allowance on our deferred tax assets in the second quarter of 2011, offset by the net losses from the joint ventures, and an additional layer of stock-based awards and the tax benefits from stock-based awards.
The increase in non-cash items for the year ended December 31, 2010 compared to the year ended December 31, 2009 was primarily the result of the net losses from the joint ventures and an additional layer of stock-based awards.
Operating assets and liabilities
The primary changes in the operating assets and liabilities for the year ended December 31, 2011 compared to the year ended December 31, 2010 related to:
| • | a reduction of accrued expenses primarily related to consulting services in connection with our patent license arrangement with IV; offset by |
| • | reimbursement from our landlord for a tenant improvement allowance. |
The primary changes in the operating assets and liabilities for the year ended December 31, 2010 compared to the year ended December 31, 2009 related to a reduction in compensation related liabilities related to accrued bonuses at the 2009 year-end that were paid in 2010 compared with no bonus accrual at December 31, 2010, as a result of the elimination of the bonus program.
Cash flows from investing activities
The cash flows from investing activities for the year ended December31, 2011 compared to the year ended December 31, 2010 and for the year ended December 31, 2010 compared to the year ended December 31, 2009 related to:
| • | investments made in property and equipment, primarily in our information technology area for computer systems and related equipment used to operate our business; |
41
Table of Contents
| • | investments made in the patent application and granting process; |
| • | investments made in joint ventures; and |
| • | net activity from investing our short- and long-term marketable securities. |
Cash flows from financing activities
The cash flows from financing activities for the year ended December 31, 2011 compared to the year ended December 31, 2010 related to the increase in purchases of common stock for the following:
| • | purchase of common stock from a shareholder in a privately negotiated transaction; |
| • | purchases of common stock as part of our stock repurchase program; and |
| • | purchases of common stock for the withholding of shares upon the vesting of restricted stock to satisfy tax withholding obligations; offset by |
| • | the exercise of stock options; and |
| • | the excess tax benefit from stock-based awards. |
The primary changes in the financing activities for the year ended December 31, 2010 compared to the year ended December 31, 2009 related to the increase in purchases of common stock for the following:
| • | purchases of common stock through net exercises of stock options, and for the withholding of shares upon the exercise of stock options and the vesting of restricted stock to satisfy tax withholding obligations; offset by |
| • | the exercise of stock options. |
Commitments and contingencies
Pursuant to the terms of the joint venture agreements with Nielsen, we were obligated to contribute an aggregate $6.7 million to the joint ventures payable in quarterly installments from July 2009 through October 2011. Upon mutual agreement, the October 2011 payment of $0.7 million was delayed to 2012. Future capital contributions, if any, to the joint ventures beyond what is contractually committed, have not yet been determined.
In May 2010 we entered into an amendment with the landlord of our corporate offices to extend the length of our facilities lease through August 2016 with rent payments totaling $5.3 million.
Our obligations under non-cancelable operating leases for our facilities and various equipment leases, which totaled $4.0 million as of December 31, 2011 and are payable in monthly installments through August 2016.
Future cash expectations
In connection with the settlement, renewal and extension agreement with Verance, we anticipate our cash flow will improve as a result of:
| 1) | payment of past due royalties in January 2012, and |
| 2) | payment of quarterly royalties based on Verance revenues. |
In connection with our IV arrangement, we anticipate our cash flow will slightly improve as a result of:
| 1) | payment of the license issue fee in increasing quarterly installments over two years, |
| 2) | consulting fees payable over four years, and |
| 3) | additional cost savings because IV has assumed the prosecution and maintenance costs related to the patents and patent applications that were licensed to IV that were previously borne by us. |
42
Table of Contents
Since the inception of our stock repurchase program in April 2009, through December 31, 2011, our Board of Directors has authorized the repurchase of $10.0 million of our common stock. As of December 31, 2011, we had repurchased 216,244 shares under this program at an aggregate purchase price of $4.7 million. Shares of our common stock may be purchased in the open market or through privately negotiated transactions, subject to market conditions. This repurchase program does not obligate us to acquire any specific number of shares or to acquire shares over any specified period of time.
We believe that our current cash, cash equivalents, and short-term marketable securities balances will satisfy our projected working capital and capital expenditure requirements for at least the next 12 months. Thereafter, we anticipate continuing to use cash, cash equivalents and marketable securities balances to satisfy our projected working capital and capital expenditure requirements.
We may use cash resources to fund acquisitions or investments in complementary businesses, technologies or product lines. In order to take advantage of opportunities, we may find it necessary to obtain additional equity financing, debt financing, or credit facilities. We do not believe at this time, however, that our long-term working capital and capital expenditures would require us to take steps to remedy any such potential deficiencies. If it were necessary to obtain additional financing or credit facilities, we may not be able to do so, or if these funds are available, they may not be available on satisfactory terms.
Contractual Obligations
| Payment Due by Period | ||||||||||||||||||||
| Total | Less than 1 year |
1-3 years | 3-5 years | More than 5 years |
||||||||||||||||
| Total joint venture obligations |
$ | 700 | $ | 700 | $ | — | $ | — | $ | — | ||||||||||
| Total operating lease obligations |
4,030 | 824 | 1,709 | 1,497 | — | |||||||||||||||
|
|
|
|
|
|
|
|
|
|
|
|||||||||||
| Total obligations |
$ | 4,730 | $ | 1,524 | $ | 1,709 | $ | 1,497 | $ | — | ||||||||||
|
|
|
|
|
|
|
|
|
|
|
|||||||||||
Off-Balance Sheet Arrangements
Other than the contractual obligations noted above, we do not have any off-balance sheet arrangements that have or are reasonably likely to have a current or future effect on our financial condition, changes in financial condition, revenue or expenses, results of operations, liquidity, capital expenditures or capital resources that is material to investors.
Forward-Looking Statements
This Annual Report on Form 10-K includes “forward-looking statements” within the meaning of Section 21E of the Securities Exchange Act of 1934 and Section 27A of the Securities Act of 1933. Words such as “may,” “plan,” “should,” “could,” “expect,” “anticipate,” “intend,” “believe,” “project,” “forecast,” “estimate,” “continue,” variations of such terms or similar expressions are intended to identify such forward-looking statements within the meaning of the Private Securities Litigation Reform Act of 1995. These forward-looking statements, or other statements made by us, are made based on our expectations and beliefs concerning future events impacting us, and are subject to uncertainties and factors (including those specified below), which are difficult to predict and, in many instances, are beyond our control. As a result, our actual results could differ materially from those expressed in or implied by any such forward-looking statements, and investors are cautioned not to place undue reliance on such statements. We believe that the following factors, among others (including those described in Item 1A. “Risk Factors”), could affect our future performance and the liquidity and value of our securities and cause our actual results to differ materially from those expressed or implied by forward-looking statements made by us:
| • | concentration of revenues with few customers comprising a large majority of the revenues; |
| • | trends and expectations in revenue growth; |
43
Table of Contents
| • | our future level of investment in our business and the joint ventures in which we have invested, including investment in research, development and engineering of products and technology, development of our intellectual properties, the acquisition of new customers and development of new market opportunities; |
| • | our ability to improve margins; |
| • | anticipated expenses, costs, margins, provision for income taxes and investment activities in the foreseeable future, including estimated increases in stock-based compensation expenses through December 2015; |
| • | anticipated revenue to be generated from current contracts and as a result of new programs; |
| • | variability of contracted arrangements; |
| • | our profitability in future periods; |
| • | business opportunities that could require that we seek additional financing; |
| • | the size and growth of our markets; |
| • | the existence of international growth opportunities and our future investment in such opportunities; |
| • | the source of our future revenue; |
| • | our expected short-term and long-term liquidity positions; |
| • | our capital expenditure and working capital requirements and our ability to fund our capital expenditure and working capital needs through cash flow from operations; |
| • | capital market conditions, including the recent economic crisis, interest rate volatility and other limitations on the availability of capital, which could have an impact on our cost of capital and our ability to access the capital markets; |
| • | our use of cash, cash equivalents and marketable securities in upcoming quarters; |
| • | anticipated levels of backlog in future periods; |
| • | the success of our arrangements with Intellectual Ventures; |
| • | protection, development and monetization of our intellectual property portfolio; and |
| • | other risks detailed in our filings with the Securities and Exchange Commission, including the risk factors set forth in Item 1A. “Risk Factors.” |
We believe that the factors specified above and the risk factors contained in Item 1A, among others, could affect our future performance and the liquidity and value of our securities and cause our actual results to differ materially from those expressed or implied by forward-looking statements made by us or on our behalf. Investors should understand that it is not possible to predict or identify all risk factors and that there may be other factors that may cause our actual results to differ materially from the forward-looking statements. All forward-looking statements made by us or by persons acting on our behalf apply only as of the date of this Annual Report. We do not undertake any obligation to publicly update or revise any forward-looking statements to reflect future events, information or circumstances that arise after the date of the filing of this Annual Report on Form 10-K.
| ITEM 7A: | QUANTITATIVE AND QUALITATIVE DISCLOSURES ABOUT MARKET RISK |
Our exposure to market risk for changes in interest rates relates primarily to the increase or decrease in the amount of interest income we can earn on our investment portfolio. We do not use derivative financial instruments in our investment portfolio. We attempt to ensure the safety and preservation of our invested principal funds by limiting default risk, market risk and investment risk. We mitigate default risk by investing in low-risk securities. At December 31, 2011, we had an investment portfolio of money market funds, commercial
44
Table of Contents
securities and U.S. government securities, including those classified as cash and cash equivalents, and short- and long-term marketable securities, totaling $33.4 million. The original maturities of our investment portfolio range from 20 to 1,000 plus days with an average interest rate of 0.54%. If market interest rates were to increase immediately and uniformly by 10% from levels as of December 31, 2011, the decline of the fair market value of the fixed income portfolio would not be material.
| ITEM 8: | FINANCIAL STATEMENTS AND SUPPLEMENTARY DATA |
Our Financial Statements and the accompanying Notes that are filed as part of this Annual Report are listed under Part III, Item 15, Exhibits and Financial Statement Schedules and are set forth beginning on page F-1 immediately following the signature page of this Form 10-K.
| ITEM 9: | CHANGES IN AND DISAGREEMENTS WITH ACCOUNTANTS ON ACCOUNTING AND FINANCIAL DISCLOSURE |
On December 21, 2010, we dismissed Grant Thornton LLP (“GT”) as our independent registered public accounting firm. The decision to dismiss GT was approved by the Audit Committee of the Board of Directors.
During 2010, there was one disagreement with GT on a matter of accounting principles in which GT communicated that it disagreed with our proposed accounting treatment concerning revenue recognition related to the patent licensing arrangement entered into between us and IV Digital Multimedia Inventions, LLC, an affiliate of IV, on October 5, 2010. The Audit Committee has periodically discussed this matter and its status with GT. The accounting treatment for this transaction remained unresolved at the time of GT’s dismissal. We authorized GT to respond fully to the inquiries of its successor accountant, KPMG, concerning this disagreement.
As discussed in Note 4 of our Notes to Financial Statements, we are recognizing license revenue from the transaction with IV as payments become due and payable because of the extended nature of the payment terms. This resulted in $5,275 of revenue being recognized in our financial statements for the year ended December 31, 2010.
| ITEM 9A: | CONTROLS AND PROCEDURES |
Evaluation of Disclosure Controls and Procedures
Our management, with the participation of our Chief Executive Officer and Chief Financial Officer, have carried out an evaluation of the effectiveness of our disclosure controls and procedures (as defined in Rules 13a-15(e) and 15d-15(e) of the Securities Exchange Act of 1934) as of the end of the period covered by this Form 10-K.
Based on our evaluation, our Chief Executive Officer and Chief Financial Officer have concluded that our disclosure controls and procedures, as of the end of the period covered by this Form 10-K, were effective in ensuring that information required to be disclosed by us in reports that we file or submit under the Securities Exchange Act of 1934 is (i) recorded, processed, summarized and reported within the time periods specified in the SEC’s rules and forms, and (ii) accumulated and communicated to our management, including our principal executive officer and principal financial officer, as appropriate to allow timely decisions regarding required disclosure.
Management’s Report on Internal Control Over Financial Reporting
Management is responsible for establishing and maintaining adequate internal control over financial reporting as defined in Rules 13a-15(f) and 15d-15(f) under the Securities Exchange Act of 1934. Our internal control over financial reporting is a process designed to provide reasonable assurance regarding the reliability of financial reporting and the preparation of financial statements for external purposes in accordance with U.S. GAAP.
45
Table of Contents
Any control system, no matter how well conceived and operated, and because of inherent limitations, can provide only reasonable, not absolute, assurance that the objectives of the control system are met. Management is committed to continue monitoring our internal controls over financial reporting and will modify or implement additional controls and procedures that may be required to ensure the ongoing integrity of our financial statements.
With the participation of our Chief Executive Officer and Chief Financial Officer, management conducted an evaluation of the effectiveness of internal control over financial reporting based on the framework established in Internal Control—Integrated Framework issued by the Committee of Sponsoring Organizations of the Treadway Commission, (COSO). Based on this evaluation, management has concluded that internal control over financial reporting was effective as of the end of the period covered by this Form 10-K based on those criteria.
There was no change in our internal control over financial reporting that occurred during the quarter ended December 31, 2011 that has materially affected, or is reasonably likely to materially affect, our internal control over financial reporting.
Our independent auditors have issued an audit report on the effectiveness of our internal control over financial reporting as of December 31, 2011, which is included herein.
46
Table of Contents
Report of Independent Registered Public Accounting Firm
The Board of Directors and Shareholders
Digimarc Corporation:
We have audited Digimarc Corporation’s internal control over financial reporting as of December 31, 2011, based on criteria established in Internal Control—Integrated Framework issued by the Committee of Sponsoring Organizations of the Treadway Commission (COSO). Digimarc Corporation’s management is responsible for maintaining effective internal control over financial reporting and for its assessment of the effectiveness of internal control over financial reporting, included in the accompanying “Management’s Report on Internal Control Over Financial Reporting.” Our responsibility is to express an opinion on Digimarc Corporation’s internal control over financial reporting based on our audit.
We conducted our audit in accordance with the standards of the Public Company Accounting Oversight Board (United States). Those standards require that we plan and perform the audit to obtain reasonable assurance about whether effective internal control over financial reporting was maintained in all material respects. Our audit included obtaining an understanding of internal control over financial reporting, assessing the risk that a material weakness exists, and testing and evaluating the design and operating effectiveness of internal control based on the assessed risk. Our audit also included performing such other procedures as we considered necessary in the circumstances. We believe that our audit provides a reasonable basis for our opinion.
A company’s internal control over financial reporting is a process designed to provide reasonable assurance regarding the reliability of financial reporting and the preparation of financial statements for external purposes in accordance with generally accepted accounting principles. A company’s internal control over financial reporting includes those policies and procedures that (1) pertain to the maintenance of records that, in reasonable detail, accurately and fairly reflect the transactions and dispositions of the assets of the company; (2) provide reasonable assurance that transactions are recorded as necessary to permit preparation of financial statements in accordance with generally accepted accounting principles, and that receipts and expenditures of the company are being made only in accordance with authorizations of management and directors of the company; and (3) provide reasonable assurance regarding prevention or timely detection of unauthorized acquisition, use, or disposition of the company’s assets that could have a material effect on the financial statements.
Because of its inherent limitations, internal control over financial reporting may not prevent or detect misstatements. Also, projections of any evaluation of effectiveness to future periods are subject to the risk that controls may become inadequate because of changes in conditions, or that the degree of compliance with the policies or procedures may deteriorate.
In our opinion, Digimarc Corporation maintained, in all material respects, effective internal control over financial reporting as of December 31, 2011, based on criteria established in Internal Control—Integrated Framework issued by COSO.
We also have audited, in accordance with the standards of the Public Company Accounting Oversight Board (United States), the balance sheets of Digimarc Corporation as of December 31, 2011 and December 31, 2010, and the related statements of operations, shareholders’ equity, and cash flows for the years then ended, and our report dated February 24, 2012 expressed an unqualified opinion on those financial statements.
/s/ KPMG LLP
Portland, Oregon
February 24, 2012
47
Table of Contents
| ITEM 9B: | OTHER INFORMATION |
None.
48
Table of Contents
PART III
Certain information required by Part III of this Annual Report on Form 10-K is incorporated herein by reference to the Proxy Statement for our 2011 annual meeting of shareholders, which we intend to file no later than 120 days after the end of the fiscal year covered by this Annual Report on Form 10-K.
| ITEM 10: | DIRECTORS, EXECUTIVE OFFICERS AND CORPORATE GOVERNANCE |
Code of Ethics
We have adopted a Code of Business Conduct that applies to our principal executive officer, principal financial officer and controller, as well as a Code of Ethics for Financial Professionals that applies to our principal financial officer and controller. We have made these codes available in the Corporate Governance section of our website at www.digimarc.com/about/governance. If we waive, or implicitly waive, any material provision of the codes, or substantively amend the codes, we will disclose that fact on our website within four business days.
The other information required by this item is incorporated herein by reference to the information in the Proxy Statement, which we intend to file with the SEC no later than 120 days after the end of the fiscal year covered by this Annual Report on Form 10-K under the captions “Election of Directors,” “Management,” “Audit Committee,” and “Section 16(a) Beneficial Ownership Reporting Compliance.”
| ITEM 11: | EXECUTIVE COMPENSATION |
The information required by this item is incorporated herein by reference to the information in the Proxy Statement, which we intend to file with the SEC no later than 120 days after the end of the fiscal year covered by this Annual Report on Form 10-K, under the captions “Director Compensation,” and “Executive Compensation” “Compensation Committee Interlocks and Insider Participation” and “Compensation Committee Report.”
| ITEM 12: | SECURITY OWNERSHIP OF CERTAIN BENEFICIAL OWNERS AND MANAGEMENT AND RELATED STOCKHOLDER MATTERS |
The information required by this item is incorporated herein by reference to the information in the Proxy Statement, which we intend to file with the SEC no later than 120 days after the end of the fiscal year covered by this Annual Report on Form 10-K, under the captions “Security Ownership of Certain Beneficial Owners and Management” and “Equity Compensation Plan Information.”
| ITEM 13: | CERTAIN RELATIONSHIPS AND RELATED TRANSACTIONS, AND DIRECTOR INDEPENDENCE |
The information required by this item is incorporated herein by reference to the information in the Proxy Statement, which we intend to file with the SEC no later than 120 days after the end of the fiscal year covered by this Annual Report on Form 10-K under the caption “Election of Directors—Determination of Independence,” and “Related Person Transactions.”
| ITEM 14: | PRINCIPAL ACCOUNTANT FEES AND SERVICES |
The information required by this item is incorporated herein by reference to the information in the Proxy Statement, which we intend to file with the SEC no later than 120 days after the end of the fiscal year covered by this Annual Report on Form 10-K, under the caption “Audit Fees.”
49
Table of Contents
| ITEM 15: | EXHIBITS AND FINANCIAL STATEMENT SCHEDULES |
(a)(1) Financial Statements
The following documents are filed as part of this Annual Report on Form 10-K:
| (i) | Report of Independent Registered Public Accounting Firm – KPMG LLP |
| (ii) | Report of Independent Registered Public Accounting Firm – Grant Thornton LLP |
| (iii) | Balance Sheets as of December 31, 2011 and 2010 |
| (iv) | Statements of Operations for the years ended December 31, 2011, 2010 and 2009 |
| (v) | Statements of Shareholders’ Equity for the years ended December 31, 2011, 2010 and 2009 |
| (vi) | Statements of Cash Flows for the years ended December 31, 2011, 2010 and 2009 |
| (vii) | Notes to Financial Statements |
(a)(2) Financial Statement Schedules
All schedules have been omitted since they are not required or are not applicable or the required information is shown in the financial statements or related notes.
(a)(3) Exhibits
See the Exhibit Index at page E-1 of this Annual Report on Form 10-K.
(c) TVaura LLC Financial Statements (A Development Stage Company)
The following documents are filed as part of this Annual Report on Form 10-K:
| (i) | Report of Independent Registered Public Accounting Firm – KPMG LLP |
| (ii) | Balance Sheets as of December 31, 2011 and 2010 |
| (iii) | Statements of Operations for the years ended December 31, 2011 and 2010, and the Period June 11, 2009 (inception) through December 31, 2011 |
| (iv) | Statements of Members’ Equity for the years ended December 31, 2011 and 2010, and the Period June 11, 2009 (inception) through December 31, 2011 |
| (v) | Statements of Cash Flows for the years ended December 31, 2011 and 2010, and the Period June 11, 2009 (inception) through December 31, 2011 |
| (vi) | Notes to Financial Statements |
(c) TVaura Mobile LLC Financial Statements (A Development Stage Company)
The following documents are filed as part of this Annual Report on Form 10-K:
| (i) | Report of Independent Registered Public Accounting Firm – Ernst & Young |
| (ii) | Statements of Operations for the years ended December 31, 2011 and 2010, and the Period June 11, 2009 (inception) through December 31, 2011 |
| (iii) | Balance Sheets as of December 31, 2011 and 2010 |
| (iv) | Statements of Members’ Equity for the years ended December 31, 2011 and 2010, and the Period June 11, 2009 (inception) through December 31, 2011 |
| (v) | Statements of Cash Flows for the years ended December 31, 2011 and 2010, and the Period June 11, 2009 (inception) through December 31, 2011 |
| (vi) | Notes to Financial Statements |
50
Table of Contents
Pursuant to the requirements of Section 13 or 15(d) of the Securities Exchange Act of 1934, the registrant has duly caused this report to be signed on its behalf by the undersigned, thereunto duly authorized.
| DIGIMARC CORPORATION | ||||||
| Date: February 24, 2011 | By: | /s/ MICHAEL MCCONNELL | ||||
| Michael McConnell Title: Chief Financial Officer | ||||||
Pursuant to the requirements of the Securities Exchange Act of 1934, this report has been signed below by the following persons on behalf of the registrant and in the capacities and on the dates indicated:
| Signature |
Title |
Date | ||
| /S/ BRUCE DAVIS Bruce Davis |
Chief Executive Officer and Chairman of the Board of Directors (Principal Executive Officer) |
February 24, 2012 | ||
| /S/ MICHAEL MCCONNELL Michael McConnell |
Chief Financial Officer and Treasurer (Principal Financial and Accounting Officer) |
February 24, 2012 | ||
| /S/ PETER W. SMITH Peter W. Smith |
Director |
February 24, 2012 | ||
| /S/ JAMES T. RICHARDSON James T. Richardson |
Director |
February 24, 2012 | ||
| /S/ WILLIAM J. MILLER William J. Miller |
Director |
February 24, 2012 | ||
| /S/ BERNARD WHITNEY Bernard Whitney |
Director |
February 24, 2012 | ||
51
Table of Contents
DIGIMARC CORPORATION INDEX TO FINANCIAL STATEMENTS
| Page | ||||
| Report of Independent Registered Public Accounting Firm – KPMG LLP |
F-2 | |||
| Report of Independent Registered Public Accounting Firm – Grant Thornton LLP |
F-3 | |||
| F-4 | ||||
| F-5 | ||||
| F-6 | ||||
| F-7 | ||||
| F-8 | ||||
F-1
Table of Contents
Report of Independent Registered Public Accounting Firm
The Board of Directors and Shareholders
Digimarc Corporation:
We have audited the accompanying balance sheets of Digimarc Corporation as of December 31, 2011 and 2010 and the related statements of operations, shareholders’ equity, and cash flows for the years then ended. These financial statements are the responsibility of the Company’s management. Our responsibility is to express an opinion on these financial statements based on our audits.
We conducted our audits in accordance with the standards of the Public Company Accounting Oversight Board (United States). Those standards require that we plan and perform the audit to obtain reasonable assurance about whether the financial statements are free of material misstatement. An audit includes examining, on a test basis, evidence supporting the amounts and disclosures in the financial statements. An audit also includes assessing the accounting principles used and significant estimates made by management, as well as evaluating the overall financial statement presentation. We believe that our audits provide a reasonable basis for our opinion.
In our opinion, the financial statements referred to above present fairly, in all material respects, the financial position of Digimarc Corporation as of December 31, 2011 and December 31, 2010, and the results of its operations and its cash flows for the years then ended , in conformity with U.S. generally accepted accounting principles.
We also have audited, in accordance with the standards of the Public Company Accounting Oversight Board (United States), Digimarc Corporation’s internal control over financial reporting as of December 31, 2011, based on criteria established in Internal Control—Integrated Framework issued by the Committee of Sponsoring Organizations of the Treadway Commission (COSO) and our report dated February 24, 2012 expressed an unqualified opinion on the effectiveness of the Company’s internal control over financial reporting.
/s/ KPMG LLP
Portland, Oregon
February 24, 2012
F-2
Table of Contents
Report of Independent Registered Public Accounting Firm
Board of Directors and Shareholders
Digimarc Corporation
We have audited the accompanying statements of operations, shareholders’ equity and cash flows for the year ended December 31, 2009 of Digimarc Corporation (the “Company”). These financial statements are the responsibility of the Company’s management. Our responsibility is to express an opinion on these financial statements based on our audits.
We conducted our audits in accordance with the standards of the Public Company Accounting Oversight Board (United States). Those standards require that we plan and perform the audit to obtain reasonable assurance about whether the financial statements are free of material misstatement. An audit includes examining, on a test basis, evidence supporting the amounts and disclosures in the financial statements. An audit also includes assessing the accounting principles used and significant estimates made by management, as well as evaluating the overall financial statement presentation. We believe that our audits provide a reasonable basis for our opinion.
In our opinion, the financial statements referred to above present fairly, in all material respects, the results of operations and cash flows for the year ended December 31, 2009 in conformity with accounting principles generally accepted in the United States of America.
/s/ GRANT THORNTON LLP
Portland, Oregon
February 24, 2010
F-3
Table of Contents
BALANCE SHEETS
(In thousands, except share data)
| December 31, 2011 |
December 31, 2010 |
|||||||
| ASSETS | ||||||||
| Current assets: |
||||||||
| Cash and cash equivalents |
$ | 3,419 | $ | 6,340 | ||||
| Marketable securities |
22,244 | 28,441 | ||||||
| Trade accounts receivable, net |
3,502 | 3,481 | ||||||
| Other current assets |
1,306 | 1,345 | ||||||
|
|
|
|
|
|||||
| Total current assets |
30,471 | 39,607 | ||||||
| Marketable securities |
7,715 | 11,163 | ||||||
| Property and equipment, net |
1,395 | 1,330 | ||||||
| Intangibles, net |
2,808 | 2,174 | ||||||
| Investments in joint ventures |
415 | 1,029 | ||||||
| Deferred tax assets |
2,634 | — | ||||||
| Other assets |
355 | 462 | ||||||
|
|
|
|
|
|||||
| Total assets |
$ | 45,793 | $ | 55,765 | ||||
|
|
|
|
|
|||||
| LIABILITIES AND SHAREHOLDERS’ EQUITY | ||||||||
| Current liabilities: |
||||||||
| Accounts payable and other accrued liabilities |
$ | 952 | $ | 1,519 | ||||
| Deferred revenue |
2,660 | 2,562 | ||||||
|
|
|
|
|
|||||
| Total current liabilities |
3,612 | 4,081 | ||||||
| Deferred rent and other long-term liabilities |
464 | 525 | ||||||
|
|
|
|
|
|||||
| Total liabilities |
4,076 | 4,606 | ||||||
| Commitments and contingencies (Note 15) |
||||||||
| Shareholders’ equity: |
||||||||
| Preferred stock (10,000 shares issued and outstanding at December 31, 2011 and 2010) |
50 | 50 | ||||||
| Common stock (7,008,031 and 7,443,450 shares issued and outstanding at December 31, 2011 and 2010, respectively) |
7 | 7 | ||||||
| Additional paid-in capital |
34,511 | 49,609 | ||||||
| Retained earnings |
7,149 | 1,493 | ||||||
|
|
|
|
|
|||||
| Total shareholders’ equity |
41,717 | 51,159 | ||||||
|
|
|
|
|
|||||
| Total liabilities and shareholders’ equity |
$ | 45,793 | $ | 55,765 | ||||
|
|
|
|
|
|||||
See Notes to Financial Statements.
F-4
Table of Contents
STATEMENTS OF OPERATIONS
(In thousands, except per share data)
| Year
Ended December 31, 2011 |
Year
Ended December 31, 2010 |
Year
Ended December 31, 2009 |
||||||||||
| Revenue: |
||||||||||||
| Service |
$ | 12,395 | $ | 12,324 | $ | 10,845 | ||||||
| License and subscription |
23,644 | 18,826 | 8,226 | |||||||||
|
|
|
|
|
|
|
|||||||
| Total revenue |
36,039 | 31,150 | 19,071 | |||||||||
| Cost of revenue: |
||||||||||||
| Service |
6,638 | 6,464 | 6,090 | |||||||||
| License and subscription |
299 | 236 | 211 | |||||||||
|
|
|
|
|
|
|
|||||||
| Total cost of revenue |
6,937 | 6,700 | 6,301 | |||||||||
| Gross profit |
29,102 | 24,450 | 12,770 | |||||||||
| Operating expenses: |
||||||||||||
| Sales and marketing |
4,336 | 3,545 | 3,034 | |||||||||
| Research, development and engineering |
7,327 | 5,687 | 4,989 | |||||||||
| General and administrative |
9,956 | 7,864 | 6,299 | |||||||||
| Intellectual property |
1,094 | 1,203 | 1,013 | |||||||||
|
|
|
|
|
|
|
|||||||
| Total operating expenses |
22,713 | 18,299 | 15,335 | |||||||||
|
|
|
|
|
|
|
|||||||
| Operating income (loss) |
6,389 | 6,151 | (2,565 | ) | ||||||||
| Net loss from joint ventures |
(2,714 | ) | (2,180 | ) | (691 | ) | ||||||
| Interest income, net |
195 | 245 | 522 | |||||||||
|
|
|
|
|
|
|
|||||||
| Income (loss) before provision for income taxes |
3,870 | 4,216 | (2,734 | ) | ||||||||
| (Provision) benefit for income taxes |
1,786 | (42 | ) | (23 | ) | |||||||
|
|
|
|
|
|
|
|||||||
| Net income (loss) |
$ | 5,656 | $ | 4,174 | $ | (2,757 | ) | |||||
|
|
|
|
|
|
|
|||||||
| Earnings (loss) per share: |
||||||||||||
| Net income per share—basic |
$ | 0.84 | $ | 0.59 | $ | (0.39 | ) | |||||
| Net income per share—diluted |
$ | 0.76 | $ | 0.55 | $ | (0.39 | ) | |||||
| Weighted average shares outstanding— basic |
6,741 | 7,120 | 7,140 | |||||||||
| Weighted average shares outstanding—diluted |
7,430 | 7,623 | 7,140 | |||||||||
See Notes to Financial Statements.
F-5
Table of Contents
STATEMENTS OF SHAREHOLDERS’ EQUITY
(In thousands, except share data)
| Preferred stock | Common stock | Additional paid-in capital |
Retained Earnings (accumulated Deficit) |
Total shareholders’ equity |
||||||||||||||||||||||||
| Shares | Amount | Shares | Amount | |||||||||||||||||||||||||
| BALANCE AT DECEMBER 31, 2008 |
10,000 | $ | 50 | 7,279,442 | $ | 7 | $ | 48,268 | $ | 76 | $ | 48,401 | ||||||||||||||||
| Issuance of common stock |
— | — | 28,343 | — | 273 | — | 273 | |||||||||||||||||||||
| Issuance of restricted common stock |
— | — | 22,200 | — | — | — | — | |||||||||||||||||||||
| Purchase and retirement of common stock |
— | — | (124,284 | ) | — | (1,737 | ) | — | (1,737 | ) | ||||||||||||||||||
| Stock compensation expense |
— | — | — | — | 2,479 | — | 2,479 | |||||||||||||||||||||
| Net loss |
— | — | — | — | (2,757 | ) | (2,757 | ) | ||||||||||||||||||||
|
|
|
|
|
|
|
|
|
|
|
|
|
|
|
|||||||||||||||
| BALANCE AT DECEMBER 31, 2009 |
10,000 | 50 | 7,205,701 | 7 | 49,283 | (2,681 | ) | 46,659 | ||||||||||||||||||||
| Issuance of common stock |
— | — | 313,832 | — | 3,045 | — | 3,045 | |||||||||||||||||||||
| Issuance of restricted common stock |
— | — | 124,560 | — | — | — | — | |||||||||||||||||||||
| Purchase and retirement of common stock |
— | — | (200,643 | ) | — | (5,824 | ) | — | (5,824 | ) | ||||||||||||||||||
| Stock compensation expense |
— | — | — | — | 3,105 | — | 3,105 | |||||||||||||||||||||
| Net income |
— | — | — | — | — | 4,174 | 4,174 | |||||||||||||||||||||
|
|
|
|
|
|
|
|
|
|
|
|
|
|
|
|||||||||||||||
| BALANCE AT DECEMBER 31, 2010 |
10,000 | 50 | 7,443,450 | 7 | 49,609 | 1,493 | 51,159 | |||||||||||||||||||||
| Issuance of common stock |
— | — | 169,420 | — | 1,651 | — | 1,651 | |||||||||||||||||||||
| Issuance of restricted common stock |
— | — | 190,180 | — | — | — | — | |||||||||||||||||||||
| Purchase and retirement of common stock |
— | — | (795,019 | ) | — | (22,046 | ) | — | (22,046 | ) | ||||||||||||||||||
| Stock compensation expense |
— | — | — | — | 4,231 | — | 4,231 | |||||||||||||||||||||
| Tax benefit from stock-based awards |
— | — | — | — | 1,066 | — | 1,066 | |||||||||||||||||||||
| Net income |
— | — | — | — | — | 5,656 | 5,656 | |||||||||||||||||||||
|
|
|
|
|
|
|
|
|
|
|
|
|
|
|
|||||||||||||||
| BALANCE AT DECEMBER 31, 2011 |
10,000 | $ | 50 | 7,008,031 | $ | 7 | $ | 34,511 | $ | 7,149 | $ | 41,717 | ||||||||||||||||
|
|
|
|
|
|
|
|
|
|
|
|
|
|
|
|||||||||||||||
See Notes to Financial Statements.
F-6
Table of Contents
STATEMENTS OF CASH FLOWS
(In thousands)
| Year Ended December 31, 2011 |
Year Ended December 31, 2010 |
Year Ended December 31, 2009 |
||||||||||
| Cash flows from operating activities: |
||||||||||||
| Net income (loss) |
$ | 5,656 | $ | 4,174 | $ | (2,757 | ) | |||||
| Adjustments to reconcile net income (loss) to net cash provided by operating activities: |
||||||||||||
| Depreciation and amortization, property and equipment |
613 | 565 | 558 | |||||||||
| Amortization, intangibles |
124 | 79 | 31 | |||||||||
| Stock-based compensation expense |
4,216 | 3,068 | 2,444 | |||||||||
| Net loss from joint ventures |
2,714 | 2,180 | 691 | |||||||||
| Deferred income tax benefit |
(2,835 | ) | — | — | ||||||||
| Tax benefit from stock-based awards |
1,066 | — | — | |||||||||
| Excess tax benefit from stock-based awards |
(1,066 | ) | — | — | ||||||||
| Changes in operating assets and liabilities: |
||||||||||||
| Trade accounts receivable |
(21 | ) | 89 | 269 | ||||||||
| Other current assets |
240 | (473 | ) | 3 | ||||||||
| Other assets |
107 | (32 | ) | (283 | ) | |||||||
| Accounts payable and other accrued liabilities |
(668 | ) | 507 | (65 | ) | |||||||
| Deferred revenue |
88 | 275 | (112 | ) | ||||||||
|
|
|
|
|
|
|
|||||||
| Net cash provided by operating activities |
10,234 | 10,432 | 779 | |||||||||
| Cash flows from investing activities: |
||||||||||||
| Purchase of property and equipment |
(678 | ) | (781 | ) | (460 | ) | ||||||
| Capitalized patent costs |
(693 | ) | (914 | ) | (842 | ) | ||||||
| Investments in joint ventures |
(2,100 | ) | (2,800 | ) | (1,100 | ) | ||||||
| Sale or maturity of marketable securities |
74,689 | 122,176 | 43,708 | |||||||||
| Purchase of marketable securities |
(65,044 | ) | (127,878 | ) | (50,626 | ) | ||||||
|
|
|
|
|
|
|
|||||||
| Net cash provided by (used in) investing activities |
6,174 | (10,197 | ) | (9,320 | ) | |||||||
| Cash flows from financing activities: |
||||||||||||
| Issuance of common stock |
1,651 | 3,045 | 273 | |||||||||
| Purchase of common stock |
(22,046 | ) | (5,824 | ) | (1,737 | ) | ||||||
| Principal payments under capital lease obligations |
— | — | (39 | ) | ||||||||
| Excess tax benefit from stock-based awards |
1,066 | — | — | |||||||||
|
|
|
|
|
|
|
|||||||
| Net cash used in financing activities |
(19,329 | ) | (2,779 | ) | (1,503 | ) | ||||||
|
|
|
|
|
|
|
|||||||
| Net decrease in cash and cash equivalents |
(2,921 | ) | (2,544 | ) | (10,044 | ) | ||||||
| Cash and cash equivalents at beginning of period |
6,340 | 8,884 | 18,928 | |||||||||
|
|
|
|
|
|
|
|||||||
| Cash and cash equivalents at end of period |
$ | 3,419 | $ | 6,340 | $ | 8,884 | ||||||
|
|
|
|
|
|
|
|||||||
| Supplemental disclosure of cash flow information: |
||||||||||||
| Cash paid for income taxes |
$ | 13 | $ | 42 | $ | 23 | ||||||
| Supplemental schedule of non-cash investing activities: |
||||||||||||
| Stock-based compensation capitalized to patent costs |
$ | 65 | $ | 37 | $ | 35 | ||||||
See Notes to Financial Statements.
F-7
Table of Contents
NOTES TO FINANCIAL STATEMENTS
(In thousands, except share and per share data)
(1) Description of Business and Summary of Significant Accounting Policies
Description of Business
Digimarc Corporation (“Digimarc” or the “Company”), an Oregon corporation, enables governments and enterprises around the world to give digital identities to media and objects that computers can sense and recognize and to which they can react. The Company’s inventions provide the means to infuse persistent digital information, perceptible only to computers and digital devices, into all forms of media content. The unique digital identifier placed in media generally persists with it regardless of the distribution path and whether it is copied, manipulated or converted to a different format, and does not affect the quality of the content or the enjoyment or other traditional uses of it. The Company’s technology permits computers and digital devices to quickly and reliably identify relevant data from vast amounts of media content.
Use of Estimates
The preparation of financial statements in accordance with accounting principles generally accepted in the U.S. requires Digimarc to make estimates and judgments that affect the reported amounts of assets, liabilities, revenue and expenses, and related disclosure of contingent assets and liabilities. Certain of the Company’s accounting policies require higher degrees of judgment than others in their application. These include revenue recognition on long-term service contracts, impairments and estimation of useful lives of long-lived assets, contingencies and litigation, patent costs, stock-based compensation and income taxes (valuation allowance). Digimarc bases its estimates on historical experience and on various other assumptions that are believed to be reasonable in the circumstances, the results of which form the basis for making judgments about the carrying values of assets and liabilities that are not readily apparent from other sources. Actual results may differ from these estimates under different assumptions or conditions.
Reclassifications
Certain prior period amounts in the accompanying financial statements and notes thereto have been reclassified to conform to current period presentation. These reclassifications had no material effect on the results of operations or financial position for any period presented. Specifically, on the statements of operations, the “transitional services” line item has been reclassified with “general and administrative.”
Cash Equivalents
The Company considers all highly liquid marketable securities with original maturities of 90 days or less at the date of acquisition to be cash equivalents. Cash equivalents include money market funds, certificates of deposit, commercial paper, and investments in government bonds totaling $2,992 and $6,036 at December 31, 2011 and 2010, respectively. Cash equivalents are carried at cost or amortized cost, which approximates market.
Marketable Securities
The Company considers all investments with original maturities over 90 days that mature in less than one year to be short-term marketable securities. Both short- and long-term marketable securities include federal agency notes, company notes, and commercial paper. The Company’s marketable securities are classified as held-to-maturity as of the balance sheet date and are reported at amortized cost, which approximates market.
A decline in the market value of any security below cost that is deemed to be other-than-temporary results in a reduction in carrying amount of fair value. The impairment is charged to earnings and a new cost basis for the
F-8
Table of Contents
DIGIMARC CORPORATION
NOTES TO FINANCIAL STATEMENTS—(Continued)
(In thousands, except share and per share data)
security is established. To determine whether an impairment is other-than-temporary, the Company considers whether it has the ability and intent to hold the investment until a market price recovery and considers whether evidence indicating that the cost of the investment is recoverable outweighs evidence to the contrary. There have been no other-than-temporary impairments identified or recorded by the Company.
Premiums and discounts are amortized or accreted over the life of the related security as an adjustment to yield using a method that approximates the effective interest method. Under this method, dividend and interest income are recognized when earned.
Fair Value of Financial Instruments
Accounting Standards Codification (“ASC”) 820 “Fair Value Measurements and Disclosures” defines fair value, establishes a framework for measuring fair value under generally accepted accounting principles, and enhances disclosures about fair value measurements. ASC 820 describes a fair value hierarchy based on three levels of inputs, of which the first two are considered observable and the last unobservable, that may be used to measure fair value, which are the following:
| • | Level 1—Pricing inputs are quoted prices available in active markets for identical investments as of the reporting date. |
| • | Level 2—Pricing inputs are quoted for similar investments, or inputs that are observable, either directly or indirectly, for substantially the full term through corroboration with observable market data. Level 2 includes investments valued at quoted prices adjusted for legal or contractual restrictions specific to these investments. |
| • | Level 3—Pricing inputs are unobservable for the investment, that is, inputs that reflect the reporting entity’s own assumptions about the assumptions market participants would use in pricing the asset or liability. Level 3 includes private portfolio investments that are supported by little or no market activity. |
ASC 825 “Financial Instruments” allows an entity the irrevocable option to elect fair value for the initial and subsequent measurement for specified financial assets and liabilities on a contract-by-contract basis. The Company did not elect the fair value option under this statement as to specific assets or liabilities.
The estimated fair values of the Company’s financial instruments, which include cash and cash equivalents, short-term marketable securities, accounts receivable, accounts payable and other accrued liabilities approximate their carrying values due to the short-term nature of these instruments. The Company records marketable securities at amortized cost, which approximates fair value. The fair value is based on quoted market prices in active markets for identical assets, a Level 1 input.
| December 31, 2011 | December 31, 2010 | |||||||
| Marketable securities, at amortized cost |
$ | 32,054 | $ | 43,898 | ||||
| Cash equivalents, included above |
$ | 2,096 | $ | 4,294 | ||||
| Money market funds |
$ | 896 | $ | 1,742 | ||||
Concentrations of Business and Credit Risk
A significant portion of the Company’s business depends on a limited number of large contracts. The loss of any large contract may result in loss of revenue and margin on a prospective basis. Financial instruments that potentially subject Digimarc to concentrations of credit risk consist primarily of cash and cash equivalents,
F-9
Table of Contents
DIGIMARC CORPORATION
NOTES TO FINANCIAL STATEMENTS—(Continued)
(In thousands, except share and per share data)
marketable securities, and trade accounts receivable. Digimarc places its cash and cash equivalents with major banks and financial institutions and at times deposits may exceed insured limits. Other than cash used for operating needs, which may include short-term marketable securities with the Company’s principal banks, Digimarc’s investment policy limits its credit exposure to any one financial institution or type of financial instrument by limiting the maximum of 5% or $1,000, whichever is greater, to be invested in any one issuer except for the U.S. government and U.S. federal agencies, which have no limits, at the time of purchase. The Company’s investment policy also limits its credit exposure by limiting the maximum of 40% of its cash and cash equivalents and marketable securities, or $15,000, whichever is greater, to be invested in any one industry category, e.g., financial or energy industries, at the time of purchase. As a result, Digimarc’s credit risk associated with cash and cash equivalents and investments is believed to be minimal.
Equity Method Investments
The Company accounts for the joint ventures under the equity method of accounting pursuant to ASC 323 “Investments – Equity Method and Joint Ventures.” Under the equity method, investments are carried at cost, plus or minus the Company’s proportionate share, based on present ownership interests, of: (a) the investee’s profit or loss after the date of acquisition; (b) changes in the Company’s equity that have not been recognized in the investee’s profit or loss; and (c) certain other adjustments. Distributions received from the investee (such as dividends) reduce the carrying amount of the investment.
The Company reviews its equity investments for impairment whenever there is a loss in value of an investment which is other than a temporary decline. The Company conducts its equity investment impairment analyses in accordance with ASC 323, which requires the Company to record an impairment charge for a decrease in value of an investment when the decline in the investment is considered to be other than temporary.
Impairment of Long-Lived Assets
The Company accounts for long-lived assets in accordance with the provisions of ASC 360 “Property, Plant and Equipment.” This statement requires that long-lived assets and certain identifiable intangibles be reviewed for impairment whenever events or changes in circumstances indicate that the carrying amount of an asset may not be recoverable. Recoverability of assets to be held and used is measured by a comparison of the carrying amount of an asset to future net undiscounted cash flows expected to be generated by the asset. If such assets are considered to be impaired, the impairment to be recognized is measured by the amount by which the carrying amount of the assets exceeds the fair value of the assets. Fair value is determined based on discounted cash flows or appraised values, depending on the nature of the asset. Assets to be disposed of are reported at the lower of the carrying amount or fair value less costs to sell. Through December 31, 2011, there have been no such impairment losses.
Research and Development
Research and development costs are expensed as incurred as defined in ASC 730 “Research and Development.”
Software Development Costs
Under ASC 985 “Software,” software development costs are to be capitalized beginning when a product’s technological feasibility has been established and ending when a product is made available for general release to customers. To date, the establishment of technological feasibility of the Company’s products has occurred shortly before general release and, therefore, software development costs qualifying for capitalization have been immaterial. Accordingly, the Company has not capitalized any software development costs and has charged all such costs to research and development expense.
F-10
Table of Contents
DIGIMARC CORPORATION
NOTES TO FINANCIAL STATEMENTS—(Continued)
(In thousands, except share and per share data)
Patent Costs
Costs associated with the application and award of patents in the U.S. and various other countries are capitalized and amortized on a straight-line basis over the term of the patents as determined at award date, which varies depending on the pendency period of the application, generally approximating seventeen years. Capitalized patent costs include internal legal labor, including salaries, payroll taxes and benefits factor and incentive compensation related to our stock compensation plans, professional legal fees, government filing fees and translation fees related to obtaining the Company’s patent portfolio.
Costs associated with the maintenance and annuity fees of patents are accounted for as prepaid assets at the time of payment and amortized over the respective periods, generally from one to four years.
Revenue Recognition
See Note 3 for detail disclosures of the Company’s revenue recognition policy.
Stock-Based Compensation
ASC 718 “Compensation – Stock Compensation” requires the measurement and recognition of compensation for all stock-based awards made to employees and directors including stock options and restricted stock based on estimated fair values.
The Company uses the Black-Scholes option pricing model as its method of valuation for stock-based awards. The Company’s determination of the fair value of stock-based awards on the date of grant using an option pricing model is affected by its stock price as well as assumptions regarding a number of highly complex and subjective variables. These variables include, but are not limited to, the expected life of the award, the Company’s expected stock price volatility over the term of the award and actual and projected exercise behaviors. Although the fair value of stock-based awards is determined in accordance with ASC 718 and SAB No. 107 “Share-Based Payment,” the Black-Scholes option pricing model requires the input of highly subjective assumptions, and other reasonable assumptions could provide differing results.
Income Taxes
The Company accounts for income taxes under the asset and liability method. Under the asset and liability method, deferred income taxes reflect the future tax consequences of differences between the tax bases of assets and liabilities and their financial reporting amounts at each year-end. Deferred tax assets and liabilities are measured using enacted tax rates expected to apply to taxable income in the years in which those temporary differences are expected to be recovered or settled. The effect on deferred tax assets and liabilities of a change in tax rates is recognized in income in the period that includes the enactment date. Valuation allowances are established when necessary to reduce tax assets to the amount expected to be realized.
(2) Recent Accounting Pronouncements
In May 2011, the Financial Accounting Standards Board (“FASB”) issued Accounting Standards Update (“ASU”) No. 2011-04, “Fair Value Measurement: Amendments to Achieve Common Fair Value Measurement and Disclosure Requirements in U.S. GAAP and IFRS,” which provides common requirements for measuring fair value and for disclosing information about fair value measurements in accordance with U.S. generally accepted accounting principles (GAAP) and International Financial Reporting Standards (IFRS). The amendments of ASU No. 2011-04 are effective during interim and annual periods beginning after December 15, 2011. Early application is prohibited. The Company is assessing the potential impact of this standard, but does not expect the adoption of the standard will have a material impact on the financial condition or results of operations of the Company.
F-11
Table of Contents
DIGIMARC CORPORATION
NOTES TO FINANCIAL STATEMENTS—(Continued)
(In thousands, except share and per share data)
In April 2010, the FASB issued ASU No. 2010-17, “Revenue Recognition—Milestone Method (Topic 605): Milestone Method of Revenue Recognition, a consensus of the FASB Emerging Issues Task Force,” which provides guidance on defining a milestone and determining when it may be appropriate to apply the milestone method of revenue recognition for research or development transactions. ASU No. 2010-17 is effective for milestones achieved in fiscal years, and interim periods within those years, beginning on or after June 15, 2010. The Company has adopted the provisions of this standard and noted no material impact on the financial condition or results of operations of the Company.
In October 2009, the FASB issued ASU No. 2009-13, “Revenue Recognition: Multiple-Deliverable Revenue Arrangements—a consensus of the FASB Emerging Issues Task Force,” which eliminates the use of the residual method for allocating consideration, as well as the criteria that requires objective and reliable evidence of fair value of undelivered elements in order to separate the elements in a multiple-element arrangement. By removing the criterion requiring the use of objective and reliable evidence of fair value in separately accounting for deliverables, the recognition of revenue will more closely align with the economics of the revenue arrangements. The standard also replaces the term “fair value” in the revenue allocation guidance with “selling price” to clarify that the allocation of revenue is based on entity-specific assumptions rather than assumptions of a marketplace participant. ASU No. 2009-13 is effective for revenue arrangements entered or materially modified in fiscal years beginning on or after June 15, 2010. The Company has adopted the provisions of this standard and noted no material impact on the financial condition or results of operations of the Company.
(3) Revenue Recognition
We derive our revenue primarily from development services and licensing of our patent portfolio:
| • | Service revenue consists primarily of software development and consulting services. The majority of service revenue arrangements are structured as time and materials consulting agreements and fixed price consulting agreements. |
| • | License revenue, including royalty revenue, originates primarily from licensing the Company’s technology and patents where the Company receives royalties as its income stream. Subscription revenue, which includes the sale of web-based subscriptions related to various software products, is recurring in nature. |
Revenue is recognized in accordance with ASC 605 and 985 when the following four criteria are met:
| (i) | persuasive evidence of an arrangement exists, |
| (ii) | delivery has occurred, |
| (iii) | the fee is fixed or determinable, and |
| (iv) | collection is probable. |
Some customer arrangements encompass multiple deliverables, such as patent license, professional services, software subscriptions, and maintenance fees. For arrangements that include multiple deliverables, the Company identifies separate units of accounting at inception based on the consensus reached under ASC 605, which provides that revenue arrangements with multiple deliverables should be divided into separate units of accounting if certain criteria are met. The consideration for the arrangement is allocated to the separate units of accounting using the relative selling price method.
F-12
Table of Contents
DIGIMARC CORPORATION
NOTES TO FINANCIAL STATEMENTS—(Continued)
(In thousands, except share and per share data)
The relative selling price method allocates the consideration based on the Company’s specific assumptions rather than assumptions of a marketplace participant, and any discount in the arrangement proportionally to each deliverable on the basis of each deliverable’s selling price.
Applicable revenue recognition criteria are considered separately for each separate unit of accounting as follows:
| • | Revenue from professional service arrangements is generally determined based on time and materials. Revenue for professional services is recognized as the services are performed. Billing for services rendered generally occurs within one month after the services are provided. |
| • | License revenue is recognized when amounts owed to the Company have been earned, are fixed or determinable (within the Company’s normal 30 to 60 day payment terms), and collection is probable. If the payment terms extend beyond the Company’s normal 30 to 60 days, the fee may not be considered to be fixed or determinable, and the revenue would then be recognized when installments are due. |
| • | The Company records revenue from certain license agreements upon cash receipt as a result of collectability not being reasonably assured. |
| • | The Company’s standard payment terms for license arrangements are 30 to 60 days. Extended payment terms increase the likelihood the Company will grant a customer a concession, such as reduced license payments or additional rights, rather than hold firm on minimum commitments in an agreement to the point of losing a potential advocate and licensee of patented technology in the marketplace. Extended payment terms on patent license arrangements are not considered to be fixed or determinable if payments are due beyond the Company’s standard payment terms, primarily because of the risk of substantial modification present in the Company’s patent licensing business. As such, revenue on license arrangements with extended payment terms are recognized as fees become fixed and determinable. |
| • | Subscription revenue is accounted for under ASC 985. Subscription revenue are generally paid in advance and recognized over the term of the license, which is generally twelve months, or upon delivery and acceptance if the Company grants a perpetual license with no further obligations. |
Deferred revenue consists of billings in advance for professional services, licenses and subscriptions for which revenue has not been earned.
(4) Patent Licensing Arrangement with Intellectual Ventures
On October 5, 2010, the Company entered into a patent licensing arrangement with IV Digital Multimedia Inventions, LLC, a Delaware limited liability company affiliated with Intellectual Ventures (“IV”), pursuant to which the Company granted an exclusive license to sublicense, subject to pre-existing encumbrances and a grant-back license, 597 patents and 288 patent applications held by the Company.
The Company also assigned to IV the related causes of action and other enforcement rights and IV has the sole right, but not the obligation, to prepare, file, prosecute, maintain, defend and enforce the licensed patents at its expense. IV may at any time abandon its license or other rights to all or any of the licensed patents, in which case, certain licensed patents that IV opts to release revert back to the Company.
The Company also entered into a patent rights agreement pursuant to which the Company granted IV an exclusive call option to purchase all or any number of the licensed patents and/or patent applications. The
F-13
Table of Contents
DIGIMARC CORPORATION
NOTES TO FINANCIAL STATEMENTS—(Continued)
(In thousands, except share and per share data)
agreement further provides for the grant by IV to the Company the right to put all or any number of patents within the licensed patents to IV if IV threatens or commences an action or proceeding with respect to infringement of a licensed patent.
The financial aspects of the IV agreement for the Company include:
| • | a license issue fee of $36 million, paid to the Company in increasing quarterly installments over three years ($11,400 in 2011, $12,550 in 2012 and $6,775 in 2013); |
| • | 20% of the profits generated from the IV licensing program, which profits consist of sublicensing and other monetization revenue less specified expenses, including the license issue fee; |
| • | IV assumes responsibility for approximately $1 million per year in prosecution and maintenance costs previously borne by the Company; |
| • | a minimum of $4 million of paid support over five years from the Company to assist IV in maximizing the value of the licensed assets; and |
| • | a royalty-free grant-back license to the licensed patents to continue the Company’s existing business related to those assets, including maintaining and renewing existing patent licenses, and providing software and services. |
The payment terms extend beyond the Company’s normal 30 to 60 day payment terms, thus the license revenue is being recognized when the installments are due, and the support services will be recognized as the services are performed.
(5) Segment Information
Geographic Information
The Company derives its revenue from a single reporting segment: media management solutions. Revenue is generated in this segment through licensing of intellectual property, subscriptions to various products and services, and the delivery of services pursuant to contracts with various customers. The Company markets its products in the U.S. and in non-U.S. countries through its sales personnel.
Revenue, based upon the “bill-to” location, by geographic area is as follows:
| Year Ended December 31, 2011 |
Year Ended December 31, 2010 |
Year Ended December 31, 2009 |
||||||||||
| Domestic |
$ | 22,660 | $ | 19,034 | $ | 8,673 | ||||||
| International |
13,379 | 12,116 | 10,398 | |||||||||
|
|
|
|
|
|
|
|||||||
| Total |
$ | 36,039 | $ | 31,150 | $ | 19,071 | ||||||
|
|
|
|
|
|
|
|||||||
Major Customers
Customers who accounted for more than 10% of the Company’s revenues are as follows:
| Year Ended December 31, 2011 |
Year Ended December 31, 2010 |
Year Ended December 31, 2009 |
||||||||||
| IV |
33 | % | 18 | % | — | |||||||
| Central Banks |
27 | % | 30 | % | 46 | % | ||||||
| The Nielsen Company (“Nielsen”) |
11 | % | 12 | % | 24 | % | ||||||
| Arbitron |
— | 14 | % | — | ||||||||
F-14
Table of Contents
DIGIMARC CORPORATION
NOTES TO FINANCIAL STATEMENTS—(Continued)
(In thousands, except share and per share data)
(6) Stock-Based Compensation
Stock-based compensation includes expense charges for all stock-based awards to employees and directors. These awards include option grants and restricted stock awards.
Stock-based compensation expense related to internal legal labor is allocated to patent costs based on direct labor hours charged to capitalized patent costs.
Determining Fair Value
Preferred Stock
The Board of Directors authorized 10,000 shares of Series A Redeemable Nonvoting Preferred Stock (Series A Preferred) to be issued to the executive officers. The Series A Preferred has no voting rights, except as required by law, and may be redeemed at the option of the Company’s Board of Directors at any time on or after June 18, 2013.
The Series A Preferred is redeemable based on the stated fair value of $5.00 per share, and the related stock compensation expense is recognized over the non-redeemable period of 5 years, or 60 months, through June 2013 using the straight-line method. The Series A Preferred has no dividend rights and no rights to the undistributed earnings of the Company.
Stock Options
Valuation and Amortization Method. The Company estimates the fair value of stock-based awards granted on date of grant using the Black-Scholes option valuation model. The Company amortizes the fair value of all awards on a straight-line basis over the requisite service periods, which are generally the vesting periods.
Expected Life. The expected life of awards granted represents the period of time that they are expected to be outstanding. For 2011, for employee grants the Company determines the expected life based on historical experience with similar awards, giving consideration to the contractual terms, vesting schedules and pre-vesting and post-vesting forfeitures. For 2010 and 2009, for both employee and director grants, the Company determined the initial expected life based on a simplified method in accordance with SAB 110 “Share-Based Payment,” giving consideration to the contractual terms, vesting schedules and post-vesting forfeitures. Stock options granted generally vest over four years for employee grants and two years for director grants, and have contractual terms of ten years.
Expected Volatility. For 2011, for employee grants, the Company estimated the volatility of its common stock at the date of grant based on the historical volatility of its common stock based on historical prices over the most recent period commensurate with the estimated expected life of the award. For 2010, for both employee and director grants, the Company’s estimate of volatility was based on a 50/50 blend of the Company’s own historical volatility and an independent analysis of a peer group’s historical volatility, calculated on an individual entity basis, of its common stock based on historical stock prices over the most recent period commensurate with the estimated expected life of the award. For 2009, for both employee and Director grants, the Company’s estimate of volatility was based on an independent analysis of a peer group’s historical volatility of their common stock, calculated on an individual entity basis.
Risk-Free Interest Rate. The Company bases the risk-free interest rate used in the Black-Scholes option valuation model on an interest rate on a Treasury bond with a maturity commensurate with each expected life estimate.
F-15
Table of Contents
DIGIMARC CORPORATION
NOTES TO FINANCIAL STATEMENTS—(Continued)
(In thousands, except share and per share data)
Expected Dividend Yield. The Company has never paid any cash dividends on its common stock and does not anticipate paying any cash dividends in the foreseeable future. Consequently, the Company uses an expected dividend yield of zero in the Black-Scholes option valuation model.
A summary of the weighted average assumptions and results for options granted are as follows:
| 2011 | 2010 | 2009 | ||||
| Expected life (in years) |
5.28 – 5.75 | 5.2 – 6.0 | 5.64 | |||
| Expected volatility |
42% – 44% | 52% – 55% | 70.45% | |||
| Risk-free interest rate |
1.0% – 2% | 2.5% – 3.0% | 2.17% | |||
| Expected dividend yield |
0% | 0% | 0% |
| Year
Ended December 31, 2011 |
Year
Ended December 31, 2010 |
Year Ended December 31, 2009 |
||||||||||
| Fair value of stock options granted |
$ | 2,464 | $ | 1,159 | $ | 185 | ||||||
Expected Forfeitures. The Company uses a zero forfeiture rate for both the stock options granted to employees, which vest monthly, and the stock options granted to the Company’s directors. Initial option grants, for new directors, vest 50% on the first anniversary of the date of grant and then monthly thereafter, and annual option grants, for continuing directors, vest monthly. The Company records stock-based compensation expense only for those awards that are expected to vest, including awards made to Directors who are expected to continue with the Company through the year following the date of grant.
Restricted Stock
The Compensation Committee of the Board of Directors awarded restricted stock shares under the Company’s 2008 Stock Incentive Plan to certain employees. The shares subject to the restricted stock awards vest over a certain period, usually four years, following the date of the grant. Specific terms of the restricted stock awards are governed by Restricted Stock Agreements between the Company and the award recipients.
The fair value of restricted stock awards granted is based on the fair market value of the Company’s common stock on the date of the grant (measurement date), and is recognized over the vesting period of the related restricted stock using the straight-line method.
Stock-based Compensation
| Year
Ended December 31, 2011 |
Year
Ended December 31, 2010 |
Year
Ended December 31, 2009 |
||||||||||
| Stock-based compensation: |
||||||||||||
| Cost of revenue |
$ | 593 | $ | 373 | $ | 231 | ||||||
| Sales and marketing |
302 | 192 | 210 | |||||||||
| Research, development and engineering |
560 | 314 | 187 | |||||||||
| General and administrative |
2,568 | 2,083 | 1,747 | |||||||||
| Intellectual property |
193 | 106 | 69 | |||||||||
|
|
|
|
|
|
|
|||||||
| Stock compensation expense |
4,216 | 3,068 | 2,444 | |||||||||
| Capitalized to patent costs |
65 | 37 | 35 | |||||||||
|
|
|
|
|
|
|
|||||||
| Total stock-based compensation |
$ | 4,281 | $ | 3,105 | $ | 2,479 | ||||||
|
|
|
|
|
|
|
|||||||
F-16
Table of Contents
DIGIMARC CORPORATION
NOTES TO FINANCIAL STATEMENTS—(Continued)
(In thousands, except share and per share data)
At December 31, 2011, the Company had 10,000 shares of Series A redeemable nonvoting preferred stock, non-vested options to purchase 467,737 shares of common stock and 296,710 shares of restricted stock outstanding.
Total unrecognized compensation costs related to non-vested stock-based awards granted under all equity compensation plans, including preferred stock, options to purchase common stock and restricted stock are as follows:
| Year
Ended December 31, 2011 |
Year
Ended December 31, 2010 |
Year
Ended December 31, 2009 |
||||||||||
| Unrecognized compensation costs |
$ | 9,463 | $ | 6,212 | $ | 6,114 | ||||||
Total unrecognized compensation costs will be adjusted for any future changes in estimated forfeitures.
The Company expects to recognize this compensation cost for stock options and restricted stock over a weighted average periods through December 2015 as follows:
| Stock Options |
Restricted Stock |
|||||||
| Weighted average period |
1.11 years | 1.74 years | ||||||
Information regarding deferred stock compensation expense and information related to the assumptions used in the above calculations is further described in Note 11.
(7) Net Income Per Share
Net income per share is calculated in accordance with ASC 260 “Earnings Per Share,” which provides that basic and diluted net income per share for all periods presented are to be computed using the weighted average number of common shares outstanding during each period, with diluted net income per share including the effect of potentially dilutive common shares.
| Year Ended December 31, 2011 | Year Ended December 31, 2010 | |||||||||||||||||||||||
| Income (Numerator) |
Shares (in thousands) (Denominator) |
Per Share Amount |
Income (Numerator) |
Shares (in thousands) (Denominator) |
Per Share Amount |
|||||||||||||||||||
| Basic EPS |
||||||||||||||||||||||||
| Income available to common shareholders |
$ | 5,656 | 6,741 | $ | 0.84 | $ | 4,174 | 7,120 | $ | 0.59 | ||||||||||||||
|
|
|
|||||||||||||||||||||||
| Effect of Dilutive Securities |
||||||||||||||||||||||||
| Options |
393 | 440 | ||||||||||||||||||||||
| Restricted stock |
296 | 63 | ||||||||||||||||||||||
|
|
|
|
|
|||||||||||||||||||||
| Diluted EPS |
||||||||||||||||||||||||
| Income available to common shareholders |
$ | 5,656 | 7,430 | $ | 0.76 | $ | 4,174 | 7,623 | $ | 0.55 | ||||||||||||||
|
|
|
|
|
|
|
|
|
|||||||||||||||||
There were 136,957 common stock equivalents related to stock options that were anti-dilutive and excluded from diluted net income per share calculations for 2011 as their exercise prices were higher than the average market price of the underlying common stock for the period.
F-17
Table of Contents
DIGIMARC CORPORATION
NOTES TO FINANCIAL STATEMENTS—(Continued)
(In thousands, except share and per share data)
There were no common stock equivalents related to stock options that were anti-dilutive for 2010 because their exercise prices were lower than the average market price of the underlying common stock for the period.
| Year Ended December 31, 2009 | ||||||||||||
| Loss (Numerator) |
Shares (in thousands) (Denominator) |
Per Share Amount |
||||||||||
| Basic EPS |
||||||||||||
| Income available to common shareholders |
$ | (2,757 | ) | 7,140 | $ | (0.39 | ) | |||||
| Effect of Dilutive Securities |
||||||||||||
| Options |
— | |||||||||||
| Restricted stock |
— | |||||||||||
|
|
|
|||||||||||
| Diluted EPS |
||||||||||||
| Income available to common shareholders |
$ | (2,757 | ) | 7,140 | $ | (0.39 | ) | |||||
|
|
|
|
|
|||||||||
There were 152,563 common stock equivalents related to stock options that were anti-dilutive and excluded from diluted net income per share calculations for 2009 as their exercise prices were higher than the average market price of the underlying common stock for the period.
(8) Trade Accounts Receivable and Allowance for Doubtful Accounts
Trade Accounts Receivable
Trade accounts receivable are recorded at the invoiced amount and do not bear interest.
| December 31, 2011 | December 31, 2010 | |||||||
| Trade accounts receivable |
$ | 3,502 | $ | 3,481 | ||||
| Allowance for doubtful accounts |
— | — | ||||||
|
|
|
|
|
|||||
| Trade accounts receivable, net |
$ | 3,502 | $ | 3,481 | ||||
|
|
|
|
|
|||||
| Unpaid deferred revenues included in accounts receivable |
$ | 2,084 | $ | 2,045 | ||||
|
|
|
|
|
|||||
Allowance for doubtful accounts
The allowance for doubtful accounts is the Company’s best estimate of the amount of probable credit losses in the Company’s existing accounts receivable. The Company determines the allowance based on historical write-off experience and current information. The Company reviews its allowance for doubtful accounts monthly. Account balances are charged off against the allowance after all means of collection have been exhausted and the potential for recovery is considered remote.
Unpaid deferred revenues
The unpaid deferred revenues that are included in accounts receivable are billed in accordance with the provisions of the contracts with the Company’s customers. Unpaid deferred revenues from the Company’s cash-basis revenue recognition customers are not included in accounts receivable nor deferred revenue accounts.
F-18
Table of Contents
DIGIMARC CORPORATION
NOTES TO FINANCIAL STATEMENTS—(Continued)
(In thousands, except share and per share data)
Major customers
Customers who accounted for more than 10% of accounts receivable, net are as follows:
| December 31, 2011 | December 31, 2010 | |||||||
| Central Banks |
45 | % | 43 | % | ||||
| Nielsen |
29 | % | 29 | % | ||||
| Civolution |
14 | % | 11 | % | ||||
(9) Property and Equipment
Property and Equipment
Property and equipment are stated at cost. Repairs and maintenance are charged to expense when incurred.
Depreciation on property and equipment is calculated using the straight-line method over the estimated useful lives of the assets, generally two to seven years.
Leasehold improvements are amortized by the straight-line method over the shorter of the estimated useful life or the lease term.
| December 31, 2011 | December 31, 2010 | |||||||
| Office furniture and fixtures |
$ | 410 | $ | 294 | ||||
| Equipment |
1,872 | 1,365 | ||||||
| Leasehold improvements |
1,041 | 986 | ||||||
|
|
|
|
|
|||||
| 3,323 | 2,645 | |||||||
| Less accumulated depreciation and amortization |
(1,928 | ) | (1,315 | ) | ||||
|
|
|
|
|
|||||
| $ | 1,395 | $ | 1,330 | |||||
|
|
|
|
|
|||||
Leases
Future minimum lease payments under non-cancelable operating leases are as follows:
| Year ending December 31: |
Operating Leases |
|||
| 2012 |
$ | 824 | ||
| 2013 |
848 | |||
| 2014 |
861 | |||
| 2015 |
886 | |||
| 2016 |
611 | |||
| Thereafter |
— | |||
|
|
|
|||
| Total minimum lease payments |
$ | 4,030 | ||
|
|
|
|||
Rent expense on the operating leases are as follows:
| Year Ended December 31, 2011 |
Year Ended December 31, 2010 |
Year Ended December 31, 2009 |
||||||||||
| Rent expense |
$ | 866 | $ | 832 | $ | 765 | ||||||
F-19
Table of Contents
DIGIMARC CORPORATION
NOTES TO FINANCIAL STATEMENTS—(Continued)
(In thousands, except share and per share data)
(10) Intangible Assets—Purchase and Capitalized Patent Costs
Intangible assets are reviewed for impairment whenever events or changes in circumstances indicate that the carrying amount of an asset may not be recoverable.
| December 31, 2011 | December 31, 2010 | |||||||
| Gross intangible assets |
$ | 3,048 | $ | 2,290 | ||||
| Accumulated amortization |
(240 | ) | (116 | ) | ||||
|
|
|
|
|
|||||
| Intangible assets, net |
$ | 2,808 | $ | 2,174 | ||||
|
|
|
|
|
|||||
(11) Shareholders’ Equity
Preferred Stock
In June 2008, the Board of Directors authorized 2,500,000 shares of preferred stock, par value $0.001 per share. The Board of Directors has the authority to issue the undesignated preferred stock in one or more series and to determine the powers, preferences and rights and the qualifications, limitations or restrictions granted to or imposed upon any wholly unissued series of undesignated preferred stock and to fix the number of shares constituting any series and the designation of such series, without any further vote or action by the shareholders. The issuance of preferred stock may have the effect of delaying, deferring or preventing a change of control of the Company without further action by shareholders and may adversely affect the voting and other rights of the holders of common stock.
Ten thousand shares of the authorized preferred stock have been designated as Series A Preferred. In the event of the liquidation, dissolution or other winding up of Digimarc, before any payment or distribution is made to the holders of common stock, holders of the Series A Preferred will be entitled to receive a value of $5.00 per share of Series A Preferred held by the shareholder. The Series A Preferred has no voting rights, except as required by law, and may be redeemed by the Board of Directors at any time on or after June 18, 2013.
Following the spin-off, the Company issued to the executive officers an aggregate of 10,000 shares of Series A Preferred.
Common Stock
In June 2008, the Board of Directors authorized 50,000,000 shares of common stock, par value $0.001 per share. The holders of Digimarc common stock are entitled to one vote for each share held of record on all matters submitted to a vote of our shareholders, including the election of directors. Subject to preferences that may be granted to any then outstanding preferred stock, holders of common stock are entitled to receive ratably those dividends as may be declared by the Board of Directors out of funds legally available for such purpose, as well as any distributions to the Company’s shareholders. The Series A Preferred does not have any dividend preferences. In the event of the Company’s liquidation, dissolution or winding up, holders of common stock are entitled to share ratably in all of the Company’s assets remaining after payment of liabilities and the liquidation preference of any then outstanding preferred stock. Holders of common stock have no preemptive or other subscription or conversion rights. There are no redemption or sinking fund provisions applicable to the common stock. All outstanding shares of common stock are fully paid and non-assessable.
Stock Incentive Plan
On July 31, 2008 the Company’s Board of Directors initially adopted the 2008 Incentive Plan, or the 2008 Plan. The 2008 Plan provides for the grant of stock options, stock appreciation rights, stock awards, restricted
F-20
Table of Contents
DIGIMARC CORPORATION
NOTES TO FINANCIAL STATEMENTS—(Continued)
(In thousands, except share and per share data)
stock, stock units, performance shares, performance units, and cash-based awards, which may be granted to officers, directors, employees, consultants, agents, advisors and independent contractors who provide services to the Company and its affiliated companies.
The 2008 Plan authorizes the issuance of up to 2,500,000 shares of common stock. The shares authorized under the 2008 Plan are subject to adjustment in the event of a stock split, stock dividend, recapitalization or similar event. Shares issued under the 2008 Plan will consist of authorized and unissued shares or shares held by the Company as treasury shares. If an award granted under the 2008 Plan lapses, expires, terminates or is forfeited or surrendered without having been fully exercised or without the issuance of all the shares subject to the award, the shares covered by that award will again be available for use under the 2008 Plan. Shares that are (i) tendered by a participant or retained by the Company as payment for the purchase price of an award or to satisfy tax withholding obligations or (ii) covered by an award that is settled in cash, or in some manner that some or all of the shares covered by the award are not issued, will be available for issuance under the 2008 Plan. In addition, awards granted as substitute awards in connection with acquisition transactions will not reduce the number of shares authorized for issuance under the 2008 Plan.
Stock Options
As of December 31, 2011, under all of the Company’s stock-based compensation plans, equity awards to purchase an additional 838,393 shares were authorized for future grants under the plans. The Company issues new shares upon option exercises. Options granted, exercised, canceled and expired under the stock incentive plan are summarized as follows:
| Number of Shares |
Weighted Average Exercise Price |
Weighted Average Grant Date Fair Value |
Aggregate Intrinsic Value |
|||||||||||||
| Options outstanding, December 31, 2008 |
1,194,000 | $ | 9.64 | $ | 6.28 | |||||||||||
| Granted |
30,000 | $ | 9.91 | $ | 6.16 | |||||||||||
| Exercised |
(28,343 | ) | $ | 9.64 | $ | 6.30 | ||||||||||
| Canceled |
(28,334 | ) | $ | 9.64 | $ | 6.28 | ||||||||||
|
|
|
|||||||||||||||
| Options outstanding, December 31, 2009 |
1,167,323 | $ | 9.65 | $ | 6.28 | |||||||||||
| Granted |
140,000 | $ | 15.64 | $ | 8.28 | |||||||||||
| Exercised |
(313,832 | ) | $ | 9.70 | $ | 6.32 | ||||||||||
| Canceled |
— | — | — | |||||||||||||
|
|
|
|||||||||||||||
| Options outstanding, December 31, 2010 |
993,491 | $ | 10.47 | $ | 6.55 | |||||||||||
| Granted |
215,000 | $ | 27.84 | $ | 11.46 | |||||||||||
| Exercised |
(169,420 | ) | $ | 9.75 | $ | 6.33 | ||||||||||
| Canceled |
(10,833 | ) | $ | 9.64 | $ | 6.28 | ||||||||||
|
|
|
|||||||||||||||
| Options outstanding, December 31, 2011 |
1,028,238 | $ | 14.23 | $ | 7.61 | $ | 10,779 | |||||||||
|
|
|
|||||||||||||||
| Options exercisable, December 31, 2011 |
560,501 | $ | 11.25 | $ | 7,199 | |||||||||||
| Options unvested, December 31, 2011 |
467,737 | $ | 17.81 | $ | 3,580 | |||||||||||
The aggregate intrinsic value is based on the closing price of $23.89 per share of Digimarc common stock on December 31, 2011, which would have been received by the optionees had all of the options with exercise prices less than $23.89 per share been exercised on that date.
F-21
Table of Contents
DIGIMARC CORPORATION
NOTES TO FINANCIAL STATEMENTS—(Continued)
(In thousands, except share and per share data)
The following table summarizes information about stock options outstanding at December 31, 2011:
| Options Outstanding | Options Exercisable | |||||||||||||||||||
| Exercise Price | Number Outstanding |
Remaining Contractual Life (Years) |
Weighted Average Price |
Number Exercisable |
Weighted Average Price |
|||||||||||||||
| $9.64 – $9.91 |
680,322 | 6.85 | $ | 9.65 | 464,909 | $ | 9.66 | |||||||||||||
| $14.99 – $18.01 |
132,916 | 8.08 | $ | 15.67 | 75,626 | $ | 16.88 | |||||||||||||
| $24.35 – $30.01 |
215,000 | 9.57 | $ | 27.84 | 19,966 | $ | 29.68 | |||||||||||||
|
|
|
|
|
|||||||||||||||||
| $9.64 – $30.01 |
1,028,238 | 7.58 | $ | 14.23 | 560,501 | $ | 11.25 | |||||||||||||
|
|
|
|
|
|||||||||||||||||
Restricted Stock
The Compensation Committee of the Board of Directors awarded restricted stock shares under the Company’s 2008 Plan to certain employees. The shares subject to the restricted stock awards will vest over a certain period, usually four years, following the date of the grant. Specific terms of the restricted stock awards and performance vesting share awards are governed by Restricted Stock Agreements between the Company and the award recipients. The following table reconciles the unvested balance of restricted stock:
| Number of Shares |
Weighted Average Grant Date Fair Value |
|||||||
| Unvested balance, December 31, 2008 |
121,000 | $ | 9.64 | |||||
| Granted |
22,200 | $ | 11.55 | |||||
| Vested |
(32,200 | ) | $ | 9.64 | ||||
| Canceled |
— | — | ||||||
|
|
|
|||||||
| Unvested balance, December 31, 2009 |
111,000 | $ | 10.02 | |||||
| Granted |
124,560 | $ | 16.77 | |||||
| Vested |
(34,350 | ) | $ | 9.89 | ||||
| Canceled |
(3,450 | ) | $ | 13.05 | ||||
|
|
|
|||||||
| Unvested balance, December 31, 2010 |
197,760 | $ | 14.25 | |||||
| Granted |
190,180 | $ | 29.12 | |||||
| Vested |
(73,110 | ) | $ | 20.82 | ||||
| Canceled |
(18,120 | ) | $ | 19.24 | ||||
|
|
|
|||||||
| Unvested balance, December 31, 2011 |
296,710 | $ | 21.90 | |||||
|
|
|
|||||||
(12) Defined Contribution Pension Plan
The Company sponsors an employee savings plan (the “Plan”) which qualifies as a deferred salary arrangement under Section 401(k) of the Internal Revenue Code. The Plan combines both an employee savings plan and company matching plan into one plan under Section 401(k), including a 401(k) Roth option. Employees become eligible to participate in the Plan at the beginning of the month following the employee’s hire date. Employees may contribute up to 75% of their pay to the Plan, subject to the limitations of the Internal Revenue Code. Company matching contributions are mandatory. The previous Plan was terminated as of December 31, 2008.
F-22
Table of Contents
DIGIMARC CORPORATION
NOTES TO FINANCIAL STATEMENTS—(Continued)
(In thousands, except share and per share data)
The Company made matching contributions in the aggregate amount as follows:
| Year
Ended December 31, 2011 |
Year
Ended December 31, 2010 |
Year
Ended December 31, 2009 |
||||||||||
| Matching contributions |
$ | 349 | $ | 323 | $ | 323 | ||||||
(13) Joint Venture and Related Party Transactions
On June 11, 2009 the Company entered into two joint venture agreements with Nielsen to launch two new companies. The two joint venture agreements and a revised patent license agreement expand and replace the previous license and services agreement between the Company and Nielsen that had been in operation since late 2007. Under the new agreements, the Company and Nielsen are working together to develop new products and services, including the expansion and deployment of those products and services that were in development under the prior agreement.
Under the terms of the patent license agreement, Nielsen agreed to pay Digimarc $18,750 during the period from July 2009 through January 2014, and Digimarc granted to Nielsen a non-exclusive license to Digimarc’s patents for use within Nielsen’s business. Unless earlier terminated in accordance with the agreement, the license will continue until the expiration of the last to expire of the licensed patents. The payment terms extend beyond the Company’s normal 30 to 60 day payment terms, thus the license revenue is being recognized when the installments are due.
Joint Venture I, TVaura LLC, is engaged in the development of copyright filtering solutions, royalty/audit solutions for online video and audio rights organizations, guilds or other organizations involved in the reconciliation of royalties, residuals and other payments, and other related products. Each of the Company and Nielsen made initial cash contributions aggregating $3,900 payable quarterly from July 2009 through October 2011. The Company provided technical and development services to TVaura LLC’s business of minimum service fees, subject to adjustment for any development service fees paid to the Company by TVaura Mobile LLC, totaling $6,670 during the period 2009 through 2011. Service revenue was recognized as the services are performed.
Joint Venture II, TVaura Mobile LLC, is engaged in the development of certain enhanced television offerings, and other related products. Each of the Company and Nielsen made initial cash contributions aggregating $2,800 payable quarterly from July 2009 through October 2011.
Upon mutual agreement, the October 2011 payment aggregating $0.7 million to both joint ventures was delayed to 2012.
Pursuant to the terms of the agreements and ASC 810 “Consolidation,” the joint ventures are not consolidated with the Company as the minority shareholder has substantive participating rights, or veto rights, such that no shareholder has majority control.
F-23
Table of Contents
DIGIMARC CORPORATION
NOTES TO FINANCIAL STATEMENTS—(Continued)
(In thousands, except share and per share data)
Related Party Transactions
| Year Ended December 31, 2011 |
Year Ended December 31, 2010 |
|||||||
| TVaura LLC: |
||||||||
| Capital contributions |
$ | 1,200 | $ | 1,600 | ||||
| Revenue (1) |
$ | 2,640 | $ | 2,723 | ||||
| TVaura Mobile LLC: |
||||||||
| Capital contributions |
$ | 900 | $ | 1,200 | ||||
| Total: |
||||||||
| Capital contributions |
$ | 2,100 | $ | 2,800 | ||||
| Revenue (1) |
$ | 2,640 | $ | 2,723 | ||||
| (1) | Technical and development services |
| December 31, 2011 | December 31, 2010 | |||||||
| TVaura LLC: |
||||||||
| Accounts receivable |
$ | 164 | $ | 255 | ||||
| TVaura Mobile LLC: |
||||||||
| Accounts receivable |
$ | — | $ | — | ||||
Summarized financial data for TVaura LLC:
| December 31, 2011 | December 31, 2010 | |||||||
| Current assets |
$ | 402 | $ | 777 | ||||
| Noncurrent assets |
$ | 22 | $ | 31 | ||||
| Current liabilities |
$ | 169 | $ | 255 | ||||
| Noncurrent liabilities |
$ | — | $ | — | ||||
| Year
Ended December 31, 2011 |
Year
Ended December 31, 2010 |
Period June 11, 2009 Through December 31, 2009 |
||||||||||
| (unaudited) | ||||||||||||
| Revenue |
$ | — | $ | — | $ | — | ||||||
| Gross profit |
$ | — | $ | — | $ | — | ||||||
| Operating expenses |
$ | 2,699 | $ | 2,825 | $ | 1,223 | ||||||
| Net loss from continuing operations |
$ | (2,699 | ) | $ | (2,824 | ) | $ | (1,223 | ) | |||
| The Company’s pro-rata share—net loss |
$ | (1,376 | ) | $ | (1,440 | ) | $ | (624 | ) | |||
Summarized financial data for TVaura Mobile LLC:
| December 31, 2011 | December 31, 2010 | |||||||
| Current assets |
$ | 1,308 | $ | 1,913 | ||||
| Noncurrent assets |
$ | — | $ | — | ||||
| Current liabilities |
$ | 720 | $ | 382 | ||||
| Noncurrent liabilities |
$ | — | $ | — | ||||
F-24
Table of Contents
DIGIMARC CORPORATION
NOTES TO FINANCIAL STATEMENTS—(Continued)
(In thousands, except share and per share data)
| Year
Ended December 31, 2011 |
Year Ended December 31, 2010 |
Period June 11, 2009 Through December 31, 2009 |
||||||||||
| (unaudited) | ||||||||||||
| Revenue |
$ | 105 | $ | — | $ | — | ||||||
| Operating expenses |
$ | 2,848 | $ | 1,532 | $ | 137 | ||||||
| Net loss from continuing operations |
$ | (2,743 | ) | $ | (1,532 | ) | $ | (137 | ) | |||
| The Company’s pro-rata share—net loss |
$ | (1,338 | ) | $ | (740 | ) | $ | (67 | ) | |||
(14) Income Taxes
For the year ended December 31, 2011, the provision for income taxes reflects current tax expense, deferred tax benefit, and withholding tax expense in various foreign jurisdictions. The withholding taxes are computed by Digimarc’s customers and paid to foreign jurisdictions on its behalf. Excess tax benefits associated with stock compensation were being utilized in 2011 to offset tax payable and credit additional paid-in capital. A deferred tax benefit resulted primarily from the release of the valuation allowance during the second quarter of 2011. During the year ended December 31, 2011, Digimarc concluded, based on an analysis of all the facts, including projections of future income, that it is more likely than not that its deferred tax assets will be realized.
For the year ended December 31, 2010 there was no provision for income taxes related to net income because the computed amount was completely offset with available federal and state attribute carryforwards and net deferred taxes were offset by a full valuation allowance. For the year ended December 31, 2009, there was no provision for current income taxes related to net income because the computation of taxable income resulted in a net operating loss for the period and net deferred tax assets were offset by a full valuation allowance.
Components of tax expense (benefit) allocated to continuing operations include the following:
| Year Ended December 31, 2011 |
Year Ended December 31, 2010 |
Year Ended December 31, 2009 |
||||||||||
| Current: |
||||||||||||
| Federal |
$ | 1,066 | $ | — | $ | — | ||||||
| State |
3 | — | — | |||||||||
| Foreign |
(20 | ) | 42 | 23 | ||||||||
|
|
|
|
|
|
|
|||||||
| Sub-total |
1,049 | 42 | 23 | |||||||||
| Deferred: |
||||||||||||
| Federal |
(2,470 | ) | — | — | ||||||||
| State |
(365 | ) | — | — | ||||||||
| Foreign |
— | — | — | |||||||||
|
|
|
|
|
|
|
|||||||
| Sub-total |
(2,835 | ) | — | — | ||||||||
|
|
|
|
|
|
|
|||||||
| Total tax (benefit) expense |
$ | (1,786 | ) | $ | 42 | $ | 23 | |||||
|
|
|
|
|
|
|
|||||||
F-25
Table of Contents
DIGIMARC CORPORATION
NOTES TO FINANCIAL STATEMENTS—(Continued)
(In thousands, except share and per share data)
The reconciliation of the statutory federal income tax rate to the Company’s effective income tax rate is as follows:
| Year
Ended December 31, 2011 |
% | Year
Ended December 31, 2010 |
% | Year
Ended December 31, 2009 |
% | |||||||||||||||||||
| Income taxes computed at statutory rates |
$ | 1,316 | 34 | % | $ | 1,434 | 34 | % | $ | (929 | ) | (34 | )% | |||||||||||
| Increases (decreases) resulting from: |
||||||||||||||||||||||||
| State income taxes, net of federal tax benefit |
194 | 5 | % | 220 | 5 | % | (143 | ) | (5 | )% | ||||||||||||||
| Federal and state research and experimentation credits |
(784 | ) | (20 | )% | (353 | ) | — | (299 | ) | (11 | )% | |||||||||||||
| Change in valuation allowance |
(2,581 | ) | (67 | )% | (1,275 | ) | (32 | )% | 1,343 | 49 | % | |||||||||||||
| Other |
69 | 2 | % | 16 | — | 51 | 2 | % | ||||||||||||||||
|
|
|
|
|
|
|
|
|
|
|
|
|
|||||||||||||
| Total |
$ | (1,786 | ) | (46 | )% | $ | 42 | 7 | % | $ | 23 | 1 | % | |||||||||||
|
|
|
|
|
|
|
|
|
|
|
|
|
|||||||||||||
Deferred income taxes reflect the net tax effects of temporary differences between the carrying amounts of assets and liabilities for financial reporting purposes and the amounts used for income tax purposes. The tax effects of significant items comprising the Company’s deferred tax assets and deferred tax liabilities are as follows:
| December 31, 2011 |
December 31, 2010 |
|||||||
| Deferred tax assets: |
||||||||
| Goodwill |
$ | 1,254 | $ | 1,369 | ||||
| Stock based compensation |
1,976 | 1,239 | ||||||
| Fixed asset differences |
— | 153 | ||||||
| Deferred rent |
190 | 55 | ||||||
| Federal and state research and experimentation credits |
458 | 681 | ||||||
| Other |
21 | 3 | ||||||
|
|
|
|
|
|||||
| Total gross deferred tax assets |
3,899 | 3,500 | ||||||
| Less valuation allowance |
— | (2,581 | ) | |||||
|
|
|
|
|
|||||
| Net deferred tax assets |
$ | 3,899 | $ | 919 | ||||
|
|
|
|
|
|||||
| Deferred tax liabilities: |
||||||||
| Fixed asset differences |
$ | (13 | ) | $ | — | |||
| Patent expenditures |
(1,051 | ) | (919 | ) | ||||
|
|
|
|
|
|||||
| Total deferred tax liabilities |
$ | (1,064 | ) | $ | (919 | ) | ||
|
|
|
|
|
|||||
| Net deferred tax asset |
$ | 2,835 | $ | — | ||||
|
|
|
|
|
|||||
During the year ended December 31, 2011, the Company determined that it was more likely than not that the net deferred tax assets would be realized and the entire valuation allowance in the amount of $2,581 was released. For the year ended December 31, 2010, the Company’s valuation allowance decreased by $1,313, including $38 out of period adjustments. For the year ended December 31, 2009, the Company’s valuation allowance increased by $1,549, including $119 out of period adjustments, $51 due to an adjustment to the rate applied to deferreds, and $36 that will impact additional paid-in capital.
As of December 31, 2011, the Company has federal and state net operating loss carry-forwards of $3,196 and $3,095, respectively, which have a carry-forward of 14 - 19 years depending on the jurisdiction and for which the benefits upon usage will be recorded in additional paid in capital (“APIC”) from the effects of stock
F-26
Table of Contents
DIGIMARC CORPORATION
NOTES TO FINANCIAL STATEMENTS—(Continued)
(In thousands, except share and per share data)
options. As of December 31, 2011, the Company has federal and state research and experimental tax credits of $1,312 and $520, respectively, which have a carry-forward of 5 – 20 years depending on the jurisdiction and for which $882 and $477, respectively, upon usage will be recorded in APIC from the effects of stock options. As of December 31, 2011, the Company has foreign tax credits of $56 which have a carry-forward of 8 – 10 years and for which the benefits upon usage will be recorded in APIC from the effects of stock options.
As part of the ASC 740 “Income Taxes” implementation, the Company adopted a policy to record accrued interest and penalties associated with uncertain tax positions in income tax expense in the statements of operations. On initial adoption of ASC 740 and through December 31, 2010, the Company recognized no uncertain tax positions nor accrued interest and penalties associated with uncertain tax positions. For the year ended December 31, 2011 the Company recognized uncertain tax positions and no accrued interest and penalties associated with uncertain tax positions. The Company does not anticipate any unrecognized benefits that will significantly increase or decrease within the next 12 months.
A summary reconciliation of the Company’s uncertain tax positions is listed below:
| December 31, 2011 |
December 31, 2010 |
|||||||
| Beginning balance |
$ | — | $ | — | ||||
| Addition for current year tax positions |
30 | — | ||||||
| Addition for prior year tax positions |
72 | — | ||||||
| Settlements with taxing authorities |
— | — | ||||||
| Lapsing of statutes of limitations |
— | — | ||||||
|
|
|
|
|
|||||
| Ending balance |
$ | 102 | $ | — | ||||
|
|
|
|
|
|||||
All uncertain tax positions if reversed would affect the effective tax rate.
During the year ended December 31, 2011, the Internal Revenue Service concluded its examination covering the Company’s 2008 and 2009 tax returns and issued a final Revenue Agent Report, disallowing an immaterial amount of expenses, which did not result in the assessment of additional tax, but merely an adjustment to the net operating loss carryforward balance. The Company is subject to examination in the federal jurisdiction for the tax years ending December 31, 2011 and 2010 and other state jurisdictions for the tax years ending December 31, 2011, 2010, 2009 and 2008.
(15) Commitments and Contingencies
Certain of the Company’s product license and services agreements include an indemnification provision for claims from third parties relating to the Company’s intellectual property. Such indemnification provisions are accounted for in accordance with ASC 450 “Contingencies.” To date, there have been no claims made under such indemnification provisions.
Verance Corporation, a Digimarc licensee, filed a declaratory judgment action against Digimarc in the United States District Court in Delaware on September 30, 2010, alleging the invalidity and non-infringement of 22 patents held by Digimarc. Verance Corp. v. Digimarc Corp., 1:10-cv-00831-UNA. The District Court dismissed Verance’s action. On September 9, 2011 Verance filed a Notice of Appeal with the Court of Appeals for the Federal Circuit. On December 6, 2010, Digimarc filed suit against Verance Corporation in the District of Oregon seeking payment for breach of contract by Verance related to Verance’s failure to make payments under the licensing agreement between Digimarc and Verance. Digimarc Corp. v. Verance Corp., CV’10-1489 JE.
F-27
Table of Contents
DIGIMARC CORPORATION
NOTES TO FINANCIAL STATEMENTS—(Continued)
(In thousands, except share and per share data)
In January 2012, Digimarc and Verance entered into mediation, sponsored by the Federal Circuit in Washington, D.C. The mediation resulted in a resolution, on January 31, 2012, of all disputes between the parties, including dismissal of all actions and appeals, a payment of $8 million by Verance for amounts due through the third quarter of 2011, a payment of approximately $852,500 for fourth quarter 2011 royalties, entry by the parties into a three year license agreement (starting in the fourth quarter of 2011) with blended royalty rates for unified fields of use, and a grant to Verance of nine annual renewal options.
Digimarc was named as one of several defendants in a complaint filed by Walker Digital, LLC (“Walker”), in the U.S. District Court for the District of Delaware on April 22, 2011, case number 11-cv-00363-UNA, alleging patent infringement. The case was settled in early October 2011 with a negotiated patent license arrangement between TVaura Mobile LLC and Walker.
The Company is subject from time to time to other legal proceedings and claims arising in the ordinary course of business. Although the ultimate outcome of these matters cannot be determined, management believes that, as of December 31, 2011, the final disposition of these proceedings will not have a material adverse effect on the financial position, results of operations, or liquidity of the Company. In accordance with ASC 450, no accrual has been recorded because the amounts are not probable or reasonably estimatable, and a range of possible outcomes is not determinable.
(16) Stock Repurchases
Summary of common stock shares repurchased:
| Year
Ended December 31, 2011 |
Year
Ended December 31, 2010 |
Year
Ended December 31, 2009 |
||||||||||
| Private transaction |
552,536 | — | — | |||||||||
| Repurchase program |
104,577 | — | 111,667 | |||||||||
| Exercise of stock options |
48,432 | 102,077 | — | |||||||||
| Tax withholding obligations on stock options |
46,401 | 81,610 | — | |||||||||
| Tax withholding obligations on restricted shares |
24,953 | 13,506 | 12,617 | |||||||||
|
|
|
|
|
|
|
|||||||
| Total |
766,899 | 197,193 | 124,284 | |||||||||
Value of common stock shares repurchased:
| Year
Ended December 31, 2011 |
Year
Ended December 31, 2010 |
Year
Ended December 31, 2009 |
||||||||||
| Private transaction |
$ | 14,927 | $ | — | $ | — | ||||||
| Repurchase program |
3,098 | — | 1,560 | |||||||||
| Exercise of stock options |
1,651 | 3,037 | — | |||||||||
| Tax withholding obligations on stock options |
1,657 | 2,435 | — | |||||||||
| Tax withholding obligations on restricted shares |
713 | 352 | 177 | |||||||||
|
|
|
|
|
|
|
|||||||
| Total |
$ | 22,046 | $ | 5,824 | $ | 1,737 | ||||||
On January 26, 2011, the Company repurchased 552,536 shares of its common stock from Koninklijke Philips Electronics, N.V., in a privately negotiated transaction. The shares were purchased for an aggregate price of approximately $14,927, including transaction fees. To facilitate the repurchase, the Company sold $10,752 and $2,996 of short- and long-term marketable securities, respectively, prior to their maturity dates at an immaterial gain.
F-28
Table of Contents
DIGIMARC CORPORATION
NOTES TO FINANCIAL STATEMENTS—(Continued)
(In thousands, except share and per share data)
In April 2009, the Board of Directors approved a stock repurchase program authorizing the purchase, at the discretion of management, of up to $5,000 of the Company’s common stock through either periodic open-market or private transactions at then prevailing market prices through April 30, 2010. In April 2010 and April 2011, the Board of Directors approved an extension of the stock repurchase program for one year periods. In November 2011, the Board of Directors approved an additional $5,000 for a one year period. As of December 31, 2011, the Company had repurchased 216,244 shares under this program at an aggregate purchase price of $4,659.
As part of the Company’s 2008 Plan, stock options are granted to certain employees and restricted stock shares are awarded to certain employees.
Pursuant to the terms of the stock option grants, the Company purchased a number of whole shares of common stock having a fair market value (as determined by the Company as of the date of exercise) equal to the amount of the total value of the aggregate exercise price of the options exercised. In addition, the Company withheld (purchased) from shares issued from upon exercise of the stock options a number of whole shares of common stock having a fair market value (as determined by the Company as of the date of vesting) equal to the amount of tax required to be withheld by law, in order to satisfy the tax withholding obligations of the Company in connection with the exercise of such options.
Pursuant to the terms of the restricted stock award agreement, the Company withheld (purchased) from fully vested shares of common stock otherwise deliverable to any employee, a number of whole shares of common stock having a fair market value (as determined by the Company as of the date of vesting) equal to the amount of tax required to be withheld by law, in order to satisfy the tax withholding obligations of the Company in connection with the vesting of such shares.
(17) Subsequent Events
In accordance with ASC 855 “Subsequent Events,” the Company has evaluated subsequent events.
On January 30, 2012, the Company and Verance Corporation, a longtime cash based revenue customer, settled all disputes regarding breach of contract and patent infringement claims. In connection with the resolution of these matters, Verance paid the Company $8.9 million for amounts due to Digimarc through December 31, 2011 and all claims between the parties were dismissed. Revenue from this payment will be recorded in the quarter ending March 31, 2012. In addition, the Company and Verance entered into a three year renewal and extension license agreement effective October 1, 2011. This renewal and extension supersedes the original agreement, which was executed in August 2002, and all subsequent amendments and requires Verance to pay quarterly royalties to Digimarc based on Verance revenues. At the end of three years, Verance may renew the agreement for up to nine additional one year periods.
F-29
Table of Contents
DIGIMARC CORPORATION
NOTES TO FINANCIAL STATEMENTS—(Continued)
(In thousands, except share and per share data)
(18) Quarterly Financial Information—Unaudited
| Quarter ended: |
March 31 | June 30 | September 30 | December 31 | ||||||||||||
| 2011 |
||||||||||||||||
| Service revenue |
$ | 3,069 | $ | 3,165 | $ | 3,108 | $ | 3,053 | ||||||||
| License and subscription revenue |
6,022 | 6,308 | 5,442 | 5,872 | ||||||||||||
|
|
|
|
|
|
|
|
|
|||||||||
| Total revenue |
9,091 | 9,473 | 8,550 | 8,925 | ||||||||||||
| Total cost of revenue |
1,649 | 1,690 | 1,742 | 1,856 | ||||||||||||
| Gross profit |
7,442 | 7,783 | 6,808 | 7,069 | ||||||||||||
| Gross profit percent, service revenue |
48 | % | 49 | % | 46 | % | 42 | % | ||||||||
| Gross profit percent, license and subscription revenue |
99 | % | 99 | % | 99 | % | 99 | % | ||||||||
| Gross profit percent, total |
82 | % | 82 | % | 80 | % | 79 | % | ||||||||
| Sales and marketing |
$ | 1,102 | $ | 1,017 | $ | 1,166 | $ | 1,051 | ||||||||
| Research, development and engineering |
1,775 | 1,884 | 1,958 | 1,710 | ||||||||||||
| General and administrative |
2,847 | 2,270 | 2,000 | 2,839 | ||||||||||||
| Intellectual property |
301 | 266 | 259 | 268 | ||||||||||||
| Operating income |
1,417 | 2,346 | 1,425 | 1,201 | ||||||||||||
| Net income |
938 | 3,626 | 639 | 453 | ||||||||||||
| Earnings per share: |
||||||||||||||||
| Net income per share—basic |
$ | 0.14 | $ | 0.54 | $ | 0.10 | $ | 0.07 | ||||||||
| Net income per share—diluted |
$ | 0.12 | $ | 0.50 | $ | 0.09 | $ | 0.06 | ||||||||
| Weighted average shares outstanding—basic |
6,864 | 6,696 | 6,706 | 6,699 | ||||||||||||
| Weighted average shares outstanding—diluted |
7,505 | 7,245 | 7,344 | 7,279 | ||||||||||||
| Quarter ended: |
March 31 | June 30 | September 30 | December 31 | ||||||||||||
| 2010 |
||||||||||||||||
| Service revenue |
$ | 3,514 | $ | 2,918 | $ | 2,761 | $ | 3,131 | ||||||||
| License and subscription revenue |
6,678 | 2,330 | 2,476 | 7,342 | ||||||||||||
|
|
|
|
|
|
|
|
|
|||||||||
| Total revenue |
10,192 | 5,248 | 5,237 | 10,473 | ||||||||||||
| Total cost of revenue |
1,857 | 1,540 | 1,469 | 1,834 | ||||||||||||
| Gross profit |
8,335 | 3,708 | 3,768 | 8,639 | ||||||||||||
| Gross profit percent, service revenue |
49 | % | 49 | % | 49 | % | 43 | % | ||||||||
| Gross profit percent, license and subscription revenue |
99 | % | 98 | % | 98 | % | 99 | % | ||||||||
| Gross profit percent, total |
82 | % | 71 | % | 72 | % | 82 | % | ||||||||
| Sales and marketing |
$ | 741 | $ | 759 | $ | 953 | $ | 1,092 | ||||||||
| Research, development and engineering |
1,259 | 1,321 | 1,471 | 1,636 | ||||||||||||
| General and administrative |
1,885 | 1,687 | 1,842 | 2,450 | ||||||||||||
| Intellectual property |
257 | 319 | 315 | 312 | ||||||||||||
| Operating income (loss) |
4,193 | (378 | ) | (813 | ) | 3,149 | ||||||||||
| Net income (loss) |
3,776 | (896 | ) | (1,460 | ) | 2,754 | ||||||||||
| Earnings (loss) per share: |
||||||||||||||||
| Net income (loss) per share—basic |
$ | 0.53 | $ | (0.13 | ) | $ | (0.21 | ) | $ | 0.38 | ||||||
| Net income (loss) per share—diluted |
$ | 0.51 | $ | (0.13 | ) | $ | (0.21 | ) | $ | 0.35 | ||||||
| Weighted average shares outstanding—basic |
7,096 | 7,097 | 7,098 | 7,190 | ||||||||||||
| Weighted average shares outstanding—diluted |
7,387 | 7,097 | 7,098 | 7,859 | ||||||||||||
F-30
Table of Contents
In reviewing the agreements included as exhibits to this Annual Report on Form 10-K, please remember they are included to provide you with information regarding their terms and are not intended to provide any other factual or disclosure information about Digimarc or the other parties to the agreements. The agreements may contain representations and warranties by each of the parties to the applicable agreement. These representations and warranties have been made solely for the benefit of the other party or parties to the applicable agreement and:
| • | should not in all instances be treated as categorical statements of fact, but rather as a means of allocating the risk to one of the parties if those statements prove to be inaccurate; |
| • | may have been qualified by disclosures that were made to the other party or parties in connection with the negotiation of the applicable agreement, which disclosures are not necessarily reflected in the agreement; |
| • | may apply standards of materiality in a manner that is different from what may be viewed as material to you or other investors; and |
| • | were made only as of the date of the applicable agreement or other date or dates that may be specified in the agreement and are subject to more recent developments. |
Accordingly, there representations and warranties may not describe the actual state of affairs as of the date they were made or at any other time. Additional information about Digimarc may be found elsewhere in this Annual Report on Form 10-K and in Digimarc’s other public filings, which are available without charge through the SEC’s website at http://www.sec.gov.
| Exhibit |
Exhibit Description | |
| 2.1 | Separation Agreement among DMRC Corporation, DMRC LLC, Digimarc Corporation and, with respect to certain sections, L-1 Identity Solutions, Inc. (incorporated by reference to Exhibit 2.1 to Amendment No. 2 to the Company’s Registration Statement on Form 10, filed with the Commission on August 13, 2008 (File No. 001-34108))† | |
| 2.2 | Agreement and Plan of Merger dated April 30, 2010 between Digimarc Corporation, a Delaware corporation, and Digimarc Oregon Corporation, an Oregon corporation (incorporated by reference to Exhibit 2.1 to the Company’s Current Report on Form 8-K, filed with the Commission on May 4, 2010 (File No. 001-34108)) | |
| 3.1 | Articles of Incorporation of Digimarc Corporation (incorporated by reference to Exhibit 10.1 to the Company’s Current Report on Form 8-K, filed with the Commission on
May 4, 2010 (File No. 001-34108)) | |
| 3.2 | Bylaws of Digimarc Corporation (incorporated by reference to Exhibit 10.1 to the Company’s Current Report on Form 8-K, filed with the Commission on May 4, 2010 (File No. 001-34108)) | |
| 4.1 | Specimen common stock certificate of Digimarc Corporation (incorporated by reference to Exhibit 4.1 to the Company’s Annual Report on Form 10-K, filed with the Commission on February 27, 2009 (File No. 001-34108)) | |
| 4.2 | Rights Agreement, dated July 31, 2008, between Digimarc Corporation and Computershare Trust Company, N.A. as Rights Agent (incorporated by reference to Exhibit 4.2 to the Company’s Annual Report on Form 10-K, filed with the Commission on February 27, 2009 (File No. 001-34108)) | |
| 4.3 | Form of Certificate of Designation of Series R Preferred Stock (attached as an exhibit to the Rights Agreement filed as Exhibit 4.2 hereto) | |
| 4.4 | Form of Rights Certificate (attached as an exhibit to the Rights Agreement filed as Exhibit 4.2 hereto) | |
E-1
Table of Contents
| Exhibit |
Exhibit Description | |
| 10.1 | License Agreement between DMRC Corporation and L-1 Identity Solutions Operating Company (incorporated by reference to Exhibit 10.2 to Amendment No. 4 to the Company’s Registration Statement on Form 10, filed with the Commission on October 2, 2008 (File No. 001-34108))(1) | |
| 10.2 | Counterfeit Deterrence System Development and License Agreement, dated as of January 1, 1999, between Digimarc Corporation and the Bank for International Settlements (incorporated by reference to Exhibit 10.4 to Amendment No. 6 to the Company’s Registration Statement on Form 10, filed with the Commission on October 14, 2008 (File No. 001-34108))(1) | |
| *10.3 | Form of Indemnification Agreement between DMRC Corporation and each of its executive officers and directors (incorporated by reference to Exhibit 10.5 to Amendment No. 2 to the Company’s Registration Statement on Form 10, filed with the Commission on August 13, 2008 (File No. 001-34108)) | |
| *10.4 | Employment Agreement, effective as of November 1, 2011, between Digimarc Corporation and Bruce Davis (incorporated by reference to Exhibit 10.1 to the Company’s Current Report on Form 8-K, filed with the Commission on November 7, 2011 (File No. 001-34108)) | |
| *10.5 | Digimarc Corporation 2008 Incentive Plan (incorporated by reference to Exhibit 10.7 to the Company’s Quarterly Report on Form 10-Q, filed with the Commission on November 24, 2008 (File No. 001-34108)) | |
| *10.6 | Form of Notice of Stock Option Award and Stock Option Award Agreement under the Digimarc Corporation 2008 Incentive Plan (incorporated by reference to Exhibit 10.8 to the
Company’s Quarterly Report on Form 10-Q, filed with the Commission on November 24, 2008 (File No. 001-34108)) | |
| *10.7 | Equity Compensation Program for Nonemployee Directors under the Digimarc Corporation 2008 Incentive Plan (incorporated by reference to Exhibit 10.9 to the Company’s Quarterly Report on Form 10-Q, filed with the Commission on November 24, 2008 (File No. 001-34108)) | |
| *10.8 | Form of Indemnification Agreement between Digimarc Corporation and each of its executive officers and directors (incorporated by reference to Exhibit 10.1 to Digimarc Corporation’s Annual Report on Form 10-K, as filed by Digimarc Corporation with the Securities and Exchange Commission on March 13, 2006 (File No. 000-28317)) | |
| *10.9 | Form of Change of Control Retention Agreement entered into by and between Digimarc Corporation and each of Messrs. McConnell and Chamness (incorporated by reference to Exhibit 10.10 to the Company’s Annual Report on Form 10-K, filed with the Commission on February 24, 2010 (File No. 001-34108)) | |
| 10.10 | Patent License Agreement, dated as of June 11, 2009 between Digimarc Corporation and The Nielsen Company (US), LLC (incorporated by reference to Exhibit 10.1 to the Company’s Quarterly Report on Form 10-Q, filed with the Commission on July 31, 2009 (File No. 001-34108))(2) | |
| 10.11 | Limited Liability Company I Agreement, dated June 11, 2009 between Digimarc Corporation and The Nielsen Company (US), LLC (incorporated by reference to Exhibit 10.2 to the Company’s Quarterly Report on Form 10-Q, filed with the Commission on July 31, 2009 (File No. 001-34108))(2) | |
| 10.12 | Limited Liability Company II Agreement, dated June 11, 2009 between Digimarc Corporation and The Nielsen Company (US), LLC (incorporated by reference to Exhibit 10.3 to
the Company’s Quarterly Report on Form 10-Q, filed with the Commission on July 31, 2009 (File No. 001-34108))(2) | |
E-2
Table of Contents
| Exhibit |
Exhibit Description | |
| 10.13 | Lease Agreement, dated March 22, 2004, between Digimarc Corporation and PS Business Parks, L.P., as amended on May 13, 2010 (incorporated by reference to Exhibit 10.1
to the Company’s Quarterly Report on Form 10-Q, filed with the Commission on July 30, 2010 (File No. 001-34108)) | |
| 10.14 | Patent License Agreement, effective as of October 5, 2010, between Digimarc Corporation and IV Digital Multimedia Inventions, LLC (incorporated by reference to Exhibit 10.12 to the Company’s Annual Report on Form 10-K, filed with the Commission on March 3, 2011 (File No. 001-34108)) (3) | |
| 10.15 | Grant-Back License Agreement, dated October 5, 2010, between Digimarc Corporation and IV Digital Multimedia Inventions, LLC (incorporated by reference to Exhibit 10.13 to the Company’s Annual Report on Form 10-K, filed with the Commission on March 3, 2011 (File No. 001-34108)) (3) | |
| 10.16 | Patent Rights Agreement, dated October 5, 2010, between Digimarc Corporation and IV Digital Multimedia Inventions, LLC (incorporated by reference to Exhibit 10.14 to the Company’s Annual Report on Form 10-K, filed with the Commission on March 3, 2011 (File No. 001-34108)) | |
| 10.17 | Work Agreement, dated October 5, 2010, by and among Digimarc Corporation, Invention Law Group, P.C. and IV Digital Multimedia Inventions, LLC (incorporated by reference to Exhibit 10.15 to the Company’s Annual Report on Form 10-K, filed with the Commission on March 3, 2011 (File No. 001-34108)) (3) | |
| 21.1 | List of Affiliates | |
| 23.1 | Consent of Independent Registered Public Accounting Firm | |
| 23.2 | Consent of Independent Registered Public Accounting Firm | |
| 23.3 | Consent of Independent Registered Public Accounting Firm | |
| 23.4 | Consent of Independent Registered Public Accounting Firm | |
| 31.1 | Rule 13a-14(a)/15d-14(a) Certification of Chief Executive Officer | |
| 31.2 | Rule 13a-14(a)/15d-14(a) Certification of Chief Financial Officer | |
| 32.1 | Section 1350 Certification of Chief Executive Officer | |
| 32.2 | Section 1350 Certification of Chief Financial Officer | |
| 99.1 | TVaura LLC financial statements and related footnotes for the years ended December 31, 2011 and 2010, and the cumulative period from June 11, 2009 (inception) through December 31, 2011 | |
| 99.2 | TVaura Mobile LLC financial statements and related footnotes for the years ended December 31, 2011 and 2010, and the cumulative period from June 11, 2009 (inception) through December 31, 2011 | |
| 101.INS | XBRL Instance Document | |
| 101.SCH | XBRL Taxonomy Extension Schema Document | |
| 101.CAL | XBRL Taxonomy Extension Calculation Linkbase Document | |
| 101.DEF | XBRL Taxonomy Extension Definition Linkbase Document | |
| 101.LAB | XBRL Taxonomy Extension Label Linkbase Document | |
| 101.PRE | XBRL Taxonomy Extension Label Linkbase Document | |
| * | Management contract or compensatory plan or arrangement. |
E-3
Table of Contents
| † | The Separation Agreement contains a brief list identifying all schedules and exhibits thereto. Such schedules and exhibits have been omitted pursuant to Item 601(b)(2) of Regulation S-K. The Registrant agrees to furnish supplementally a copy of the omitted schedules and exhibits to the Securities and Exchange Commission upon request. |
| (1) | Confidential treatment has been granted for certain portions omitted from this exhibit pursuant to an order granted by the Commission on October 21, 2008, under Rule 24b-2 of the Securities Exchange Act of 1934, as amended. Confidential portions of this exhibit have been separately filed with the Securities and Exchange Commission. |
| (2) | Confidential treatment has been granted for certain portions omitted from this exhibit pursuant to an order granted by the Commission on September 10, 2009, under Rule 24b-2 under the Securities Exchange Act of 1934, as amended. Confidential portions of this exhibit have been separately filed with the Securities and Exchange Commission. |
| (3) | Confidential treatment has been granted for certain portions omitted from this exhibit pursuant to an order granted by the Commission on March 17, 2011, under Rule 24b-2 under the Securities Exchange Act of 1934, as amended. Confidential portions of this exhibit have been separately filed with the Securities and Exchange Commission. |
E-4