Attached files
| file | filename |
|---|---|
| EXCEL - IDEA: XBRL DOCUMENT - CRAY INC | Financial_Report.xls |
| EX-21.1 - SUBSIDIARIES OF THE COMPANY - CRAY INC | d278623dex211.htm |
| EX-32.1 - CERTIFICATE PURSUANT TO 18 U.S.C. SECTION 1350 - CRAY INC | d278623dex321.htm |
| EX-23.1 - CONSENT OF PETERSON SULLIVAN LLP - CRAY INC | d278623dex231.htm |
| EX-31.1 - RULE 13A-14(A)/15D-14(A) CERTIFICATION OF MR. UNGARO, CHIEF EXECUTIVE OFFICER - CRAY INC | d278623dex311.htm |
| EX-10.46 - SEVENTH AMENDMENT TO CREDIT AGREEMENT - CRAY INC | d278623dex1046.htm |
| EX-10.48 - AMENDMENT NO.1 TO LOAN AND SECURITY AGREEMENT - CRAY INC | d278623dex1048.htm |
| EX-10.45 - SIXTH AMENDMENT TO CREDIT AGREEMENT - CRAY INC | d278623dex1045.htm |
| EX-31.2 - RULE 13A-14(A)/15D-14(A) CERTIFICATION OF MR. HENRY, CHIEF FINANCIAL OFFICER - CRAY INC | d278623dex312.htm |
Table of Contents
UNITED STATES SECURITIES AND EXCHANGE COMMISSION
Washington, D.C. 20549
FORM 10-K
| þ | ANNUAL REPORT PURSUANT TO SECTION 13 OR 15(d) OF THE SECURITIES EXCHANGE ACT OF 1934 |
For the Fiscal Year Ended December 31, 2011
| ¨ | TRANSITION REPORT PURSUANT TO SECTION 13 OR 15(d) OF THE SECURITIES EXCHANGE ACT OF 1934 |
For the Transition Period From to .
Commission File Number: 000-26820
CRAY INC.
(Exact Name of Registrant as Specified in Its Charter)
| Washington | 93-0962605 | |
| (State or Other Jurisdiction of Incorporation or Organization) |
(I.R.S. Employer Identification No.) | |
| 901 Fifth Avenue, Suite 1000 | 98164 | |
| Seattle, Washington | (Zip Code) | |
| (Address of Principal Executive Offices) | ||
Registrant’s telephone number, including area code:
(206) 701-2000
Securities Registered Pursuant to Section 12(b) of the Act:
| Title of Each Class |
Name of Each Exchange on Which Registered | |
| Common Stock, $.01 par value | Nasdaq Stock Market LLC | |
Securities registered pursuant to Section 12(g) of the Act: NONE
Indicate by check mark if the registrant is a well-known seasoned issuer, as defined in Rule 405 of the Securities Act: Yes ¨ No þ
Indicate by check mark if the registrant is not required to file reports pursuant to Section 13 or Section 15(d) of the Act: Yes ¨ No þ
Indicate by check mark whether the registrant (1) has filed all reports required to be filed by Section 13 or 15(d) of the Securities Exchange Act of 1934 during the preceding 12 months (or for such shorter period that the registrant was required to file such reports), and (2) has been subject to such filing requirements for the past 90 days: Yes þ No ¨
Indicate by check mark whether the registrant has submitted electronically and posted on its corporate Web site, if any, every Interactive Data File required to be submitted and posted pursuant to Rule 405 of Regulation S-T (§ 232.405 of this chapter) during the preceding 12 months (or for such shorter period that the registrant was required to submit and post such files). Yes þ No ¨
Indicate by check mark if disclosure of delinquent filers pursuant to Item 405 of Regulation S-K (§ 229.405 of this chapter) is not contained herein, and will not be contained, to the best of registrant’s knowledge, in definitive proxy or information statements incorporated by reference in Part III of this Form 10-K or any amendment to this Form 10-K. þ
Indicate by check mark whether the registrant is a large accelerated filer, an accelerated filer, a non-accelerated filer, or a smaller reporting company. See the definitions of “large accelerated filer,” “accelerated filer” and “smaller reporting company” in Rule 12b-2 of the Exchange Act.
| Large accelerated filer ¨ | Accelerated filer þ | Non-accelerated filer ¨ | Smaller reporting company ¨ | |||
| (Do not check if a smaller reporting company) | ||||||
Indicate by check mark whether the registrant is a shell company (as defined in Rule 12b-2 of the Act). Yes ¨ No þ
The aggregate market value of the Common Stock held by non-affiliates of the registrant as of June 30, 2011, was approximately $220,092,794 based upon the closing price of $6.40 per share reported on June 30, 2011, on the Nasdaq Global Market.
As of February 15, 2012, there were 36,778,889 shares of Common Stock issued and outstanding.
DOCUMENTS INCORPORATED BY REFERENCE
Portions of the Proxy Statement to be delivered to shareholders in connection with the registrant’s Annual Meeting of Shareholders to be held on June 7, 2012, are incorporated by reference into Part III.
Table of Contents
FORM 10-K
For Fiscal Year Ended December 31, 2011
INDEX
Cray is a federally registered trademark of Cray Inc., and Cray Sonexion, Cray Sonexion 1300, Cray XT, Cray XT3, Cray XT4, Cray XT5, Cray XT6, Cray XE, Cray XE5, Cray XE6, Cray XE6m, Cray XK6, Cray XK6m, Cray CX1, Cray CX1000, Gemini, Cray ECOphlex, Cascade, Cray Linux Environment, Cray Threadstorm and YarcData are trademarks of Cray Inc. The registered trademark Linux is used pursuant to a sublicense from LMI, the exclusive licensee of Linus Torvalds, owner of the mark on a worldwide basis. Other trademarks used in this report are the property of their respective owners.
Table of Contents
Forward-Looking Statements
This annual report on Form 10-K contains forward-looking statements that involve risks and uncertainties, as well as assumptions that, if they never materialize or if they prove incorrect, could cause our actual results to differ materially from those expressed or implied by such forward-looking statements. Forward-looking statements are based on our management’s beliefs and assumptions and on information currently available to them. In some cases you can identify forward-looking statements by terms such as “may,” “will,” “should,” “could,” “would,” “expect,” “plans,” “anticipates,” “believes,” “estimates,” “projects,” “predicts” and “potential” and similar expressions, but the absence of these words does not mean that a statement is not forward-looking. All statements other than statements of historical fact are statements that could be deemed forward-looking statements, and examples of forward-looking statements include any projections of earnings, revenue or other results of operations or financial results; any statements of the plans, strategies, objectives and beliefs of management of the Company; any statements concerning proposed new products, technologies or services; any statements regarding future research and development or co-funding for such efforts; any statements regarding future economic conditions; and any statements of assumptions underlying any of the foregoing. These forward-looking statements are subject to the safe harbor created by Section 27A of the Securities Act of 1933, as amended, and Section 21E of the Securities Exchange Act of 1934, as amended. Our actual results could differ materially from those anticipated in these forward-looking statements for many reasons, including the risks faced by us and described in Item 1A. Risk Factors in Part I and other sections of this report and our other filings with the U.S. Securities and Exchange Commission, or SEC, or Commission. You should not place undue reliance on these forward-looking statements, which apply only as of the date of this report. You should read this report completely and with the understanding that our actual future results may be materially different from what we expect. We assume no obligation to update these forward-looking statements, whether as a result of new information, future events, or otherwise.
General
We design, develop, manufacture, market and service high-performance computing, or HPC, systems, commonly known as supercomputers, and provide storage solutions and engineering services related to HPC systems and solutions to our customers, which include government agencies, academic institutions and commercial entities. Our supercomputer systems provide capability and sustained performance far beyond typical server-based computer systems and address challenging scientific, engineering, commercial and national security computing problems. Our current strategy is to gain market share in the high-end supercomputer market segment, extend our technology leadership, maintain our focus on execution and profitability and expand our addressable market in areas where we can leverage our experience and technology, such as in storage & data management, data analytics of enormous volumes of data, popularly referred to as “big data” analytics, midrange HPC systems and custom engineered solutions.
We were incorporated in the State of Washington in December 1987 under the name Tera Computer Company. We changed our corporate name to Cray Inc. in connection with our acquisition of the Cray Research, Inc., or Cray Research, operating assets from Silicon Graphics, Inc. in 2000. Our corporate headquarters are located at 901 Fifth Avenue, Suite 1000, Seattle, Washington 98164. Our telephone number is (206) 701-2000 and our website address is www.cray.com. The contents of our website are not incorporated by reference into this annual report on Form 10-K or our other SEC reports and filings.
1
Table of Contents
Products, Services and Customer Support
We concentrate on building balanced systems that are purpose-built for supercomputer users. Whether it is one of our general-purpose supercomputer products or one that is custom engineered for a specific customer problem, our systems address the critical computing resource challenges HPC users face today: achieving massive scaling to tens of thousands of processors; ease of use for high productivity; and very high levels of sustained performance on real applications. We achieve this by designing supercomputers that combine highly capable processors, high speed interconnect technology for maximum communication efficiency, innovative packaging to address increased density, energy efficiency and reliability requirements, and scalable system software that enables performance and manageability at scale.
Our supercomputers utilize components and technologies designed to support the demanding requirements of high-end HPC users. In contrast, lower bandwidth cluster system vendors use processors, interconnects and system software designed to meet the requirements of the general purpose server market and then attempt to leverage these commercially-oriented products into the HPC market. An important benefit of our purpose-built approach is significantly higher sustained performance on many important applications at high scaling levels, with performance improvements on the order of up to 10 or more times that of our commodity cluster competition in these areas. With our supercomputers, HPC users are able to focus on their primary objectives, including advancing scientific discovery, increasing industrial capabilities and improving national security.
Our supercomputer systems offer several additional benefits:
| • | upgrade paths that allow customers to leverage their investments over longer periods of time and thereby reduce total costs of ownership; |
| • | improved productivity, resiliency, reliability and performance through custom design of interconnect systems and, in certain systems, proprietary processors; |
| • | flexibility of processor type, memory and network configuration, storage configuration and system software tools developed towards implementation of our “Adaptive Supercomputing” vision discussed below; and |
| • | the Cray brand name, synonymous with supercomputing and the Cray service experience, that brings with it a proven research and development team and a global sales and service organization dedicated to the needs of high-end HPC users. |
We expect the continued advancement of many-core and accelerator processors to be advantageous to us, complementing our technical strengths in networking, scaling system software and cooling and power management technologies. The growing number of cores on each processor will amplify the scaling issues that customers face today by putting increased stress on all aspects of the system while accelerator processors (e.g., graphical processor units, or GPUs) will further unbalance systems from a computational performance perspective putting increased pressure on the system’s communications network in which we specialize. We believe our balanced approach to system design will become increasingly critical in enabling customers to take advantage of the benefits of many-core processing.
2
Table of Contents
HPC Systems
Cray XE6 System. The Cray XE6 system is our flagship massively parallel processing, or MPP, system and is the successor system to the Cray XT6, Cray XT5, Cray XT4 and Cray XT3 systems. The Cray XE6 system combines scalability with manageability, resiliency, lower cost of ownership with reduced power and cooling requirements, and broader application support. The Cray XE6 system has industry leading compute density and high memory bandwidth, supporting very high density processor configurations of 192 AMD Opteron processor sockets or up to 3,072 processor cores and delivering more than 20 teraflops (20 trillion floating point operations per second) of computational capacity per cabinet, with system peak and sustained performance designed to exceed ten petaflops. Customers can upgrade to the Cray XE6 system from the Cray XT4, Cray XT5 or Cray XT6 systems by upgrading the network, processors, memory and a compute blade or they can choose to just upgrade the network to create a Cray XE5 system, thereby leveraging their investment over a longer period of time. The Cray XE6 Linux-based operating system efficiently supports the extreme levels of scaling featured in each of our supercomputers as well as a large range of industry applications with our Cluster Compatibility Mode, or CCM, software environment. The Cray XE6 system can be liquid cooled through use of Cray ECOphlex technology or air cooled.
Cray XE6m System. Our Cray XE6m supercomputer is designed to make our HPC technology available to more users by targeting a lower price band in the supercomputer market segment with price points starting at approximately $200,000. The Cray XE6m system incorporates our Cray Gemini network specially designed and optimized for systems with peak performances starting at under 7 teraflops and scaling to our high-end systems, providing superior bandwidth, upgradeability and manageability at prices comparable to those of commodity clusters. Offered with up to six cabinets, the Cray XE6m series features multi-core AMD Opteron processors and can be liquid cooled through use of Cray ECOphlex technology or air cooled. The Cray Linux Environment enables the use of a wide range of open source tools as well as streamlined porting of a broad set of applications from independent software vendors. The Cray XE6m system compute blades, like the Cray XE6 compute blades, are designed for maximum power efficiency with only the components needed for MPP: processors, memory and interconnect. The Cray XE6m series can be upgraded or expanded to take advantage of new technologies, such as next-generation compute processors, memory and I/O technologies as they become available, and can be upgraded to a full Cray XE6 supercomputer.
Cray XK6 System. The Cray XK6 supercomputer combines our proven Gemini interconnect, AMD’s leading multi-core scalar processors and NVIDIA’s powerful many-core GPU processors to create a true, productive hybrid supercomputer. Capable of scaling to 500,000 scalar processors and 50 petaflops of hybrid peak performance, every aspect of the Cray XK6 system — from its resiliency features to its scalability-boosting technologies — has been engineered to meet science’s real-world demands.
Cray XK6m System. The Cray XK6m supercomputer leverages all of the technology in the Cray XE6m system and integrates GPUs.
Our Adaptive Supercomputing Vision and Cascade Program
Our Adaptive Supercomputing vision is our vision of the best way to support the anticipated future needs of HPC customers by incorporating many of our technical strengths, including system scalability, multiple processing technologies and high bandwidth networks — into a single system that we believe will make supercomputing capabilities accessible to a greater number of end-users. With Adaptive Supercomputing we expect to expand the concept of heterogeneous computing to a fully integrated view of both hardware and software supporting multiple processing technologies within a single, highly scalable system. Our plan is to increasingly integrate these processing technologies, such as x86 CPUs and accelerators, into a single Linux-based platform. We expect to include powerful compilers and related software that will allow users to more transparently leverage the heterogeneous underlying hardware in the system and help enable programmers to write code in a more natural way.
3
Table of Contents
Our “Cascade” development program implements our Adaptive Supercomputing vision. Our “Cascade” efforts are co-funded by the U.S. government. Under our funding agreement with the Defense Advanced Research Projects Agency, or DARPA, we are completing the development of a prototype system that demonstrates the functionality required for scaling to multiple sustained petaflops levels of performance on real applications. The “Cascade” system involves a new system architecture that combines future processor technologies, a new high-performance network and an adaptive software layer into a single integrated system. It is expected to be commercially available in 2013.
YarcData Division
Future “Big Data” Analytics Solution. As previously announced in early 2012, we created a new division within our organization called YarcData which focuses on providing solutions to the “big data” market by extending our supercomputing platform to data analytics problems. Cray’s future “big data” analytics solution includes a scalable massively multithreaded platform with a shared memory architecture that is ideally suited for tasks such as pattern matching, complex searches, scenario development, behavioral prediction, anomaly identification and graph analysis. This system is purpose-built for parallel applications that are dynamically changing, require random access to shared memory and typically do not run well on conventional systems. This system is ideal for massive unstructured and irregular data mining problems. The design is based on a Cray XT compute blade but utilizes custom Cray Threadstorm processors developed for massively multithreaded processing. A single Cray Threadstorm processor can sustain 128 simultaneous threads and is connected to memory that is globally accessible by any other Cray Threadstorm processor in the system.
Storage & Data Management
Cray Sonexion 1300. We offer industry-leading storage & data management solutions and select the best combination of functionality and price performance for each customer project. With the introduction of the Cray Sonexion 1300 integrated storage system, we provide HPC customers with an industry leading high-bandwidth, high capacity integrated Lustre solution. In addition, we continue to support partner storage offerings from companies such as Data Direct Networks and NetApp through our esFS solutions. This flexibility ensures customers always have access to the best storage & data management technologies from us and our partners. The new Cray Sonexion 1300 system is a modular, high performance, high reliability storage system that takes full advantage of the Lustre file system at any scale in a scale-out network attached storage, or NAS, solution. The system combines next-generation hardware and software technology into an efficient modular design that scales from a hundred terabytes to petabytes and offers optimal reliability, performance and ease of management. At the heart of the Cray Sonexion scalable storage architecture is the storage scalable unit, or SSU, which consolidates and integrates traditional block storage, network and file system components. Each SSU is a balanced performance, high-capacity building block fully integrated with Lustre according to best practices.
Services
Custom Engineering. To address those HPC users whose needs cannot be met through our standard product offerings, we provide an alternative. Cray Custom Engineering leverages our amassed intellectual property portfolio, deep domain expertise, and HPC know-how to design and build solutions and services designed to match a customer’s specific needs. The need for a unique solution often stems from special processing needs, often performance, application or capacity related; special environmental needs, commonly size, weight, power and cooling limitations; or unique interface or integration requirements.
We provide deliverables ranging from specific components to complete integrated systems, focusing on custom-designed hardware, software, packaging, power and cooling solutions to address an HPC customer’s unique challenges in special processing or application performance, environmental limitations or integration with distinct equipment. In addition to our custom technologies, we may integrate commodity components or specialized third-party technologies into the complete system. Our services encompass the entire life cycle of a product or system, spanning design, development, program management, application characterization, production, installation, integration and support.
4
Table of Contents
Customer Support. Our worldwide customer support organization delivers our customers the “Cray experience” that provides us with a competitive advantage and a predictable flow of revenue and cash. We believe that the quality of our customer support personnel plays an important role in our ability to maintain long-term customer relationships. Support services are important to our customers, and we generally locate our support personnel at or near customer sites globally, which are supported by a central service organization. Our support services include hardware and software maintenance in support of our systems, applications support, installation project management, system installation and de-installation, site preparation and technical training for our systems. In addition, we offer ancillary services in application consulting, site engineering, on-site analysts for defined projects and specialized training. In recent years, annual maintenance service revenue has accounted for roughly fourteen to twenty-one percent of our total revenue. Maintenance support services are provided under separate contracts with our product customers. These contracts generally provide for support services on an annual basis, although some cover multiple years. While most customers pay for support on an annual basis, others pay on a monthly, quarterly or multi-year basis. Customers may select levels of support and response times, ranging from next business day parts only to 24 x 7 coverage with two-hour response.
Our Markets
Our systems are installed at more than 100 sites around the world. Our target markets for our products designed for the supercomputer market segment are:
Scientific Research. Scientific research includes governmental research laboratories and research universities around the world. The Department of Defense, through its High Performance Computing Modernization Program, funds a number of research organizations that are target customers for us. The Office of Science in the Department of Energy and its laboratories are key target customers, as are the National Science Foundation and the National Aeronautics and Space Administration and related agencies around the world.
National Security. Classified work in U.S. government agencies has represented an important customer market for us over many years. Certain U.S. governmental departments also continue to provide funding support for our research and development efforts to meet their objectives. Current and target customers for our products include a number of Department of Defense-related classified customers, the National Nuclear Security Administration of the Department of Energy and certain foreign counterparts.
Defense. The U.S. government and defense segment has wide ranging needs for HPC systems that in some ways are unique and in other ways are similar to market segments such as life sciences. HPC systems can assist in the development of defense technologies, equipment and secure communications infrastructure, as well as in the identification and analysis of military intelligence. Intelligence supports real-time development of defense strategy and decision making, while technology advancements are necessary to maintain military advantages and deterrents.
Earth Sciences. Weather forecasting and climate modeling applications require increasing speed and larger volumes of data. Forecasting models and climate applications have grown increasingly complex with an ever-increasing number of interactive variables, making improved supercomputing capabilities increasingly critical. We have a number of customers running weather and climate applications, including customers in Korea, Brazil, Switzerland, Denmark, Finland, India, Spain and the United States.
Life Sciences. The life sciences industry has evolved dramatically over the past decade, and the simulations used today test the limits of HPC systems. In the life sciences, HPC methods cover a vast area that includes modular and quantum mechanics and dynamics, quantitative structure-activity relationship models, genomic assembly and comparison, whole cell process simulations, and medical imaging, just to name a few. HPC computing systems in this market utilize a mix of high capability and high throughput technologies.
Energy. Supercomputing in the energy sector is driven largely by research by and for oil and gas exploration and processing. The simulation methods used are both CPU and GPU compute intensive and often require fast networks. We currently have customers utilizing both Cray XE6 and Cray XK6 systems and we are targeting this segment for future products.
Computer-Aided Engineering. Supercomputers are used to design lighter, safer and more durable vehicles, study wind noise and airflow around vehicles, improve airplane flight characteristics and, in many other computer-aided engineering applications, to improve time-to-market and product quality. We currently have customers in the aerospace, automotive, life sciences and manufacturing industries around the world.
5
Table of Contents
Data Analytics. The ability to perform data analytics in enormous volumes of data, or “big data” analytics, has become an important driver to the success of both business and academic research. A change in the analytics industry is occurring, from the generation of reports about historical transactions, to the ability to assess what is happening in real time and to make useful, actionable predictions. Data analytics is a new market for us, but one that plays well to our core strengths, namely the ability to process vast amounts of data at very high speeds and to make predictions. We are in early implementations of our solutions with various research, governmental and life sciences organizations.
Agencies of the U.S. government or customers serving the U.S. government, directly and indirectly through system integrators and other resellers, accounted for approximately 54% of our revenue in 2011, 62% of our 2010 revenue, and 72% of our 2009 revenue. Significant customers with over 10% of our annual revenue, including those funded by the U.S. Government, were the High Performance Computing Center Stuttgart and the National Energy Research Scientific Computing Center in 2011, the Korean Meteorological Administration and Los Alamos National Laboratory in 2010, and Oak Ridge National Laboratory and the University of Tennessee in 2009. International customers accounted for 35% of our total revenue in 2011, 34% of our total revenue in 2010, and 24% of our total revenue in 2009.
We have three operating segments for financial reporting purposes. Segment information and related disclosures are set forth in Note 14 — Segment Information in the Notes to Consolidated Financial Statements in Item 15. Exhibits and Financial Statement Schedules in Part IV of this annual report.
Sales and Marketing
We focus our sales and marketing activities on government agencies, academic institutions and commercial entities that purchase HPC systems and storage. We sell our high-end products and custom engineered solutions primarily through a seasoned supercomputing direct sales force that operates throughout the United States and in Canada, Europe, Japan and Asia-Pacific. We serve smaller vertical and remote markets through sales representatives. About half of our sales force is located in the United States and Canada, with the remainder overseas.
A formal request-for-proposal process for HPC systems or technology drives a majority of our high-end systems sales and custom engineering engagements. We utilize pre-sales technical experts to develop technical proposals that meet the customer requirements and benchmarking teams to demonstrate the advantages of our particular supercomputing products or service being proposed. For a majority of our larger sales opportunities, the proposal process, including establishing system size, options, pricing and other commitments, involves a number of resources outside of our sales organization. While we often tailor our supercomputer solutions for each customer, especially so in our custom engineering engagements, there is substantial commonality in the underlying components and systems, allowing us to leverage manufacturing and supply chain operations.
As government agencies and government-funded scientific research institutions comprise a large portion of our customer base, our government programs efforts are an integral part of our overall strategy. Our government programs personnel actively manage our relationship with U.S. government agencies and Congress.
Our marketing staff is primarily responsible for product marketing, business development and marketing communications. Product marketing bridges our research and development organization and our sales staff to help ensure that our products meet the demands and requirements of our key customers and a broader set of prospects for our HPC business and each of our new business initiatives. Marketing communications focus on our overall brand messaging, press releases, conferences, trade shows and marketing campaigns. Business development focuses on providing products and services to specific customer sets, such as earth sciences, computer-aided engineering, life sciences and energy.
Our Technology
We focus our research and development activities on designing system architecture, hardware and software necessary to implement our product roadmap.
6
Table of Contents
Architecture
Massively parallel processing, or MPP, architectures typically link up to tens of thousands of commodity processors and their memory systems. These systems are best suited for large computing problems that can be segmented into many parts and distributed across a large number of processors. The performance of these systems depends in large part on the synchronization and communication capabilities of the inter-processor interconnects. The Cray XE family of supercomputer systems is based on this architecture.
We have world-class expertise in developing highly scalable, high-performance multiprocessor interconnects. Our interconnects are designed to scale effectively to very large numbers of processors under heavy communication loads, providing lower latency and less performance variability than commodity networks do. Our network roadmap includes support for globally addressable memory, highly efficient synchronization primitives and very high transaction rates.
We have processor design expertise, with a strong understanding of how processors interact with compilers and networks for HPC applications. This allows us to better consult with processor vendors on future product designs, as well as design custom multithreaded processors for our future “big data” analytics solution. Multithreading is designed to provide latency tolerance by supporting a large number of executable threads per processor and quickly switching to another thread when a thread waits for data to be computed or to return from global shared memory. These systems are particularly effective for access to large irregular data sets and graph-based algorithms. Our future “big data” analytics solution is based on this technology.
Hardware
We have extensive experience in designing hardware components of HPC systems, including integrated circuits, memory controllers, interconnect systems, I/O subsystems and cooling, power, and packaging infrastructures, and integrating them into a single system. Our hardware research and development experience includes:
| • | High-speed interconnect. We design high speed and high bandwidth interconnect systems using a combination of custom I/O circuits, high-density connectors, carefully chosen transmission media and highly optimized logic; |
| • | Packaging and cooling. We use very dense packaging in order to produce systems with high processing capabilities and complementary bandwidth. This packaging generates more heat per unit volume than standard packaging. We use specialized cooling techniques to address this issue, including liquid cooling and high volume air cooling; and |
| • | Integrated circuit design. We have designed custom and standard cell integrated circuits, including vector and multithreaded processors. Our processors and other integrated circuits have special features that let them use highly available memory bandwidth efficiently. |
Software
We have extensive experience in designing, developing and adapting system software such as the operating system, hardware supervisory system as well as programming environment software as an integral aspect of our scalable HPC systems and distribute that software as part of system sales. We are transitioning to a common system software and a common programming environment across all of our platforms, an important aspect of our Adaptive Supercomputing vision. Our software research and development experience includes: operating systems; provision of scalable hardware control RAS infrastructure systems for managing hardware, including power control, monitoring of environmental data and hardware diagnostics; and programming environments, including our own and commercially available compilers, libraries and tools.
We purchase or license software technologies from third parties when necessary to provide appropriate support to our customers, while focusing our own resources where we believe we add the highest value. We have not marketed or sold application programs separate from our systems.
For information relating to amounts spent on research and development, see Note 15 — Research and Development in the Notes to Consolidated Financial Statements in Item 15. Exhibits and Financial Statement Schedules in Part IV of this annual report.
7
Table of Contents
Manufacturing and Supply Chain
We subcontract the manufacture of a majority of the hardware components for our high-end products and custom-engineered systems, including integrated circuits, printed circuit boards, connectors, cables, power supplies and memory parts, on a sole or limited source basis to third-party suppliers. We use contract manufacturers to assemble our components. Our manufacturing strategy centers on build-to-order systems, focusing on obtaining competitive assembly and component costs and concentrating on the final assembly, test and quality assurance stages. This strategy allows us to avoid the large capital commitment and overhead associated with establishing full-scale manufacturing facilities and to maintain the flexibility to adopt new technologies as they become available without the risk of equipment obsolescence, provide near real-time configuration changes to exploit faster and/or less expensive technologies and provide a higher level of large scale system quality. We perform final system integration, testing and quality check-out of our systems. Our manufacturing personnel are located primarily in Chippewa Falls, Wisconsin. We work closely with an original equipment manufacturer to provide integrated and tested Cray Sonexion storage products.
Our systems designed for the supercomputer market segment and our custom-engineered solutions incorporate components that are available from single or limited sources, often containing our proprietary designs. Such components include integrated circuits, interconnect systems and certain memory devices. Prior to development of a particular product, proprietary components are competitively bid to a short list of technology partners. The technology partner that provides the highest value solution for the component is generally awarded the contract for the life of the component. Once we have engaged a technology partner, changing our product designs to utilize another supplier’s integrated circuits can be a costly and time-consuming process. We also have sole or limited sources for less critical components, such as peripherals, power supplies, cooling and chassis hardware. We currently obtain key processors from AMD and NVIDIA for our Cray XE and XK systems and from Taiwan Semiconductor Manufacturing Company for our Cray future “big data” analytics solution and Gemini interconnect chip. In the near future we will incorporate processors from Intel. Our procurements from these vendors are primarily through purchase orders. We have chosen to deal with sole sources in specific cases due to the availability of specific technologies, economic advantages and other factors. Reliance on single or limited source vendors involves several risks, including the possibility of shortages of key components, long lead times, reduced control over delivery schedules and changes in direction by vendors. We have been adversely affected by delays in obtaining qualified competitive components in 2011 and in previous years.
Competition
The broad HPC market is very competitive. Many of our competitors in the U.S. and internationally are established companies well known in the HPC supercomputing market, including IBM, Hewlett-Packard, NEC, Hitachi, Fujitsu, Silicon Graphics International, and Bull S.A. Most of these competitors have substantially greater total research, engineering, manufacturing, marketing and financial resources than we do.
We also compete with systems builders and resellers of systems that are constructed from commodity components using processors manufactured by Intel, AMD and others. IBM builds systems leveraging third-party processors as well as its own processors. These competitors include the previously named companies and Dell Computer as well as smaller companies that assemble systems from commercially available commodity products. These companies have capitalized on developments in parallel processing and increased computer performance in commodity-based networking and cluster systems. While these companies’ products are more limited in applicability and scalability, they have achieved growing market acceptance as they can offer significant price/peak performance on larger problems lacking complexity. Such companies, because they may offer high peak performance per dollar, can put pricing pressure on us in certain procurements.
To the extent that Intel, IBM and other processor suppliers develop processors with greater capabilities than the processors we use from AMD, our Cray XE and Cray XK systems may be at a competitive disadvantage to systems utilizing such other processors. We expect to help mitigate this risk in the future when we begin to also provide Intel processors across our range of products, including in our “Cascade” systems.
8
Table of Contents
For our products designed for the supercomputer market segment, we compete primarily on the basis of product performance, scalability, breadth of features, price/performance, performance per unit of power, quality, reliability, upgradeability, service and support, corporate reputation, brand image and account relationships. Our market approach is more focused than many of our competitors, as we concentrate on high-end supercomputing with products designed for the needs of this specific market. We work to offer systems that provide greater performance on the largest, most difficult computational problems and superior price/performance on many important applications in the upper-end of the supercomputer market segment. Our systems often offer superior total cost of ownership advantages as they typically use less electric power and cooling and occupy less space than lower bandwidth cluster systems.
The competitive landscape in the “big data” market is similar to that of our high-end supercomputer systems (by company), though the majority of competition stems from vendors that offer large shared memory systems, like Silicon Graphics International, or commodity cluster systems with specialized software for data analytics. Also in the competitive field are business intelligence vendors such as Teradata, Oracle, EMC, Lexis-Nexis and IBM (Netezza). The market for knowledge discovery from “big data” is nascent and fragmented as no dominant applications have yet emerged and so custom and open source software approaches are generally used, such as Hadoop/MapReduce. We expect to compete primarily on the basis of product performance, ease of use, scalability and total cost of ownership. We believe our offerings can compete effectively on these factors and that our market approach is more focused than our competition, as we develop technologies specifically for complex analysis of large scale data.
Our storage products compete with a number of manufacturers and integrators of parallel storage solutions including IBM with its GPFS parallel filesystem and with Data Direct Network, NetApp, Terascala and others. The parallel storage and filesystem market is currently fragmented with a number of competing providers in the HPC marketplace. We believe our offerings have an advantage against our competition when the prospective target market has overlap with our system target market due to our experience, engineering know-how and reputation in high-performance computing.
The market for our technology in custom engineering is competitive. Competition typically occurs at the design stage of a prospective customer’s proposed product or need, where the customer evaluates alternative technologies and design approaches. A design win provides an initial engagement, and while it often leads to a long-term multi-phase engagement of development, manufacturing and support, there is no guarantee of the subsequent phases. The principal competitive factors in our market are product performance, reputation, ability to execute on time, price and integration and support services. Our competitive strengths include innovative engineering, deep knowledge of relevant technologies, a reputation for quality, and our ability to respond to varied customer requirements. There are a limited number of competitors with which we compete but most of them are much larger and thus have greater resources than we do. We compete primarily with defense contractors, such as General Dynamics, Lockheed Martin and Northrop Grumman and selected systems vendors such as IBM and Hewlett-Packard. Like us, these competitors have long-standing customer relationships and government program insights, but given their size, their reach and breadth of services are much greater.
Intellectual Property
We attempt to protect our trade secrets and other proprietary rights through formal agreements with our employees, customers, suppliers and consultants, and through patent protection. Although we intend to protect our rights vigorously, there can be no assurance that our contractual and other security arrangements will be successful.
Our general policy is to seek patent protection for those inventions and improvements that give us a competitive advantage and are likely to be incorporated into our products and services. We have a number of patents and pending patent applications relating to our hardware and software technologies. While we believe our patents and applications have value, no single patent or group of patents is in itself essential to us as a whole or to any of our key products. Any of our proprietary rights could be challenged, invalidated or circumvented and may not provide significant competitive advantage.
9
Table of Contents
We have licensed certain patents and other intellectual property from Silicon Graphics International. We obtained our initial license to these patents and intellectual property as a result of our acquisition of the Cray Research operations from Silicon Graphics, Inc. These licenses contain restrictions on our use of the underlying technology, generally limiting the use to historic Cray products. We have also entered into cross-license arrangements with other companies involved in the HPC industry.
Backlog
We do not believe backlog is a meaningful indicator of our future business prospects due to the uncertainty of converting orders into recognized revenue in any given period or at all. Factors impacting the amount of backlog and our ability to recognize revenue from backlog in any given period include the possibility of significant contract amendments, the timing of our product development, manufacturing and delivery schedules and changes in delivery schedules requested by our customers. Therefore, we believe that backlog information is not material to an understanding of our overall business.
Employees
As of December 31, 2011, we had 860 employees. We have no collective bargaining agreement with our employees. We have not experienced a work stoppage and believe that our employee relations are very good.
Available Information
Our annual reports on Form 10-K, quarterly reports on Form 10-Q, current reports on Form 8-K and amendments to those reports filed or furnished pursuant to Section 13(a) or 15(d) of the Securities Exchange Act of 1934, as amended, are available free of charge at our website at www.cray.com, as soon as reasonably practicable after we file such reports with the SEC electronically. The public may read and copy any materials that we file with the SEC at the SEC’s Public Reference Room at 100 F Street, NE, Washington, DC 20549. The public may obtain information on the operation of the Public Reference Room by calling the SEC at 1-800-SEC-0330. The SEC also maintains an internet site that contains reports, proxy and information statements, and other information regarding issuers that file electronically with the SEC at www.sec.gov. In addition, we have set forth our Code of Business Conduct, Corporate Governance Guidelines, the charters of the Audit, Compensation, Corporate Governance and Strategic Technology Assessment Committees of our Board of Directors and other governance documents on our website, www.cray.com, under “Investors — Corporate Governance.”
In addition to the other information contained in this annual report, you should carefully read and consider the following risk factors. If any of these risks actually occur, our business, financial condition or operating results could be materially adversely affected and the trading price of our common stock could decline.
Our operating results fluctuate significantly and we may not achieve profitability in any given period. Our operating results are subject to significant fluctuations which make estimating revenue and operating results for any specific period very difficult, particularly because a material portion of product revenue recognized in any given quarter or year typically depends on a very limited number of system sales expected for that quarter or year and the product revenue generally depends on the timing of product acceptances by customers and contractual provisions affecting revenue recognition. Delays in recognizing revenue from a product transaction or transactions due to development or product delivery delays, not receiving needed components timely or with anticipated quality and performance, not achieving customer acceptances of installed systems, contractual provisions or for other reasons, could have a material adverse effect on our operating results in any specific quarter or year, and could shift associated revenue, gross profit and cash receipts from one quarter to another, or even from one year to another in the case of revenue expected to be realized in the fourth quarter of any year. The amount and timing of research and development co-funding (such as from our DARPA, High Productivity Computing Systems, or HPCS program) can also materially affect our expenses for any given quarter or year. In addition, because our revenue is often concentrated in particular quarters rather than evenly spread throughout a year, we generally do not expect to sustain profitability over successive quarters even if we are profitable for the year.
10
Table of Contents
Although we recorded positive net income in 2010 and 2011, we have historically experienced net losses and, prior to 2010, had last recorded positive annual net income in 2003. For example, we recorded a net loss of $10.6 million in 2007, a net loss of $40.7 million in 2008, which included a non-cash goodwill impairment charge of approximately $54.5 million and a net loss of $0.6 million in 2009. Net income in 2011 benefited from the partial reduction of the valuation allowance held against our U.S. deferred tax assets of $13.9 million and a complete reduction of the valuation allowance held against the deferred tax assets of our German subsidiary of $0.8 million.
Whether we will be able to increase our revenue and achieve and sustain profitability on a quarterly and annual basis depends on a number of factors, including:
| • | successfully delivering and obtaining customer acceptances of our Cray XE6 and Cray XK6 systems, including the systems delivered or to be delivered to the Department of Energy’s Oak Ridge National Laboratory and the University of Illinois’ National Center for Supercomputing Applications; |
| • | the level of revenue recognized in any given period, which is affected by the very high average sales prices and limited number of significant system sales and resulting potential acceptances in any quarter, the timing of product acceptances by customers and contractual provisions affecting the timing and amount of revenue recognition; |
| • | revenue delays or losses due to customers postponing purchases to wait for future upgraded or new systems, delays in delivery of upgraded or new systems, longer than expected customer acceptance cycles or penalties resulting from system acceptance issues; |
| • | our ability to successfully and timely design, integrate and secure competitive processors for our Cray XE6 and Cray XK6 systems and upgrades and successors systems, including for the planned upgrade to our current Cray XK6 system that will be based on the NVIDIA “Kepler” GPUs; |
| • | our ability to secure orders for our Cray XE6/Cray XE6m and Cray XK6/Cray XK6m systems as well as upgrades and successor systems; |
| • | our ability to successfully generate revenue and profitability from opportunities developed from our YarcData division and storage & data management business; |
| • | our expense levels, including research and development expense net of government funding, which are affected by the amount and timing of such funding and the meeting of contractual development milestones, including the milestones under our DARPA HPCS program; |
| • | our ability to secure additional government funding for future development projects, in particular funding targeted for “exascale” computing initiatives; |
| • | the level of product gross profit contribution in any given period due to volume or product mix, competitive factors, strategic transactions, product life cycle, currency fluctuations, acceptance penalties and component costs; |
| • | the competitiveness of our products; |
| • | maintaining our product development projects on schedule and within budgetary limitations; |
| • | the level and timing of maintenance contract renewals with existing customers; |
| • | the terms and conditions of sale or lease for our products and services. |
The receipt of orders and the timing of shipments and acceptances impact our quarterly and annual results, including cash flows, and are affected by events outside our control, such as:
| • | the timely availability of acceptable components, including, but not limited to, processors, in sufficient quantities to meet customer delivery schedules; |
| • | the timing and level of government funding for product acquisitions and research and development contracts, which may be adversely affected by the current economic and fiscal uncertainties and increased governmental budgetary limitations; |
| • | the introduction or announcement of competitive or key industry supplier products; |
| • | price fluctuations in the commodity electronics, processor and memory markets; |
11
Table of Contents
| • | general economic trends, including changes in levels of customer capital spending; |
| • | the availability of adequate customer facilities to install and operate new Cray systems; |
| • | currency fluctuations, international conflicts or economic crises, including the ongoing macroeconomic challenges in the United States and the debt crisis in certain countries in the European Union; and |
| • | the receipt and timing of necessary export licenses. |
Because of the numerous factors affecting our revenue and results of operations, we may not have net income on a quarterly or annual basis in the future. We anticipate that our quarterly results will fluctuate significantly, and include losses, even in years where we expect or achieve positive annual net income. Delays in component availability, product development, receipt of orders, level and timing of approved government fiscal budgets, product acceptances, reductions in outside funding for our research and development efforts and achieving contractual development milestones have had a substantial adverse effect on our past results and could continue to have such an effect on our results in 2012 and in future years.
If we are unable to complete and obtain acceptance on the final DARPA milestones when or as expected or at all, our net research and development expenditures would increase significantly and our operating results would be adversely affected. The DARPA HPCS program calls for the delivery of prototype systems in late 2012, and currently provides for a contribution by DARPA to us of up to $180 million assuming we meet certain milestones, $158 million of which we had already earned as of December 31, 2011, leaving $22 million to be earned through three milestones. In February of 2010, the total possible contribution from DARPA over the term of the HPCS program was reduced from $250 million to $190 million and, in October 2011, it was further reduced to $180 million. If the completion of any remaining development milestone is delayed, our reported net research and development expenses, and our operating results, would be adversely affected. If we are unable to complete the remaining milestones, or one or more milestone payments are delayed, reduced and/or eliminated or the program is terminated, our cash flows and expenses would be adversely impacted. If we do not achieve and have accepted a milestone in the period we had originally estimated, we may incur research and development expense without offsetting co-funding by DARPA, resulting in increased net research and development expense during the period. We incurred some delays in payments for program milestones by DARPA in 2007 and 2008; in addition, as a result of our discussions with DARPA on the changes in scope and program schedule, results for the third and fourth quarters of 2009 and full-year 2009 were adversely impacted by delays in completing development milestones. The amount of DARPA funds we can recognize as an offset to our periodic research and development expenses depends on our estimates of the total costs and the time to complete the program; changes in our estimates may decrease the amount of funding recognized in any period, which may increase the amount of net research and development expense recognized in that quarter. DARPA’s future financial commitments are subject to subsequent Congressional and federal inter-agency action, and our development efforts and the level of reported research and development expenses would be adversely impacted if DARPA does not receive expected funding, a delay in the timing of milestones or a decision to terminate the program before completion.
If our current and future strategic initiatives targeting markets outside of our traditional markets, primarily our YarcData division and storage & data management business, are not successful, our ability to grow our revenues and achieve and sustain profitability will be adversely affected. Our ability to materially grow our revenues and achieve and sustain profitability will be adversely affected if we are unable to generate sufficient revenue from strategic initiatives targeting markets outside of our traditional market, particularly if those market segments do not grow significantly. We are currently focusing on data analytics and storage & data management opportunities originally developed from our Custom Engineering business and selling our Cray XE6m and Cray XK6m systems into the mid-sized supercomputing segment. To grow our revenue from new opportunities outside our primary market, we must continue to win awards for new contracts, timely perform on existing contracts, develop our capability for broader market sales and business development and successfully develop and introduce new solution-oriented offerings, notwithstanding that these are relatively new businesses for Cray and we do not have significant experience targeting these markets. The Cray XE6m, Cray XK6m and successor systems require successful sales in a lower priced segment of the supercomputer market as well as in relatively new commercial market segments. These data analytics and storage & data management opportunities and our Cray XE6m/Cray XK6m (and successor systems) efforts require monetary investments ahead of revenue, including adding experienced personnel and initiating new marketing and sales efforts.
12
Table of Contents
If the U.S. government and other governments purchase, or fund the purchase of, fewer supercomputers or delay such purchases, our revenue would be reduced and our operating results would be adversely affected. Historically, sales to the U.S. government and customers primarily serving the U.S. government have represented the largest single market segment for supercomputer sales worldwide, including our products and services. In 2009, 2010 and 2011, approximately 72%, 62% and 54% respectively, of our revenue was derived from such sales. Our plans for the foreseeable future contemplate significant sales to U.S. government agencies and customers primarily serving the U.S. government. Sales to government agencies and customers primarily serving the U.S. government, including further sales pursuant to existing contracts, may be adversely affected by factors outside our control, such as the current economic uncertainty, the downgrading of U.S. government debt, the political climate in a U.S. presidential election year focusing on cutting or limiting budgets and their effect on government budgets, the effects of the potential Congressional failure or success in addressing, limits on federal borrowing capacity, changes in procurement policies, budgetary considerations including Congressional delays in completing appropriation bills as occurred in 2011, domestic crises, and international political developments, such as the downgrading of European debt. If agencies and departments of the United States or other governments were to stop, reduce or delay their use and purchases of supercomputers, our revenue and operating results would be adversely affected.
Our reliance on third-party suppliers poses significant risks to our operating results, business and prospects. We rely upon third-party vendors to supply processors for our systems and storage subsystems and use service providers to co-develop key technologies, including integrated circuit design and verification. We subcontract the manufacture of a majority of the hardware components for our high-end products, including integrated circuits, printed circuit boards, connectors, cables, power supplies and memory parts, on a sole or limited source basis to third-party suppliers. We use contract manufacturers to assemble certain important components for all of our systems. We also rely on third parties to supply key software and hardware capabilities, such as file systems, solution-specific servers and storage subsystems. Because specific components must be designed into our systems well in advance of initial deliveries of those systems, we are particularly reliant on our processor vendors to deliver on the capabilities and pricing expected at the time we design key elements of the system. We are subject to substantial risks because of our reliance on these and other limited or sole source suppliers, including the following risks:
| • | If a supplier does not provide components that meet our specifications in sufficient quantities on time or deliver when required, then production, delivery, acceptance and revenue from our systems could be delayed and we could be subject to costly penalties even once delivered and accepted, which happened during the fourth quarter of 2011 and adversely affected our efforts to complete the acceptance process on the Cray XK6 upgrade at Oak Ridge National Laboratory, which in turn significantly lowered our total revenue for fiscal year 2011; |
| • | If an interruption of supply of our components, services or capabilities occurs because a supplier changes its technology roadmap, decides to no longer provide those products or services, increases the price of those products or services significantly or imposes reduced delivery allocations on its customers, it could take us a considerable period of time to identify and qualify alternative suppliers, to redesign our products as necessary and to begin to manufacture the redesigned components or otherwise obtain those services or capabilities. In some cases, such as with key integrated circuits and memory parts or processors, we may not be able to redesign such components or find alternate sources that we could use in any realistic timeframe; |
| • | If a supplier of a component is subject to a claim that the component infringes a third-party’s intellectual property rights, as has happened with one of our suppliers, our ability to obtain necessary components could be adversely affected or our cost to obtain such components could increase significantly; |
| • | If a supplier providing us with key research and development and design services or core technology components with respect to integrated circuit design, network communication capabilities or software is late, fails to provide us with effective functionality or loses key internal talent, our development programs may be delayed or prove to be impossible to complete; |
| • | If a supplier cannot provide a competitive key component (for example, due to inadequate performance or a prohibitive price) or eliminates key features from components, such as with the processors we design into our systems, our systems may be less competitive than systems using components with greater capabilities; |
13
Table of Contents
| • | As a result of the unprecedented flooding in Thailand in 2011 and the impact the flooding had on the suppliers of hard disk drives, we may have difficulty obtaining the quantity of hard disk drives required to satisfy the production and sales of our systems; |
| • | If a supplier provides us with hardware or software that contains bugs or other errors or is different from what we expected, as is occurring with a key component, our development projects and production systems may be adversely affected through reduced performance or capabilities, additional design testing and verification efforts, re-spins of integrated circuits and/or development of replacement components, and the production and sales of our systems could be delayed and systems installed at customer sites could require significant, expensive field component replacements or result in penalties; |
| • | Some of our key component and service suppliers are small companies with limited financial and other resources, and consequently may be more likely to experience financial and operational difficulties than larger, well-established companies, which increases the risk that they will be unable to deliver products as needed; and |
| • | If a key supplier is acquired or has a significant business change, such as the acquisition of our file system software provider by our competitor Sun Microsystems and the subsequent acquisition of Sun by Oracle, the production and sales of our systems and services may be delayed or adversely affected, or our development programs may be delayed or may be impossible to complete. |
For example, our DARPA HPCS project was adversely affected by changes by a major microprocessor supplier in its high performance technology roadmap that affected our ability to complete that program successfully and resulted in a reduction in the amount of funding we could receive from DARPA by $60 million. In addition, our Cray XE6 and Cray XE6m systems are based on certain AMD Opteron processors. Delays in the availability of certain acceptable reliable components, including processors and memory parts, and increases in order lead times for certain components, adversely affected our revenue and operating results in prior periods, including in 2011, and could adversely affect future results. In particular, planned upgrades to and variants of our Cray XK6 and Cray XK6m systems are dependent upon the NVIDIA “Kepler” graphics processors. If we are unable to obtain adequate quantities of this processor when needed or meet the anticipated specifications our revenue in 2012 and in subsequent periods would be adversely affected.
If we are unable to secure additional government research and development funding, our desired strategy would be adversely affected and our ability to conduct research and development would decrease. The significant government research and development funding we receive from the DARPA HPCS program is scheduled to end in 2012. If we are unable to secure sufficient additional government research and development funding beyond 2012, in particular funding targeted for “exascale” computing initiatives, or similar next-generation technology development government initiatives, our desired strategy would be adversely affected and our ability to continue research and development efforts on next-generation systems would decrease.
If we are unable to compete successfully in the highly competitive HPC market, our business will not be successful. The market for HPC systems is very competitive. An increase in competitive pressures in our market or our failure to compete effectively may result in pricing reductions, reduced gross margins and loss of market share and revenue. Many of our competitors are established companies well known in the HPC market, including IBM, NEC, Hewlett-Packard, Fujitsu, Hitachi, Silicon Graphics International, and Bull S.A. Most of these competitors have substantially greater research, engineering, manufacturing, marketing and financial resources than we do. We also compete with systems builders and resellers of systems that are constructed from commodity components using processors manufactured by Intel, AMD and others. These competitors include the companies named above and Dell, with IBM using both third-party processors and its own proprietary processors, as well as smaller companies that benefit from the low research and development costs needed to assemble systems from commercially available commodity products. Such companies, because they can offer high peak performance per dollar, can put pricing pressure on us in certain competitive procurements. In addition, to the extent that Intel, IBM and other processor suppliers develop processors with greater capabilities or at a lower cost than the processors we currently use, such as those from AMD, our Cray XE6, Cray XE6m, Cray XK6 and successor systems may be at a competitive disadvantage to systems utilizing such other processors until we can design in, integrate and secure competitive processors, if at all. Although our collaboration with Intel is intended to help mitigate this risk, Intel processors are not expected to be delivered in our supercomputers targeted at the high-end of the supercomputer market segment until 2013.
14
Table of Contents
Periodic announcements by our competitors of new HPC systems or plans for future systems and price adjustments may reduce customer demand for our products. Many of our potential customers already own or lease high performance computer systems. Some of our competitors may offer substantial discounts to potential customers. We have in the past and may again be required to provide substantial discounts to make strategic sales, which may reduce or eliminate any gross profit on such transactions, or to provide lease financing for our products, which could result in a deferral of our receipt of cash and revenue for these systems. These developments limit our revenue and resources and reduce our ability to be profitable.
If we are unable to successfully sell and deliver our Cray XE6 and the Cray XK6 systems and develop, sell and deliver successor systems, such as our “Cascade” system, our operating results will be adversely affected. We expect that a substantial portion of our revenue in the foreseeable future will come from sales and deliveries of Cray XE6 and successor systems, such as our “Cascade” system, and systems including integration of GPU “accelerators,” such as with the Cray XK6 systems, or future processors. Because of the long technology development cycles required to compete effectively in this market, we must begin development of products years ahead of our ability to sell such systems. With procurements for large systems that require that we link together multiple cabinets containing powerful processors and other components into an integrated system, our Cray XE6, Cray XK6 and successor systems, such as our “Cascade” system, must also scale to unprecedented levels of performance. During our internal testing and the customer acceptance processes, we may discover that we cannot achieve acceptable system stability or scalability across these large systems without incurring significant additional delays and expense. Any additional delays in receiving acceptable components or in product development, assembly, final testing and obtaining large system stability would delay delivery, installation and acceptance of Cray XE6, Cray XK6 and successor systems, such as our “Cascade” system.
Many factors affect our ability to successfully develop and sell these systems, including the following:
| • | The level of product differentiation in our Cray XE6, Cray XK6 and successor systems, such as our “Cascade” system. We need to compete successfully against HPC systems from large established companies and lower bandwidth, commodity “cluster” systems from both large, established companies and smaller companies and demonstrate the value of our balanced high bandwidth systems. |
| • | Our ability to meet all customer requirements for acceptance. Even once a system has been delivered, we sometimes do not meet all of the contract requirements for customer acceptance and ongoing reliability of our systems within the provided-for acceptance period, which has resulted in contract penalties and delays in our ability to recognize revenue from system deliveries. Most often these penalties have adversely affected gross profit through the provision of additional equipment and services and/or service credits to satisfy delivery delays and performance shortfalls. The risk of contract penalties is increased when we bid for new business prior to completing development of new products when we must estimate future system performance, such as was required with our Cray XE6 and Cray XK6 systems and is occurring for subsequent systems. |
| • | Our ability to source competitive, key components in appropriate quantities, in a timely fashion and on acceptable terms and conditions. If we underestimated our needs, we could limit the number of possible sales of these products and reduce potential revenue, or if we overestimated, we could incur inventory obsolescence charges and reduce our gross profit, as has happened in the past. |
| • | Whether potential customers delay purchases of our products because they decide to wait for successor systems or upgrades that we have announced, such as our “Cascade” system, or they believe will be available in the future. |
Failure to successfully sell our Cray XE6 and Cray XK6 systems and develop and sell upgrades and successor systems, such as our “Cascade” system, into the high-end of the HPC market will adversely affect our operating results.
15
Table of Contents
Customers and other third parties may make statements speculating about or announcing an intention to complete purchases of Cray products before such purchases are substantially certain, and these proposed purchases may not be completed when or as expected, if at all. From time to time, customers and other third parties may make statements speculating about or announcing a potential purchase of Cray products before Cray has obtained an order for such purchases or completed negotiations and signed a contract for the purchase of such products. In some instances, government and government-funded customers may announce possible purchases even before they have obtained the necessary budget to procure the products. As a result, these statements or announcements do not mean that Cray will ultimately be able to secure the sale when or as expected or at all as it is not certain that the contract or order negotiations will be completed successfully or as expected or that the customer will be able to obtain the budget they hope for or expect.
The continuing commoditization of HPC hardware and software has resulted in pricing pressure and may adversely affect our operating results. The continuing commoditization of HPC hardware, particularly processors and interconnect systems, and the growing commoditization of software, including plentiful building blocks and more capable open source software, as well as the potential for integration of differentiated technology into already-commoditized components, has resulted in, and may result in, the expansion and acceptance of lower-bandwidth cluster systems using processors manufactured by Intel, AMD and others combined with commercially available commodity networking and other components. These systems may offer higher theoretical peak performance for equivalent cost than equivalent Cray systems, and “price/peak performance” is often the dominant factor in HPC procurements outside of the high-end HPC or supercomputer market segment. Vendors of such systems often put pricing pressure on us in competitive procurements, even at times in larger procurements, and this pricing pressure may cause us to reduce our pricing in order to remain competitive which can negatively impact our gross margins and adversely affect our operating results.
Failure to overcome the technical challenges of developing competitive supercomputer systems well in advance of when they can be sold would adversely affect our revenue and operating results in subsequent years. We continue to develop successor systems to the Cray XE6 and Cray XK6 systems, such as our “Cascade” system, and expect to incorporate Intel technologies into our products as part of our DARPA HPCS program and our “Cascade” systems. We are also planning to continue to incorporate GPU “accelerators” into our supercomputer systems, such as with the Cray XK6 systems. The incorporation of GPUs and future many-core processors into our systems designed for the supercomputing segment of the market poses unique challenges in both hardware and software integration.
These development efforts are lengthy and technically challenging processes, and require a significant investment of capital, engineering and other resources often years ahead of the time when we can be assured that they will result in competitive products. We may invest significant resources in alternatives that prove ultimately unfruitful. Unanticipated performance and/or development issues may require more engineers, time or testing resources than are currently available. In the past several years, directing engineering resources to solving current issues has adversely affected the timely development of successor products required for our longer-term product roadmap. Given the breadth of our engineering challenges and our limited engineering and technical personnel resources, we periodically review the anticipated contributions and expense of our product programs to determine their long-term viability, and we may substantially modify or terminate one or more development programs. We may not be successful in meeting our development schedules for technical reasons and/or because of insufficient engineering resources, which could result in an uncompetitive product or cause a lack of confidence in our capabilities among our key customers. To the extent that we incur delays in completing the design, development and production of hardware components, delays in development of requisite system software, cancellation of programs due to technical or economic infeasibility or investment in unproductive development efforts, our revenue, results of operations and cash flows, and the reputation of such systems in the market, could be adversely affected.
16
Table of Contents
We are subject to increasing government regulations and other requirements due to the nature of our business, which may adversely affect our business operations. In 2009, 2010 and 2011, 72%, 62% and 54% respectively, of our revenue was derived from the U.S. government or customers primarily serving the U.S. government. In addition to normal business risks, our contracts with the U.S. government are subject to unique risks, some of which are beyond our control. Our contracts with the U.S. government are subject to particular risks, including:
The funding of U.S. government programs is subject to congressional appropriations. Many of the U.S. government programs in which we participate may extend for several years; however, these programs are normally funded annually. Changes in U.S. strategy and priorities, particularly in this U.S. Presidential election year, may affect our future procurement opportunities and existing programs. Long-term government contracts and related orders are subject to cancellation, or delay, if appropriations for subsequent performance periods are not made. The termination of funding for existing or new U.S. government programs could result in a material adverse effect on our results of operations and financial condition.
The U.S. government may modify, curtail or terminate its contracts with us. The U.S. government may modify, curtail or terminate its contracts and subcontracts with us, without prior notice at its convenience upon payment for work done and commitments made at the time of termination. Modification, curtailment or termination of our major programs or contracts could have a material adverse effect on our results of operations and financial condition.
Our U.S. government contract costs are subject to audits by U.S. government agencies. U.S. government representatives may audit the costs we incur on our U.S. government contracts, including allocated indirect costs. Such audits could result in adjustments to our contract costs. Any costs found to be improperly allocated to a specific contract will not be reimbursed, and such costs already reimbursed must be refunded. If any audit uncovers improper or illegal activities, we may be subject to civil and criminal penalties and administrative sanctions, including termination of contracts, forfeiture of profits, suspension of payments, fines and suspension or prohibition from doing business with the U.S. government.
Our business is subject to potential U.S. government inquiries and investigations. We may be subject to U.S. government inquiries and investigations of our business practices due to our participation in government contracts. Any such inquiry or investigation could potentially result in a material adverse effect on our results of operations and financial condition.
Our U.S. government business is also subject to specific procurement regulations and other requirements. These requirements, although customary in U.S. government contracts, increase our performance and compliance costs. These costs might increase in the future, reducing our margins, which could have a negative effect on our financial condition. Failure to comply with these regulations and requirements could lead to suspension or debarment, for cause, from U.S. government contracting or subcontracting for a period of time and could have a negative effect on our reputation and ability to secure future U.S. government contracts.
U.S. export controls could hinder our ability to make sales to foreign customers and our future prospects. The U.S. government regulates the export of HPC systems such as our products. Occasionally we have experienced delays for up to several months in receiving appropriate approvals necessary for certain sales, which have delayed the shipment of our products. Delay or denial in the granting of any required licenses could make it more difficult to make sales to certain foreign customers, eliminating an important source of potential revenue. Our ability to have certain components manufactured in certain foreign countries for a lower cost has also been adversely affected by export restrictions covering information necessary to allow such foreign manufacturers to manufacture components for us.
17
Table of Contents
If we cannot retain, attract and motivate key personnel, we may be unable to effectively implement our business plan. Our success depends in large part upon our ability to retain, attract and motivate highly skilled management, development, marketing, sales and service personnel. The loss of and failure to replace key engineering management and personnel could adversely affect multiple development efforts. Recruitment and retention of senior management and skilled technical, sales and other personnel is very competitive, and we may not be successful in either attracting or retaining such personnel. From time to time, we have lost key personnel to other high technology companies. For example, during the third quarter of 2011 our Chief Technology Officer resigned to join another company in our industry. As part of our strategy to attract and retain key personnel, we may offer equity compensation through stock options and restricted stock grants. Potential employees, however, may not perceive our equity incentives as attractive enough and current employees who have significant options with exercise prices significantly above current market values for our common stock may seek other employment. In addition, due to the intense competition for qualified employees, we may be required to increase the level of compensation paid to existing and new employees, which could materially increase our operating expenses.
Our stock price is volatile. The trading price of our common stock is subject to significant fluctuations in response to many factors, including our quarterly operating results, changes in analysts’ estimates or our outlook, our capital raising activities, announcements of technological innovations and customer contracts by us or our competitors, a significant aggressive seller or buyer, general economic conditions and conditions in our industry.
We may infringe or be subject to claims that we infringe the intellectual property rights of others. Third parties in the past have asserted, and may in the future assert intellectual property infringement claims against us. As a result of such intellectual property infringement claims, we could be required or otherwise decide that it is appropriate to:
| • | pay third-party infringement claims; |
| • | discontinue manufacturing, using, or selling particular products subject to infringement claims; |
| • | discontinue using the technology or processes subject to infringement claims; |
| • | develop other technology not subject to infringement claims, which could be time-consuming and costly or may not be possible; or |
| • | license technology from the third-party claiming infringement, which license may not be available on commercially reasonable terms. |
Regardless of the merits, any intellectual property infringement claim would require management attention and could be expensive to defend.
We incorporate software licensed from third parties into the operating systems for our products as well as in our tools to design products and any significant interruption in the availability of these third-party software products or defects in these products could reduce the demand for our products or cause delay in development. The operating system as well as other software we develop for our HPC systems contains components that are licensed to us under open source software licenses. Our business could be disrupted if this software, or functional equivalents of this software, were either no longer available to us or no longer offered to us on commercially reasonable terms. In either case we would be required to redesign our operating system software to function with alternative third-party software, or develop these components ourselves, which would result in increased costs and could result in delays in product shipments. Our supercomputer systems utilize software system variants that incorporate Linux technology. The open source licenses under which we have obtained certain components of our operating system software may not be enforceable. Any ruling by a court that these licenses are not enforceable, or that Linux-based operating systems, or significant portions of them, may not be copied, modified or distributed as provided in those licenses, would adversely affect our ability to sell our systems. In addition, as a result of concerns about the risks of litigation and open source software generally, we may be forced to protect our customers from potential claims of infringement. In any such event, our financial condition and results of operations may be adversely affected.
18
Table of Contents
We also incorporate proprietary incidental software from third parties, such as for file systems, job scheduling and storage subsystems. We have experienced some functional issues in the past with implementing such software with our supercomputer systems. In addition, we may not be able to secure needed software systems on acceptable terms, which may make our systems less attractive to potential customers. These issues may result in lost revenue, additional expense by us and/or loss of customer confidence.
We are required to evaluate our internal control over financial reporting under Section 404 of the Sarbanes-Oxley Act of 2002 at the end of each fiscal year, and any adverse results from such future evaluations could result in a loss of investor confidence in our financial reports and have an adverse effect on our stock price. Pursuant to Section 404 of the Sarbanes-Oxley Act of 2002, we are required to furnish a report by our management and a report by our independent registered public accounting firm on our internal control over financial reporting in our annual reports on Form 10-K as to whether we have any material weaknesses in our internal controls over financial reporting. Depending on their nature and severity, any future material weaknesses could result in our having to restate financial statements, could make it difficult or impossible for us to obtain an audit of our annual financial statements or could result in a qualification of any such audit. In such events, we could experience a number of adverse consequences, including our inability to comply with applicable reporting and listing requirements, a loss of market confidence in our publicly available information, delisting from the NASDAQ Global Market, an inability to complete a financing, loss of other financing sources such as our line of credit, and litigation based on the events themselves or their consequences.
We may not be able to protect our proprietary information and rights adequately. We rely on a combination of patent, copyright and trade secret protection, nondisclosure agreements and licensing arrangements to establish, protect and enforce our proprietary information and rights. We have a number of patents and have additional applications pending. There can be no assurance, however, that patents will be issued from the pending applications or that any issued patents will adequately protect those aspects of our technology to which such patents will relate. Despite our efforts to safeguard and maintain our proprietary rights, we cannot be certain that we will succeed in doing so or that our competitors will not independently develop or patent technologies that are substantially equivalent or superior to our technologies. The laws of some countries do not protect intellectual property rights to the same extent or in the same manner as do the laws of the United States. Additionally, under certain conditions, the U.S. government might obtain non-exclusive rights to certain of our intellectual property. Although we continue to implement protective measures and intend to defend our proprietary rights vigorously, these efforts may not be successful.
Provisions of our Restated Articles of Incorporation and Bylaws could make a proposed acquisition of Cray that is not approved by our Board of Directors more difficult. Provisions of our Restated Articles of Incorporation and Bylaws could make it more difficult for a third-party to acquire us. These provisions could limit the price that investors might be willing to pay in the future for our common stock. For example, our Restated Articles of Incorporation and Bylaws provide for:
| • | removal of a director only in limited circumstances and only upon the affirmative vote of not less than two-thirds of the shares entitled to vote to elect directors; |
| • | the ability of our Board of Directors to issue up to 5,000,000 shares of preferred stock, without shareholder approval, with rights senior to those of the common stock; |
| • | no cumulative voting of shares; |
| • | the right of shareholders to call a special meeting of the shareholders only upon demand by the holders of not less than 30% of the shares entitled to vote at such a meeting; |
| • | the affirmative vote of not less than two-thirds of the outstanding shares entitled to vote on an amendment, unless the amendment was approved by a majority of our continuing directors, who are defined as directors who have either served as a director since August 31, 1995, or were nominated to be a director by the continuing directors; |
| • | special voting requirements for mergers and other business combinations, unless the proposed transaction was approved by a majority of continuing directors; |
| • | special procedures to bring matters before our shareholders at our annual shareholders’ meeting; and |
| • | special procedures to nominate members for election to our Board of Directors. |
19
Table of Contents
These provisions could delay, defer or prevent a merger, consolidation, takeover or other business transaction between us and a third-party that is not approved by our Board of Directors.
Item 1B. Unresolved Staff Comments
None.
Our principal properties are as follows:
| Location of Property |
Uses of Facility |
Approximate Square Footage |
||||
| Chippewa Falls, WI |
Manufacturing, hardware development, central service and warehouse | 227,800 | ||||
| Seattle, WA |
Executive offices, hardware and software development, sales and marketing | 54,000 | ||||
| St. Paul, MN |
Software development, sales and marketing | 62,200 | ||||
We own 179,200 square feet of manufacturing, development, service and warehouse space in Chippewa Falls, Wisconsin, and lease the remaining space described above.
We lease a total of 8,594 square feet of office space, primarily for hardware development, in Austin, Texas. We lease a total of 5,600 square feet of office space, primarily for software development, in Pleasanton, California. We also lease a total of approximately 6,200 square feet, primarily for sales and service offices, in other domestic locations. In addition, various foreign sales and service subsidiaries have leased an aggregate of approximately 12,600 square feet of office space. We believe our facilities are adequate to meet our needs at least through 2012.
We are currently not a party to any material legal proceedings.
Item 4. Mine Safety Disclosures
Not applicable.
20
Table of Contents
Item 5. Market for the Registrant’s Common Equity, Related Shareholder Matters and Issuer Purchases of Equity Securities
Price Range of Common Stock and Dividend Policy
Our common stock is traded on the Nasdaq Global Market under the symbol CRAY. On February 15, 2012, we had 36,778,889 shares of common stock outstanding that were held by 355 holders of record.
The quarterly high and low sales prices of our common stock for the periods indicated are as follows:
| High | Low | |||||||
| Year Ended December 31, 2011: |
||||||||
| First Quarter |
$ | 8.38 | $ | 6.14 | ||||
| Second Quarter |
$ | 6.87 | $ | 5.83 | ||||
| Third Quarter |
$ | 6.52 | $ | 4.97 | ||||
| Fourth Quarter |
$ | 6.85 | $ | 4.96 | ||||
| Year Ended December 31, 2010: |
||||||||
| First Quarter |
$ | 6.85 | $ | 4.52 | ||||
| Second Quarter |
$ | 7.45 | $ | 4.51 | ||||
| Third Quarter |
$ | 6.90 | $ | 4.95 | ||||
| Fourth Quarter |
$ | 7.70 | $ | 5.39 | ||||
We have not paid cash dividends on our common stock and we do not anticipate paying any cash dividends on our common stock in the foreseeable future.
Equity Compensation Plan Information
The following table provides information as of December 31, 2011, with respect to compensation plans under which shares of our common stock are authorized for issuance, including plans previously approved by our shareholders and plans not previously approved by our shareholders.
| Plan Category |
Number of Shares of Common Stock to be Issued Upon Exercise of Outstanding Options, Warrants and Rights |
Weighted-Average Exercise Price of Outstanding Options, Warrants and Rights |
Number of Shares of Common Stock Available for Future Issuance Under Equity Compensation Plans (excluding shares reflected in 1st column) |
|||||||||
| Equity compensation plans approved by shareholders(1) |
2,913,857 | $ | 6.40 | 2,476,528 | ||||||||
| Equity compensation plans not approved by shareholders(2) |
504,063 | $ | 5.61 | — | ||||||||
|
|
|
|
|
|||||||||
| Total |
3,417,920 | $ | 6.28 | 2,476,528 | ||||||||
| (1) | The shareholders approved our 1995, 1999 and 2003 stock option plans, our 2004, 2006 and 2009 long-term equity compensation plans and our 2001 employee stock purchase plan (including as amended); the 1995 and 1999 stock option plans have terminated and no more options may be granted under those plans. Pursuant to these stock option plans, incentive options may be granted to employees (including officers) and nonqualified options may be granted to employees, officers, directors, agents and consultants with exercise prices at least equal to the fair market value of the underlying common stock at the time of grant. While the Board may grant options with varying vesting periods under these plans, most options granted to employees vest over four years, with 25% of the options vesting after one year and the remaining options vesting monthly over the next three years, and most option grants to non-employee directors vesting monthly over the twelve months after grant. Under the 2004, 2006 and 2009 long-term equity compensation plans, the Board may grant restricted and performance stock grants in addition to incentive and nonqualified stock options. As of December 31, 2011, under the option and equity compensation plans approved by shareholders under which we may grant stock options, an aggregate of 2,476,528 shares remained available for grant as options and, under the option and equity compensation plans approved by shareholders under which we may grant restricted and bonus awards, an aggregate of 1,341,792 shares were available for such awards. |
21
Table of Contents
| (2) | The shareholders did not approve the 2000 non-executive employee stock option plan. Under the 2000 non-executive employee stock option plan approved by the Board of Directors on March 30, 2000, an aggregate of 1,500,000 shares pursuant to non-qualified options could be issued to employees, agents and consultants but not to officers or directors. Otherwise, the 2000 non-executive employee stock option plan is similar to the stock option plans described in footnote (1) above. On March 30, 2010, the 2000 non-executive employee stock option plan was terminated, which ended future grants but did not affect then outstanding options. At December 31, 2011, under the 2000 non-executive employee stock plan we had options for 474,973 shares outstanding. |
On April 1, 2004, in connection with the acquisition of OctigaBay Systems Corporation, subsequently renamed Cray Canada Inc., we assumed that company’s key employee stock option plan, including existing options. Options could be granted to Cray Canada employees, directors and consultants. Otherwise the Cray Canada key employee stock option plan is similar to the stock option plans described in footnote (1) above. On March 8, 2006, the Cray Canada plan was terminated, which ended future grants but did not affect then outstanding options. Under the Cray Canada key employee stock option plan, we had 29,090 options outstanding as of December 31, 2011.
We had no warrants outstanding as of December 31, 2011.
Unregistered Sales of Securities
We had no unregistered sales of our securities in 2011 not previously reported.
Issuer Repurchases
We did not repurchase any of our common stock in 2011.
22
Table of Contents
STOCK PERFORMANCE GRAPH
The graph below compares the cumulative total return to shareholders for our common stock with the comparable return of the Nasdaq Stock Market (U.S. companies) Index and the Nasdaq Computer Manufacturer Stocks Index.
The graph assumes that a shareholder invested $100 in our common stock on December 31, 2006, and that all dividends were reinvested. We have never paid cash dividends on our common stock. All return information is historical and is not necessarily indicative of future performance.
COMPARISON OF CUMULATIVE TOTAL RETURN AMONG OUR COMMON STOCK,
THE NASDAQ STOCK MARKET (U.S. COMPANIES) INDEX AND THE NASDAQ
COMPUTER MANUFACTURER STOCKS INDEX THROUGH DECEMBER 31, 2011
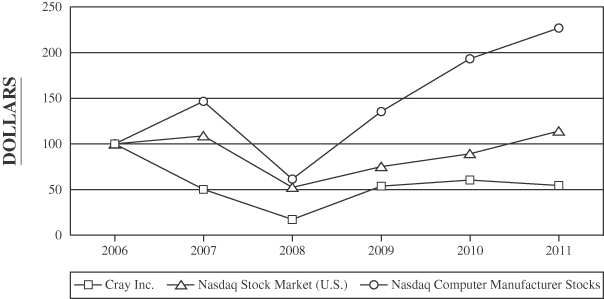
| 12/31/06 | 12/31/07 | 12/31/08 | 12/31/09 | 12/31/10 | 12/31/11 | |||||||||||||||||||
| Cray Inc. |
100.0 | 50.4 | 17.5 | 54.0 | 60.4 | 54.5 | ||||||||||||||||||
| Nasdaq Stock Market (U.S.) |
100.0 | 108.5 | 52.3 | 75.1 | 89.2 | 113.8 | ||||||||||||||||||
| Nasdaq Computer Manufacturer Stocks |
100.0 | 146.3 | 61.5 | 135.0 | 192.6 | 226.0 | ||||||||||||||||||
23
Table of Contents
Item 6. Selected Consolidated Financial Data
The following table presents selected historical consolidated financial data for Cray Inc. and its subsidiaries, which is derived from our audited consolidated financial statements:
| Years Ended December 31, | ||||||||||||||||||||
| 2011 | 2010 | 2009 | 2008 | 2007 | ||||||||||||||||
| (In thousands, except for per share data) | ||||||||||||||||||||
| Operating Data: |
||||||||||||||||||||
| Product revenue |
$ | 155,561 | $ | 239,085 | $ | 199,114 | $ | 218,970 | $ | 133,455 | ||||||||||
| Service revenue |
80,485 | 80,303 | 84,933 | 63,883 | 52,698 | |||||||||||||||
|
|
|
|
|
|
|
|
|
|
|
|||||||||||
| Total revenue |
236,046 | 319,388 | 284,047 | 282,853 | 186,153 | |||||||||||||||
|
|
|
|
|
|
|
|
|
|
|
|||||||||||
| Cost of product revenue |
101,000 | 155,027 | 130,444 | 133,715 | 89,475 | |||||||||||||||
| Cost of service revenue |
40,680 | 54,404 | 47,719 | 38,062 | 31,247 | |||||||||||||||
|
|
|
|
|
|
|
|
|
|
|
|||||||||||
| Total cost of revenue |
141,680 | 209,431 | 178,163 | 171,777 | 120,722 | |||||||||||||||
|
|
|
|
|
|
|
|
|
|
|
|||||||||||
| Gross profit |
94,366 | 109,957 | 105,884 | 111,076 | 65,431 | |||||||||||||||
|
|
|
|
|
|
|
|
|
|
|
|||||||||||
| Research and development, net |
49,452 | 43,618 | 62,947 | 51,775 | 37,883 | |||||||||||||||
| Sales and marketing |
26,134 | 31,085 | 26,601 | 24,988 | 22,137 | |||||||||||||||
| General and administrative |
15,840 | 17,767 | 16,579 | 16,742 | 14,956 | |||||||||||||||
| Restructuring, severance and impairment |
1,783 | — | — | 54,450 | (48 | ) | ||||||||||||||
|
|
|
|
|
|
|
|
|
|
|
|||||||||||
| Operating expenses |
93,209 | 92,470 | 106,127 | 147,955 | 74,928 | |||||||||||||||
|
|
|
|
|
|
|
|
|
|
|
|||||||||||
| Income (loss) from operations |
1,157 | 17,487 | (243 | ) | (36,879 | ) | (9,497 | ) | ||||||||||||
| Other income (expense), net |
(989 | ) | (766 | ) | (430 | ) | 588 | 1,112 | ||||||||||||
| Interest income (expense), net |
(33 | ) | 219 | (805 | ) | (4,068 | ) | (1,076 | ) | |||||||||||
|
|
|
|
|
|
|
|
|
|
|
|||||||||||
| Income (loss) before income taxes |
135 | 16,940 | (1,478 | ) | (40,359 | ) | (9,461 | ) | ||||||||||||
| (Provision) benefit for income taxes |
14,194 | (1,878 | ) | 874 | (387 | ) | (1,174 | ) | ||||||||||||
|
|
|
|
|
|
|
|
|
|
|
|||||||||||
| Net income (loss) |
$ | 14,329 | $ | 15,062 | $ | (604 | ) | $ | (40,746 | ) | $ | (10,635 | ) | |||||||
|
|
|
|
|
|
|
|
|
|
|
|||||||||||
| Net income (loss) per common share: |
||||||||||||||||||||
| Basic |
$ | 0.41 | $ | 0.44 | $ | (0.02 | ) | $ | (1.25 | ) | $ | (0.33 | ) | |||||||
|
|
|
|
|
|
|
|
|
|
|
|||||||||||
| Diluted |
$ | 0.40 | $ | 0.43 | $ | (0.02 | ) | $ | (1.25 | ) | $ | (0.33 | ) | |||||||
|
|
|
|
|
|
|
|
|
|
|
|||||||||||
| Weighted average outstanding shares: |
||||||||||||||||||||
| Basic |
35,122 | 34,313 | 33,559 | 32,573 | 31,892 | |||||||||||||||
|
|
|
|
|
|
|
|
|
|
|
|||||||||||
| Diluted |
36,072 | 35,278 | 33,559 | 32,573 | 31,892 | |||||||||||||||
|
|
|
|
|
|
|
|
|
|
|
|||||||||||
| Cash Flow Data: |
||||||||||||||||||||
| Cash provided by (used in): |
||||||||||||||||||||
| Operating activities |
$ | (3,823 | ) | $ | (49,164 | ) | $ | 66,684 | $ | (45,507 | ) | $ | 38,650 | |||||||
| Investing activities |
(4,779 | ) | 500 | (7,682 | ) | 46,207 | (35,426 | ) | ||||||||||||
| Financing activities |
1,462 | 933 | (27,209 | ) | (47,196 | ) | 1,695 | |||||||||||||
| Depreciation and amortization |
8,601 | 9,431 | 8,454 | 10,232 | 13,359 | |||||||||||||||
| Purchases of property and equipment |
4,916 | 3,736 | 7,581 | 4,430 | 2,768 | |||||||||||||||
| Balance Sheet Data: |
||||||||||||||||||||
| Cash, cash equivalents, restricted cash and short-term investments |
$ | 54,187 | $ | 61,295 | $ | 113,178 | $ | 80,414 | $ | 179,121 | ||||||||||
| Working capital |
137,733 | 125,377 | 98,759 | 114,179 | 150,839 | |||||||||||||||
| Total assets |
283,099 | 260,628 | 223,660 | 313,861 | 355,648 | |||||||||||||||
| Convertible notes, net of discount, current |
— | — | — | 25,681 | — | |||||||||||||||
| Convertible notes, net of discount, non-current |
— | — | — | — | 68,330 | |||||||||||||||
| Shareholders’ equity |
166,814 | 145,821 | 124,163 | 120,205 | 159,618 | |||||||||||||||
24
Table of Contents
Item 7. Management’s Discussion and Analysis of Financial Condition and Results of Operations
Forward-Looking Statements
The information set forth in “Management’s Discussion and Analysis of Financial Condition and Results of Operations” below includes “forward-looking statements” as described in the section “Forward-Looking Statements” preceding Part I of this annual report on Form 10-K, and is subject to the safe harbor created by Section 27A of the Securities Act of 1933, as amended, and Section 21E of the Securities Exchange Act of 1934, as amended. Our actual results could differ materially from those anticipated in these forward-looking statements for many reasons, including the risks faced by us and described in Item 1A. Risk Factors in Part I and other sections of this report and our other filings with the Securities and Exchange Commission. The following discussion should also be read in conjunction with the Consolidated Financial Statements and accompanying Notes thereto.
Overview and Executive Summary
We design, develop, manufacture, market and service high-performance computing, or HPC, systems, commonly known as supercomputers, and provide storage solutions and engineering services related to HPC systems and solutions to our customers, which include government agencies, academic institutions and commercial entities. Our supercomputer systems provide capability and sustained performance far beyond typical server-based computer systems and address challenging scientific, engineering, commercial and national security computing problems. Our current strategy is to gain market share in the high-end supercomputer market segment, extend our technology leadership, maintain our focus on execution and profitability and expand our addressable market in areas where we can leverage our experience and technology, such as in storage & data management, “big data” analytics, midrange HPC systems and custom engineered solutions.
Summary of 2011 Results
Revenue decreased by $83.3 million in 2011 compared to 2010 to $236.0 million. Product revenue decreased by $83.5 million and service revenue increased by $0.2 million. The decrease in product revenue was principally the result of our inability to complete the acceptance process of the Cray XK6 upgrade at Oak Ridge National Laboratory due to supply issues related to a key component, which resulted in a delay in the recognition of the associated revenue. As our revenue is driven by relatively few, large transactions, significant variability in annual and quarterly results is expected. If the Oak Ridge National Laboratory acceptance had not been delayed, our 2011 revenue would have been approximately $65 million higher and the decreases in revenue and product revenue would have been less pronounced. Additionally, product revenue from sales of our external storage systems was lower in 2011. Gross profit margin from services was higher in 2011 compared to 2010 on approximately the same revenue. The higher service gross profit margin was partially attributable to higher margins on maintenance services due to an increased number of systems in the field with low associated variable costs. Also contributing to the increase in service gross profit margin was an additional $6.2 million in revenue recorded on a Custom Engineering contract in 2011, where the associated costs were recorded in prior periods, as revenue was recognized on the cash basis as our ability to collect payment was not reasonably assured.
We recorded income from operations of $1.2 million in 2011 compared to income from operations of $17.5 million in 2010. Total gross profit decreased $15.6 million in 2011 from 2010 due to lower product revenue. This was partially offset by higher gross profit on service revenue. Operating expenses increased $0.7 million principally due to lower reimbursements for research and development from our DARPA HPCS Phase III program, which was largely offset by lower incentive compensation expense and outside services expense. Incentive compensation costs are principally driven by pre-bonus operating income and, to a lesser extent, product revenue.
Net income decreased from $15.1 million in 2010 to $14.3 million in 2011. Net income in 2011 includes $14.7 million ($.41 per diluted share) attributable to a partial reduction of the valuation allowance held against our U.S. deferred tax assets and a complete reduction of the valuation allowance held against the deferred tax assets of our German subsidiary.
Net cash used in operations during 2011 was $3.8 million, as compared to net cash used in operations of $49.2 million in 2010. The decrease in net cash used in operations was principally due to higher collections from customers, partially offset by higher inventory levels on hand at the end of 2011.
25
Table of Contents
Market Overview and Challenges
Significant trends in the HPC industry include:
| • | The commoditization of HPC hardware, particularly processors and interconnect systems; |
| • | The growing commoditization of software, including plentiful building blocks and more capable open source software; |
| • | Supercomputing with many-core commodity processors driving increasing scalability requirements; |
| • | Electrical power requirements becoming a design constraint and driver in total cost of ownership determinations; |
| • | Increased micro-architectural diversity, including increased usage of many-core processors and growing experimentation with accelerators, as the rate of per-core performance increases slows; and |
| • | Data needs growing faster than computational needs. |
Several of these trends have resulted in the expansion and acceptance of lower-bandwidth cluster systems using processors manufactured by Intel, AMD and others combined with commercially available commodity networking and other components, particularly in the middle and lower segments of the HPC market. These systems may offer higher theoretical peak performance for equivalent cost, and “price/peak performance” is often the dominant factor in HPC procurements outside of the high-end supercomputer market segment. Vendors of such systems often put pricing pressure on us in competitive procurements.
In the markets for the largest systems, those costing significantly in excess of $3 million, the use of commodity components can result in increasing data transfer bottlenecks as these components do not balance processor power with network communication capability. With the arrival of increasing processor core counts due to new many-core processors, these unbalanced systems will typically have even lower productivity, especially in larger systems running more complex applications. We and other vendors have also begun to augment standard microprocessors with other processor types, such as field programmable gate arrays and graphics processing units, in order to increase computational power, further complicating programming models. In addition, with increasing scale, bandwidth and processor core counts, large computer systems use progressively higher amounts of power to operate and require special cooling capabilities.
To position ourselves to meet the market’s demanding needs, we concentrate our research and development efforts on technologies that enable our supercomputers to perform at scale — that is, to continue to increase actual performance as systems grow ever larger in size – and in areas where we can leverage our core expertize in other markets. We also have demonstrated expertise in several processor technologies. We expect to be in a comparatively advantageous position as larger many-core processors become available and as multiple processing technologies become integrated into single systems in heterogeneous environments. In addition, we intend to expand our addressable market by leveraging our technologies and customer base, the Cray brand and industry trends by introducing complementary products and services to new and existing customers, as demonstrated by our emphasis on strategic initiatives, such as storage & data management, “big data” analytics, midrange HPC systems and custom engineered solutions.
26
Table of Contents
Key Performance Indicators
Our management monitors and analyzes several key performance indicators in order to manage our business and evaluate our financial and operating performance, including:
Revenue. Product revenue generally constitutes the major portion of our revenue in any reporting period and, for the reasons discussed elsewhere in this annual report on Form 10-K, is subject to significant variability from period to period. In the short term, we closely review the status of product shipments, installations and acceptances in order to forecast revenue and cash receipts; longer-term, we monitor the status of the pipeline of product sales opportunities and product development cycles. Product revenue growth over several quarters is an indicator of whether we are achieving our objective of increased market share in the supercomputing market. The introduction of the Cray XE and Cray XK families and our longer-term product roadmap are efforts to increase product revenue. We are also increasing our business and product development efforts on certain new initiatives such as storage & data management, “big data” analytics, midrange HPC systems and custom engineered solutions. Maintenance service revenue is more constant in the short term and assists, in part, to offset the impact that the variability in product revenue has on total revenue.
Gross profit margin. Our product gross profit margin was 35% in 2010 and 2011. Service gross profit margin increased from 32% in 2010 to 49% in 2011. The increase in service gross profit margin is due to higher margins from our maintenance services due to an increased number of systems in the field with low associated variable costs and an additional $6.2 million in revenue recorded on a Custom Engineering contract in 2011 where revenue was recognized on the cash basis, where the associated costs were recorded in prior periods, as our ability to collect payment was not reasonably assured. The increase in our service gross margin drove the increase in our total gross profit margin from 34% in 2010 to 40% in 2011.
Operating expenses. Our operating expenses are driven largely by headcount, the level of recognized co-funding for research and development, contracted third-party research and development services, and incentive compensation. As part of our ongoing efforts to control operating expenses, we monitor headcount levels in specific geographic and operational areas.
Liquidity and cash flows. Due to the variability in product revenue, new contracts, and payment terms, our cash position also varies significantly from quarter-to-quarter and within a quarter. We monitor our expected cash levels, particularly in light of increased inventory purchases for large system installations and the risk of delays in product shipments and acceptances and, longer-term, in product development. Cash receipts often lag customer acceptances and, because we had a number of large customer acceptances in the fourth quarter of 2011, we anticipate significant cash receipts in the first quarter of 2012.
27
Table of Contents
Results of Operations
Revenue and Gross Profit
Our product and service revenue for the indicated years ended December 31 were (in thousands, except for percentages):
| Year Ended December 31, | ||||||||||||
| 2011 | 2010 | 2009 | ||||||||||
| Product revenue |
$ | 155,561 | $ | 239,085 | $ | 199,114 | ||||||
| Less: Cost of product revenue |
101,000 | 155,027 | 130,444 | |||||||||
|
|
|
|
|
|
|
|||||||
| Product gross profit |
$ | 54,561 | $ | 84,058 | $ | 68,670 | ||||||
|
|
|
|
|
|
|
|||||||
| Product gross profit percentage |
35% | 35% | 34% | |||||||||
| Service revenue |
$ | 80,485 | $ | 80,303 | $ | 84,933 | ||||||
| Less: Cost of service revenue |
40,680 | 54,404 | 47,719 | |||||||||
|
|
|
|
|
|
|
|||||||
| Service gross profit |
$ | 39,805 | $ | 25,899 | $ | 37,214 | ||||||
|
|
|
|
|
|
|
|||||||
| Service gross profit percentage |
49% | 32% | 44% | |||||||||
| Total revenue |
$ | 236,046 | $ | 319,388 | $ | 284,047 | ||||||
| Less: Total cost of revenue |
141,680 | 209,431 | 178,163 | |||||||||
|
|
|
|
|
|
|
|||||||
| Total gross profit |
$ | 94,366 | $ | 109,957 | $ | 105,884 | ||||||
|
|
|
|
|
|
|
|||||||
| Total gross profit percentage |
40% | 34% | 37% | |||||||||
Product Revenue
Product revenue in 2011 decreased $83.5 million, or 35%, over 2010 principally due to our inability to complete the acceptance process of the Cray XK6 upgrade at Oak Ridge National Laboratory in 2011, which resulted in a delay in the recognition of the associated revenue. Additionally, revenue from sales of our external storage systems was lower in 2011 as fewer customers implemented large storage systems during the year.
Product revenue in 2010 increased $40.0 million, or 20%, over 2009 due primarily to the release of the Cray XE6 system and higher external storage sales as part of our data management practice.
Service Revenue
Service revenue for 2011 increased $0.2 million from 2010. Lower revenues on certain Custom Engineering projects were offset by a $6.3 million increase in revenue from our Maintenance and Support group due to an increased number of systems in the field. Custom Engineering service revenue in 2011 included an additional $6.2 million in revenue recorded on a contract in 2011 where revenue was recognized on the cash basis as our ability to collect payment was not reasonably assured.
Service revenue for 2010 decreased $4.6 million, or 5%, from 2009 primarily due to our inability to record revenue on a Custom Engineering contract in 2010 for services that were performed but where not all revenue recognition criteria had been met.
Cost of Product Revenue and Product Gross Profit
Cost of product revenue for 2011 decreased by $54.0 million compared to 2010 driven by lower product revenue. Product gross profit percentage in 2011 was unchanged from the gross profit percentage in 2010 of 35%. Lower component costs, principally memory, contributed to maintaining product gross margin levels in 2011. This was partially offset by penalties incurred on 2011 product acceptances resulting from delays in the availability of a key component.
Product gross profit percentage improved one percentage point in 2010 compared to 2009. The improvement in product gross profit percentage was due to lower charges for excess and obsolete inventory of $0.9 million in 2010 compared to $5.4 million in 2009. Cost of product revenue increased $24.6 million due to higher product revenue partially offset by lower charges for excess and obsolete inventory.
28
Table of Contents
Cost of Service Revenue and Service Gross Profit
Cost of service revenue decreased $13.7 million and service gross profit margin increased by 17 percentage points to 49% in 2011 compared to 2010. The increase in service gross profit margin was due to increases in revenue from our Maintenance and Support group from the large systems that were accepted in the fourth quarter of 2010 with a minimal increase in costs and an additional $6.2 million in revenue in 2011 recorded on a Custom Engineering contract where revenue was being recorded on a cash basis, where the associated costs were recorded in prior periods, as the Company’s ability to collect payment was not reasonably assured. The Company’s workforce reductions in March 2011 and other cost reduction actions also contributed to an increase in service gross profit for 2011.
Service gross profit percentage declined 12 percentage points and cost of service revenue increased $6.7 million in 2010 as compared to 2009. Custom Engineering service revenue was negatively impacted by the transition of certain projects from development (service revenue) to production (product revenue). In addition, revenue was not recognized on a contract in 2010 for services that were performed but where not all revenue recognition criteria had been met, while related project costs were expensed in 2010.
Operating Expenses
Research and Development
Research and development expenses for the indicated years ended December 31 were as follows (in thousands, except for percentages):
| 2011 | 2010 | 2009 | ||||||||||
| Gross research and development expenses |
$ | 76,993 | $ | 82,525 | $ | 91,874 | ||||||
| Less: Amounts included in cost of revenue |
(410 | ) | (79 | ) | (1,789 | ) | ||||||
| Less: Reimbursed research and development (excludes amounts in revenue) |
(27,131 | ) | (38,828 | ) | (27,138 | ) | ||||||
|
|
|
|
|
|
|
|||||||
| Net research and development expenses |
$ | 49,452 | $ | 43,618 | $ | 62,947 | ||||||
|
|
|
|
|
|
|
|||||||
| Percentage of total revenue |
21% | 14% | 22% | |||||||||
Gross research and development expenses in the table above reflect all research and development expenditures. Research and development expenses include personnel expenses, depreciation, allocations for certain overhead expenses, software, prototype materials and outside contracted expenses.
In February 2010 and again in October 2011, we amended the Phase III agreement with DARPA. As with the previous contract, we expect to receive reimbursement after the achievement of a series of predefined milestones culminating in the delivery of a prototype system. Consistent with the changes, certain deliverables have been eliminated from the contract, reducing the overall scope and cost of the project. Pursuant to the amended contract, the full co-funding amount was revised to $180.0 million from $190 million. As of December 31, 2011, we had earned and received $158.0 million of reimbursement under the DARPA Phase III agreement, leaving $22 million to be earned and received. We expect to earn and receive the remaining $22 million in 2012.
In 2011, gross research and development expenses decreased $5.5 million from 2010 levels primarily due to decreased incentive based compensation expense and lower third-party service expenses, partially offset by higher salary expense resulting from higher headcount. Reimbursed research and development decreased $11.7 million in 2011 compared to 2010 due to $12.5 million less in reimbursements recognized in connection with our DARPA HPCS Phase III project as we passed two milestones in 2011 compared to three milestones in 2010.
In 2010, gross research and development expenses decreased $9.3 million from 2009 primarily due to lower spending on the DARPA HPCS Phase III project, as a result of lower third-party costs, primarily related to a modification in the DARPA contract, which was partially offset by higher incentive-based compensation expenses. Reimbursed research and development increased by $11.7 million in 2010 compared to 2009 due to higher DARPA HPCS Phase III reimbursements as we passed three milestones in 2010 compared to passing two milestones in 2009.
29
Table of Contents
Other Operating Expenses
Our sales and marketing and general and administrative expenses for the indicated years ended December 31 were (in thousands, except for percentages):
| Year Ended December 31, | ||||||
| 2011 | 2010 | 2009 | ||||
| Sales and marketing |
$26,134 | $31,085 | $26,601 | |||
| Percentage of total revenue |
11% | 10% | 9% | |||
| General and administrative |
$15,840 | $17,767 | $16,579 | |||
| Percentage of total revenue |
7% | 6% | 6% | |||
| Restructuring |
$1,783 | — | — | |||
| Percentage of total revenue |
1% | — | — | |||
Sales and Marketing. The $5.0 million decrease in sales and marketing expenses in 2011 compared to 2010 was due principally to lower incentive-based compensation and lower commissions.
The $4.5 million increase in sales and marketing expenses in 2010 compared to 2009 was due principally to $1.0 million in higher commissions on higher revenues, increased headcount in strategic initiatives and higher other incentive-based compensation.
General and Administrative. The $1.9 million decrease in general and administrative expenses in 2011 compared to 2010 was primarily due to lower incentive-based compensation and lower salary expense due to lower headcount.
The $1.2 million increase in general and administrative expenses in 2010 compared to 2009 was primarily due to higher incentive-based compensation.
Restructuring. Restructuring expenses in 2011 were primarily due to the elimination of positions in our workforce rebalancing announced in March 2011.
Other Expense, Net
We recorded $1.0 million and $0.8 million of net other expense for the years ended December 31, 2011 and 2010, respectively, principally due to foreign exchange transaction losses. For the year ended December 31, 2009, we recognized $0.4 million of net other expense due principally to foreign exchange transaction gains offset by a $0.9 million loss on the repurchase of $27.6 million principal amount of our 3.0% Convertible Senior Subordinated Notes due in 2024 (“Notes”).
Interest Income (Expense), Net
Our interest income and interest expense for the years ended December 31 were (in thousands):
| Year Ended December 31, | ||||||||||||
| 2011 | 2010 | 2009 | ||||||||||
| Interest income |
$229 | $485 | $477 | |||||||||
| Interest expense |
(262 | ) | (266 | ) | (1,282 | ) | ||||||
|
|
|
|
|
|
|
|||||||
| Net interest income (expense) |
$ | (33 | ) | $ | 219 | $ | (805 | ) | ||||
|
|
|
|
|
|
|
|||||||
Interest income in 2011 decreased as compared to 2010 due to lower average invested balances and lower short-term interest rates. Interest income in 2010 was consistent with interest income in 2009. The higher interest expense in 2009 compared to 2011 and 2010 resulted from outstanding convertible debt that was fully repurchased in late 2009.
Taxes
We recorded an income tax benefit of $14.2 million in 2011, income tax expense of $1.9 million in 2010, and an income tax benefit of $0.9 million in 2009.
30
Table of Contents
An income tax benefit, in the amount of $14.7 million ($.41 per diluted share), was recorded in 2011 as a result of the partial reduction of the valuation allowance held against the Company’s U.S. deferred tax assets, as well as to a much lesser extent the complete reduction of the valuation allowance held against the deferred tax assets of the Company’s German subsidiary. The foregoing tax benefit was partially offset by income taxes due in the U.S. and certain foreign jurisdictions. Income tax expense recorded in 2010 related primarily to higher pre-tax earnings. The income tax benefit recorded in 2009 related primarily to the partial reduction of the valuation allowance held against the deferred tax assets of our Japanese subsidiary and a $0.7 million benefit recorded as a result of tax legislation that enabled a corporation to recover certain previously generated U.S. income tax credits, offset somewhat by income taxes due in the U.S. and various foreign jurisdictions.
The partial reduction of the valuation allowance held against the Company’s U.S. deferred tax assets and the complete reduction of the valuation allowance held against the deferred tax assets of our German subsidiary was based upon an evaluation of all available positive and negative evidence. We consider our actual historical results over several years to have stronger weight than other more subjective indicators, including forecasts, when considering whether to establish or reduce a valuation allowance on deferred tax assets. As of December 31, 2011 we have generated cumulative pre-tax income in recent years. In addition to our cumulative income position, our assessment of our ability to utilize our deferred tax assets included an assessment of all known business risks and industry trends, as well as forecasted domestic and international earnings over a number of years. Our ability to forecast results significantly into the future is severely limited due to the rapid rate of technological change in the industry in which we operate. Included in our forecast was the impact of two unusually large contracts that were finalized during the fourth quarter of 2011; namely a $188.0 million contract with the University of Illinois National Center for Supercomputing Applications and a $97.0 million contract with the Department of Energy’s Oak Ridge National Laboratory.
Our conclusion about the realizability of our deferred tax assets and therefore the appropriateness of the valuation allowance will be reviewed quarterly and could change in future periods depending on our future assessment of all available evidence in support of the likelihood of realization of our deferred tax assets.
As of December 31, 2011, we had federal income tax net operating loss carryforwards of approximately $215.9 million that will expire between 2019 through 2031, if not utilized.
Liquidity and Capital Resources
We generate cash from operations predominantly from the sale of high performance computer systems and related services. We typically have a small number of significant contracts that make up the majority of total revenue. The material changes in certain of our balance sheet accounts were due to the timing of product deliveries, customer acceptances, contractually determined billings and cash collections. Working capital requirements, including inventory purchases and normal capital expenditures, are generally funded with cash from operations.
Inventory increased from $49.2 million at December 31, 2010 to $97.9 million at December 31, 2011 as certain systems and system upgrades had been delivered to customer sites but had not completed the acceptance process as of December 31, 2011. Partially offsetting these impacts on our liquidity position has been a decrease in accounts and other receivables from $106.3 million at December 31, 2010 to $72.4 million at December 31, 2011 as we received a higher number of customer acceptances in the fourth quarter of 2010 than 2011. The final payments for these systems are not due until early in the following year.
In early 2012 we anticipate that our cash position will improve, at least in part, as we collect payment for the receivables related to significant system acceptances in late fourth quarter 2011 and in the first part of 2012.
Cash and cash equivalents and restricted cash totaled $54.2 million at December 31, 2011 compared to $61.3 million at December 31, 2010. As of December 31, 2011, we had working capital of $137.7 million compared to $125.4 million as of December 31, 2010.
Cash flow information for the years ended December 31 included the following (in thousands):
| 2011 | 2010 | 2009 | ||||||||||
| Operating Activities |
$ | (3,823 | ) | $ | (49,164 | ) | $ | 66,684 | ||||
| Investing Activities |
(4,779 | ) | 500 | (7,682 | ) | |||||||
| Financing Activities |
1,462 | 933 | (27,209 | ) | ||||||||
31
Table of Contents
Operating Activities. Net cash used in operating activities was $3.8 million and $49.2 million in 2011 and 2010, respectively. Net cash provided by operating activities was $66.7 million in 2009. For the year ended December 31, 2011, cash used in operating activities was principally the result of a significant increase in inventory partially offset by a decrease in accounts receivable. For the year ended December 31, 2010, cash used by operating activities was principally the result of a large increase in accounts receivable due to final billings related to fourth quarter acceptances due in early 2011. For the year ended December 31, 2009, cash provided by operating activities was principally the result of significant decreases in accounts receivable and inventory.
Investing Activities. Net cash used in investing activities was $4.8 million in 2011. Net cash provided by investing activities was $0.5 million in 2010. Net cash used in investing activities was $7.7 million in 2009. For the year ended December 31, 2011, net cash used in investing activities was principally the result of purchases of property and equipment. For the year ended December 31, 2010, net cash provided by investing activities was a result of the sale of $3.0 million in short-term investments and a $1.2 million decrease in restricted cash, offset by property and equipment purchases of $3.7 million. For the year ended December 31, 2009, net cash used in investing activities was principally the result of purchases of property and equipment.
Financing Activities. Net cash provided by financing activities was $1.5 million in 2011. Net cash provided by financing activities was $0.9 million in 2010. Net cash used in financing activities was $27.2 million in 2009. For the years ended December 31, 2011 and 2010, net cash provided by financing activities was due primarily to proceeds from stock option exercises and stock purchases from our employee stock purchase plan. For the year ended December 31, 2009, net cash used in financing activities was due primarily to $27.3 million of cash paid to repurchase our Notes. As of December 31, 2009, there was no outstanding balance on our Notes.
Over the next twelve months, we expect our significant cash requirements will relate to operational expenses, consisting primarily of personnel costs, costs of inventory associated with certain large-scale product deliveries, spare parts, outside engineering expenses, and the acquisition of property and equipment. In addition, we lease certain equipment and facilities used in our operations under operating leases in the normal course of business. The following table summarizes our contractual cash obligations as of December 31, 2011 (in thousands):
| Amounts Committed by Year | ||||||||||||||||||||
| Contractual Obligations |
Total | 1 Year | Years 2-3 | Years 4-5 | Thereafter | |||||||||||||||
| Development agreements |
$ | 4,856 | $ | 4,533 | $ | 323 | $ | — | $ | — | ||||||||||
| Operating leases |
26,509 | 4,375 | 8,049 | 7,434 | 6,651 | |||||||||||||||
|
|
|
|
|
|
|
|
|
|
|
|||||||||||
| Total contractual cash obligations |
$ | 31,365 | $ | 8,908 | $ | 8,372 | $ | 7,434 | $ | 6,651 | ||||||||||
|
|
|
|
|
|
|
|
|
|
|
|||||||||||
We have a line of credit with Wells Fargo Bank, National Association of $3.5 million which has a maturity date of June 1, 2012. In September 2010, we entered into a secured line of credit with Silicon Valley Bank in the amount of $25.0 million. The first $15.0 million is available at any time and the additional $10.0 million is available if certain minimum financial ratios are exceeded. Our line of credit with Silicon Valley Bank has a maturity date of September 13, 2012. We made no draws in 2011 nor are there any outstanding borrowings on these lines of credit as of December 31, 2011.
In our normal course of operations, we have development arrangements under which we engage outside engineering resources to work on our research and development projects. For the year ended December 31, 2011, we incurred $4.7 million for such arrangements.
At any particular time, our cash position is affected by the timing of cash receipts for product sales, maintenance contracts, government co-funding for research and development activities and our payments for inventory, resulting in significant fluctuations in our cash balance from quarter-to-quarter and within a quarter. Our principal sources of liquidity are our cash and cash equivalents, short-term investments and cash from operations. We expect our cash resources to be adequate for at least the next twelve months.
The adequacy of our cash resources is dependent on the amount and timing of government funding as well as our ability to sell our products with adequate gross profit. Beyond the next twelve months, the adequacy of our cash resources will largely depend on our success in achieving profitable operations and positive operating cash flows on a sustained basis.
32
Table of Contents
Critical Accounting Policies and Estimates
This discussion as well as disclosures included elsewhere in this annual report on Form 10-K are based upon our consolidated financial statements, which have been prepared in accordance with accounting principles generally accepted in the United States of America, or GAAP. The preparation of these financial statements requires us to make estimates and judgments that affect the reported amounts of assets, liabilities, revenue and expenses, and related disclosure of contingencies. In preparing our financial statements in accordance with GAAP, there are certain accounting policies that are particularly important. These include revenue recognition, inventory valuation, income taxes, research and development expenses and share-based compensation. We believe these accounting policies and others set forth in Note 2 — Summary of Significant Accounting Policies of the Notes to Consolidated Financial Statements in Item 15. Exhibits and Financial Statement Schedules in Part IV of this annual report should be reviewed as they are integral to understanding our results of operations and financial condition. In some cases, these policies represent required accounting. In other cases, they may represent a choice between acceptable accounting methods or may require substantial judgment or estimation.
Additionally, we consider certain judgments and estimates to be significant, including those relating to the estimated selling price determination used in revenue recognition, percentage of completion accounting, estimates of proportional performance on co-funded engineering contracts and prepaid engineering services, determination of inventory at the lower of cost or market, useful lives for depreciation and amortization, determination of future cash flows associated with impairment testing of long-lived assets, determination of the fair value of stock options and other assessments of fair value, calculation of deferred income tax assets, including our ability to utilize such assets, potential income tax assessments and other contingencies. We base our estimates on historical experience, current conditions and on other assumptions that we believe to be reasonable under the circumstances. Actual results may differ materially from these estimates and assumptions.
Our management has discussed the selection of significant accounting policies and the effect of judgments and estimates with the Audit Committee of our Board of Directors.
Revenue Recognition
We recognize revenue when it is realized or realizable and earned. We consider revenue realized or realizable and earned when we have persuasive evidence of an arrangement, delivery has occurred, the sales price is fixed or determinable, and collectibility is reasonably assured. Delivery does not occur until the products have been shipped or services provided to the customer, risk of loss has transferred to the customer, and, where applicable, a customer acceptance has been obtained. The sales price is not considered to be fixed or determinable until all material contingencies related to the sales have been resolved. We record revenue in the Consolidated Statements of Operations net of any sales, use, value added or certain excise taxes imposed by governmental authorities on specific sales transactions. In addition to the aforementioned general policy, the following are our statements of policy with regard to multiple-element arrangements and specific revenue recognition policies for each major category of revenue.
Multiple-Element Arrangements. We commonly enter into revenue arrangements that include multiple deliverables of our product and service offerings due to the needs of our customers. Product may be delivered in phases over time periods which can be as long as five years. Maintenance services generally begin upon acceptance of the first equipment delivery and future deliveries of equipment generally have an associated maintenance period. We consider the maintenance period to commence upon acceptance of the product or installation in situations where a formal acceptance is not required, which may include a warranty period and accordingly allocate a portion of the arrangement consideration as a separate deliverable which is recognized as service revenue over the entire service period. Other services such as training and engineering services can be delivered as a discrete delivery or over the term of the contract. A multiple-element arrangement is separated into more than one unit of accounting if the following criteria are met:
| • | The delivered item(s) has value to the customer on a standalone basis; and |
| • | If the arrangement includes a general right of return relative to the delivered item(s), delivery or performance of the undelivered item(s) is considered probable and substantially in our control. |
33
Table of Contents
If these criteria are not met, the arrangement is accounted for as one unit of accounting which would result in revenue being recognized ratably over the contract term or being deferred until the earlier of when such criteria are met or when the last undelivered element is delivered. If these criteria are met for each element, the arrangement consideration is allocated to the separate units of accounting based on each unit’s relative estimated selling price.
We follow a selling price hierarchy in determining the best estimate of the selling price of each deliverable. Certain products and services are sold separately in standalone arrangements for which we are sometimes able to determine vendor specific objective evidence, or VSOE. We determine VSOE based on normal pricing and discounting practices for the product or service when sold separately.
When we are not able to establish VSOE for all deliverables in an arrangement with multiple elements, we attempt to establish the selling price of each remaining element based on third-party evidence, or TPE. Our inability to establish VSOE is often due to a relatively small sample of customer contracts that differ in system size and contract terms which can be due to infrequently selling each element separately, not pricing products within a narrow range, or only having a limited sales history, such as in the case of certain advanced and emerging technologies. TPE is determined based on our prices or competitor prices for similar deliverables when sold separately. However, we are often unable to determine TPE, as our offerings contain a significant level of customization and differentiation from those of competitors and we are often unable to reliably determine what similar competitor products’ selling prices are on a standalone basis.
When we are unable to establish selling price using VSOE or TPE, we use estimated selling price, or ESP, in our allocation of arrangement consideration. The objective of ESP is to determine the price at which we would transact a sale if the product or service were sold on a standalone basis. In determining ESP, we use either the list price of the deliverable less a discount or the cost to provide the product or service plus a margin. When using list price less a discount, we use discounts from list price for previous transactions. This approach incorporates several factors, including the size of the transaction and any changes to list prices. The data is collected from prior sales, and although the data may not have the sample size or consistency to establish VSOE, it is sufficiently objective to estimate the selling price. When using cost plus a margin, we consider the total cost of the product or service, including customer-specific and geographic factors. We also consider the historical margins of the product or service on previous contracts and several factors including any changes to pricing methodologies, competitiveness of products and services and cost drivers that would cause future margins to differ from historical margins.
Products. We most often recognize revenue from sales of products upon customer acceptance of the system. Where formal acceptance is not required, we recognize revenue upon delivery or installation. When the product is part of a multiple element arrangement, we allocate a portion of the arrangement consideration to product revenue based on estimates of selling price.
Services. Maintenance services are provided under separate maintenance contracts with customers. These contracts generally provide for maintenance services for one year, although some are for multi-year periods, often with prepayments for the term of the contract. We consider the maintenance period to commence upon acceptance of the product or installation in situations where a formal acceptance is not required, which may include a warranty period. When service is part of a multiple element arrangement, we allocate a portion of the arrangement consideration to maintenance service revenue based on estimates of selling price. Maintenance contracts that are billed in advance of revenue recognition are recorded as deferred revenue. Maintenance revenue is recognized ratably over the term of the maintenance contract.
Revenue from engineering services is recognized as services are performed.
34
Table of Contents
Project Revenue. Revenue from design and build contracts is recognized under the percentage-of-completion, or POC method. Under the POC method, revenue is recognized based on the costs incurred to date as a percentage of the total estimated costs to fulfill the contract. If circumstances arise that change the original estimates of revenues, costs, or extent of progress toward completion, revisions to the estimates are made. These revisions may result in increases or decreases in estimated revenues or costs, and such revisions are recorded in income in the period in which the circumstances that gave rise to the revision become known by management. We perform ongoing profitability analyses of our contracts accounted for under the POC method in order to determine whether the latest estimates of revenue, costs and extent of progress require updating. If at any time these estimates indicate that the contract will be unprofitable, the entire estimated loss for the remainder of the contract is recorded immediately.
We record revenue from certain research and development contracts which include milestones using the milestone method if the milestones are determined to be substantive. A milestone is considered to be substantive if management believes there is substantive uncertainty that it will be achieved and the milestone consideration meets all of the following criteria:
| • | It is commensurate with either of the following: |
| • | Our performance to achieve the milestone; or |
| • | The enhancement of value of the delivered item or items as a result of a specific outcome resulting from our performance to achieve the milestone. |
| • | It relates solely to past performance. |
| • | It is reasonable relative to all of the deliverables and payment terms (including other potential milestone consideration) within the arrangement. |
The individual milestones are determined to be substantive or nonsubstantive in their entirety and milestone consideration is not bifurcated.
Revenue from projects is classified as Product Revenue or Service Revenue, based on the nature of the work performed.
Nonmonetary Transactions. We value and record nonmonetary transactions at the fair value of the asset surrendered unless the fair value of the asset received is more clearly evident, in which case the fair value of the asset received is used.
Inventory Valuation
We record our inventory at the lower of cost or market. We regularly evaluate the technological usefulness and anticipated future demand for our inventory components. Due to rapid changes in technology and the increasing demands of our customers, we are continually developing new products. Additionally, during periods of product or inventory component upgrades or transitions, we may acquire significant quantities of inventory to support estimated current and future production and service requirements. As a result, it is possible that older inventory items we have purchased may become obsolete, be sold below cost or be deemed in excess of quantities required for production or service requirements. When we determine it is not likely we will recover the cost of inventory items through future sales, we write-down the related inventory to our estimate of its market value.
Because the products we sell have high average sales prices and because a high number of our prospective customers receive funding from U.S. or foreign governments, it is difficult to estimate future sales of our products and the timing of such sales. It also is difficult to determine whether the cost of our inventories will ultimately be recovered through future sales. While we believe our inventory is stated at the lower of cost or market and that our estimates and assumptions to determine any adjustments to the cost of our inventories are reasonable, our estimates may prove to be inaccurate. We have sold inventory previously reduced in part or in whole to zero, and we may have future sales of previously written-down inventory. We also may have additional expense to write-down inventory to its estimated market value. Adjustments to these estimates in the future may materially impact our operating results.
35
Table of Contents
Accounting for Income Taxes
Deferred tax assets and liabilities are determined based on differences between financial reporting and tax bases of assets and liabilities and operating loss and tax credit carryforwards and are measured using the enacted tax rates and laws that will be in effect when the differences and carryforwards are expected to be recovered or settled. A valuation allowance for deferred tax assets is provided when we estimate that it is more likely than not that all or a portion of the deferred tax assets will not be realized through future operations. This assessment is based upon consideration of available positive and negative evidence, which includes, among other things, our recent results of operations and expected future profitability. We consider our actual historical results over several years to have stronger weight than other more subjective indicators, including forecasts, when considering whether to establish or reduce a valuation allowance on deferred tax assets. Cray has significant difficulty projecting future results due to the nature of the business and the industry in which the Company operates.
We recognize the income tax benefit from a tax position only if it is more likely than not that the tax position will be sustained on examination by the applicable taxing authorities, based on the technical merits of our position. The tax benefit recognized in the financial statements from such a position is measured based on the largest benefit that has a greater than fifty percent likelihood of being realized upon ultimate settlement.
Estimated interest and penalties are recorded as a component of interest expense and other expense, respectively.
As of December 31, 2011, we had approximately $128.0 million of net deferred tax assets, against which we provided a $110.5 million valuation allowance, resulting in a net deferred tax asset of $17.5 million. In 2011, the Company reduced the valuation allowances against deferred tax assets established in prior years. The aggregate reduction of $14.7 million ($.41 per diluted share) in deferred tax valuation allowances was attributable to a $13.9 million reduction related to a portion of the Company’s U.S. deferred tax assets and $0.8 million reduction related to all of the deferred tax assets of our German subsidiary. The reductions in previously established allowances were based upon an evaluation of all available positive and negative evidence including an assessment of known business risks and industry trends, as well as forecasted domestic and international earnings. We continue to provide a partial valuation allowance against our U.S. deferred tax assets and a full valuation allowance against deferred tax assets arising in a limited number of foreign jurisdictions as the realization of such assets is not considered to be more likely than not at this time. In a future period the Company’s assessment of the realizability of our deferred tax assets and therefore the appropriateness of the valuation allowance could change based on an assessment of all available evidence, both positive and negative in that future period. If our conclusion about the realizability of our deferred tax assets and therefore the appropriateness of the valuation allowance changes in a future period we could record a substantial tax provision or benefit in our Consolidated Statement of Operations when that occurs.
Research and Development Expenses
Research and development expenses include costs incurred in the development and production of our hardware and software, costs incurred to enhance and support existing product features, costs incurred to support and improve our development processes, and costs related to future product development. Research and development costs are expensed as incurred, and may be offset by co-funding from third parties. We may also enter into arrangements whereby we make advance, non-refundable payments to a vendor to perform certain research and development services. These payments are deferred and recognized over the vendor’s estimated performance period.
Amounts to be received under co-funding arrangements with the U.S. government or other customers are based on either contractual milestones or costs incurred. These co-funding milestone payments are recognized in operations as performance is estimated to be completed and are measured as milestone achievements occur or as costs are incurred. These estimates are reviewed on a periodic basis and are subject to change, including in the near term. If an estimate is changed, net research and development expense could be impacted significantly.
36
Table of Contents
We do not record a receivable from the U.S. government prior to completing the requirements necessary to bill for a milestone or cost reimbursement. Funding from the U.S. government is subject to certain budget restrictions and milestones may be subject to completion risk, and as a result, there may be periods in which research and development costs are expensed as incurred for which no reimbursement is recorded, as milestones have not been completed or the U.S. government has not funded an agreement. Accordingly, there can be substantial variability in the amount of net research and development expenses from quarter to quarter and year to year.
We classify amounts to be received from funded research and development projects as either revenue or a reduction to research and development expense based on the specific facts and circumstances of the contractual arrangement, considering total costs expected to be incurred compared to total expected funding and the nature of the research and development contractual arrangement. In the event that a particular arrangement is determined to represent revenue, the corresponding research and development costs are classified as cost of revenue.
Share-based Compensation
We measure compensation cost for share-based payment awards at fair value and recognize it as compensation expense over the service period for awards expected to vest. We recognize share-based compensation expense for all share-based payment awards, net of an estimated forfeiture rate. We recognize compensation cost for only those shares expected to vest on a straight-line basis over the requisite service period of the award.
Determining the appropriate fair value model and calculating the fair value of share-based payment awards requires subjective assumptions, including the expected life of the share-based payment awards and stock price volatility. We utilize the Black-Scholes options pricing model to value the stock options granted under our options plans. In this model, we utilize assumptions related to stock price volatility, stock option term and forfeiture rates that are based upon both historical factors as well as management’s judgment.
The fair value of restricted stock and restricted stock units is determined based on the number of shares or units granted and the quoted price of our common stock at the date of grant.
Recent Accounting Pronouncements
In June 2011, the Financial Accounting Standards Board issued Accounting Standards Update (“ASU”) No. 2011-05, Comprehensive Income, or ASU 2011-05. The guidance in ASU 2011-05 revises the manner in which entities present comprehensive income in their financial statements. An entity is required to report the components of comprehensive income in either one or two consecutive financial statements:
| • | A single, continuous statement must present the components of net income and total net income, the components of other comprehensive income and total other comprehensive income, and a total for comprehensive income. |
| • | In a two-statement approach, an entity must present the components of net income and total net income in the first statement. That statement must be immediately followed by a financial statement that presents the components of other comprehensive income, a total for other comprehensive income, and a total for comprehensive income. |
ASU 2011-05 does not change the items that must be reported in other comprehensive income. The amendments in ASU 2011-05 are effective for fiscal years beginning after December 15, 2011. The Company does not believe the adoption of ASU 2011-05 will have a material impact on the presentation of information in its financial statements.
Item 7A. Quantitative and Qualitative Disclosures About Market Risk
We are exposed to financial market risks, including changes in interest rates and equity price fluctuations.
37
Table of Contents
Interest Rate Risk: We invest our available cash in money market mutual funds whose underlying investments include investment-grade debt instruments of corporate issuers and in debt instruments of the U.S. government and its agencies. We do not have any derivative instruments or auction rate securities in our investment portfolio. We protect and preserve invested funds by limiting default, market and reinvestment risk. Investments in both fixed-rate and floating-rate interest earning instruments carry a degree of interest rate risk. Fixed-rate securities may have their fair market value adversely affected due to a rise in interest rates, while floating-rate securities may produce less income than expected if interest rates fall. Due in part to these factors, our future investment income may fall short of expectations due to changes in interest rates or we may suffer losses in principal if forced to sell securities which have declined in market value due to changes in interest rates. Although we have the above noted risks, a 0.5% change in interest rates would not be material.
Foreign Currency Risk: We sell our products primarily in North America, Asia and Europe. As a result, our financial results could be affected by factors such as changes in foreign currency exchange rates or weak economic conditions in foreign markets. Our products are generally priced based on U.S. dollars, and a strengthening of the dollar could make our products less competitive in foreign markets. While we often sell products with payments in U.S. dollars, our product sales contracts may call for payment in foreign currencies and to the extent we do so, or engage with our foreign subsidiaries in transactions deemed to be short-term in nature, we are subject to foreign currency exchange risks. As of December 31, 2011, we had entered into forward exchange contracts that hedge approximately $55.8 million of anticipated cash receipts on specific foreign currency denominated sales contracts. These forward contracts hedge the risk of foreign exchange rate changes between the time that the related contracts were signed and when the cash receipts are expected to be received. Our foreign maintenance contracts are typically paid in local currencies and provide a partial natural hedge against foreign exchange exposure. To the extent that we wish to repatriate any of these funds to the United States, however, we are subject to foreign exchange risks. As of December 31, 2011, a 10% change in foreign exchange rates could impact our annual earnings and cash flows by approximately $0.5 million. We do not hold or purchase any currency forward exchange contracts for trading purposes.
38
Table of Contents
Item 8. Financial Statements and Supplementary Data
INDEX TO FINANCIAL STATEMENTS*
| * | The Financial Statements are located following page F-1. |
The selected quarterly financial data required by this item is set forth in Note 18 of the Notes to Consolidated Financial Statements.
39
Table of Contents
Item 9. Changes in and Disagreements with Accountants on Accounting and Financial Disclosure
None.
Item 9A. Controls and Procedures
Disclosure Controls and Procedures
We maintain disclosure controls and procedures that are designed to ensure that information required to be disclosed in our reports under the Exchange Act is recorded, processed, summarized and reported within the time periods specified in the SEC’s rules and forms, and that such information is accumulated and communicated to management, as appropriate, to allow timely decisions regarding required disclosure. Our management, with the participation and under the supervision of our Chief Executive Officer, Chief Financial Officer and Chief Accounting Officer/Corporate Controller, evaluated the effectiveness of our disclosure controls and procedures as of the end of the period covered by this report, and based on that evaluation, our Chief Executive Officer and Chief Financial Officer determined that our disclosure controls and procedures were effective.
Changes in Internal Control over Financial Reporting
There have been no changes in our internal controls over financial reporting during the fourth quarter of 2011 that have materially affected, or are reasonably likely to materially affect, our internal controls over financial reporting.
Management’s Report on Internal Control Over Financial Reporting
Our management is responsible for establishing and maintaining adequate internal control over financial reporting as defined by Rule 13a-15(f) under the Exchange Act. Internal control over financial reporting is a process designed to provide reasonable assurance regarding the reliability of financial reporting and the preparation of financial statements for external purposes in accordance with accounting principles generally accepted in the United States of America.
Our internal control over financial reporting includes those policies and procedures that (i) pertain to the maintenance of records that, in reasonable detail, accurately and fairly reflect our transactions and dispositions of assets; (ii) provide reasonable assurance that transactions are recorded as necessary to permit preparation of financial statements in accordance with accounting principles generally accepted in the United States of America, and that our receipts and expenditures are being made only in accordance with authorizations of our management and directors; and (iii) provide reasonable assurance regarding prevention or timely detection of unauthorized acquisition, use, or disposition of our assets that could have a material effect on the financial statements.
Because of its inherent limitations, internal control over financial reporting may not prevent or detect misstatements. Also, projections of any evaluation of effectiveness to future periods are subject to the risk that controls may become inadequate because of changes in conditions, or that the degree of compliance with the policies or procedures may deteriorate.
Our management, including our Chief Executive Officer and Chief Financial Officer, conducted an evaluation of the effectiveness of our internal control over financial reporting based on the framework in “Internal Control — Integrated Framework” issued by the Committee of Sponsoring Organizations of the Treadway Commission, or COSO. Based on this evaluation, our management concluded that our internal control over financial reporting was effective as of December 31, 2011.
Peterson Sullivan LLP, an independent registered public accounting firm, has expressed an unqualified opinion on the effectiveness of our internal control over financial reporting as of December 31, 2011.
40
Table of Contents
REPORT OF INDEPENDENT REGISTERED PUBLIC ACCOUNTING FIRM
To the Board of Directors and Shareholders
Cray Inc.
We have audited Cray Inc. and Subsidiaries’ (“the Company”) internal control over financial reporting as of December 31, 2011, based on criteria established in Internal Control — Integrated Framework issued by the Committee of Sponsoring Organizations of the Treadway Commission (COSO). The Company’s management is responsible for maintaining effective internal control over financial reporting and for its assessment of the effectiveness of internal control over financial reporting included in the accompanying Management’s Report on Internal Control Over Financial Reporting. Our responsibility is to express an opinion on the Company’s internal control over financial reporting based on our audit.
We conducted our audit in accordance with the standards of the Public Company Accounting Oversight Board (United States). Those standards require that we plan and perform the audit to obtain reasonable assurance about whether effective internal control over financial reporting was maintained in all material respects. Our audit included obtaining an understanding of internal control over financial reporting, assessing the risk that a material weakness exists, and testing and evaluating the design and operating effectiveness of internal control based on the assessed risk. Our audit also included performing such other procedures as we considered necessary in the circumstances. We believe that our audit provides a reasonable basis for our opinion.
A company’s internal control over financial reporting is a process designed to provide reasonable assurance regarding the reliability of financial reporting and the preparation of financial statements for external purposes in accordance with accounting principles generally accepted in the United States of America. A company’s internal control over financial reporting includes those policies and procedures that (1) pertain to the maintenance of records that, in reasonable detail, accurately and fairly reflect the transactions and dispositions of the assets of the company; (2) provide reasonable assurance that transactions are recorded as necessary to permit preparation of financial statements in accordance with accounting principles generally accepted in the United States of America, and that receipts and expenditures of the company are being made only in accordance with authorizations of management and directors of the company; and (3) provide reasonable assurance regarding prevention or timely detection of unauthorized acquisition, use, or disposition of the company’s assets that could have a material effect on the financial statements.
Because of its inherent limitations, internal control over financial reporting may not prevent or detect misstatements. Also, projections of any evaluation of effectiveness to future periods are subject to the risk that controls may become inadequate because of changes in conditions, or that the degree of compliance with the policies or procedures may deteriorate.
In our opinion, the Company maintained, in all material respects, effective internal control over financial reporting as of December 31, 2011, based on criteria established in Internal Control — Integrated Framework issued by the Committee of Sponsoring Organizations of the Treadway Commission (COSO).
We have also audited, in accordance with the standards of the Public Company Accounting Oversight Board (United States), the consolidated balance sheets of the Company as of December 31, 2011 and 2010, and the related consolidated statements of operations, shareholders’ equity and comprehensive income (loss), and cash flows for each of the three years in the period ended December 31, 2011, and our report dated February 27, 2012, expressed an unqualified opinion on those consolidated financial statements.
/s/ PETERSON SULLIVAN LLP
Seattle, Washington
February 27, 2012
41
Table of Contents
None.
Item 10. Directors, Executive Officers and Corporate Governance
The information required by this Item is contained in part in the sections captioned “Our Common Stock Ownership,” “The Board of Directors,” “Executive Officers” and “Proposal 1: To Elect Eight Directors for One-Year Terms” in the proxy statement for our annual meeting of shareholders scheduled to be held on or around June 7, 2012, and such information is incorporated herein by reference.
Item 11. Executive Compensation
The information required by this Item is contained in the section captioned “The Board of Directors — Compensation of Directors” and “Compensation of the Executive Officers” of the proxy statement for our annual meeting of shareholders scheduled to be held on or around June 7, 2012, and such information is incorporated herein by reference.
Item 12. Security Ownership of Certain Beneficial Owners and Management and Related Shareholder Matters
The information required by this Item is contained in part in the section captioned “Our Common Stock Ownership” in the proxy statement for our annual meeting of shareholders scheduled to be held on or around June 7, 2012, and such information is incorporated herein by reference.
Item 13. Certain Relationships and Related Transactions, and Director Independence
The information required by this Item is contained in the sections captioned “The Board of Directors — Independence” and “Transactions With Related Persons” of the proxy statement for our annual meeting of shareholders scheduled to be held on or around June 7, 2012, and such information is incorporated herein by reference.
Item 14. Principal Accountant Fees and Services
The information required by this Item is contained in the section captioned “Proposal 2: To Ratify the Appointment of Peterson Sullivan LLP as Our Independent Auditors” of the proxy statement for our annual meeting of shareholders scheduled to be held on or around June 7, 2012, and such information is incorporated herein by reference.
Item 15. Exhibits and Financial Statement Schedules
| (a)(1) | Financial Statements | |
| Consolidated Balance Sheets at December 31, 2011 and December 31, 2010 | ||
| Consolidated Statements of Operations for the years ended December 31, 2011, 2010 and 2009 | ||
| Consolidated Statements of Shareholders’ Equity and Comprehensive Income (Loss) for the years ended December 31, 2011, 2010 and 2009 | ||
| Consolidated Statements of Cash Flows for the years ended December 31, 2011, 2010 and 2009 | ||
| Notes to Consolidated Financial Statements | ||
| Report of Independent Registered Public Accounting Firm | ||
42
Table of Contents
(a)(2) Financial Statement Schedules
Schedule II — Valuation and Qualifying Accounts — The financial statement schedule for the years ended December 31, 2011, 2010, and 2009 should be read in conjunction with the consolidated financial statements of Cray Inc. filed as part of this annual report on Form 10-K.
Schedules other than that listed above have been omitted since they are either not required, not applicable, or because the information required is included in the consolidated financial statements or the notes thereto.
(a)(3) Exhibits
The Exhibits listed in the Exhibit Index, which appears immediately following the signature page and is incorporated herein by reference, are filed as part of this annual report on Form 10-K. Each management contract or compensatory plan or agreement listed on the Exhibit Index is identified by an asterisk.
43
Table of Contents
SIGNATURES
Pursuant to the requirements of Section 13 or 15(d) of the Securities Exchange Act of 1934, the Company has duly caused this report to be signed on its behalf by the undersigned, thereunto duly authorized, in the City of Seattle, State of Washington, on February 27, 2012.
| CRAY INC. | ||
| By |
/s/ PETER J. UNGARO | |
| Peter J. Ungaro | ||
| Chief Executive Officer and President | ||
Each of the undersigned hereby constitutes and appoints Peter J. Ungaro, Brian C. Henry and Michael C. Piraino and each of them, the undersigned’s true and lawful attorney-in-fact and agent, with full power of substitution, for the undersigned and in his or her name, place and stead, in any and all capacities, to sign any or all amendments to this Annual Report on Form 10-K and any other instruments or documents that said attorneys-in-fact and agents may deem necessary or advisable, to enable Cray Inc. to comply with the Securities Exchange Act of 1934 and any requirements of the Securities and Exchange Commission in respect thereof, and to file the same, with all exhibits thereto, with the Securities and Exchange Commission, granting unto said attorneys-in-fact and agents and each of them full power and authority to do and perform each and every act and thing requisite and necessary to be done, as fully to all intents and purposes as the undersigned might or could do in person, hereby ratifying and confirming all that each such attorney-in-fact and agent, or his substitute, may lawfully do or cause to be done by virtue hereof.
Pursuant to the requirements of the Securities Exchange Act of 1934, this report has been signed below by the following persons on behalf of the Company and in the capacities indicated on February 27, 2012.
| Signature |
Title | |
|
By /s/ PETER J. UNGARO Peter J. Ungaro |
Chief Executive Officer, President and Director (Principal Executive Officer) | |
| By /s/ BRIAN C. HENRY Brian C. Henry |
Chief Financial Officer and Executive Vice President (Principal Financial Officer) | |
|
By /s/ CHARLES D. FAIRCHILD Charles D. Fairchild |
Chief Accounting Officer, Controller and Vice President (Principal Accounting Officer) | |
|
By /s/ WILLIAM C. BLAKE William C. Blake |
Director | |
|
By /s/ JOHN B. JONES, JR. John B. Jones, Jr. |
Director | |
| By /s/ STEPHEN C. KIELY Stephen C. Kiely |
Director | |
|
By /s/ FRANK L. LEDERMAN Frank L. Lederman |
Director | |
|
By /s/ SALLY G. NARODICK Sally G. Narodick |
Director | |
| By /s/ DANIEL C. REGIS Daniel C. Regis |
Director | |
|
By /s/ STEPHEN C. RICHARDS Stephen C. Richards |
Director | |
44
Table of Contents
EXHIBIT INDEX
| Exhibit |
Exhibit Description |
Incorporated by Reference | ||||||||||||||||||
| Form | File No. | Filing Date |
Exhibit/ Annex |
Filed Herewith | ||||||||||||||||
| 3.1 | Restated Articles of Incorporation | 8-K | 000-26820 | 06/08/06 | 3.3 | |||||||||||||||
| 3.2 | Amended and Restated Bylaws | 8-K | 000-26820 | 02/12/07 | 3.1 | |||||||||||||||
| 10.0* | 1999 Stock Option Plan | S-8 | 333-57970 | 03/30/01 | 4.1 | |||||||||||||||
| 10.1* | 2000 Non-Executive Employee Stock Option Plan | S-8 | 333-57970 | 03/30/01 | 4.2 | |||||||||||||||
| 10.2* | 2001 Employee Stock Purchase Plan, as Amended | |
DEF 14A |
|
000-26820 | 04/14/05 | A | |||||||||||||
| 10.3* | 2003 Stock Option Plan | |
DEF 14A |
|
000-26820 | 03/31/03 | A | |||||||||||||
| 10.4* | 2004 Long-Term Equity Compensation Plan | |
DEF 14A |
|
000-26820 | 03/24/04 | B | |||||||||||||
| 10.5* | 2005 Executive Bonus Plan | 8-K | 000-26820 | 03/25/05 | 10.1 | |||||||||||||||
| 10.6* | Cray Canada Inc. Amended and Restated Key Employee Stock Option Plan | S-8 | 333-114243 | 04/06/04 | 4 | |||||||||||||||
| 10.7* | 2006 Long-Term Equity Compensation Plan | |
DEF 14A |
|
000-26820 | 04/28/06 | B | |||||||||||||
| 10.8* | 2009 Long-Term Equity Compensation Plan | |
DEF 14A |
|
000-26820 | 03/31/09 | A | |||||||||||||
| 10.9* | Form of Officer Non-Qualified Stock Option Agreement | 10-K | 000-26820 | 04/01/05 | 10.32 | |||||||||||||||
| 10.10* | Form of Officer Incentive Stock Option Agreement | 10-K | 000-26820 | 04/01/05 | 10.33 | |||||||||||||||
| 10.11* | Form of Director Stock Option Agreement | 10-K | 000-26820 | 04/01/05 | 10.34 | |||||||||||||||
| 10.12* | Form of Director Stock Option Agreement, immediate vesting | 10-K | 000-26820 | 04/01/05 | 10.35 | |||||||||||||||
| 10.13* | Form of Employee Restricted Stock Agreement, current form | 10-K | 000-26820 | 03/09/07 | 10.11 | |||||||||||||||
| 10.14* | Form of Director Restricted Stock Agreement | 8-K | 000-26820 | 06/08/06 | 10.1 | |||||||||||||||
| 10.15* | 2007 Cash Incentive Plan | 8-K | 000-26820 | 02/12/07 | 10.1 | |||||||||||||||
| 10.16* | Senior Officer Cash Incentive Plan for annual cash incentive awards | 8-K | 000-26820 | 05/14/08 | 10.1 | |||||||||||||||
| 10.17* | Letter Agreement between the Company and Peter J. Ungaro, dated March 4, 2005 | 8-K | 000-26820 | 03/08/05 | 10.1 | |||||||||||||||
| 10.18* | Offer Letter between the Company and Margaret A. Williams, dated April 14, 2005 | 8-K | 000-26820 | 05/09/05 | 10.1 | |||||||||||||||
| 10.19* | Offer Letter between the Company and Brian C. Henry, dated May 16, 2005 | 10-Q | 000-26820 | 11/09/05 | 10.1 | |||||||||||||||
45
Table of Contents
| Exhibit |
Exhibit Description |
Incorporated by Reference | ||||||||||||||||||
| Form | File No. | Filing Date |
Exhibit/ Annex |
Filed Herewith | ||||||||||||||||
| 10.20* | Form of Management Continuation Agreement between the Company and its Executive Officers and certain other Employees | 10-Q | 000-26820 | 05/17/99 | 10.1 | |||||||||||||||
| 10.21* | Form of Management Retention Agreement, dated as of December 19, 2008, including Annex A-1 and Annex A-2 applicable to Peter J. Ungaro and Brian C. Henry, respectively | 8-K | 000-26820 | 12/22/08 | 10.1 | |||||||||||||||
| 10.22* | Executive Severance Policy, as adopted on December 13, 2010 | 8-K | 000-26820 | 12/17/10 | 10.1 | |||||||||||||||
| 10.23* | Retention Agreement between the Company and Peter J. Ungaro, dated December 20, 2005 | 8-K | 000-26820 | 12/22/05 | 10.2 | |||||||||||||||
| 10.24* | Retention Agreement between the Company and Brian C. Henry, dated December 20, 2005 | 8-K | 000-26820 | 12/22/05 | 10.3 | |||||||||||||||
| 10.25* | Retention Agreement between the Company and Margaret A. Williams, dated December 20, 2005 | 8-K | 000-26820 | 12/22/05 | 10.4 | |||||||||||||||
| 10.26* | Summary sheet setting forth amended compensation arrangements for non-employee Directors | 8-K | 000-26820 | 02/21/06 | 10.1 | |||||||||||||||
| 10.27* | Amended and Restated 2001 Employee Stock Purchase Plan | 10-K | 000-26820 | 03/04/11 | 10.28 | |||||||||||||||
| 10.28* | Form of Indemnification Agreement | 8-K | 000-26820 | 02/08/11 | 10.1 | |||||||||||||||
| 10.29 | Lease Agreement between 900 Fourth Avenue Property LLC and the Company, dated as of August 11, 2008 | 8-K | 000-26820 | 08/29/08 | 10.1 | |||||||||||||||
| 10.30 | FAB I Building Lease Agreement between Union Semiconductor Technology Corporation and the Company, dated June 30, 2000 | 10-K | 000-26820 | 04/02/01 | 10.9 | |||||||||||||||
| 10.31 | Amendment No. 1 to the FAB Building Lease Agreement between Union Semiconductor Technology Corporation and the Company, dated as of August 19, 2002 | 10-K | 000-26820 | 03/28/03 | 10.13 | |||||||||||||||
| 10.32 | Conference Center Lease Agreement between Union Semiconductor Technology Corporation and the Company, dated June 30, 2000 | 10-K | 000-26820 | 04/02/01 | 10.10 | |||||||||||||||
| 10.33 | Amendment No. 1 to the Conference Center Lease Agreement between Union Semiconductor Technology Corporation and the Company, dated as of August 19, 2002 | 10-K | 000-26820 | 03/28/03 | 10.15 | |||||||||||||||
| 10.34 | Development Building and Conference Center Lease Agreement between Northern Lights Semiconductor Corporation and the Company, dated as of February 1, 2008 | 8-K | 000-26820 | 02/01/08 | 10.1 | |||||||||||||||
| 10.35 | Lease Agreement between NEA Galtier, LLC and the Company, dated as of July 2, 2009 | 8-K | 000-26820 | 07/16/09 | 10.1 | |||||||||||||||
46
Table of Contents
| Exhibit |
Exhibit Description |
Incorporated by Reference | ||||||||||||||||||||
| Form | File No. | Filing Date |
Exhibit/ Annex |
Filed Herewith |
||||||||||||||||||
| 10.36 | Technology Agreement between Silicon Graphics, Inc. and the Company, effective as of March 31, 2000 | 10-Q | 000-26820 | 05/15/00 | 10.3 | |||||||||||||||||
| 10.37 | Amendment No. 2 to the Technology Agreement between Silicon Graphics, Inc. and the Company, dated as of March 30, 2007 | 10-Q | 000-26820 | 08/07/07 | 10.1 | |||||||||||||||||
| 10.38 | Amendment No. 3 to the Technology Agreement between Silicon Graphics, Inc. and the Company, dated as of March, 28, 2008 | 8-K | 000-26820 | 04/08/08 | 10.1 | |||||||||||||||||
| 10.39 | Credit Agreement between Wells Fargo Bank, National Association and the Company, dated December 29, 2006 | 8-K | 000-26820 | 01/04/07 | 10.1 | |||||||||||||||||
| 10.40 | First Amendment to Credit Agreement between Wells Fargo Bank, National Association and the Company, dated January 31, 2007 | 10-K | 000-26820 | 03/09/07 | 10.42 | |||||||||||||||||
| 10.41 | Second Amendment to Credit Agreement between Wells Fargo Bank, National Association and the Company, effective as of December 31, 2007 | 8-K | 000-26820 | 01/04/08 | 10.1 | |||||||||||||||||
| 10.42 | Third Amendment to Credit Agreement between Wells Fargo Bank, National Association and the Company, dated August 22, 2008 | 8-K | 000-26820 | 08/29/08 | 10.2 | |||||||||||||||||
| 10.43 | Fourth Amendment to Credit Agreement between Wells Fargo Bank, National Association and the Company, dated April 20, 2009 | 10-K | 000-26820 | 03/16/10 | 10.44 | |||||||||||||||||
| 10.44 | Fifth Amendment to Credit Agreement between Wells Fargo Bank, National Association and the Company, dated June 1, 2009 | 8-K | 000-26820 | 07/13/09 | 10.1 | |||||||||||||||||
| 10.45 | Sixth Amendment to Credit Agreement between Wells Fargo Bank, National Association and the Company, dated June 1, 2010 |
X | ||||||||||||||||||||
| 10.46 | Seventh Amendment to Credit Agreement between Wells Fargo Bank, National Association and the Company, dated June 1, 2011 |
X | ||||||||||||||||||||
| 10.47 | Loan and Security Agreement between Silicon Valley Bank and the Company, dated September 13, 2010 | 8-K | 000-26820 | 09/17/10 | 10.1 | |||||||||||||||||
| 10.48 | Amendment No. 1 to Loan and Security Agreement between Silicon Valley Bank and the Company, dated June 21, 2011 |
X | ||||||||||||||||||||
| 21.1 | Subsidiaries of the Company | X | ||||||||||||||||||||
| 23.1 | Consent of Peterson Sullivan LLP, Independent Registered Public Accounting Firm | X | ||||||||||||||||||||
| 24.1 | Power of Attorney for directors and officers (included on the signature page of this report) | X | ||||||||||||||||||||
47
Table of Contents
| Exhibit |
Exhibit Description |
Incorporated by Reference | ||||||||||||
| Form | File No. | Filing Date |
Exhibit/ Annex |
Filed Herewith |
||||||||||
| 31.1 | Rule 13a-14(a)/15d-14(a) Certification of Mr. Ungaro, Chief Executive Officer | X | ||||||||||||
| 31.2 | Rule 13a-14(a)/15d-14(a) Certification of Mr. Henry, Chief Financial Officer | X | ||||||||||||
| 32.1 | Certification pursuant to 18 U.S.C. Section 1350 by the Chief Executive Officer and the Chief Financial Officer | X | ||||||||||||
| 101.INS | XBRL Instance Document | X | ||||||||||||
| 101.SCH | XBRL Taxonomy Extension Schema Document | X | ||||||||||||
| 101.CAL | XBRL Taxonomy Extension Calculation Linkbase Document | X | ||||||||||||
| 101.LAB | XBRL Taxonomy Extension Label Linkbase Document | X | ||||||||||||
| 101.PRE | XBRL Taxonomy Extension Presentation Linkbase Document | X | ||||||||||||
| * | Management contract or compensatory plan or arrangement. |
Excluded from this list of exhibits, pursuant to Paragraph (b)(4)(iii)(a) of Item 601 of Regulation S-K, may be one or more instruments defining the rights of holders of long-term debt of the Company. The Company hereby agrees that it will, upon request of the Securities and Exchange Commission, furnish to the Commission a copy of any such instrument.
48
Table of Contents
CONSOLIDATED BALANCE SHEETS
(In thousands, except share data)
| December 31, 2011 |
December 31, 2010 |
|||||||
| ASSETS | ||||||||
| Current assets: |
||||||||
| Cash and cash equivalents |
$ | 50,411 | $ | 57,381 | ||||
| Restricted cash |
3,776 | 3,914 | ||||||
| Accounts and other receivables, net |
72,381 | 106,268 | ||||||
| Inventory |
97,881 | 49,241 | ||||||
| Prepaid expenses and other current assets |
12,932 | 5,901 | ||||||
|
|
|
|
|
|||||
| Total current assets |
237,381 | 222,705 | ||||||
| Property and equipment, net |
16,462 | 17,953 | ||||||
| Service inventory, net |
1,611 | 1,887 | ||||||
| Deferred tax asset |
13,352 | 3,105 | ||||||
| Other non-current assets |
14,293 | 14,978 | ||||||
|
|
|
|
|
|||||
| TOTAL ASSETS |
$ | 283,099 | $ | 260,628 | ||||
|
|
|
|
|
|||||
| LIABILITIES AND SHAREHOLDERS’ EQUITY |
| |||||||
| Current liabilities: |
||||||||
| Accounts payable |
$ | 38,328 | $ | 20,384 | ||||
| Accrued payroll and related expenses |
11,270 | 20,668 | ||||||
| Other accrued liabilities |
5,414 | 6,380 | ||||||
| Deferred revenue |
44,636 | 49,896 | ||||||
|
|
|
|
|
|||||
| Total current liabilities |
99,648 | 97,328 | ||||||
| Long-term deferred revenue |
14,184 | 14,954 | ||||||
| Other non-current liabilities |
2,453 | 2,525 | ||||||
|
|
|
|
|
|||||
| TOTAL LIABILITIES |
116,285 | 114,807 | ||||||
| Commitments and Contingencies (Note 9) |
||||||||
| Shareholders’ equity: |
||||||||
| Preferred stock — Authorized and undesignated, 5,000,000 shares; no shares issued or outstanding |
— | — | ||||||
| Common stock and additional paid-in capital, par value $.01 per share — Authorized, 75,000,000 shares; issued and outstanding 36,763,379 and 36,068,081 shares, respectively |
564,148 | 559,058 | ||||||
| Accumulated other comprehensive income |
6,480 | 4,906 | ||||||
| Accumulated deficit |
(403,814 | ) | (418,143 | ) | ||||
|
|
|
|
|
|||||
| TOTAL SHAREHOLDERS’ EQUITY |
166,814 | 145,821 | ||||||
|
|
|
|
|
|||||
| TOTAL LIABILITIES AND SHAREHOLDERS’ EQUITY |
$ | 283,099 | $ | 260,628 | ||||
|
|
|
|
|
|||||
See accompanying notes
F-1
Table of Contents
CONSOLIDATED STATEMENTS OF OPERATIONS
(In thousands, except per share data)
| Years Ended December 31, | ||||||||||||
| 2011 | 2010 | 2009 | ||||||||||
| Revenue: |
||||||||||||
| Product |
$ | 155,561 | $ | 239,085 | $ | 199,114 | ||||||
| Service |
80,485 | 80,303 | 84,933 | |||||||||
|
|
|
|
|
|
|
|||||||
| Total revenue |
236,046 | 319,388 | 284,047 | |||||||||
|
|
|
|
|
|
|
|||||||
| Cost of revenue: |
||||||||||||
| Cost of product revenue |
101,000 | 155,027 | 130,444 | |||||||||
| Cost of service revenue |
40,680 | 54,404 | 47,719 | |||||||||
|
|
|
|
|
|
|
|||||||
| Total cost of revenue |
141,680 | 209,431 | 178,163 | |||||||||
|
|
|
|
|
|
|
|||||||
| Gross profit |
94,366 | 109,957 | 105,884 | |||||||||
| Operating expenses: |
||||||||||||
| Research and development, net |
49,452 | 43,618 | 62,947 | |||||||||
| Sales and marketing |
26,134 | 31,085 | 26,601 | |||||||||
| General and administrative |
15,840 | 17,767 | 16,579 | |||||||||
| Restructuring |
1,783 | — | — | |||||||||
|
|
|
|
|
|
|
|||||||
| Total operating expenses |
93,209 | 92,470 | 106,127 | |||||||||
|
|
|
|
|
|
|
|||||||
| Income (loss) from operations |
1,157 | 17,487 | (243 | ) | ||||||||
| Other expense, net |
(989 | ) | (766 | ) | (430 | ) | ||||||
| Interest income (expense), net |
(33 | ) | 219 | (805 | ) | |||||||
|
|
|
|
|
|
|
|||||||
| Income (loss) before income taxes |
135 | 16,940 | (1,478 | ) | ||||||||
| Income tax benefit (expense) |
14,194 | (1,878 | ) | 874 | ||||||||
|
|
|
|
|
|
|
|||||||
| Net income (loss) |
$ | 14,329 | $ | 15,062 | $ | (604 | ) | |||||
|
|
|
|
|
|
|
|||||||
| Basic net income (loss) per common share |
$ | 0.41 | $ | 0.44 | $ | (0.02 | ) | |||||
|
|
|
|
|
|
|
|||||||
| Diluted net income (loss) per common share |
$ | 0.40 | $ | 0.43 | $ | (0.02 | ) | |||||
|
|
|
|
|
|
|
|||||||
| Basic weighted average shares outstanding |
35,122 | 34,313 | 33,559 | |||||||||
|
|
|
|
|
|
|
|||||||
| Diluted weighted average shares outstanding |
36,072 | 35,278 | 33,559 | |||||||||
|
|
|
|
|
|
|
|||||||
See accompanying notes
F-2
Table of Contents
CONSOLIDATED STATEMENTS OF SHAREHOLDERS’ EQUITY
AND COMPREHENSIVE INCOME (LOSS)
(In thousands)
| Common Stock and Additional Paid In Capital |
Accumulated Other Comprehensive Income |
Accumulated Deficit |
Total | Comprehensive Income (Loss) |
||||||||||||||||||||
| Number of Shares |
Amount | |||||||||||||||||||||||
| BALANCE, December 31, 2008 |
33,507 | $ | 543,442 | $ | 9,364 | $ | (432,601 | ) | $ | 120,205 | ||||||||||||||
| Issuance of shares under employee stock purchase plan |
108 | 510 | — | — | 510 | — | ||||||||||||||||||
| Exercise of stock options |
43 | 264 | — | — | 264 | — | ||||||||||||||||||
| Issuance of shares under Company 401(k) Plan match |
671 | 1,780 | — | — | 1,780 | — | ||||||||||||||||||
| Restricted shares issued for compensation, net of forfeitures |
852 | — | — | — | — | — | ||||||||||||||||||
| Share-based compensation |
— | 5,811 | — | — | 5,811 | — | ||||||||||||||||||
| Stock option repurchase |
— | (587 | ) | — | — | (587 | ) | — | ||||||||||||||||
| Other comprehensive loss: |
||||||||||||||||||||||||
| Unrealized gain on available-for-sale securities |
— | — | 4 | — | 4 | 4 | ||||||||||||||||||
| Currency translation adjustment |
— | — | (882 | ) | — | (882 | ) | (882 | ) | |||||||||||||||
| Unrealized loss on cash flow hedges, net of reclassification adjustments |
— | — | (2,338 | ) | — | (2,338 | ) | (2,338 | ) | |||||||||||||||
| Net loss |
— | — | — | (604 | ) | (604 | ) | (604 | ) | |||||||||||||||
|
|
|
|
|
|
|
|
|
|
|
|
|
|||||||||||||
| BALANCE, December 31, 2009 |
35,181 | $ | 551,220 | $ | 6,148 | $ | (433,205 | ) | $ | 124,163 | $ | (3,820 | ) | |||||||||||
|
|
|
|
|
|
|
|
|
|
|
|
|
|||||||||||||
| Issuance of shares under employee stock purchase plan |
84 | 497 | — | — | 497 | — | ||||||||||||||||||
| Exercise of stock options |
92 | 436 | — | — | 436 | — | ||||||||||||||||||
| Issuance of shares under Company 401(k) Plan match |
355 | 1,978 | — | — | 1,978 | — | ||||||||||||||||||
| Restricted shares issued for compensation, net of forfeitures |
356 | — | — | — | — | — | ||||||||||||||||||
| Share-based compensation |
— | 4,927 | — | — | 4,927 | — | ||||||||||||||||||
| Other comprehensive income: |
||||||||||||||||||||||||
| Reclassification adjustment for gains on available-for-sale securities included in net income |
— | — | (3 | ) | — | (3 | ) | (3 | ) | |||||||||||||||
| Currency translation adjustment |
— | — | 350 | — | 350 | 350 | ||||||||||||||||||
| Unrealized loss on cash flow hedges, net of reclassification adjustments |
— | — | (1,589 | ) | — | (1,589 | ) | (1,589 | ) | |||||||||||||||
| Net income |
— | — | — | 15,062 | 15,062 | 15,062 | ||||||||||||||||||
|
|
|
|
|
|
|
|
|
|
|
|
|
|||||||||||||
| BALANCE, December 31, 2010 |
36,068 | $ | 559,058 | $ | 4,906 | $ | (418,143 | ) | $ | 145,821 | $ | 13,820 | ||||||||||||
|
|
|
|
|
|
|
|
|
|
|
|
|
|||||||||||||
| Issuance of shares under employee stock purchase plan |
65 | 372 | — | — | 372 | — | ||||||||||||||||||
| Exercise of stock options |
248 | 1,090 | — | — | 1,090 | — | ||||||||||||||||||
| Restricted shares issued for compensation, net of forfeitures |
382 | — | — | — | — | — | ||||||||||||||||||
| Share-based compensation |
— | 3,628 | — | — | 3,628 | — | ||||||||||||||||||
| Other comprehensive income: |
||||||||||||||||||||||||
| Currency translation adjustment |
— | — | 785 | — | 785 | 785 | ||||||||||||||||||
| Unrealized gain on cash flow hedges, net of reclassification adjustments |
— | — | 789 | — | 789 | 789 | ||||||||||||||||||
| Net income |
— | — | — | 14,329 | 14,329 | 14,329 | ||||||||||||||||||
|
|
|
|
|
|
|
|
|
|
|
|
|
|||||||||||||
| BALANCE, December 31, 2011 |
36,763 | $ | 564,148 | $ | 6,480 | $ | (403,814 | ) | $ | 166,814 | $ | 15,903 | ||||||||||||
|
|
|
|
|
|
|
|
|
|
|
|
|
|||||||||||||
See accompanying notes
F-3
Table of Contents
CONSOLIDATED STATEMENTS OF CASH FLOWS
(In thousands)
| Years Ended December 31, | ||||||||||||
| 2011 | 2010 | 2009 | ||||||||||
| Operating activities: |
||||||||||||
| Net income (loss) |
$ | 14,329 | $ | 15,062 | $ | (604 | ) | |||||
| Adjustments to reconcile net income (loss) to net cash provided by (used in) operating activities: |
||||||||||||
| Depreciation and amortization |
8,601 | 9,431 | 8,454 | |||||||||
| Loss on disposal of fixed assets |
503 | 504 | — | |||||||||
| Share-based compensation expense |
3,628 | 4,927 | 5,811 | |||||||||
| Inventory write-down |
— | 887 | 5,431 | |||||||||
| Amortization of issuance costs, convertible notes payable and line of credit |
— | — | 11 | |||||||||
| Deferred income taxes |
(14,396 | ) | (251 | ) | (1,411 | ) | ||||||
| Amortization of convertible notes debt discount |
— | — | 834 | |||||||||
| Loss on repurchase of Notes |
— | — | 910 | |||||||||
| Cash (used in) provided by operations due to changes in operating assets and liabilities: |
||||||||||||
| Accounts and other receivables |
34,180 | (68,077 | ) | 56,735 | ||||||||
| Inventory |
(50,950 | ) | (25,300 | ) | 44,119 | |||||||
| Prepaid expenses and other assets |
(2,275 | ) | (2,040 | ) | 16,078 | |||||||
| Accounts payable |
18,099 | 1,600 | 2,028 | |||||||||
| Accrued payroll and related expenses and other accrued liabilities |
(9,493 | ) | 1,480 | (37,033 | ) | |||||||
| Other non-current liabilities |
(71 | ) | (194 | ) | (456 | ) | ||||||
| Deferred revenue |
(5,978 | ) | 12,807 | (34,223 | ) | |||||||
|
|
|
|
|
|
|
|||||||
| Net cash (used in) provided by operating activities |
(3,823 | ) | (49,164 | ) | 66,684 | |||||||
| Investing activities: |
||||||||||||
| Sales/maturities of short-term investments |
— | 3,000 | 7,850 | |||||||||
| Purchases of short-term investments |
— | — | (5,481 | ) | ||||||||
| Decrease (increase) in restricted cash |
137 | 1,236 | (2,470 | ) | ||||||||
| Purchases of property and equipment |
(4,916 | ) | (3,736 | ) | (7,581 | ) | ||||||
|
|
|
|
|
|
|
|||||||
| Net cash provided by (used in) investing activities |
(4,779 | ) | 500 | (7,682 | ) | |||||||
| Financing activities: |
||||||||||||
| Proceeds from issuance of common stock through employee stock purchase plan |
372 | 497 | 510 | |||||||||
| Proceeds from exercise of options |
1,090 | 436 | 264 | |||||||||
| Stock option repurchase |
— | — | (669 | ) | ||||||||
| Repayment of convertible notes |
— | — | (27,314 | ) | ||||||||
|
|
|
|
|
|
|
|||||||
| Net cash provided by (used in) financing activities |
1,462 | 933 | (27,209 | ) | ||||||||
| Effect of foreign exchange rate changes on cash and cash equivalents |
170 | 94 | 852 | |||||||||
|
|
|
|
|
|
|
|||||||
| Net (decrease) increase in cash and cash equivalents |
(6,970 | ) | (47,637 | ) | 32,645 | |||||||
| Cash and cash equivalents: |
||||||||||||
| Beginning of period |
57,381 | 105,018 | 72,373 | |||||||||
|
|
|
|
|
|
|
|||||||
| End of period |
$ | 50,411 | $ | 57,381 | $ | 105,018 | ||||||
|
|
|
|
|
|
|
|||||||
| Supplemental disclosure of cash flow information: |
||||||||||||
| Cash paid for interest |
$ | 98 | $ | 3 | $ | 469 | ||||||
| Cash paid for income taxes |
1,495 | 1,530 | 1,262 | |||||||||
| Non-cash investing and financing activities: |
||||||||||||
| Inventory transfers to fixed assets and service inventory |
$ | 2,310 | $ | 4,183 | $ | 1,876 | ||||||
| Value of shares issued for 401(k) match |
— | 1,978 | 1,780 | |||||||||
See accompanying notes
F-4
Table of Contents
NOTES TO CONSOLIDATED FINANCIAL STATEMENTS
NOTE 1 DESCRIPTION OF BUSINESS
Cray Inc., or Cray, or the Company designs, develops, manufactures, markets and services high performance computer, or HPC, systems, commonly known as supercomputers, and provides storage solutions and engineering services related to HPC systems. Cray’s supercomputer systems provide capability and sustained performance far beyond typical server-based computer systems and address challenging scientific, engineering, commercial and national security computing problems. The Company’s customers include government agencies, academic institutions and commercial entities.
NOTE 2 SUMMARY OF SIGNIFICANT ACCOUNTING POLICIES
Accounting Principles
The consolidated financial statements and accompanying notes are prepared in accordance with accounting principles generally accepted in the United States of America, or GAAP.
Principles of Consolidation
The consolidated financial statements include the accounts of the Company and its wholly-owned subsidiaries. Intercompany balances and transactions have been eliminated.
Reclassifications
Certain prior year amounts have been reclassified to conform with the current year presentation. There has been no impact on previously reported net income (loss) or shareholders’ equity from such reclassifications.
Use of Estimates
The preparation of financial statements in accordance with GAAP requires management to make estimates and assumptions that affect the amounts reported in the Company’s consolidated financial statements and accompanying notes. Actual results could differ materially from those estimates.
Cash, Cash Equivalents and Restricted Cash
Cash and cash equivalents consist of highly liquid financial instruments that are readily convertible to cash and have original maturities of three months or less at the time of acquisition. The Company maintains cash and cash equivalent balances with financial institutions that exceed federally insured limits. As of December 31, 2011, the Company had restricted cash of $3.8 million, of which $3.5 million related to the Company’s line of credit with Wells Fargo and $0.3 million resulted from a performance bond on a sales contract. As of December 31, 2010, the Company had restricted cash of $3.9 million, of which $3.5 million related to the Company’s line of credit with Wells Fargo and $0.4 million resulted from a performance bond on a sales contract.
Short-term investments
Investments generally mature between three months and one year from the purchase date. All short-term investments are classified as available-for-sale and are recorded at fair value, based on quoted market prices; as such, unrealized gains and losses are recorded in “Accumulated other comprehensive income,” unless losses are considered other than temporary, in which case, losses would be included in results of operations. The Company had no assets classified as short-term investments as of December 31, 2011 or 2010.
F-5
Table of Contents
CRAY INC. AND SUBSIDIARIES
NOTES TO CONSOLIDATED FINANCIAL STATEMENTS — (Continued)
Foreign Currency Derivatives
The Company uses forward foreign currency exchange contracts to hedge certain foreign currency exposures. Forward contracts are cash flow hedges of the Company’s foreign currency exposures on certain revenue contracts and are recorded at the contract’s fair value. Any gains or losses on the effective portion of the forward contract is initially reported in “Accumulated other comprehensive income,” a component of shareholders’ equity, with a corresponding asset or liability recorded based on the fair value of the forward contract. When the hedged transaction is settled, any unrecognized gains or losses on the hedged transaction are reclassified into results of operations in the same period. Any hedge ineffectiveness is recorded to operations in the current period. The Company measures hedge effectiveness by comparing changes in fair values of the forward contract and expected cash flows based on changes in the spot prices of the underlying currencies. Cash flows from forward contracts accounted for as cash flow hedges are classified in the same category as the cash flows from the items being hedged. The Company does not use derivative financial instruments for speculative purposes.
Concentration of Credit Risk
Financial instruments that potentially subject the Company to significant concentrations of credit risk consist primarily of cash and cash equivalents, accounts receivable and forward foreign currency exchange contracts.
The Company maintains cash and cash equivalents and forward contracts with various financial institutions. As part of its risk management process, the Company performs periodic evaluations of the relative credit standing of the financial institutions. The Company has not sustained any credit losses from instruments held at financial institutions. The Company utilizes forward contracts to protect against the effects of foreign currency fluctuations. Such contracts involve the risk of non-performance by the counterparty, which could result in a material loss.
The Company currently derives a significant portion of its revenue from sales of products and services to different agencies of the U.S. government or commercial customers primarily serving various agencies of the U.S. government. See Note 14 — Segment Information for additional information. Given the type of customers, the Company does not believe its accounts receivable represent significant credit risk.
Other Concentration
The Company obtains certain components from single source suppliers due to technology, availability, price, quality or other considerations. The loss of a single source supplier, the single source supplier’s inability to deliver the required components or intellectual property due to natural disaster or other reasons, the deterioration of the relationship with a single source supplier, or any unilateral modification of contract terms under which the Company is supplied components by a single source supplier could have a significant adverse effect on the Company’s revenue and gross margins.
Accounts Receivable
Accounts receivable are stated at principal amounts and are primarily comprised of amounts contractually due from customers for products and services and amounts due from government reimbursed research and development contracts. The Company provides an allowance for doubtful accounts based on an evaluation of customer past due account balances. In determining whether to record an allowance for a specific customer, the Company considers a number of factors, including prior payment history and financial information for the customer.
F-6
Table of Contents
CRAY INC. AND SUBSIDIARIES
NOTES TO CONSOLIDATED FINANCIAL STATEMENTS — (Continued)
Fair Values of Financial Instruments
The Company measures certain financial assets and liabilities at fair value based on the exchange price that would be received for an asset or paid to transfer a liability (an exit price) in the principal or most advantageous market for the asset or liability in an orderly transaction between market participants. The Company’s financial instruments primarily consist of time deposits, money market funds, and foreign currency derivatives. See Note 3 for a further discussion on fair value of financial instruments.
Inventories
Inventories are valued at the lower of cost or market, with cost computed on a first-in, first-out basis. The Company regularly evaluates the technological usefulness and anticipated future demand for various inventory components and the expected use of the inventory. When it is determined that these components do not function as intended, or quantities on hand are in excess of estimated requirements, the costs associated with these components are charged to expense.
In connection with certain of its sales agreements, the Company may receive used equipment from a customer. This inventory generally will be recorded at no value based on the expectation that the Company will not be able to resell or otherwise use the equipment. In the event that the Company has a specific contractual plan for resale at the date the inventory is acquired, the inventory is recorded at its estimated fair value.
Property and Equipment, net
Property and equipment are recorded at cost less accumulated depreciation and amortization. Additions and improvements are capitalized and maintenance and repairs are expensed as incurred. Depreciation is calculated on a straight-line basis over the estimated useful lives of the related assets, ranging from 18 months to seven years for furniture and fixtures, three years for computer equipment, and eight years to 25 years for buildings and land improvements. Leasehold improvements are depreciated over the life of the lease or asset, whichever is shorter.
The Company capitalizes certain internal and external costs incurred to acquire or create internal use software, principally related to software coding, design system interfaces and installation and testing of the software. The Company amortizes internal use software costs using the straight-line method over the estimated useful lives of the software, generally from three to five years.
Service Inventory
Service inventory is valued at the lower of cost or market and represents inventory used to support service and maintenance agreements with customers. As inventory is utilized, replaced items are returned to us and are either repaired or scrapped. Costs incurred to repair inventory to a usable state are charged to expense as incurred. Service inventory is recorded at cost and is amortized over the estimated service life of the related product platform (generally four years).
Impairment of Long-Lived Assets
The Company evaluates property, plant and equipment and purchased intangible assets with finite lives for impairment whenever events or changes in circumstances indicate the carrying value of an asset may not be recoverable. The Company assesses the recoverability of the assets based on the undiscounted future cash flow the assets are expected to generate and recognizes an impairment loss when estimated undiscounted future cash flow expected to result from the use of the asset plus net proceeds expected from disposition of the asset, if any, are less than the carrying value of the asset. When the Company identifies an impairment, the carrying value of the asset is reduced to its estimated fair value based on a discounted cash flow approach or, when available and appropriate, to comparable market values.
F-7
Table of Contents
CRAY INC. AND SUBSIDIARIES
NOTES TO CONSOLIDATED FINANCIAL STATEMENTS — (Continued)
Revenue Recognition
The Company recognizes revenue when it is realized or realizable and earned. The Company considers revenue realized or realizable and earned when it has persuasive evidence of an arrangement, delivery has occurred, the sales price is fixed or determinable, and collectibility is reasonably assured. Delivery does not occur until the products have been shipped or services provided to the customer, risk of loss has transferred to the customer, and, where applicable, a customer acceptance has been obtained. The sales price is not considered to be fixed or determinable until all material contingencies related to the sales have been resolved. The Company records revenue in the Consolidated Statements of Operations net of any sales, use, value added or certain excise taxes imposed by governmental authorities on specific sales transactions. In addition to the aforementioned general policy, the following are the Company’s statements of policy with regard to multiple-element arrangements and specific revenue recognition policies for each major category of revenue.
Multiple-Element Arrangements. The Company commonly enters into revenue arrangements that include multiple deliverables of its product and service offerings due to the needs of its customers. Product may be delivered in phases over time periods which can be as long as five years. Maintenance services generally begin upon acceptance of the first equipment delivery and future deliveries of equipment generally have an associated maintenance period. The Company considers the maintenance period to commence upon acceptance of the product or installation in situations where a formal acceptance is not required, which may include a warranty period and accordingly allocates a portion of the arrangement consideration as a separate deliverable which is recognized as service revenue over the entire service period. Other services such as training and engineering services can be delivered as a discrete delivery or over the term of the contract. A multiple-element arrangement is separated into more than one unit of accounting if the following criteria are met:
| • | The delivered item(s) has value to the customer on a standalone basis; and |
| • | If the arrangement includes a general right of return relative to the delivered item(s), delivery or performance of the undelivered item(s) is considered probable and substantially in the control of the Company. |
If these criteria are not met, the arrangement is accounted for as one unit of accounting which would result in revenue being recognized ratably over the contract term or being deferred until the earlier of when such criteria are met or when the last undelivered element is delivered. If these criteria are met for each element, the arrangement consideration is allocated to the separate units of accounting based on each unit’s relative estimated selling price.
The Company follows a selling price hierarchy in determining the best estimate of the selling price of each deliverable. Certain products and services are sold separately in standalone arrangements for which the Company is sometimes able to determine vendor specific objective evidence, or VSOE. The Company determines VSOE based on normal pricing and discounting practices for the product or service when sold separately.
When the Company is not able to establish VSOE for all deliverables in an arrangement with multiple elements, the Company attempts to establish the selling price of each remaining element based on third-party evidence, or TPE. The Company’s inability to establish VSOE is often due to a relatively small sample of customer contracts that differ in system size and contract terms which can be due to infrequently selling each element separately, not pricing products within a narrow range, or only having a limited sales history, such as in the case of certain advanced and emerging technologies. TPE is determined based on the Company’s prices or competitor prices for similar deliverables when sold separately. However, the Company is often unable to determine TPE, as the Company’s offerings contain a significant level of customization and differentiation from those of competitors and the Company is often unable to reliably determine what similar competitor products’ selling prices are on a standalone basis.
F-8
Table of Contents
CRAY INC. AND SUBSIDIARIES
NOTES TO CONSOLIDATED FINANCIAL STATEMENTS — (Continued)
When the Company is unable to establish selling price using VSOE or TPE, the Company uses estimated selling price, or ESP, in its allocation of arrangement consideration. The objective of ESP is to determine the price at which the Company would transact a sale if the product or service were sold on a standalone basis. In determining ESP, the Company uses either the list price of the deliverable less a discount or the cost to provide the product or service plus a margin. When using list price less a discount, the Company uses discounts from list price for previous transactions. This approach incorporates several factors, including the size of the transaction and any changes to list prices. The data is collected from prior sales, and although the data may not have the sample size or consistency to establish VSOE, it is sufficiently objective to estimate the selling price. When using cost plus a margin, the Company considers the total cost of the product or service, including customer-specific and geographic factors. The Company also considers the historical margins of the product or service on previous contracts and several factors including any changes to pricing methodologies, competitiveness of products and services and cost drivers that would cause future margins to differ from historical margins.
Products. The Company most often recognizes revenue from sales of products upon customer acceptance of the system. Where formal acceptance is not required, the Company recognizes revenue upon delivery or installation. When the product is part of a multiple element arrangement, the Company allocates a portion of the arrangement consideration to product revenue based on estimates of selling price.
Services. Maintenance services are provided under separate maintenance contracts with customers. These contracts generally provide for maintenance services for one year, although some are for multi-year periods, often with prepayments for the term of the contract. The Company considers the maintenance period to commence upon acceptance of the product or installation in situations where a formal acceptance is not required, which may include a warranty period. When service is part of a multiple element arrangement, the Company allocates a portion of the arrangement consideration to maintenance service revenue based on estimates of selling price. Maintenance contracts that are billed in advance of revenue recognition are recorded as deferred revenue. Maintenance revenue is recognized ratably over the term of the maintenance contract.
Revenue from engineering services is recognized as services are performed.
Project Revenue. Revenue from design and build contracts is recognized under the percentage-of-completion, or POC method. Under the POC method, revenue is recognized based on the costs incurred to date as a percentage of the total estimated costs to fulfill the contract. If circumstances arise that change the original estimates of revenues, costs, or extent of progress toward completion, revisions to the estimates are made. These revisions may result in increases or decreases in estimated revenues or costs, and such revisions are recorded in income in the period in which the circumstances that gave rise to the revision become known by management. The Company performs ongoing profitability analyses of its contracts accounted for under the POC method in order to determine whether the latest estimates of revenue, costs and extent of progress require updating. If at any time these estimates indicate that the contract will be unprofitable, the entire estimated loss for the remainder of the contract is recorded immediately.
The Company records revenue from certain research and development contracts which include milestones using the milestone method if the milestones are determined to be substantive. A milestone is considered to be substantive if management believes there is substantive uncertainty that it will be achieved and the milestone consideration meets all of the following criteria:
| • | It is commensurate with either of the following: |
| • | The Company’s performance to achieve the milestone; or |
| • | The enhancement of value of the delivered item or items as a result of a specific outcome resulting from the Company’s performance to achieve the milestone. |
| • | It relates solely to past performance. |
| • | It is reasonable relative to all of the deliverables and payment terms (including other potential milestone consideration) within the arrangement. |
F-9
Table of Contents
CRAY INC. AND SUBSIDIARIES
NOTES TO CONSOLIDATED FINANCIAL STATEMENTS — (Continued)
The individual milestones are determined to be substantive or nonsubstantive in their entirety and milestone consideration is not bifurcated.
Revenue from projects is classified as Product Revenue or Service Revenue, based on the nature of the work performed.
Nonmonetary Transactions. The Company values and records nonmonetary transactions at the fair value of the asset surrendered unless the fair value of the asset received is more clearly evident, in which case the fair value of the asset received is used.
Foreign Currency Translation
The Company uses the U.S. dollar predominantly as its functional currency. Assets and liabilities of foreign subsidiaries that have a functional currency denominated in non-U.S. dollars are translated into U.S. dollars at year-end exchange rates, and revenue and expenses of these foreign subsidiaries are translated at average rates prevailing during the year. Translation adjustments are included in “Accumulated other comprehensive income,” a separate component of shareholders’ equity. Transaction gains and losses arising from transactions denominated in a currency other than the functional currency of the entity involved are included in “Other expense, net” in the accompanying Consolidated Statements of Operations. Net transaction gains (losses) were $(1.3) million, ($1.0) million, and $0.3 million for 2011, 2010, and 2009, respectively.
Research and Development
Research and development expenses include costs incurred in the development and production of the Company’s hardware and software, costs incurred to enhance and support existing product features, costs incurred to support and improve the Company’s development processes, and costs related to future product development. Research and development costs are expensed as incurred, and may be offset by co-funding from third parties. The Company may also enter into arrangements whereby the Company makes advance, non-refundable payments to a vendor to perform certain research and development services. These payments are deferred and recognized over the vendor’s estimated performance period. During the third quarter of 2009, the Company amended a vendor agreement to settle outstanding performance issues. The Company had made advance payments of $16.2 million to the vendor. Due to the amendment, the Company received a refund of $10.0 million of amounts previously paid to the vendor and the right to receive rebates on future purchases. The Company estimated the fair value of this rebate right to be $6.2 million. The Company believes the rebate right is recoverable and it has been classified in “Other non-current assets” in the Consolidated Balance Sheets. No gain or loss was recorded as a result of this amendment. The Company anticipates the rebates will begin to be realized in 2013.
Amounts to be received under co-funding arrangements with the U.S. government or other customers are based on either contractual milestones or costs incurred. These co-funding milestone payments are recognized in operations as performance is estimated to be completed and are measured as milestone achievements occur or as costs are incurred. These estimates are reviewed on a periodic basis and are subject to change, including in the near term. If an estimate is changed, net research and development expense could be impacted significantly.
The Company does not record a receivable from the U.S. government prior to completing the requirements necessary to bill for a milestone or cost reimbursement. Funding from the U.S. government is subject to certain budget restrictions and milestones may be subject to completion risk, and as such, there may be periods in which research and development costs are expensed as incurred for which no reimbursement is recorded, as milestones have not been completed or the U.S. government has not funded an agreement. Accordingly, there can be substantial variability in the amount of net research and development expenses from quarter to quarter and year to year.
F-10
Table of Contents
CRAY INC. AND SUBSIDIARIES
NOTES TO CONSOLIDATED FINANCIAL STATEMENTS — (Continued)
The Company classifies amounts to be received from funded research and development projects as either revenue or a reduction to research and development expense based on the specific facts and circumstances of the contractual arrangement, considering total costs expected to be incurred compared to total expected funding and the nature of the research and development contractual arrangement. In the event that a particular arrangement is determined to represent revenue, the corresponding research and development costs are classified as cost of revenue.
Income Taxes
Deferred tax assets and liabilities are determined based on differences between financial reporting and tax bases of assets and liabilities and operating loss and tax credit carryforwards and are measured using the enacted tax rates and laws that will be in effect when the differences and carryforwards are expected to be recovered or settled. A valuation allowance for deferred tax assets is provided when we estimate that it is more likely than not that all or a portion of the deferred tax assets may not be realized through future operations. This assessment is based upon consideration of available positive and negative evidence, which includes, among other things, our recent results of operations and expected future profitability. The Company considers its actual historical results over several years to have stronger weight than other more subjective indicators, including forecasts, when considering whether to establish or reduce a valuation allowance on deferred tax assets.
The Company recognizes the income tax benefit from a tax position only if it is more likely than not that the tax position will be sustained on examination by the applicable taxing authorities, based on the technical merits of the Company’s position. The tax benefit recognized in the financial statements from such a position is measured based on the largest benefit that has a greater than fifty percent likelihood of being realized upon ultimate settlement.
Estimated interest and penalties are recorded as a component of interest expense and other expense, respectively.
As of December 31, 2011, the Company had approximately $128.0 million of net deferred tax assets, against which the Company provided a $110.5 million valuation allowance, resulting in a net deferred tax asset of $17.5 million. In 2011, the Company reduced the valuation allowances against deferred tax assets established in prior years. The aggregate reduction of $14.7 million ($.41 per diluted share) in deferred tax asset valuation allowances was attributable to a $13.9 million reduction related to a portion of the Company’s U.S. deferred tax assets and a $0.8 million reduction related to all of the deferred tax assets of the Company’s German subsidiary. The reductions in previously established allowances were based upon an evaluation of all available positive and negative evidence including an assessment of known business risks and industry trends, as well as forecasted domestic and international earnings. The Company continues to provide a partial valuation allowance against its U.S. deferred tax assets and a full valuation allowance against deferred tax assets arising in a limited number of foreign jurisdictions as the realization of such assets is not considered to be more likely than not at this time. In a future period the Company’s assessment of the realizability of its deferred tax assets and therefore the appropriateness of the valuation allowance could change based on an assessment of all available evidence, both positive and negative in that future period. If the Company’s conclusion about the realizability of its deferred tax assets and therefore the appropriateness of the valuation allowance changes in a future period the Company could record a substantial tax provision or benefit in its Consolidated Statement of Operations when that occurs.
Share-Based Compensation
The Company measures compensation cost for share-based payment awards at fair value and recognizes it as compensation expense over the service period for awards expected to vest. Share-based compensation expense is recognized for all share-based payment awards, net of an estimated forfeiture rate. Compensation cost only is only recognized for those shares expected to vest on a straight-line basis over the requisite service period of the award.
F-11
Table of Contents
CRAY INC. AND SUBSIDIARIES
NOTES TO CONSOLIDATED FINANCIAL STATEMENTS — (Continued)
Determining the appropriate fair value model and calculating the fair value of share-based payment awards requires subjective assumptions, including the expected life of the share-based payment awards and stock price volatility. The Company utilizes the Black-Scholes options pricing model to value the stock options granted under its options plans. In this model, the assumptions utilized relate to stock price volatility, stock option term and forfeiture rates that are based upon both historical factors as well as management’s judgment.
The fair value of restricted stock and restricted stock units is determined based on the number of shares or units granted and the quoted price of our common stock at the date of grant.
Shipping and Handling Costs
Costs related to shipping and handling are included in “Cost of product revenue” and “Cost of service revenue” in the accompanying Consolidated Statements of Operations.
Advertising Costs
Sales and marketing expenses in the accompanying Consolidated Statements of Operations include advertising expenses of $0.6 million, $0.8 million, and $0.9 million in 2011, 2010, and 2009, respectively. The Company incurs advertising costs for representation at certain trade shows, promotional events and sales lead generation, as well as design and printing costs for promotional materials. The Company expenses all advertising costs as incurred.
Earnings (Loss) Per Share, or EPS
Basic EPS is computed by dividing net income available to common shareholders by the weighted average number of common shares, excluding unvested restricted stock outstanding during the period. Diluted EPS is computed by dividing net income available to common shareholders by the weighted average number of common and potential common shares outstanding during the period, which includes the additional dilution related to conversion of stock options, unvested restricted stock and restricted stock units and common stock purchase warrants as computed under the treasury stock method and the common shares issuable upon conversion of the outstanding convertible notes. For the years ended December 31, 2011 and 2010, the added shares from these items included in the calculation of diluted shares and EPS totaled approximately 0.9 million and 1.0 million respectively. For the year ended December 31, 2009, outstanding stock options, unvested restricted stock, restricted stock units, warrants, and shares issuable upon conversion of the convertible notes were antidilutive, and, as such, their effect has not been included in the calculation of diluted net loss per share. Potentially dilutive shares of 2.2 million, 1.9 million, and 5.3 million, respectively, have been excluded from the denominator in the computation of diluted EPS for the years ended December 31, 2011, 2010, and 2009, respectively, because they are antidilutive.
Accumulated Other Comprehensive Income
Accumulated other comprehensive income, a component of Shareholders’ equity, consisted of the following at December 31 (in thousands):
| 2011 | 2010 | 2009 | ||||||||||
| Accumulated unrealized net gain on available-for-sale investments |
$ | — | $ | — | $ | 3 | ||||||
| Accumulated unrealized net gain on cash flow hedges |
2,136 | 1,347 | 2,936 | |||||||||
| Accumulated currency translation adjustment |
4,344 | 3,559 | 3,209 | |||||||||
|
|
|
|
|
|
|
|||||||
| Accumulated other comprehensive income |
$ | 6,480 | $ | 4,906 | $ | 6,148 | ||||||
|
|
|
|
|
|
|
|||||||
F-12
Table of Contents
CRAY INC. AND SUBSIDIARIES
NOTES TO CONSOLIDATED FINANCIAL STATEMENTS — (Continued)
Recent Accounting Pronouncements
In June 2011, the Financial Accounting Standards Board issued ASU No. 2011-05, Comprehensive Income, or ASU 2011-05. The guidance in ASU 2011-05 revises the manner in which entities present comprehensive income in their financial statements. An entity is required to report the components of comprehensive income in either one or two consecutive financial statements:
| • | A single, continuous statement must present the components of net income and total net income, the components of other comprehensive income and total other comprehensive income, and a total for comprehensive income. |
| • | In a two-statement approach, an entity must present the components of net income and total net income in the first statement. That statement must be immediately followed by a financial statement that presents the components of other comprehensive income, a total for other comprehensive income, and a total for comprehensive income. |
ASU 2011-05 does not change the items that must be reported in other comprehensive income. The amendments in ASU 2011-05 are effective for fiscal years beginning after December 15, 2011. The Company does not believe the adoption of ASU 2011-05 will have a material impact on the presentation of information in its financial statements.
NOTE 3 FAIR VALUE MEASUREMENTS
Under FASB Accounting Standards Codification Topic 820, Fair Value Measurements and Disclosures, based on the observability of the inputs used in the valuation techniques used to determine the fair value of certain financial assets and liabilities, the Company is required to provide the following information according to the fair value hierarchy. The fair value hierarchy ranks the quality and reliability of the information used to determine fair values.
In general, fair values determined by Level 1 inputs utilize quoted prices (unadjusted) in active markets for identical assets or liabilities. Fair values determined by Level 2 inputs utilize observable inputs other than Level 1 prices, such as quoted prices for similar assets or liabilities, quoted prices in markets that are not active or other inputs that are observable or can be corroborated by observable market data for substantially the full term of the related assets or liabilities. Fair values determined by Level 3 inputs are unobservable data points for the asset or liability, and include situations where there is little, if any, market activity for the asset or liability. The following table presents information about the Company’s financial assets and liabilities that have been measured at fair value as of December 31, 2011 and 2010, and indicates the fair value hierarchy of the valuation inputs utilized to determine such fair value (in thousands):
| Description |
Fair Value at December 31, 2011 |
Quoted Prices in Active Markets (Level 1) |
Significant Other Observable Inputs (Level 2) |
|||||||||
| Assets: |
||||||||||||
| Cash, cash equivalents and restricted cash |
$ | 54,187 | $ | 54,187 | $ | — | ||||||
| Foreign exchange forward contracts(1) |
3,251 | — | 3,251 | |||||||||
|
|
|
|
|
|
|
|||||||
| Assets measured at fair value at December 31, 2011 |
$ | 57,438 | $ | 54,187 | $ | 3,251 | ||||||
|
|
|
|
|
|
|
|||||||
| Liabilities: |
||||||||||||
| Foreign exchange forward contracts(2) |
3 | — | 3 | |||||||||
|
|
|
|
|
|
|
|||||||
| Liabilities measured at fair value at December 31, 2011 |
$ | 3 | $ | — | $ | 3 | ||||||
|
|
|
|
|
|
|
|||||||
F-13
Table of Contents
CRAY INC. AND SUBSIDIARIES
NOTES TO CONSOLIDATED FINANCIAL STATEMENTS — (Continued)
| Description |
Fair Value at December 31, 2010 |
Quoted Prices in Active Markets (Level 1) |
Significant Other Observable Inputs (Level 2) |
|||||||||
| Assets: |
||||||||||||
| Cash, cash equivalents and restricted cash |
$ | 61,295 | $ | 61,295 | $ | — | ||||||
| Foreign exchange forward contracts(3) |
2,044 | — | 2,044 | |||||||||
|
|
|
|
|
|
|
|||||||
| Assets measured at fair value at December 31, 2010 |
$ | 63,339 | $ | 61,295 | $ | 2,044 | ||||||
|
|
|
|
|
|
|
|||||||
| Liabilities: |
||||||||||||
| Foreign exchange forward contracts(2) |
704 | — | 704 | |||||||||
|
|
|
|
|
|
|
|||||||
| Liabilities measured at fair value at December 31, 2010 |
$ | 704 | $ | — | $ | 704 | ||||||
|
|
|
|
|
|
|
|||||||
| (1) | $2.1 million of this amount is included in “Prepaid expenses and other current assets” and $1.1 million is included in “Other non-current assets” at December 31, 2011 on the Company’s Consolidated Balance Sheet. |
| (2) | Included in “Other accrued liabilities” on the Company’s Consolidated Balance Sheets. |
| (3) | Included in “Other non-current assets” at December 31, 2010 on the Company’s Consolidated Balance Sheet. |
The fair values of Level 1 assets are determined through market, observable and corroborated sources. The fair values of Level 2 assets and liabilities do not have observable prices, but have inputs that are based on observable inputs, such as foreign currency exchange rates, either directly or indirectly.
Foreign Currency Derivatives
As of December 31, 2011 and 2010, the Company had outstanding forward contracts which have been designated as cash flow hedges of anticipated future cash receipts on sales contracts payable in foreign currencies. As of December 31, 2011, the outstanding notional amounts were approximately 3.5 million British pound sterling, 33.7 million euro and 20.6 million Norwegian Kroner. As of December 31, 2010, the outstanding notional amounts were approximately 2.0 million British pound sterling, 37.8 million euro and 53.3 million Swedish krona. As of December 31, 2011 and 2010, these contracts hedged foreign currency exposure of approximately $55.8 million and $63.0 million, respectively. The associated cash receipts are expected to be received between 2012 and 2014, during which time the revenue on the associated sales contracts is expected to be recognized. As of December 31, 2011 and 2010, the fair value of outstanding forward contracts totaled a net gain of $3.2 million and $1.3 million, respectively. As of December 31, 2011 and 2010, unrecognized gains of $2.1 million and $1.4 million, respectively, were included in “Accumulated other comprehensive income” on the Company’s Consolidated Balance Sheets. The Company recognized approximately $0.4 million, $3.5 million and $2.0 million in net reclassification adjustments, which increased product revenue, as revenue on the associated sales contracts was recognized for the years ended December 31, 2011, 2010 and 2009, respectively.
F-14
Table of Contents
CRAY INC. AND SUBSIDIARIES
NOTES TO CONSOLIDATED FINANCIAL STATEMENTS — (Continued)
NOTE 4 ACCOUNTS AND OTHER RECEIVABLES, NET
A summary of net accounts and other receivables follows (in thousands):
| December 31, | ||||||||
| 2011 | 2010 | |||||||
| Trade accounts receivable |
$ | 34,927 | $ | 79,891 | ||||
| Unbilled receivables |
7,307 | 1,785 | ||||||
| Advance billings |
24,490 | 22,445 | ||||||
| Other receivables |
5,767 | 2,270 | ||||||
|
|
|
|
|
|||||
| 72,491 | 106,391 | |||||||
| Allowance for doubtful accounts |
(110 | ) | (123 | ) | ||||
|
|
|
|
|
|||||
| Accounts and other receivables, net |
$ | 72,381 | $ | 106,268 | ||||
|
|
|
|
|
|||||
Unbilled receivables represent amounts where the Company has recognized revenue in advance of the contractual billing terms. Advance billings represent billings made based on contractual terms for which no revenue has yet been recognized.
As of December 31, 2011 and 2010, accounts receivable included $32.2 million and $56.4 million, respectively, due from U.S. government agencies and customers primarily serving the U.S. government. Of this amount, $0.7 million and $0.5 million, respectively, were unbilled, based upon contractual billing arrangements with these customers. As of December 31, 2011, one non-U.S. government customer accounted for 30% of total accounts and other receivables. As of December 31, 2010, two non-U.S. government customers accounted for 32% of total accounts and other receivables.
NOTE 5 INVENTORY
A summary of inventory follows (in thousands):
| December 31, | ||||||||
| 2011 | 2010 | |||||||
| Components and subassemblies |
$ | 29,402 | $ | 11,481 | ||||
| Work in process |
19,956 | 5,670 | ||||||
| Finished goods |
48,523 | 32,090 | ||||||
|
|
|
|
|
|||||
| $ | 97,881 | $ | 49,241 | |||||
|
|
|
|
|
|||||
As of December 31, 2011 and 2010, $47.9 million and $31.5 million, respectively, of finished goods inventory was located at customer sites pending acceptance. At December 31, 2011, two customers accounted for $46.4 million of finished goods inventory. At December 31, 2010, two customers accounted for $29.4 million of finished goods inventory.
During 2010 and 2009, the Company wrote-off $0.9 million and $5.4 million, respectively, of inventory primarily related to the Cray XT product lines. There were no inventory write-offs during 2011.
F-15
Table of Contents
CRAY INC. AND SUBSIDIARIES
NOTES TO CONSOLIDATED FINANCIAL STATEMENTS — (Continued)
NOTE 6 PROPERTY AND EQUIPMENT, NET
A summary of property and equipment follows (in thousands):
| December 31, | ||||||||
| 2011 | 2010 | |||||||
| Land |
$ | 131 | $ | 131 | ||||
| Buildings |
11,540 | 11,060 | ||||||
| Furniture and equipment |
12,277 | 10,432 | ||||||
| Computer equipment |
69,794 | 68,801 | ||||||
| Leasehold improvements |
361 | 367 | ||||||
|
|
|
|
|
|||||
| 94,103 | 90,791 | |||||||
| Accumulated depreciation and amortization |
(77,641 | ) | (72,838 | ) | ||||
|
|
|
|
|
|||||
| Property and equipment, net |
$ | 16,462 | $ | 17,953 | ||||
|
|
|
|
|
|||||
Depreciation expense on property and equipment for 2011, 2010 and 2009 was $7.6 million, $8.1 million and $7.1 million, respectively.
NOTE 7 SERVICE INVENTORY, NET
A summary of service inventory follows (in thousands):
| December 31, | ||||||||
| 2011 | 2010 | |||||||
| Service inventory |
$ | 14,692 | $ | 27,663 | ||||
| Accumulated depreciation |
(13,081 | ) | (25,776 | ) | ||||
|
|
|
|
|
|||||
| Service inventory, net |
$ | 1,611 | $ | 1,887 | ||||
|
|
|
|
|
|||||
NOTE 8 DEFERRED REVENUE
Deferred revenue consisted of the following (in thousands):
| December 31, | ||||||||
| 2011 | 2010 | |||||||
| Deferred product revenue |
$ | 22,068 | $ | 19,959 | ||||
| Deferred service revenue |
36,752 | 44,891 | ||||||
|
|
|
|
|
|||||
| Total deferred revenue |
58,820 | 64,850 | ||||||
| Less long-term deferred revenue |
(14,184 | ) | (14,954 | ) | ||||
|
|
|
|
|
|||||
| Deferred revenue in current liabilities |
$ | 44,636 | $ | 49,896 | ||||
|
|
|
|
|
|||||
At December 31, 2011, three customers accounted for 50% of total deferred revenue. At December 31, 2010, one customer accounted for 28% of total deferred revenue.
NOTE 9 COMMITMENTS AND CONTINGENCIES
The Company has recorded rent expense under leases for buildings or office space, which are accounted for as operating leases, in 2011, 2010 and 2009 of $4.9 million, $4.7 million, and $4.4 million, respectively.
F-16
Table of Contents
CRAY INC. AND SUBSIDIARIES
NOTES TO CONSOLIDATED FINANCIAL STATEMENTS — (Continued)
Minimum contractual commitments as of December 31, 2011, were as follows (in thousands):
| Operating Leases |
Development Agreements |
|||||||
| 2012 |
$ | 4,375 | $ | 4,533 | ||||
| 2013 |
4,216 | 323 | ||||||
| 2014 |
3,833 | — | ||||||
| 2015 |
3,693 | — | ||||||
| 2016 |
3,741 | — | ||||||
| Thereafter |
6,651 | — | ||||||
|
|
|
|
|
|||||
| Minimum contractual commitments |
$ | 26,509 | $ | 4,856 | ||||
|
|
|
|
|
|||||
In its normal course of operations, the Company engages in development arrangements under which it hires outside engineering resources to augment its existing internal staff in order to complete research and development projects, or parts thereof. For the years ended December 31, 2011, 2010 and 2009, the Company incurred $4.7 million, $8.2 million, and $17.8 million for such arrangements, respectively.
Litigation
From time to time, the Company is subject to various legal proceedings that arise in the ordinary course of business; none of which are currently material to the Company’s business.
NOTE 10 INCOME TAXES
Income taxes are recognized for the amount of taxes payable for the current year and for the impact of deferred tax assets and liabilities, which represent consequences of events that have been recognized differently in the financial statements under GAAP than for tax purposes.
Most of the Company’s deferred tax assets result from net operating loss carryforwards. As of December 31, 2011, the Company had U.S. federal net operating loss carryforwards of approximately $215.9 million, of which approximately $21 million was related to stock-based income tax deductions in excess of amounts that have been recognized for financial reporting purposes. Any reduction in the deferred tax asset valuation allowance for stock-based income tax deductions in excess of amounts that have been recognized for financial reporting purposes will be directly credited to shareholders’ equity. As of December 31, 2011, the Company had gross federal research and development tax credit carryforwards of approximately $14.0 million. The federal net operating loss carryforwards will expire from 2019 through 2031, and the research and development tax credits will expire from 2021 through 2031 if not utilized. Utilization of the Company’s federal net operating loss and research and development tax credit carryforwards generated prior to May 10, 2001 are limited under Section 382 of the Internal Revenue Code. As of December 31, 2011, the Company had approximately $16.8 million of foreign net operating loss carryforwards in various jurisdictions. Most of the Company’s foreign net operating losses can be carried forward indefinitely, with certain amounts expiring from 2016 to 2030.
Income (loss) before income taxes consisted of the following (in thousands):
| Year Ended December 31, | ||||||||||||
| 2011 | 2010 | 2009 | ||||||||||
| United States |
$ | (2,847 | ) | $ | 16,319 | $ | (3,233 | ) | ||||
| International |
2,982 | 621 | 1,755 | |||||||||
|
|
|
|
|
|
|
|||||||
| Total |
$ | 135 | $ | 16,940 | $ | (1,478 | ) | |||||
|
|
|
|
|
|
|
|||||||
F-17
Table of Contents
CRAY INC. AND SUBSIDIARIES
NOTES TO CONSOLIDATED FINANCIAL STATEMENTS — (Continued)
The tax provision (benefit) for income taxes related to operations consisted of the following (in thousands):
| Year Ended December 31, | ||||||||||||
| 2011 | 2010 | 2009 | ||||||||||
| Current provision (benefit): |
||||||||||||
| Federal |
$ | (106 | ) | $ | 636 | $ | (783 | ) | ||||
| State |
37 | 258 | 6 | |||||||||
| Foreign |
271 | 1,235 | 1,314 | |||||||||
|
|
|
|
|
|
|
|||||||
| Total current provision |
202 | 2,129 | 537 | |||||||||
| Deferred benefit: |
||||||||||||
| Federal |
(12,935 | ) | — | — | ||||||||
| State |
(936 | ) | — | — | ||||||||
| Foreign |
(525 | ) | (251 | ) | (1,411 | ) | ||||||
|
|
|
|
|
|
|
|||||||
| Total deferred benefit |
(14,396 | ) | (251 | ) | (1,411 | ) | ||||||
|
|
|
|
|
|
|
|||||||
| Total provision (benefit) for income taxes |
$ | (14,194 | ) | $ | 1,878 | $ | (874 | ) | ||||
|
|
|
|
|
|
|
|||||||
The tax provision (benefit) differs from the amount computed by applying the federal statutory income tax rate as follows (in thousands):
| Year Ended December 31, | ||||||||||||
| 2011 | 2010 | 2009 | ||||||||||
| Income tax provision (benefit) at statutory rate |
$ | 47 | $ | 5,929 | $ | (517 | ) | |||||
| State taxes, net of federal benefit |
(972 | ) | 237 | (78 | ) | |||||||
| Foreign income taxes |
(406 | ) | 1,948 | 152 | ||||||||
| Deemed dividends for U.S. income tax purposes |
338 | 152 | 677 | |||||||||
| Meals and entertainment expense |
86 | 102 | 103 | |||||||||
| Nondeductible expenses |
156 | 66 | 33 | |||||||||
| Nondeductible goodwill |
— | — | 16 | |||||||||
| Disallowed compensation |
0 | 169 | — | |||||||||
| Research and development tax credit |
(1,524 | ) | (1,389 | ) | (2,199 | ) | ||||||
| Effect of change in valuation allowance on deferred tax assets |
(11,919 | ) | (5,336 | ) | 939 | |||||||
|
|
|
|
|
|
|
|||||||
| Effective income tax provision (benefit) |
$ | (14,194 | ) | $ | 1,878 | $ | (874 | ) | ||||
|
|
|
|
|
|
|
|||||||
F-18
Table of Contents
CRAY INC. AND SUBSIDIARIES
NOTES TO CONSOLIDATED FINANCIAL STATEMENTS — (Continued)
Significant components of the Company’s deferred income tax assets and liabilities follow (in thousands):
| December 31, | ||||||||
| 2011 | 2010 | |||||||
| Current: |
||||||||
| Deferred Income Tax Assets |
||||||||
| Inventory |
$ | 6,552 | $ | 4,378 | ||||
| Accrued compensation |
2,341 | 1,347 | ||||||
| Deferred revenue |
6,899 | 8,872 | ||||||
| Net operating loss carryforwards |
7,232 | 0 | ||||||
| Other |
937 | 83 | ||||||
|
|
|
|
|
|||||
| Gross current deferred tax assets |
23,961 | 14,680 | ||||||
| Valuation allowance |
(19,773 | ) | (14,680 | ) | ||||
|
|
|
|
|
|||||
| Current deferred tax assets |
4,188 | — | ||||||
|
|
|
|
|
|||||
| Net current deferred tax asset |
$ | 4,188 | $ | — | ||||
|
|
|
|
|
|||||
| Long-Term: |
||||||||
| Deferred Income Tax Assets |
||||||||
| Property and equipment |
$ | 852 | $ | 2,392 | ||||
| Research and experimentation credit carryforwards |
18,285 | 16,371 | ||||||
| Net operating loss carryforwards |
79,431 | 92,261 | ||||||
| Goodwill |
975 | 1,213 | ||||||
| Other |
4,907 | 4,723 | ||||||
|
|
|
|
|
|||||
| Gross long-term deferred tax assets |
104,450 | 116,960 | ||||||
| Valuation allowance |
(90,664 | ) | (113,259 | ) | ||||
|
|
|
|
|
|||||
| Long-term deferred tax assets |
13,786 | 3,701 | ||||||
|
|
|
|
|
|||||
| Deferred Income Tax Liabilities |
||||||||
| Other |
(434 | ) | (596 | ) | ||||
|
|
|
|
|
|||||
| Long-term deferred tax liabilities |
(434 | ) | (596 | ) | ||||
|
|
|
|
|
|||||
| Net long-term deferred tax asset |
$ | 13,352 | $ | 3,105 | ||||
|
|
|
|
|
|||||
The Company’s net current deferred tax asset is included in prepaid expenses and other current assets in the Company’s Consolidated Balance Sheet.
During 2011, the Company recorded an income tax benefit of $14.7 million ($.41 per diluted share) due to a partial reduction, in the amount of $13.9 million, of the valuation allowance held against its U.S. deferred tax assets and the complete reduction, in the amount of $0.8 million, of the valuation allowance held against the deferred tax assets of the Company’s Germany subsidiary.
F-19
Table of Contents
CRAY INC. AND SUBSIDIARIES
NOTES TO CONSOLIDATED FINANCIAL STATEMENTS — (Continued)
The partial reduction of the valuation allowance held against the Company’s U.S. deferred tax assets and the complete reduction of the valuation allowance held against the deferred tax assets of the Company’s German subsidiary was based upon an evaluation of all available positive and negative evidence. The Company considers its actual historical results over several years to have stronger weight than other more subjective indicators, including forecasts, when considering whether to establish or reduce a valuation allowance on deferred tax assets. As of December 31, 2011 the Company has generated cumulative pre-tax income in recent years. In addition to the Company’s cumulative income position, the assessment of the Company’s ability to utilize its deferred tax assets included an assessment of all known business risks and industry trends, as well as forecasted domestic and international earnings over a number of years. The Company’s ability to forecast results significantly into the future is severely limited due to the rapid rate of technological change in the industry in which it operates. Included in the Company’s forecast was the impact of two contracts that were finalized during the fourth quarter of 2011; namely a $188 million contract with the University of Illinois National Center for Supercomputing Applications and a $97 million contract with the Department of Energy’s Oak Ridge National Laboratory. The Company’s conclusion about the realizability of its deferred tax assets, and therefore the appropriateness of the valuation allowance, will be reviewed quarterly and could change in future periods depending on the Company’s future assessment of all available evidence in support of the likelihood of realization of its deferred tax assets.
The valuation allowance on deferred tax assets decreased by $17.5 million and $5.9 million in 2011 and 2010, respectively, and increased by $0.9 million in 2009.
Undistributed earnings relating to certain of the Company’s foreign subsidiaries are considered to be permanently reinvested; accordingly, no provision for U.S. federal and state income taxes has been provided thereon. Upon repatriation of those earnings, in the form of dividends or otherwise, the Company would be subject to both U.S. income taxes (subject to an adjustment for foreign tax credits) and withholding taxes payable to the various foreign countries. Determination of the amount of unrecognized deferred U.S. income tax liability is not practicable due to the complexities associated with this hypothetical calculation. As of December 31, 2011 the Company’s foreign subsidiaries held cash in the amount of $14.3 million.
The following table summarizes changes in the amount of the Company’s unrecognized tax benefits for uncertain tax positions for the three years ended December 31, 2011 (in thousands):
| Balance at December 31, 2008 |
$ | 646 | ||
| Increase related to prior year income tax positions |
35 | |||
| Decrease related to prior year income tax positions |
(50 | ) | ||
| Lapse of state of limitations |
(143 | ) | ||
|
|
|
|||
| Balance at December 31, 2009 |
$ | 488 | ||
| Increase related to prior year income tax positions |
7 | |||
| Settlement |
(265 | ) | ||
| Lapse of statute of limitations |
(210 | ) | ||
|
|
|
|||
| Balance at December 31, 2010 |
$ | 20 | ||
| Lapse of statute of limitations |
(20 | ) | ||
|
|
|
|||
| Balance at December 31, 2011 |
$ | — | ||
|
|
|
F-20
Table of Contents
CRAY INC. AND SUBSIDIARIES
NOTES TO CONSOLIDATED FINANCIAL STATEMENTS — (Continued)
The Company or its subsidiaries file income tax returns in the U.S. federal jurisdiction and various state and foreign jurisdictions. The Company defines its major tax jurisdictions to include Australia, the United Kingdom and the United States. The Company is no longer subject to income tax examinations with respect to Australia for periods before 2006 and for periods before 2010 in the United Kingdom. With respect to the U.S. federal and various state jurisdictions we are no longer subject to income tax examinations with respect to periods before 2008, although in such jurisdictions net operating loss and tax credit carryforwards generated in a year are subject to examination and adjustment for at least three years following the year in which such losses or credits are actually used to offset taxable income.
Estimated interest and penalties are recorded as a component of interest expense and other expense, respectively. Such amounts were not material for 2011, 2010 and 2009.
NOTE 11 LINES OF CREDIT
The Company has a Credit Agreement with Wells Fargo Bank, National Association, or Wells Fargo, with a principal amount of the credit facility of $3.5 million and a maturity date of June 1, 2012. This facility may be used to secure foreign exchange contracts (with a potential exposure of no more than $1.8 million) and to support letters of credit (up to no more than $1.7 million in aggregate). The Company is required to maintain at least $3.5 million of cash, cash equivalents and similar investments to secure the facility and to maintain $3.5 million of additional liquid assets. The Credit Agreement provides support for the Company’s existing letters of credit. The available borrowing base under the Credit Agreement is reduced by the amount of outstanding letters of credit at that date.
In September 2010, the Company entered into a secured line of credit with Silicon Valley Bank in the amount of $25 million. The first $15 million is available at any time and the additional $10 million is available if certain minimum financial ratios are exceeded. In connection with this line of credit, a blanket lien has been granted in substantially all assets. The line of credit with Silicon Valley Bank has a maturity date of September 13, 2012.
As of December 31, 2011 and 2010, the Company had no outstanding borrowings on these lines of credit and was in compliance with all covenants.
NOTE 12 SHAREHOLDERS’ EQUITY
Preferred Stock: The Company has 5,000,000 shares of undesignated preferred stock authorized, and no shares of preferred stock outstanding.
Common Stock: The Company has 75,000,000 authorized shares of common stock with a par value of $0.01 per share.
Restricted Stock and Restricted Stock Units: During 2011, 2010 and 2009, respectively, the Company issued an aggregate of 513,587, 501,157, and 877,170 shares of restricted stock and restricted stock units, respectively, to certain directors, executives and other employees. The grant date fair value of these grants was approximately $3.1 million, $2.8 million, and $3.4 million for 2011, 2010 and 2009, respectively. Stock compensation expense is recorded over the vesting period, which has generally been two years for non-employee directors and four years for officers and employees of the Company. As of December 31, 2011, $4.0 million remains to be expensed over the remaining vesting periods of these grants.
As of December 31, 2011 and 2010, the Company had issued and outstanding 15,000 and 25,000 restricted stock units, respectively. Restricted stock units have similar vesting characteristics as restricted stock but are not outstanding shares and do not have any voting or dividend rights. The Company records stock-based compensation expense over the vesting period. Once a restricted stock unit vests, a share of common stock of the Company will be issued.
F-21
Table of Contents
CRAY INC. AND SUBSIDIARIES
NOTES TO CONSOLIDATED FINANCIAL STATEMENTS — (Continued)
Stock Option Plans: As of December 31, 2011, the Company had five active stock option plans that provide shares available for option grants to employees, directors and others. Options granted to employees under the Company’s option plans generally vest over four years or as otherwise determined by the plan administrator. Options to purchase shares expire no later than ten years after the date of grant.
In determining the fair value of stock options, the Company used the Black-Scholes option pricing model that employed the following key weighted average assumptions:
| 2011 | 2010 | 2009 | ||||||||||
| Risk-free interest rate |
0.7% | 1.8% | 1.6% | |||||||||
| Expected dividend yield |
0% | 0% | 0% | |||||||||
| Volatility |
74% | 74% | 79% | |||||||||
| Expected life |
4.0 years | 4.0 years | 4.0 years | |||||||||
| Weighted average Black-Scholes value of options granted |
$3.34 | $3.04 | $2.41 | |||||||||
The risk-free interest rate is based on the U.S. Treasury yield curve in effect at the time of grant. The Company does not anticipate declaring dividends in the foreseeable future. Volatility is based on historical data. The expected life of an option was based on the assumption that options will be exercised, on average, about two years after vesting occurs. The Company recognizes compensation expense for only the portion of options or stock units that are expected to vest. Therefore, management applies an estimated forfeiture rate that is derived from historical employee termination data and adjusted for expected future employee turnover rates. The estimated forfeiture rates applied for the years ended December 31, 2011, 2010 and 2009 were 5.2%, 7.6%, and 8.0%, respectively. If the actual number of forfeitures differs from those estimated by management, additional adjustments to compensation expense may be required in future periods. The Company’s stock price volatility, option lives and expected forfeiture rates involve management’s best estimates at the time of such determination, all of which impact the fair value of the option calculated under the Black-Scholes methodology and, ultimately, the expense that will be recognized over the life of the option.
A summary of the Company’s stock option activity and related information follows:
| Options | Weighted Average Exercise Price |
Remaining Contractual Term |
||||||||||
| Outstanding at January 1, 2009 |
3,755,894 | $ | 12.30 | |||||||||
| Granted |
1,320,200 | 4.12 | ||||||||||
| Exercised |
(43,535 | ) | 6.07 | |||||||||
| Canceled and forfeited |
(1,916,037 | ) | 16.35 | |||||||||
|
|
|
|||||||||||
| Outstanding at December 31, 2009 |
3,116,522 | 6.43 | ||||||||||
|
|
|
|||||||||||
| Granted |
715,950 | 5.50 | ||||||||||
| Exercised |
(92,280 | ) | 4.73 | |||||||||
| Canceled and forfeited |
(294,482 | ) | 7.32 | |||||||||
|
|
|
|||||||||||
| Outstanding at December 31, 2010 |
3,445,710 | 6.20 | ||||||||||
| Granted |
476,500 | 6.08 | ||||||||||
| Exercised |
(248,271 | ) | 4.39 | |||||||||
| Canceled and forfeited |
(256,019 | ) | 6.65 | |||||||||
|
|
|
|||||||||||
| Outstanding at December 31, 2011 |
3,417,920 | 6.28 | 6.9 years | |||||||||
|
|
|
|||||||||||
| Exercisable at December 31, 2011 |
2,097,443 | 6.84 | 5.9 years | |||||||||
|
|
|
|||||||||||
| Available for grant at December 31, 2011 |
2,476,528 | |||||||||||
|
|
|
|||||||||||
F-22
Table of Contents
CRAY INC. AND SUBSIDIARIES
NOTES TO CONSOLIDATED FINANCIAL STATEMENTS — (Continued)
As of December 31, 2011, there was $3.6 million of aggregate intrinsic value of outstanding stock options, including $2.1 million of aggregate intrinsic value of exercisable stock options. Intrinsic value is the total pretax intrinsic value for all “in-the-money” options (i.e., the difference between the Company’s closing stock price on the last trading day of 2011 and the exercise price, multiplied by the number of shares) that would have been received by the option holders had all option holders exercised their options as of December 31, 2011. This amount changes, based on the fair market value of the Company’s stock. Total intrinsic value of options exercised was $0.5 million, $0.2 million, and $0.1 million for the years ended December 31, 2011, 2010 and 2009, respectively.
A summary of the Company’s unvested restricted stock and restricted stock unit grants and changes during the years ended December 31 was as follows:
| Shares | Weighted Average Grant Date Fair Value |
|||||||
| Outstanding at January 1, 2009 |
623,874 | $ | 7.36 | |||||
| Granted during 2009 |
877,170 | 3.87 | ||||||
| Forfeited during 2009 |
— | — | ||||||
| Vested during 2009 |
(69,159 | ) | 7.36 | |||||
|
|
|
|||||||
| Outstanding at December 31, 2009 |
1,431,885 | 5.22 | ||||||
| Granted during 2010 |
501,157 | 5.54 | ||||||
| Forfeited during 2010 |
(145,125 | ) | 4.54 | |||||
| Vested during 2010 |
(407,426 | ) | 7.40 | |||||
|
|
|
|||||||
| Outstanding at December 31, 2010 |
1,380,491 | 4.77 | ||||||
| Granted during 2011 |
513,587 | 6.04 | ||||||
| Forfeited during 2011 |
(146,677 | ) | 5.29 | |||||
| Vested during 2011 |
(444,987 | ) | 4.03 | |||||
|
|
|
|||||||
| Outstanding at December 31, 2011 |
1,302,414 | 5.47 | ||||||
|
|
|
|||||||
The aggregate fair value of restricted shares vested during 2011, 2010 and 2009 was $2.9 million, $2.2 million, and $0.3 million, respectively.
As of December 31, 2011, the Company had $7.9 million of total unrecognized compensation cost related to unvested stock options and unvested restricted stock grants and restricted stock units, which is expected to be recognized over a weighted average period of 2.2 years.
Outstanding and exercisable options by price range as of December 31, 2011, were as follows:
| Outstanding Options | Exercisable Options | |||||||||||||||||||
| Range of Exercise Prices per Share |
Number Outstanding |
Weighted Average Remaining Life (Years) |
Weighted Average Exercise Price |
Number Exercisable |
Weighted Average Exercise Price |
|||||||||||||||
| $0.00 – $ 4.00 |
943,644 | 7.2 | $ | 3.73 | 596,827 | $ | 3.73 | |||||||||||||
| $4.01 – $ 6.00 |
888,143 | 6.6 | $ | 5.60 | 520,128 | $ | 5.70 | |||||||||||||
| $6.01 – $ 8.00 |
1,254,729 | 7.5 | $ | 6.44 | 694,918 | $ | 6.66 | |||||||||||||
| $8.01 – $50.28 |
331,404 | 4.3 | $ | 14.80 | 285,570 | $ | 15.84 | |||||||||||||
|
|
|
|
|
|||||||||||||||||
| $0.00 – $50.28 |
3,417,920 | 6.9 | $ | 6.28 | 2,097,443 | $ | 6.84 | |||||||||||||
|
|
|
|
|
|||||||||||||||||
F-23
Table of Contents
CRAY INC. AND SUBSIDIARIES
NOTES TO CONSOLIDATED FINANCIAL STATEMENTS — (Continued)
The following table (in thousands) sets forth the share-based compensation cost resulting from stock options and stock grants recorded in the Company’s Consolidated Statements of Operations for the years ended December 31, 2011, 2010 and 2009.
| 2011 | 2010 | 2009 | ||||||||||
| Cost of product revenue |
$ | 177 | $ | 218 | $ | 222 | ||||||
| Cost of service revenue |
369 | 432 | 502 | |||||||||
| Research and development |
784 | 1,628 | 2,022 | |||||||||
| Sales and marketing |
490 | 603 | 880 | |||||||||
| General and administrative |
1,808 | 2,046 | 2,185 | |||||||||
|
|
|
|
|
|
|
|||||||
| Total share-based compensation expense |
$ | 3,628 | $ | 4,927 | $ | 5,811 | ||||||
|
|
|
|
|
|
|
|||||||
In February 2009, the Company commenced a tender offer to purchase up to 2.1 million of eligible vested and unvested employee and director stock options outstanding. The tender offer was for options with a grant price of $8.00 or more, that were granted prior to May 2007. The tender offer was completed on March 20, 2009, and the Company purchased 1.8 million options for $669,000. The amount charged to shareholders’ equity for stock options purchased at or below the estimated fair value of the options on the date of repurchase was $587,000, with the balance of $82,000 charged to compensation expense as amounts paid were in excess of estimated fair value. During the year ended December 31, 2009, the Company recorded $1.4 million of stock-based compensation expense related to previously unrecognized compensation cost of unvested stock options that were purchased.
Employee Stock Purchase Plan (ESPP): Under the Company’s employee stock purchase plan, the maximum number of shares of the Company’s common stock that employees could acquire under the ESPP is 1,750,000 shares. Eligible employees are permitted to acquire shares of the Company’s common stock through payroll deductions not exceeding 15% of base wages. The purchase price per share under the ESPP is 95% of the closing market price on the fourth business day after the end of each offering period. As of December 31, 2011 and 2010, 959,784 and 894,667 shares, respectively, had been issued under the ESPP.
NOTE 13 BENEFIT PLANS
401(k) Plan
For the three years ended December 31, 2011, the Company’s retirement plan covered substantially all U.S. employees and provided for voluntary salary deferral contributions on a pre-tax basis in accordance with Section 401(k) of the Internal Revenue Code of 1986, as amended. The Company matches a portion of employee contributions. The 2011, 2010 and 2009 Company match expense was $1.1 million, $2.1 million and $2.0 million, respectively.
Pension Plan
The Company’s German subsidiary maintains a defined benefit pension plan. At December 31, 2011 and 2010, the Company recorded a liability of $2.3 million which approximates the excess of plan assets over the projected benefit obligation of $0.1 million and the excess of the projected benefit obligation over plan assets of $0.8 million, respectively. Plan assets are invested in insurance policies payable to employees. Net pension expense was not material for any period. Contributions to the plan are not expected to be significant to the financial position of the Company.
F-24
Table of Contents
CRAY INC. AND SUBSIDIARIES
NOTES TO CONSOLIDATED FINANCIAL STATEMENTS — (Continued)
NOTE 14 SEGMENT INFORMATION
The Company has three reportable business segments: Cray Products; Custom Engineering; and Maintenance and Support. The segments represent components of the Company for which separate financial information is available that is utilized on a regular basis by the Chief Executive Officer, who is the Chief Operating Decision Maker, in determining how to allocate the Company’s resources and evaluate performance. The segments are determined based on several factors, including the Company’s internal operating structure, the manner in which the Company’s operations are managed, client base, similar economic characteristics and the availability of separate financial information. The Company is undergoing an organizational change and its reportable segments, as a result, may change in the future.
Cray Products
Cray Products include a suite of highly advanced systems, including the Cray XE6, Cray XE6m, Cray XK6, Cray XK6m, Cray CX1000 and Cray CX1, which are used by single users all the way up through large research centers.
Custom Engineering
Custom Engineering designs, builds and implements custom high-performance computing solutions.
Maintenance and Support
Maintenance and Support provides ongoing maintenance of Cray systems and systems analysts to help customers achieve their mission objectives.
The following table presents revenues and gross margin for the Company’s operating segments for the years ended December 31 (in thousands):
| 2011 | 2010 | 2009 | ||||||||||
| Revenue: |
||||||||||||
| Cray Products |
$ | 140,973 | $ | 201,260 | $ | 196,039 | ||||||
| Custom Engineering |
32,687 | 61,999 | 30,656 | |||||||||
| Maintenance and Support |
62,386 | 56,129 | 57,352 | |||||||||
|
|
|
|
|
|
|
|||||||
| Total revenue |
$ | 236,046 | $ | 319,388 | $ | 284,047 | ||||||
|
|
|
|
|
|
|
|||||||
| Cost of Revenue: |
||||||||||||
| Cray Products |
$ | 91,096 | $ | 128,807 | $ | 128,662 | ||||||
| Custom Engineering |
19,026 | 47,924 | 17,877 | |||||||||
| Maintenance and Support |
31,558 | 32,700 | 31,624 | |||||||||
|
|
|
|
|
|
|
|||||||
| Total cost of revenue |
$ | 141,680 | $ | 209,431 | $ | 178,163 | ||||||
|
|
|
|
|
|
|
|||||||
| Gross Profit: |
||||||||||||
| Cray Products |
$ | 49,877 | $ | 72,453 | $ | 67,377 | ||||||
| Custom Engineering |
13,661 | 14,075 | 12,779 | |||||||||
| Maintenance and Support |
30,828 | 23,429 | 25,728 | |||||||||
|
|
|
|
|
|
|
|||||||
| Total gross profit |
$ | 94,366 | $ | 109,957 | $ | 105,884 | ||||||
|
|
|
|
|
|
|
|||||||
Revenue and cost of revenue is the only discrete financial information the Company prepares for its segments. Other financial results or assets are not separated by segment.
F-25
Table of Contents
CRAY INC. AND SUBSIDIARIES
NOTES TO CONSOLIDATED FINANCIAL STATEMENTS — (Continued)
Operating segments do not sell products to each other, and accordingly, there is no inter-segment revenue to be reported.
Product and service revenue and long-lived assets classified by significant country were as follows (in thousands):
| United States |
All Other Countries |
Total | ||||||||||
| For the year ended December 31, 2011: |
||||||||||||
| Product revenue |
$ | 95,929 | $ | 59,632 | $ | 155,561 | ||||||
|
|
|
|
|
|
|
|||||||
| Service revenue |
$ | 56,660 | $ | 23,825 | $ | 80,485 | ||||||
|
|
|
|
|
|
|
|||||||
| Long-lived assets |
$ | 28,281 | $ | 4,085 | $ | 32,366 | ||||||
|
|
|
|
|
|
|
|||||||
| For the year ended December 31, 2010: |
||||||||||||
| Product revenue |
$ | 153,599 | $ | 85,486 | $ | 239,085 | ||||||
|
|
|
|
|
|
|
|||||||
| Service revenue |
$ | 58,406 | $ | 21,897 | $ | 80,303 | ||||||
|
|
|
|
|
|
|
|||||||
| Long-lived assets |
$ | 30,450 | $ | 4,368 | $ | 34,818 | ||||||
|
|
|
|
|
|
|
|||||||
| For the year ended December 31, 2009: |
||||||||||||
| Product revenue |
$ | 151,733 | $ | 47,381 | $ | 199,114 | ||||||
|
|
|
|
|
|
|
|||||||
| Service revenue |
$ | 64,840 | $ | 20,093 | $ | 84,933 | ||||||
|
|
|
|
|
|
|
|||||||
| Long-lived assets |
$ | 30,934 | $ | 4,155 | $ | 35,089 | ||||||
|
|
|
|
|
|
|
|||||||
Revenue attributed to foreign countries is derived from sales to customers located outside the United States. Revenue derived from U.S. government agencies or commercial customers primarily serving the U.S. government, and therefore under its control, totaled approximately $127.8 million, $197.9 million and $204.7 million in 2011, 2010 and 2009, respectively. In 2011, two customers accounted for an aggregate of approximately 30% of total revenue. In 2010, two customers accounted for an aggregate of approximately 25% of total revenue. In 2009, two customers accounted for an aggregate of approximately 30% of total revenue. In general, concentrations of revenue by customer encompass all segments. In 2011, revenue in Germany accounted for 12% of total revenue. In 2010, revenue in South Korea accounted for 13% of total revenue. In 2009 no foreign country accounted for more than 10% of the Company’s revenue.
NOTE 15 RESEARCH AND DEVELOPMENT
The detail for the Company’s net research and development costs for the years ended December 31 follows (in thousands):
| December 31, | ||||||||||||
| 2011 | 2010 | 2009 | ||||||||||
| Gross research and development expenses |
$ | 76,993 | $ | 82,525 | $ | 91,874 | ||||||
| Less: Amounts included in cost of revenue |
(410 | ) | (79 | ) | (1,789 | ) | ||||||
| Less: Reimbursed research and development (excludes amounts in revenue) |
(27,131 | ) | (38,828 | ) | (27,138 | ) | ||||||
|
|
|
|
|
|
|
|||||||
| Net research and development expenses |
$ | 49,452 | $ | 43,618 | $ | 62,947 | ||||||
|
|
|
|
|
|
|
|||||||
F-26
Table of Contents
CRAY INC. AND SUBSIDIARIES
NOTES TO CONSOLIDATED FINANCIAL STATEMENTS — (Continued)
NOTE 16 INTEREST INCOME (EXPENSE)
The detail of interest income (expense) for the years ended December 31 follows (in thousands):
| 2011 | 2010 | 2009 | ||||||||||
| Interest income |
$ | 229 | $ | 485 | $ | 477 | ||||||
| Interest expense |
(262 | ) | (266 | ) | (1,282 | ) | ||||||
|
|
|
|
|
|
|
|||||||
| Net interest income (expense) |
$ | (33 | ) | $ | 219 | $ | (805 | ) | ||||
|
|
|
|
|
|
|
|||||||
Interest income is earned by the Company on cash and cash equivalent and short-term investment balances.
NOTE 17 QUARTERLY DATA (UNAUDITED)
The following table presents unaudited quarterly financial information for the two years ended December 31, 2011. In the opinion of management, this information contains all adjustments, consisting only of normal recurring adjustments, necessary for a fair presentation thereof.
The operating results are not necessarily indicative of results for any future periods. Quarter-to-quarter comparisons should not be relied upon as indicators of future performance. The Company’s business is driven by a few significant contracts and, as a result, the Company’s operating results are subject to very large quarterly fluctuations.
(In thousands, except per share data)
| 2011 | 2010 | |||||||||||||||||||||||||||||||
| For the Quarter Ended |
3/31 | 6/30 | 9/30 | 12/31 | 3/31 | 6/30 | 9/30 | 12/31 | ||||||||||||||||||||||||
| Revenue |
$ | 39,867 | $ | 67,920 | $ | 36,705 | $ | 91,554 | $ | 28,388 | $ | 28,733 | $ | 42,836 | $ | 219,431 | ||||||||||||||||
| Cost of revenue |
22,667 | 42,166 | 20,421 | 56,426 | 21,754 | 17,415 | 32,096 | 138,166 | ||||||||||||||||||||||||
|
|
|
|
|
|
|
|
|
|
|
|
|
|
|
|
|
|||||||||||||||||
| Gross profit |
17,200 | 25,754 | 16,284 | 35,128 | 6,634 | 11,318 | 10,740 | 81,265 | ||||||||||||||||||||||||
| Research and development, net |
6,456 | 18,464 | 17,949 | 6,583 | 7,694 | 7,044 | 18,563 | 10,317 | ||||||||||||||||||||||||
| Sales and marketing |
6,356 | 6,373 | 6,233 | 7,172 | 6,264 | 6,572 | 6,512 | 11,737 | ||||||||||||||||||||||||
| General and administrative |
4,137 | 3,777 | 3,693 | 4,233 | 4,287 | 4,018 | 4,166 | 5,296 | ||||||||||||||||||||||||
| Restructuring |
1,118 | 58 | 687 | (80 | ) | — | — | — | — | |||||||||||||||||||||||
| Net income (loss) |
(1,485 | ) | (2,958 | ) | (12,232 | ) | 31,004 | (11,597 | ) | (6,638 | ) | (18,776 | ) | 52,073 | ||||||||||||||||||
| Net income (loss) per common share, basic |
$ | (0.04 | ) | $ | (0.08 | ) | $ | (0.35 | ) | $ | 0.88 | $ | (0.34 | ) | $ | (0.19 | ) | $ | (0.55 | ) | $ | 1.50 | ||||||||||
| Net income (loss) per common share, diluted |
$ | (0.04 | ) | $ | (0.08 | ) | $ | (0.35 | ) | $ | 0.85 | $ | (0.34 | ) | $ | (0.19 | ) | $ | (0.55 | ) | $ | 1.46 | ||||||||||
Diluted net income per common share for the fourth quarter of 2011 included approximately 1.1 million equivalent shares for outstanding employee stock options and unvested restricted stock grants. Diluted net income per common share for the fourth quarter of 2010 included approximately 1.1 million equivalent shares for outstanding employee stock options and unvested restricted stock grants. Net income in the fourth quarter of 2011 includes $14.7 million ($.41 per diluted share) attributable to a partial reduction of the valuation allowance held against our U.S. deferred tax assets and a complete reduction of the valuation allowance held against the deferred tax assets of our Germany subsidiary.
F-27
Table of Contents
REPORT OF INDEPENDENT REGISTERED PUBLIC ACCOUNTING FIRM
To the Board of Directors and Shareholders
Cray Inc.
We have audited the accompanying consolidated balance sheets of Cray Inc. and Subsidiaries (“the Company”) as of December 31, 2011 and 2010, and the related consolidated statements of operations, shareholders’ equity and comprehensive income (loss), and cash flows for each of the three years in the period ended December 31, 2011. Our audits also included the financial statement schedule listed in the index at item 15(a)(2). These consolidated financial statements and schedule are the responsibility of the Company’s management. Our responsibility is to express an opinion on these financial statements and schedule based on our audits.
We conducted our audits in accordance with the standards of the Public Company Accounting Oversight Board (United States). Those standards require that we plan and perform the audits to obtain reasonable assurance about whether the financial statements are free of material misstatement. An audit includes examining, on a test basis, evidence supporting the amounts and disclosures in the financial statements. An audit also includes assessing the accounting principles used and significant estimates made by management, as well as evaluating the overall financial statement presentation. We believe that our audits provide a reasonable basis for our opinion.
In our opinion, the consolidated financial statements referred to above present fairly, in all material respects, the consolidated financial position of Cray Inc. and Subsidiaries as of December 31, 2011 and 2010, and the consolidated results of their operations and their cash flows for each of the three years in the period ended December 31, 2011, in conformity with accounting principles generally accepted in the United States of America. Also, in our opinion, the related financial statement schedule, when considered in relation to the basic financial statements taken as a whole, presents fairly in all material respects the information set forth therein.
We have also audited, in accordance with the standards of the Public Company Accounting Oversight Board (United States), the Company’s internal control over financial reporting as of December 31, 2011, based on criteria established in Internal Control — Integrated Framework issued by the Committee of Sponsoring Organizations of the Treadway Commission (COSO), and our report dated February 27, 2012, expressed an unqualified opinion on the Company’s internal control over financial reporting.
/s/ PETERSON SULLIVAN LLP
Seattle, Washington
February 27, 2012
F-28
Table of Contents
Schedule II — Valuation and Qualifying Accounts(1)
December 31, 2011
(In Thousands)
| Description |
Balance at Beginning of Period |
Charge/(Benefit) to Expense |
Deductions | Balance at End of Period |
||||||||||||
| Year ended December 31, 2009: |
||||||||||||||||
| Allowance for doubtful accounts |
$ | 99 | $ | 213 | $ | (140)(2) | $ | 172 | ||||||||
|
|
|
|
|
|
|
|
|
|||||||||
| Year ended December 31, 2010: |
||||||||||||||||
| Allowance for doubtful accounts |
$ | 172 | $ | 89 | $ | (138)(2) | $ | 123 | ||||||||
|
|
|
|
|
|
|
|
|
|||||||||
| Year ended December 31, 2011: |
||||||||||||||||
| Allowance for doubtful accounts |
$ | 123 | $ | (13 | ) | $ | 0(2) | $ | 110 | |||||||
|
|
|
|
|
|
|
|
|
|||||||||
| (1) | The Company does not have any warranty liabilities. |
| (2) | Represents uncollectible accounts written off, net of recoveries. |
F-29