Attached files
| file | filename |
|---|---|
| EX-99.1 - PRESS RELEASE - Mondelez International, Inc. | d304731dex991.htm |
| 8-K - FORM 8-K - Mondelez International, Inc. | d304731d8k.htm |
 Kraft
Foods February 21, 2012
CAGNY Conference
1
Exhibit 99.2 |
 Forward-looking statements
2
This
slide
presentation
contains
a
number
of
forward-looking
statements.
The
words
“believe,”
“expect,”
“anticipate,”
“optimistic,”
“intend,”
“plan,”
“goals,”
“may,”
“aim,”
“will”
and
similar
expressions
are
intended
to
identify
our
forward-looking
statements.
Examples
of
forward-looking
statements
include,
but
are
not
limited
to,
statements
we
make
regarding
our
virtuous
cycle
of
growth;
our
5-10-10
strategy;
Kraft
Foods
Developing
Markets
and
Kraft
Foods
Europe
growth
in
2012;
the
2012
environment;
the
three
priorities
for
the
grocery
and
snacks
businesses’
success;
Power
Brands
and
2012
organic
growth;
product
line
pruning;
factors
that
will
drive
2012
results;
2012
top-line
momentum;
Cadbury
revenue
synergies;
cost
management;
2012
top-tier
growth;
one-time
and
refinancing
costs;
launching
two
investment
grade
companies;
sustainable,
top-tier
performance;
expectations
for
the
North
American
grocery
and
Global
snacks
companies;
next
steps
related
to
the
spin-off;
and
what
shareholders
can
expect
from
2012.
These
forward-looking
statements
involve
risks
and
uncertainties,
many
of
which
are
beyond
our
control,
and
important
factors
that
could
cause
actual
results
to
differ
materially
from
those
in
the
forward-looking
statements
include,
but
are
not
limited
to,
increased
competition,
pricing
actions,
continued
volatility
in
commodity
costs,
increased
costs
of
sales,
our
indebtedness
and
our
ability
to
pay
our
indebtedness,
risks
from
operating
globally,
our
failure
to
successfully
execute
in
developing
markets,
our
failure
to
recognize
the
synergies
from
our
combination
with
Cadbury;
our
failure
to
launch
two
successful
independent
companies;
and
tax
law
changes.
For
additional
information
on
these
and
other
factors
that
could
affect
our
forward-looking
statements,
see
our
risk
factors,
as
they
may
be
amended
from
time
to
time,
set
forth
in
our
filings
with
the
SEC,
including
our
most
recently
filed
Annual
Report
on
Form
10-K
and
subsequent
reports
on
Forms
10-Q
and
8-K.
We
disclaim
and
do
not
undertake
any
obligation
to
update
or
revise
any
forward-looking
statement
in
this
slide
presentation,
except
as required
by applicable law or regulation. |
 Agenda
•
Driving sustainable, top-tier growth
•
Building on success in North America
•
2012 guidance
•
The path to separation
3 |
 4
Irene Rosenfeld
Chairman and CEO |
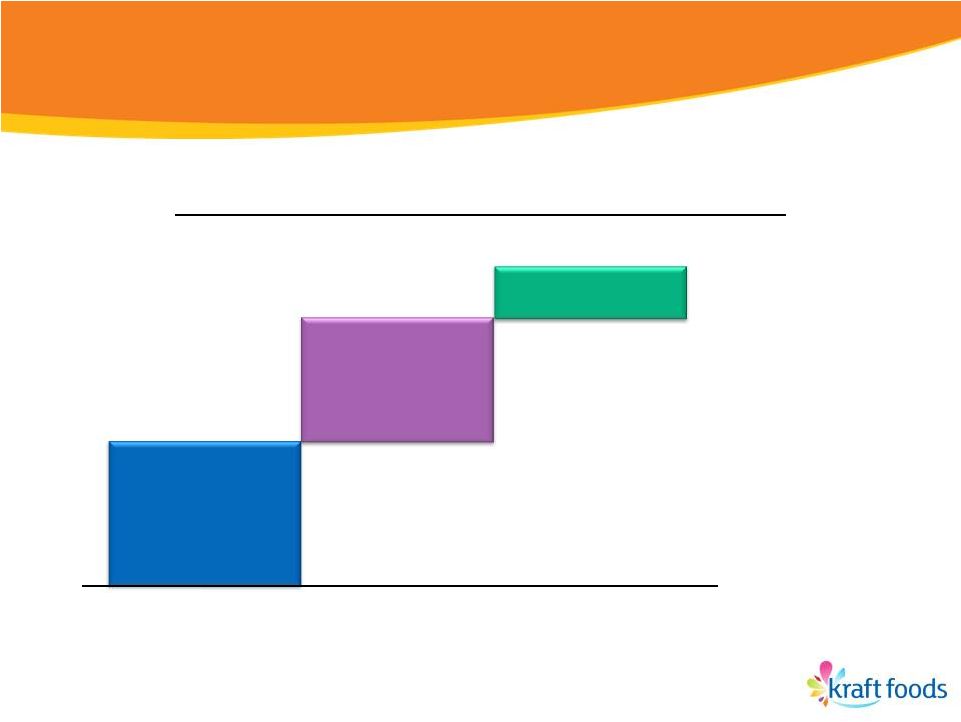
 Virtuous cycle
of growth is paying off 5
Focus on Power
Brands
+8% in 2011
Drive Top-Tier Growth
Organic Net Revenue
+6.6%
(1)
(1)
Reported Net Revenue growth was 10.5%. See GAAP to Non-GAAP reconciliation at the
end of this presentation. |
 Strong growth
in global snacks portfolio •
Global Biscuits +9%
–
Developing Markets up double-digits
–
Developed Markets up mid-single digits
•
Global Chocolate +6%
–
Developing Markets up double digits
–
Developed Markets up slightly
•
Global Gum & Candy +1%
–
Developing Markets up high-single digits
–
Developed Markets down mid-single digits
6
(1) Reflects FY 2011 Organic Net Revenue Growth. Reported FY 2011 Net Revenue
growth was 11.5% for Biscuits, 16.1% for Chocolate and 11.8% for Gum & Candy.
Global Biscuits includes snack nuts. See GAAP to Non-GAAP reconciliation at
the end of this presentation. (1)
(1)
(1) |
 Delivering
top-tier organic growth 7
Organic
Revenue
Growth
(Fiscal
Year)
*
2009
2010
2011
(1)
(2)
(2)
(2)
(2)
(4)
(2)
(2)
(2)
(2)
(2)
(3)
(2)
1
General Mills
8.5%
1
Danone
6.9%
1
Danone
7.8%
2
ConAgra
7.7%
2
Hershey
6.1%
2
Nestlé
7.5%
3
Heinz
5.5%
3
Coca-Cola
6.0%
3
Hershey
6.9%
4
Nestlé
4.1%
4
Nestlé
6.0%
4
Kraft Foods
6.6%
5
Coca-Cola
4.0%
5
General Mills
4.0%
5
PepsiCo
5.0%
6
Hershey
4.0%
6
PepsiCo
3.5%
6
Sara Lee
4.9%
7
PepsiCo
4.0%
7
Kraft Foods
3.1/3.2%
7
Kellogg
4.5%
8
Danone
3.2%
8
Heinz
2.1%
8
Coca-Cola
4.0%
9
Campbell
3.0%
9
ConAgra
(0.8)%
9
General Mills
2.0%
10
Kellogg
3.0%
10
Kellogg
(1.3)%
10
Heinz
1.9%
11
Sara Lee
2.7%
11
Campbell
(2.0)%
11
ConAgra
1.1%
12
Kraft Foods
1.5%
12
Sara Lee
(2.8)%
12
Campbell
(1.0)%
* Source: Thomson First Call.
(1)
Reported Net Revenue growth was 27.0%; Combined Organic Net Revenue Growth was 3.1%; Kraft
Foods Base Organic Net Revenue growth was 3.2%. See GAAP to Non-GAAP
reconciliation at the end of this presentation.
(2)
Per company reports.
(3)
Reported net revenue growth was 10.5%. See GAAP to Non-GAAP reconciliation at the end
of this presentation.
(4)
Reflects Wall Street estimate. |
 Virtuous cycle
of growth is paying off 8
Focus on Power
Brands
+8% in 2011
Reduce Costs
Productivity
>4%% COGS
Drive Top-Tier Growth
Organic Net Revenue
+6.6%
(1)
(1)
Reported Net Revenue growth was 10.5%. See GAAP to Non-GAAP reconciliation at the
end of this presentation. |
 Virtuous cycle
of growth is paying off 9
Focus on Power
Brands
+8% in 2011
Reduce Costs
Productivity
>4%% COGS
Leverage Overheads
% of NR down (60)bps
(2)
Drive Top-Tier Growth
Organic Net Revenue
+6.6%
(1)
(1)
Reported Net Revenue growth was 10.5%. See GAAP to Non-GAAP reconciliation at
the end of this presentation.
(2)
Underlying overheads as a % of net revenue excludes Integration Program costs,
acquisition-related costs and costs associated with the proposed spin-off of the North American
grocery business. Reported overheads as a % of net revenue was down (130) bps versus
2010. See GAAP to Non-GAAP reconciliation at the end of this presentation. |
 Virtuous cycle
of growth is paying off 10
Focus on Power
Brands
+8% in 2011
Reinvest in Growth
A&C 8% of NR
NPD 10%+ of NR
Reduce Costs
Productivity
>4%% COGS
Leverage Overheads
% of NR down (60)bps
(2)
Drive Top-Tier Growth
Organic Net Revenue
+6.6%
(1)
(1)
Reported Net Revenue growth was 10.5%. See GAAP to Non-GAAP reconciliation at the end
of this presentation.
(2)
Underlying overheads as a % of net revenue excludes Integration Program costs,
acquisition-related costs and costs associated with the proposed spin-off of the North American
grocery business. Reported overheads as a % of net revenue was down (130) bps versus
2010. See GAAP to Non-GAAP reconciliation at the end of this presentation. |
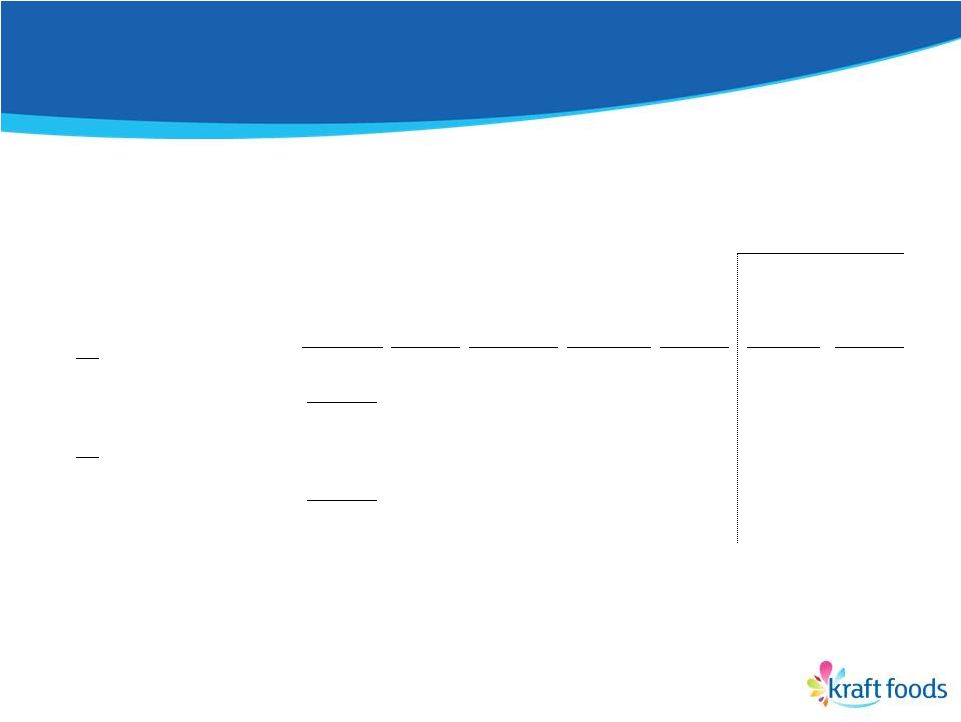
 Operating
gains fueling EPS growth 11
2010
Diluted
EPS
2010
Adjustments
(1)
Operating
Gains
(2)
Other,
net
(3)
2011
Operating
EPS
(5)
$2.39
$(0.37)
$0.25
$0.02
$2.29
2010
Operating
EPS
(5)
$2.02
Non-
Operating
Items
(4)
$(0.30)
2011
Diluted
EPS
$1.99
+13%
+10% constant FX
(1)
2010 Adjustments include earnings and gain from discontinued operations,
acquisition-related costs, Integration Program costs and the U.S. Healthcare legislation
impact on deferred taxes.
(3)
“Other, net” includes the impact of: decreases in operating income from divestitures,
primarily the loss of the Starbucks CPG business; the increase in operations from one
month of Cadbury; the change in restructuring accrual reversals and asset impairments; the change in unrealized gains/losses
from hedging activities; favorable foreign currency; higher interest expense; changes in taxes;
and changes in shares outstanding.
(4)
Non-operating items include Integration Program costs and costs related to the proposed
spin-off of the North American Grocery business.
(5)
See GAAP to Non-GAAP reconciliation at the end of this presentation.
(2)
Includes
the
benefit
of
accounting
calendar
changes
(including
the
impact
of
the
53
rd
week
of
shipments). |
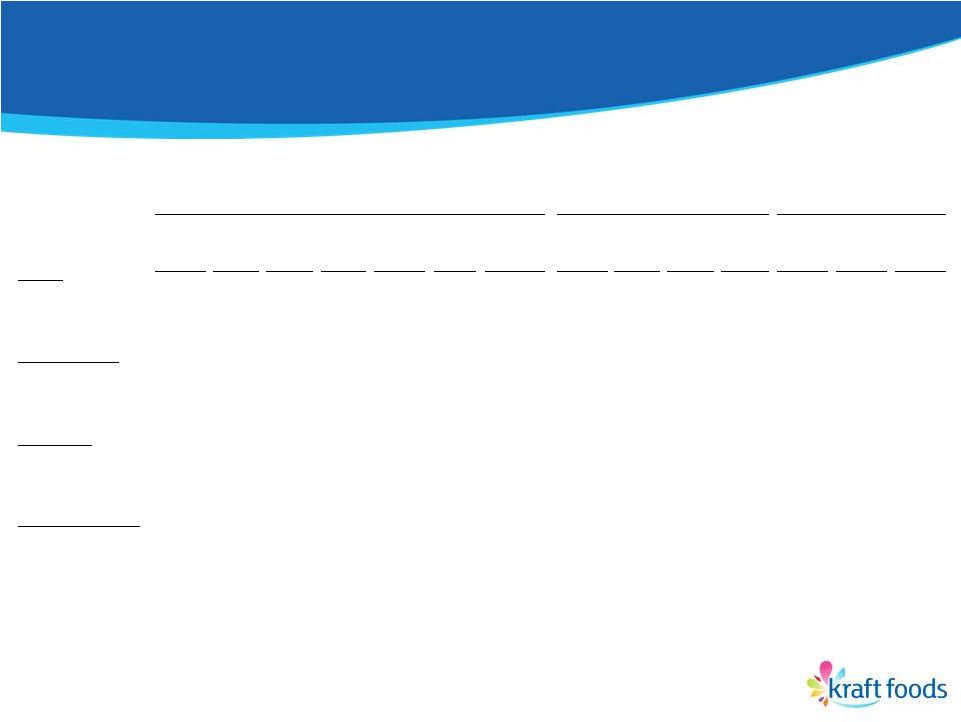
 Delivering
top-tier earnings growth 12
2009
2010
2011
(2)
(4)
(4)
(4)
(4)
(3)
(4)
(4)
(4)
(4)
(4)
(4)
(4)
Operating EPS Growth
(1)
1
Hershey
15.4%
1
Hershey
17.5%
1
Kraft Foods
13.4%
2
General Mills
13.1%
2
General Mills
15.6%
2
Hershey
10.6%
3
Heinz
10.3%
3
ConAgra
14.5%
3
Coca-Cola
10.0%
4
Kraft Foods
8.0%
4
Coca-Cola
14.1%
4
General Mills
7.8%
5
Campbell
6.2%
5
PepsiCo
11.3%
5
Heinz
7.3%
6
Kellogg
5.7%
6
Campbell
11.3%
6
Danone
6.6%
7
PepsiCo
0.8%
7
Nestlé
7.4%
7
PepsiCo
6.5%
8
Nestlé
0.7%
8
Danone
5.4%
8
Campbell
2.8%
9
Danone
(0.8)%
9
Kraft Foods
4.7%
9
Sara Lee
2.6%
10
Coca-Cola
(2.9)%
10
Kellogg
4.4%
10
Kellogg
2.4%
11
Sara Lee
(15.2)%
11
Heinz
(1.0)%
11
ConAgra
0.6%
12
ConAgra
(20.0)%
12
Sara Lee
(9.5)%
12
Nestlé
(7.2)%
(1)
Source: Thomson First Call.
(2)
Represents
Operating
EPS.
Diluted
EPS
declined
17.7%.
See
GAAP
to
Non-GAAP
reconciliation
at
the
end
of
this
presentation.
(3)
Diluted EPS declined 16.7%. See GAAP to Non-GAAP reconciliation at the
end of this presentation. (4)
Per company reports. |
 Kraft Foods
Developing Markets 13
Sanjay Khosla
President
Kraft Foods Developing Markets |
 Kraft Foods
Developing Markets is driving a virtuous cycle
14
Focus on Power
Brands
+17% in 2011
(1)
Reported
Net
Revenue
growth
was
16.2%.
See
GAAP
to
Non-GAAP
reconciliation
at
the
end
of
this
presentation.
Drive Top-Tier Growth
Organic Net Revenue
+11.2%
(1) |
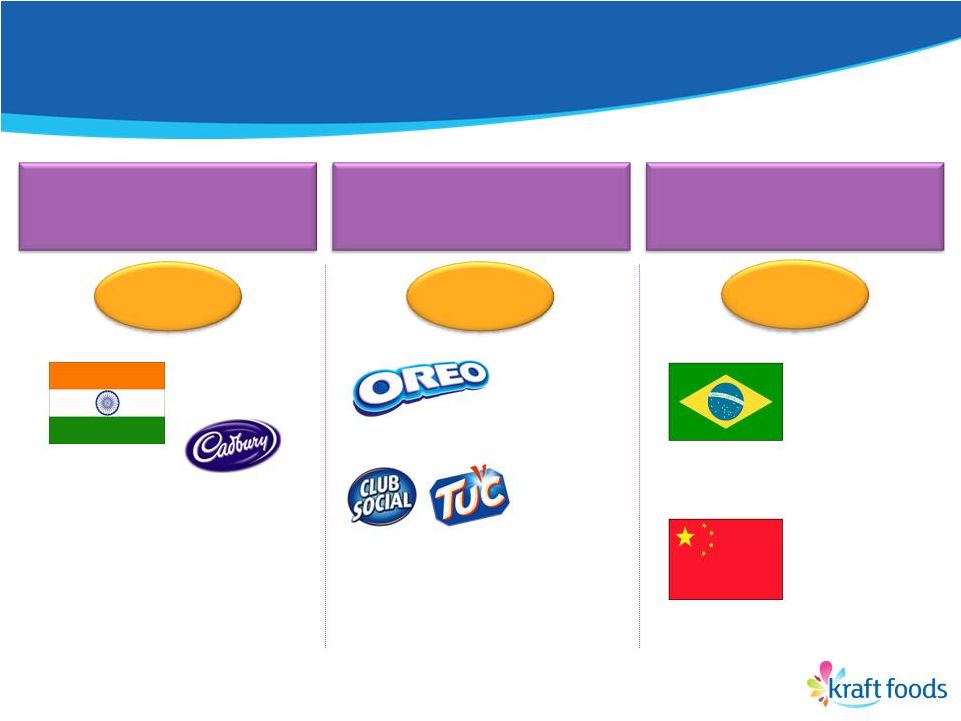 5-10-10 strategy drives revenue growth
15
5
Categories
10
Power Brands
10
Priority Markets
+12%
India
Chocolate
+30%
+17%
+50%
+35%
+12%
Brazil
+15%
To $2B+
+30%
to $800M+
China |
 Kraft Foods
Developing Markets is driving a virtuous cycle
16
Focus on Power
Brands
+17% in 2011
Drive Top-Tier Growth
Organic Net Revenue
+11.2%
(1)
Reduce Costs
Productivity
4% COGS
Leverage Overheads
% of NR down (20) bps
(2)
(1)
Reported Net Revenue growth was 16.2%. See GAAP to Non-GAAP reconciliation at the end of this
presentation.
(2)
Underlying overheads as a % of net revenue excludes Integration Program costs, acquisition-related
costs and costs associated with the proposed spin-off of the North American grocery
business. Reported overheads as a % of net revenue was down (40) bps versus 2010. See GAAP
to Non-GAAP reconciliation at the end of this presentation. |
 Kraft Foods
Developing Markets is driving a virtuous cycle
17
Focus on Power
Brands
+17% in 2011
Reinvest in Growth
A&C 10% of NR
NPD 12% of NR
Drive Top-Tier Growth
Organic Net Revenue
+11.2%
(1)
Reduce Costs
Productivity
4% COGS
Leverage Overheads
% of NR down (20) bps
(2)
(1)
Reported Net Revenue growth was 16.2%. See GAAP to Non-GAAP reconciliation at the end
of this presentation.
(2)
Underlying overheads as a % of net revenue excludes Integration Program costs,
acquisition-related costs and costs associated with the proposed spin-off of the North American
grocery business. Reported overheads as a % of net revenue was down (40) bps versus
2010. See GAAP to Non-GAAP reconciliation at the end of this presentation. |
 Kraft Foods
Developing Markets will continue to drive strong growth in 2012
•
Relentless focus behind 5-10-10 strategy
•
Capture Cadbury synergies
•
Expand margins through productivity and
overhead leverage
18 |
 Kraft Foods
Europe 19
Tim Cofer
President
Kraft Foods Europe |
 Kraft Foods
Europe is driving a virtuous cycle 20
Focus on Power
Brands
+7% in 2011
Drive Top-Tier Growth
Organic Net Revenue
+4.6%
(1)
(1)
Reported Net Revenue growth was 14.9%. See GAAP to Non-GAAP reconciliation at the
end of this presentation. |
 Power Brands,
innovation and geographic expansion driving growth
21
Choco-Bakery
+29%
+25%
+25%
+18% |
 Kraft Foods
Europe is driving a virtuous cycle 22
Focus on Power
Brands
+7% in 2011
Reduce Costs
Productivity
>4% COGS
Drive Top-Tier Growth
Organic Net Revenue
+4.6%
(1)
(1)
Reported Net Revenue growth was 14.9%. See GAAP to Non-GAAP reconciliation at the
end of this presentation. |
 Kraft Foods
Europe is driving a virtuous cycle 23
Focus on Power
Brands
+7% in 2011
Reduce Costs
Productivity
>4% COGS
Drive Top-Tier Growth
Organic Net Revenue
+4.6%
(1)
Leverage Overheads
% of NR down (150)bps
(2)
(1)
Reported Net Revenue growth was 14.9%. See GAAP to Non-GAAP reconciliation at the end
of this presentation.
(2)
Underlying overheads as a % of net revenue excludes Integration Program costs,
acquisition-related costs and costs associated with the proposed spin-off of the North American
grocery business. Reported overheads as a % of net revenue was down (200) bps versus
2010. See GAAP to Non-GAAP reconciliation at the end of this presentation. |
 Kraft Foods
Europe is driving a virtuous cycle 24
Focus on Power
Brands
+7% in 2011
Reinvest in Growth
A&C 8% of NR
NPD 12% of NR
(1)
Reported Net Revenue growth was 14.9%. See GAAP to Non-GAAP reconciliation at the end
of this presentation. (2)
Underlying overheads as a % of net revenue excludes Integration Program costs,
acquisition-related costs and costs associated with the proposed spin-off of the North American
grocery business. Reported overheads as a % of net revenue was down (200) bps versus
2010. See GAAP to Non-GAAP reconciliation at the end of this presentation.
Reduce Costs
Productivity
>4% COGS
Drive Top-Tier Growth
Organic Net Revenue
+4.6%
(1)
Leverage Overheads
% of NR down (150)bps
(2) |
 Kraft Foods
Europe will continue to drive a growth agenda in 2012
•
Top-line momentum
–
Distort investments towards Power Brands
–
Step up innovation
–
Excellent sales execution
–
Enter “white space”
markets
•
Expand margins and fund investments through
relentless cost management
–
Lower overheads
–
Increase productivity
25 |
 Building on
Success in North America
26
Tony Vernon
President
Kraft Foods North America |
 2011
Priorities •
Revitalize our brands
•
Increase marketing and sales excellence
•
Deliver record cost savings
27 |
 Kraft Foods
North America is driving a virtuous cycle
28
Focus on Power
Brands
+4.5% in 2011
Drive Top-Tier Growth
Organic Net Revenue
+4.8%
(1)
(1)
Reported Net Revenue growth was 5.1%. See GAAP to Non-GAAP reconciliation at the end of
this presentation. |
 Solid market
share performance in an unprecedented environment
29
Source: 52-weeks ending Dec. 24, 2011. 4-outlet data, Nielsen.
Percent of 2011 U.S. Retail Revenue
36%
Gaining/holding
share
31%
Pricing to
protect profit
13%
Outsized category
growth through
Innovation |
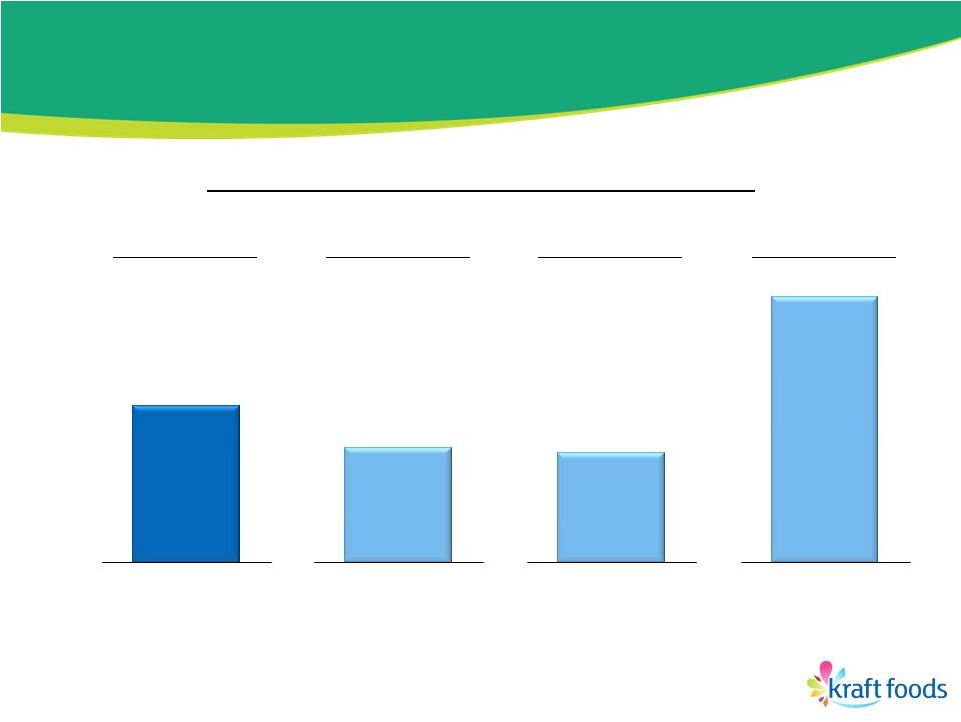
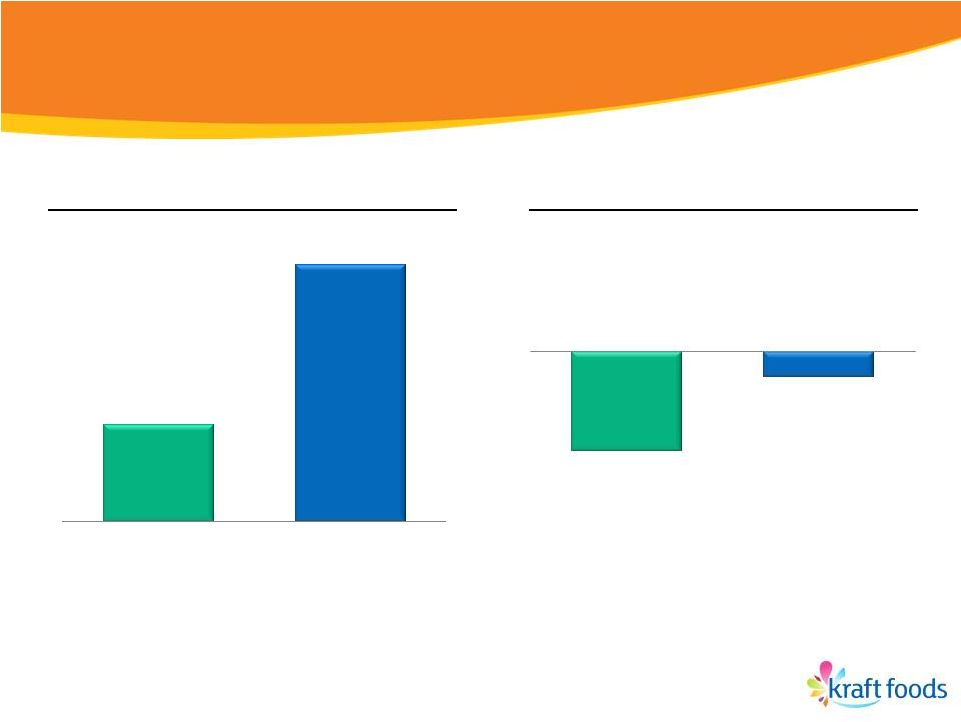 Drove our U.S.
retail categories faster than the industry
30
Total U.S.
Food &
Beverage
Kraft Foods
U.S.
Categories
(2.4)%
(0.6)%
2011 Equivalent
Units Growth
Total U.S.
Food &
Beverage
Kraft Foods
U.S.
Categories
2.7%
7.1%
2011 $ Growth
Source: 52-weeks ending Dec. 24, 2011. 4-outlet data, Nielsen.
|
 Kraft Foods
North America is driving a virtuous cycle
31
Focus on Power
Brands
+4.5% in 2011
Leverage Overheads
% of NR down (60)bps
(2)
Drive Top-Tier Growth
Organic Net Revenue
+4.8%
(1)
Reduce Costs
Productivity
>4% COGS
(1)
Reported Net Revenue growth was 5.1%. See GAAP to Non-GAAP reconciliation at the end of
this presentation.
(2)
Reflects underlying overheads as a % of net revenue, which excludes Integration Program costs,
acquisition-related costs and costs associated with the proposed spin-off of the North
American grocery business. Reported overheads as a % of net revenue was down (60) bps
versus 2010. See GAAP to Non-GAAP reconciliation at the end of this presentation. |
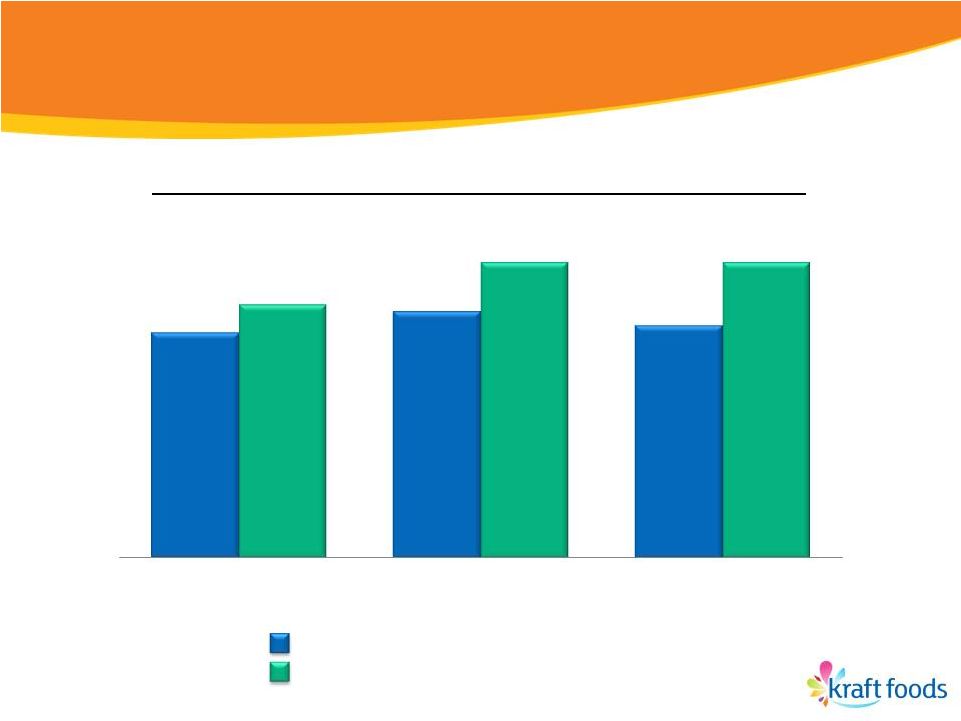
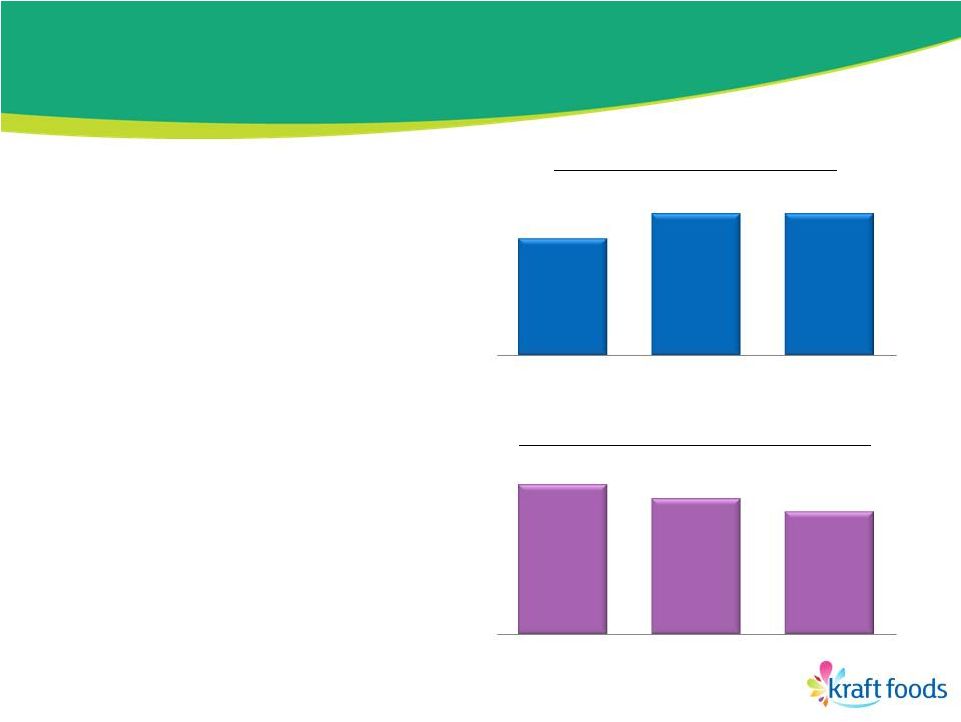
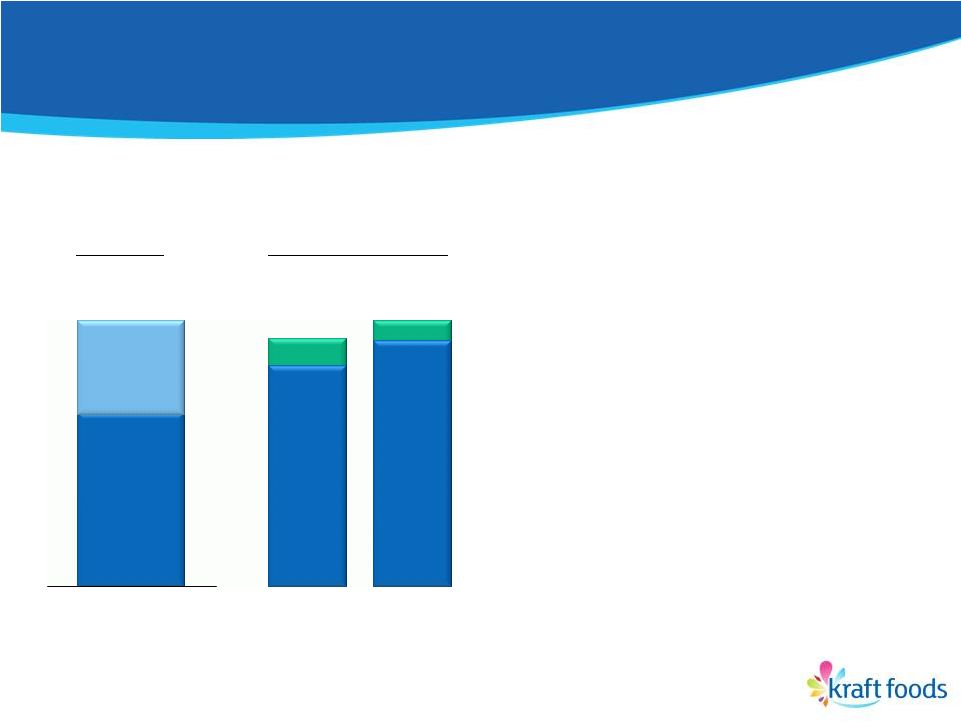
 Focus on cost
reduction is paying off 32
Productivity as % of
Cost of Goods Sold
4.0%
4.4%
Overheads as % of
Net Revenue
(1)
12.0%
11.4%
(1)
Reflects underlying overheads as a % of net revenue, which excludes Integration Program costs,
acquisition-related costs and costs associated with the proposed spin-off of
the North American grocery business. Reported overheads as a % of net revenue
were 12.2% and 11.6% in 2010 and 2011, respectively. See GAAP to Non-GAAP
reconciliation at the end of this presentation. (2)
Reflects Kraft Foods base business only.
(3)
Pro forma combined Kraft Foods base business and Cadbury.
3.5%
(2)
12.6%
(3)
2009
2010
2011
2009
2010
2011 |
 Kraft Foods
North America is driving a virtuous cycle
33
Focus on Power
Brands
+4.5% in 2011
Leverage Overheads
% of NR down (60)bps
(2)
Reinvest in Growth
A&C 6% of NR
NPD 9% of NR
Drive Top-Tier Growth
Organic Net Revenue
+4.8%
(1)
Reduce Costs
Productivity
4.4% COGS
(1)
Reported Net Revenue growth was 5.1%. See GAAP to Non-GAAP reconciliation at the end of
this presentation.
(2)
Reflects underlying overheads as a % of net revenue, which excludes Integration Program costs,
acquisition-related costs and costs associated with the proposed spin-off of the North
American grocery business. Reported overheads as a % of net revenue was down (60) bps
versus 2010. See GAAP to Non-GAAP reconciliation at the end of this presentation. |
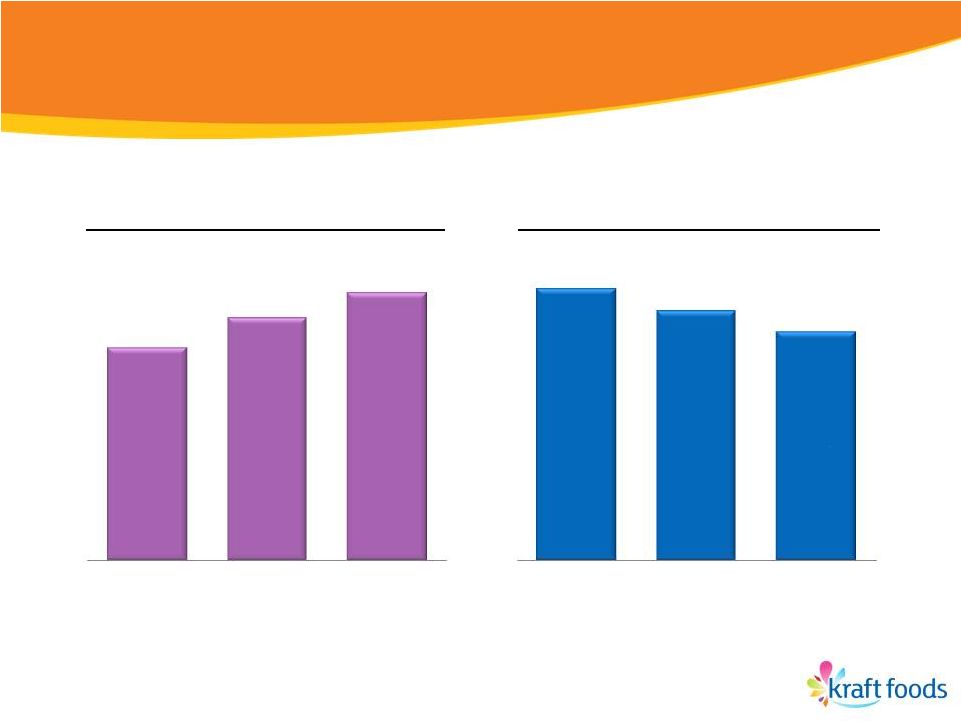
 Distorting
brand building investments to Power Brands
34
KFNA A&C as a Percentage of Net Revenues
(1)
(1) Pro forma for Cadbury acquisition.
A&C % of net revenues for total KFNA
A&C % of net revenues for KFNA Power Brands
6.2%
6.5%
6.3%
6.6%
7.2%
7.2%
2009
2010
2011 |
 Driving growth
in our iconic brands 35
+12%
+5%
+8%
+9%
+6%
+11%
+7%
+20%
+44%
+5% |
 Stepping up
growth from new products 36
(1)
Reflects percentage of net revenue derived from products introduced within the prior 3
years. (2)
Reflects Kraft Foods base business only.
New Product Development as % of Net Revenue
8%
9%
6.5%
(1)
(2)
2009
2010
2011 |
 •
Weak GDP rebound
•
High unemployment
•
Commodity costs
expected to remain
high / volatile
•
Low consumer
confidence, but
improving
•
F&B demand
recovering, but
remains weak
•
Value focus will
remain; more than
just low price
•
Rising prices driving
dollar growth but
volume softness
•
Dynamic retail
environment
•
Customers looking
for Kraft to bring
category leadership,
innovation, value
and H&W
37
37
Economy
Consumer
Customer
2012 environment will remain difficult |
 Three
priorities will position both grocery and snacks businesses for success
1.
Strategically distort portfolio
–
Drive break-through innovation
–
Skew A&C investments to Power Brands
–
Discontinue products with low profitability
38 |
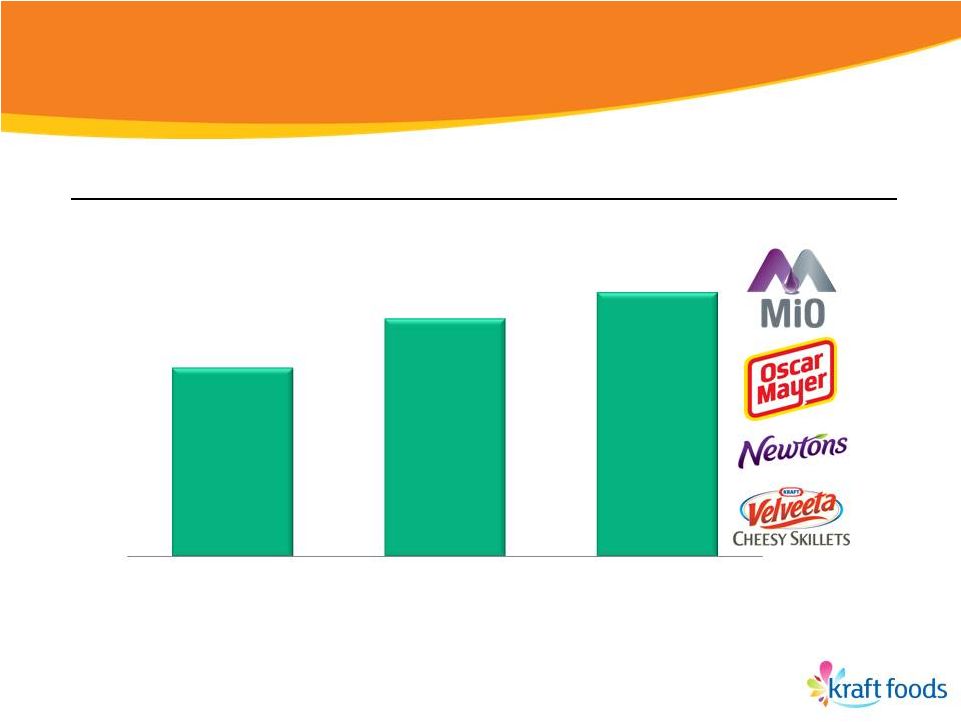
 2012
Innovation 39 |
 •
Higher-than-average gross margins
•
Vibrant categories
•
Outsized investments behind product news
40
A&C investments skewed to 21 Power Brands
will drive 2012 organic growth |
 Selective
product line pruning will improve mix
•
Eliminating product lines with low profitability
–
40% from North America Foodservice
–
60% from other business units
•
Impacts organic net revenue growth
–
Up to 2 percentage points in North America
–
Up to 1 percentage point for total Kraft
•
Manageable impact to operating income
41 |
 Three
priorities will position both grocery and snacks businesses for success
1.
Strategically distort portfolio
2.
Drive towards best-in-class costs
–
Deliver productivity of 4%+
–
Streamline manufacturing and distribution networks
–
Reduce overhead
42 |
 Realigning
U.S. Sales organization 43
Grocery
Business
Snacks
Business
Retail Execution
HQ Sales |
 Three
priorities will position both grocery and snacks businesses for success
1.
Strategically distort portfolio
2.
Drive towards best-in-class costs
3.
Reignite a winning culture
–
Spirit of a start up, soul of a powerhouse
–
Recruit the best talent
–
Reinvest in our employees
44 |
 Summary
•
Kraft Foods North America is driving a
virtuous cycle
•
We will continue to deliver industry-leading
results
•
We will launch two businesses positioned
for success
45 |
 Executive
Vice President and CFO
2012 Guidance
Dave Brearton |
 2012 results
will be driven by multiple factors •
Strong organic growth from Power Brands
•
Full Cadbury synergies
•
Further gains from End-to-End Cost
Management
•
One-time costs to achieve peak performance
•
Financing costs to execute the separation
47 |
 2012 will
benefit from the tailwind of top-line momentum in each region
48
Kraft
Foods
(1)
+6.6%
+4.8%
North
America
(1)
+4.6%
Europe
(1)
+11.2%
Developing
Markets
(1)
Pricing
Vol/Mix
6.0
pp
0.6
pp
6.1
pp
(1.3)
pp
4.4
pp
0.2
pp
7.3
pp
3.9
pp
2011 Organic Net Revenue Growth
(1)
Reported Net Revenues in FY 2011 increased 10.5%, 5.1%, 14.9% and 16.2% for Kraft Foods, North
America, Europe and Developing Markets, respectively. See GAAP to Non-GAAP
reconciliation at the end of this presentation. |
 Cadbury
revenue synergies will escalate •
Achieved $400 million revenue run-rate
–
Drove 2011 revenue synergies of $300+ million
–
~60 bps of growth
•
On-track to reach $1 billion target
–
Roughly two-thirds from Developing Markets
–
50-100 bps of growth in 2012
49 |
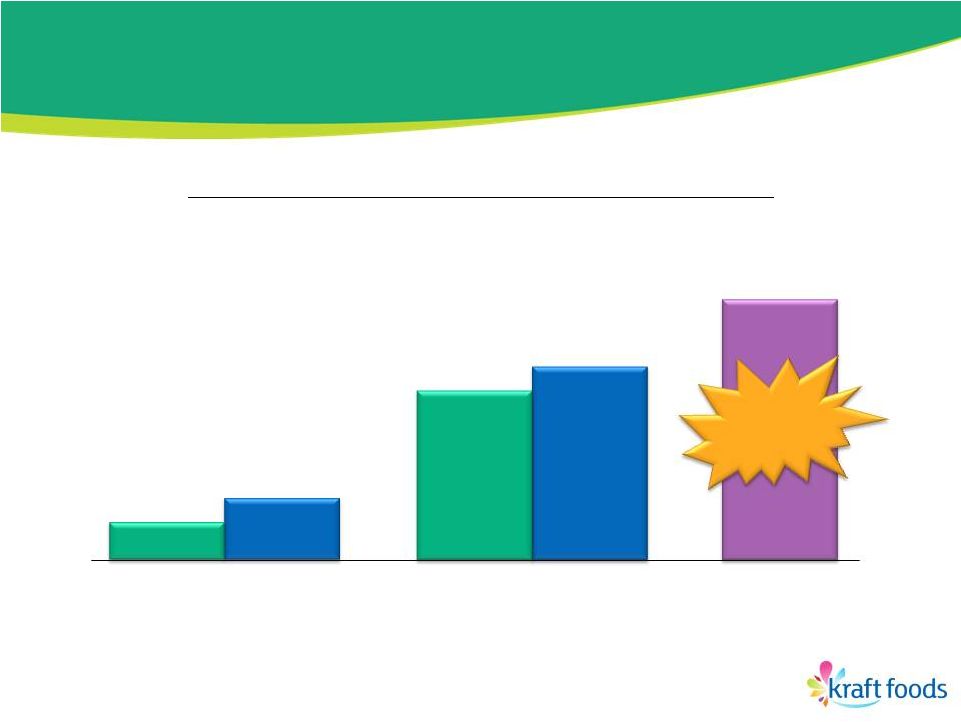 Exceeding
Cadbury cost synergy targets 50
(Cumulative P&L Impact, % of Original $750 Million Target)
Cost Synergies
~25%
~80%
105%+
~15%
Actual
2011
2012
Original
Estimate
2010
Actual
Original
Estimate
~70%
~$800
Million |
 End-to-End Cost Management will drive
further gains
•
Productivity
–
Procurement
–
Manufacturing
–
Customer Service & Logistics
•
Overhead Cost Reset
–
North America: NOG
–
Europe: NOG
–
Developing Markets: HOG
51
Productivity % of COGS
Overheads % of Net Revenue
~4%
4%+
4%+
2010
2012E
2011
13.8%
14.4%
13%-13.5%
2010
2012E
2011
(2)
(3)
(4)
(1)
(1)
Kraft Foods Base Business only
(2)
Excludes integration and acquisition-related costs associated with the Cadbury acquisition,
and costs associated with the proposed spin-off of the North American grocery
business.
(3)
Reported Overheads as a % of Net revenues for FY 2010 was 16.0%. See GAAP to Non-GAAP
reconciliation at the end of this presentation.
(4)
Reported Overheads as a % of Net revenues for FY 2011 was 14.7%. See GAAP to Non-GAAP
reconciliation at the end of this presentation. |
 Targeting
top-tier growth in 2012 52
•
Organic revenue growth consistent with
5%+ long-term guidance
+
Strong momentum, Power Brands in each region
+
Revenue synergies from Cadbury
+
Low/mid-single-digit benefit from pricing
–
Macroeconomic environment
–
Product pruning in North America of up to 1 pp
Organic Net Revenue growth
of approximately 5% |
 Targeting
top-tier growth in 2012 •
Organic revenue growth consistent with
5%+ long-term guidance
•
Operating EPS growth consistent with
9%-11% constant-currency, long-term guidance
+
Strong operating momentum
+
Further gains from End-to-End Cost Management, synergies
–
Pension cost headwind ~4 pp
–
Higher effective tax rate (~28%)
53
Constant Currency Operating EPS growth
at low end of 9%-11% range |
 Setting up
each company for future success •
“Clean sheet”
approach
–
Lean corporate structures
–
Tailoring support functions to needs of each company
–
Streamlining manufacturing and distribution infrastructures
•
Transition and transaction costs to execute
separation
•
$1.6-$1.8 billion of one-time costs
–
Approximately two-thirds in cash
–
Most expected to be booked in 2012
•
Key enabler to achieving peak performance for
each company
54 |
 Refinancing
costs to be incurred to set up capital structures
•
Debt breakage and financing fees from
migrating debt to North American grocery
•
$400 million to $800 million cost
55 |
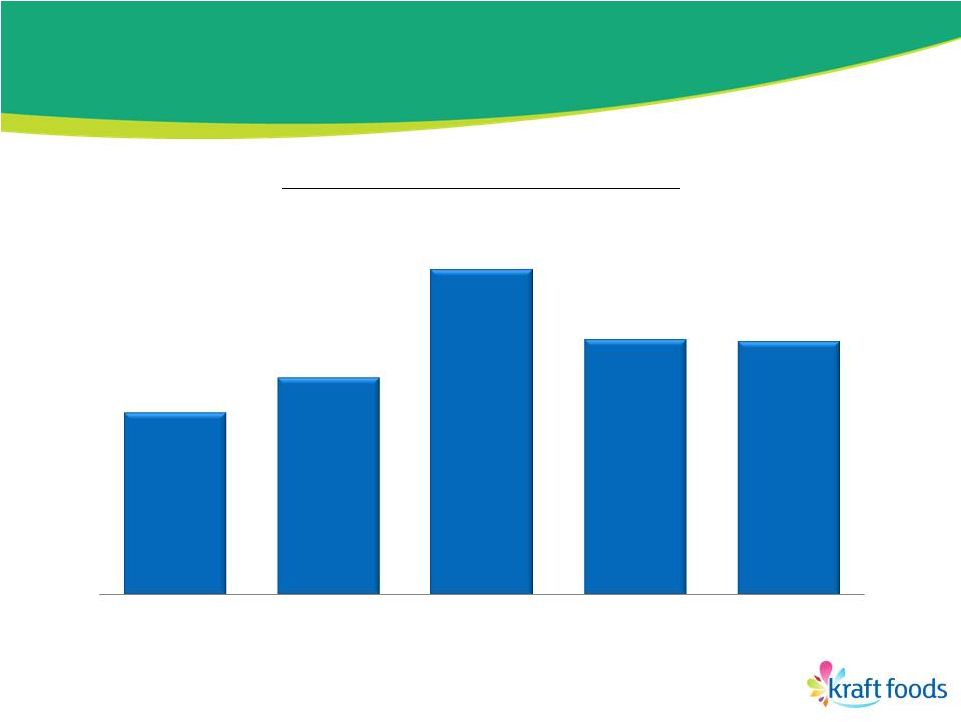 Generating
strong free cash flow 56
(1)
Adjusted free cash flow is defined as net cash from operating activities less capital
expenditures plus voluntary pension contributions and taxes paid on the gain on the
2010 sale of North America pizza business. See GAAP to Non-GAAP
reconciliation at the end of this presentation.
Adjusted
Free
Cash
Flow
(1)
($ billions)
$2.3
$2.8
$4.2
$3.3
$3.2
2007
2008
2009
2010
2011 |
 Well-positioned to launch two investment
grade companies with access to CP
•
Successfully delevered from Cadbury acquisition
–
Gross debt-to-underlying EBITDA of 3.1x
–
Total debt down $4+ billion since March 2010
•
Taking actions to create space, flexibility
–
Issued $800 million floating rate notes in Jan. 2012
–
More to come
•
Several options to migrate debt to North
American grocery company
57 |
 Driving
sustainable, top-tier performance for the long term
•
Top-tier operating performance on both
top and
bottom lines
•
Setting stage for strong, future gains through a
clean-sheet approach
•
On track to launch two investment-grade
entities with low-cost debt
58 |
 The Path to
Separation Irene Rosenfeld
Chairman and CEO |
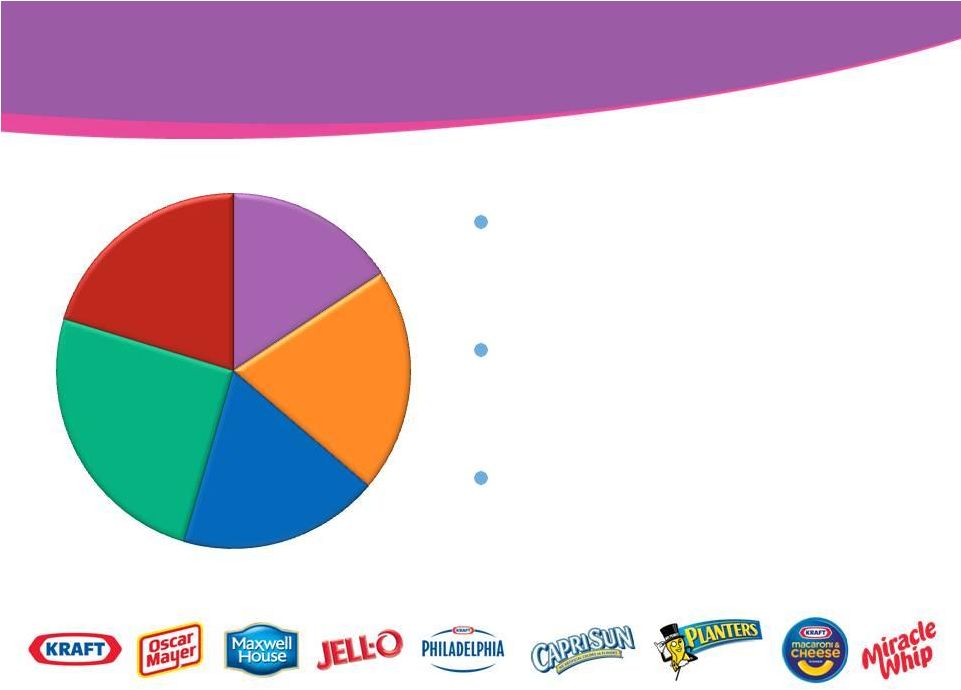 North American
grocery will be a major force in the industry
U.S. Beverages
16%
$18 Billion in Revenues*
U.S. Cheese
21%
U.S. Convenient
Meals
18%
U.S. Grocery
25%
Canada &
NA Foodservice
20%
Growth in line with
categories
Strong margins with
upside opportunity
Highly competitive
dividend payout
60
* Based
on
2011
reported
net
revenues
adjusted
for the
53
week
of
shipments
and
divestitures,
including
the
Starbucks
CPG
business.
rd
Includes Planters. All figures are
unaudited. |
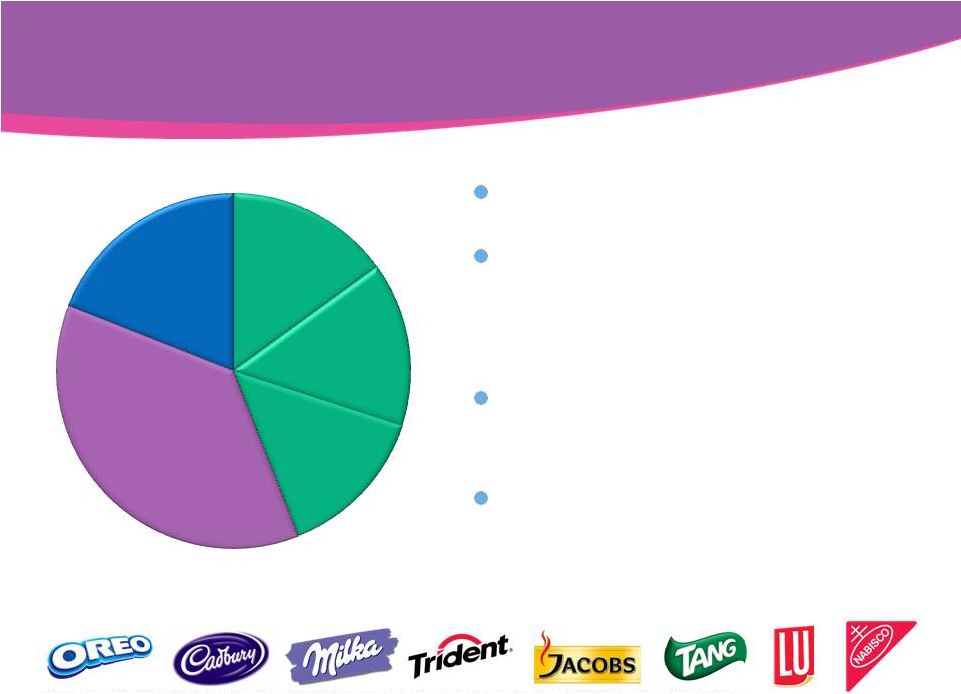 Latin
America
CEEMA
Asia
Pacific
Europe
37%
North
America
19%
Developing
Markets
44%
$35 Billion in Revenues*
Industry-leading growth
Drive margin gains
through revenue growth
and cost containment
Invest to support future
growth
Top-tier EPS growth plus
a modest dividend
* Based
on
2011
reported
net
revenues
adjusted
for
accounting
calendar
changes,
the
53rd
week
of
shipments
and
divestitures.
Excludes Planters. All figures are unaudited.
61
Global snacks’
geographic profile is unique
within consumer products |
 What’s
next •
Continue to report as one company
•
Initial Form 10 filing, carve-out financials in Q2
•
Tax Rulings around mid-year
•
Management structures and personnel decisions
finalized by mid-year
•
Complete separation no later than
Dec. 31, 2012
•
Investor events close to separation date
62 |
 2012 will be
an exciting year for Kraft Foods and our shareholders
•
Strong operating momentum
•
Executing separation from position of strength
•
The best is yet to come!
63 |
 |
 Kraft
Foods 65
Organic Net
Revenue
Growth
(1)
•
Revenue growth in top-tier of
peer group
–
Positive vol/mix despite significant
pricing
•
Power Brands +8%
•
Underlying OI +10%
(3)
–
Pricing fully covered $2.6 billion
increase in raw material costs
•
Underlying OI Margin
essentially flat due to
denominator effect of pricing
FY 2011
+6.6%
Pricing
+6.0 pp
Vol/Mix
+0.6 pp
Operating
Income Margin
FY 2010
FY 2011
11.5%
(reported)
13.3%
13.4%
12.2%
(reported)
(2)
(2)
(1)
Reported Net Revenues increased 10.5% in FY 2011. See GAAP to Non-GAAP
reconciliation at the end of this presentation.
(2)
Underlying Operating Income margin excludes Integration Program costs, acquisition-related
costs and costs associated with the proposed spin-off of the North American grocery
business. See GAAP to Non-GAAP reconciliation at the end of this presentation.
(3)
Reported Operating Income increased 17.5%. See GAAP to Non-GAAP reconciliation at
the end of this presentation.
|
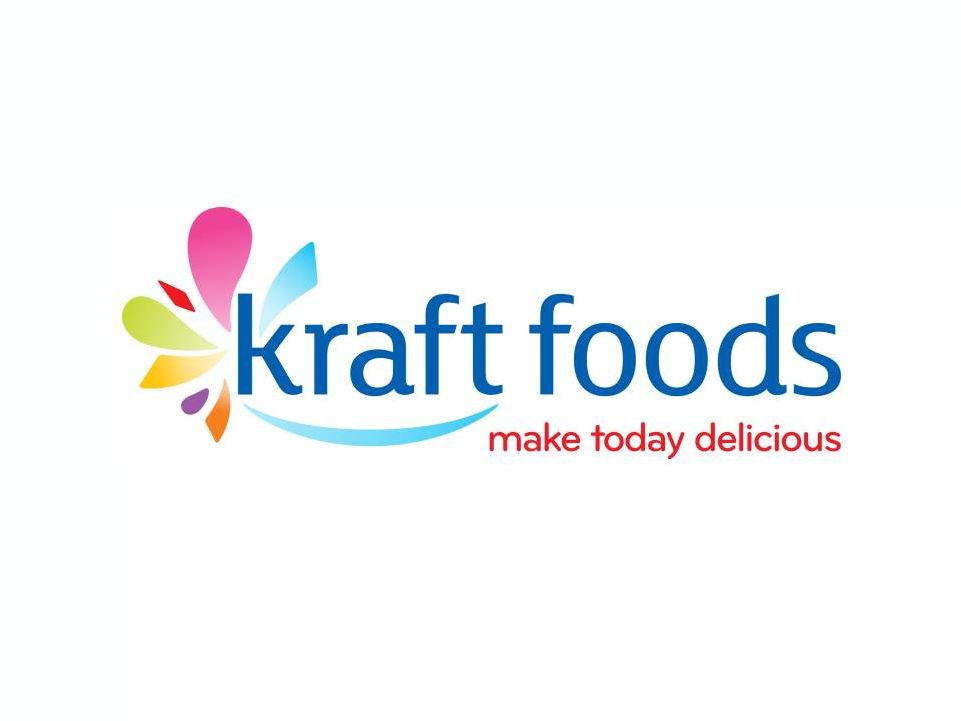
 Kraft Foods
North America 66
Organic Net
Revenue
Growth
(1)
•
Pricing and new products drove
revenue growth
–
Vol/mix in line with expectations
–
Power Brands +6%
–
New products contributed 9%+
of revenue
•
Underlying SOI +4%
(3)
–
(3)pp impact from divestitures,
primarily Starbucks CPG business
–
Pricing fully covered increase in
raw material costs
•
Underlying SOI Margin
essentially flat due to
denominator effect of pricing
FY 2011
+4.8%
Pricing
+6.1 pp
Vol/Mix
(1.3)pp
Segment Operating
Income Margin
FY 2010
FY 2011
16.8%
(reported)
16.8%
17.0%
16.5%
(reported)
(2)
(2)
(1)
Reported Net Revenues increased 5.1% in FY 2011. See GAAP to Non-GAAP reconciliation
at the end of this presentation.
(2)
Underlying Operating Income margin excludes Integration Program costs, acquisition-related
costs and costs associated with the proposed spin-off of the North American grocery
business. See GAAP to Non-GAAP reconciliation at the end of this
presentation.
(3)
Reported Operating Income increased 3.6%. See GAAP to Non-GAAP reconciliation at the
end of this presentation. |
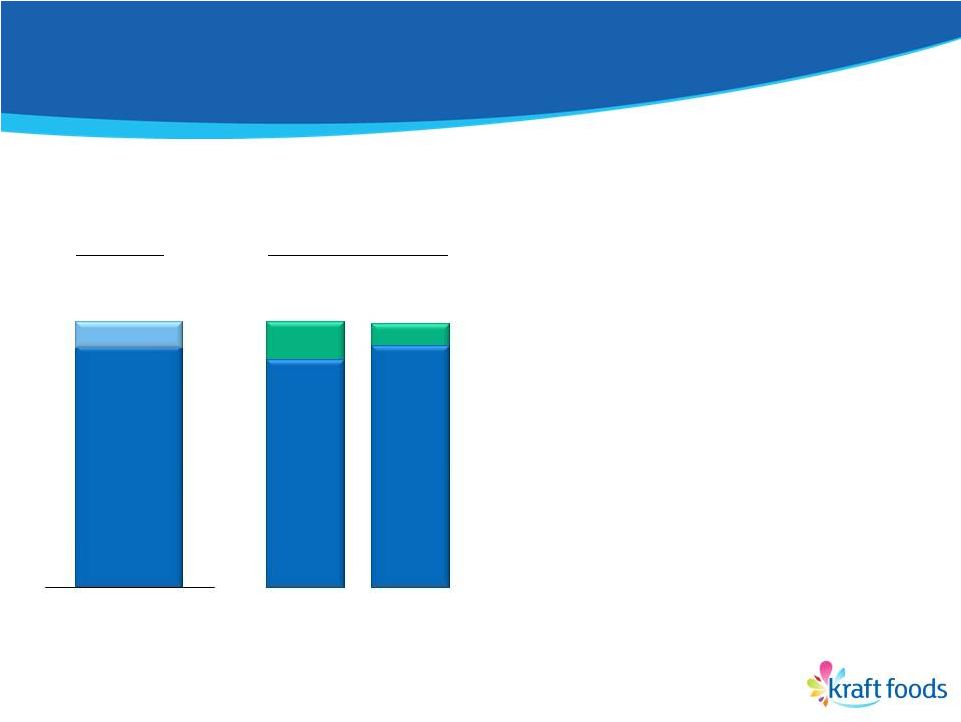
 Kraft Foods
Europe 67
Organic Net
Revenue
Growth
(1)
•
Strong performance in each
quarter this year
–
8 straight quarters of top-
and
bottom-line gains
–
Positive vol/mix despite significant
pricing
•
Power Brands +7%
•
Underlying SOI +19%
(3)
–
Pricing and productivity essentially
covered increase in raw material
costs
FY 2011
+4.6%
Pricing
+4.4 pp
Vol/Mix
+0.2 pp
Segment Operating
Income Margin
FY 2010
FY 2011
9.6%
(reported)
12.4%
12.0%
(1)
Reported Net Revenues increased 14.9% in FY 2011. See GAAP to Non-GAAP
reconciliation at the end of this presentation. (2)
Underlying Operating Income margin excludes Integration Program costs, acquisition-related
costs and costs associated with the proposed spin-off of the North American grocery
business. See GAAP to Non-GAAP reconciliation at the end of this
presentation
(3)
Reported Operating Income increased 26.1%. See GAAP to Non-GAAP reconciliation at
the end of this presentation. 10.5%
(reported)
(2)
(2) |
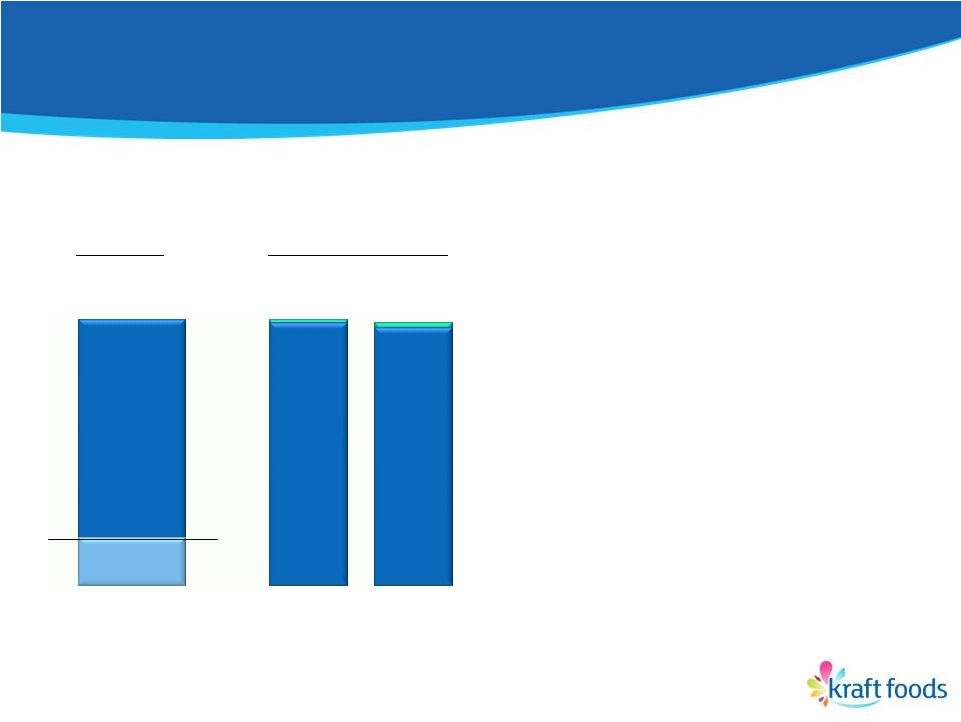
 Kraft Foods
Developing Markets 68
Organic Net
Revenue
Growth
(1)
•
Strong revenue performance in
each region despite volatile
market conditions
–
Latin America and Asia Pacific
both up double-digits
–
CEEMA up high single-digits
•
Power Brands +17%
•
Underlying SOI +24%
–
Pricing fully covered increase in
raw material costs
–
Vol/mix and overhead leverage
drove margin expansion
FY 2011
+11.2%
Pricing
+7.3 pp
Vol/Mix
+3.9 pp
Segment Operating
Income Margin
FY 2010
FY 2011
11.6%
(reported)
14.0%
13.1%
13.0%
(reported)
(2)
(2)
(1)
Reported Net Revenues increased 16.2% in FY 2011. See GAAP to Non-GAAP
reconciliation at the end of this presentation.
(2)
Underlying Operating Income margin excludes Integration Program costs, acquisition-related
costs and costs associated with the proposed spin-off of the North American grocery
business. See GAAP to Non-GAAP reconciliation at the end of this presentation
(3)
Reported Operating Income increased 30.2%. See GAAP to Non-GAAP reconciliation at
the end of this presentation. |
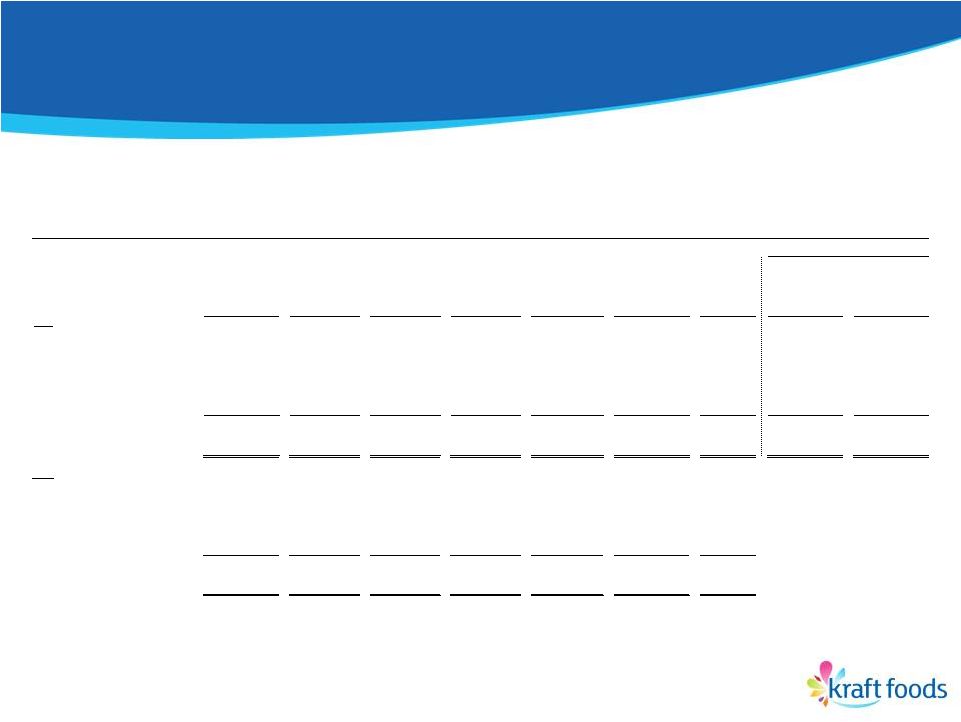 GAAP to
Non-GAAP Reconciliation 69
As Reported
(GAAP)
Impact of
Divestitures
Impact of
Acquisitions
(2)
Impact of
Integration
Program
Impact of
Accounting
Calendar
Changes
(3)
Impact of
Currency
Organic
(Non-GAAP)
As Reported
(GAAP)
Organic
(Non-GAAP)
2011
Biscuits
12,010
$
-
$
-
$
-
$
(235)
$
(219)
$
11,556
$
11.5%
8.7%
Confectionery
Chocolate
9,607
-
(287)
-
(143)
(361)
8,816
16.1%
6.4%
Gum & Candy
5,575
-
(379)
1
(2)
(151)
5,044
11.6%
1.0%
Other Confectionery
293
-
(3)
-
(6)
(7)
277
(32.6)%
(12.9)%
15,475
-
(669)
1
(151)
(519)
14,137
12.9%
4.0%
Snacks
(1)
27,485
$
-
$
(669)
$
1
$
(386)
$
(738)
$
25,693
$
12.3%
6.1%
2010
Biscuits
10,775
$
-
$
-
$
-
$
(147)
$
-
$
10,628
$
Confectionery
Chocolate
8,276
11
-
1
(3)
-
8,285
Gum & Candy
4,996
-
-
-
-
-
4,996
Other Confectionery
435
(117)
-
-
-
-
318
13,707
(106)
-
1
(3)
-
13,599
Snacks
(1)
24,482
$
(106)
$
-
$
1
$
(150)
$
-
$
24,227
$
Net Revenues to Organic Net Revenues by Consumer Sector
For the Twelve Months Ended December 31,
($ in millions, except percentages) (Unaudited)
Kraft Foods
% Change
(1)
Snacks is defined as the combination of the Biscuits sector, which includes cookies,
crackers and salted snacks, and the Confectionery sector, which includes
chocolate, gum & candy and other confectionery. (2)
Impact of acquisitions reflects the incremental January 2011 operating results from
our Cadbury acquisition on February 2, 2010. (3)
Includes
the
impacts
of
accounting
calendar
changes
and
the
53
week
of
shipments
in
2011.
rd |
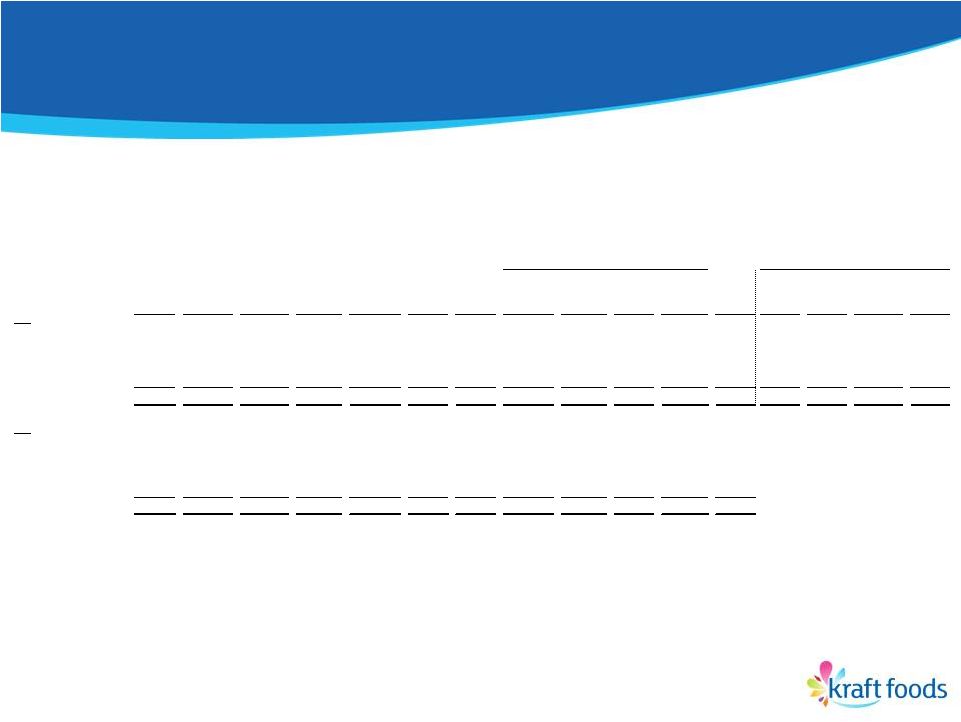
 GAAP to
Non-GAAP Reconciliation 70
(1)
Impact of divestitures includes for reporting purposes Starbucks CPG business.
(2)
Impact of acquisitions reflects the incremental January 2011 operating results from
our Cadbury acquisition on February 2, 2010. (3)
As Reported
(GAAP)
Impact of
Divestitures
(1)
Impact of
Acquisitions
(2)
Impact of
Integration
Program
Impact of
Accounting
Calendar
Changes
(3)
Impact of
Currency
Organic
(Non-GAAP)
As Reported
(GAAP)
Organic
(Non-GAAP)
2011
Kraft Foods North America
25,188
$
(91)
$
(117)
$
-
$
(294)
$
(136)
$
24,550
$
5.1%
4.8%
Kraft Foods Europe
13,356
-
(201)
-
(403)
(632)
12,120
14.9%
4.6%
Kraft Foods Developing Markets
15,821
-
(379)
1
(183)
(397)
14,863
16.2%
11.2%
Kraft Foods
54,365
$
(91)
$
(697)
$
1
$
(880)
$
(1,165)
$
51,533
$
10.5%
6.6%
2010
Kraft Foods North America
23,966
$
(547)
$
-
$
-
$
-
$
-
$
23,419
$
Kraft Foods Europe
11,628
-
-
-
(45)
-
11,583
Kraft Foods Developing Markets
13,613
(105)
-
1
(148)
-
13,361
Kraft Foods
49,207
$
(652)
$
-
$
1
$
(193)
$
-
$
48,363
$
Net Revenues to Organic Net Revenues
For the Twelve Months Ended December 31,
($ in millions, except percentages) (Unaudited)
% Change
Includes
the
impacts
of
accounting
calendar
changes
and
the
53
week
of
shipments
in
2011.
rd |
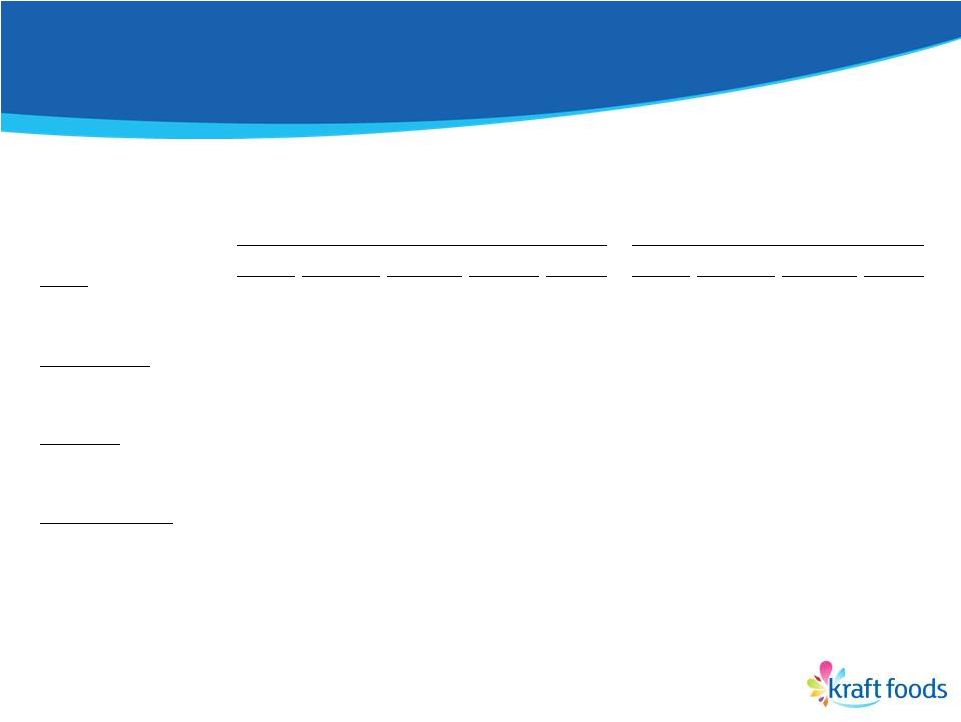
 GAAP to
Non-GAAP Reconciliation 71
As Reported
(GAAP)
Impact of
Divestitures
Impact of
Acquisitions
(1)
Impact of
Integration
Programs
Impact of
Accounting
Calendar
Changes
Impact of
Currency
Organic
(Non-GAAP)
Impact of
Acquisitions -
Cadbury
(1)
Divestitures -
Cadbury's
Poland and
Romania
Operations
(1)
Impact of
Currency -
Cadbury
(1)
Cadbury
Organic
(Non-GAAP)
(1)
Combined
Organic
(Non-GAAP)
As Reported
(GAAP)
Organic
(Non-GAAP)
Cadbury
Organic
(Non-GAAP)
(1)
Combined
Organic
(Non-GAAP)
2010
Kraft Foods North America
23,966
$
(21)
$
(1,498)
$
-
$
-
$
(251)
$
22,196
$
1,498
$
-
$
(35)
$
1,463
$
23,659
$
8.8%
1.1%
0.8%
1.1%
Kraft Foods Europe
11,628
-
(2,892)
-
(51)
267
8,952
2,892
-
91
2,983
11,935
32.6%
2.3%
0.7%
1.9%
Kraft Foods Developing Markets
13,613
-
(4,753)
1
(150)
15
8,726
4,753
(105)
(302)
4,346
13,072
71.1%
9.9%
5.1%
8.2%
Kraft Foods
49,207
$
(21)
$
(9,143)
$
1
$
(201)
$
31
$
39,874
$
9,143
$
(105)
$
(246)
$
8,792
$
48,666
$
27.0%
3.2%
2.9%
3.1%
2009
Kraft Foods North America
22,030
$
(80)
$
-
$
-
$
-
$
-
$
21,950
$
1,452
$
-
$
-
$
1,452
$
23,402
$
Kraft Foods Europe
8,768
(15)
-
-
-
-
8,753
2,961
-
-
2,961
11,714
Kraft Foods Developing Markets
7,956
(14)
-
-
-
-
7,942
4,341
(207)
-
4,134
12,076
Kraft Foods
38,754
$
(109)
$
-
$
-
$
-
$
-
$
38,645
$
8,754
$
(207)
$
-
$
8,547
$
47,192
$
(1)
Kraft Foods acquired Cadbury plc on February 2, 2010. Cadbury data, shown above, is for
February through December 2010 and 2009, adjusted from IFRS to U.S. GAAP and translated to US$ from local countries' currencies.
Net Revenues to Combined Organic Net Revenues
For the Twelve Months Ended December 31,
($ in millions, except percentages) (Unaudited)
Add back:
% Change |
 GAAP to
Non-GAAP Reconciliation 72
As Reported
(GAAP)
Integration
Program Costs
(1)
Acquisition-
Related Costs
(2)
Spin-off Costs
(3)
Underlying
(Non-GAAP)
As Reported
(GAAP)
Integration
Program Costs
(1)
Acquisition-
Related Costs
(2)
Underlying
(Non-GAAP)
Kraft Foods
Operating Income
6,657
$
521
$
-
$
46
$
7,224
$
5,666
$
646
$
273
$
6,585
$
Growth vs. Prior Year
17.5%
9.7%
Operating Income Margin
12.2%
13.3%
11.5%
13.4%
Kraft Foods North America
Segment Operating Income
4,167
$
66
$
-
$
-
$
4,233
$
4,021
$
54
$
7
$
4,082
$
Growth vs. Prior Year
3.6%
3.7%
Segment Operating Income Margin
16.5%
16.8%
16.8%
17.0%
Kraft Foods Europe
Segment Operating Income
1,406
$
256
$
-
$
-
$
1,662
$
1,115
$
256
$
23
$
1,394
$
Growth vs. Prior Year
26.1%
19.2%
Segment Operating Income Margin
10.5%
12.4%
9.6%
12.0%
Kraft Foods Developing Markets
Segment Operating Income
2,053
$
161
$
-
$
-
$
2,214
$
1,577
$
181
$
25
$
1,783
$
Growth vs. Prior Year
30.2%
24.2%
Segment Operating Income Margin
13.0%
14.0%
11.6%
13.1%
(1)
Integration Program costs are defined as the costs associated with combining the Kraft Foods and
Cadbury businesses, and are separate from those costs associated with
the acquisition. (2)
Acquisition-related costs include transaction advisory fees, U.K. stamp taxes and the impact
of the Cadbury inventory revaluation. (3)
Spin-off costs include transaction fees and other costs associated with the proposed
spin-off of the North American grocery business. Operating Income To Underlying Operating
Income For the Twelve Months Ended December 31,
($ in millions, except percentages) (Unaudited)
2011
2010 |
 GAAP to
Non-GAAP Reconciliation 73
2011
As
Reported
(GAAP)
Integration
Program
Costs
(1)
Acquisition-
Related Costs
(2)
and Financing
Fees
(3)
U.S. Health Care
Legislation
Impact on
Deferred Taxes
Spin-off Costs
(4)
Operating
(Non-GAAP)
Currency
Operating
Constant Fx
(Non-GAAP)
As
Reported
EPS Growth
(GAAP)
Operating
EPS Growth
(Non-GAAP)
Operating
Constant
Fx EPS
Growth
(Non-GAAP)
Diluted EPS
-
Continuing operations
1.99
$
0.28
$
-
$
-
$
0.02
$
2.29
$
(0.06)
$
2.23
$
38.2%
13.4%
10.4%
-
Discontinued operations
-
-
Net earnings attributable to Kraft Foods
1.99
$
(16.7)%
2010
Diluted EPS
-
Continuing operations
1.44
$
0.29
$
0.21
$
0.08
$
-
$
2.02
$
-
$
2.02
$
-
Discontinued operations
0.95
-
Net earnings attributable to Kraft Foods
2.39
$
(1)
Integration Program costs are defined as the costs associated with combining the
Kraft Foods and Cadbury businesses, and are separate from those costs
associated with the acquisition. Integration Program costs were $521 million,
or $497 million after-tax including certain tax costs associated with the integration of Cadbury,
for the twelve months ended December 31, 2011, as compared to $657 million, or $497
million after-tax for the twelve months ended December 31, 2010. (2)
Acquisition-related costs include transaction advisory fees, U.K. stamp
taxes and the impact of the Cadbury inventory revaluation. (3)
Acquisition-related financing fees include hedging and foreign currency impacts
associated with the Cadbury acquisition and other fees associated with the
Cadbury bridge facility. (4)
Spin-off costs include transaction fees and other costs associated with the
proposed spin-off of the North American grocery business. Diluted Earnings
per Share to Operating EPS For the Twelve Months Ended December 31,
(Unaudited)
% Growth |
 GAAP to
Non-GAAP Reconciliation 74
As Reported
(GAAP)
Integration
Program
Costs
(1)
Acquisition-
Related Costs
(2)
and Financing
Fees
(3)
U.S. Health Care
Legislation
Impact on
Deferred Taxes
Operating
(Non-GAAP)
As Reported
EPS Growth
(GAAP)
Operating
EPS Growth
(Non-GAAP)
2010
Diluted EPS
- Continuing operations
1.44
$
0.29
$
0.21
$
0.08
$
2.02
$
(23.8)%
4.7%
- Discontinued operations
0.95
- Net earnings attributable to Kraft Foods
2.39
$
17.7%
2009
Diluted EPS
- Continuing operations
1.89
$
-
$
0.04
$
-
$
1.93
$
- Discontinued operations
0.14
- Net earnings attributable to Kraft Foods
2.03
$
(1)
Integration Program costs are defined as the costs associated with combining the Kraft Foods
and Cadbury businesses, and are separate from those costs associated with the
acquisition. (2)
Acquisition-related costs include transaction advisory fees, U.K. stamp taxes and the
impact of the Cadbury inventory revaluation. (3)
Acquisition-related financing fees include hedging and foreign currency impacts associated
with the Cadbury acquisition and other fees associated with the Cadbury bridge
facility. Diluted Earnings per Share to Operating EPS
For the Twelve Months Ended December 31,
(Unaudited)
% Growth |
 GAAP to
Non-GAAP Reconciliation 75
As Reported
(GAAP)
Integration
Program
Costs
(1)
Acquisition-
Related
Costs
(2)
Spin-off
Costs
(3)
Underlying
(Non-GAAP)
Currency
Underlying
Constant Fx
(Non-GAAP)
As Reported
(GAAP)
Integration
Program
Costs
Acquisition-
Related
Costs
(2)
Underlying
(Non-GAAP)
As Reported
(GAAP)
Underlying
(Non-GAAP)
Underlying
Constant Fx
(Non-GAAP)
Kraft Foods
Net Revenues
54,365
$
1
$
-
$
-
$
54,366
$
(1,165)
$
53,201
$
49,207
$
1
$
-
$
49,208
$
Overheads
7,980
$
(405)
$
-
$
(46)
$
7,529
$
(174)
$
7,355
$
7,894
$
(574)
$
(218)
$
7,102
$
1.1%
6.0%
3.6%
Overheads as % of Net Revenues
14.7%
13.8%
13.8%
16.0%
14.4%
(1.3)pp
(0.6)pp
(0.6)pp
Kraft Foods North America
Net Revenues
25,188
$
-
$
-
$
-
$
25,188
$
(136)
$
25,052
$
23,966
$
-
$
-
$
23,966
$
Overheads
2,932
$
(52)
$
-
$
-
$
2,880
$
(14)
$
2,866
$
2,933
$
(51)
$
-
$
2,882
$
-
(0.1%)
(0.6%)
Overheads as % of Net Revenues
11.6%
11.4%
11.4%
12.2%
12.0%
(0.6)pp
(0.6)pp
(0.6)pp
Kraft Foods Europe
Net Revenues
13,356
$
-
$
-
$
-
$
13,356
$
(632)
$
12,724
$
11,628
$
-
$
-
$
11,628
$
Overheads
2,072
$
(170)
$
-
$
-
$
1,902
$
(93)
$
1,809
$
2,031
$
(209)
$
-
$
1,822
$
2.0%
4.4%
(0.7%)
Overheads as % of Net Revenues
15.5%
14.2%
14.2%
17.5%
15.7%
(2.0)pp
(1.5)pp
(1.5)pp
Kraft Foods Developing Markets
Net Revenues
15,821
$
1
$
-
$
-
$
15,822
$
(397)
$
15,425
$
13,613
$
1
$
-
$
13,614
$
Overheads
2,476
$
(145)
$
-
$
-
$
2,331
$
(65)
$
2,266
$
2,187
$
(158)
$
-
$
2,029
$
13.2%
14.9%
11.7%
Overheads as % of Net Revenues
15.7%
14.7%
14.7%
16.1%
14.9%
(0.4)pp
(0.2)pp
(0.2)pp
(1)
Integration Program costs are defined as the costs associated with combining the
Kraft Foods and Cadbury businesses, and are separate from those costs associated with the acquisition.
(2)
Acquisition-related costs include transaction advisory fees, U.K. stamp taxes
and the impact of the Cadbury inventory revaluation. (3)
Spin-off costs include transaction fees and other costs associated with the
proposed spin-off of the North American grocery business. Overheads
For the Twelve Months Ended December 31,
($
in
millions,
except
percentages)
(Unaudited)
2011
2010
Increase/(Decrease)
(1) |
 GAAP to
Non-GAAP Reconciliation 76
2007
2008
2009
2010
2011
Net Cash Provided by Operating Activities (GAAP)
3.6
$
4.1
$
5.1
$
3.7
$
4.5
$
Capital Expenditures
(1.2)
(1.4)
(1.3)
(1.7)
(1.8)
Free Cash Flow (Non-GAAP)
(1)
2.3
$
2.8
$
3.8
$
2.1
$
2.7
$
Taxes Paid on Frozen Pizza Business Divestiture
-
-
-
1.2
-
Voluntary Pension Contributions
-
-
0.4
-
0.5
Adjusted Free Cash Flow (Non-GAAP)
2.3
$
2.8
$
4.2
$
3.3
$
3.2
$
(1)
May not add due to rounding
Net Cash Provided by Operating Activities to Adjusted Free Cash Flow
For the Twelve Months Ended December 31,
($ in billions) (Unaudited) |