Attached files
| file | filename |
|---|---|
| 8-K - 8-K - HMS HOLDINGS CORP | a12-5342_18k.htm |
| EX-99.1 - EX-99.1 - HMS HOLDINGS CORP | a12-5342_1ex99d1.htm |
Exhibit 99.2
|
|
Q4 2011 Investor Call February 17, 2012 Bill Lucia, President and CEO Walter Hosp, EVP and CFO Contact: Christine Saenz csaenz@hms.com 212.857.5986 |
|
|
Safe Harbor Statement This presentation contains “forward-looking statements” within the meaning of the U.S. Private Securities Litigation Reform Act of 1995. Such statements give our expectations or forecasts of future events; they do not relate strictly to historical or current facts. Forward-looking statements can be identified by words such as “anticipates,” “estimates,” “expects,” “projects,” “intends,” “plans,” “believes,” “will,” “target,” “seeks,” “forecast” and similar expressions and references to guidance. In particular, these include statements relating to future actions, business plans, objects and prospects, and future operating or financial performance. Forward-looking statements are based on our current expectations and assumptions regarding our business, the economy and other future conditions. Should known or unknown risks or uncertainties materialize, or should underlying assumptions prove inaccurate, actual results could differ materially from past results and those anticipated, estimated or projected. We caution you therefore against relying on any of these forward-looking statements. Factors that could cause or contribute to such differences include, but are not limited to: our ability to successfully integrate HDI’s operations; the development by competitors of new or superior services or products or the entry into the market of new competitors; all the risks inherent in the development, introduction, and implementation of new products and services; the loss of a major customer, compliance with the covenants and obligations under the terms of our new credit facility, our ability to generate sufficient cash to cover our interest and principal payments under our new credit facility, customer dissatisfaction or early termination of customer contracts triggering significant costs or liabilities; variations in our results of operations; negative results of government reviews, audits or investigations to verify our compliance with contracts and applicable laws and regulations; changing conditions in the healthcare industry which could simplify the reimbursement process and reduce the need for and price of our services; government regulatory, political and budgetary pressures that could affect the procurement practices and operations of healthcare organizations, reducing the demand for our services; our failure to comply with laws and regulations governing health data or to protect such data from theft and misuse. A further description of risks, uncertainties, and other matters can be found in the Company’s Annual Report on Form 10-K for the fiscal year ended December 31, 2010 and our most recently filed Quarterly Report on Form 10-Q for the quarterly period ended September 30, 2011, copies which may be obtained from the Company’s website at www.hms.com under the “Investor Relations” tab. Any forward-looking statements made by us in this presentation speak only as of the date of this presentation. Factors or events that could cause actual results to differ may emerge from time to time and it is not possible for us to predict all of them. We undertake no obligation to publicly update forward-looking statements, whether as a result of new information, future events or otherwise, except as may be required by law. 2 |
|
|
Discussion Outline Q4 and Full Year 2011 Financial Performance Guidance New Business Medicaid RAC HDI Update Q&A 3 |
|
|
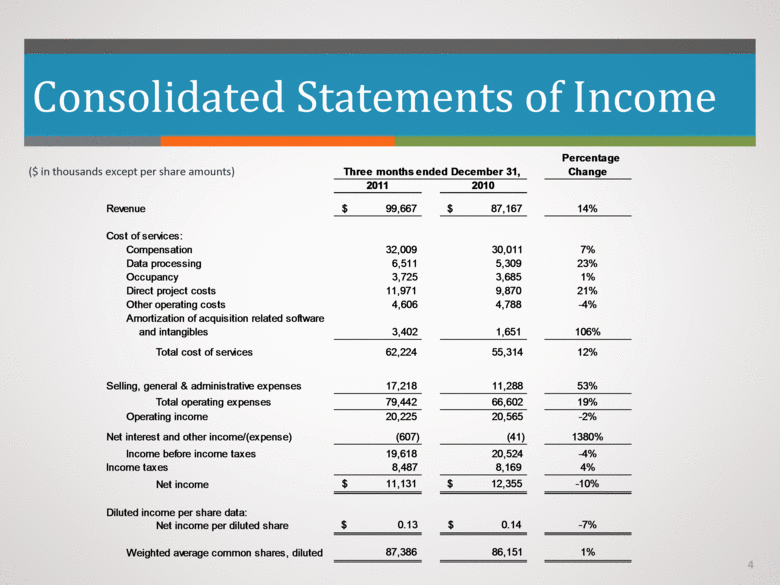
Consolidated Statements of Income ($ in thousands except per share amounts) 4 Percentage ($ in thousands except per share amounts) Three months ended December 31, Change 2011 2010 Revenue $ 99,667 $ 87,167 14% Cost of services: Compensation 32,009 30,011 7% Data processing 6,511 5,309 23% Occupancy 3,725 3,685 1% Direct project costs 11,971 9,870 21% Other operating costs 4,606 4,788 -4% Amortization of acquisition related software and intangibles 3,402 1,651 106% Total cost of services 62,224 55,314 12% Selling, general & administrative expenses 17,218 11,288 53% Total operating expenses 79,442 66,602 19% Operating income 20,225 20,565 -2% Net interest and other income/(expense) (607) (41) 1380% Income before income taxes 19,618 20,524 -4% Income taxes 8,487 8,169 4% Net income $ 11,131 $ 12,355 -10% Diluted income per share data: Net income per diluted share $ 0.13 $ 0.14 -7% Weighted average common shares, diluted 87,386 86,151 1% |
|
|
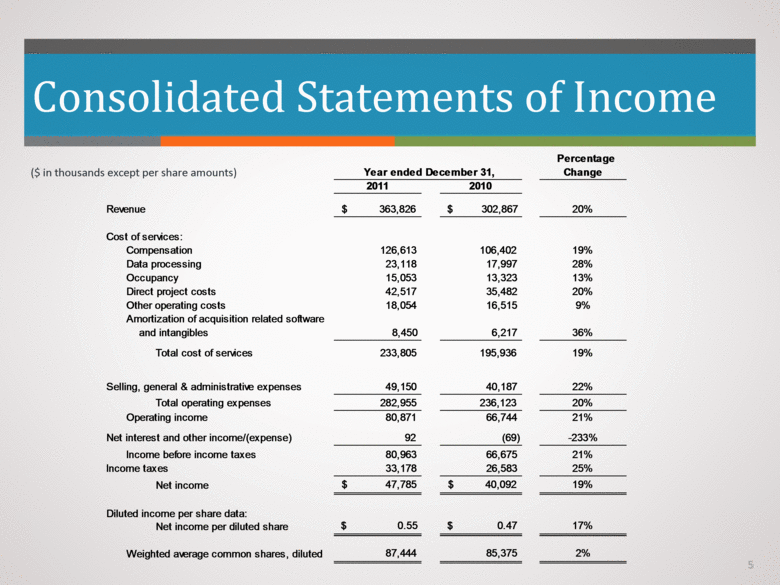
Consolidated Statements of Income 5 ($ in thousands except per share amounts) Year ended December 31, Change 2011 2010 Revenue $ 363,826 $ 302,867 20% Cost of services: Compensation 126,613 106,402 19% Data processing 23,118 17,997 28% Occupancy 15,053 13,323 13% Direct project costs 42,517 35,482 20% Other operating costs 18,054 16,515 9% Amortization of acquisition related software and intangibles 8,450 6,217 36% Total cost of services 233,805 195,936 19% Selling, general & administrative expenses 49,150 40,187 22% Total operating expenses 282,955 236,123 20% Operating income 80,871 66,744 21% Net interest and other income/(expense) 92 (69) -233% Income before income taxes 80,963 66,675 21% Income taxes 33,178 26,583 25% Net income $ 47,785 $ 40,092 19% Diluted income per share data: Net income per diluted share $ 0.55 $ 0.47 17% Weighted average common shares, diluted 87,444 85,375 2% |
|
|
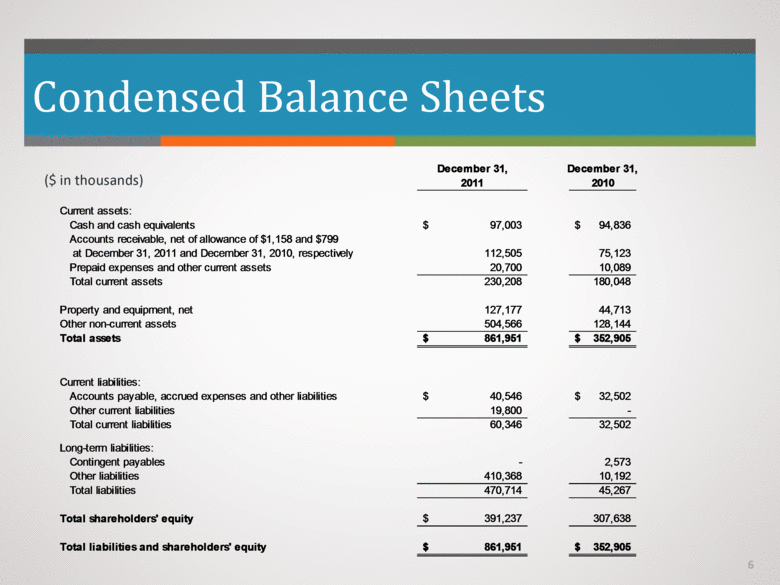
Condensed Balance Sheets 6 December 31, December 31, ($ in thousands) 2011 2010 Current assets: Cash and cash equivalents $ 97,003 $ 94,836 Accounts receivable, net of allowance of $1,158 and $799 at December 31, 2011 and December 31, 2010, respectively 112,505 75,123 Prepaid expenses and other current assets 20,700 10,089 Total current assets 230,208 180,048 Property and equipment, net 127,177 44,713 Other non-current assets 504,566 128,144 Total assets $ 861,951 $ 352,905 Current liabilities: Accounts payable, accrued expenses and other liabilities $ 40,546 $ 32,502 Other current liabilities 19,800 - Total current liabilities 60,346 32,502 Long-term liabilities: Contingent payables - 2,573 Other liabilities 410,368 10,192 Total liabilities 470,714 45,267 Total shareholders' equity $ 391,237 307,638 Total liabilities and shareholders' equity $ 861,951 $ 352,905 |
|
|
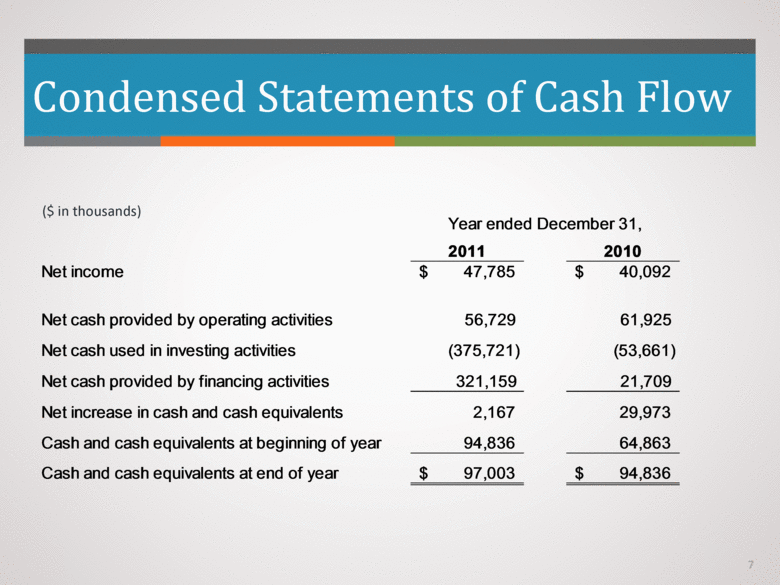
Condensed Statements of Cash Flow 7 ($ in thousands) Year ended December 31, 2011 2010 Net income $ 47,785 $ 40,092 Net cash provided by operating activities 56,729 61,925 Net cash used in investing activities (375,721) (53,661) Net cash provided by financing activities 321,159 21,709 Net increase in cash and cash equivalents 2,167 29,973 Cash and cash equivalents at beginning of year 94,836 64,863 Cash and cash equivalents at end of year $ 97,003 $ 94,836 |
|
|
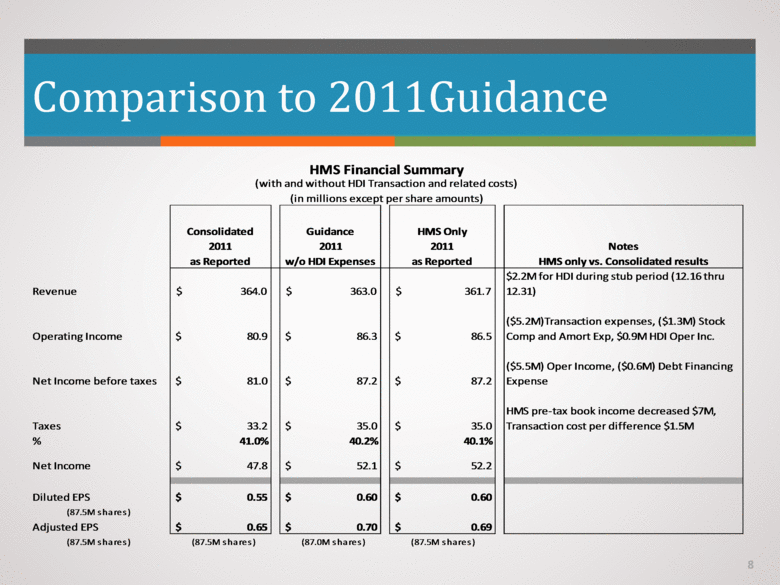
Comparison to 2011Guidance 8 HMS Financial Summary (with and without HDI Transaction and related costs) (in millions except per share amounts) Consolidated Guidance HMS Only 2011 2011 2011 Notes as Reported w/o HDI Expenses as Reported HMS only vs. Consolidated results $2.2M for HDI during stub period (12.16 thru Revenue $ 364.0 $ 363.0 $ 361.7 12.31) ($5.2M)Transaction expenses, ($1.3M) Stock Operating Income $ 80.9 $ 86.3 $ 86.5 Comp and Amort Exp, $0.9M HDI Oper Inc. ($5.5M) Oper Income, ($0.6M) Debt Financing Net Income before taxes $ 81.0 $ 87.2 $ 87.2 Expense HMS pre-tax book income decreased $7M, Taxes $ 33.2 $ 35.0 $ 35.0 Transaction cost per difference $1.5M % 41.0% 40.2% 40.1% Net Income $ 47.8 $ 52.1 $ 52.2 Diluted EPS $ 0.55 $ 0.60 $ 0.60 (87.5M shares) Adjusted EPS $ 0.65 $ 0.70 $ 0.69 (87.5M shares) (87.5M shares) (87.0M shares) (87.5M shares) |
|
|
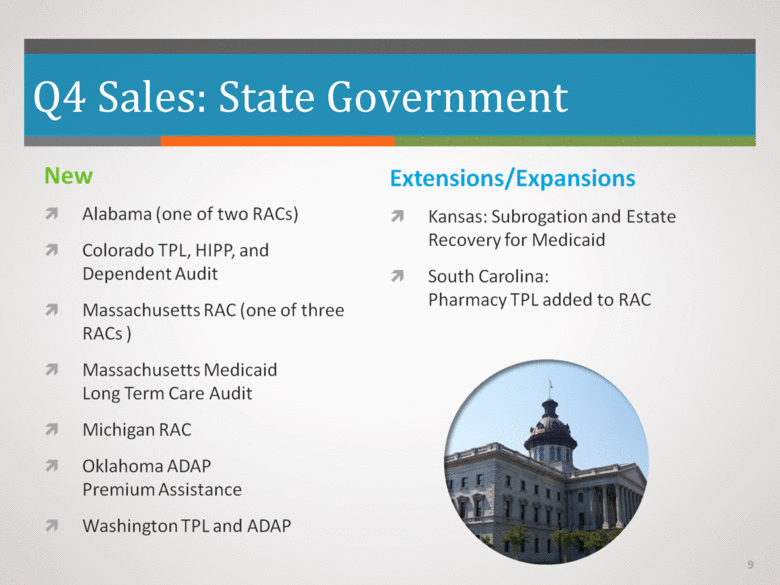
Q4 Sales: State Government 9 New Alabama (one of two RACs) Colorado TPL, HIPP, and Dependent Audit Massachusetts RAC (one of three RACs) Massachusetts Medicaid Long Term Care Audit Michigan RAC Oklahoma ADAP Premium Assistance Washington TPL and ADAP Extensions/ Expansions Kansas: Subrogation and Estate Recovery for Medicaid South Carolina: Pharmacy TPL added to RAC |
|
|
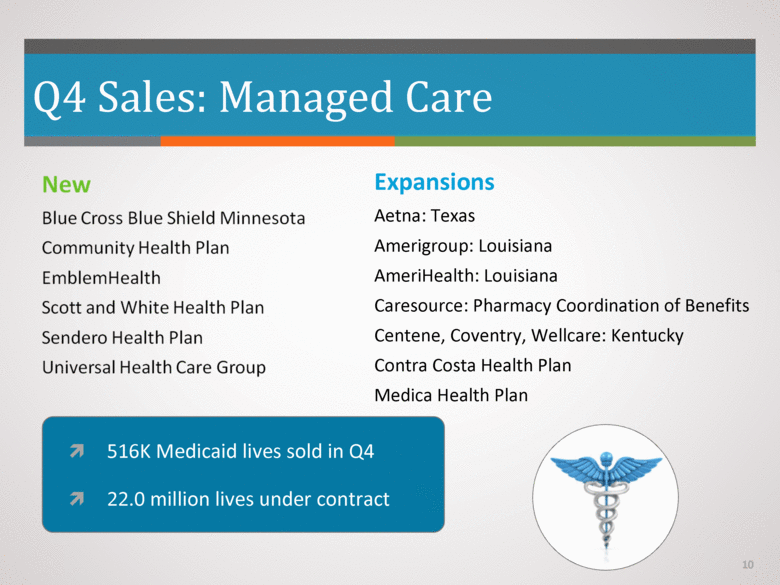
Q4 Sales: Managed Care 516K Medicaid lives sold in Q4 22.0 million lives under contract 10 New Blue Cross Blue Shield Minnesota Community Health Plan EmblemHealth Scott and White Health Plan Sendero Health Plan Universal Health Care Group Expansions Aetna: Texas Amerigroup: Louisiana AmeriHealth: Louisiana Caresource: Pharmacy Coordination of Benefits Centene, Coventry, Wellcare: Kentucky Contra Costa Health Plan Medica Health Plan |
|
|
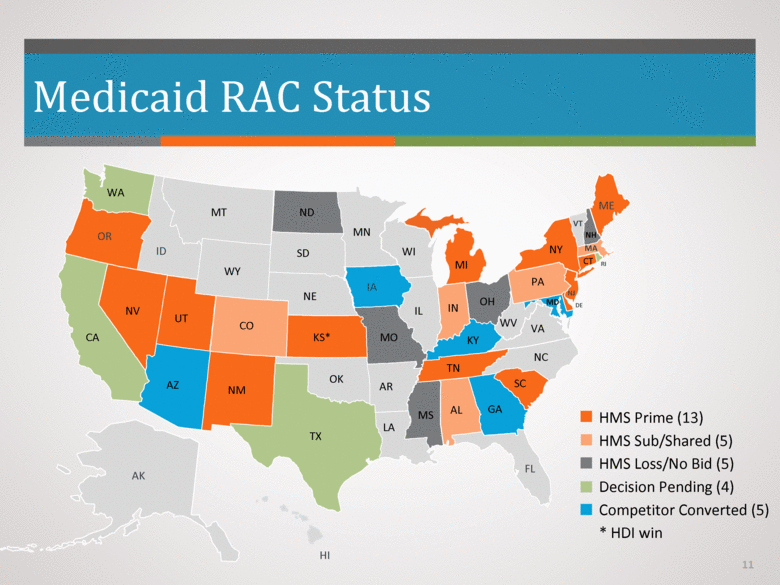
Medicaid RAC Status WA OR CA AK HI TX NM AZ NV ID MT WY ND SD NE CO UT KS* MO MN IA IL AR OK LA MS AL TN KY IN MI OH GA FL VA NC SC WV PA NY WI ME VT NH CT NJ RI MD DE MA HMS Prime (13) HMS Sub/Shared (5) HMS Loss/No Bid (5) Decision Pending (4) Competitor Converted (5) * HDI win 11 |
|
|
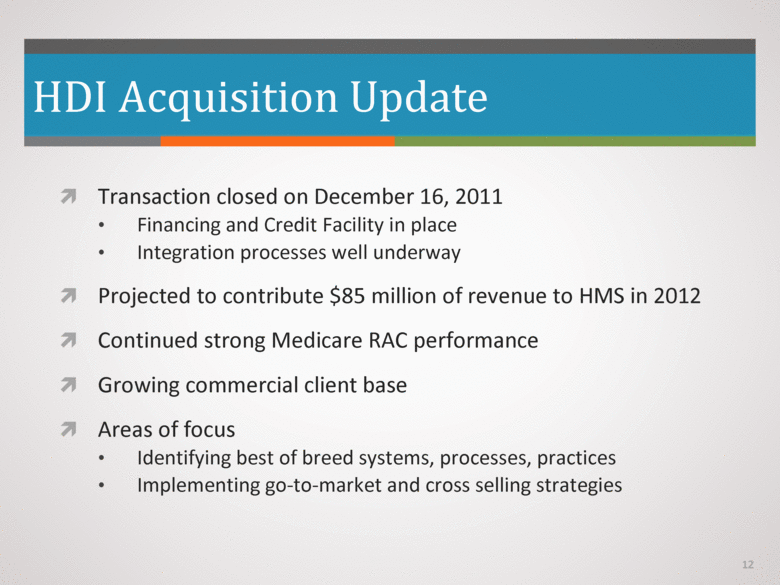
HDI Acquisition Update Transaction closed on December 16, 2011 Financing and Credit Facility in place Integration processes well underway Projected to contribute $85 million of revenue to HMS in 2012 Continued strong Medicare RAC performance Growing commercial client base Areas of focus Identifying best of breed systems, processes, practices Implementing go-to-market and cross selling strategies 12 |
|
|
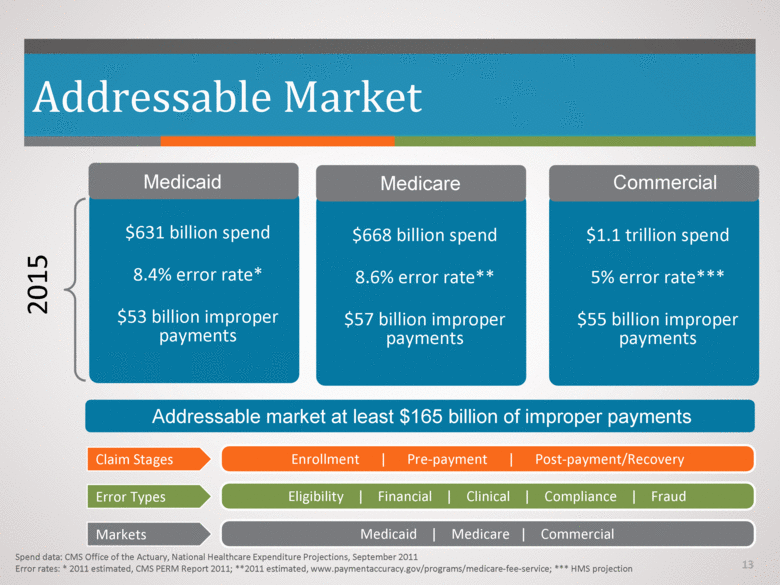
Addressable Market Addressable market at least $165 billion of improper payments $668 billion spend 8.6% error rate** $57 billion improper payments Medicare $631 billion spend 8.4% error rate* $53 billion improper payments Medicaid $1.1 trillion spend 5% error rate*** $55 billion improper payments Medicare Spend data: CMS Office of the Actuary, National Healthcare Expenditure Projections, September 2011 Error rates: * 2011 estimated, CMS PERM Report 2011; **2011 estimated, www.paymentaccuracy.gov/programs/medicare-fee-service; *** HMS projection Commercial 13 Claim Stages Eligibility Financial Clinical Compliance Fraud Error Types Medicaid Medicare Commercial Markets 2015 Enrollment Pre-payment Post-payment/Recovery |
|
|
Summary Solid 2011 performance and promising 2012 outlook Evolving Medicaid RAC program Transformational HDI acquisition Large and growing addressable market 14 |
|
|
[LOGO] |

