Attached files
| file | filename |
|---|---|
| 8-K - 8-K - WELLTOWER INC. | d300790d8k.htm |
| EX-99.1 - EX-99.1 - WELLTOWER INC. | d300790dex991.htm |
Exhibit 99.2
4Q11 Supplemental Information HEALTHCARE REIT
Table of Contents
Overview | 2 Portfolio | 3 Investment | 13 Financial | 16 Glossary | 21
Supplemental Reporting Measures | 23
Forward Looking Statements and Risk Factors | 24
Overview
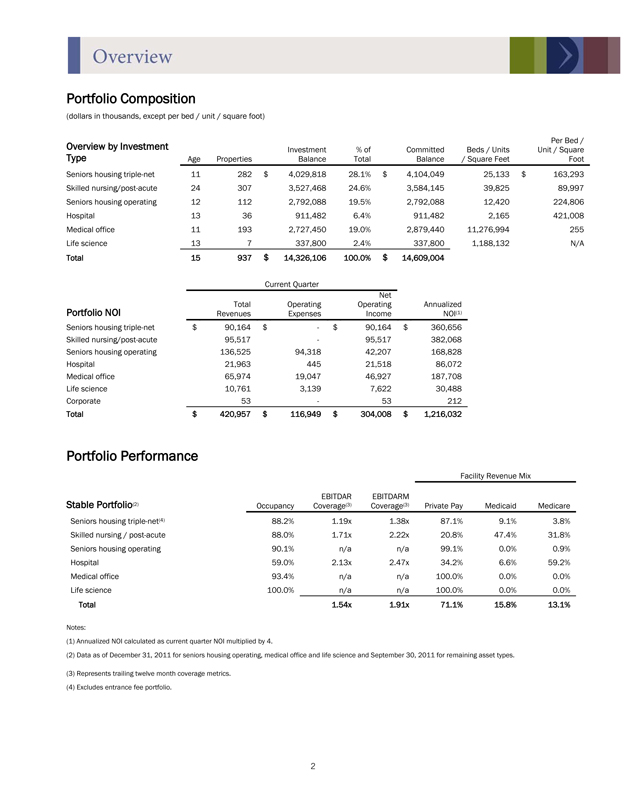
Portfolio Composition
(dollars in thousands, except per bed / unit / square foot)
Per Bed /
Overview by Investment Investment% of Committed Beds / Units Unit / Square
Type Age Properties Balance Total Balance / Square Feet Foot
Seniors housing triple-net 11 282 $ 4,029,818 28.1% $ 4,104,049 25,133 $ 163,293
Skilled nursing/post-acute 24 307 3,527,468 24.6% 3,584,145 39,825 89,997
Seniors housing operating 12 112 2,792,088 19.5% 2,792,088 12,420 224,806
Hospital 13 36 911,482 6.4% 911,482 2,165 421,008
Medical office 11 193 2,727,450 19.0% 2,879,440 11,276,994 255
Life science 13 7 337,800 2.4% 337,800 1,188,132 N/A
Total 15 937 $ 14,326,106 100.0% $ 14,609,004
Current Quarter
Net
Total Operating Operating Annualized
Portfolio NOI Revenues Expenses Income NOI(1)
Seniors housing triple-net $ 90,164 $—$ 90,164 $ 360,656
Skilled nursing/post-acute 95,517—95,517 382,068
Seniors housing operating 136,525 94,318 42,207 168,828
Hospital 21,963 445 21,518 86,072
Medical office 65,974 19,047 46,927 187,708
Life science 10,761 3,139 7,622 30,488
Corporate 53—53 212
Total $ 420,957 $ 116,949 $ 304,008 $ 1,216,032
Portfolio Performance
Facility Revenue Mix
EBITDAR EBITDARM
Stable Portfolio(2) Occupancy Coverage(3) Coverage(3) Private Pay Medicaid Medicare
Seniors housing triple-net(4) 88.2% 1.19x 1.38x 87.1% 9.1% 3.8%
Skilled nursing / post-acute 88.0% 1.71x 2.22x 20.8% 47.4% 31.8%
Seniors housing operating 90.1% n/a n/a 99.1% 0.0% 0.9%
Hospital 59.0% 2.13x 2.47x 34.2% 6.6% 59.2%
Medical office 93.4% n/a n/a 100.0% 0.0% 0.0%
Life science 100.0% n/a n/a 100.0% 0.0% 0.0%
Total 1.54x 1.91x 71.1% 15.8% 13.1%
Notes:
(1) Annualized NOI calculated as current quarter NOI multiplied by 4.
(2) Data as of December 31, 2011 for seniors housing operating, medical office and life science and September 30, 2011 for remaining asset types.
(3) Represents trailing twelve month coverage metrics. (4) Excludes entrance fee portfolio.
2
Portfolio
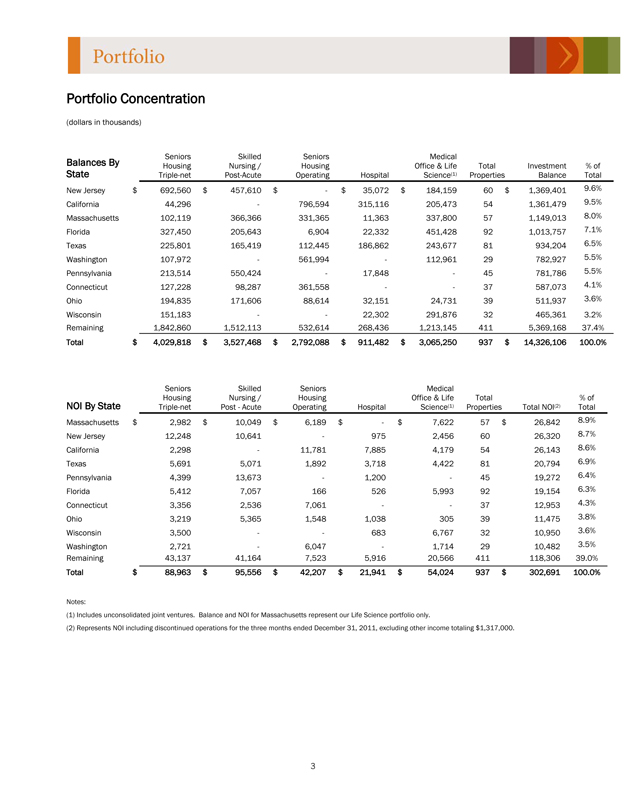
Portfolio Concentration
(dollars in thousands)
Seniors Skilled Seniors Medical
Balances By Housing Nursing / Housing Office & Life Total Investment% of
State Triple-net Post-Acute Operating Hospital Science(1) Properties Balance Total
New Jersey $ 692,560 $ 457,610 $—$ 35,072 $ 184,159 60 $ 1,369,401 9.6%
California 44,296—796,594 315,116 205,473 54 1,361,479 9.5%
Massachusetts 102,119 366,366 331,365 11,363 337,800 57 1,149,013 8.0%
Florida 327,450 205,643 6,904 22,332 451,428 92 1,013,757 7.1%
Texas 225,801 165,419 112,445 186,862 243,677 81 934,204 6.5%
Washington 107,972—561,994—112,961 29 782,927 5.5%
Pennsylvania 213,514 550,424—17,848—45 781,786 5.5%
Connecticut 127,228 98,287 361,558—- 37 587,073 4.1%
Ohio 194,835 171,606 88,614 32,151 24,731 39 511,937 3.6%
Wisconsin 151,183—- 22,302 291,876 32 465,361 3.2%
Remaining 1,842,860 1,512,113 532,614 268,436 1,213,145 411 5,369,168 37.4%
Total $ 4,029,818 $ 3,527,468 $ 2,792,088 $ 911,482 $ 3,065,250 937 $ 14,326,106 100.0%
Seniors Skilled Seniors Medical
Housing Nursing / Housing Office & Life Total% of
NOI By State Triple-net Post—Acute Operating Hospital Science(1) Properties Total NOI(2) Total
Massachusetts $ 2,982 $ 10,049 $ 6,189 $—$ 7,622 57 $ 26,842 8.9%
New Jersey 12,248 10,641—975 2,456 60 26,320 8.7%
California 2,298—11,781 7,885 4,179 54 26,143 8.6%
Texas 5,691 5,071 1,892 3,718 4,422 81 20,794 6.9%
Pennsylvania 4,399 13,673—1,200—45 19,272 6.4%
Florida 5,412 7,057 166 526 5,993 92 19,154 6.3%
Connecticut 3,356 2,536 7,061—- 37 12,953 4.3%
Ohio 3,219 5,365 1,548 1,038 305 39 11,475 3.8%
Wisconsin 3,500—- 683 6,767 32 10,950 3.6%
Washington 2,721—6,047—1,714 29 10,482 3.5%
Remaining 43,137 41,164 7,523 5,916 20,566 411 118,306 39.0%
Total $ 88,963 $ 95,556 $ 42,207 $ 21,941 $ 54,024 937 $ 302,691 100.0%
Notes: (1) Includes unconsolidated joint ventures. Balance and NOI for Massachusetts represent our Life Science portfolio only.
(2) Represents NOI including discontinued operations for the three months ended December 31, 2011, excluding other income totaling $1,317,000.
3
Portfolio
Top Ten Customer Descriptions
Genesis HealthCare, LLC, located in Kennett Square, PA, is a privately held company that operates 231 eldercare facilities, consisting of 206 skilled nursing facilities and 25 assisted living facilities, with approximately 28,300 beds across 13 New England and Middle Atlantic states. Genesis also provides third-party rehabilitation services to nearly 900 healthcare providers. As of December 31, 2011, the HCN portfolio consisted of 150 facilities in 11 states with an investment balance of $2.5 billion.
Merrill Gardens LLC, located in Seattle, WA, is a privately held company that operates and/or manages 56 independent and assisted living facilities with over 6,000 units in nine states. As of December 31, 2011, the HCN portfolio consisted of 48 facilities in eight states with an investment balance of $1.1 billion.
Benchmark Senior Living, LLC, located in Wellesley, MA, is a privately held company that operates 46 facilities with approximately 4,000 residents across the Northeast. The company currently operates independent living, assisted living, and dementia care facilities that focus on low to moderate acuity. As of December 31, 2011, the HCN portfolio consisted of 35 facilities in six states with an investment balance of $883.7 million.
Brandywine Senior Living, LLC, located in Mount Laurel, NJ, is a privately held company that operates 29 seniors housing facilities with over 2,200 units in five states. As of December 31, 2011, the HCN portfolio consisted of 24 facilities in five states with an investment balance of $719.5 million.
Senior Living Communities, LLC, located in Charlotte, NC, is a privately held company that operates premier continuing care retirement communities (CCRCs) throughout the southeastern United States. The company operates 12 facilities in five states. As of December 31, 2011, the HCN portfolio consisted of 12 facilities in five states with an investment balance of $604.1 million.
Senior Star Living, located in Tulsa, OK, is a private operator of CCRCs and independent living, assisted living and dementia care facilities that operates 12 facilities in six states. As of December 31, 2011, the HCN portfolio consisted of 10 facilities in six states with an investment balance of $456.7 million.
Brookdale Senior Living, Inc. (NYSE:BKD), located in Chicago, IL, is a publicly traded company that provides independent living and assisted living services. The company operates 647 facilities in 33 states with the ability to serve approximately 67,000 residents. As of December 31, 2011, the HCN portfolio consisted of 74 facilities in 16 states with an investment balance of $318.0 million.
Chelsea Senior Living, located in Fanwood, NJ, is a privately held company that operates 14 seniors housing facilities throughout New Jersey, New York, and Pennsylvania. As of December 31, 2011, the HCN portfolio consisted of ten facilities in two states with an investment balance of $305.0 million.
Capital Senior Living Corp., (NYSE:CSU) located in Dallas, TX, is a publicly traded company that owns, operates, develops and manages seniors living communities throughout the United States. The company operates 81 seniors living communities in 23 states with an aggregate capacity of approximately 11,500 residents. As of December 31, 2011, the HCN portfolio consisted of 24 facilities in seven states with an investment balance of $292.9 million.
Aurora Health Care, Inc., located in Milwaukee, WI, is a non-profit operator of over 250 hospitals, pharmacies and clinics in eastern Wisconsin. Aurora is investment grade rated and is the largest health care system in the state. As of December 31, 2011, the HCN portfolio consisted of 18 facilities with an investment balance of $291.9 million.
4
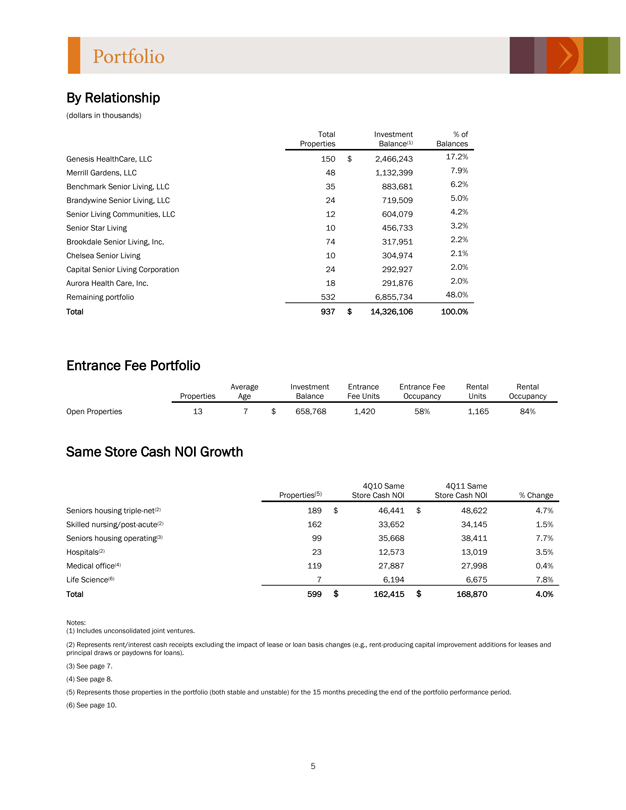
By Relationship
(dollars in thousands)
Total Investment% of
Properties Balance(1) Balances
Genesis HealthCare, LLC 150 $ 2,466,243 17.2%
Merrill Gardens, LLC 48 1,132,399 7.9%
Benchmark Senior Living, LLC 35 883,681 6.2%
Brandywine Senior Living, LLC 24 719,509 5.0%
Senior Living Communities, LLC 12 604,079 4.2%
Senior Star Living 10 456,733 3.2%
Brookdale Senior Living, Inc. 74 317,951 2.2%
Chelsea Senior Living 10 304,974 2.1%
Capital Senior Living Corporation 24 292,927 2.0%
Aurora Health Care, Inc. 18 291,876 2.0%
Remaining portfolio 532 6,855,734 48.0%
Total 937 $ 14,326,106 100.0%
Entrance Fee Portfolio
Average Investment Entrance Entrance Fee Rental Rental
Properties Age Balance Fee Units Occupancy Units Occupancy
Open Properties 13 7 $ 658,768 1,420 58% 1,165 84%
Same Store Cash NOI Growth
4Q10 Same 4Q11 Same
Properties(5) Store Cash NOI Store Cash NOI% Change
Seniors housing triple-net(2) 189 $ 46,441 $ 48,622 4.7%
Skilled nursing/post-acute(2) 162 33,652 34,145 1.5%
Seniors housing operating(3) 99 35,668 38,411 7.7%
Hospitals(2) 23 12,573 13,019 3.5%
Medical office(4) 119 27,887 27,998 0.4%
Life Science(6) 7 6,194 6,675 7.8%
Total 599 $ 162,415 $ 168,870 4.0%
Notes: (1) Includes unconsolidated joint ventures.
(2) Represents rent/interest cash receipts excluding the impact of lease or loan basis changes (e.g., rent-producing capital improvement additions for leases and principal draws or paydowns for loans).
(3) See page 7. (4) See page 8.
(5) Represents those properties in the portfolio (both stable and unstable) for the 15 months preceding the end of the portfolio performance period. (6) See page 10.
5
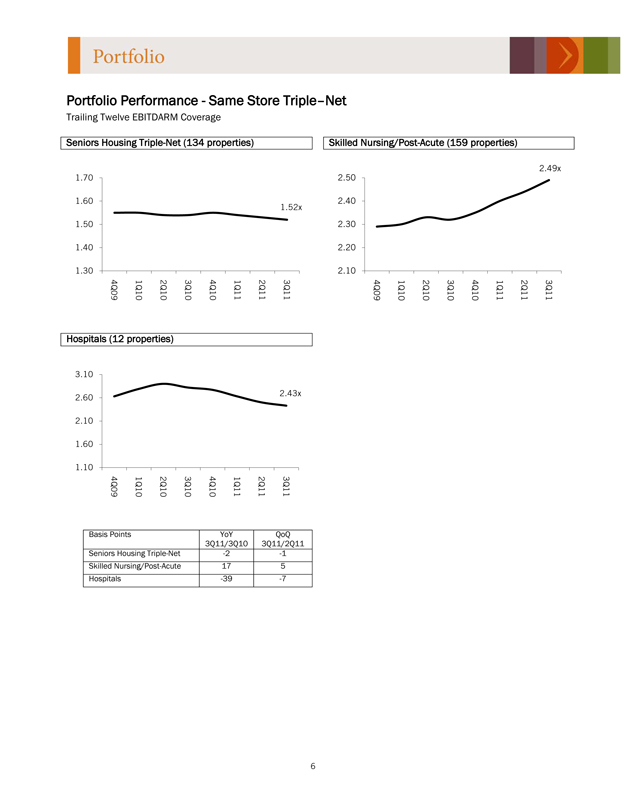
Portfolio Performance—Same Store Triple–Net
Trailing Twelve EBITDARM Coverage
Seniors Housing Triple-Net (134 properties) Skilled Nursing/Post-Acute (159 properties)
2.49x
1.70 2.50
1.60 2.40
1.52x
1.50 2.30
1.40 2.20
1.30 2.10
4Q09 1Q10 2Q10 3Q10 4Q10 1Q11 2Q11 3Q11 4Q09 1Q10 2Q10 3Q10 4Q10 1Q11 2Q11 3Q11
Hospitals (12 properties)
3.10
2.43x
2.60
2.10
1.60
1.10
4Q09 1Q10 2Q10 3Q10 4Q10 1Q11 2Q11 3Q11
Basis Points YoY QoQ 3Q11/3Q10 3Q11/2Q11 Seniors Housing Triple-Net -2 -1 Skilled Nursing/Post-Acute 17 5 Hospitals -39 -7
6
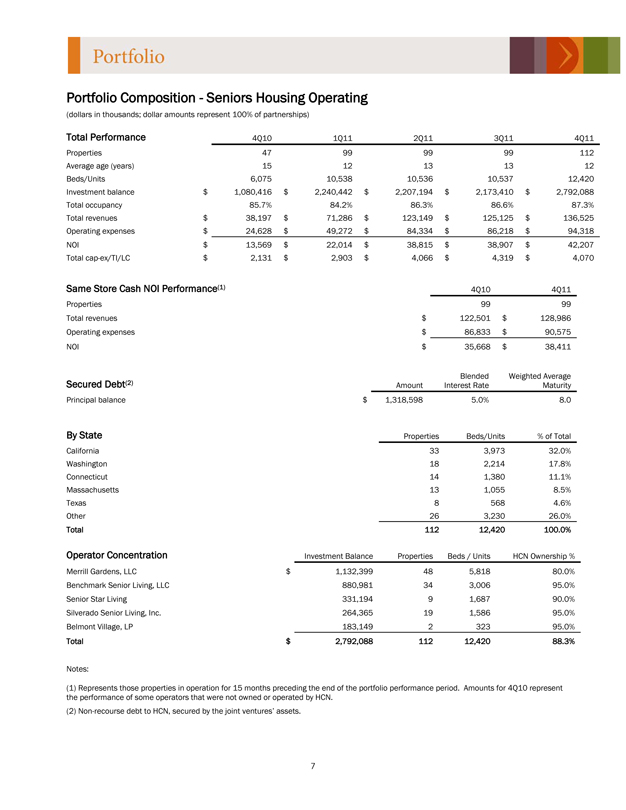
Portfolio Composition—Seniors Housing Operating
(dollars in thousands; dollar amounts represent 100% of partnerships)
Total Performance 4Q10 1Q11 2Q11 3Q11 4Q11
Properties 47 99 99 99 112
Average age (years) 15 12 13 13 12
Beds/Units 6,075 10,538 10,536 10,537 12,420
Investment balance $ 1,080,416 $ 2,240,442 $ 2,207,194 $ 2,173,410 $ 2,792,088
Total occupancy 85.7% 84.2% 86.3% 86.6% 87.3%
Total revenues $ 38,197 $ 71,286 $ 123,149 $ 125,125 $ 136,525
Operating expenses $ 24,628 $ 49,272 $ 84,334 $ 86,218 $ 94,318
NOI $ 13,569 $ 22,014 $ 38,815 $ 38,907 $ 42,207
Total cap-ex/TI/LC $ 2,131 $ 2,903 $ 4,066 $ 4,319 $ 4,070
Same Store Cash NOI Performance(1) 4Q10 4Q11
Properties 99 99
Total revenues $ 122,501 $ 128,986
Operating expenses $ 86,833 $ 90,575
NOI $ 35,668 $ 38,411
Blended Weighted Average
Secured Debt(2) Amount Interest Rate Maturity
Principal balance $ 1,318,598 5.0% 8.0
By State Properties Beds/Units% of Total
California 33 3,973 32.0%
Washington 18 2,214 17.8%
Connecticut 14 1,380 11.1%
Massachusetts 13 1,055 8.5%
Texas 8 568 4.6%
Other 26 3,230 26.0%
Total 112 12,420 100.0%
Operator Concentration Investment Balance Properties Beds / Units HCN Ownership %
Merrill Gardens, LLC $ 1,132,399 48 5,818 80.0%
Benchmark Senior Living, LLC 880,981 34 3,006 95.0%
Senior Star Living 331,194 9 1,687 90.0%
Silverado Senior Living, Inc. 264,365 19 1,586 95.0%
Belmont Village, LP 183,149 2 323 95.0%
Total $ 2,792,088 112 12,420 88.3%
Notes:
(1) Represents those properties in operation for 15 months preceding the end of the portfolio performance period. Amounts for 4Q10 represent the performance of some operators that were not owned or operated by HCN.
(2) Non-recourse debt to HCN, secured by the joint ventures’ assets.
7
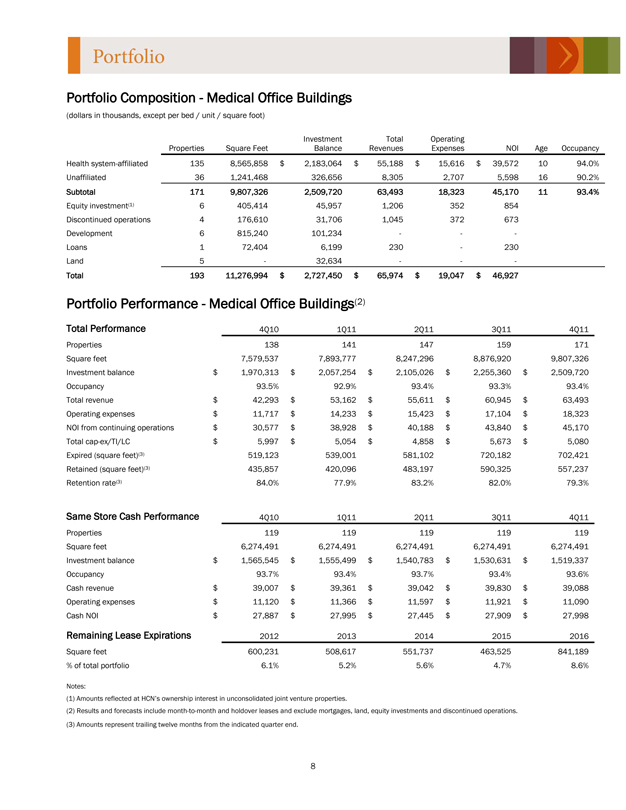
Portfolio Composition—Medical Office Buildings
(dollars in thousands, except per bed / unit / square foot)
Investment Total Operating
Properties Square Feet Balance Revenues Expenses NOI Age Occupancy
Health system-affiliated 135 8,565,858 $ 2,183,064 $ 55,188 $ 15,616 $ 39,572 10 94.0%
Unaffiliated 36 1,241,468 326,656 8,305 2,707 5,598 16 90.2%
Subtotal 171 9,807,326 2,509,720 63,493 18,323 45,170 11 93.4%
Equity investment(1) 6 405,414 45,957 1,206 352 854
Discontinued operations 4 176,610 31,706 1,045 372 673
Development 6 815,240 101,234——
Loans 1 72,404 6,199 230—230
Land 5—32,634——
Total 193 11,276,994 $ 2,727,450 $ 65,974 $ 19,047 $ 46,927
Portfolio Performance—Medical Office Buildings(2)
Total Performance 4Q10 1Q11 2Q11 3Q11 4Q11
Properties 138 141 147 159 171
Square feet 7,579,537 7,893,777 8,247,296 8,876,920 9,807,326
Investment balance $ 1,970,313 $ 2,057,254 $ 2,105,026 $ 2,255,360 $ 2,509,720
Occupancy 93.5% 92.9% 93.4% 93.3% 93.4%
Total revenue $ 42,293 $ 53,162 $ 55,611 $ 60,945 $ 63,493
Operating expenses $ 11,717 $ 14,233 $ 15,423 $ 17,104 $ 18,323
NOI from continuing operations $ 30,577 $ 38,928 $ 40,188 $ 43,840 $ 45,170
Total cap-ex/TI/LC $ 5,997 $ 5,054 $ 4,858 $ 5,673 $ 5,080
Expired (square feet)(3) 519,123 539,001 581,102 720,182 702,421
Retained (square feet)(3) 435,857 420,096 483,197 590,325 557,237
Retention rate(3) 84.0% 77.9% 83.2% 82.0% 79.3%
Same Store Cash Performance 4Q10 1Q11 2Q11 3Q11 4Q11
Properties 119 119 119 119 119
Square feet 6,274,491 6,274,491 6,274,491 6,274,491 6,274,491
Investment balance $ 1,565,545 $ 1,555,499 $ 1,540,783 $ 1,530,631 $ 1,519,337
Occupancy 93.7% 93.4% 93.7% 93.4% 93.6%
Cash revenue $ 39,007 $ 39,361 $ 39,042 $ 39,830 $ 39,088
Operating expenses $ 11,120 $ 11,366 $ 11,597 $ 11,921 $ 11,090
Cash NOI $ 27,887 $ 27,995 $ 27,445 $ 27,909 $ 27,998
Remaining Lease Expirations 2012 2013 2014 2015 2016
Square feet 600,231 508,617 551,737 463,525 841,189
% of total portfolio 6.1% 5.2% 5.6% 4.7% 8.6%
Notes: (1) Amounts reflected at HCN’s ownership interest in unconsolidated joint venture properties.
(2) Results and forecasts include month-to-month and holdover leases and exclude mortgages, land, equity investments and discontinued operations. (3) Amounts represent trailing twelve months from the indicated quarter end.
8
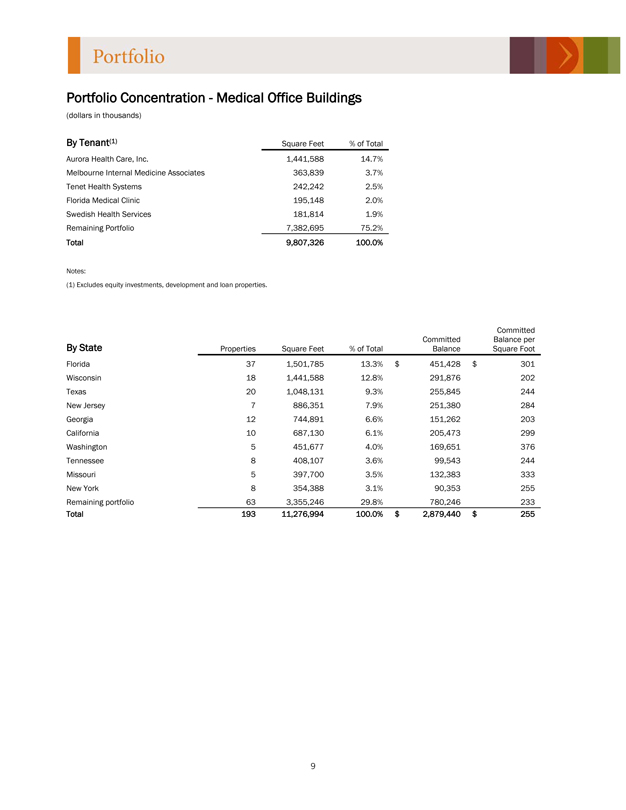
Portfolio Concentration—Medical Office Buildings
(dollars in thousands)
By Tenant(1) Square Feet% of Total
Aurora Health Care, Inc. 1,441,588 14.7%
Melbourne Internal Medicine Associates 363,839 3.7%
Tenet Health Systems 242,242 2.5%
Florida Medical Clinic 195,148 2.0%
Swedish Health Services 181,814 1.9%
Remaining Portfolio 7,382,695 75.2%
Total 9,807,326 100.0%
Notes:
(1) Excludes equity investments, development and loan properties.
Committed
Committed Balance per
By State Properties Square Feet% of Total Balance Square Foot
Florida 37 1,501,785 13.3% $ 451,428 $ 301
Wisconsin 18 1,441,588 12.8% 291,876 202
Texas 20 1,048,131 9.3% 255,845 244
New Jersey 7 886,351 7.9% 251,380 284
Georgia 12 744,891 6.6% 151,262 203
California 10 687,130 6.1% 205,473 299
Washington 5 451,677 4.0% 169,651 376
Tennessee 8 408,107 3.6% 99,543 244
Missouri 5 397,700 3.5% 132,383 333
New York 8 354,388 3.1% 90,353 255
Remaining portfolio 63 3,355,246 29.8% 780,246 233
Total 193 11,276,994 100.0% $ 2,879,440 $ 255
9
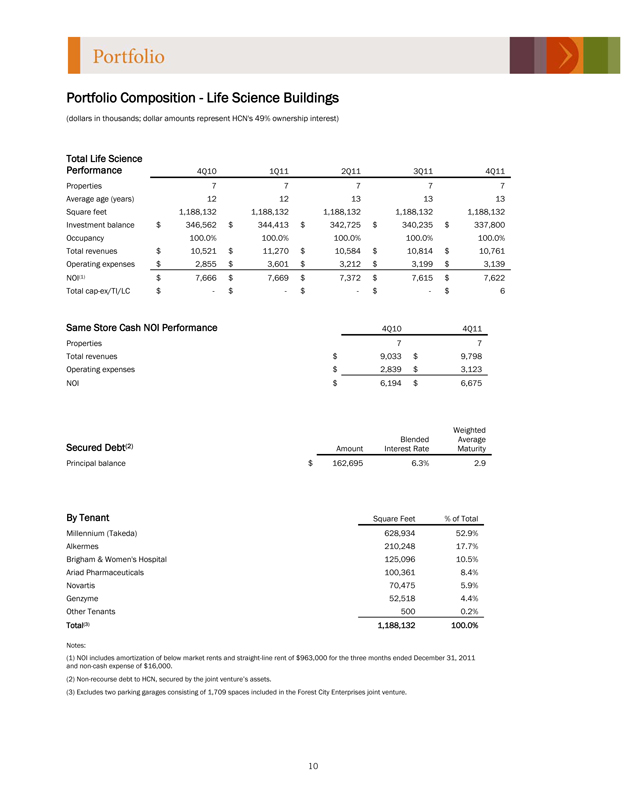
Portfolio Composition—Life Science Buildings
(dollars in thousands; dollar amounts represent HCN’s 49% ownership interest)
Total Life Science
Performance 4Q10 1Q11 2Q11 3Q11 4Q11
Properties 7 7 7 7 7
Average age (years) 12 12 13 13 13
Square feet 1,188,132 1,188,132 1,188,132 1,188,132 1,188,132
Investment balance $ 346,562 $ 344,413 $ 342,725 $ 340,235 $ 337,800
Occupancy 100.0% 100.0% 100.0% 100.0% 100.0%
Total revenues $ 10,521 $ 11,270 $ 10,584 $ 10,814 $ 10,761
Operating expenses $ 2,855 $ 3,601 $ 3,212 $ 3,199 $ 3,139
NOI(1) $ 7,666 $ 7,669 $ 7,372 $ 7,615 $ 7,622
Total cap-ex/TI/LC $—$—$—$—$ 6
Same Store Cash NOI Performance 4Q10 4Q11
Properties 7 7
Total revenues $ 9,033 $ 9,798
Operating expenses $ 2,839 $ 3,123
NOI $ 6,194 $ 6,675
Weighted
Blended Average
Secured Debt(2) Amount Interest Rate Maturity
Principal balance $ 162,695 6.3% 2.9
By Tenant Square Feet% of Total
Millennium (Takeda) 628,934 52.9%
Alkermes 210,248 17.7%
Brigham & Women’s Hospital 125,096 10.5%
Ariad Pharmaceuticals 100,361 8.4%
Novartis 70,475 5.9%
Genzyme 52,518 4.4%
Other Tenants 500 0.2%
Total(3) 1,188,132 100.0%
Notes:
(1) NOI includes amortization of below market rents and straight-line rent of $963,000 for the three months ended December 31, 2011
and non-cash expense of $16,000.
(2) Non-recourse debt to HCN, secured by the joint venture’s assets.
(3) Excludes two parking garages consisting of 1,709 spaces included in the Forest City Enterprises joint venture.
10
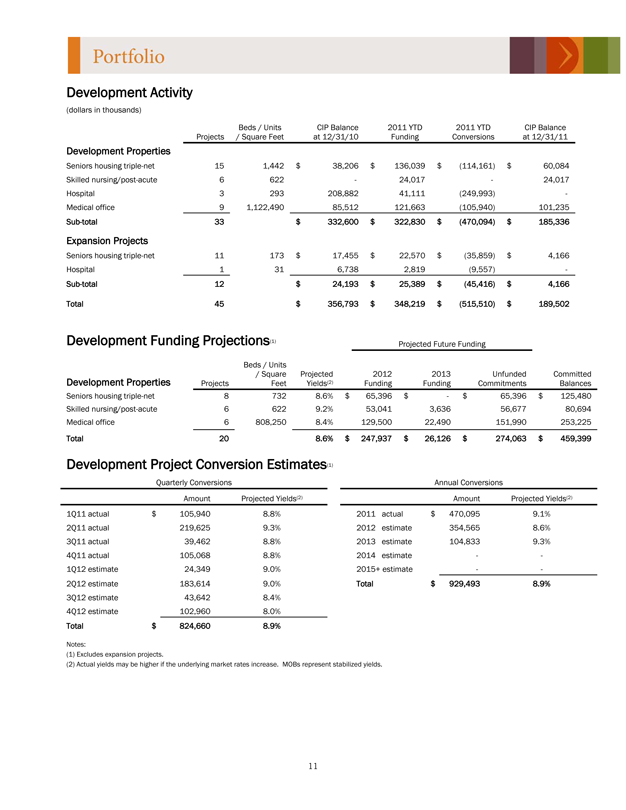
Development Activity
(dollars in thousands)
Beds / Units CIP Balance 2011 YTD 2011 YTD CIP Balance
Projects / Square Feet at 12/31/10 Funding Conversions at 12/31/11
Development Properties
Seniors housing triple-net 15 1,442 $ 38,206 $ 136,039 $(114,161) $ 60,084
Skilled nursing/post-acute 6 622—24,017—24,017
Hospital 3 293 208,882 41,111(249,993) -
Medical office 9 1,122,490 85,512 121,663(105,940) 101,235
Sub-total 33 $ 332,600 $ 322,830 $(470,094) $ 185,336
Expansion Projects
Seniors housing triple-net 11 173 $ 17,455 $ 22,570 $(35,859) $ 4,166
Hospital 1 31 6,738 2,819(9,557) -
Sub-total 12 $ 24,193 $ 25,389 $(45,416) $ 4,166
Total 45 $ 356,793 $ 348,219 $(515,510) $ 189,502
Development Funding Projections(1) Projected Future Funding
Beds / Units
/ Square Projected 2012 2013 Unfunded Committed
Development Properties Projects Feet Yields(2) Funding Funding Commitments Balances
Seniors housing triple-net 8 732 8.6% $ 65,396 $—$ 65,396 $ 125,480
Skilled nursing/post-acute 6 622 9.2% 53,041 3,636 56,677 80,694
Medical office 6 808,250 8.4% 129,500 22,490 151,990 253,225
Total 20 8.6% $ 247,937 $ 26,126 $ 274,063 $ 459,399
Development Project Conversion Estimates(1)
Quarterly Conversions Annual Conversions
Amount Projected Yields(2) Amount Projected Yields(2)
1Q11 actual $ 105,940 8.8% 2011 actual $ 470,095 9.1%
2Q11 actual 219,625 9.3% 2012 estimate 354,565 8.6%
3Q11 actual 39,462 8.8% 2013 estimate 104,833 9.3%
4Q11 actual 105,068 8.8% 2014 estimate—-
1Q12 estimate 24,349 9.0% 2015+ estimate—-
2Q12 estimate 183,614 9.0% Total $ 929,493 8.9%
3Q12 estimate 43,642 8.4%
4Q12 estimate 102,960 8.0%
Total $ 824,660 8.9%
Notes:
(1) Excludes expansion projects.
(2) Actual yields may be higher if the underlying market rates increase. MOBs represent stabilized yields.
11
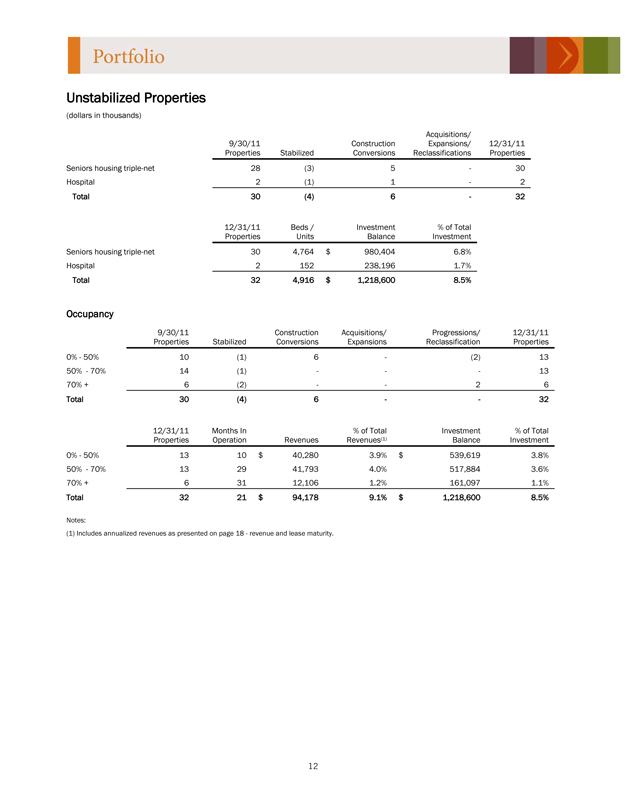
Unstabilized Properties
(dollars in thousands)
Acquisitions/
9/30/11 Construction Expansions/ 12/31/11
Properties Stabilized Conversions Reclassifications Properties
Seniors housing triple-net 28(3) 5—30
Hospital 2(1) 1—2
Total 30(4) 6—32
12/31/11 Beds / Investment% of Total
Properties Units Balance Investment
Seniors housing triple-net 30 4,764 $ 980,404 6.8%
Hospital 2 152 238,196 1.7%
Total 32 4,916 $ 1,218,600 8.5%
Occupancy
9/30/11 Construction Acquisitions/ Progressions/ 12/31/11
Properties Stabilized Conversions Expansions Reclassification Properties
0%—50% 10(1) 6 -(2) 13
50%—70% 14(1)—— 13
70% + 6(2)—- 2 6
Total 30(4) 6—- 32
12/31/11 Months In% of Total Investment% of Total
Properties Operation Revenues Revenues(1) Balance Investment
0%—50% 13 10 $ 40,280 3.9% $ 539,619 3.8%
50%—70% 13 29 41,793 4.0% 517,884 3.6%
70% + 6 31 12,106 1.2% 161,097 1.1%
Total 32 21 $ 94,178 9.1% $ 1,218,600 8.5%
Notes:
(1) Includes annualized revenues as presented on page 18—revenue and lease maturity. 12
12
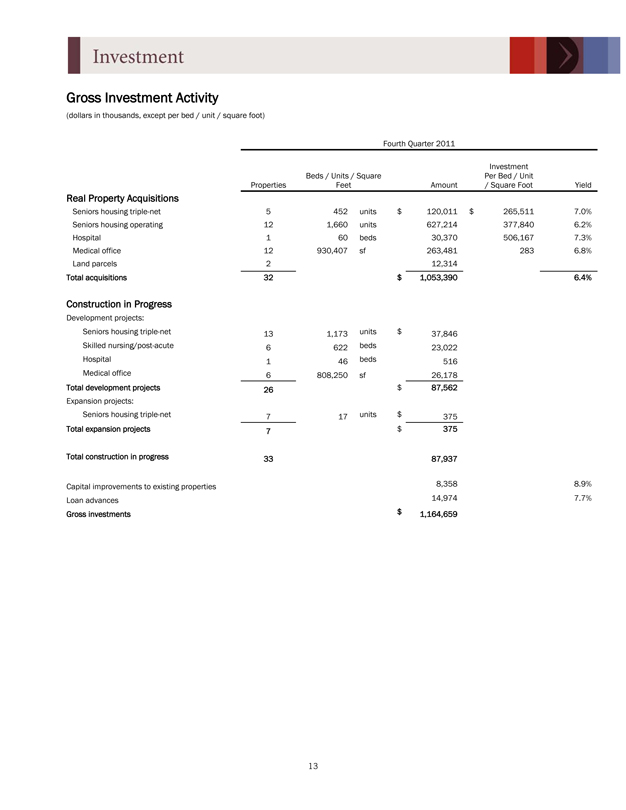
Gross Investment Activity
(dollars in thousands, except per bed / unit / square foot)
Fourth Quarter 2011
Investment
Beds / Units / Square Per Bed / Unit
Properties Feet Amount / Square Foot Yield
Real Property Acquisitions
Seniors housing triple-net 5 452 units $ 120,011 $ 265,511 7.0%
Seniors housing operating 12 1,660 units 627,214 377,840 6.2%
Hospital 1 60 beds 30,370 506,167 7.3%
Medical office 12 930,407 sf 263,481 283 6.8%
Land parcels 2 12,314
Total acquisitions 32 $ 1,053,390 6.4%
Construction in Progress
Development projects:
Seniors housing triple-net 13 1,173 units $ 37,846
Skilled nursing/post-acute 6 622 beds 23,022
Hospital 1 46 beds 516
Medical office 6 808,250 sf 26,178
Total development projects 26 $ 87,562
Expansion projects:
Seniors housing triple-net 7 17 units $ 375
Total expansion projects 7 $ 375
Total construction in progress 33 87,937
Capital improvements to existing properties 8,358 8.9%
Loan advances 14,974 7.7%
Gross investments $ 1,164,659
13
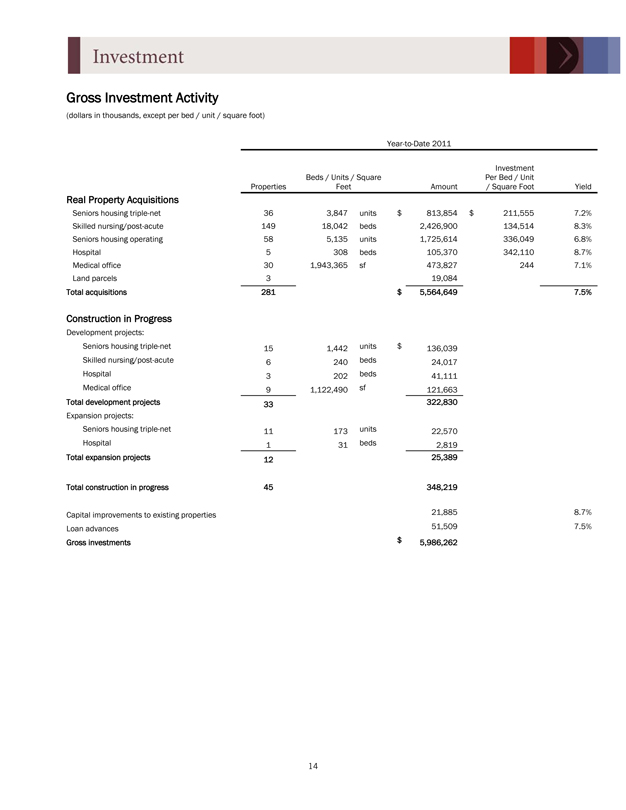
Gross Investment Activity
(dollars in thousands, except per bed / unit / square foot)
Year-to-Date 2011
Investment
Beds / Units / Square Per Bed / Unit
Properties Feet Amount / Square Foot Yield
Real Property Acquisitions
Seniors housing triple-net 36 3,847 units $ 813,854 $ 211,555 7.2%
Skilled nursing/post-acute 149 18,042 beds 2,426,900 134,514 8.3%
Seniors housing operating 58 5,135 units 1,725,614 336,049 6.8%
Hospital 5 308 beds 105,370 342,110 8.7%
Medical office 30 1,943,365 sf 473,827 244 7.1%
Land parcels 3 19,084
Total acquisitions 281 $ 5,564,649 7.5%
Construction in Progress
Development projects:
Seniors housing triple-net 15 1,442 units $ 136,039
Skilled nursing/post-acute 6 240 beds 24,017
Hospital 3 202 beds 41,111
Medical office 9 1,122,490 sf 121,663
Total development projects 33 322,830
Expansion projects:
Seniors housing triple-net 11 173 units 22,570
Hospital 1 31 beds 2,819
Total expansion projects 12 25,389
Total construction in progress 45 348,219
Capital improvements to existing properties 21,885 8.7%
Loan advances 51,509 7.5%
Gross investments $ 5,986,262
14
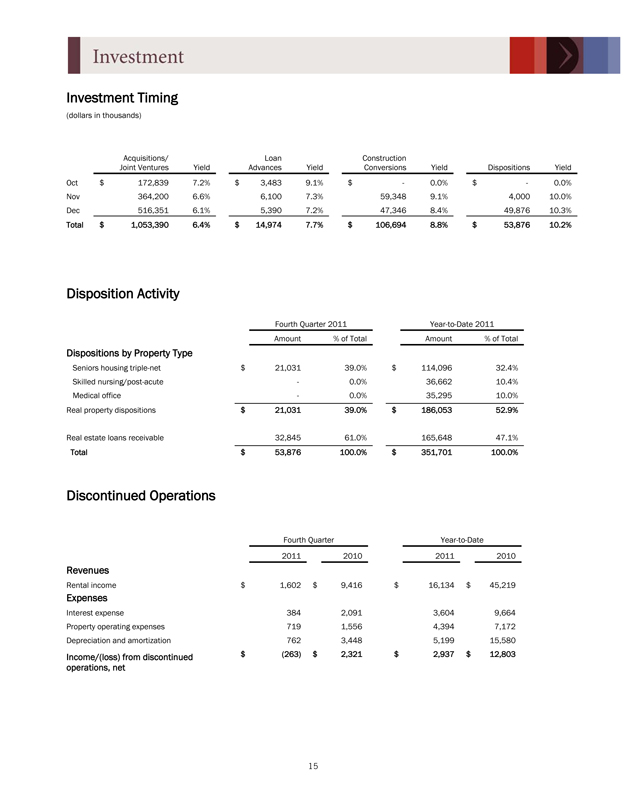
Investment Timing
(dollars in thousands)
Acquisitions/ Loan Construction
Joint Ventures Yield Advances Yield Conversions Yield Dispositions Yield
Oct $ 172,839 7.2% $ 3,483 9.1% $—0.0% $—0.0%
Nov 364,200 6.6% 6,100 7.3% 59,348 9.1% 4,000 10.0%
Dec 516,351 6.1% 5,390 7.2% 47,346 8.4% 49,876 10.3%
Total $ 1,053,390 6.4% $ 14,974 7.7% $ 106,694 8.8% $ 53,876 10.2%
Disposition Activity
Fourth Quarter 2011 Year-to-Date 2011
Amount% of Total Amount% of Total
Dispositions by Property Type
Seniors housing triple-net $ 21,031 39.0% $ 114,096 32.4%
Skilled nursing/post-acute—0.0% 36,662 10.4%
Medical office—0.0% 35,295 10.0%
Real property dispositions $ 21,031 39.0% $ 186,053 52.9%
Real estate loans receivable 32,845 61.0% 165,648 47.1%
Total $ 53,876 100.0% $ 351,701 100.0%
Discontinued Operations
Fourth Quarter Year-to-Date
2011 2010 2011 2010
Revenues
Rental income $ 1,602 $ 9,416 $ 16,134 $ 45,219
Expenses
Interest expense 384 2,091 3,604 9,664
Property operating expenses 719 1,556 4,394 7,172
Depreciation and amortization 762 3,448 5,199 15,580
Income/(loss) from discontinued $(263) $ 2,321 $ 2,937 $ 12,803
operations, net
15
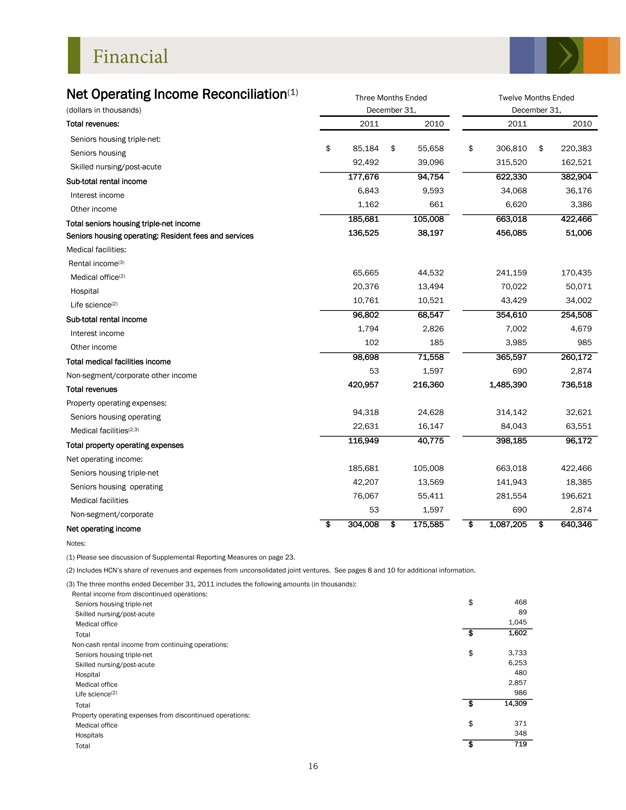
Net Operating Income Reconciliation(1) Three Months Ended Twelve Months Ended
(dollars in thousands) December 31, December 31,
Total revenues: 2011 2010 2011 2010
Seniors housing triple-net:
Seniors housing $ 85,184 $ 55,658 $ 306,810 $ 220,383
Skilled nursing/post-acute 92,492 39,096 315,520 162,521
Sub-total rental income 177,676 94,754 622,330 382,904
Interest income 6,843 9,593 34,068 36,176
Other income 1,162 661 6,620 3,386
Total seniors housing triple-net income 185,681 105,008 663,018 422,466
Seniors housing operating: Resident fees and services 136,525 38,197 456,085 51,006
Medical facilities:
Rental income(3)
Medical office(2) 65,665 44,532 241,159 170,435
Hospital 20,376 13,494 70,022 50,071
Life science(2) 10,761 10,521 43,429 34,002
Sub-total rental income 96,802 68,547 354,610 254,508
Interest income 1,794 2,826 7,002 4,679
Other income 102 185 3,985 985
Total medical facilities income 98,698 71,558 365,597 260,172
Non-segment/corporate other income 53 1,597 690 2,874
Total revenues 420,957 216,360 1,485,390 736,518
Property operating expenses:
Seniors housing operating 94,318 24,628 314,142 32,621
Medical facilities(2,3) 22,631 16,147 84,043 63,551
Total property operating expenses 116,949 40,775 398,185 96,172
Net operating income:
Seniors housing triple-net 185,681 105,008 663,018 422,466
Seniors housing operating 42,207 13,569 141,943 18,385
Medical facilities 76,067 55,411 281,554 196,621
Non-segment/corporate 53 1,597 690 2,874
Net operating income $ 304,008 $ 175,585 $ 1,087,205 $ 640,346
Notes:
(1) Please see discussion of Supplemental Reporting Measures on page 23.
(2) Includes HCN’s share of revenues and expenses from unconsolidated joint ventures. See pages 8 and 10 for additional information.
(3) The three months ended December 31, 2011 includes the following amounts (in thousands):
Rental income from discontinued operations:
Seniors housing triple-net $ 468
Skilled nursing/post-acute 89
Medical office 1,045
Total $ 1,602
Non -cash rental income from continuing operations:
Seniors housing triple-net $ 3,733
Skilled nursing/post-acute 6,253
Hospital 480
Medical office 2,857
Life science(2) 986
Total $ 14,309
Property operating expenses from discontinued operations:
Medical office $ 371
Hospitals 348
Total $ 719
16
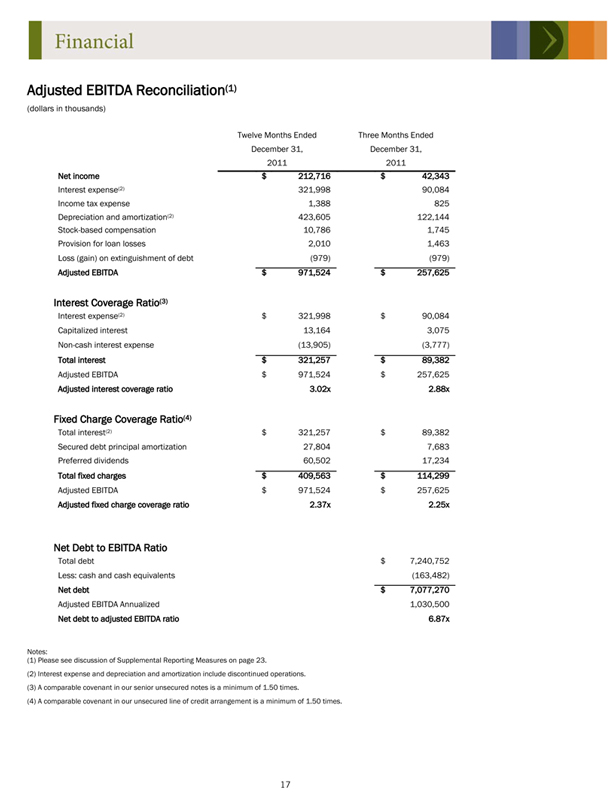
Adjusted EBITDA Reconciliation(1)
(dollars in thousands)
Twelve Months Ended Three Months Ended
December 31, December 31,
2011 2011
Net income $ 212,716 $ 42,343
Interest expense(2) 321,998 90,084
Income tax expense 1,388 825
Depreciation and amortization(2) 423,605 122,144
Stock-based compensation 10,786 1,745
Provision for loan losses 2,010 1,463
Loss (gain) on extinguishment of debt (979) (979)
Adjusted EBITDA $ 971,524 $ 257,625
Interest Coverage Ratio(3)
Interest expense(2) $ 321,998 $ 90,084
Capitalized interest 13,164 3,075
Non-cash interest expense (13,905) (3,777)
Total interest $ 321,257 $ 89,382
Adjusted EBITDA $ 971,524 $ 257,625
Adjusted interest coverage ratio 3.02x 2.88x
Fixed Charge Coverage Ratio(4)
Total interest(2) $ 321,257 $ 89,382
Secured debt principal amortization 27,804 7,683
Preferred dividends 60,502 17,234
Total fixed charges $ 409,563 $ 114,299
Adjusted EBITDA $ 971,524 $ 257,625
Adjusted fixed charge coverage ratio 2.37x 2.25x
Net Debt to EBITDA Ratio
Total debt $ 7,240,752
Less: cash and cash equivalents (163,482)
Net debt $ 7,077,270
Adjusted EBITDA Annualized 1,030,500
Net debt to adjusted EBITDA ratio 6.87x
Notes:
(1) Please see discussion of Supplemental Reporting Measures on page 23.
(2) Interest expense and depreciation and amortization include discontinued operations.
(3) A comparable covenant in our senior unsecured notes is a minimum of 1.50 times.
(4) A comparable covenant in our unsecured line of credit arrangement is a minimum of 1.50 times.
17
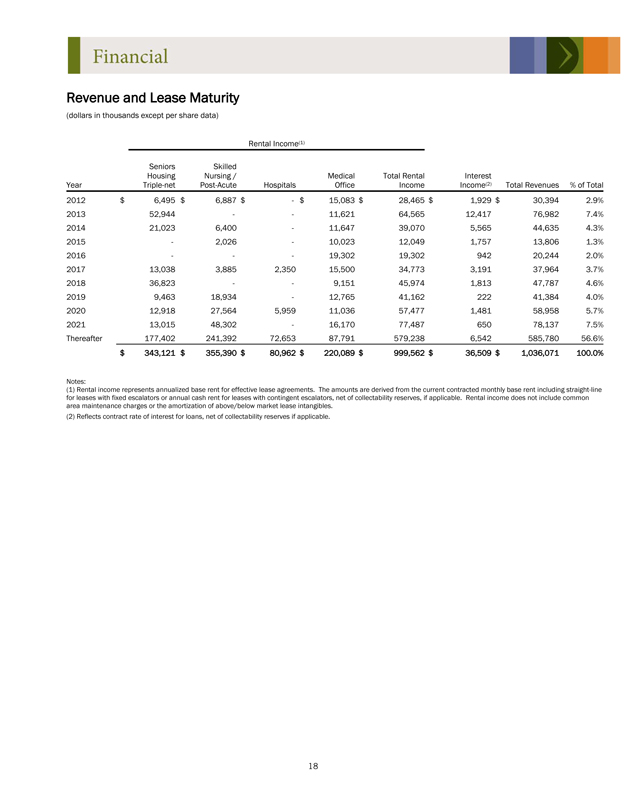
Revenue and Lease Maturity
(dollars in thousands except per share data)
Rental Income(1)
Seniors Skilled
Housing Nursing / Medical Total Rental Interest
Year Triple-net Post-Acute Hospitals Office Income Income(2) Total Revenues% of Total
2012 $ 6,495 $ 6,887 $—$ 15,083 $ 28,465 $ 1,929 $ 30,394 2.9%
2013 52,944—- 11,621 64,565 12,417 76,982 7.4%
2014 21,023 6,400—11,647 39,070 5,565 44,635 4.3%
2015—2,026—10,023 12,049 1,757 13,806 1.3%
2016—— 19,302 19,302 942 20,244 2.0%
2017 13,038 3,885 2,350 15,500 34,773 3,191 37,964 3.7%
2018 36,823—- 9,151 45,974 1,813 47,787 4.6%
2019 9,463 18,934—12,765 41,162 222 41,384 4.0%
2020 12,918 27,564 5,959 11,036 57,477 1,481 58,958 5.7%
2021 13,015 48,302—16,170 77,487 650 78,137 7.5%
Thereafter 177,402 241,392 72,653 87,791 579,238 6,542 585,780 56.6%
$ 343,121 $ 355,390 $ 80,962 $ 220,089 $ 999,562 $ 36,509 $ 1,036,071 100.0%
Notes:
(1) Rental income represents annualized base rent for effective lease agreements. The amounts are derived from the current contracted monthly base rent including straight-line
for leases with fixed escalators or annual cash rent for leases with contingent escalators, net of collectability reserves, if applicable. Rental income does not include common
area maintenance charges or the amortization of above/below market lease intangibles.
(2) Reflects contract rate of interest for loans, net of collectability reserves if applicable.
18
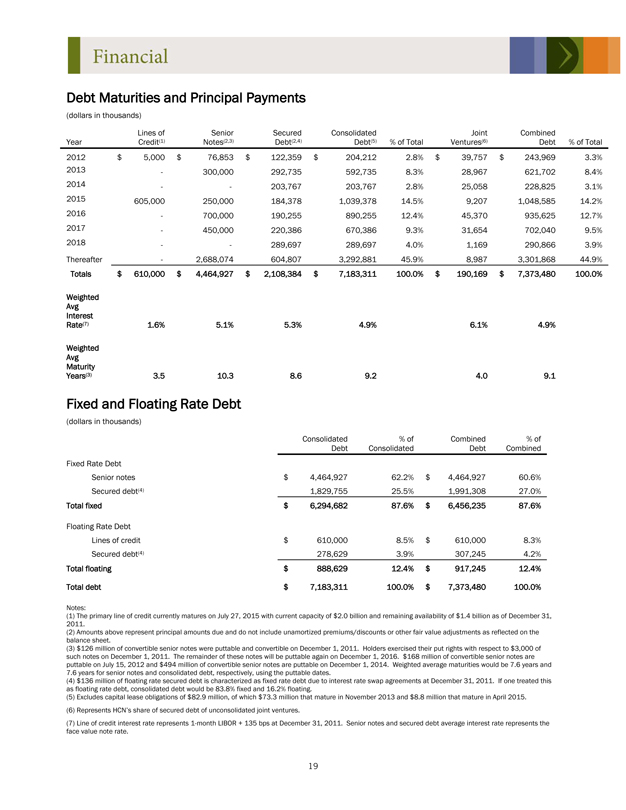
Debt Maturities and Principal Payments (dollars in thousands) Lines of Senior Secured Consolidated Joint Combined Year Credit(1) Notes(2,3) Debt(2,4) Debt(5)% of Total Ventures(6) Debt% of Total 2012 $ 5,000 $ 76,853 $ 122,359 $ 204,212 2.8% $ 39,757 $ 243,969 3.3% 2013—300,000 292,735 592,735 8.3% 28,967 621,702 8.4% 2014—- 203,767 203,767 2.8% 25,058 228,825 3.1% 2015 605,000 250,000 184,378 1,039,378 14.5% 9,207 1,048,585 14.2% 2016—700,000 190,255 890,255 12.4% 45,370 935,625 12.7% 2017—450,000 220,386 670,386 9.3% 31,654 702,040 9.5% 2018—- 289,697 289,697 4.0% 1,169 290,866 3.9% Thereafter—2,688,074 604,807 3,292,881 45.9% 8,987 3,301,868 44.9% Totals $ 610,000 $ 4,464,927 $ 2,108,384 $ 7,183,311 100.0% $ 190,169 $ 7,373,480 100.0% Weighted Avg Interest Rate(7) 1.6% 5.1% 5.3% 4.9% 6.1% 4.9% Weighted Avg Maturity Years(3) 3.5 10.3 8.6 9.2 4.0 9.1 Fixed and Floating Rate Debt (dollars in thousands) Consolidated% of Combined% of Debt Consolidated Debt Combined Fixed Rate Debt Senior notes $ 4,464,927 62.2% $ 4,464,927 60.6% Secured debt(4) 1,829,755 25.5% 1,991,308 27.0% Total fixed $ 6,294,682 87.6% $ 6,456,235 87.6% Floating Rate Debt Lines of credit $ 610,000 8.5% $ 610,000 8.3% Secured debt(4) 278,629 3.9% 307,245 4.2% Total floating $ 888,629 12.4% $ 917,245 12.4% Total debt $ 7,183,311 100.0% $ 7,373,480 100.0% Notes: (1) The primary line of credit currently matures on July 27, 2015 with current capacity of $2.0 billion and remaining availability of $1.4 billion as of December 31, 2011. (2) Amounts above represent principal amounts due and do not include unamortized premiums/discounts or other fair value adjustments as reflected on the balance sheet. (3) $126 million of convertible senior notes were puttable and convertible on December 1, 2011. Holders exercised their put rights with respect to $3,000 of such notes on December 1, 2011. The remainder of these notes will be puttable again on December 1, 2016. $168 million of convertible senior notes are puttable on July 15, 2012 and $494 million of convertible senior notes are puttable on December 1, 2014. Weighted average maturities would be 7.6 years and 7.6 years for senior notes and consolidated debt, respectively, using the puttable dates. (4) $136 million of floating rate secured debt is characterized as fixed rate debt due to interest rate swap agreements at December 31, 2011. If one treated this as floating rate debt, consolidated debt would be 83.8% fixed and 16.2% floating. (5) Excludes capital lease obligations of $82.9 million, of which $73.3 million that mature in November 2013 and $8.8 million that mature in April 2015.
(6) Represents HCN’s share of secured debt of unconsolidated joint ventures. (7) Line of credit interest rate represents 1-month LIBOR + 135 bps at December 31, 2011. Senior notes and secured debt average interest rate represents the face value note rate.
19
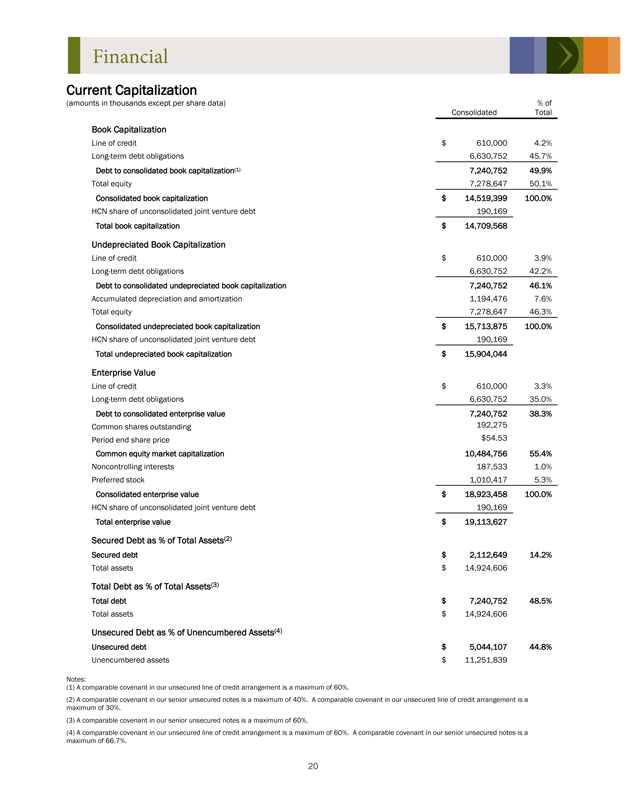
Current Capitalization (amounts in thousands except per share data)% of Consolidated Total Book Capitalization Line of credit $ 610,000 4.2% Long-term debt obligations 6,630,752 45.7% Debt to consolidated book capitalization(1) 7,240,752 49.9% Total equity 7,278,647 50.1% Consolidated book capitalization $ 14,519,399 100.0% HCN share of unconsolidated joint venture debt 190,169 Total book capitalization $ 14,709,568 Undepreciated Book Capitalization Line of credit $ 610,000 3.9% Long-term debt obligations 6,630,752 42.2% Debt to consolidated undepreciated book capitalization 7,240,752 46.1% Accumulated depreciation and amortization 1,194,476 7.6% Total equity 7,278,647 46.3% Consolidated undepreciated book capitalization $ 15,713,875 100.0% HCN share of unconsolidated joint venture debt 190,169 Total undepreciated book capitalization $ 15,904,044 Enterprise Value Line of credit $ 610,000 3.3% Long-term debt obligations 6,630,752 35.0% Debt to consolidated enterprise value 7,240,752 38.3% Common shares outstanding 192,275 Period end share price $54.53 Common equity market capitalization 10,484,756 55.4% Noncontrolling interests 187,533 1.0% Preferred stock 1,010,417 5.3% Consolidated enterprise value $ 18,923,458 100.0% HCN share of unconsolidated joint venture debt 190,169 Total enterprise value $ 19,113,627 Secured Debt as % of Total Assets(2) Secured debt $ 2,112,649 14.2% Total assets $ 14,924,606 Total Debt as % of Total Assets(3) Total debt $ 7,240,752 48.5% Total assets $ 14,924,606 Unsecured Debt as % of Unencumbered Assets(4) Unsecured debt $ 5,044,107 44.8% Unencumbered assets $ 11,251,839 Notes:
(1) A comparable covenant in our unsecured line of credit arrangement is a maximum of 60%. (2) A comparable covenant in our senior unsecured notes is a maximum of 40%. A comparable covenant in our unsecured line of credit arrangement is a maximum of 30%.
(3) A comparable covenant in our senior unsecured notes is a maximum of 60%. (4) A comparable covenant in our unsecured line of credit arrangement is a maximum of 60%. A comparable covenant in our senior unsecured notes is a maximum of 66.7%.
20
Age: Current year, less the year built, adjusted for major renovations.
Cap-ex, Tenant Improvements, Leasing Commissions: Represents amounts paid in cash for: 1) recurring and non-recurring capital expenditures required to maintain and re-tenant our properties, 2) second generation tenant improvements and 3) leasing commissions paid to third party leasing agents to secure new tenants.
CCRC: Continuing care retirement communities include a combination of detached homes, an independent living facility, an assisted living facility and/or a skilled nursing facility on one campus. Resident payment plans vary, but can include entrance fees, condominium fees and rental fees. Many of these communities also charge monthly maintenance fees in exchange for a living unit, meals and some health services.
Committed Balance: Represents investment balance plus unfunded construction commitments for which initial funding has commenced.
Construction Conversion: Represents completed construction projects that were placed into service and began earning rent.
EBITDAR: Earnings before interest, taxes, depreciation, amortization and rent. The company uses unaudited, periodic financial information provided solely by tenants/borrowers to calculate EBITDAR and has not independently verified the information.
EBITDAR Coverage: Represents the ratio of EBITDAR to contractual rent for leases or interest and principal payments for loans. EBITDAR coverage is a measure of a property’s ability to generate sufficient cash flows for the operator/borrower to pay rent and meet other obligations. The coverage shown excludes properties that are unstabilized, closed or for which data is not available or meaningful.
EBITDARM: Earnings before interest, taxes, depreciation, amortization, rent and management fees. The company uses unaudited, periodic financial information provided solely by tenants/borrowers to calculate EBITDARM and has not independently verified the information.
EBITDARM Coverage: Represents the ratio of EBITDARM to contractual rent for leases or interest and principal payments for loans. EBITDARM coverage is a measure of a property’s ability to generate sufficient cash flows for the operator/borrower to pay rent and meet other obligations, assuming that management fees are not paid. The coverage shown excludes properties that are unstabilized, closed or for which data is not available or meaningful.
Entrance Fee: A property where the resident pays a substantial upfront fee and an ongoing monthly service fee for the right to occupy a unit. Typically, a portion of the upfront fee is refundable.
Health System-Affiliated: Properties are considered affiliated with a health system if one or more of the following conditions are met: 1) the land parcel is contained within the physical boundaries of a hospital campus; 2) the land parcel is located adjacent to the campus; 3) the building is physically connected to the hospital regardless of the land ownership structure; 4) a ground lease is maintained with a health system entity; 5) a master lease is maintained with a health system entity; 6) significant square footage is leased to a health system entity; 7) the property includes an ambulatory surgery center with a hospital partnership interest; or (8) a significant square footage is leased to a physician group that is either employed, directly or indirectly by a health system, or has a significant clinical and financial affiliation with the health system.
Hospitals: Hospitals generally include acute care hospitals, inpatient rehabilitation hospitals and long-term acute care hospitals. Acute care hospitals provide a wide range of inpatient and outpatient services, including, but not limited to, surgery, rehabilitation, therapy and clinical laboratories. Long-term acute care hospitals provide inpatient services for patients with complex medical conditions who require more intensive care, monitoring or emergency support than that available in most skilled nursing facilities.
Investment Amount:
Acquisitions – Represents purchase price excluding accounting adjustments pursuant to U.S. GAAP. New loans – Represents face amount of new loan.
Construction conversion – Represents book balance converted from CIP to real property upon completion. Capital improvements to existing properties – Represents cash funded to tenants under an existing lease. Loan advances – Represents cash funded to operators under an existing loan agreement.
Investment Balance: Represents net book value of real estate investments or the company’s interest in unconsolidated joint ventures as reflected on the company’s balance sheet.
21
Life Science: Life science buildings are laboratory and office facilities, often located near universities, specifically constructed and designed for use by biotechnology and pharmaceutical companies.
Medical Office: Medical office buildings are office and clinic facilities, often located near hospitals or on hospital campuses, specifically constructed and designed for use by physicians and other health care personnel to provide services to their patients. They may also include ambulatory surgery centers that are used for general or specialty surgical procedures not requiring an overnight stay in a hospital. Medical office buildings typically contain sole and group physician practices and may provide laboratory and other patient services.
Occupancy: Medical office occupancy represents the percentage of total rentable square feet leased and occupied, including month-to-month leases, as of the date reported. Occupancy for all other property types represents average quarterly operating occupancy based on the most recent quarter of available data and excludes properties that are unstabilized, closed or for which data is not available or meaningful. The company uses unaudited, periodic financial information provided solely by tenants/borrowers to calculate occupancy and has not independently verified the information.
Renewal Rate: The ratio of total square feet expiring and available for lease to total renewed square feet.
Renewed Square Feet: Square feet expiring during the reporting period upon which a lease is executed by the current occupant.
Same Store: For the medical office building portfolio, same store is defined as those properties owned for the entire previous five quarters. Properties acquired, developed or classified in discontinued operations are excluded from the same store amounts. For all other property types, same store is defined as those properties in the stable portfolio for the 24 months preceding the end of the portfolio performance reporting period, unless otherwise noted. Excludes seniors housing operating portfolio.
Seniors Housing Operating: Includes independent and assisted living properties held in consolidated joint ventures, structured to take advantage of the REIT Investment Diversification and Empowerment Act of 2007.
Seniors Housing Triple-net: Includes independent and assisted living properties subject to triple-net operating leases and real estate loans receivable.
Skilled Nursing/Post-Acute: Skilled nursing facilities are licensed daily rate or rental properties where the majority of individuals require 24-hour nursing and/or medical care. Generally, these properties are licensed for Medicaid and/or Medicare reimbursement and are subject to triple-net operating leases. All facilities offer some level of rehabilitation services. Some facilities offer rehabilitation units specializing in cardiac, orthopedic, dialysis, neurological or pulmonary rehabilitation, which focus on higher acuity patients.
Square Feet: Net rentable square feet calculated utilizing Building Owners and Managers Association measurement standards.
Stable: Generally, a property is considered stable (versus unstabilized or under development) when it has achieved EBITDAR coverage of 1.10x or greater for three consecutive months or, if targeted performance has not been achieved, 12 months following the budgeted stabilization date. Entrance fee communities are considered stable after achieving aggregate property occupancy of 80% or more.
Unstabilized: An acquisition that does not meet the stable criteria upon closing or a construction property that has opened but not yet reached stabilization.
Yield: Represents annualized contractual or projected income to be received in cash divided by investment amount for acquisitions/joint ventures, loan advances, capital improvements and construction conversions. Represents annualized contractual income that was being received in cash at date of disposition divided by disposition cash proceeds for dispositions.
22
The company believes that net income attributable to common stockholders (NICS), as defined by U.S. generally accepted accounting principles (U.S. GAAP), is the most appropriate earnings measurement. However, the company considers EBITDA and net operating income (NOI) to be useful supplemental measures of its operating performance.
EBITDA stands for earnings before interest, taxes, depreciation and amortization. A covenant in our line of credit arrangement contains a financial ratio based on a definition of EBITDA that is specific to that agreement. Failure to satisfy this covenant could result in an event of default that could have a material adverse impact on our cost and availability of capital, which could in turn have a material adverse impact on our consolidated results of operations, liquidity and/or financial condition. Due to the materiality of this debt agreement and the financial covenant, we have disclosed Adjusted EBITDA, which represents EBITDA as defined above and adjusted for stock-based compensation expense, provision for loan losses and gain/loss on extinguishment of debt. We use Adjusted EBITDA to measure our adjusted fixed charge coverage ratio, which represents Adjusted EBITDA divided by fixed charges on a trailing twelve months basis. Fixed charges include total interest (excluding capitalized interest and non-cash interest expenses), secured debt principal amortization and preferred dividends. Our covenant requires an adjusted fixed charge ratio of at least 1.50 times.
Net operating income (NOI) is used to evaluate the operating performance of the company’s properties. The company defines NOI as total revenues, including tenant reimbursements and discontinued operations, less property operating expenses, which exclude depreciation and amortization, general and administrative expenses, impairments and interest expense. The company believes NOI provides investors relevant and useful information because it measures the operating performance of the company’s properties at the property level on an unleveraged basis. The company uses NOI to make decisions about resource allocations and to assess the property level performance of our properties.
Other than Adjusted EBITDA, the company’s supplemental reporting measures and similarly entitled financial measures are widely used by investors, equity and debt analysts and rating agencies in the valuation, comparison, rating and investment recommendations of companies. The company’s management uses these financial measures to facilitate internal and external comparisons to historical operating results and in making operating decisions. Additionally, these measures are utilized by the Board of Directors to evaluate management. Adjusted EBITDA is used solely to determine our compliance with a financial covenant of our line of credit arrangement and is not being presented for use by investors for any other purpose. The supplemental reporting measures do not represent net income or cash flow provided from operating activities as determined in accordance with U.S. GAAP and should not be considered as alternative measures of profitability or liquidity. Finally, the supplemental reporting measures, as defined by the company, may not be comparable to similarly entitled items reported by other real estate investment trusts or other companies. Multi-period amounts may not equal the sum of the individual quarterly amounts due to rounding.
23
Forward-Looking Statements and Risk Factors
This document may contain “forward-looking” statements as defined in the Private Securities Litigation Reform Act of 1995. These forward-looking statements concern and are based upon, among other things, the possible expansion of the company’s portfolio; the sale of facilities; the performance of its operators/tenants and facilities; its ability to enter into agreements with viable new tenants for vacant space or for facilities that the company takes back from financially troubled tenants, if any; its occupancy rates; its ability to acquire, develop and/or manage facilities; its ability to make distributions to stockholders; its policies and plans regarding investments, financings and other matters; its tax status as a real estate investment trust; its critical accounting policies; its ability to appropriately balance the use of debt and equity; its ability to access capital markets or other sources of funds; and its ability to meet its earnings guidance. When the company uses words such as “may,” “will,” “intend,” “should,” “believe,” “expect,” “anticipate,” “project,” “estimate” or similar expressions, it is making forward-looking statements. Forward-looking statements are not guarantees of future performance and involve risks and uncertainties. The company’s expected results may not be achieved and actual results may differ materially from expectations. This may be a result of various factors, including, but not limited to: the status of the economy; the status of capital markets, including availability and cost of capital; issues facing the health care industry, including compliance with, and changes to, regulations and payment policies, responding to government investigations and punitive settlements and operators’/tenants’ difficulty in cost-effectively obtaining and maintaining adequate liability and other insurance; changes in financing terms; competition within the health care, seniors housing and life science industries; negative developments in the operating results or financial condition of operators/tenants, including, but not limited to, their ability to pay rent and repay loans; the company’s ability to transition or sell facilities with profitable results; the failure to make new investments as and when anticipated; acts of God affecting the company’s facilities; the company’s ability to re-lease space at similar rates as vacancies occur; the company’s ability to timely reinvest sale proceeds at similar rates to assets sold; operator/tenant or joint venture partner bankruptcies or insolvencies; the cooperation of joint venture partners; government regulations affecting Medicare and Medicaid reimbursement rates and operational requirements; regulatory approval and market acceptance of the products and technologies of life science tenants; liability or contract claims by or against operators/tenants; unanticipated difficulties and/or expenditures relating to future acquisitions; environmental laws affecting the company’s facilities; changes in rules or practices governing the company’s financial reporting; the movement of U.S. and Canadian exchange rates; and legal and operational matters, including real estate investment trust qualification and key management personnel recruitment and retention. Finally, the company assumes no obligation to update or revise any forward-looking statements or to update the reasons why actual results could differ from those projected in any forward-looking statements.
Additional Information
The information in this supplemental information package should be read in conjunction with the company’s Annual Report on Form 10-K, Quarterly Reports on Form 10-Q, Current Reports on Form 8-K, earnings press release dated February 16, 2012 and other information filed with, or furnished to, the Securities and Exchange Commission (“SEC”). The Supplemental Reporting Measures and reconciliations of Non-GAAP measures are an integral part of the information presented herein.
You can access the company’s Annual Report on Form 10-K, Quarterly Reports on Form 10-Q, Current Reports on Form 8-K and amendments to those reports filed or furnished pursuant to Section 13(a) or 15(d) of the Exchange Act at http://www.hcreit.com as soon as reasonably practicable after they are filed with, or furnished to, the SEC. The information on or connected to the company’s website is not, and shall not be deemed to be, a part of, or incorporated into this supplemental information package. You can also review these SEC filings and other information by accessing the SEC’s website at http://www.sec.gov.
24

4500 Durr Street Toledo, Ohio 43615-4040
www.hcreit.com
2012 HealthCare REIT, Inc.